Embed Size (px)
Citation preview
The author(s) shown below used Federal funds provided by the U.S. Department of Justice and prepared the following final report: Document Title: Process and Outcome Evaluation of the
G.R.E.A.T. Program
Author(s): Finn-Aage Esbensen, Wayne Osgood, Dana Peterson, Terrance J. Taylor, Dena Carson, Adrienne Freng, Kristy Matsuda
Document No.: 244346 Date Received: December 2013 Award Number: 2006-JV-FX-0011 This report has not been published by the U.S. Department of Justice. To provide better customer service, NCJRS has made this Federally-funded grant report available electronically.
Opinions or points of view expressed are those of the author(s) and do not necessarily reflect
the official position or policies of the U.S. Department of Justice.
FINAL REPORT
PROCESS AND OUTCOME EVALUATION OF THE G.R.E.A.T. PROGRAM (Award No. 2006-JV-FX-0011)
P.I.: Finn-Aage Esbensen Department of Criminology and Criminal Justice 324 Lucas Hall University of Missouri-St. Louis One University Boulevard St. Louis, MO 63121 Phone: 314-516-4619 Email: [email protected]
Co-Investigators: Wayne Osgood, Pennsylvania State University Dana Peterson, University at Albany Terrance J. Taylor, University of Missouri-St. Louis
Research Associates: Dena Carson, University of Missouri-St. Louis Adrienne Freng, University of Wyoming Kristy Matsuda, University of Missouri-St. Louis
Research Assistants: Jared Armstrong, Elizabeth Atwood, Adam Baggett, Brad Brick, Dena Carson, Desiree Coleman, Allison Collins, Kelly Cutler, Steven Downing, Erin Flannery, Ashley Flores, Teri Gulledge, Laura Hastings, Sara Hoover, Joelle Jones, Russell Jewell, Graham Jones, Anne Knorr, Krystle Leugoud, Nicole Logan, Kristyn McCord, Meredith McKinney, Chris Melde, Jeaneé Miller, Joanna Miller, Nick Miofski, Adrian Molina, Vanessa Panfil, Skyler Pimple, Katie Polzer, Zachary Robbins, Preston Sanchez, Vanessa Sandoval, Aaron Sego, Brad Stevens, Candice Tate, Mia Taylor, Saundra Trujillo, Stephanie Turner, Karin Tusinski, J. Michael Vecchio, Ben Voss, Christina Watson, Stephanie Wiley, Alicia Wolfe-Lewis, Sarah Young
**This research was made possible, in part, by the support and participation of seven school districts, including the School District of Philadelphia. This project was supported by Award No. 2006-JV-FX-0011 awarded by the National Institute of Justice, Office of Justice Programs, U.S. Department of Justice. We would also like to thank the numerous school administrators, teachers, students, and law enforcement officers for their involvement and assistance in this study. The opinions, findings, and conclusions or recommendations expressed in this publication are those of the authors and do not necessarily reflect the views of the Department of Justice or of the seven participating school districts.
This document is a research report submitted to the U.S. Department of Justice. This report has not been published by the Department. Opinions or points of view expressed are those of the author(s)
and do not necessarily reflect the official position or policies of the U.S. Department of Justice.
TABLE OF CONTENTS
ABSTRACT: Process and Outcome Evaluation of the G.R.E.A.T. Program ................................1
SUMMARY ............................................................................................................................2 – 14 Is G.R.E.A.T Effective? Results from the National Evaluation of the Gang .....................2 Resistance Education and Training (G.R.E.A.T.) Program?
Finn-Aage Esbensen, D. Wayne Osgood, Dana Peterson, Terrance J. Taylor, and Dena C. Carson
PROCESS EVALUATION .................................................................................................15 – 47 Multi-method Strategy for Assessing Program Fidelity: The national .............................15 evaluation of the revised G.R.E.A.T. program.
Finn-Aage Esbensen, Kristy Matsuda, Terrance J. Taylor, and Dana Peterson.
OUTCOME EVALUATION ............................................................................................48 – 137
Results from a multi-site evaluation of the G.R.E.A.T. program: ...........................48 – 82One-Year Post-Treatment.
Finn-Aage Esbensen, D. Wayne Osgood, Dana Peterson, and Terrance J. Taylor
Short and Long Term Outcome Results from a Multi-site Evaluation ..................83 – 137 of the G.R.E.A.T. Program.
Finn-Aage Esbensen, D. Wayne Osgood, Dana Peterson, Terrance J. Taylor, and Dena C. Carson
GRANT PRODUCTS: Presentations, Reports, and Publications ..............................138 – 147
APPENDICES: Reports and Data Collection Instruments .........................................148 – 613
G.R.E.A.T. Officer Training (G.O.T.) Report .......................................................148 – 188 Terrance J. Taylor, Finn-Aage Esbensen, and Dana Peterson
Results from Surveys and Interviews with G.R.E.A.T.-trained Officers ..............189 – 209 Dena C. Carson, Finn-Aage Esbensen, Terrance J. Taylor, and Dana Peterson
School Personnel Survey Report ...........................................................................210 – 251 Dana Peterson, Vanessa R. Panfil, Finn-Aage Esbensen, and Terrance J. Taylor
This document is a research report submitted to the U.S. Department of Justice. This report has not been published by the Department. Opinions or points of view expressed are those of the author(s)
and do not necessarily reflect the official position or policies of the U.S. Department of Justice.
Observing the Implementer: Description of Findings, Recommendations, ..........252 – 300 and Conclusions from G.R.E.A.T. Program Implementation Observation
Krystle Leugoud, Finn-Aage Esbensen, Bradley T. Brick, and Terrance J. Taylor
2007 Report to Schools and Communities.............................................................301 – 318 Finn-Aage Esbensen, Terrance J. Taylor, Bradley T. Brick, and Dana Peterson
2008 Report to Schools and Communities: Anti-Social Norms among ...............319 – 342 a Sample of Middle-School Students
Finn-Aage Esbensen, Dana Peterson, Terrance J. Taylor, Vanessa R. Panfil, and Bradley T. Brick
2009 Report to Schools and Communities: Program Implementation .................343 – 365 Quality and Preliminary Outcome Results
Finn-Aage Esbensen, Dana Peterson, and Terrance J. Taylor
2010 Report to Schools and Communities: School Safety and ...........................366 – 386 Victimization
Kristy N. Matsuda, Finn-Aage Esbensen, Dana Peterson, and Terrance J. Taylor
Data Collection Instruments: .................................................................................387 – 613
All Lesson Observation Checklist .........................................................................387 – 435
School Personnel Questionnaire ...........................................................................436 – 449
Law Enforcement Officer Questionnaire ..............................................................450 – 459
Wave 1 Student Questionnaire ..............................................................................460 – 487
Wave 2 Student Questionnaire ..............................................................................488 – 510
Wave 3 Student Questionnaire ..............................................................................511 – 535
Wave 4 Student Questionnaire ..............................................................................536 – 561
Wave 5 Student Questionnaire ..............................................................................562 – 587
Wave 6 Student Questionnaire ..............................................................................588 – 613
This document is a research report submitted to the U.S. Department of Justice. This report has not been published by the Department. Opinions or points of view expressed are those of the author(s)
and do not necessarily reflect the official position or policies of the U.S. Department of Justice.
ABSTRACT:
PROCESS AND OUTCOME EVALUATION OF THE G.R.E.A.T. PROGRAM
In 2006, the University of Missouri-St. Louis was awarded a grant from the National
Institute of Justice to determine what effect, if any, the G.R.E.A.T. (Gang Resistance Education
and Training) program had on students. G.R.E.A.T., which is a 13-lesson general prevention
program taught by uniformed law enforcement officers to middle school students, has three
stated goals: 1) to reduce gang membership, 2) to reduce delinquency, especially violent
offending, and 3) to improve students’ attitudes toward the police.
The process evaluation consisted of multiple methods to assess program fidelity: 1)
observations of G.R.E.A.T. Officer Trainings, 2) surveys and interviews of G.R.E.A.T.-trained
officers and supervisors, 3) surveys of school personnel, and 4) “on-site,” direct observations of
officers delivering the G.R.E.A.T. program in the study sites. Results illustrate a high level of
program fidelity, providing greater confidence in any subsequent outcome results.
To assess program effectiveness, we conducted a randomized control trial involving
3,820 students nested in 195 classrooms in 31 schools in 7 cities. Active parental consent was
obtained for 78% (3,820 students) of the students enrolled (11 percent of parents declined and 11
percent failed to return consent forms). These students were surveyed six times (completion rates
were: 98%, 95%, 87%, 83%, 75%, and 72%).in the course of five years thereby allowing
assessment of both short- and long-term program effects. Approximately half of the G.R.E.A.T.
grade-level classrooms within each school were randomly assigned to experimental or control
groups, with102 classrooms (2,051 students) assigned to receive G.R.E.A.T. and 93 classrooms
(1,769 students) assigned to the control condition.
Results from analyses of data one-year post-program delivery were quite favorable; we
found statistically significant differences between the treatment (i.e., G.R.E.A.T.) and control
students on 14 out of 33 attitudinal and behavioral outcomes. However, the question remained
whether the program had long-term impacts that persisted into high school. To address this
question, we continued to survey this group of students for three more years (most of the
students were in 10th or 11th grade at the time of the last survey administration). The four-year
post program analyses revealed results similar to the one-year post program effects, albeit with
smaller effect sizes. Across four years post program 10 positive program effects were found,
including lower odds of gang joining and more positive attitudes to police.
1
This document is a research report submitted to the U.S. Department of Justice. This report has not been published by the Department. Opinions or points of view expressed are those of the author(s)
and do not necessarily reflect the official position or policies of the U.S. Department of Justice.
SUMMARY
Is G.R.E.A.T Effective? Results from the National Evaluation of the Gang Resistance Education and Training (G.R.E.A.T.) Program1
Finn-Aage Esbensen, Dana Peterson, Terrance J. Taylor, D. Wayne Osgood, and Dena C.
Carson
The Gang Resistance Education and Training (G.R.E.A.T.) program is a gang and
delinquency prevention program delivered by law enforcement officers within a school setting.
Developed as a local program in 1991 by Phoenix-area law enforcement agencies, the program
quickly spread throughout the United States. The original G.R.E.A.T. program operated as a
nine-lesson lecture-based curriculum taught primarily in middle-school settings. Results from an
earlier National Evaluation of the G.R.E.A.T. program (1995-2001) found that the program had
an effect on several mediating variables (factors commonly identified as risk factors) associated
with gang membership and delinquency but found no differences between G.R.E.A.T. and non-
G.R.E.A.T. youths in terms of these behaviors (i.e., gang membership and involvement in
delinquent behavior).
Based in part on these findings, the G.R.E.A.T. program underwent a critical review that
resulted in substantial program modifications. The revised curriculum (see Box A) consists of 13
lessons aimed at teaching youths the life-skills (e.g., communication and refusal skills, as well as
conflict resolution and anger management techniques) thought necessary to prevent involvement
in gang behavior and delinquency. The revised G.R.E.A.T. curriculum was piloted in 2001, with
full-scale implementation occurring in 2003. Currently, the program is taught in middle schools
across the country as well as in other countries. In school districts with school-resource officers,
the G.R.E.A.T. program is generally taught by the SROs. In other jurisdictions, law enforcement
1 An earlier version of this summary was published in Cheryl L. Maxson, Arlen Egley, Jr., Jody Miller, and Malcolm W. Klein (eds.) (2013). The Modern Gang Reader, 4th edition. New York, NY: Oxford University Press.
2
This document is a research report submitted to the U.S. Department of Justice. This report has not been published by the Department. Opinions or points of view expressed are those of the author(s)
and do not necessarily reflect the official position or policies of the U.S. Department of Justice.

officers deliver the program as part of their assignment in community relations divisions, while
elsewhere officers teach the program on an overtime basis. Regardless of officers’ assignments,
all instructors must complete G.R.E.A.T. Officer Training and be certified prior to their
assignment to teach in the local schools. This training (one week for officers with prior teaching
experience and two weeks for others), in addition to introducing the officers to the program,
includes sections on gang trends, issues associated with the transition from an emphasis on
enforcement to one of prevention, middle school student developmental stages, and teaching and
classroom management techniques. The program’s three main goals are:
1. To help youths avoid gang membership.
2. To help youths avoid violence and criminal activity.
3. To help youths develop a positive relationship with law enforcement.
The National Evaluation of G.R.E.A.T.
In 2006, following a competitive peer review process, the National Institute of Justice
awarded the University of Missouri-St. Louis funding to conduct the National Evaluation of the
G.R.E.A.T. program. The evaluation consists of both process and outcome components that
include student surveys, classroom observations in G.R.E.A.T. and non-G.R.E.A.T. classrooms,
surveys of teachers, school administrators, and law enforcement officers, interviews with
G.R.E.A.T. officers and G.R.E.A.T. supervisors, and observations of G.R.E.AT. Officer Training
(G.O.T.). In this report we focus on findings of program effectiveness.
As will be detailed below, we surveyed students attending 31 public middle schools in
seven cities across the country. Based upon student responses to multiple waves of
questionnaires (pre-test, post-test, and annual follow-up surveys in each of the following four
years), we are able to assess short- and long-term program effects. That is, we examine the extent
3
This document is a research report submitted to the U.S. Department of Justice. This report has not been published by the Department. Opinions or points of view expressed are those of the author(s)
and do not necessarily reflect the official position or policies of the U.S. Department of Justice.
to which students receiving G.R.E.A.T. differ from non-G.R.E.A.T. students in terms of their
delinquent activity and gang involvement. Additionally, we examine the extent to which risk
factors addressed in the G.R.E.A.T. program also differentiate the G.R.E.A.T. students from the
control group.
Study Design
To implement an outcome evaluation of a school-based program that is offered in settings
across the United States, it is important to select a sample that will be representative of the
diversity of settings in which the overall program operates. Cost and logistics must also be
factored into design decisions. Our overall strategy was to include four to six schools in six
different cities. By including multiple schools in a single city we reduce potential bias that could
arise from including atypical schools. Having multiple cities in the evaluation allows for
inclusion of geographically diverse areas, different sized cities and school districts, differential
levels of gang activity, and a diversity of racial and ethnic groups. Within each participating
school, classrooms were randomly assigned to receive G.R.E.A.T. or to be designated as a
control classroom. While apprehension about the random assignment and subsequent exclusion
of some classrooms from receiving G.R.E.A.T. was expressed by some principals and teachers,
ultimately 31 schools agreed to the design specifics.2
Site Selection
During the summer of 2006, we selected seven cities for inclusion in the National
Evaluation of G.R.E.A.T. Site selection was based on three main criteria: 1) existence of the
2 Two principals who were contacted declined their schools’ participation. In one case, the principal had previously been a police gang investigator and, thus, “knew the program worked.” In the other case, the principal would not agree to our study design (i.e., random assignment of classrooms). In a third school, while the principal agreed to participate, there was resistance to the evaluation design, and this school was ultimately dropped from the study. In each instance, other schools were selected to replace the non-participating schools.
4
This document is a research report submitted to the U.S. Department of Justice. This report has not been published by the Department. Opinions or points of view expressed are those of the author(s)
and do not necessarily reflect the official position or policies of the U.S. Department of Justice.
G.R.E.A.T. program, 2) geographic and demographic diversity, and 3) evidence of gang activity.
This site selection process was carried out in a series of steps. First, the research staff contacted
the G.R.E.A.T. Regional Administrators3 and Bureau of Justice Assistance4 personnel to identify
locales with established programs. Consideration was given to factors such as the length of time
the program had been in operation, number of G.R.E.A.T.-trained officers, and the number of
schools in which the program was offered. Second, once this list of more than 50 potential
agencies was constructed, the research staff contacted representatives in these cities to obtain
more information about the delivery of the G.R.E.A.T. program. Third, given the focus of the
program, information about gang activity in these potential cities was obtained from the National
Gang Center. Ultimately, we selected seven cities (varying in size, region, and level of gang
activity) as our primary target sites. Given the difficulties associated with securing permission to
conduct evaluations in many school districts, we were hopeful that six of these seven cities
would cooperate.
Once these seven cities were identified, the research staff worked with the primary local
law enforcement agency and the school district in each city to seek their cooperation. Much to
our surprise, all seven districts agreed to participate. Rather than exclude one of the sites, we
decided to expand our original design from six to seven cities. These participating cities are:
Albuquerque, New Mexico; Chicago, Illinois; Greeley, Colorado; Nashville, Tennessee;
Philadelphia, Pennsylvania; Portland, Oregon; and a Dallas-Fort Worth (DFW), Texas, area
3 G.R.E.A.T. is a national program overseen by the G.R.E.A.T. National Policy Board (NPB). For administrative purposes, responsibilities for program oversight are held by (or ―given to‖) agencies operating in different geographic regions: Northeast, Midwest, Southeast, Southwest, and West. Additionally, two federal partners—the Bureau of Alcohol, Tobacco, Firearms, and Explosives (BATF) and the Federal Law Enforcement Training Center (FLETC)—are involved in program training and oversight. 4 The Bureau of Justice Assistance (BJA) oversees the allocation of federal funds and grant compliance associated with the G.R.E.A.T. program.
5
This document is a research report submitted to the U.S. Department of Justice. This report has not been published by the Department. Opinions or points of view expressed are those of the author(s)
and do not necessarily reflect the official position or policies of the U.S. Department of Justice.

location. With school district approval, we then identified potential schools for study
participation and contacted the principals. Our intent in the selection of schools was to include
schools that, taken as a whole, would be representative of the districts. Once initial agreement to
participate was obtained from the school administrator, more detailed discussions/meetings were
held between school personnel, G.R.E.A.T. officers, and the research team. Whenever possible,
face-to-face meetings were held, but in some instances final arrangements were made via
telephone. School and police personnel were informed of the purpose of the evaluation, issues
related to the random assignment of classrooms to the treatment or control condition (i.e., receive
G.R.E.A.T./not receive G.R.E.A.T.), procedures to obtain active parental consent for students in
these classrooms, scheduling G.R.E.A.T. program delivery, and other logistical issues associated
with the study design.
Implementation of G.R.E.A.T.
Prior to addressing program effectiveness, it is imperative to assess implementation
fidelity; that is, is the program implemented as it is intended? In the G.R.E.A.T. Evaluation, we
tackled this issue via four distinct approaches: 1) observation of G.R.E.A.T. Officer Training
(GOT); 2) interviews and surveys of G.R.E.A.T. officers; 3) survey of school administrators and
teachers; and 4) observation of classroom delivery. Based on our observation and assessment of
9 GOT sessions (mostly 2 week sessions), we concluded that the officers were well-trained
during the training and that certified officers should, upon graduation, be prepared to teach the
G.R.E.A.T. curriculum in their local schools. The interviews and surveys of officers provided
additional insight into the quality of training as well as officer opinions about the program.
Generally, officers felt well prepared to teach the program and they believed the lessons to be
effective. Officers did provide some suggestions for program enhancements but, for the most
6
This document is a research report submitted to the U.S. Department of Justice. This report has not been published by the Department. Opinions or points of view expressed are those of the author(s)
and do not necessarily reflect the official position or policies of the U.S. Department of Justice.
part, were very positive about the program and their involvement in it. Teachers and
administrators liked having officers in their schools and believed that the program was well-
designed and well-implemented by the officers. As part of the process evaluation of the program,
we observed 492 unique classroom program deliveries. Based on these observations, we were
able to provide a fidelity score to each officer and each classroom. Of the 33 officers teaching
G.R.E.A.T. in the participating schools, 27 were judged to implement the program with above
average fidelity, 3 with below average fidelity, and 3 failed to deliver the program with sufficient
rigor to expect the program to have any effect. Relying on these four process evaluation
components led us to conclude that the G.R.E.A.T. program (at least in the schools participating
in the evaluation) was implemented with a high degree of program fidelity and that any program
effects detected could reasonably be a result of the program.
Effectiveness of G.R.E.A.T.
The evaluation design of this project can best be described as an experimental
longitudinal panel design. That is, classrooms in each of the participating schools were randomly
assigned to the treatment (i.e., G.R.E.A.T.) or control condition (i.e., no program exposure), and
students in these classrooms were scheduled to complete six waves of questionnaires (pre- and
post-tests followed by four annual surveys). Thus, the final sample of students would be
followed through their school experiences from 6th or 7th grade through 10th or 11th grade.
Importantly, all students in the selected classrooms were eligible to participate in the evaluation.
A total of 4,905 students were enrolled in the 195 participating classrooms (102 G.R.E.A.T. and
93 control classes) in the 31 middle schools at the beginning of the data collection process.
Active parental consent procedures were implemented in all sites. We worked closely
with the principals and classroom teachers during the consent process. Teachers distributed and
7
This document is a research report submitted to the U.S. Department of Justice. This report has not been published by the Department. Opinions or points of view expressed are those of the author(s)
and do not necessarily reflect the official position or policies of the U.S. Department of Justice.
collected consent form packets. Each packet included a cover letter explaining the purpose of the
evaluation as well as an informed consent form (explaining the risks and benefits of the students’
participation) for parents/guardians to read, sign, and return to the teacher. When allowed by the
districts, the research staff provided monetary compensation to the teachers directly for their
assistance. In some instances, district regulations prohibited such compensation; in these cases,
compensation was provided as a donation, made in honor of the teachers, to the school or
district. Students were also given a small personal radio, calculator, or tote bag in exchange for
returning a completed consent form. These rewards were provided to students regardless of
whether the parent/guardian granted or withheld consent for the youth to participate in the study.
Overall, 89.1 percent of youths (N=4,372) returned a completed consent form, with 77.9 percent
of parents/guardians (N=3,820) allowing their child’s participation.
Students completed pre-test surveys (prior to implementation of the G.R.E.A.T. program)
with a completion rate of 98.3 percent and post-test surveys (shortly after completion of the
G.R.E.A.T. program) with a completion rate of 94.6 percent. Students also completed annual
follow-up surveys in each of the following four years, with completion rates of 87%, 83%, 75%,
and 72%. These rates are quite impressive given the mobility of these students; we surveyed
virtually all students still enrolled in schools within the original seven school districts, which
meant we surveyed students in more than 200 different schools during each of the last two years
of data collection. We obtained permission from principals at these schools to survey the transfer
students – clearly, a time and labor intensive effort but one well worth achieving these high
response rates.
8
This document is a research report submitted to the U.S. Department of Justice. This report has not been published by the Department. Opinions or points of view expressed are those of the author(s)
and do not necessarily reflect the official position or policies of the U.S. Department of Justice.

Student Sample Characteristics
The sample is evenly split between males and females; most (55%) youths reside with
both biological parents; and the majority (88%) was born in the United States. The sample is
racially/ethnically diverse, with Hispanic youths (37%), White youths (27%), and African-
American (18%) youths accounting for 81 percent of the sample. Approximately two-thirds of
the youths (61%) were aged 11 or younger at the pre-test, representing the fact that 26 of the 31
schools delivered the G.R.E.A.T. program in 6th grade; three of the six Chicago schools and two
of four schools in Albuquerque taught G.R.E.A.T. in 7th grade. Thus, the students in Chicago
and Albuquerque were somewhat older than students in the other sites. Except in Chicago (in
which Hispanics are over-represented and African Americans under-represented), the sample is
similar to the demographic composition of the respective school districts.5
Outcome Results
To reiterate, the G.R.E.A.T. program has three primary goals: 1) to help youths avoid
gang membership, 2) to help youths reduce their involvement in violence and criminal activity,
and 3) to help youths develop a positive relationship with law enforcement. The curriculum
consists of 13 lessons aimed at teaching youths the life-skills thought necessary to prevent
involvement in gangs and delinquency. Among these skills are the following: empathy, risk-
seeking, conflict resolution skills, resistance to peer pressure, and refusal skills. The G.R.E.A.T.
program teaches lessons that directly address these particular skills. To assess program
5 This disproportionate representation in Chicago occurred despite efforts by the research team to recruit schools that would be representative overall of Chicago Public Schools. One of the five originally-selected schools, which was comprised of nearly 100 percent African American students, was unable to meet the requirements of the study and was dropped from the sample. Given time constraints (i.e., too late in the school year to select a comparable school and implement the program with fidelity), we were unable to replace the excluded school during 2006-2007. Thus, the resulting sample was largely Hispanic, while the district was largely African American. To increase representativeness of the sample, the decision was made to add two primarily African American schools to the evaluation in the 2007-2008 school year, even though this meant that these schools would be one year behind other schools in the evaluation.
9
This document is a research report submitted to the U.S. Department of Justice. This report has not been published by the Department. Opinions or points of view expressed are those of the author(s)
and do not necessarily reflect the official position or policies of the U.S. Department of Justice.
effectiveness, we compare responses from students in the G.R.E.A.T. classes to the students in
the control classrooms on 33 potential outcomes, including five behavioral outcomes (gang
affiliation, general delinquency, and violent offending – the latter two measured as both
frequency and variety indices) and 28 attitudinal measures, including two measures of attitudes
to the police attitudes towards gangs. First, we utilize the pre-test and the one-year follow-up
questionnaires; these results, therefore, represent short-term program effects. The student
questionnaire contains a number of questions that tap program components, including measures
of gang membership, self-reported delinquency, and attitudes toward the police. Additionally the
survey includes questions that were drawn from a variety of empirical studies assessing key risk
and protective factors associated with youth problem behaviors.
Given the research design (individuals are nested within classrooms and classrooms are
nested within schools), hierarchical linear modeling techniques were used to assess program
effectiveness. At one-year post treatment, we found statistically significant differences between
the treatment (i.e., G.R.E.A.T.) and control students on 14 out of 33 attitudinal and behavioral
outcomes. Specifically, the G.R.E.A.T. students compared to non-G.R.E.A.T. students reported:
- More positive attitudes about police (ES = .076)
- More positive attitudes about having police in classrooms (ES = .204)
- Less positive attitudes about gangs (ES = .114)
- More use of refusal skills (ES = .090)
- More resistance to peer pressure (ES = .079)
- Higher collective efficacy (ES = .125)
- Less use of hitting neutralizations (ES = .105)
- Fewer associations with delinquent peers (ES = .083)
- Less self-centeredness (ES = .054)
- Less anger (ES =. 057)
10
This document is a research report submitted to the U.S. Department of Justice. This report has not been published by the Department. Opinions or points of view expressed are those of the author(s)
and do not necessarily reflect the official position or policies of the U.S. Department of Justice.
- Lower rates of gang membership (39% reduction in odds)
- Less use of lie neutralization (ES = .066; p < .10)
- More pro-social peers (ES = .051; p < .10)
- More pro-social involvement (ES = .047; p < .10)
These findings address two of the three main program goals: 1) to reduce gang affiliation
and 2) to improve youths’ relationships with law enforcement. Additionally, several program-
specific skills-building objectives appear to be met, especially refusal skills. These results can be
considered quite favorable and reflect sustained program effects, one year post-program. That is,
students completing the G.R.E.A.T. program had lower rates of gang affiliation than did students
in the control group. Additionally, the G.R.E.A.T. students reported a number of more pro-social
attitudes, including more positive attitudes to the police, than did the control students. There
were, however, no statistically significant differences between the two groups of students on
self-reported delinquency.
These results reflect only short-term program effects. An important question remains: are
these short-term program effects sustained across time? To address this question, we continued
to survey this group of students for three more years (most of the students were in 10th or 11th
grade at the time of the last survey administration). Remarkably (in light of the rather small
program dosage of 13 lessons that averaged less than 40 minutes per lesson), the analyses
revealed results similar to the one-year post program effects, albeit with smaller effect sizes.
Across four years post program the following 10 positive program effects were found:
- More positive attitudes to police (ES = .058)
- More positive attitudes about police in classrooms (ES = .144)
- Less positive attitudes about gangs (ES = .094)
- More use of refusal skills (ES = .049)
11
This document is a research report submitted to the U.S. Department of Justice. This report has not been published by the Department. Opinions or points of view expressed are those of the author(s)
and do not necessarily reflect the official position or policies of the U.S. Department of Justice.
- Higher collective efficacy (ES = .096)
- Less use of hitting neutralizations (ES = .079)
- Less anger (ES = .049)
- Lower rates of gang membership (24% reduction in odds)
- Higher levels of altruism (ES = .058)
- Less risk seeking (ES = .053)
These effects are all in the direction of beneficial program effects, but again, the effect sizes are
modest (some would say small). Importantly, although the other comparisons between the two
groups were not statistically significant, all indicated more pro-social attitudes and behaviors
among the G.R.E.A.T. students.
Replication across study sites
One of the evaluation objectives was to assess the extent to which the program could be
implemented in different locales and if the results were similar across the diverse settings. To
address these issues, we replicated the analyses for each of the seven cities. The outcome
analyses for both the short- and long-term follow-up periods produced similar results. Results in
three of the cities (Albuquerque, the DFW area site, and Portland) were similar, albeit not
identical, to the aggregate level results reported above. A few program effects were noted in
Philadelphia but null findings were found in Greeley, Nashville, and Chicago. By four-years
post-treatment, results in Albuquerque, Portland, and the Texas site resemble the aggregate
results. Philadelphia experienced a few positive outcomes while Chicago and Greeley once again
had null findings. At four years post-treatment, however, the G.R.E.A.T. students in Nashville
reported five negative outcomes (more susceptibility to peer pressure, more commitment to
negative peers, less school commitment, and greater neutralizations for lying and stealing).
Overall, the site-specific results are quite robust with the four years post-treatment results quite
12
This document is a research report submitted to the U.S. Department of Justice. This report has not been published by the Department. Opinions or points of view expressed are those of the author(s)
and do not necessarily reflect the official position or policies of the U.S. Department of Justice.

similar to those found for one year post-treatment with the caveat that the one year post-
treatment effect sizes, as is the case with the overall results, are somewhat larger.
Effectiveness by pre-existing risk
We also investigated the possibility that the program might have differential impact based
on students’ pre-existing risk for gang membership. To test for this, we used Wave 1 data to
identify students at risk for gang membership. Specifically, we used sex, race/ethnicity, and 35
attitudinal and behavioral measures from wave 1 as predictors of ever being a gang member in
wave 2 through 6. None of the treatment by risk interactions wass significant, but to test for the
possibility that effects may change over time, we also examined risk by treatment by time
interactions. A number of significant three way interactions emerged and the pattern is
consistent; the three way interactions suggest that most of the beneficial impact is associated
with the high risk students in the early waves and that the treatment/control difference for high-
risk youth fades over time.
Summary
To recap, our multi-component evaluation found that the G.R.E.A.T. program is
implemented as it is intended and has the intended program effects on youth gang membership
and on a number of risk factors and social skills thought to be associated with gang membership.
Results one year post-program showed a 39% reduction in odds of gang-joining among students
who received the program compared to those who did not and an average of 24% reduction in
odds of gang joining across the four years post-program. To learn more, please see the resources
provided below.
For more information about the G.R.E.A.T. program: http://www.great-online.org/ For more information about the G.R.E.A.T. Evaluation: http://www.umsl.edu/ccj/About%20The%20Department/great_evaluation.html.
13
This document is a research report submitted to the U.S. Department of Justice. This report has not been published by the Department. Opinions or points of view expressed are those of the author(s)
and do not necessarily reflect the official position or policies of the U.S. Department of Justice.
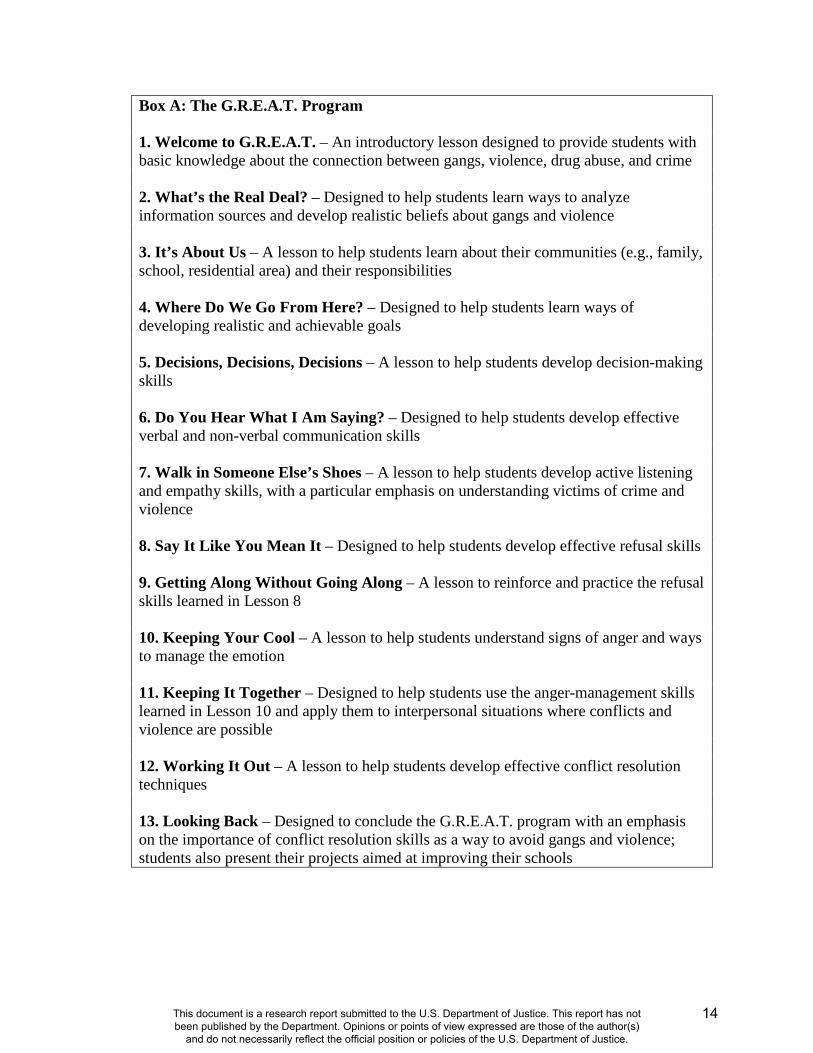
Box A: The G.R.E.A.T. Program 1. Welcome to G.R.E.A.T. – An introductory lesson designed to provide students with basic knowledge about the connection between gangs, violence, drug abuse, and crime 2. What’s the Real Deal? – Designed to help students learn ways to analyze information sources and develop realistic beliefs about gangs and violence 3. It’s About Us – A lesson to help students learn about their communities (e.g., family, school, residential area) and their responsibilities 4. Where Do We Go From Here? – Designed to help students learn ways of developing realistic and achievable goals 5. Decisions, Decisions, Decisions – A lesson to help students develop decision-making skills 6. Do You Hear What I Am Saying? – Designed to help students develop effective verbal and non-verbal communication skills 7. Walk in Someone Else’s Shoes – A lesson to help students develop active listening and empathy skills, with a particular emphasis on understanding victims of crime and violence 8. Say It Like You Mean It – Designed to help students develop effective refusal skills 9. Getting Along Without Going Along – A lesson to reinforce and practice the refusal skills learned in Lesson 8 10. Keeping Your Cool – A lesson to help students understand signs of anger and ways to manage the emotion 11. Keeping It Together – Designed to help students use the anger-management skills learned in Lesson 10 and apply them to interpersonal situations where conflicts and violence are possible 12. Working It Out – A lesson to help students develop effective conflict resolution techniques 13. Looking Back – Designed to conclude the G.R.E.A.T. program with an emphasis on the importance of conflict resolution skills as a way to avoid gangs and violence; students also present their projects aimed at improving their schools
14
This document is a research report submitted to the U.S. Department of Justice. This report has not been published by the Department. Opinions or points of view expressed are those of the author(s)
and do not necessarily reflect the official position or policies of the U.S. Department of Justice.
PROCESSS EVALUATION
Multi-method strategy for assessing program fidelity: The national evaluation of the revised G.R.E.A.T. program1
Finn-Aage Esbensen University of Missouri-St. Louis
Kristy N. Matsuda
University of Missouri-St. Louis
Terrance J. Taylor University of Missouri-St. Louis
&
Dana Peterson University at Albany
1 A version of this report was previously published in Evaluation Review (2010) 35:14-39.
15
This document is a research report submitted to the U.S. Department of Justice. This report has not been published by the Department. Opinions or points of view expressed are those of the author(s)
and do not necessarily reflect the official position or policies of the U.S. Department of Justice.
Multi-method strategy for assessing program fidelity: The national evaluation of the revised G.R.E.A.T. program
Abstract
This study reports the results of the process evaluation component of the Process and Outcome
Evaluation of the Gang Resistance Education and Training (G.R.E.A.T.) program. The process
evaluation consisted of multiple methods to assess program fidelity: 1) observations of
G.R.E.A.T. Officer Trainings, 2) surveys and interviews of G.R.E.A.T.-trained officers and
supervisors, 3) surveys of school personnel, and 4) “on-site,” direct observations of officers
delivering the G.R.E.A.T. program in the study sites. Results illustrate a high level of program
fidelity, providing greater confidence in any subsequent outcome results.
16
This document is a research report submitted to the U.S. Department of Justice. This report has not been published by the Department. Opinions or points of view expressed are those of the author(s)
and do not necessarily reflect the official position or policies of the U.S. Department of Justice.
The demands for implementation and dissemination of “evidence-based practices”—
those which have been found to meet their primary goals through rigorous scientific scrutiny—
have gained substantial momentum during the past decades. At the same time, there has been
renewed emphasis on prevention, rather than reaction. Consequently, research focusing on
“what works” has become an increasing priority in order to help develop, modify, and replicate
successful programs and policies (see, for example, the efforts of Elliott and Mihalic 2004;
Fagan and Mihalic 2003; McHugo et al. 2007; and Mihalic and Irwin 2003). The general public
wants social problems “fixed,” policy-makers are expected to “do something,” and practitioners
want to know that they are “making a difference,” all the while being conscience of the “bottom-
line” that “resources are limited.” While these foci have permeated many settings, they have
become increasingly important in school-based settings, where constraints posed by mandated
curricula mean that limited time for prevention should be well-spent on programs with
demonstrated efficacy (see Gottfredson 2001 for an excellent review of findings from
evaluations of school-based prevention programs).
Program Fidelity: What is it and why is it important?
In the search for “what works,” it is equally important to understand how and why
certain interventions are more successful than others (Dusenbury et al. 2003). The issues of
“how” and “why” of program success are typically determined through process evaluations.
Program fidelity, or the degree to which program providers deliver the program as intended
(Dusenbury et al. 2003), includes a number of dimensions, including adherence, dose, quality,
participant responsiveness, and program differentiation (Dane and Schneider 1998). Dumas and
colleagues succinctly stated (2001: 38): “In outcome research, an intervention can be said to
satisfy fidelity requirements if it can be shown that each of its components is delivered in a
17
This document is a research report submitted to the U.S. Department of Justice. This report has not been published by the Department. Opinions or points of view expressed are those of the author(s)
and do not necessarily reflect the official position or policies of the U.S. Department of Justice.
comparable manner to all participants and is true to the theory and goals underlying the
research.”
Without evidence that a program has been implemented properly, it is difficult to
determine whether a program “works,” or meets its intended goals (Kovaleski et al. 1999; Rossi,
Freeman, and Lipsey 1999). In fact, a substantial body of research indicates that lack of program
fidelity—rather than failure of the program design—is one of the primary explanations for the
failure of prevention programs (see Dusenbury et al. 2003 for an excellent review). Thus,
outcome evaluations failing to take into account the degree of program fidelity may lead to a
“Type III error,” or erroneously concluding that outcomes indicating the degree of program
success are due to the specific intervention under examination when, in fact, that is not the case
(Basch et al. 1985; Dobson and Cook 1980). This is not a trivial issue, as meta-analyses have
found that program effect sizes can vary substantially depending upon the degree of program
fidelity (Durlak and DuPre 2008; Lipsey 2009).
In addition to providing greater confidence that outcome effectiveness results are truly
related to the program, evaluations of program fidelity allow for two additional outcomes: 1)
they help identify programs and program components that can be exported to and implemented
in other locations and 2) the provide a greater understanding of potential barriers and remedies
when programs are being implemented in different locales (Heller 1996; Melde, Esbensen, and
Tusinski 2006; Teague, Bond, and Drake 1998). For example, recent work from the Blueprints
for Violence Prevention (Elliott and Mihalic 2004; Fagan and Mihalic 2003; Mihalic and Irwin
2003) and the National Implementing Evidence-Based Practices Project (McHugo et al. 2007)
have illustrated the difficulties of implementing and replicating even the most effective programs
in multiple settings, which has the potential to “undermine public confidence in scientific claims
18
This document is a research report submitted to the U.S. Department of Justice. This report has not been published by the Department. Opinions or points of view expressed are those of the author(s)
and do not necessarily reflect the official position or policies of the U.S. Department of Justice.
that we have programs that work” (Elliott and Mihalic 2004: 52). Dissemination of well-
executed process evaluation documentation, however, has the potential to ease the
implementation process for program providers and allows for more public confidence that
effective programs are available and possible to deliver. Indeed, finding methods to enhance
implementation of evidence-based practices provides a “bridge” between research and practice
(Fagan et al. 2008).
Current Study
Although program fidelity is recognized as being of critical importance and assessments
are becoming more common, they remain rare. Even less common are fidelity studies that
include multiple methodologies [e.g., combining surveys of program stakeholders with direct
observation of critical program components provides necessary information about the program
under review (Lillehoj, Griffin, and Spoth 2004; Melde et al. 2006)]. Dusenbury and colleagues
(2003) provide a guide of areas that should be examined: 1) teacher (i.e., program provider)
training, 2) program characteristics (e.g., as outlined in program manuals), 3) teacher (i.e.,
program provider) characteristics, and 4) organizational characteristics (e.g., support and
cooperation of the host organization).
Drawing upon prior research on program fidelity, this study reports the results of the
process evaluation component of the Process and Outcome Evaluation of the Gang Resistance
Education and Training (G.R.E.A.T.) Program. To thoroughly assess fidelity of the G.R.E.A.T.
program, we evaluate three primary areas where implementation may break-down: 1) officer
preparedness and commitment to the program (i.e., program provider training), 2) support and
involvement of educators, and 3) program delivery (i.e., officers’ actual ability to deliver the
program in the schools as designed). In order to assess these areas, data were collected from four
19
This document is a research report submitted to the U.S. Department of Justice. This report has not been published by the Department. Opinions or points of view expressed are those of the author(s)
and do not necessarily reflect the official position or policies of the U.S. Department of Justice.

primary sources: 1) observations of G.R.E.A.T. Officer Trainings to assess the quality of the
training that officers receive before being sent into classrooms, 2) surveys and interviews of
G.R.E.A.T.-trained officers and supervisors to determine their own perceptions of preparedness
and the level of commitment to delivering the program, 3) surveys of school personnel to
evaluate officers’ abilities as instructors and educators’ involvement in the program, and 4)
approximately 500 “on-site,” direct observations of 33 different officers delivering the
G.R.E.A.T. program in 31 schools in seven cities to determine the quality of program
implementation.
We begin with an overview of the G.R.E.A.T. program and a description of the multiple
methods used in this evaluation. Overall assessments of program fidelity in the areas of officer
preparedness to teach and commitment to the program, educators’ support and involvement, and
quality of program delivery, as well as observed strengths and barriers, are discussed, drawing on
findings of each component of the process evaluation. We conclude with a discussion of how
findings from the current study help to inform both specific recommendations for the G.R.E.A.T.
program stakeholders and the larger issues associated with program fidelity.
Overview of the G.R.E.A.T. Program
The Gang Resistance Education and Training (G.R.E.A.T.) program is a gang and
delinquency prevention program delivered by law enforcement officers within a school setting.
Thus, a number of stakeholders are involved, primarily 1) law enforcement agencies and their
officers and 2) schools and their personnel and students. Developed as a local program in 1991
by Phoenix area law enforcement agencies, the program quickly spread throughout the United
States (see Winfree, Peterson Lynskey, and Maupin 1999). The original G.R.E.A.T. program
operated as a nine-lesson lecture-based curriculum taught primarily in middle-school settings.
20
This document is a research report submitted to the U.S. Department of Justice. This report has not been published by the Department. Opinions or points of view expressed are those of the author(s)
and do not necessarily reflect the official position or policies of the U.S. Department of Justice.
While initial results from the 1995 cross-sectional study were promising (Esbensen and Osgood
1999), those from the more methodologically rigorous longitudinal, panel study of the program
between 1995 – 1999 found a few delayed attitudinal program effects differentiating G.R.E.A.T.
and non-G.R.E.A.T. youths, but no differences in terms of behavioral characteristics (i.e., gang
membership and involvement in delinquent behavior) (Esbensen et al. 2001).
Based in part on these findings, the G.R.E.A.T. program underwent a critical review that
resulted in substantial program modifications based upon effective evidence-based practices (see
Esbensen et al. 2002 for a description of this process). The revised curriculum (see Appendix
A) consists of 13 lessons aimed at teaching youth’s evidence-based life-skills (e.g.,
communication and refusal skills, as well as conflict resolution and anger management
techniques) necessary to prevent involvement in gang behavior and delinquency. The revised
G.R.E.A.T. curriculum was piloted in January 2001 with full-scale implementation occurring the
following year.
The program’s two main goals are:
1. To help youths avoid gang membership, violence, and criminal activity.
2. To help youths develop a positive relationship with law enforcement.
The evaluation consists of a number of different components, including student surveys,
classroom observations, surveys of teachers and law enforcement officers, interviews with
G.R.E.A.T. officers and G.R.E.A.T. supervisors, and observations of G.R.E.AT. Officer Training
(G.O.T.).
Site Selection
During the summer of 2006, efforts were made to identify cities for inclusion in the
Process and Outcome Evaluation of G.R.E.A.T. Site selection was based upon three main
21
This document is a research report submitted to the U.S. Department of Justice. This report has not been published by the Department. Opinions or points of view expressed are those of the author(s)
and do not necessarily reflect the official position or policies of the U.S. Department of Justice.
criteria: 1) existence of an established G.R.E.A.T. program, 2) geographic and demographic
diversity, and 3) evidence of gang activity. Sites were selected with consideration to the
following factors: the length of time the program had been in operation; the number of
G.R.E.A.T.-trained officers; the number of schools in which the program was offered; and the
components of the G.R.E.A.T. program implemented. Each potential city also had demonstrable
youth gang activity according to the National Youth Gang Center (now the National Gang
Center). Consideration was given to the representativeness of the selected sites in terms of both
the program and the targeted audience. That is, program-related variables such as police
department size and organizational structure may affect program delivery. Some G.R.E.A.T.
programs, for instance, utilize School Resource Officers (SRO) to teach the program while
others use the “Portland” model in which “street cops” teach the program on an overtime basis in
schools on their beat. Other program-related characteristics that we considered include school
size, length of program history at a site, and size and degree of program implementation. Site
characteristics that were considered include population characteristics (i.e., race and ethnic
composition, and population size), volume of youth crime and gang activity, and geographic
location. Without consideration of such factors it would be difficult to address the extent to
which the program is adaptable to different settings and audiences. Because G.R.E.A.T. is a
universal prevention program, it was important that the evaluation address the extent to which
G.R.E.A.T. is effective in diverse settings. Ultimately, seven cities varying in size, region, and
level of gang activity were recruited into the study (Albuquerque, New Mexico; Chicago,
Illinois; a location in the Dallas/Ft. Worth (DFW) area in Texas; Greeley, Colorado; Nashville,
Tennessee; Philadelphia, Pennsylvania; and Portland, Oregon).
22
This document is a research report submitted to the U.S. Department of Justice. This report has not been published by the Department. Opinions or points of view expressed are those of the author(s)
and do not necessarily reflect the official position or policies of the U.S. Department of Justice.
Once the cities were selected, the research staff worked with the primary local law
enforcement agency and the school district in each city to secure their cooperation. Four or five
schools in each city were selected with the goal of selecting schools that, taken as a whole,
would be representative of the districts. School and police personnel were informed of the
purpose of the evaluation, issues related to the random assignment of classrooms to the treatment
condition (i.e., receive G.R.E.A.T./not receive G.R.E.A.T.), procedures to obtain active parental
consent for students in these classrooms, scheduling the G.R.E.A.T. program delivery, and other
logistical issues associated with the study design.
DATA AND METHODS
Observations of G.R.E.A.T. Officer Training (G.O.T.)
Prior studies have highlighted that good training for program providers increases the
likelihood that programs will be implemented with fidelity (Dusenbury et al. 2003). To examine
the training aspect of the G.R.E.A.T. program, we conducted observations of eight G.R.E.A.T.
Officer Training (G.O.T.) sessions from June 2006 to August 2008. Each of the original five
G.R.E.A.T. regions (i.e., Midwest, Northeast, Southeast, Southwest, and West) coordinated
delivery of the standard (G.O.T) in its region. At least one training session was observed in each
of the five G.R.E.A.T. regions in the event of site-specific variation in training. In total, two
G.O.T.s were observed in the Midwest, one in the Northeast, one in the Southeast, two in the
Southwest, and two in the West. G.O.T.s are available in two programs. The 40-hour (i.e., one
week) training is available for officers with prior teaching experience and an 80-hour, two week,
training is available for officers with no prior experience.2 Both types of training are taught by
2 The longer program allows for officers with limited teaching histories to “teach back” lessons and receive feedback
on their public speaking. It also provides a “transition” component that helps officers make the move from their law
23
This document is a research report submitted to the U.S. Department of Justice. This report has not been published by the Department. Opinions or points of view expressed are those of the author(s)
and do not necessarily reflect the official position or policies of the U.S. Department of Justice.
the same staff.3 Six observations of the 40-hour program were completed and two of the 80-hour
sessions.4 Observers took detailed notes during each day of training and evaluated each G.O.T.
session on 1) coverage of the G.R.E.A.T. components, 2) styles and strategies for effective
classroom delivery, and 3) adherence to training guidelines.
Surveys and Interviews with G.R.E.A.T. Officers and Supervisors
Surveys were sent to all G.R.E.A.T.-trained officers (mean=24.8, range= 6 to 55) in six
of the seven cities participating in the evaluation. The seventh site, Chicago, had over 150
G.R.E.A.T.-trained officers, so surveys were sent to a random sample of 40% of these officers
(n=56). In total, 205 surveys were distributed and 137 were returned (66.8%). By city, the survey
response rate ranged from 37.5 percent in Chicago to 89.7 percent in Nashville. Survey packets
included an anonymous survey, a sealable postage-paid envelope, and a brief letter explaining
the G.R.E.A.T. evaluation and the purpose of the officer surveys. In addition to personal and
professional descriptive information, officers were asked for the reasons they became
G.R.E.A.T. officers, their opinion on the effectiveness of the program design and lessons, and
their experiences actually teaching the program. The survey sample was mostly male (75%) and
enforcement orientation to their new role as a prevention program provider (see Taylor, Esbensen, and Peterson,
2009 for more detail).
3 All G.O.T.s are taught by police officers certified by the National Training Team to teach officers the curriculum.
Approximately 5-8 certified officers are present at each training session. They are assisted by a member of the
Institute for Intergovernmental Research (to provide technical assistance), a professional educator (to inform
teaching pedagogy), and a gang expert (to cover gang trends and characteristics).
4 Observers included the Principal Investigator, the Co-Investigators, and graduate research assistants.
24
This document is a research report submitted to the U.S. Department of Justice. This report has not been published by the Department. Opinions or points of view expressed are those of the author(s)
and do not necessarily reflect the official position or policies of the U.S. Department of Justice.
65.2 percent White (17.8% African American, 10.4% Hispanic, and 6.6% Other race/ethnicity)
with an average of 16 years in law enforcement (SD=7.5).
In addition to the surveys, we conducted face-to-face or telephone interviews with the
officers who taught the program in the 25 of the 31 schools participating in the evaluation (we
were not permitted to interview Chicago Police Department personnel) and with five of the
G.R.E.A.T. supervisors. The supervisor interview instrument included ten questions, asking them
to describe the reasons for and extent of their agency’s involvement in the G.R.E.A.T. program;
where G.R.E.A.T. fits in the broader agency picture and mission; how officers are selected for
G.R.E.A.T.; their role as supervisor and major challenges faced in that role; relationships with
the schools; and the extent of the gang problem in the area and schools.
We interviewed 27 of the 33 officers delivering the program in the study setting. In
addition to the four officers from Chicago to whom we were not granted access, one officer in
Portland and one in Albuquerque could not be reached. Each interview lasted approximately 30
minutes and included 14 questions. Officers were asked to describe the reasons for and extent of
their involvement in the G.R.E.A.T. program; where G.R.E.A.T. fits in the broader agency
picture and mission; the major challenges of program delivery; the support they have received
from their agency and the other related organizations (e.g., National Training Team); the
resulting relationship with the schools; and the extent of the gang problem in the area and
schools. Officers were also asked specifics about their program delivery, such as the lessons they
consider to be the most effective, their recommendations for changes to the curriculum, and
whether they had ever skipped or combined lessons and, if so, the reasons this was necessary.
Survey of School Personnel
25
This document is a research report submitted to the U.S. Department of Justice. This report has not been published by the Department. Opinions or points of view expressed are those of the author(s)
and do not necessarily reflect the official position or policies of the U.S. Department of Justice.
Surveys were also distributed to all school administrators (Principals and Vice/Assistant
Principals) and all teachers and coordinators at the grade level in which G.R.E.A.T. was taught in
the 31 schools under evaluation. Surveys, a cover letter explaining the purpose, and a small gift
were distributed to 29 schools in spring of 2007. The response rate was much lower than desired.
Only 29.1 percent of the sample returned completed surveys (range of 13.5% to 54.2% across
sites). Schools with very low return rates and two newly added schools to the evaluation were re-
surveyed in fall 2008. This attempt yielded a 58.4 percent return rate (range of 40.4% in two sites
to 90% in Nashville). Surveys from both attempts were combined for analyses.5 In total, 373
surveys were distributed and a 61.7 percent combined response was achieved (n=230 non-
duplicate surveys). Most survey respondents were teachers (83%) and female (68%), 75 percent
were White (12% Black, 4% Hispanic/Latino, and 8% were of other or multi-racial/ethnic
background), and 64 percent taught primarily 6th grade.
All school personnel were asked about their professional history, their opinions on the
issues facing their schools, school climate and job satisfaction, their perceptions of school-based
prevention programs in general, and their views about police officers in schools. Educators with
a personal knowledge of the G.R.E.A.T. program were asked their opinions about the basic
purpose and design of the program. In total, 186 of the 230 respondents (82% of the sample)
reported familiarity with the program. This included 92 percent of administrators and 79 percent
of teachers. Finally, teachers who had had G.R.E.A.T. taught in their classrooms were asked to
5 Surveys were anonymous. To ensure that duplicate surveys were not included (e.g., the same person returning a
survey at both administration), responses to key demographic questions like sex, race/ethnicity, position held, and
years at school were compared between the two collections. When a duplicate was discovered, the spring 2007
survey was the only one included in the final sample.
26
This document is a research report submitted to the U.S. Department of Justice. This report has not been published by the Department. Opinions or points of view expressed are those of the author(s)
and do not necessarily reflect the official position or policies of the U.S. Department of Justice.
comment on their most recent experience with the program and their opinion of the G.R.E.A.T.
officer. In total, 96 respondents (42% of the sample and 52% of those familiar with the program)
reported G.R.E.A.T. had been taught in their classrooms.
Observations of G.R.E.A.T. Implementation in Classrooms
Classrooms were randomly assigned in each school to receive the program or serve as
controls.6 Members of the national evaluation team conducted observations of officers
delivering the G.R.E.A.T. program in each of the seven evaluation sites from September 2006 to
May 2007. A 41-page program delivery instrument (three to four pages for each of the 13
lessons) was created for use in the field. The instrument, based upon the material contained in the
G.R.E.A.T. Instructor’s Manual, included measures of 1) the main components of G.R.E.A.T.
organized by lesson (i.e., adherence to program design and coverage of topical areas), 2) time
spent per lesson component and lesson and overall time management, 3) general measures of
student involvement and engagement with officer, and 4) overall lesson quality. This instrument
contained both quantitative (in the form of checklists where observers recorded the presence or
absence of particular aspects such as coverage of particular lesson content) and qualitative (i.e.,
space for observers to record open-ended comments about, for example, the discussion or
6 To assess the degree to which the random assignment process minimized differences across classrooms
(potentially confounding results), we also conducted 108 observations of treatment and control classrooms.
Observers noted the physical layout (e.g., resources available in classroom, spaciousness), teachers’ instructional
style (e.g., student-teacher interaction, learning activities), teachers’ control of classroom misbehavior, engagement
of students, attentiveness of the class, and an overall assessment of the classroom setting. For G.R.E.A.T.
classrooms, observers also rated whether classes for each teacher were “Better,” “the Same,” or “Worse” on each of
the above criteria during classes when G.R.E.A.T. was not in session. Observers noted no overt classroom
differences between the G.R.E.A.T. and control classrooms.
27
This document is a research report submitted to the U.S. Department of Justice. This report has not been published by the Department. Opinions or points of view expressed are those of the author(s)
and do not necessarily reflect the official position or policies of the U.S. Department of Justice.
activities of the lesson) components. Observers also made note of any unusual occurrences
during the lesson. In total, 492 unique observations and 26 sets of inter-rater reliability (IRR)
observations were completed for this evaluation.7 A total of 33 officers taught the program in the
seven study sites. Four officers taught the program in each of five cities: Albuquerque, Chicago,
DFW-area site, Greeley, and Nashville. Five officers were observed in Philadelphia, and eight
different officers were included in Portland. Each officer was observed an average of 15 times
during this evaluation (range of 6 to 27), though we observed 19 different officers a minimum of
26 times. Each lesson was observed at least once in every site with four exceptions (not observed
were Lessons 12 and 13 in Chicago and Lessons 7 and 11 in Nashville) with each lesson
observed an average of 38 times (range of 26 to 53). Results of classroom observations presented
in this paper are derived from the 492 unique observations of program delivery.
RESULTS
Drawing on data obtained from the four methods described previously, we examine three
specific areas related to program fidelity: 1) G.R.E.A.T. officer preparedness and commitment to
program delivery, 2) the support and involvement of educators in participating study schools,
and 3) quality of G.R.E.A.T. program delivery. The latter includes an assessment of officers’
time management and ability to control the classroom, teacher involvement, and overall quality
of delivery.
Officer Preparedness and Commitment to Program Delivery
7 A total of 26 sets of classroom observations were conducted for IRR (representing 14 of 33 total officers). Both
qualitative and quantitative components of the two observations were assessed. Overall IRR, or percent agreement,
was 85.4 percent. Two IRR observations had agreement of less than 69 percent (46% and 29%) and were based on
observations of an officer who was determined not to have taught the program with sufficient fidelity.
28
This document is a research report submitted to the U.S. Department of Justice. This report has not been published by the Department. Opinions or points of view expressed are those of the author(s)
and do not necessarily reflect the official position or policies of the U.S. Department of Justice.
In order to have any likelihood of program fidelity, the individuals implementing the
program must be well-informed of the mission, intention, and purpose of the program. To assess
officer preparedness and commitment to program delivery we rely on the observations from
G.O.T., surveys and interviews with G.R.E.A.T. officers, and, to a lesser degree, school
personnel assessments of officers’ abilities in the classroom.
Officer Preparedness - The purpose of the G.R.E.A.T. Officer Training (G.O.T.) is to provide
police officers with the skills needed to successfully teach the G.R.E.A.T. program to middle-
school students. Officers arrive at G.O.T. with a range of prior teaching experiences, and the
training is intended to cater to all levels of teaching ability. Overall, observers concluded that the
G.O.T. provided officers with sufficient knowledge and skill to be effective at implementing the
program. The evaluation showed that G.R.E.A.T. trainers adhered to the training guidelines and
provided sufficient coverage of all of the G.R.E.A.T. curriculum components.
Coverage of the program was provided using both overviews of lessons (i.e., trainers
would review the materials of the lesson) and lesson modeling (i.e., trainers would teach the
lesson in full to the trainees as if they were middle school students). Officers in the 80-hour
training were allowed sufficient opportunity to improve their teaching abilities. Officers
practiced their public speaking every day in the two-week training. At the beginning of the
training, presentations were only two to three minutes long. Officers received feedback from
other trainees and team leaders, and eventually presented an overview of a G.R.E.A.T. lesson.
Different trainers modeled G.R.E.A.T. lessons for the trainees to present a variety of teaching
styles. In addition, educational specialists led discussions of good pedagogy and introduced
various methods of teaching a middle school student audience. Gang experts (often police
officers in gang units) exposed officers to trends in gang crime and gang research.
29
This document is a research report submitted to the U.S. Department of Justice. This report has not been published by the Department. Opinions or points of view expressed are those of the author(s)
and do not necessarily reflect the official position or policies of the U.S. Department of Justice.
All indicators suggest that officers who complete G.O.T. should be sufficiently prepared
to teach the program. Consistent with this finding, all of the G.R.E.A.T. trained officers we
interviewed during this evaluation stated that they felt prepared to deliver the program after
training. It may be, however, that the most critical judges of officer preparedness may not be
objective observers of their training or the officers themselves, but rather the teachers in whose
classrooms the G.R.E.A.T. program is delivered. Of the school personnel who reported
G.R.E.A.T. being taught in their classroom, 85 percent “agreed” or “strongly agreed” that
officers appeared adequately trained to deliver program content.
Our process evaluation, however, does not suggest that there is no room for
improvement. Observers of the G.O.T. consistently noted one area in need of improvement for
officer preparedness was time management. The G.R.E.A.T. curriculum uses a “building-block”
approach to skills building with each lesson building upon prior lessons in the 13-lesson series.
The G.O.T. sessions provided “modeled” lessons, or lessons as they should be delivered in the
classrooms. Each G.R.E.A.T. lesson in the curriculum is designed to be taught in 40 to 45
minutes, but generally, trainers modeled the lessons in a one-hour time frame (and in some
instances, observers noted that trainers did not or could not complete the lesson within an hour).
This one-hour time frame may be unrealistic in practice, given that middle school class periods
are generally shorter than 50 minutes. The G.O.T. modeling lessons may overestimate the time
allotted for G.R.E.A.T. teaching in practice, and thus, may be under-preparing officers for time
management in the field.
To help assess program delivery and the concern raised from observations at G.O.T.
regarding time management, surveyed officers were asked if they ever combined or skipped
lessons while they were teaching. In total, 31.7 percent of surveyed officers reported that they
30
This document is a research report submitted to the U.S. Department of Justice. This report has not been published by the Department. Opinions or points of view expressed are those of the author(s)
and do not necessarily reflect the official position or policies of the U.S. Department of Justice.
had combined or skipped a lesson. Those officers who did skip at least one lesson reported doing
so most often toward the end of the 13-week program (i.e., 76.5% skipped one lesson between
Lessons 8 through 13). The primary reason (62.2%) offered for skipping or modifying the lesson
was time constraints due, for example, to shortened class schedules or to attempts to complete
the 13-lesson program in a specified time period during the school year. The effect of time
management on the fidelity of program delivery will be addressed in the latter half of this paper.
Another potential area for improvement emerged from officer interviews and school
personnel surveys. Some G.R.E.A.T. officers reported that, despite their feeling prepared to
teach the program, they would have benefited from more instruction on how to manage the
classroom (i.e., deal with disruptive students). The survey of school personnel supported this
notion. Despite a high percentage of educators agreeing that officers were prepared to teach the
program, there was less agreement (only 74% “agreeing” or “strongly agreeing”) that officers
were prepared for classroom management. Fourteen percent of school personnel indicated that,
in their experience, officers had difficulty controlling the class. While the G.R.E.A.T. Officer
Training emphasizes the importance of soliciting teachers’ assistance and cooperation in
program delivery, this area may require more attention during the GOTs. The classroom
management skills of G.R.E.A.T. officers were found to be very important and are discussed in
the section on program implementation.
Officer Commitment – Observers of G.O.T. noted that officer enthusiasm for being a part of the
training and program varied. Some officers had volunteered to attend the training and others
were assigned to be there. For example, in team meetings on the first day of training, one officer
said he had been trying to get to the training for years, while another suggested that he was sent
because of “departmental politics.” Although officers were given the tools that they would need
31
This document is a research report submitted to the U.S. Department of Justice. This report has not been published by the Department. Opinions or points of view expressed are those of the author(s)
and do not necessarily reflect the official position or policies of the U.S. Department of Justice.
to effectively teach the program, it is still unclear whether all officers necessarily desired the
opportunity to do so. Our surveys and interviews of G.R.E.A.T.-trained officers further explored
this issue. Officers were asked why they became G.R.E.A.T.-trained. Results differed based on
method. When asked to indicate the reason(s) s/he became involved with G.R.E.A.T. from a list
of six possible choices (with “other” offered as a choice), a majority (85.3%) of the survey
sample selected, as at least one of their answers, that they “wanted to teach” or “wanted to
prevent kids from joining gangs.” By contrast, only six of the 27 officers interviewed using an
open-ended response format indicated that working with kids was their motivation for becoming
a G.R.E.A.T. officer. A majority of the interview sample reported that they taught the program
because they were assigned or required to do so as part of their regular assignment.
Variation in enthusiasm may stem from perceptions about how being a G.R.E.A.T.
officer affects one’s career. A majority of officers reported in the survey that teaching
G.R.E.A.T. 1) does not improve their chances for promotion, 2) allows them fewer opportunities
for overtime8, and 3) is not well perceived by other officers. One supervisor stated in an
interview that G.R.E.A.T. officers are “looked down upon by other officers.” Many officers
echoed this sentiment. Over 20 percent of survey respondents reported that one of the aspects of
being a G.R.E.A.T. officer they disliked was the “way they are viewed by other officers.”
Interviews with officers helped to clarify this point further. Approximately 11 percent of
interviewed officers mentioned the perception of other officers when asked what they disliked
about teaching G.R.E.A.T. in an open-ended format. These officers suggested that other officers
viewed them as “lazy” or “kiddie cops.”
8 It is important to note that officers in Portland deliver the G.R.E.A.T. program on an overtime basis. Thus, the
pooled survey responses may mask site-specific differences in responses.
32
This document is a research report submitted to the U.S. Department of Justice. This report has not been published by the Department. Opinions or points of view expressed are those of the author(s)
and do not necessarily reflect the official position or policies of the U.S. Department of Justice.

Support and Involvement of School Personnel
Though the G.R.E.A.T. program focuses on police officers interacting with students, the
involvement of school personnel must be highlighted. School personnel have the ability to be
“game changers” in implementation of the program (this point will be highlighted in next section
of the paper). School administrators must agree to implement the program in their schools, and
teachers must “give up” their instructional time for the program. The involvement of educators
has always been a component of this school-based program design. This is why educational
specialists attend each G.O.T. and why the G.R.E.A.T. curriculum includes “extended-teacher
activities” (i.e., activities that can be incorporated by teachers into their curricula to reinforce
G.R.E.A.T. lessons). If school personnel do not believe in the need for or utility of the program,
they may be reluctant to assist in its implementation.
School Personnel Support – Surveyed school personnel were generally supportive of school-
based prevention programs. Most respondents agreed that these kinds of programs could help
deter youth from drugs, delinquency, and gang involvement (80%), and that it is the school’s
responsibility to prevent students from engaging in these kinds of behaviors (81%). However,
fewer personnel reported they would like to see more prevention programs in their schools
(64%), and only 56 percent agreed that teachers should incorporate prevention program lessons
into their own curricula. Most of the school personnel who were familiar with the G.R.E.A.T.
program reported being in favor of having the program in their school (89%).
Personnel familiar with the G.R.E.A.T. program were asked to assess the program design,
with most school personnel agreeing that the design is appropriate to achieve desired program
goals. Ninety-two percent of the educators, for example, thought the curriculum was age-
appropriate. Further, 82 percent believed that the G.R.E.A.T. program teaches the students the
33
This document is a research report submitted to the U.S. Department of Justice. This report has not been published by the Department. Opinions or points of view expressed are those of the author(s)
and do not necessarily reflect the official position or policies of the U.S. Department of Justice.
skills needed to avoid gangs and violence, and 85 percent agreed that it improves students’
perceptions of police. However, only about 60 percent agreed that the G.R.E.A.T. curriculum
was long enough and that officers had enough time in each class period to cover all of the
relevant material.
School Personnel Involvement - Despite the importance of school personnel in the presentation
and implementation in the G.R.E.A.T. program, results from observations of G.O.T. and surveys
with school personnel show that educators’ involvement in the program is minimal and could be
improved.
Educational specialists at G.O.T. help prepare officers to deliver the program.
Observations of G.O.T. revealed educational specialists’ contributions are very important
(especially to the longer 80-hour training for officers with no previous teaching experience).
However, observers noted that after their primary presentations, educators were not utilized
much at the trainings. This is noteworthy given they are experts in classroom management and
age-specific behavioral issues, and they have insight into how to get classroom teachers involved
in both classroom management and G.R.E.A.T. delivery. In addition, observations of G.O.T.
revealed that extended-teacher activities were often glossed over by trainers (usually due to time
limitations), raising the question of whether officers are familiar enough with these resources to
pass them on to teachers.
Minimal teacher involvement was echoed by school personnel survey respondents who
reported that G.R.E.A.T. had been taught in their classes (n=96 or 42% of surveyed sample).
Teachers were asked in an open-ended response format how they generally spent their time while
G.R.E.A.T. was being taught in their classrooms.9 Teachers most often responded that they
9 A total of 72 school personnel provided a response to this question, and many provided more than one answer.
34
This document is a research report submitted to the U.S. Department of Justice. This report has not been published by the Department. Opinions or points of view expressed are those of the author(s)
and do not necessarily reflect the official position or policies of the U.S. Department of Justice.
observed or listened (about 42%), assisted with discipline (about 31%), assisted the officer as
needed (about 20%) and/or participated in some other manner (about 20%). Many indicated they
used the time for grading or planning (31%).
Educators were also asked if they covered or reinforced any G.R.E.A.T. content in their
own lesson plans (e.g., drugs, gangs, violence, culture, communication, peer pressure). Fifty-five
percent of school personnel did report covering or reinforcing some G.R.E.A.T. content (most
often because the content was consistent with other planned lessons), but most teachers (84%)
did not use any of the G.R.E.A.T. extended-teacher activities designed by the program. Teachers
often reported that they did not know these activities existed (31%) or that they did not have any
time (43%). Results suggest that educational personnel are largely untapped resources that could
be brought in to support the program and its implementation.
Quality of Program Delivery
Time Management – Despite observer concerns that G.O.T. was overestimating the amount of
time actually available to teach the program in schools, most officers did an excellent job fitting
program delivery into the allotted time frame. The average time it took to deliver a lesson was 40
minutes. In this study, we considered that any lesson taught in 20 minutes or less was not
implemented as intended. This time allotment is approximately half of the estimated time
recommended for each lesson by the G.R.E.A.T. curriculum. Of the 33 officers, 19 were never
observed completing a lesson in less than 20 minutes. Nine officers were observed teaching one
lesson under 20 minutes, three officers taught two lessons under the time, and one officer taught
three lessons under the 20 minute mark. One additional officer had chronically poor adherence to
time management. This officer taught more than three lessons in less than 20 minutes and was
35
This document is a research report submitted to the U.S. Department of Justice. This report has not been published by the Department. Opinions or points of view expressed are those of the author(s)
and do not necessarily reflect the official position or policies of the U.S. Department of Justice.
the only officer classified as poorly implementing the program based solely on time management
(this officer was reassigned at the end of the year).
The result of difficulties in time management was a decrease in the quality of lesson
adherence. In instances when time became problematic, sections were taught more quickly,
activities and/or discussion were eliminated, and/or lessons were combined with other lessons.10
We previously presented concerns with combining of lessons as a solution for time management
issues. In our survey of G.R.E.A.T trained officers, almost one-third of officers reported
combining lessons at some point in time. They also reported that they had done so because of
outside influences, such as shortened class schedules, for example, due to a fire drill, or other
policing duties that pulled them from the classroom. In the classroom observations of
G.R.E.A.T. delivery, we found that 8 of the 33 officers (24%) combined a lesson. Most often,
officers taught more than one lesson per class to complete a prior lesson or accommodate
restricted time frames for completing the program. In only one instance did it appear that
combining lessons was an attempt to reduce the length or coverage of the G.R.E.A.T. lesson. In
short, the process evaluation did not conclude that lesson combining was occurring on a regular
basis, nor was it systematic when it did occur.
The two most common causes of time management problems were disruptive students or
atypical occurrences. Many officers displayed inventive and effective methods of classroom
control, but the officers who did not have command over rowdy students most often had
problems with time management. Also contributing to poor time management was the
10 The G.R.E.A.T. training provides guidelines about how officers are to handle time management. For example, in
instances when a lesson needs to be shortened, officers are instructed to skip introductions and/or wrap-ups, but
never to skip the “Life in the Middle” skit. Our observations revealed that officers followed these guidelines often.
36
This document is a research report submitted to the U.S. Department of Justice. This report has not been published by the Department. Opinions or points of view expressed are those of the author(s)
and do not necessarily reflect the official position or policies of the U.S. Department of Justice.
occurrence of atypical events, of which the most common (occurring 57 times) were schedule
changes due to a school-sanctioned activity (e.g., assembly, fire drill, field trip) or the officer
being interrupted to perform duties related to policing (e.g., responding to a school disturbance).
Other atypical situations included the presence of a substitute teacher (n=14) or substitute
G.R.E.A.T. officer (n=4). Officers generally were not informed of changes to the schedule in
advance and were forced to alter their lesson plans on arrival.
Classroom Management – As stated previously, some G.R.E.A.T. officers and school personnel
expressed concern with officers’ ability to manage the classroom. Our evaluation found that one
of the major reasons for time mismanagement (and therefore, poorer lesson adherence) was
difficulty handling problematic classroom behavior. The overall quality of the lesson relied
heavily on student and teacher behavior. Observers found that students were better behaved
when teachers were involved in the program and classroom management, the topic of the next
section. While classroom management techniques are covered in G.O.T., this is generally in the
form of trainers discussing the techniques and modeling them in the process of modeling the
lessons. Officers themselves are not offered the opportunity to role-play or practice behavior
management, something that may improve their confidence and effectiveness in this area.
Teacher involvement – Perhaps not surprisingly, the best lesson delivery involved strong
relationships between officers, students, and teachers. Teacher involvement, in particular, was
critical to improving the implementation of the program. When teachers became involved in
lesson content (e.g., participated in discussion or walked around to check students’ progress on
activities), lessons ran more smoothly and students were more respectful, cooperative, and
interested. There were some instances, however, when teachers would ignore students’
misbehavior, leave the room, use the telephone, interrupt the lessons, or call students over during
37
This document is a research report submitted to the U.S. Department of Justice. This report has not been published by the Department. Opinions or points of view expressed are those of the author(s)
and do not necessarily reflect the official position or policies of the U.S. Department of Justice.
a lesson to discuss non-G.R.E.A.T. related topics. In these instances when teachers were
disengaged from the program, student misbehavior increased, enhancing problems with officers’
time management and lesson adherence.
Overall Program Implementation Quality - Our analysis of overall quality of program delivery
concludes that the G.R.E.A.T. program was implemented with fidelity in each of the seven
evaluation sites. Officers were considered to have implemented the program with fidelity if the
following conditions were met: 1) at least 70 percent of the lesson content was covered during
the lesson; 2) the lesson was delivered in a time frame (longer than 20 minutes) that would allow
the materials to be presented in the intended manner; 3) the officer taught the lesson content in
the recommended sequence; 4) students participated in the group activities; and 5) the trained
observer rated the implementation quality as good or better at the conclusion of the lesson (a
score of 3 or higher on a five point scale with 1 being low implementation quality and 5 high
quality). Our classroom observations indicate that most officers implemented the program with
ratings by observers of “average” or “above average” fidelity. Therefore, if a treatment effect is
detected in the outcome evaluation, it would be feasible to attribute this effect to the G.R.E.A.T.
program.
Classroom observations of G.R.E.A.T. delivery showed that a majority of lessons were
taught in a manner consistent with the G.R.E.A.T. Officer Training provided. Most officers had
sufficient time management capabilities, adhered to the lessons as they were designed, and
implemented the program with fidelity.11 Officers were classified in one of five categories based
11 We did not observe systematic differences in the program delivery between classes taught by the same officer, and
therefore, findings are presented at the officer level and not the classroom. There is one exception: One officer
taught the program in a particularly disruptive classroom. Observers concluded that the program was not delivered
38
This document is a research report submitted to the U.S. Department of Justice. This report has not been published by the Department. Opinions or points of view expressed are those of the author(s)
and do not necessarily reflect the official position or policies of the U.S. Department of Justice.
on observations of their abilities in the following areas: discussions, activities, time adherence,
coverage of topical areas, and overall quality of lesson. In total, 27 of 33 officers were classified
as having implemented the program with average or above average fidelity. Specifically, nine
officers were classified as having “excellent implementation,” eight were “above average,” 10
were “average,” three were “below average,” and three were classified as providing “poor
implementation” (i.e., any possible program effect could not be attributed to program exposure).
Students in the classrooms taught by the three officers who delivered the program with below
average fidelity (based on poor delivery quality) still received a sufficient amount of the program
(dosage) with enough fidelity (program adherence) to link outcome effects to the program. These
officers tended to have time management problems and were thereby forced to omit parts of
lessons, discussion, or activities (and did not return to re-address missing components).
Summary and Recommendations
The G.R.E.A.T. program has been in existence for nearly 20 years. It is a program that
has been designed, implemented, evaluated, re-designed, re-implemented, and is currently
undergoing re-evaluation (see Esbensen et al. 2011 for a review). It is a program that enjoys
extensive federal resources and requires heavy investment by police departments and schools
across the country, and as such, it deserves much scrutiny. This is particularly important in the
“what works” era of evidence-based practices (Elliott and Mihalic 2004; Fagan and Mihalic
2003; McHugo et al. 2007; Mihalic and Irwin 2003).
We add to the growing body of literature examining program fidelity as a key aspect of
program evaluation (Dane and Schneider 1998; Moncher and Prinz 1991). Using a multi-
in this classroom, though they did conclude that the program was delivered with “average” implementation fidelity
in the four other classrooms taught by the same officer.
39
This document is a research report submitted to the U.S. Department of Justice. This report has not been published by the Department. Opinions or points of view expressed are those of the author(s)
and do not necessarily reflect the official position or policies of the U.S. Department of Justice.
methodological approach—specifically, 1) observations of G.R.E.A.T. Officer Trainings, 2)
surveys and interviews of G.R.E.A.T.-trained officers and supervisors, 3) surveys of school
personnel, and 4) “on-site,” direct observations of officers delivering the G.R.E.A.T. program—
we examined 1) officer preparedness and commitment to the program, 2) support and
involvement of educators, and 3) G.R.E.A.T. program delivery. These areas are consistent with
key areas of assessment outlined by Dusenbury and colleagues (2003), and add to the growing
body of not only program fidelity research but of multi-methodological works in this area
(Lillehoj et al. 2004; Melde et al. 2006).
Our process evaluation concludes that the G.R.E.A.T. program was implemented with
fidelity in most of the classrooms in the seven sites under current investigation. We find that
officers, even those with minimal experience in the classroom, are sufficiently trained and
prepared to administer program content. This finding was supported across multiple methods of
assessment: our observations of G.R.E.A.T. Officer Training, G.R.E.A.T. officers’ self-reports,
school personnel verification, and our own objective assessment of program delivery in the
classroom. A majority of officers had a firm grasp on classroom and time management. Only
three of the 33 officers included in this program evaluation were found to have implemented the
program with insufficient fidelity to expect program effects in our associated outcome
evaluation. These officers did not have sufficient coverage of topical areas and/or they failed to
adhere to lessons due largely to a lack of organization on their part. The outcome evaluation data
will therefore be analyzed accordingly, such as through the use of fidelity scores (Emshoff et al.
1987; McHugo et al. 2007; Teague et al. 1999).
While this process evaluation concludes that the G.R.E.A.T. program was implemented
with sufficient fidelity to reasonably attribute outcome effects to the program, the
40
This document is a research report submitted to the U.S. Department of Justice. This report has not been published by the Department. Opinions or points of view expressed are those of the author(s)
and do not necessarily reflect the official position or policies of the U.S. Department of Justice.
implementation of the program was not without some pitfalls. Departures from ideal lesson
delivery were most often due to time constraints (as opposed to other possible reasons such as
officer incompetence); available class time, for example, was often substantially shorter in the
field than was modeled in training. Officers were forced to improvise, combine lessons, reduce
coverage, or eliminate activities when the time allotted for the lessons was cut short for some
reason. Thus, one recommendation emerging from our process evaluation is for trainers to
consider whether the time-frame allocated to lesson modeling in training should be modified to
be more in line with what officers will experience during actual program delivery in schools. An
alternative would be to highlight specific sections of each lesson which may be uniformly
shortened if absolutely necessary. On a positive note, many of the other identified issues could
be remedied by greater communication between officers and teachers and greater involvement of
teachers in the actual G.R.E.A.T. program. Other reasons associated with officers’ lesson
modification were classroom misbehavior and atypical situations. We found that classrooms in
which teachers took in active role in discipline received the best version of the program. While
officers should be capable to control classroom misbehavior during each lesson (and greater
attention to this in G.O.T. would improve their skills in this area), teachers could be of invaluable
help. They are familiar with students and effective techniques for dealing with the students in
their classes. In addition, teachers can also be of assistance in the face of atypical situations,
which most often were planned, school-sanctioned events. Teachers knew of these events, but
officers were not aware of changes to scheduling. Greater communication between teachers and
G.R.E.A.T. officers could limit the problems these situations pose to effective program delivery.
Greater teacher involvement could also help reinforce G.R.E.A.T. lessons and,
presumably, increase positive programmatic effects. If teachers participate in G.R.E.A.T.
41
This document is a research report submitted to the U.S. Department of Justice. This report has not been published by the Department. Opinions or points of view expressed are those of the author(s)
and do not necessarily reflect the official position or policies of the U.S. Department of Justice.
lessons, for example, they will be knowledgeable about lesson content and be able to draw on
and reinforce this content in their own curricula, enhancing students’ learning of the material and
skills. In addition, survey responses of teachers with previous experience of G.R.E.A.T. in their
classrooms revealed that teachers usually did not use the extended-teacher activities because they
were unaware of them. Better communication between officer and teachers could increase
teacher awareness and use of the activities, potentially improving program outcomes.
The cooperation of the host organization—in this case, school personnel—is central to
the implementation of any school-based prevention program (Dusenbury et al. 2003; Peterson
and Esbensen 2004). These recommendations clearly have the potential to impact schools’
“willingness” to take on programs that require extensive commitment. Our survey of school
personnel showed while nearly 90 percent favored having the G.R.E.A.T. program in their
schools, only 56 percent believed that teachers should incorporate related prevention lessons into
their own teaching curricula. This suggests that teachers may not be receptive to adding
responsibilities related to outside programming (i.e., not mandated by district standards). Schools
obviously need to weigh the costs and benefits associated with participation in school-based
prevention programs; our program evaluation suggests, however, that many problems with
program implementation could probably be relieved with minimal inconvenience to teachers. For
example, teacher presence in the classroom during program delivery to assist in discipline and
enhanced communication with G.R.E.A.T. officers could make a significant difference in the
quality of program delivery.
Conclusions
In short, our results suggest that the G.R.E.A.T. program was implemented with fidelity
in the vast majority of classrooms included in the Process and Outcome Evaluation of
42
This document is a research report submitted to the U.S. Department of Justice. This report has not been published by the Department. Opinions or points of view expressed are those of the author(s)
and do not necessarily reflect the official position or policies of the U.S. Department of Justice.
G.R.E.A.T., thereby providing confidence in outcome results. Observations of G.R.E.A.T.
Officer Training indicated that the course provided officers with the knowledge and skills to
effectively deliver the G.R.E.A.T. program, and observations of program delivery illustrated that
officers generally implemented the program as intended. Findings from surveys and interviews
with G.R.E.A.T.-trained officers in the seven study sites were also generally consistent with the
findings of the on-site observations, while also demonstrating that most of the G.R.E.A.T.
officers were committed to the program itself. Observations of program delivery and survey
responses from school personnel indicated that, although their involvement in the program was
largely limited to a “supporting role” led by the officers, greater involvement of teachers could
enhance program delivery. School personnel survey responses, however, suggest that this may
be a difficult task, as most indicated a lack of time to devote to the program. Despite the
existence of areas for improvement in future implementation, our process evaluation shows,
across multiple methods, that the G.R.E.A.T. program is implemented as intended across
multiple settings, providing a sound base for outcome analyses and, potentially, adding to the
evidence of “what works” in school-based gang and delinquency prevention.
43
This document is a research report submitted to the U.S. Department of Justice. This report has not been published by the Department. Opinions or points of view expressed are those of the author(s)
and do not necessarily reflect the official position or policies of the U.S. Department of Justice.
REFERENCES
Basch, Charles E., Elena M. Sliepcevich, Robert S. Gold, David F. Duncan, and Lloyd J. Kolbe. 1985. Avoiding type III errors in health education program evaluations: A case study. Health Education and Behavior 12: 315-31.
Dane, Andrew V. and Bill H. Schneider. 1998. Program integrity in primary and early secondary prevention: Are implementation effects out of control? Clinical Psychology Review 18: 23–4.
Dobson, Douglas and Thomas J. Cook. 1980. Avoiding Type III error in program evaluation: results from a field experiment. Evaluation and Program Planning 3: 269–76.
Dumas, Jean E., Anne M. Lynch, James E. Laughlin, Emilie Phillips Smith, and Ronald J. Prinz. 2001. Promoting intervention fidelity: Conceptual issues, methods, and preliminary results from the EARLY ALLIANCE prevention program. American Journal of Preventive Medicine 20 (1S): 38-47.
Durlak, Joseph A. and Emily P. DuPre. 2008. Implementation matters: A review of research on the influence of implementation on program outcomes and the factors affecting implementation. American Journal of Community Psychology 41: 327-50.
Dusenbury, Linda, Rosalind Brannigan, Mathea Falco, and William B. Hansen. 2003. A review of research on fidelity of implementation: Implications for drug abuse prevention in school settings. Health Education Research 18: 237-56.
Elliott, Delbert S. and Sharon Mihalic. 2004. Issues in disseminating and replicating effective prevention programs. Prevention Science 5: 47-53.
Emshoff, James G., Craig Blakely, Rand Gottschalk, Jeffrey Mayer, William S. Davidson, and Stephen Erickson. 1987. Innovation in education and criminal justice: Measuring fidelity of implementation and program effectiveness. Educational Evaluation and Policy Analysis 9: 300-11.
Esbensen, Finn-Aage, Adrienne Freng, Terrance J. Taylor, Dana Peterson, and D. Wayne Osgood. 2002. Putting research into practice: The national evaluation of the Gang Resistance Education and Training (G.R.E.A.T.) program. In Winifred L. Reed and Scott H. Decker (Eds.), Responding to gangs: Evaluation and research (pp. 139-67). Washington, DC: U.S. Department of Justice, National Institute of Justice.
Esbensen, Finn-Aage and D. Wayne Osgood. 1999. Gang Resistance Education and Training (G.R.E.A.T.): Results from the national evaluation. Journal of Research in Crime and Delinquency 36: 194-225.
Esbensen, Finn-Aage, D. Wayne Osgood, Terrance J. Taylor, Dana Peterson, and Adrienne Freng. 2001. How great is G.R.E.A.T.?: Results from a quasi-experimental design. Criminology and Public Policy 1: 87-118.
Esbensen, Finn-Aage, Dana Peterson, Terrance J. Taylor, Adrienne Freng, D. Wayne Osgood, Dena C. Carson, and Kristy N. Matsuda. 2011. Evaluation and evolution of the Gang Resistance Education and Training Program. Journal of School Violence. 10:53-70
Fagan, Abigail A. and Sharon Mihalic. 2003. Strategies for enhancing the adoption of school-based prevention programs: Lessons learned from the Blueprints for
44
This document is a research report submitted to the U.S. Department of Justice. This report has not been published by the Department. Opinions or points of view expressed are those of the author(s)
and do not necessarily reflect the official position or policies of the U.S. Department of Justice.
Violence Prevention replications of the Life Skills Training Program. Journal of Community Psychology 31: 235–54.
Fagan, Abigail A., Koren Hanson, J. David Hawkins, and Michael W. Arthur. 2008. Bridging science to practice: Achieving prevention program fidelity in the Community Youth Development Study. American Journal of Community Psychology 41: 235-49.
Gottfredson, Denise. 2001. Schools and delinquency. New York: Cambridge University Press.
Heller, K. 1996. Coming of age in prevention science: comments on the 1994 National Institute of Mental Health–Institute of Medicine prevention reports. American Psychologist 51: 1123–7.
Kovaleski, Joseph H., Edward E. Gickling, Henry Morrow, and Paul R. Swank. 1999. High versus low implementation of Instructional Support Teams: A case for maintaining program fidelity. Remedial and Special Education 20: 170-83.
Lillehoj, Catherine J. (Goldberg), Kenneth W. Griffin, and Richard Spoth. 2004. Program provider and observer ratings of school-based preventive intervention implementation: Agreement and relation to youth outcomes. Health Education and Behavior 31: 242-57.
Lipsey, Mark. 2009. “The primary factors that characterize effective interventions with Juvenile offenders: a meta-analytic overview.” Victims and Offenders 4: 124-147.
McHugo, Gregory J., Robert E. Drake, Rob Whitley, Gary R. Bond, Kikuko Campbell, Charles A. Rapp, Howard H. Goldman, Wilma J. Lutz, and Molly T. Finnerty. 2007. Fidelity outcomes in the National Implementing Evidence-Based Practices Project. Psychiatric Services 58: 1279-84.
Melde, Chris, Finn-Aage Esbensen, and Karin Tusinski. 2006. “Addressing Program Fidelity Using Onsite Observations and Program Provider Descriptions of Program Delivery.” Evaluation Review 30: 714-730.
Mihalic, Sharon F., and Katherine Irwin. 2003. Blueprints for Violence Prevention: From research to real-world settings—Factors influencing the successful replication of model programs. Youth Violence and Juvenile Justice 1: 307-29.
Moncher, Frank J., and Ronald J. Prinz. 1991. Treatment fidelity in outcome studies. Clinical Psychology Review 11: 247-66.
Peterson, Dana and Finn-Aage Esbensen. 2004. “The Outlook is G.R.E.A.T.: What Educators Say about School-based Prevention and the Gang Resistance Education and Training (G.R.E.A.T.) Program.” Evaluation Review 28: 218-245.
Rossi, Peter H., Howard E. Freeman, and Mark W. Lipsey. 1999. Evaluation: A systematic approach. 6th ed. Thousand Oaks, CA: Sage.
Taylor, Terrance J., Finn-Aage Esbensen, and Dana Peterson. 2009. National Evaluation of the Gang Resistance Education and Training (G.R.E.A.T.) Program: G.R.E.A.T. Officer Training (G.O.T.) Report. St. Louis, MO: University of Missouri – St. Louis.
Teague, Gregory B., Gary R. Bond, and Robert E. Drake. 1998. Program fidelity in assertive community treatment: Development and use of a measure. American Journal of Orthopsychiatry 68: 216-32.
45
This document is a research report submitted to the U.S. Department of Justice. This report has not been published by the Department. Opinions or points of view expressed are those of the author(s)
and do not necessarily reflect the official position or policies of the U.S. Department of Justice.
Winfree, L. Thomas, Jr., Dana Peterson Lynskey, and James R. Maupin. 1999. Developing local police and federal law enforcement partnerships: G.R.E.A.T. as a case study of policy implementation. Criminal Justice Review 24: 145-68.
46
This document is a research report submitted to the U.S. Department of Justice. This report has not been published by the Department. Opinions or points of view expressed are those of the author(s)
and do not necessarily reflect the official position or policies of the U.S. Department of Justice.
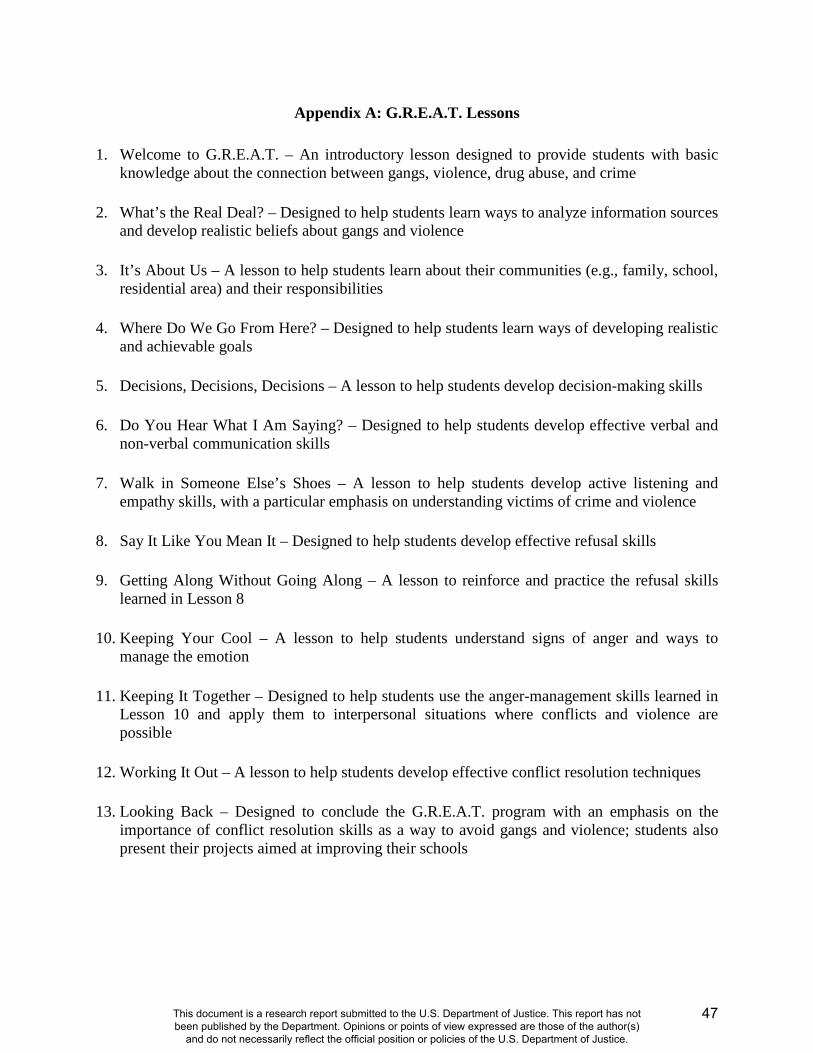
Appendix A: G.R.E.A.T. Lessons
1. Welcome to G.R.E.A.T. – An introductory lesson designed to provide students with basic knowledge about the connection between gangs, violence, drug abuse, and crime
2. What’s the Real Deal? – Designed to help students learn ways to analyze information sources
and develop realistic beliefs about gangs and violence 3. It’s About Us – A lesson to help students learn about their communities (e.g., family, school,
residential area) and their responsibilities 4. Where Do We Go From Here? – Designed to help students learn ways of developing realistic
and achievable goals 5. Decisions, Decisions, Decisions – A lesson to help students develop decision-making skills 6. Do You Hear What I Am Saying? – Designed to help students develop effective verbal and
non-verbal communication skills 7. Walk in Someone Else’s Shoes – A lesson to help students develop active listening and
empathy skills, with a particular emphasis on understanding victims of crime and violence 8. Say It Like You Mean It – Designed to help students develop effective refusal skills 9. Getting Along Without Going Along – A lesson to reinforce and practice the refusal skills
learned in Lesson 8 10. Keeping Your Cool – A lesson to help students understand signs of anger and ways to
manage the emotion
11. Keeping It Together – Designed to help students use the anger-management skills learned in Lesson 10 and apply them to interpersonal situations where conflicts and violence are possible
12. Working It Out – A lesson to help students develop effective conflict resolution techniques
13. Looking Back – Designed to conclude the G.R.E.A.T. program with an emphasis on the
importance of conflict resolution skills as a way to avoid gangs and violence; students also present their projects aimed at improving their schools
47
This document is a research report submitted to the U.S. Department of Justice. This report has not been published by the Department. Opinions or points of view expressed are those of the author(s)
and do not necessarily reflect the official position or policies of the U.S. Department of Justice.
OUTCOME EVALUATION
Results from a multi-site evaluation of the G.R.E.A.T. program: One-Year Post Treatment1
Finn-Aage Esbensen University of Missouri - St. Louis
Dana Peterson
University at Albany
Terrance J. Taylor University of Missouri - St. Louis
D. Wayne Osgood
Pennsylvania State University
*This research was made possible, in part, by the support and participation of seven school
districts, including the School District of Philadelphia. This project was supported by Award No.
2006-JV-FX-0011 awarded by the National Institute of Justice, Office of Justice Programs, U.S.
Department of Justice. The opinions, findings, and conclusions or recommendations expressed
in this manuscript are those of the authors and do not necessarily reflect the views of the
Department of Justice or of the seven participating school districts. We would like to express our
appreciation to the students who made this project possible by completing the student
questionnaires. And, this project would have been impossible without our team of colleagues
and research assistants; special thanks to Adrienne Freng, Brad Brick, and Dena Carson.
1 This report was previously published in Justice Quarterly (2012) 29:125-151.
48
This document is a research report submitted to the U.S. Department of Justice. This report has not been published by the Department. Opinions or points of view expressed are those of the author(s)
and do not necessarily reflect the official position or policies of the U.S. Department of Justice.
ABSTRACT: Results from a multi-site evaluation of the G.R.E.A.T. program
Despite a long history of youth gang problems in the United States, there remains a paucity of
evaluations identifying promising or effective gang prevention and intervention programs. One
primary prevention program that has received limited support is Gang Resistance Education and
Training (G.R.E.A.T.). An earlier national evaluation of the G.R.E.A.T. core middle school
curriculum reported modest program effects but, importantly, found no programmatic effect on
gang membership or delinquency. This manuscript presents results from a second national
evaluation of the revised G.R.E.A.T. core curriculum that utilizes a randomized field trial in
which classrooms were randomly assigned to treatment and control conditions. Approximately
4,000 students attending 31 schools in seven cities comprise the initial sample. Analyses of one-
year post-treatment data indicate that students receiving the program had lower odds of gang
membership compared to the control group. Additionally, the treatment group also reported
more pro-social attitudes on a number of program-specific outcomes.
49
This document is a research report submitted to the U.S. Department of Justice. This report has not been published by the Department. Opinions or points of view expressed are those of the author(s)
and do not necessarily reflect the official position or policies of the U.S. Department of Justice.
Youth delinquent gangs received considerable academic and media attention during the
1990s. Much of this attention focused on the violence and drug dealing in which gang members
are involved. To help combat this problem, a number of prevention, intervention, and
suppression programs were developed (e.g., Decker, 2002; Klein and Maxson, 2006; Reed and
Decker, 2002). Schools, one of the common grounds for American youth, have become a focal
point for both general and specific prevention programming. In fact, Gottfredson and colleagues
(2000) reported the average middle school offers 14 different and unique prevention programs
that address violence, bullying, victimization, drug abuse, and other social problems, including
gangs. Given the plethora of school-based prevention programs that have been designed to
reduce an array of adolescent behaviors, school administrators face challenges in selecting a
program that is optimal in light of the time and resource constraints of their facilities. Thus, it is
imperative this choice be guided by a well-informed sense of program effectiveness. Several
attempts in the past decade have sought to provide administrators with such knowledge. For
example, the Blueprints Series (Mihalic, Fagan, Irwin, Ballard, & Elliott, 2002; Mihalic and
Irwin, 2003) identified model violence prevention programs that have withstood rigorous
scientific evaluations, and the Maryland Report (Sherman, Gottfredson, MacKenzie, Eck, Reuter,
& Bushway, 1997) assessed the effectiveness of a broad range of projects. In 2005, the Helping
America’s Youth (HAY) Community Guide (Howell, 2009) rated programs identified by non-
federal agencies on three levels: Level 1 (exemplary or model programs based on evaluation
designs of the “highest quality”); Level 2 (effective programs based on quasi-experimental
research); and Level 3 (promising programs). Similarly, the Office of Juvenile Justice and
Delinquency Prevention provides a listing of effective or promising programs (OJJDP, 2010).
One notable aspect of these reviews is the paucity of “model” or “effective” programs. This is
50
This document is a research report submitted to the U.S. Department of Justice. This report has not been published by the Department. Opinions or points of view expressed are those of the author(s)
and do not necessarily reflect the official position or policies of the U.S. Department of Justice.
not to say that most of the extant programs are ineffective; rather, the majority has not been
evaluated in a manner that allows for assessment of their effectiveness (see, for instance,
Dusenbury, Brannigan, Falco, and Hansen, 2003; Lillehoj, Griffin, and Spoth, 2004). In
addition, some programs have experienced implementation failure that is then interpreted as
program failure.
A second notable aspect of these reviews is that, in spite of the widespread concern with
gangs and associated program development; there has been a paucity of research and evaluation
of gang-specific prevention programs. One notable exception is the National Institute of Justice
(NIJ)-funded evaluation of the Gang Resistance Education and Training (G.R.E.A.T.) program
(Esbensen and Osgood, 1997, 1999; Esbensen, Osgood, Taylor, Peterson, and Freng, 2001). The
G.R.E.A.T. program was developed in 1991 by law enforcement agencies in the greater Phoenix
area (for a detailed accounting of the program history, consult Winfree, Peterson Lynskey, and
Maupin,1999) and experienced exponential growth calling for a national evaluation in 1994.
That evaluation consisted of two separate studies: a cross-sectional design in which students
receiving the G.R.E.A.T. program’s core middle school curriculum were surveyed one year after
program delivery and that relied upon student self-report of program participation; and a five-
year longitudinal study with matched control classrooms. The cross-sectional study identified
favorable outcome results, including lower rates of gang membership among the treatment group
(Esbensen and Osgood, 1997, 1999) and held considerable promise for the program model. The
findings from the more rigorous longitudinal design with matched classrooms and four-year
follow-up were more ambiguous. No behavioral effects were found, but a lagged or sleeper
effect was found for five mediating/proximal factors. That is, there were no differences between
G.R.E.A.T. and comparison students in rates of gang membership or delinquency, but at three
51
This document is a research report submitted to the U.S. Department of Justice. This report has not been published by the Department. Opinions or points of view expressed are those of the author(s)
and do not necessarily reflect the official position or policies of the U.S. Department of Justice.
and four years post-program, G.R.E.A.T. students had lower risk-seeking tendencies, lower rates
of victimization, more pro-social peers, more positive attitudes about police officers, and less
positive attitudes about gangs (Esbensen et al., 2001).
Based in part on these modest findings, the G.R.E.A.T. program underwent a rigorous
program review (see Esbensen, Freng, Taylor, Peterson, and Osgood, 2002; Esbensen, Peterson,
Taylor, Freng, Osgood, Carson, and Matsuda, 2011, for a detailed account of the program
review) that culminated in a redesign of the curriculum, expanding the core middle school
component from nine to 13 lessons, focusing more attention on skills building through
interactive and cooperative learning strategies, and encouraging greater involvement of
classroom teachers in program delivery. In addition, the revised curriculum took into account
the extant research on risk factors for youth gang involvement, with lesson components targeting
known risk factors or proximal influences for gang joining.
In this manuscript we report on the evaluation of the revised G.R.E.A.T. program,
assessing the extent to which middle school students participating in this school-based gang
prevention program express attitudes and engage in behaviors that are measurably different from
those of a control group of students at one year post-program. Our findings contribute to the
sparse body of knowledge about effective prevention strategies; the revised G.R.E.A.T. program
is currently rated as "effective" by OJJDP and designated as "Level 2" in the Helping America’s
Youth rating scale.2
REVIEW OF RELEVANT LITERATURE
2 In another article, we have reported on the high level of program fidelity associated with delivery of the G.R.E.A.T. program in classrooms participating in the current evaluation, allowing outcome evaluation results to be attributed with confidence to the program (Esbensen, Matsuda, Taylor, and Peterson, 2011).
52
This document is a research report submitted to the U.S. Department of Justice. This report has not been published by the Department. Opinions or points of view expressed are those of the author(s)
and do not necessarily reflect the official position or policies of the U.S. Department of Justice.

Youth gangs and gang violence are community problems - that is, gangs and gang
violence do not occur in a vacuum and must be considered within the larger contextual setting.
When the G.R.E.A.T. program was initially developed in 1991, youth and gang violence were at
“epidemic” proportions (Snyder and Sickmund, 2006). Since then rates of youth and gang
violence have decreased substantially, although the past few years have witnessed a new increase
in gangs and gang membership (Egley, Howell, and Moore, 2010). A number of macro-level
explanations have been offered for the decrease in violence and gang problems between 1995
and 2001, including a change in handgun availability, the crack market decline, an improved
economy, and increased incarceration rates (Blumstein and Wallman, 2000). The increase in
prevention and intervention programming during the 1990s may also have played a contributing
role in this youth crime drop, addressing more proximal influences for gang involvement at the
school, peer, family and/or individual level. Because virtually all American youths attend
school, this setting has considerable potential for programs to prevent or intervene with gang
joining and gang violence by attempting to ameliorate these negative proximal influences.
Risk Factors and Prevention Strategies
Research has identified a number of risk factors associated with gang affiliation and
violent offending, and these risk factors can inform prevention programs. This growing body of
research has categorized these influences within multiple domains, including community, school,
peer, family, and individual. Representative of these risk factors are the following: community
poverty and social disorganization, low commitment to school, poor school performance,
association with few conventional or many delinquent peers, low parental monitoring, low
attachment to parents, low involvement in conventional family activities, lack of empathy,
53
This document is a research report submitted to the U.S. Department of Justice. This report has not been published by the Department. Opinions or points of view expressed are those of the author(s)
and do not necessarily reflect the official position or policies of the U.S. Department of Justice.
impulsiveness, and moral disengagement (e.g., Battin, Hill, Abbott, Catalano, and Hawkins,
1998; Esbensen and Deschenes, 1998; Esbensen, Huizinga, and Weiher, 1993; Esbensen,
Peterson, Taylor, and Freng, 2010; Hill, Howell, Hawkins, Battin-Pearson,1999; Klein and
Maxson, 2006; Maxson and Whitlock, 2002; Maxson, Whitlock, and Klein, 1998; Pyrooz, Fox,
and Decker, 2010; Thornberry, 1998; Thornberry, Krohn, Lizotte, Smith, and Tobin, 2003).
Research has also demonstrated the deleterious cumulative effects of risk exposure: the greater
the number of risk factors and/or the greater the number of risk domains experienced, the greater
the odds of youth gang and violence involvement, with these increases in risk associated with
exponential increases in odds (Esbensen et al., 2010; Thornberry et al., 2003). This collective
body of risk factor research suggests that prevention programs should attempt to address risk
factors in multiple domains and to do so earlier, rather than later, in adolescence, both before the
factors accumulate and before the typical age of onset—i.e., age 14 for gang joining (Esbensen
and Huizinga, 1993; Hill et al., 1999; Thornberry et al., 2003).
The developmental progression of behavior may also be important in planning prevention
strategies. While many studies treat gangs as a phenomenon distinct from the general study of
delinquency, there is considerable overlap between delinquency and gang involvement, as well
as between risk factors associated with delinquency, particularly violence, and gang membership
(see, e.g., Esbensen et al., 2010). The works of Battin et al. (1998), Esbensen and Huizinga
(1993), Gatti et al. (2005), and Thornberry et al. (1993, 2003), for example, suggest that while
the gang environment facilitates delinquency, many gang members are already delinquent prior
to joining the gang (see also Melde and Esbensen, 2011). The rates of delinquent activity,
however, increase dramatically during gang membership. This finding that delinquency
generally precedes gang membership highlights the importance of universal gang prevention
54
This document is a research report submitted to the U.S. Department of Justice. This report has not been published by the Department. Opinions or points of view expressed are those of the author(s)
and do not necessarily reflect the official position or policies of the U.S. Department of Justice.
efforts during the early years of adolescence (i.e., programs that target all 11 to 12 year olds, that
is, students in the 6th or 7th grade). Additionally, the link between risk factors associated with
gang membership and delinquent behavior reinforces the relevance of two of the goals of the
G.R.E.A.T. program: to reduce both delinquent (violent) activity and gang involvement. How
does the G.R.E.A.T. program attempt to accomplish these goals?
THE G.R.E.A.T. PROGRAM
The Gang Resistance Education and Training (G.R.E.A.T.) program is a school-based
gang and violence prevention program with three primary goals: 1) teach youths to avoid gang
membership; 2) prevent violence and criminal activity; and 3) assist youths to develop positive
relationships with law enforcement. The original G.R.E.A.T. program3 consisted of nine lessons
and was modeled after the Drug Abuse Resistance Education (DARE) program. Developed by
the Phoenix Police Department in 1991, G.R.E.A.T. was a cognitive-based program that taught
students about crime and its effect on victims, cultural diversity, conflict resolution skills,
meeting basic needs (without a gang), responsibility, and goal setting. Uniformed law
enforcement officers taught the curriculum in schools, and teachers were requested to
complement the program content during regular classes. The revised G.R.E.A.T. program
contains much of the substance of the original program but, importantly, was also informed by
the work of educators and prevention specialists and the growing body of risk factor research.
As a result, the new G.R.E.A.T. program was expanded to 13 lessons; is still primarily taught by
uniformed law enforcement officers (Federal agents from the U.S. Marshalls and the Bureau of
Alcohol, Tobacco, and Firearms as well as District Attorneys have also been trained and certified
3 The core program component of G.R.E.A.T. is its middle school curriculum, and this is often what is referred to with the term “G.R.E.A.T. program.” Other optional components of G.R.E.A.T. are an elementary school curriculum, a summer program, and G.R.E.A.T. Families.
55
This document is a research report submitted to the U.S. Department of Justice. This report has not been published by the Department. Opinions or points of view expressed are those of the author(s)
and do not necessarily reflect the official position or policies of the U.S. Department of Justice.
to teach G.R.E.A.T.); and incorporates classroom management training of officers and a focus on
students’ skill development through cooperative learning strategies: important pedagogical tools
for educational settings (Gottfredson, 2001).4
Two school-based programs guiding the revision of the G.R.E.A.T. program were the
Seattle Social Development Model (SSDM) and Life Skills Training (LST). The SSDM is a
comprehensive model that seeks to reduce delinquency and violence by building a positive
learning environment incorporating several different classroom management components,
including cooperative learning, proactive classroom management, and interactive teaching
(Catalano, Arthur, Hawkins, Berglund, & Olson, 1998). The LST program is a three-year
intervention in which two annual booster sessions supplement the initial program (Dusenbury &
Botvin, 1992). LST consists of three components: 1) self-management skills; 2) social skills;
and 3) information and skills that are directly related to the problem of drug abuse. The revised
G.R.E.A.T. program has adopted some of the strategies from LST (in fact, some of the LST
curriculum writers participated in the rewriting of the G.R.E.A.T. program), including an
emphasis on the development of skills, rather than on the assimilation of knowledge, and has
also incorporated problem-solving exercises and cooperative learning strategies. With this
revised program fully implemented by 2003, there was renewed interest in the question of
program effectiveness. In July 2006, the National Institute of Justice selected the University of
Missouri-St. Louis to conduct a process and outcome evaluation of the revised G.R.E.A.T.
program. This manuscript focuses upon sustained program effects one-year post treatment
(consistent with the Blueprints standard), while results from the process evaluation, which
4 Information about the G.R.E.A.T. program and an overview of the G.R.E.A.T. lessons included in the middle school curriculum can be found at (http://www.great-online.org/).
56
This document is a research report submitted to the U.S. Department of Justice. This report has not been published by the Department. Opinions or points of view expressed are those of the author(s)
and do not necessarily reflect the official position or policies of the U.S. Department of Justice.
indicated a strong degree of implementation fidelity, are reported in Esbensen, Matsuda, et al.
(2011).
METHODS
Site and School Selection
Site selection was driven by the presence of the G.R.E.A.T. program and willingness of
the police departments and school districts to agree to the evaluation design. In addition, three
main criteria guided site selection: 1) existence of an established G.R.E.A.T. program5, 2)
geographic and demographic diversity, and 3) evidence of gang activity. The first step in the
process was to secure a listing of potential program sites based upon the existence of the
G.R.E.A.T. program. The research staff contacted the G.R.E.A.T. Regional Administrators6 and
Bureau of Justice Assistance7 personnel to identify locales with institutionalized programs.
Consideration was given to factors such as the length of time the program had been in operation,
number of G.R.E.A.T.-trained officers, number of schools in which the program was offered, and
the components of the G.R.E.A.T. program implemented. Also of interest were police
5 Length of time the locale had operated the program and the extent to which schools had been exposed to the program were assessed prior to site selection for the national evaluation. Sites where the program was just beginning were excluded because they were deemed likely to have had less time to “work out the kinks” associated with delivering the program with fidelity. Conversely, some sites with a long history of delivering the program were excluded from consideration because it was deemed likely that the program had saturated the entire school and/or community context. In the selected cities, G.R.E.A.T. had not been taught in all district schools which allowed us in some instances to include schools with little or no prior exposure to G.R.E.A.T. while at the same time having experienced officers teaching the program. The possibility for a contamination effect, however, is possible in some schools in which G.R.E.A.T. had been offered for several years. 6 G.R.E.A.T. is a national program overseen by the G.R.E.A.T. National Policy Board (NPB). For administrative purposes, responsibilities for program oversight are held by (or “given to”) agencies operating in different geographic regions: Midwest Atlantic, Southeast, Southwest, and West. Additionally, two federal partners—the Bureau of Alcohol, Tobacco, Firearms, and Explosives (BATF) and the Federal Law Enforcement Training Center (FLETC)—are involved in program training and oversight. 7 The Bureau of Justice Assistance (BJA) oversees the allocation of federal funds and grant compliance associated with the G.R.E.A.T. program.
57
This document is a research report submitted to the U.S. Department of Justice. This report has not been published by the Department. Opinions or points of view expressed are those of the author(s)
and do not necessarily reflect the official position or policies of the U.S. Department of Justice.
department characteristics that could affect program delivery, including department size and
organizational structure. Some G.R.E.A.T. programs, for instance, utilize School Resource
Officers (SRO) to teach the program while others use the “Portland” model in which “street
cops” teach the program on an overtime basis in schools on their beat. Once this list of potential
agencies was constructed, the research staff contacted representatives in these cities to obtain
more information about the delivery of the G.R.E.A.T. program (e.g., school district size, length
of program history at a site, and degree of program implementation). Additional site
characteristics (i.e., race and ethnic composition, and population size) were also taken into
account at this time. A last criterion considered was the volume of youth crime (based on police
reports) and gang activity (information was obtained from the National Gang Center) in each
site. Ultimately, a list of seven cities varying in size, region, and level of gang activity were
identified (Albuquerque, NM; Chicago, IL; a Dallas-Fort Worth area district; Greeley, CO;
Nashville, TN; Philadelphia, PA; and Portland, OR).
Upon selection of the cities, the research staff worked with the primary local law
enforcement agency and the school district in each city to secure their cooperation. Upon
district approval, between four and six schools in each site were identified for study
participation; the goal of the school selection was to identify schools that, taken as a whole,
would be representative of the districts. Principals in these targeted schools were contacted to
elicit their support and cooperation with the evaluation design. In two instances, the principals
declined to participate8. These schools were then replaced with a comparable school in the
8 Principals declined their schools’ participation for different reasons. One principal indicated that he had previously been a police gang investigator, and, therefore, knew the program worked; the second principal would not agree to random assignment and withholding some students from the program.
58
This document is a research report submitted to the U.S. Department of Justice. This report has not been published by the Department. Opinions or points of view expressed are those of the author(s)
and do not necessarily reflect the official position or policies of the U.S. Department of Justice.

district9. This process produced a final sample of 31 schools and 195 classrooms (102 received
G.R.E.A.T. and 93 did not receive the program), and 4,905 students listed on the classroom
rosters.
Following the principal’s agreement to participate in the evaluation, more detailed
discussions/meetings were scheduled with school administrators and grade-level teachers,
G.R.E.A.T. officers, and the research team. Whenever possible, face-to-face meetings were
held, but in some instances final arrangements were made via telephone. School and police
personnel were informed of the purpose of the evaluation, issues related to the random
assignment of classrooms to the treatment condition (i.e., receive G.R.E.A.T./not receive
G.R.E.A.T.), procedures for obtaining active parental consent for students in these classrooms to
participate in the evaluation, scheduling the G.R.E.A.T. program delivery, and other logistical
issues associated with the study design.
School configuration varied somewhat, with twenty schools having the traditional middle
school organization of grades six through eight, five schools having grades five through eight,
and six schools organized as kindergarten through eighth grade. For the evaluation, classes in
the G.R.E.A.T. grade level were selected, and this varied slightly; while most officers taught the
program to sixth-graders, some taught at the seventh-grade level. Thus, sixth grade students
were included from twenty-six schools, and seventh grade students comprised the sample in the
remaining five schools.
9 One of the five originally-selected schools in Chicago (comprised of nearly 100 percent African American students) agreed to participate in the evaluation but was unable to meet the requirements of the study and was dropped from the sample. Given time constraints (i.e., too late in the school year to select a comparable school and implement the program with fidelity), we were unable to replace the excluded school during 2006-2007. Thus, the resulting sample was disproportionately Hispanic and not representative of the district. To increase sample representativeness, we added two primarily African American schools to the evaluation in the 2007-2008 school year, even though this meant that these schools would be one year behind other schools in the evaluation.
59
This document is a research report submitted to the U.S. Department of Justice. This report has not been published by the Department. Opinions or points of view expressed are those of the author(s)
and do not necessarily reflect the official position or policies of the U.S. Department of Justice.
Active Parental Consent
Due to the nature of the evaluation, active parental consent was required for student
participation. We utilized a strategy that had proven successful in prior studies (Ellickson &
Hawes, 1989; Esbensen et al., 1996; McMorris et al., 2004; Unger et al., 2004). Specifically,
teachers were recruited and compensated for their assistance collecting the consent forms from
their students. Regardless of whether permission was granted or denied by the parent, teachers
received $2.00 for each returned form. Additionally, for each classroom, there was an incentive
for teachers based upon classroom-level return rates: The teachers would receive a $10 bonus if
70 percent or more of their students returned consent forms, $20 if the class reached 80 percent
or more, and $30 if 90 percent or more of the students in the classroom returned a form. In three
cities, the school districts would not allow direct compensation to teachers, but we were allowed
to provide compensation to the school or district in the teachers’ honor. In addition to
compensating teachers, students were also provided with an incentive for returning the form – a
small portable FM radio with headphones (cost of approximately $3.00 wholesale).
Letters to parents and active consent forms were distributed to students and their return
recorded on class rosters. This documentation allowed for follow-up forms to be sent home with
students who failed to return the initial form. In addition to these incentives, teachers were
contacted on a regular basis, in most instances daily, to monitor return rates. In most schools,
this consent process was completed in less than two weeks, and in several instances, in just three
days. (For more detailed description of the active consent process, consult Esbensen et al.,
2008.)
This strategy of compensating teachers and students, while costly, is to be recommended
because it rewards teachers and students for their assistance and allows the active consent
60
This document is a research report submitted to the U.S. Department of Justice. This report has not been published by the Department. Opinions or points of view expressed are those of the author(s)
and do not necessarily reflect the official position or policies of the U.S. Department of Justice.

process to be completed in a relatively short timeframe. Overall, 89.1% of youths (N=4,372)
returned a completed consent form, with 77.9% of parents/guardians (N=3,820) allowing their
child’s participation. It should be noted that while Esbensen et al., 2008, reported a 79% consent
rate, the addition of two schools to the evaluation after the publication of that article resulted in
the 78% overall consent rate reported here. The direct cost of the teacher incentives was $12,894
and the cost of the 4,750 radios was $14,250 for a total of $27,144. This translates into a cost of
approximately $3,878 per city, $936 per school, $146 per classroom, and $7.39 per active
consent participant. To summarize the results of the site selection and active parental consent
process, this study includes an active consent sample of 3,820 students (77.9% of the 4,905
students listed on classroom rosters at the beginning of the study period) representing 195
classrooms in 31 schools in seven cities across the continental United States.
Research Design and Random Assignment of Classrooms
The outcome evaluation employs an experimental longitudinal panel design (a
randomized control trial with long-term follow-up) in which classrooms in each of the
participating schools were randomly assigned to the treatment (i.e., G.R.E.A.T.) or control
condition. The G.R.E.A.T. program was taught in sixth grade in 26 of the 31 schools and in
seventh grade in the remaining five schools. Once it was determined in which core subject area
(commonly Social Studies but also in English and Science classes) the program was to be taught,
we enumerated all of the grade-level classes (ranging from 3 to 12). In situations with an odd
number of classes, we made the a priori decision to oversample treatment classes (in partial
recognition of the fact that many of the principals were reluctant to “deprive” any of their
students of the program). The list of classes was then numbered from one through highest and a
61
This document is a research report submitted to the U.S. Department of Justice. This report has not been published by the Department. Opinions or points of view expressed are those of the author(s)
and do not necessarily reflect the official position or policies of the U.S. Department of Justice.
table of random numbers was consulted to select the classrooms in which G.R.E.A.T. would be
taught. Unselected classrooms comprised the control group.
All students in the treatment and control classrooms were eligible to participate in the
evaluation. All students for whom active parental consent was obtained (3,820) were then asked
to participate in the evaluation by completing a confidential group-administered pre-test
questionnaire. Upon completion of the G.R.E.A.T. program in each school, students were then
requested to complete post-tests and four annual follow-up surveys. Retention rates across the
three waves of data included in these outcome analyses were excellent: 98.3 percent completed
the pre-test, 94.6 percent completed the post-test, and 87.3 percent completed the one-year post
program survey. These response rates reflect the diligent efforts of the research assistants
working on this project. It is particularly challenging to track students through multiple schools
and school districts, especially in a highly mobile sample: while initially enrolled in 31 middle
schools at pretest, students were surveyed in 121 different schools in Wave 3 (although we
identified students enrolled in a total of 180 different schools, most of the schools in which
students were not surveyed were outside the original seven districts). We obtained permission
from principals at the new schools to survey the transfer students – clearly, a time and labor-
intensive effort, but one well worth achieving these high response rates.
Student sample characteristics
The sample is evenly split between males and females; most (55%) youths reside with
both biological parents; and the majority (88%) was born in the United States (see Table 1). The
sample is racially/ethnically diverse, with Hispanic youths (37%), White youths (27%), and
African American (17%) youths accounting for 81% of the sample. Approximately two-thirds of
62
This document is a research report submitted to the U.S. Department of Justice. This report has not been published by the Department. Opinions or points of view expressed are those of the author(s)
and do not necessarily reflect the official position or policies of the U.S. Department of Justice.

the youths (61%) were aged 11 or younger at the pre-test, representing the fact that 26 of the 31
schools delivered the G.R.E.A.T. program in 6th grade. Three of the six Chicago schools and
two of four schools in Albuquerque taught G.R.E.A.T. in 7th grade; thus, students in these sites
were somewhat older than students in the other sites.
INSERT TABLE 1 ABOUT HERE
MEASUREMENT
Outcome Measures
To assess program effectiveness, it was essential that measures of the three program goals
be included in the student surveys. Additionally, the G.R.E.A.T. lessons introduced a number of
secondary (proximal) outcomes that sought to reduce known risk factors for delinquency and
gang joining. We developed a student questionnaire that captured the essence of this skills
building program; that is, identifying the mediating variables that could explain the mechanisms
through which behavioral outcomes could be achieved. If the program is determined to reduce
rates of gang membership and youth violence, it is important to understand how these goals are
achieved. To reiterate, the G.R.E.A.T. program has three primary goals: (a) to help youths avoid
gang membership, (b) to reduce violence and criminal activity, and (c) to help youths develop a
positive relationship with law enforcement. In the current analyses, gang membership is
measured by a single-item question that is part of a larger set of questions about youth gangs.
Specifically, students were asked to answer the following question; “Are you now in a gang?”
This self-nomination approach has been found to be a valid and robust measure of gang
affiliation (e.g., Esbensen, Winfree, He, & Taylor, 2001; Thornberry et al., 2003). To measure
delinquency and violent offending, students completed a 15-item self-reported delinquency
inventory, including response categories that allowed for assessment of both ever and annual
63
This document is a research report submitted to the U.S. Department of Justice. This report has not been published by the Department. Opinions or points of view expressed are those of the author(s)
and do not necessarily reflect the official position or policies of the U.S. Department of Justice.
prevalence as well as frequency of offending during the past six months. We treated this self-
report inventory as a composite measure of general delinquency (examined both a variety and
frequency score) but also created a separate measure of violent offending consisting of three
items (attacked someone with a weapon, used a weapon or force to get money or things from
people, been involved in gang fights). To measure the third specific program goal (improving
relations with law enforcement), students were asked to respond to six questions tapping global
attitudes to the police as well as two additional questions measuring students’ attitudes about
police officers as teachers.
In addition to these preceding three program goals, the 13 G.R.E.A.T. lessons are
intended to teach youths the life-skills thought necessary to prevent involvement in gangs and
delinquency (see, e.g., Hill et al., 1999; Klein and Maxson, 2006; Maxson & Whitlock, 2002;
Maxson et al., 1998; Thornberry et al., 2003) by reducing the effect of a range of risk factors.
These mediating or proximal variables are treated as implied program objectives and are
included in our outcome analyses. We therefore examined the extent to which students exposed
to G.R.E.A.T. had improved or enhanced skills that would enable them to better resist the lures
of gang membership and resist peer pressure to engage in illegal activities. The G.R.E.A.T.
lessons encourage students to make healthy choices such as being involved in more pro-social
activities and associating more with pro-social peers and less with delinquent peers. The lessons
also teach students to improve their communication skills by being active listeners and being
better able to interpret verbal and non-verbal communication. The program targets these skills in
order to improve students’ empathy for others. Risk factors associated with youth violence and
joining gangs are also addressed in the curriculum. The program, for example, seeks to increase
the levels of guilt associated with norm violation and to reduce the neutralization of illegal acts
64
This document is a research report submitted to the U.S. Department of Justice. This report has not been published by the Department. Opinions or points of view expressed are those of the author(s)
and do not necessarily reflect the official position or policies of the U.S. Department of Justice.
(i.e., moral disengagement). For a full listing of scales and scale characteristics, see the
Appendix.
ANALYSIS STRATEGY
Our highly nested research design requires a multilevel analysis, which we implemented
with the MLwiN software (Rasbash, Steele, Brown, and Goldstein, 2009). The design includes
two waves (Waves 2 and 3) of outcome observations (level 1) for 3,702 individual students10
(level 2), who are nested within 195 classrooms in which the program was or was not delivered
(level 3), which are, in turn, nested within 31 schools (level 4) located in 7 cities (level 5). Given
the small number of cities, we treated this level as a fixed effect through a set of dummy
variables. The model included random effects for the remaining four levels. To insure that
school differences were not confounded with the program effect, the treatment versus control
contrast was centered within schools. The analysis controlled for the pretest measure of the
outcome and for the difference between Waves two and three (coded -.5 for Wave 2 and +.5 for
Wave 3). The treatment effect was allowed to vary randomly across schools in order to insure a
conservative test. A logistic model was applied to the dichotomous measure of gang
membership and a negative binomial model was used for the highly skewed measures of self-
reported general delinquency and violent offending. All other models were linear. For the linear
models we express the magnitude of the program effect in terms of standard deviation units of
10 The analysis file includes data for 3,246 students with data for both Waves 2 and 3, another 368 for Wave 2 but not Wave 3, and 88 for Wave 3 but not Wave 2, for a total of 3,702 students with either or both. The 3,702 students represent an upper bound for the analyses because it counts youth with any data and does not take into account variable-specific missing data on any given outcome or cases lost when we control for Wave 1 (from being missing on the same variable). The analysis-specific counts of cases are for person/waves rather than people (as specified in MLwiN). In the basic model (without Wave 1 control) we lose cases only due to being missing on the outcome because the only other variables involved we have for everybody (wave, site, and treatment/control). With respect to missing data, the total dataset has 6,948 person/wave cases; the number included in the analyses with & without Wave 1 control varies from 6,611 and 6,180 (attitudes toward gangs) to 6,905 and 6,751 (school disorganization).
65
This document is a research report submitted to the U.S. Department of Justice. This report has not been published by the Department. Opinions or points of view expressed are those of the author(s)
and do not necessarily reflect the official position or policies of the U.S. Department of Justice.
difference between treatment and control (i.e., Cohen’s d), with positive values reflecting
beneficial impacts. For the logistic and negative binomial models, the value is the percentage
difference between treatment and control.
RESULTS
To assess program effectiveness, we compare responses from students in G.R.E.A.T.
classes to students in control classrooms using the post-test and one-year follow-up
questionnaires. Results presented here represent the average treatment effects over Waves 2 and
3.11 However, prior to examination of outcomes, we examined the success of the random
assignment of classrooms to produce comparable groups of treatment and control. We conclude
that the random assignment process was moderately successful; there were three significant
differences (p<.05) between the two groups (awareness of services, attitudes about gangs, and
frequency of delinquency), with the treatment group being more pro-social at the pre-test. Five
additional differences were noted at p<.1 (violent offending frequency, gang membership, pro-
social peers, negative peer commitment, and delinquent peers). These pre-existing differences
between the groups do not permit us to make strong claims of comparability because there may
be a little more difference than one would expect by chance alone, and the differences that do
arise tend to favor the treatment group. But overall the differences are quite small, and the
biggest difference is well within the bounds of chance. Furthermore, controlling for pretest
measures, as we do in all of the analyses, has negligible impact on the size or significance of the
group differences on outcomes.
11 Analyses were also conducted separately by wave, to assess treatment effects at post-test and treatment effects at the one-year follow-up. For all but 5 measures, there was a significant treatment effect at both time points. For the five that differed, the difference in effect between Wave 2 and Wave 3 was not statistically significant, and there was a statistically-significant average treatment effect across the time periods.
66
This document is a research report submitted to the U.S. Department of Justice. This report has not been published by the Department. Opinions or points of view expressed are those of the author(s)
and do not necessarily reflect the official position or policies of the U.S. Department of Justice.
With respect to the primary goal of reducing gang membership, it will be helpful to
identify the number of gang-involved youth at Wave 2 and Wave 3 by treatment condition. At
Wave 2, 177 youth answered yes to the question: “are you now in a gang?” Of these gang-
involved youth, 105 were in the control group and 72 were G.R.E.A.T. students. At Wave 3,
there were 172 gang members, 101 in the control group and 71 in the treatment group. This
pattern of more gang members in the control group was found in all seven cities.
Program Goals
Our first concern is to determine if the three stated program goals (i.e., reduction in gang
membership, reduction in violent offending, and improved attitudes towards the police) were
achieved. The analyses reveal that there were statistically significant differences between the
treatment and control groups on two of the three outcomes. First, with regard to gang
membership, we note in Table 2 that the odds of gang membership were 39 percent lower12 for
students completing the G.R.E.A.T. program relative to the control sample.13 Second,
G.R.E.A.T. students reported more positive opinions of police officers than did the study
participants in the control group (effect size (ES) of .076). This positive assessment of law
enforcement was even more pronounced for the two-item scale measuring attitudes more specific
to the G.R.E.A.T. program (G.R.E.A.T. ATP, ES = .204). While results were in the expected
direction of a positive program effect (10% reduction in the frequency of offending, although 1%
increase in the variety of offending), the third program goal of reducing violent offending, was
12 In an unpublished report submitted to NIJ and in Esbensen et al. (2011), we reported a 54% reduction in the odds of gang joining. The difference reported here is due to a change in the MLwiN program that now allowed the model to run with all variance terms included in the analysis. 13 In response to one reviewer’s concerns, the Wave 2 specific program effect was a 38.7% reduction in the odds of gang membership and 40.6% for Wave 3.
67
This document is a research report submitted to the U.S. Department of Justice. This report has not been published by the Department. Opinions or points of view expressed are those of the author(s)
and do not necessarily reflect the official position or policies of the U.S. Department of Justice.
not met. There were no differences between the two groups with respect to violent offending, or
general delinquency for that matter.
INSERT TABLE 2 ABOUT HERE
Proximal Outcomes
With regard to more proximal outcome measures, a number of statistically significant
differences were observed. These differences were all in the direction of a positive program
effect. As discussed above, the G.R.E.A.T. program is intended to be a skills building
curriculum that provides students with, for example, the ability to better resist peer pressure, to
control their anger, and to view joining gangs as an unattractive choice. Our outcome analyses
included 26 proximal outcome measures (in addition to the five program outcomes discussed
above) that tapped the extent to which the students enrolled in the G.R.E.A.T. program
developed skills and attitudes that were promoted throughout the G.R.E.A.T. curriculum. Of
these 26 measures, G.R.E.A.T. students had significantly (p<.05) more positive responses to
eight of these outcomes than did control students and marginal significance on another three (lie
neutralization, pro-social activities, and pro-social peers). For instance, the G.R.E.A.T. students
made better use of refusal skills (ES = .090), were better able to resist peer pressure (ES = .079),
reported being less self-centered (ES = .054) and expressed less positive attitudes towards gangs
(ES = .114). There were no statistically significant differences between the groups on 15 of the
attitudinal measures: empathy, impulsivity, risk-seeking, negative peer commitment, positive
peer commitment, neutralization for theft, school commitment, guilt, conflict resolution, calming
others, active listening, problem solving, self-efficacy, awareness of services, and altruism.
68
This document is a research report submitted to the U.S. Department of Justice. This report has not been published by the Department. Opinions or points of view expressed are those of the author(s)
and do not necessarily reflect the official position or policies of the U.S. Department of Justice.
Though program effects were somewhat larger at Wave 2 than at Wave 3, the difference
was not substantial. For the 13 measures with program effects significant at p < .10 in Table 2,
the mean effect size was .11 at Wave 2 and .07 at Wave 3. The program impact estimates
reached significance with p < .05 for nine variables at Wave 2 versus six variables at Wave 3,
and significance with p < .10 for 10 and nine variables at the two waves. Though the program
impact significantly declined over time for two of the measures (with p < .05, GREAT ATP and
collective efficacy), the program impact remained significant at p < .05 for both waves in each
case.
Summary of Program Outcomes
In sum, we examined a total of 33 outcome measures: five behavioral outcomes (variety
and frequency of violent offending, variety and frequency of delinquency, and gang
membership) and 28 attitudinal or perceptual outcomes. Of the 33 outcome measures included
in the analyses, one behavioral (gang membership) and 10 attitudinal/perceptual differences were
found at the .05 significance level between the G.R.E.A.T. and non- G.R.E.A.T. students; an
additional three attitudinal differences were marginally significant (p < .10). Specifically, the
G.R.E.A.T. students compared to non-G.R.E.A.T. students reported (see Table 2):
- More positive attitudes to police (ES = .076)
- More positive attitudes about police in classrooms (ES = .204)
- Less positive attitudes about gangs (ES = .114)
- More use of refusal skills (ES = .090)
- More resistance to peer pressure (ES = .079)
- Higher collective efficacy (ES = .125)
69
This document is a research report submitted to the U.S. Department of Justice. This report has not been published by the Department. Opinions or points of view expressed are those of the author(s)
and do not necessarily reflect the official position or policies of the U.S. Department of Justice.
- Less use of hitting neutralizations (ES = .105)
- Fewer associations with delinquent peers (ES = .083)
- Less self-centeredness (ES = .054)
- Less anger (ES = . 057)
- Lower rates of gang membership (39% reduction in odds)
- Less use of lie neutralization (ES = .066; p < .10)
- More pro-social peers (ES = .051; p < .10)
- More pro-social involvement (ES = .047; p < .10)
In addition to knowing the overall magnitude of the program effects, it would also be
useful to have information about how much that effect varies across schools and cities. In our
multilevel analysis, the variance component for the treatment effect estimates this variation. For
none of the significant program outcomes was this variation in program effect statistically
significant, and for six of the fourteen the maximum likelihood estimate of the variance was
zero. This should not be taken as strong evidence of consistency, however, because this is not a
very powerful test. Indeed, when the variance estimates were not zero, they typically
corresponded to standard deviations about the size of the significant program effects. In that
scenario, program impact would be negligible to slightly harmful in about 20% of schools.
DISCUSSION
Schools have become a common setting in which delinquency prevention programs are
delivered (Gottfredson, 2001). There is no shortage of available programs from which to choose,
and schools—especially middle schools—often have multiple programs operating during the
school year (Gottfredson, 2001). Given resource limitations, however, school administrators
70
This document is a research report submitted to the U.S. Department of Justice. This report has not been published by the Department. Opinions or points of view expressed are those of the author(s)
and do not necessarily reflect the official position or policies of the U.S. Department of Justice.

need to weigh the “costs and benefits” of each program when making their decisions. Research
evolving from the movement toward “evidence-based practices” (e.g., Sherman et al., 1997) has
provided a wealth of information regarding the implementation and effectiveness of specific
prevention programs, although the evidence base on gang prevention programs is still
insufficient.
During the past twenty years, there has been a commensurate increase in the inclusion of
police officers on school campuses, as both School Resource Officers (e.g., Finn and McDevitt,
2005; Gottfredson and Na, 2010) and prevention program providers (e.g., DARE and
G.R.E.A.T.). In this manuscript we have addressed the efficacy of one such program that utilizes
law enforcement officers to deliver a gang prevention and violence reduction program. A third
objective of this program is related to the program provider: that is, improving police – youth
relationships.
The current manuscript highlights the key sustained outcome findings (average program
effects for post-test and one-year follow-up) from the Process & Outcome Evaluation of
G.R.E.A.T. Results from analyses of three waves of survey data collected from students in seven
U.S. public school districts indicate that the program is meeting its primary objective of
preventing gang membership; the analyses indicate a 39 percent reduction in the odds of gang
joining one year post-program. In spite of the research showing a number of shared risk factors
between delinquency and gang membership (and few or no factors unique to gang membership),
we did not find a significant program effect on rates of violent offending.14 The third goal of the
G.R.E.A.T. program, to improve youths’ attitudes towards the police (ATP), was met, with an
14 We acknowledge that given the findings reported for the other two program goals and proximate program goals, it is surprising that there was no reduction in offending associated with the program. This is especially so, given the overlap in risk factors associated with gang membership and offending.
71
This document is a research report submitted to the U.S. Department of Justice. This report has not been published by the Department. Opinions or points of view expressed are those of the author(s)
and do not necessarily reflect the official position or policies of the U.S. Department of Justice.
effect size of .11 for the global measure of ATP and an effect size of .20 for the more specific
measure of ATP related to G.R.E.A.T.
These findings suggest that a relatively short-term (13 lessons) primary prevention
program can have measurable effects on a diverse sample of students. The evaluation was
conducted in seven cities representing a cross-section of the United States. The process
evaluation indicated that the program was implemented with fidelity (Esbensen, Matsuda, et al.,
2011), providing confidence that the outcomes can be attributed to the G.R.E.A.T. program.
Active parental consent rates for the students’ participation in the outcome evaluation were quite
high, thereby reducing the potential bias of selective loss. The high retention rates from the
Wave 1 to Wave 3 surveys also add confidence to the robustness of the outcome results.
In addition to examining direct effects of G.R.E.A.T. on the three main program goals,
we explored a range of mediating or proximal factors. Our results identify positive program
effects on many of these program objectives. Compared with students in the control classrooms,
students in G.R.E.A.T. classrooms illustrated less susceptibility to peer pressure, better refusal
skills, and less involvement with delinquent peers; lower support for neutralizations regarding
violence; less favorable attitudes about gangs; lower levels of self-centeredness and anger; and a
higher degree of collective efficacy. Thinking about these findings from a logical perspective,
the results are quite promising: G.R.E.A.T. appears to reduce key underlying risk factors for
gang membership and violent offending (e.g.., self-centeredness, anger); reduce the situational
contexts where delinquency and gang membership is most likely to flourish (i.e., associations
with delinquent peers); and provide youth with the skills necessary to recognize and resist
temptations of peer pressure (e.g., peer pressure susceptibility and use of refusal skills),
including a greater belief that offending is universally “wrong” (i.e., fewer neutralizations).
72
This document is a research report submitted to the U.S. Department of Justice. This report has not been published by the Department. Opinions or points of view expressed are those of the author(s)
and do not necessarily reflect the official position or policies of the U.S. Department of Justice.
It is important to place these findings in context. The one-year post program results from
the longitudinal component of the national evaluation of the original G.R.E.A.T. program
(Esbensen et al. 2001) indicated no program effect. And, it was only three and four years post-
treatment that a sleeper or lagged effect was found for five outcomes: more favorable attitudes to
police, lower victimization, more negative attitudes about gangs, more pro-social peers, and less
risk-seeking behavior. We can speculate that the revised curriculum with its emphasis on skills
building and use of cooperative learning strategies (and other pedagogically sound practices) was
more successful in achieving favorable outcomes than was the earlier program with its emphasis
on cognitive elements that were delivered in a more “canned” and didactic delivery mode. Three
of the five significant outcomes noted in G.R.E.A.T. 1, were replicated in the current evaluation
(attitudes to police, negative attitudes to gangs, and pro-social peers). The fact that both
evaluations produced more favorable attitudes toward the police among the G.R.E.A.T. students
suggests that this kind of law enforcement-based prevention program can have a positive impact
on youth-police relations. It is also interesting to note that both studies produced evidence that
the G.R.E.A.T. program is associated with more negative views of gangs and greater association
with pro-social peers. While there were no differences between the treatment and control
students with regard to risk-seeking in the current study, two other elements of self-control
theory (anger and self-centeredness) were significant. In the current evaluation we did not
examine victimization as a potential outcome since it was not a stated program goal nor was it
addressed in the lessons. We view these similarities in findings as suggestive of an overall
consistency in the program but further speculate that the additional program effects of the revised
G.R.E.A.T. program are likely an artifact of the revised and enhanced curriculum. Only time
73
This document is a research report submitted to the U.S. Department of Justice. This report has not been published by the Department. Opinions or points of view expressed are those of the author(s)
and do not necessarily reflect the official position or policies of the U.S. Department of Justice.
will tell if the delayed or sleeper effects reported in the earlier evaluation of G.R.E.A.T. will be
replicated in the current evaluation.
Clearly, this program is no “silver bullet” but these findings suggest that G.R.E.A.T. can
be effectively included as a primary prevention component of a larger community-wide effort to
reduce gang membership and youth violence. It is important to note that the effect sizes were
modest (ranging from .05 to .20) and that no differences were found between students in
G.R.E.A.T. and non-G.R.E.A.T. classrooms for a number of important mediating factors.
However, the fact that statistically significant differences were found for 11 outcome measures
(and another three with marginal significance) should be considered very promising, especially
in light of the fact that these effects were produced after just 13 class periods (approximately 40
minutes in length). We would also like to point out that in some of the study schools, there
exists a small possibility of a contamination effect suggesting that the results presented here
should be considered conservative estimates. The G.R.E.A.T. program, as discussed in the site
selection section, had operated for multiple years in each of the participating school districts and
in many of the selected schools. While we excluded from consideration sites in which there was
a strong likelihood of contamination, it is still possible that in some schools, the presence of
G.R.E.A.T. for several years may well under-estimate program effectiveness.
74
This document is a research report submitted to the U.S. Department of Justice. This report has not been published by the Department. Opinions or points of view expressed are those of the author(s)
and do not necessarily reflect the official position or policies of the U.S. Department of Justice.

References
Battin, S. R., Hill, K. J., Abbott, R. D., Catalano, R. F., & Hawkins, J.D. (1998). The contribution of gang membership to delinquency beyond delinquent friends. Criminology, 36 (1), 93-115.
Blumstein, A. & Wallman, J. (2000). The crime drop in America. New York, NY: Cambridge University Press.
Catalano, R. F., Arthur, M. W., Hawkins, J. D., Berglund, L. & Olson, J. J. (1998). Comprehensive community and school based interventions to prevent antisocial behavior. In R. Loeber & D. P. Farrington’s (Eds.), Serious and violent juvenile offenders: Risk factors and successful inventions (pp. 248-283). Thousand Oaks, CA: Sage Publications.
Decker, S. H. (2002). Policing gangs and youth violence. Belmont, CA: Wadsworth/ Thomson Learning.
Dusenbury, L., & Botvin, G. J. (1992). Competence enhancement and the development of positive life options. Journal of Addictive Diseases, 11 (3), 29-45.
Dusenbury, L., Brannigan, R., Falco, M., & Hansen, W. B. (2003). A review of research on fidelity of implementation: Implications for drug abuse prevention in school settings. Health Education Research, 18 (2), 237-256.
Egley, A., Jr., Howell, J. C., &Moore, J. P. (2010). Highlights of the 2008 National Youth Gang Survey. Washington, DC: U.S. Department of Justice, Office of Justice Programs, Office of Juvenile Justice and Delinquency Prevention.
Ellickson, P. L., & Hawes, J. (1989). An assessment of active versus passive methods of obtaining parental consent. Evaluation Review, 13, 45-55.
Esbensen, F.-A., & Deschenes, E.P. (1998). A multisite examination of youth gang membership: Does gender matter? Criminology, 36, 799-828.
Esbensen, F.-A., Deschenes, E. P., Vogel, R. E., West, J., Arboit, K., & Harris, L. (1996). Active parental consent in school-based research: An examination of ethical and methodological issues. Evaluation Review, 20, 737-753.
Esbensen, F.-A., Freng, A., Taylor, T. J., Peterson, D., & Osgood, D. W. (2002). Putting research into practice: The national evaluation of the Gang Resistance Education and Training (G.R.E.A.T.) program. In W. L. Reed & S. H. Decker (Eds.), Responding to gangs: Evaluation and research (pp. 139-167). Washington, DC: U.S. Department of Justice, National Institute of Justice.
Esbensen, F.-A., Huizinga, D., &Weiher, A. W. (1993). Gang and non-gang youth: Differences in explanatory factors. Journal of Contemporary Criminal Justice, 9, 94-116.
Esbensen, F.-A., Matsuda, K., Taylor, T.J., & Peterson, D. (2011). Multi-method strategy for assessing program fidelity: The national evaluation of the revised G.R.E.A.T. program. Evaluation Review, 35, 14-39.
Esbensen, F.-A., Melde, C., Taylor, T. J., & Peterson, D. (2008). Active parental consent in school-based research: How much is enough and how do we get it? Evaluation Review, 32, 335-362.
Esbensen, F.-A., & Osgood, D. W. (1997). Research in Brief “G.R.E.A.T. Program Effectiveness.” Washington, D.C.: U.S. Department of Justice, National Institute of Justice.
75
This document is a research report submitted to the U.S. Department of Justice. This report has not been published by the Department. Opinions or points of view expressed are those of the author(s)
and do not necessarily reflect the official position or policies of the U.S. Department of Justice.
Esbensen, F.-A., & Osgood, D. W. (1999). Gang Resistance Education and Training (G.R.E.A.T.): Results from the national evaluation. Journal of Research in Crime and Delinquency, 36, 194-225.
Esbensen, F.-A., Osgood, D. W., Taylor, T. J., Peterson, D., & Freng, A. (2001). How G.R.E.A.T. is G.R.E.A.T.?: Results from a quasi-experimental design. Criminology & Public Policy, 1, 87-118.
Esbensen, F.-A., Peterson, D., Taylor, T.J., & Freng, A. (2010). Youth Violence: Sex and race differences in offending, victimization, and gang membership. Philadelphia, PA: Temple University Press.
Esbensen, F.-A., Peterson, D., Taylor, T.J., Freng, A., Osgood, D.W., Carson, D., & Matsuda, K. (2011). Evaluation and evolution of the Gang Resistance Education and Training (G.R.E.A.T.) program. Journal of School Violence 10, 53-70.
Esbensen, F.-A., Winfree, L. T., Jr., He, N., & Taylor, T. J. (2001). Youth gangs and definitional issues: When is a gang a gang and why does it matter? Crime & Delinquency, 47, 105-130.
Finn, P., & McDevitt, J. (2005). National assessment of school resource officer programs: Final project report. Abt Associates, Inc. Available online at: http://www.ncjrs.gov/pdffiles1/nij/grants/209273.pdf.
Gatti, U., Tremblay, R.E., Vitaro, F., & McDuff, P. (2005). Youth gangs, delinquency, and drug use: A test of the selection, facilitation, and enhancement hypotheses. Journal of Child Psychology and Psychiatry, 46(11), 1178-1190.
Gottfredson, D.C. (2001). Schools and delinquency. New York, NY: Cambridge University Press.
Gottfredson, D.C., & Na, C. (2010) Police officers in schools: Do they prevent crime?” Paper presented at the Annual Meeting of the American Society of Criminology, San Francisco, CA.
Gottfredson, G.D., Gottfredson, D.C., & Czeh, E. R. (2000). National study of delinquency prevention in schools, Final report. Ellicott City, Maryland: Gottfredson Associates, Inc.
Hill, K. G., Howell, J. C., Hawkins, J. D., & Battin-Pearson, S. (1999). Childhood risk factors for adolescent gang membership: Results from the Seattle Social Development Project. Journal of Research in Crime and Delinquency, 36, 300-322.
Howell, J.C. (2009). Preventing and Reducing Juvenile Delinquency: A Comprehensive Framework. Thousand Oaks, CA: Sage Publications, Inc.
Klein, M., & Maxson, C. L. (2006). Street gang patterns and policies. New York: Oxford University Press.
Lillehoj, C. J., Griffin, K. W., & Spoth, R. (2004). Program provider and observer ratings of school-based preventive intervention implementation: Agreement and relation to youth outcomes. Health Education and Behavior, 31 (2), 242-257.
Maxson, C. L., & Whitlock, M. L. (2002). Joining the gang: Gender differences in risk factors for gang membership. In C. R. Huff (Ed.), Gangs in America (3rd ed., pp. 19-36). Thousand Oaks, CA: Sage Publications.
Maxson, C. L., Whitlock, M. L., & Klein, M. W. (1998). Vulnerability to street gang membership: Implications for practice. Social Service Review, March, 70-91.
McMorris, B. J., Clements, J., Evans-Whipp, T., Gangnes, D., Bond, L., Toumbourou, J. W., & Catalano, R. F. (2004). A comparison of methods to obtain active parental consent for an international student survey. Evaluation Review, 28, 64-83.
76
This document is a research report submitted to the U.S. Department of Justice. This report has not been published by the Department. Opinions or points of view expressed are those of the author(s)
and do not necessarily reflect the official position or policies of the U.S. Department of Justice.
Melde, C. & Esbensen, F.-A. (2011). Gang membership as a turning point in the life course. Criminology 49:513-552.
Mihalic, S. F., Fagan, A., Irwin, K., Ballard, D., & Elliott, D. S. (2002). Blueprints for Violence Prevention replications: Factors for implementation success. Colorado: University of Colorado, Center for the Study and Prevention of Violence.
Mihalic, S. F., & Irwin, K. (2003). Blueprints for Violence Prevention: From research to real-world settings - Factors influencing the successful replication of model programs. Youth Violence and Juvenile Justice, 1, 307-329.
Office of Juvenile Justice and Delinquency Prevention. (2010). Model Programs Guide. http://www.ojjdp.gov/mpg/
Pyrooz, D. C., Fox, A. M., & Decker, S. H. (2010). Racial and ethnic heterogeneity, economic disadvantage, and gangs: A macro-level study of gang membership in urban America. Justice Quarterly, 27, 867-892.
Rasbash, J., Steele, F., Browne, W. J., & Goldstein, H. (2009). A user’s guide to MLwiN, version 2.10. Bristol, UK: Bristol University.
Reed, W. L. & Decker S. H. (2002). Responding to gangs: Evaluation and research. Washington, DC: U.S. Department of Justice, National Institute of Justice.
Sherman, L. W., Gottfredson, D., MacKenzie, D., Eck, J., Reuter, P., & Bushway, S. (1997)
Preventing crime: What works, what doesn’t, what’s promising. Washington, DC: U.S. Department of Justice, Office of Justice Programs.
Snyder, H. N., & Sickmund, M. (2006). Juvenile offenders and victims: 2006 National Report. Washington, DC: Office of Justice Programs, Office of Juvenile Justice and Delinquency Prevention (March).
Thornberry, T. P. (1998). Membership in youth gangs and involvement in serious and violent offending. In R. Loeber and D. P. Farrington (Eds.), Serious and violent juvenile offenders: Risk factors and successful interventions (pp. 147-166). Thousand Oaks, CA: Sage Publications.
Thornberry, T. P., Krohn, M. D., Lizotte, A. J., & Chard-Wierschem, D. (1993). The role of juvenile gangs in facilitating delinquent behavior. Journal of Research in Crime and Delinquency, 30, 55-87.
Thornberry, T. P., Krohn, M. D., Lizotte, A. J., Smith, C. A., & Tobin, K. (2003). Gangs and delinquency in developmental perspective. New York: Cambridge University Press.
Unger, J. B., Gallaher, P., Palmer, P. H., Baezconde-Garbanati, L., Trinidad, D. R., Cen, S., & Johnson, C. A. (2004). No news is bad news: Characteristics of adolescents who provide neither parental consent nor refusal for participation in school-based survey research. Evaluation Review, 28, 52-63.
Winfree, L. T., Jr., Peterson Lynskey, D., & Maupin, J. R. (1999). Developing local police and federal law enforcement partnerships: G.R.E.A.T. as a case study of policy implementation. Criminal Justice Review, 24, 145-168.
77
This document is a research report submitted to the U.S. Department of Justice. This report has not been published by the Department. Opinions or points of view expressed are those of the author(s)
and do not necessarily reflect the official position or policies of the U.S. Department of Justice.
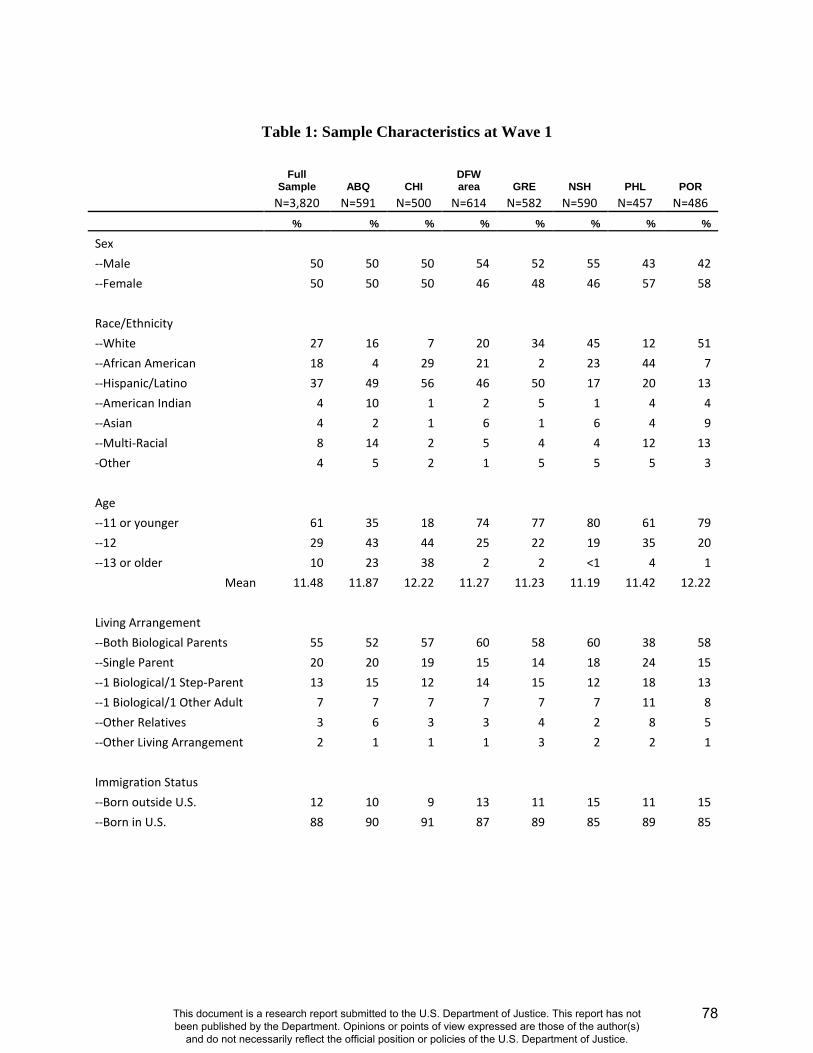
Table 1: Sample Characteristics at Wave 1
Full Sample ABQ CHI
DFW area GRE NSH PHL POR
N=3,820 N=591 N=500 N=614 N=582 N=590 N=457 N=486 % % % % % % % %
Sex --Male 50 50 50 54 52 55 43 42 --Female 50 50 50 46 48 46 57 58 Race/Ethnicity --White 27 16 7 20 34 45 12 51 --African American 18 4 29 21 2 23 44 7 --Hispanic/Latino 37 49 56 46 50 17 20 13 --American Indian 4 10 1 2 5 1 4 4 --Asian 4 2 1 6 1 6 4 9 --Multi-Racial 8 14 2 5 4 4 12 13 -Other 4 5 2 1 5 5 5 3 Age --11 or younger 61 35 18 74 77 80 61 79 --12 29 43 44 25 22 19 35 20 --13 or older 10 23 38 2 2 <1 4 1
Mean 11.48 11.87 12.22 11.27 11.23 11.19 11.42 12.22 Living Arrangement --Both Biological Parents 55 52 57 60 58 60 38 58 --Single Parent 20 20 19 15 14 18 24 15 --1 Biological/1 Step-Parent 13 15 12 14 15 12 18 13 --1 Biological/1 Other Adult 7 7 7 7 7 7 11 8 --Other Relatives 3 6 3 3 4 2 8 5 --Other Living Arrangement 2 1 1 1 3 2 2 1 Immigration Status --Born outside U.S. 12 10 9 13 11 15 11 15 --Born in U.S. 88 90 91 87 89 85 89 85
78
This document is a research report submitted to the U.S. Department of Justice. This report has not been published by the Department. Opinions or points of view expressed are those of the author(s)
and do not necessarily reflect the official position or policies of the U.S. Department of Justice.
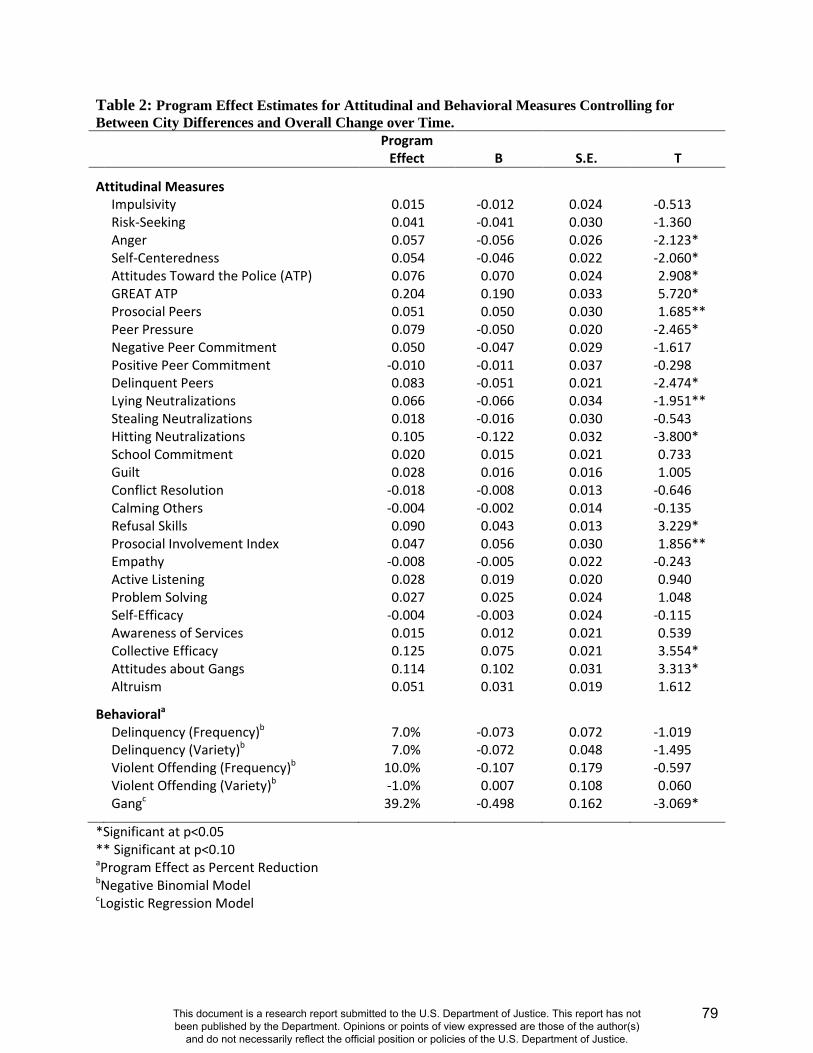
Table 2: Program Effect Estimates for Attitudinal and Behavioral Measures Controlling for Between City Differences and Overall Change over Time. Program
Effect B S.E. T
Attitudinal Measures Impulsivity 0.015 -0.012 0.024 -0.513 Risk-Seeking 0.041 -0.041 0.030 -1.360 Anger 0.057 -0.056 0.026 -2.123* Self-Centeredness 0.054 -0.046 0.022 -2.060* Attitudes Toward the Police (ATP) 0.076 0.070 0.024 2.908* GREAT ATP 0.204 0.190 0.033 5.720* Prosocial Peers 0.051 0.050 0.030 1.685** Peer Pressure 0.079 -0.050 0.020 -2.465* Negative Peer Commitment 0.050 -0.047 0.029 -1.617 Positive Peer Commitment -0.010 -0.011 0.037 -0.298 Delinquent Peers 0.083 -0.051 0.021 -2.474* Lying Neutralizations 0.066 -0.066 0.034 -1.951** Stealing Neutralizations 0.018 -0.016 0.030 -0.543 Hitting Neutralizations 0.105 -0.122 0.032 -3.800* School Commitment 0.020 0.015 0.021 0.733 Guilt 0.028 0.016 0.016 1.005 Conflict Resolution -0.018 -0.008 0.013 -0.646 Calming Others -0.004 -0.002 0.014 -0.135 Refusal Skills 0.090 0.043 0.013 3.229* Prosocial Involvement Index 0.047 0.056 0.030 1.856** Empathy -0.008 -0.005 0.022 -0.243 Active Listening 0.028 0.019 0.020 0.940 Problem Solving 0.027 0.025 0.024 1.048 Self-Efficacy -0.004 -0.003 0.024 -0.115 Awareness of Services 0.015 0.012 0.021 0.539 Collective Efficacy 0.125 0.075 0.021 3.554* Attitudes about Gangs 0.114 0.102 0.031 3.313* Altruism 0.051 0.031 0.019 1.612
Behaviorala Delinquency (Frequency)b 7.0% -0.073 0.072 -1.019 Delinquency (Variety)b 7.0% -0.072 0.048 -1.495 Violent Offending (Frequency)b 10.0% -0.107 0.179 -0.597 Violent Offending (Variety)b -1.0% 0.007 0.108 0.060 Gangc 39.2% -0.498 0.162 -3.069*
*Significant at p<0.05 ** Significant at p<0.10 aProgram Effect as Percent Reduction bNegative Binomial Model cLogistic Regression Model
79
This document is a research report submitted to the U.S. Department of Justice. This report has not been published by the Department. Opinions or points of view expressed are those of the author(s)
and do not necessarily reflect the official position or policies of the U.S. Department of Justice.
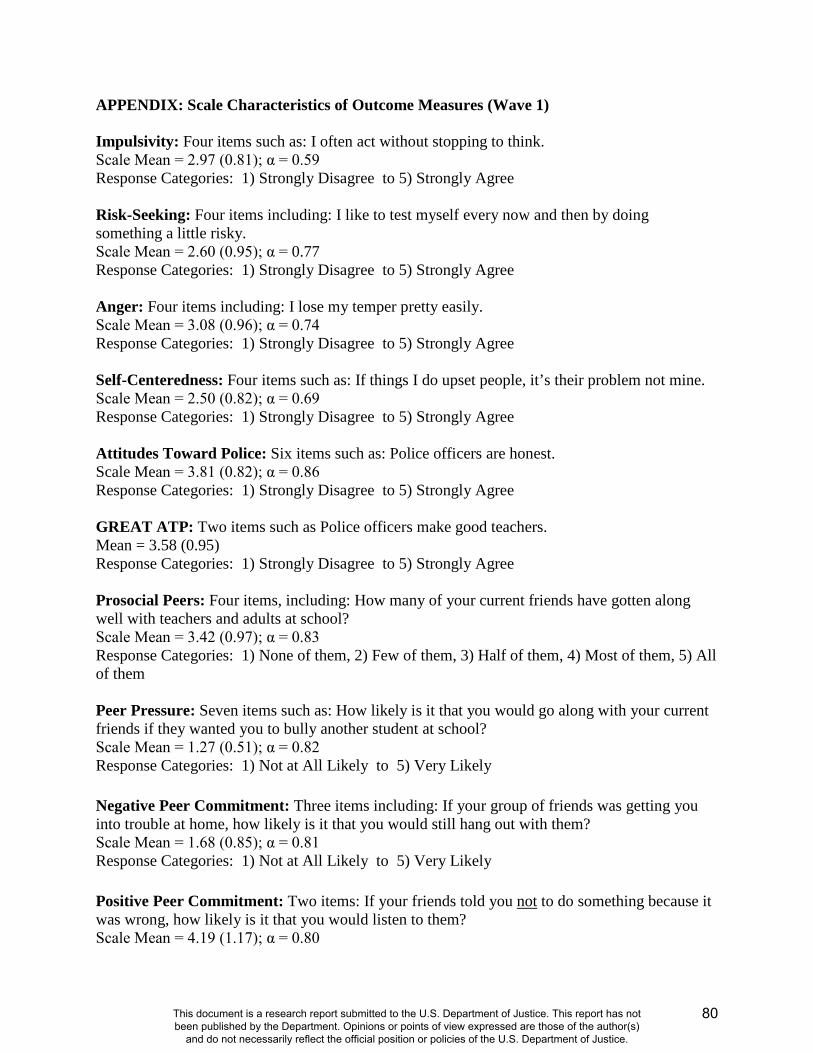
APPENDIX: Scale Characteristics of Outcome Measures (Wave 1)
Impulsivity: Four items such as: I often act without stopping to think. Scale Mean = 2.97 (0.81); α = 0.59 Response Categories: 1) Strongly Disagree to 5) Strongly Agree Risk-Seeking: Four items including: I like to test myself every now and then by doing something a little risky. Scale Mean = 2.60 (0.95); α = 0.77 Response Categories: 1) Strongly Disagree to 5) Strongly Agree Anger: Four items including: I lose my temper pretty easily. Scale Mean = 3.08 (0.96); α = 0.74 Response Categories: 1) Strongly Disagree to 5) Strongly Agree Self-Centeredness: Four items such as: If things I do upset people, it’s their problem not mine. Scale Mean = 2.50 (0.82); α = 0.69 Response Categories: 1) Strongly Disagree to 5) Strongly Agree Attitudes Toward Police: Six items such as: Police officers are honest. Scale Mean = 3.81 (0.82); α = 0.86 Response Categories: 1) Strongly Disagree to 5) Strongly Agree GREAT ATP: Two items such as Police officers make good teachers. Mean = 3.58 (0.95) Response Categories: 1) Strongly Disagree to 5) Strongly Agree Prosocial Peers: Four items, including: How many of your current friends have gotten along well with teachers and adults at school? Scale Mean = 3.42 (0.97); α = 0.83 Response Categories: 1) None of them, 2) Few of them, 3) Half of them, 4) Most of them, 5) All of them Peer Pressure: Seven items such as: How likely is it that you would go along with your current friends if they wanted you to bully another student at school? Scale Mean = 1.27 (0.51); α = 0.82 Response Categories: 1) Not at All Likely to 5) Very Likely Negative Peer Commitment: Three items including: If your group of friends was getting you into trouble at home, how likely is it that you would still hang out with them? Scale Mean = 1.68 (0.85); α = 0.81 Response Categories: 1) Not at All Likely to 5) Very Likely Positive Peer Commitment: Two items: If your friends told you not to do something because it was wrong, how likely is it that you would listen to them? Scale Mean = 4.19 (1.17); α = 0.80
80
This document is a research report submitted to the U.S. Department of Justice. This report has not been published by the Department. Opinions or points of view expressed are those of the author(s)
and do not necessarily reflect the official position or policies of the U.S. Department of Justice.
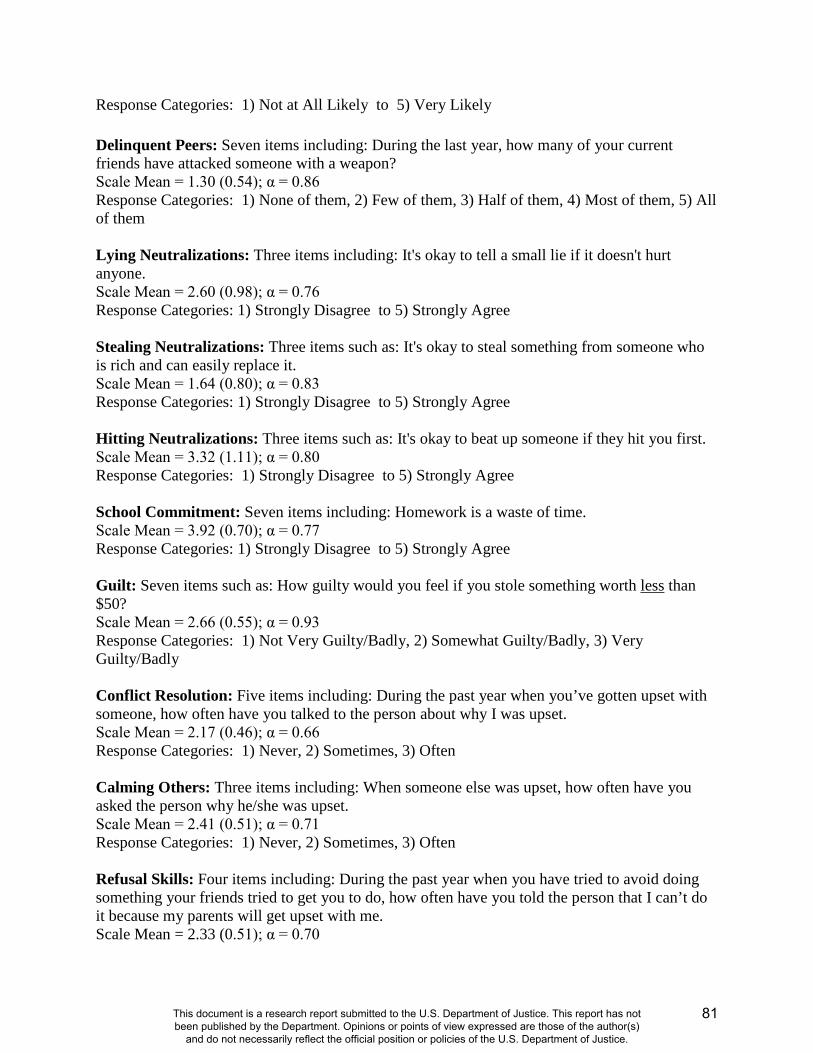
Response Categories: 1) Not at All Likely to 5) Very Likely Delinquent Peers: Seven items including: During the last year, how many of your current friends have attacked someone with a weapon? Scale Mean = 1.30 (0.54); α = 0.86 Response Categories: 1) None of them, 2) Few of them, 3) Half of them, 4) Most of them, 5) All of them Lying Neutralizations: Three items including: It's okay to tell a small lie if it doesn't hurt anyone. Scale Mean = 2.60 (0.98); α = 0.76 Response Categories: 1) Strongly Disagree to 5) Strongly Agree Stealing Neutralizations: Three items such as: It's okay to steal something from someone who is rich and can easily replace it. Scale Mean = 1.64 (0.80); α = 0.83 Response Categories: 1) Strongly Disagree to 5) Strongly Agree Hitting Neutralizations: Three items such as: It's okay to beat up someone if they hit you first. Scale Mean = 3.32 (1.11); α = 0.80 Response Categories: 1) Strongly Disagree to 5) Strongly Agree School Commitment: Seven items including: Homework is a waste of time. Scale Mean = 3.92 (0.70); α = 0.77 Response Categories: 1) Strongly Disagree to 5) Strongly Agree Guilt: Seven items such as: How guilty would you feel if you stole something worth less than $50? Scale Mean = 2.66 (0.55); α = 0.93 Response Categories: 1) Not Very Guilty/Badly, 2) Somewhat Guilty/Badly, 3) Very Guilty/Badly Conflict Resolution: Five items including: During the past year when you’ve gotten upset with someone, how often have you talked to the person about why I was upset. Scale Mean = 2.17 (0.46); α = 0.66 Response Categories: 1) Never, 2) Sometimes, 3) Often Calming Others: Three items including: When someone else was upset, how often have you asked the person why he/she was upset. Scale Mean = 2.41 (0.51); α = 0.71 Response Categories: 1) Never, 2) Sometimes, 3) Often Refusal Skills: Four items including: During the past year when you have tried to avoid doing something your friends tried to get you to do, how often have you told the person that I can’t do it because my parents will get upset with me. Scale Mean = 2.33 (0.51); α = 0.70
81
This document is a research report submitted to the U.S. Department of Justice. This report has not been published by the Department. Opinions or points of view expressed are those of the author(s)
and do not necessarily reflect the official position or policies of the U.S. Department of Justice.
Response Categories: 1) Never, 2) Sometimes, 3) Often Pro-social Involvement (Index): Four items including: During the past year have you been involved in school activities or athletics? Mean = 2.38 (1.14) Response Categories: 1) No, 2) Yes, Empathy: Five item including: I would feel sorry for a lonely stranger in a group. Scale Mean = 3.63 (0.65); α = 0.59 Response Categories: 1) Strongly Disagree to 5) Strongly Agree Active Listening: Three items such as: I look at the person talking to me. Scale Mean = 3.66 (0.72); α = 0.60 Response Categories: 1) Strongly Disagree to 5) Strongly Agree Problem Solving: Two items including: I talk to my friends about my problems. Scale Mean = 3.57 (0.91); α = 0.45 Response Categories: 1) Strongly Disagree to 5) Strongly Agree Self-Efficacy: Five items such as: When I make plans, I am certain I can make them work. Scale Mean = 3.76 (0.65); α = 0.72 Response Categories: 1) Strongly Disagree to 5) Strongly Agree Awareness of Services: Four items including: You know where a person can go for help if he/she is victimized. Scale Mean = 3.76 (0.65); α = 0.72 Response Categories: 1) Strongly Disagree to 5) Strongly Agree Collective Efficacy: Three items including: It is my responsibility to do something about problems in our community. Scale Mean = 3.25 (0.77); α = 0.62 Response Categories: 1) Strongly Disagree to 5) Strongly Agree Attitudes about Gangs: Two items: Getting involved with gangs will interfere with reaching my goals. Scale Mean = 3.72 (1.12); α = 0.71 Response Categories: 1) Strongly Disagree to 5) Strongly Agree Altruism: Three items including: It feels good to do something without expecting anything in return. Scale Mean = 3.60 (0.83); α = 0.66 Response Categories: 1) Strongly Disagree to 5) Strongly Agree
82
This document is a research report submitted to the U.S. Department of Justice. This report has not been published by the Department. Opinions or points of view expressed are those of the author(s)
and do not necessarily reflect the official position or policies of the U.S. Department of Justice.
Short and Long Term Outcome Results from a Multi-site Evaluation of the G.R.E.A.T. Program*
Finn-Aage Esbensen Department of Criminology and Criminal Justice
University of Missouri - St. Louis
D. Wayne Osgood Department of Sociology
Pennsylvania State University
Dana Peterson School of Criminal Justice
University at Albany
Terrance J. Taylor Department of Criminology and Criminal Justice
University of Missouri - St. Louis
Dena C. Carson Department of Criminology and Criminal Justice
University of Missouri - St. Louis
*This research was made possible, in part, by the support and participation of seven school
districts, including the School District of Philadelphia. This project was supported by Award No.
2006-JV-FX-0011 from the National Institute of Justice, Office of Justice Programs, U.S.
Department of Justice. The opinions, findings, and conclusions or recommendations expressed
in this manuscript are those of the authors and do not necessarily reflect the views of the
Department of Justice or of the seven participating school districts. We would like to express our
appreciation to the students who made this project possible by completing the student
questionnaires. And, this project would have been impossible without our team of colleagues
and research assistants; special thanks to Adrienne Freng, Kristy Matsuda, J. Michael Vecchio,
and Stephanie A. Wiley for their invaluable assistance.
This report was previously published in Criminology and Public Policy (2013)
83
This document is a research report submitted to the U.S. Department of Justice. This report has not been published by the Department. Opinions or points of view expressed are those of the author(s)
and do not necessarily reflect the official position or policies of the U.S. Department of Justice.
ABSTRACT: Short and Long Term Outcome Results from a Multi-site Evaluation of the
G.R.E.A.T. Program
Research Summary
This article presents results from a randomized control trial of the Gang Resistance Education
and Training Program (G.R.E.A.T.); 3,820 students enrolled in 195 classrooms in 31 schools in
seven cities were surveyed six times over five years (pre- and post-tests in Year 1 and four
annual follow-up surveys). Results indicate that during the four years post-treatment, students
receiving the program had lower odds of gang membership compared to the control group. The
treatment group also reported more pro-social attitudes on a number of program-specific
outcomes. In addition to examining effectiveness for the full sample, we also report analyses that
examine program effects by: (1) site and (2) initial levels of risk for gang membership.
Policy Implications
Effective youth violence prevention programs continue to be few in numbers; effective youth
gang prevention programs are even rarer. Various rating systems exist (e.g., University of
Colorado’s Blueprint Model; Helping America’s Youth; OJJDP Model Program Guide; NIJ’s
Crime Solutions), but even application of the least rigorous standards fails to identify many
promising or effective programs. Based on results reported in this article, the Gang Resistance
Education and Training (G.R.E.A.T.) program holds promise as a universal gang prevention
program.
84
This document is a research report submitted to the U.S. Department of Justice. This report has not been published by the Department. Opinions or points of view expressed are those of the author(s)
and do not necessarily reflect the official position or policies of the U.S. Department of Justice.

Short and Long Term Outcome Results from a Multi-site Evaluation of the G.R.E.A.T.
Program
Youth gangs continue to garner substantial attention from the media, public, and
academic researchers due in large part to the violence attributed to gang members. A number of
prevention, intervention, and suppression programs have been introduced to address problems
associated with youth gangs but, to date, relatively few have been deemed as promising, let alone
effective (e.g., Esbensen, Freng, Taylor, Peterson, and Osgood, 2002; Howell, 2012; Klein and
Maxson, 2006; Maxson, Egley, Miller, and Klein, 2013; Reed and Decker, 2002).
Given the disruptive influence on school safety and academic performance (as well as on
communities) that gangs pose, gangs and associated violence are targets of prevention and
intervention efforts. A number of programs have been developed and promoted as “effective,”
and school administrators are often confronted with slick promotional materials advocating the
“wonderfulness” of a wide array of programs claiming they will reduce problem behaviors,
increase social skills, and/or promote positive youth behavior. Whenever possible, these school
administrators should be encouraged to choose programs with a history of evaluation findings
supporting program effectiveness. While many programs exist, relatively few have been
subjected to rigorous program evaluations. Of particular import is the relative lack of programs
subjected to randomized control trials (RCTs). The current study presents one example of short-
and long-term findings from a recent RCT assessing the effectiveness of a gang prevention
program - Gang Resistance Education and Training (G.R.E.A.T.). Findings from this study can
aid recent efforts to provide empirically-based information to school administrators and
community leaders seeking to implement evidence-supported programs.
85
This document is a research report submitted to the U.S. Department of Justice. This report has not been published by the Department. Opinions or points of view expressed are those of the author(s)
and do not necessarily reflect the official position or policies of the U.S. Department of Justice.
Despite the relative absence of the most rigorous evaluation designs (i.e., RCTs)
assessing gang prevention programs, an increasing number of agencies/organizations have
developed criteria for classifying programs into various categories ranging from “not effective”
to “effective” or “model” programs based on the findings of empirical evaluations. For example,
the Blueprints Series (Mihalic, Fagan, Irwin, Ballard, and Elliott, 2002; Mihalic and Irwin, 2003)
identifies model violence prevention programs that have withstood rigorous scientific
evaluations, and the Maryland Report (Sherman, Gottfredson, MacKenzie, Eck, Reuter, and
Bushway, 1997) assessed the effectiveness of a broad range of projects. In 2005, the Helping
America’s Youth (HAY) Community Guide (Howell, 2009) rated programs identified by non-
federal agencies on three levels: Level 1 (exemplary or model programs based on evaluation
designs of the “highest quality”); Level 2 (effective programs based on quasi-experimental
research); and Level 3 (promising programs). Similarly, the Office of Juvenile Justice and
Delinquency Prevention provides a listing of exemplary, effective, or promising programs
(OJJDP, 2010) and in 2010, the National Institute of Justice introduced its “Crime Solutions”
website which identifies effective and promising programs (http://www.crimesolutions.gov).
Of particular relevance to the current study, the G.R.E.A.T. program is currently rated as
"promising" by OJJDP and by Crime Solutions, and designated as "Level 2" (effective) in the
Helping America’s Youth rating scale (www.findyouthinfo.gov). Additionally, a recent
systematic review found that the G.R.E.A.T. program was one of only a handful of gang
awareness programs meeting strict guidelines for determining program effectiveness (Gravel,
Bouchard, Descormiers, Wong, and Morselli, 2013). These designations were initially based on
findings from two multisite evaluations of the “original” program curriculum: one cross-
sectional study conducted in 1995 (Esbensen and Osgood, 1999) and one longitudinal study
86
This document is a research report submitted to the U.S. Department of Justice. This report has not been published by the Department. Opinions or points of view expressed are those of the author(s)
and do not necessarily reflect the official position or policies of the U.S. Department of Justice.
conducted between 1995 and 1999 (Esbensen, Osgood, Taylor, Peterson, and Freng, 2001), but
the current classifications are based on short-term findings from an evaluation of the revised
G.R.E.A.T. program (Esbensen, Peterson, Taylor, and Osgood, 2012).
The G.R.E.A.T. program has been in existence since 1991 and has received some acclaim
since its inception. Originally developed as a nine-lesson curriculum based on Drug Abuse
Resistance Education (DARE), the program underwent a substantial curriculum revision after the
findings of the two aforementioned studies. Once these revisions were made, there was
considerable interest in determining whether the program would be found to be more effective at
meeting program goals than was the case in the evaluations of the original G.R.E.A.T. program.
In a recent publication we reported on the one-year post treatment effects of the revised
G.R.E.A.T. program (Esbensen et al., 2012). This current manuscript provides an overview of
those results but focuses on the long-term program effects (up to four years post-treatment) while
also reporting additional analyses that examine: (1) site-specific program outcomes and (2) the
extent to which pre-existing risk factors impact program effectiveness. Our findings contribute to
the sparse body of knowledge about effective gang prevention strategies.
We begin with a description of the G.R.E.A.T. program. Next, we turn to a recap of
findings from the earlier evaluations, with a particular emphasis on critiques levied at both the
program and the evaluation findings, and how the current program and evaluation overcome
many of the limitations previously highlighted. We then describe the methodology employed
and results of the current evaluation of the revised G.R.E.A.T. program. We conclude with a
discussion of how the current results fit with those of previous evaluations and what this means
for gang prevention programming.
87
This document is a research report submitted to the U.S. Department of Justice. This report has not been published by the Department. Opinions or points of view expressed are those of the author(s)
and do not necessarily reflect the official position or policies of the U.S. Department of Justice.
The G.R.E.A.T. Program1
The Gang Resistance Education and Training (G.R.E.A.T.) program is a school-based
gang and violence prevention program with three primary goals: (1) teach youths to avoid gang
membership; (2) prevent violence and criminal activity; and (3) assist youths to develop positive
relationships with law enforcement. Developed as a universal prevention program targeting
youth in early adolescence (i.e., 6th or 7th graders), the G.R.E.A.T. program was classified as a
gang awareness program in a recent review of gang programs (Gravel et al., 2013). The original
G.R.E.A.T. program,2 developed by Phoenix-area police departments in 1991, was a cognitive-
based program that taught students about crime and its effect on victims, cultural diversity,
conflict resolution skills, meeting basic needs (without a gang), responsibility, and goal setting.3
Uniformed law enforcement officers taught the curriculum in schools, and teachers were
requested to complement the program content during regular classes.
The revised G.R.E.A.T. program contains much of the substance of the original program
but, importantly, was also informed by the work of educators and prevention specialists and the
growing body of risk factor research (see Esbensen, Freng, Taylor, Peterson, and Osgood, 2002;
Esbensen, Peterson, Taylor, Freng, Osgood, Carson, and Matsuda, 2011, for a detailed account
of the program review that informed the curriculum revision). As a result, the revised
G.R.E.A.T. program was expanded from nine to 13 lessons; is still primarily taught by
uniformed law enforcement officers (largely police officers and sheriff’s deputies, but Federal
agents from the U.S. Marshalls and the Bureau of Alcohol, Tobacco, and Firearms as well as
1 This section describing the G.R.E.A.T. program is partially excerpted from Esbensen, Peterson, Taylor, and Osgood (2012). 2 The core program component of G.R.E.A.T. is its middle school curriculum, and this is often what is referred to with the term “G.R.E.A.T. program.” Other optional components of G.R.E.A.T. are an elementary school curriculum, a summer program, and G.R.E.A.T. Families. 3 For a detailed account of the political context surrounding the development of the original G.R.E.A.T. program, consult Winfree, Peterson Lynskey, and Maupin (1999).
88
This document is a research report submitted to the U.S. Department of Justice. This report has not been published by the Department. Opinions or points of view expressed are those of the author(s)
and do not necessarily reflect the official position or policies of the U.S. Department of Justice.
District Attorneys have also been trained and certified to teach G.R.E.A.T.); and incorporates
classroom management training of officers and a focus on students’ skill development through
cooperative learning strategies - important pedagogical tools for educational settings
(Gottfredson, 2001).4
Two school-based programs, the Seattle Social Development Model (SSDM) and Life
Skills Training (LST), guided the revision of the G.R.E.A.T. program. LST is classified as a
model program by the rigorous Blueprint standards while the SSDM has received acclaim from a
variety of sources. The SSDM is a comprehensive model that seeks to reduce delinquency and
violence by building a positive learning environment incorporating several different classroom
management components, such as cooperative learning, proactive classroom management, and
interactive teaching (Catalano, Arthur, Hawkins, Berglund, and Olson, 1998). The LST program
is a three-year intervention in which two annual booster sessions supplement the initial program
(Dusenbury and Botvin, 1992). LST consists of three components: (1) self-management skills;
(2) social skills; and (3) information and skills directly related to the problem of drug abuse. The
revised G.R.E.A.T. program adopted some of the strategies from LST (in fact, some of the LST
curriculum writers participated in the rewriting of the G.R.E.A.T. program), including an
emphasis on the development of skills, rather than on the assimilation of knowledge, and also
incorporated problem-solving exercises and cooperative learning strategies.
During the revision of the G.R.E.A.T. program, incorporation of findings from research
identifying risk factors for gang affiliation and violent offending was a primary enhancement to
the program. While recognizing the importance of risk factors in all five domains (i.e.,
community, school, peer, family, and individual), the curriculum writers acknowledged that a
4 Information about the G.R.E.A.T. program and an overview of the G.R.E.A.T. lessons included in the middle school curriculum can be found at http://www.great-online.org/.
89
This document is a research report submitted to the U.S. Department of Justice. This report has not been published by the Department. Opinions or points of view expressed are those of the author(s)
and do not necessarily reflect the official position or policies of the U.S. Department of Justice.
school-based program could best address risk factors in the school, peer, and individual domains.
As such, the revised curriculum addresses the following risk factor areas: school commitment,
school performance, association with conventional and/or delinquent peers, susceptibility to peer
influence, involvement in conventional activities, empathy, self-control (impulsivity, risk-
seeking, self-centeredness, and anger control), perceived guilt, neutralization techniques (for
lying, stealing, and hitting), and moral disengagement (e.g., Battin, Hill, Abbott, Catalano, and
Hawkins, 1998; Esbensen and Deschenes, 1998; Esbensen, Huizinga, and Weiher, 1993;
Esbensen, Peterson, Taylor, and Freng, 2010; Hill, Howell, Hawkins, Battin-Pearson,1999;
Howell and Egley, 2005; Klein and Maxson, 2006; Maxson and Whitlock, 2002; Maxson,
Whitlock, and Klein, 1998; Pyrooz, Fox, and Decker, 2010; Thornberry, 1998; Thornberry,
Krohn, Lizotte, Smith, and Tobin, 2003).
Research has also demonstrated the deleterious cumulative effects of risk exposure; the
greater the number of risk factors and/or the greater the number of risk domains experienced, the
greater the odds of youth gang and violence involvement, with these increases in risk associated
with exponential increases in odds of becoming gang-involved (Esbensen et al., 2010;
Thornberry et al., 2003). This collective body of risk factor research suggests that prevention
programs should attempt to address risk factors in multiple domains and to do so earlier, rather
than later, in adolescence, both before the factors accumulate and before the typical age of onset
for gang involvement — i.e., prior to the age of about 14 (Esbensen and Huizinga, 1993; Hill et
al., 1999; Thornberry et al., 2003). To this end, the revised G.R.E.A.T. curriculum addresses
multiple risk factors across multiple domains and is taught in 6th or 7th grade, when students
average 11 – 13 years of age.
90
This document is a research report submitted to the U.S. Department of Justice. This report has not been published by the Department. Opinions or points of view expressed are those of the author(s)
and do not necessarily reflect the official position or policies of the U.S. Department of Justice.
Comparing Earlier Evaluations with the Current Evaluation
Two previous multi-site evaluations of the original G.R.E.A.T. program were conducted
(Esbensen and Osgood, 1999, and Esbensen et al., 2001). These evaluations found different
degrees of “success” of the G.R.E.A.T. program at meeting its stated goals. A brief background
on these studies provides context for the current study’s findings.
The first was a cross-sectional study of nearly 6,000 eighth graders attending public
schools in eleven U.S. cities conducted in 1995 (Esbensen and Osgood, 1999). The study found a
number of results supportive of the original G.R.E.A.T. program’s effectiveness at reaching its
goals. A variety of modeling strategies were employed, with three increasingly restrictive
samples examined. Under the most restrictive analyses, G.R.E.A.T. students were found to be
significantly “better” than non-G.R.E.A.T. students on 14 of 33 outcome measures examined.
Program participants were consistently found to have lower levels of drug use and minor
delinquent offending than non-participants. Looking at attitudinal measures with consistent
findings across modeling strategies, G.R.E.A.T. students had more negative attitudes about
gangs, fewer delinquent friends, more friends involved in prosocial activities, greater
commitment to peers promoting prosocial behaviors, less likelihood of acting impulsively,
higher self-esteem, more commitment to success at school, and higher levels of attachment to
both mothers and fathers than their non-G.R.E.A.T. counterparts. Additionally, program effects
on five outcome measures—peer delinquency, friends’ involvement in prosocial activities,
commitment to peers who promote prosocial activities, self-esteem, and commitment to success
at school—were found to be stronger for males (relative to females) and effects for two
outcomes—commitment to and involvement with prosocial peers—were stronger for Black and
Hispanic youth (relative to white youth).
91
This document is a research report submitted to the U.S. Department of Justice. This report has not been published by the Department. Opinions or points of view expressed are those of the author(s)
and do not necessarily reflect the official position or policies of the U.S. Department of Justice.
The second evaluation was a prospective longitudinal study of more than 2,000 youth
attending public schools in six U.S. school districts. Students were followed from seventh grade
(sixth in one site) until eleventh grade (tenth in one site). In 15 of the 22 schools that
participated, classrooms were randomly assigned to treatment and control conditions; in the
remaining schools, due to constraints such as G.R.E.A.T. officers’ schedules, classrooms were
assigned to condition based on matching procedures (e.g., one teacher’s morning class was
assigned to the treatment condition, while the same teacher’s afternoon class was assigned to the
control condition). Results of the longitudinal analyses were less supportive of the program than
the cross-sectional results. Specifically, five of the 32 outcome measures were found to be
consistent with beneficial program effects in pre-program vs. post-program (all four years
combined) contrasts; G.R.E.A.T. students were found to have lower rates of victimization, more
negative views of gangs, more favorable attitudes toward the police, more involvement with
prosocial peers, and reduced levels of risk seeking. The results examining trends over time were
less pronounced, with only three of the outcomes reaching statistical significance (victimization,
involvement with and commitment to prosocial peers) and evidence that effects were delayed
(rather than immediate). It is important to note, however, that 25 of the 32 outcome measures
examined were in a direction consistent with positive program effects. Also in contrast to the
earlier cross-sectional analyses, there were no significant differences in program effects across
subgroups by sex or race/ethnicity.
Many of the accolades the G.R.E.A.T. program has received were based, in some part, on
the relatively positive findings of the cross-sectional study and the finding of small lagged effects
on some program outcomes in the longitudinal evaluation. That is not to say that these studies
were definitive “proof” that the original G.R.E.A.T. program was an undeniable “success.” In
92
This document is a research report submitted to the U.S. Department of Justice. This report has not been published by the Department. Opinions or points of view expressed are those of the author(s)
and do not necessarily reflect the official position or policies of the U.S. Department of Justice.
fact, results from the longitudinal evaluation were viewed as evidence of a lack of program effect
and contributed to the comprehensive program review and revision. Some commentators were
critical of the G.R.E.A.T. program and also raised concerns about the earlier evaluations. Klein
and Maxson (2006), for example, note that the most promising results were found employing the
least rigorous methodological design: the cross-sectional study. The more rigorous longitudinal
design found less support for the program, as demonstrated by the relative lack of significant
differences between treatment and control groups after program exposure and only modest
program effects when differences were found. They also highlight the lack of a significant
program effect on gang membership, the key program outcome.
Klein and Maxson (2006) identify three factors that could account for the failure of the
program to reduce the odds of gang membership. First, the original G.R.E.A.T. program was
based on a “failed” program model: Drug Abuse Resistance Education (DARE). Second, the
original G.R.E.A.T. program was not “gang specific;” rather, it was based on more general social
skills targeted at delinquency prevention. Third, the program was aimed at a population with
relatively low rates and probabilities of gang membership. Specifically, Klein and Maxson argue
that this universal program focusing on all seventh grade classrooms would be unlikely to reach
the target group because few seventh graders attending schools are involved with gangs.
Ludwig (2005) presents additional concerns about the effectiveness of the original
G.R.E.A.T. program. In addition to reinforcing the point that evaluations of the G.R.E.A.T.
program found no effect on key dependent variables of gang involvement, drug use, or
delinquency, Ludwig also notes that sample attrition throughout the study reduces the confidence
that we should have about program effectiveness found in the longitudinal study.
93
This document is a research report submitted to the U.S. Department of Justice. This report has not been published by the Department. Opinions or points of view expressed are those of the author(s)
and do not necessarily reflect the official position or policies of the U.S. Department of Justice.
There was renewed interest in the question of program effectiveness after the revised
curriculum was fully implemented in 2003. In July 2006, the National Institute of Justice
selected the University of Missouri-St. Louis to conduct a process and outcome evaluation of the
revised G.R.E.A.T. program. The current program and evaluation address many of the
limitations of the earlier program and evaluation designs and build upon the results of those
earlier studies. First, as previously described, the G.R.E.A.T. program underwent major changes
after a substantial curriculum review based in large part on the findings of the previous
evaluations. Of particular import was an emphasis on linking specific program lessons with risk
factors found to be important in gang joining and delinquency. In short, while the revised
program still deals with general social skills and the prevention of delinquency, greater attention
is now paid to risk factors found to be associated with gangs. Second, the criticism that the
original G.R.E.A.T. program was modeled after the DARE program was addressed during the
curriculum review, with the revised G.R.E.A.T. program now modeled after two highly
acclaimed school-based prevention programs (LST and SSDM). Third, Klein and Maxson’s
critique of the universal targeted population raises the issue of efforts attempting to reduce
statistically rare events. As many gang researchers have noted, gang membership is a rare event,
even in the most at-risk neighborhoods or sub-populations. At the same time, the past twenty
plus years of gang research have demonstrated that gangs and gang-involved youth are found in
communities not only across the U.S.A. but across the world (e.g., Covey, 2010; Esbensen and
Maxson, 2013; Hagedorn, 2008). While one can question the utility of trying to prevent a
statistically rare event, it does not seem reasonable to abandon general prevention efforts,
especially given researchers’ and practitioners’ inability to identify unique risk factors for gang
membership5 and recent studies indicating a great deal of overlap in risk factors for gang
5 See Klein and Maxson’s (2006) review of the gang risk factor literature.
94
This document is a research report submitted to the U.S. Department of Justice. This report has not been published by the Department. Opinions or points of view expressed are those of the author(s)
and do not necessarily reflect the official position or policies of the U.S. Department of Justice.
membership and violence (Esbensen et al., 2010; Peterson and Morgan, forthcoming). Finally,
with respect to methodological issues raised by Ludwig and others, extensive efforts were made
to increase both the active consent rates and survey completion rates in the current evaluation.
The results of these efforts are reported in the Methods section.
While an earlier study reporting short-term program effects of the revised G.R.E.A.T.
program was published in 2012 (Esbensen et al., 2012), the current study focuses on long-term
effects across four years post-treatment.6 This long-term emphasis is important not only to
determine whether short-term effects are sustained over time, but also because it captures youth
at the ages of highest risk of gang joining (Klein and Maxson, 2006) and because delayed effects
were detected in the previous longitudinal evaluation (Esbensen et al., 2001). Additionally,
supplemental analyses reported in the current study (1) investigate the extent to which the overall
results are replicated at each of the seven individual research sites and (2) control for pre-existing
risk factors. These important questions address the universality of program effects and introduce
a more rigorous assessment than was possible in the earlier study. As such, the current study
goes well beyond the one-year program effects reported in the 2012 study.
Methods
Site and School Selection
Seven cities (Albuquerque, NM; Chicago, IL; a Dallas-Fort Worth area district; Greeley,
CO; Nashville, TN; Philadelphia, PA; and Portland, OR) were selected to provide a diverse
sample of schools and students. Sample selection was guided by three main criteria: (1)
geographic and demographic diversity, (2) a substantial number of officers delivering the
program to some, but not all, students, and (3) information provided by the National Gang Center
6 In several sections of this paper, we report long-term effects alongside the earlier-reported short-term effects for comparison purposes.
95
This document is a research report submitted to the U.S. Department of Justice. This report has not been published by the Department. Opinions or points of view expressed are those of the author(s)
and do not necessarily reflect the official position or policies of the U.S. Department of Justice.

about cities’ level of gang activity. The goal was to develop a sample that was geographically
and demographically diverse across cities with varying degrees of gang activity. The student and
school sample is representative of the students and schools in each of the seven cities’ school
districts. The final sample consists of 3,820 students (for whom active consent was obtained)
nested within 195 classrooms (102 received G.R.E.A.T. and 93 did not receive the program) in
31 schools.
Active Parental Consent
Active parental consent was required for student participation (see Esbensen, Melde,
Peterson, and Taylor, 2008 for a detailed description of the active consent process) and, as stated
previously, significant effort was made to improve these rates over what was achieved in the
earlier evaluation. Teachers were recruited to assist with the process and the combined effort of
teachers and evaluators produced a commendable active consent rate of 78 percent. Of the 4,905
students represented on the classroom rosters at the time of the consent process, 89.1 percent of
youths (N=4,372) returned a completed consent form, with 77.9 percent of parents/guardians
(N=3,820) allowing their child’s participation while 11.3 percent (N= 552) declined.7
Research Design and Random Assignment of Classrooms
The outcome evaluation employs an experimental longitudinal panel design (a
randomized control trial with long-term follow-up) in which classrooms in each of the
participating schools were randomly assigned to the treatment (i.e., G.R.E.A.T.) or control
condition.8 Once it was determined in which grade level (6th grade in 26 schools and 7th grade in
5 schools) and in which core subject area (commonly Social Studies but also in English and
7 This may be compared with an active consent rate of 57 percent of students being allowed to participate in the earlier longitudinal evaluation of the original G.R.E.A.T. program (Esbensen et al., 2001). 8 This is an improvement over the earlier longitudinal evaluation design, in which random assignment was possible in only 15 of 22 participating schools (Esbensen et al., 2001).
96
This document is a research report submitted to the U.S. Department of Justice. This report has not been published by the Department. Opinions or points of view expressed are those of the author(s)
and do not necessarily reflect the official position or policies of the U.S. Department of Justice.
Science classes) the program would be taught, we enumerated all of the grade-level classrooms
(ranging from 3 to 12). In situations with an odd number of classes, we made the a priori
decision to oversample treatment classes (in partial recognition of the fact that many of the
principals were reluctant to “deprive” any of their students of the program). The list of classes
was then numbered from one through highest and a table of random numbers was consulted to
select the classrooms in which G.R.E.A.T. would be taught. Unselected classrooms comprised
the control group.
All students in the treatment and control classrooms were eligible to participate in the
evaluation and those for whom active parental consent was obtained (N=3,820) were then asked
to participate in the evaluation by completing a confidential group-administered pre-test
questionnaire. Upon completion of the G.R.E.A.T. program in each school, students in both the
experimental and control groups were then requested to complete post-tests and four annual
follow-up surveys. Retention rates across the six waves of data included in the outcome analyses
reported in this paper were 98.3%, 94.6 %, 87.3%, 83 %, 75%, and 72%, respectively, for Wave
1 (pretest) through Wave 6 (4 years post treatment).9 These response rates reflect the diligent
efforts of the research assistants working on this project. It is particularly challenging to track
students through multiple schools and school districts, especially in a highly mobile sample:
while initially enrolled in 31 middle schools at pretest, students were surveyed in more than 200
different schools in Waves 5 and 6 when the students were in high school. We tracked students
in each of the seven cities, identifying the schools (or cities) to which students had transferred. In
a number of instances (especially for students who had moved outside of the district), this
required soliciting information from school administrative assistants, teachers, and/or other
9 This compares with completion rates of 87%, 80%, 86%, 76%, 69%, and 67% in the earlier longitudinal evaluation.
97
This document is a research report submitted to the U.S. Department of Justice. This report has not been published by the Department. Opinions or points of view expressed are those of the author(s)
and do not necessarily reflect the official position or policies of the U.S. Department of Justice.
students because, somewhat surprisingly, this information was often not available from the
central district office or from computerized records. These efforts at locating students, combined
with multiple visits to individual schools (in some instances more than 10 trips to survey
chronically truant students), contributed to the fact that we were able to survey virtually all of the
students still enrolled in schools in the original districts. We obtained permission from principals
at each of the new schools to survey the transfer students – clearly, a time and labor-intensive
effort, but one well worth achieving these high response rates.
Student Sample Characteristics
Based on responses provided at Wave 1, the sample is evenly split between males and
females; most (55%) youths reside with both biological parents; and the majority (88%) was
born in the United States (see Table 1). The sample is racially/ethnically diverse, with Hispanic
youths (37%), White youths (27%), and African American youths (17%) accounting for 81% of
the sample. Approximately two-thirds of the youths (61%) were aged 11 or younger at the pre-
test, representing the fact that 26 of the 31 schools delivered the G.R.E.A.T. program in 6th
grade. Three of the six Chicago schools and two of four schools in Albuquerque taught
G.R.E.A.T. in 7th grade; thus, students in these sites were somewhat older than students in the
other sites.
INSERT TABLE 1 ABOUT HERE
Measurement
Program Goals
To assess program effectiveness, it was essential that measures of the three program goals
be included in the student surveys. Additionally, the G.R.E.A.T. lessons targeted a number of
secondary outcomes that sought to reduce known risk factors for delinquency and gang
98
This document is a research report submitted to the U.S. Department of Justice. This report has not been published by the Department. Opinions or points of view expressed are those of the author(s)
and do not necessarily reflect the official position or policies of the U.S. Department of Justice.

membership. We developed a student questionnaire that captured the essence of this skills
building program, including many of the risk factors associated with gang membership as well as
lesson-specific social skills (e.g., dealing with peer pressure and being able to say no). To
reiterate, the G.R.E.A.T. program has three primary goals: (1) to help youths avoid gang
membership, (2) to reduce violence and criminal activity, and (3) to help youths develop a
positive relationship with law enforcement. Gang membership is measured by a single-item
question that is part of a larger set of questions about youth gangs. Specifically, students
answered the question; “Are you now in a gang?” This self-nomination approach has been found
to be a valid and robust measure of gang affiliation (e.g., Esbensen, Winfree, He, and Taylor,
2001; Thornberry et al., 2003). To measure delinquency and violent offending, students
completed a 14-item self-reported delinquency inventory, including response categories that
allowed for assessment of both ever and annual prevalence as well as frequency of offending
during the past six months (past three months at Wave 2, the post-test). We treated this self-
report inventory as a composite measure of general delinquency (examining both a variety and a
frequency score) but also created a separate measure of violent offending consisting of three
items (attacked someone with a weapon, used a weapon or force to get money or things from
people, been involved in gang fights). To measure the third specific program goal (improving
relations with law enforcement), students answered six questions tapping general attitudes
toward the police as well as two additional questions measuring students’ attitudes about police
officers as teachers.
Additional Program Objectives
In addition to these three program goals, the 13 G.R.E.A.T. lessons address risk factors
for gang joining and life-skills thought necessary to prevent involvement in gangs and
99
This document is a research report submitted to the U.S. Department of Justice. This report has not been published by the Department. Opinions or points of view expressed are those of the author(s)
and do not necessarily reflect the official position or policies of the U.S. Department of Justice.
delinquency (see, e.g., Hill et al., 1999; Klein and Maxson, 2006; Maxson and Whitlock, 2002;
Maxson et al., 1998; Thornberry et al., 2003). These mediating variables are treated as implied
program objectives and are included in our outcome analyses. We therefore examined the extent
to which students exposed to G.R.E.A.T. had improved or enhanced skills that would enable
them to better resist the lures of gang membership and resist peer pressure to engage in illegal
activities. The G.R.E.A.T. lessons encourage students to make healthy choices such as being
involved in more pro-social activities and associating more with pro-social peers and less with
delinquent peers. The lessons also teach students to improve their communication skills by
being active listeners and being better able to interpret verbal and non-verbal communication,
targeting these skills in order to improve students’ empathy for others.
A total of 33 outcomes are assessed in these analyses, comprising five behavioral
outcomes (gang affiliation, general delinquency, and violent offending – the latter two measured
as both frequency and variety indices) and 28 attitudinal measures, including the two measures
of attitudes to the police; guilt associated with norm violation; attitudes about gangs; refusal
skills; collective efficacy; neutralizations for lying, stealing, and hitting; resistance to peer
pressure; associations with delinquent and pro-social peers; pro-social involvement; commitment
to negative and to positive peers; school commitment; guilt; empathy; self-centeredness; anger;
impulsivity; risk-seeking; conflict resolution; calming others; active listening; problem-solving;
self-efficacy; awareness of services; and altruism. (For a full listing of scales and scale
characteristics, see the Appendix.)
Analysis strategy
The post-test-through-four-year post-treatment analysis strategy is an elaboration of that
used by Esbensen and colleagues (2012) for the first two post-treatment waves of outcome
100
This document is a research report submitted to the U.S. Department of Justice. This report has not been published by the Department. Opinions or points of view expressed are those of the author(s)
and do not necessarily reflect the official position or policies of the U.S. Department of Justice.
measures. These analyses, using MLwiN software (Rasbash, Steele, Browne, and Goldstein,
2009), include the outcome measures obtained on five occasions after treatment (waves two
through six, level 1) for a total of 15,693 observations nested within 3,739 individual students
(level 2) in 195 different classrooms (level 3), in 31 schools (level 4) in 7 cities (level 5).
Analyses allowed for residual mean differences for students, classrooms, and schools through
random intercept terms at each level and for cities through dummy variable fixed effects (due to
the small number of cities). By mean-centering the treatment versus control explanatory variable
within schools, we insure that differences across schools in mean levels of outcomes did not
inadvertently bias the estimate of program effects. The model also included a variance
component to allow for the possibility that program impact varied across schools (i.e., a random
coefficient for treatment versus control at the school level), which insured an appropriately
conservative significance test of program impact. The variation in program impact across
schools did not reach statistical significance at p < .05 for any of the outcomes. The analyses
also controlled for the pretest measure of each outcome. We assessed the pre-test comparability
of treatment and comparison groups through a version of this model that omits time as a level of
analysis.
The model allows for change over time through a quadratic function. We were careful to
code this function so that the main effect for treatment would reflect mean differences across the
entire post-treatment period. We accomplished this by capturing the function through orthogonal
polynomials (coded across waves 2 - 6 as linear = -2, -1, 0, 1, 2; quadratic = 2, -1, -2, -1, 2). We
then centered these terms within each person to adjust for any individual differences associated
with attrition. Analyses included random variance components for the linear and squared terms at
the individual, classroom, and school levels, thus allowing for the possibility of systematic
101
This document is a research report submitted to the U.S. Department of Justice. This report has not been published by the Department. Opinions or points of view expressed are those of the author(s)
and do not necessarily reflect the official position or policies of the U.S. Department of Justice.

differences in trajectories at each of those levels.
Our analytic model is designed so that the coefficient for treatment versus control
provides an overall assessment of program impact, and the interactions between that term and the
linear and squared terms for time reflect change over time in program impact (with significance
assessed by a joint test of those two interaction terms). We applied a linear version of this model
to most of the outcomes. The measure of gang membership is dichotomous and thus required a
logistic version of the model. The self-report measures of general and violent delinquency were
highly skewed integer variables, for which a negative binomial model was most appropriate. For
the linear models, our tables show the magnitude of program effects in standard deviation units
of difference between treatment and control groups (also known as Cohen’s d), transformed so
that positive values reflect beneficial program effects. For the logistic and negative binomial
models we report the percentage difference between treatment and control in odds (for logistic)
or mean rate of offenses (negative binomial).
One of the objectives of this multi-site evaluation was to include students from diverse
settings to allow us to address the issue of transferability of the program. The seven participating
cities were selected to represent large and small cities, racially homogenous and racially
heterogeneous populations, and cities across the geographical range of the U.S. To examine the
generalizability and transferability of the program, we implemented a version of the model that
provides separate estimates of program effects and time trends for each city. We accomplished
this by replacing all of the fixed regression coefficients in the base model (except the pretest
outcome measure) by their interactions with dummy variables for every site (leaving no
reference site). The variance components remained the same.
102
This document is a research report submitted to the U.S. Department of Justice. This report has not been published by the Department. Opinions or points of view expressed are those of the author(s)
and do not necessarily reflect the official position or policies of the U.S. Department of Justice.
There is also a body of literature that suggests that youth with greater pre-existing risk
may benefit more from some programs than youth at low risk (Andrews, Zinger, Hoge, Bonta,
Gendreau, and Cullen, 1990; Lipsey, 2009). Indeed, the cross-sectional results reported by
Esbensen and Osgood (1999) found some evidence that the G.R.E.A.T. program was more
effective for males (relative to females) and African American and Latino youth (relative to
white youth)—groups commonly found to be at higher risk of gang membership. To examine
this issue, additional analyses were run to test whether program impact differed between high
and low risk youth.10 To measure risk, we first identified respondents who reported belonging to
a gang in waves 2 through 6. We then conducted a logistic regression analysis with that measure
as the outcome and sex, race/ethnicity, and 35 wave 1 measures (the 33 variables identified
above and two measures of school and community disorder) of all of the outcome variables as
predictors. The fitted values from that analysis differentiate respondents for their probability of
joining a gang by the end of the study. These fitted values were most strongly correlated with
wave 1 gang membership (r = .80), delinquency (r = .74), and peer delinquency (r = .57). We
defined high-risk youth as the 25% of the sample with the highest probability of joining a gang
and low risk as the remaining 75% of the sample. We tested for differential program effects on
high versus low risk youth by adding to the base model the two-way interaction of risk with
classroom treatment assignment and the three-way interactions of risk and treatment assignment
with linear and quadratic change. Finally, we also assessed the extent to which program effects
differed by the subgroups (sex and race/ethnicity) compared in the previous evaluations,
conducting sex (or race/ethnicity) by treatment interactions and examining group by treatment
interaction over time. These analyses indicated that only for very few (one or two out of 33)
10 As well, this analysis addresses, in part, Klein and Maxson’s (2006) critique that this universal program fails to target the most in-need youth and that effects from universal programs such as this may be diluted due to the large number of low-risk youth in the sample.
103
This document is a research report submitted to the U.S. Department of Justice. This report has not been published by the Department. Opinions or points of view expressed are those of the author(s)
and do not necessarily reflect the official position or policies of the U.S. Department of Justice.
outcomes did program effects differ significantly by sex or race/ethnicity, certainly no more than
by chance.
Results
Preliminary analyses examined the comparability of treatment and comparison groups on
pretest measures. Across the entire set of 33 outcome measures, differences tended to be small,
but slightly favored the treatment group, with the mean Cohen’s d = .017 for the 28 measures to
which it applies. The differences reached p < .05 for three measures and p < .10 for a total of
seven, which is somewhat more than expected by chance, but not to a statistically significant
degree. For instance, the binomial distribution indicates that p = .23 for obtaining three or more
“significant” results by chance in 33 tests. Furthermore, the lowest probability any of these
differences was p = .02, which is far higher than the Bonferroni standard of .0015 for 33
significance tests. To be cautious, we report results from analyses that control for pretest scores.
That control had negligible consequence for the magnitude of estimated program effects, but it
did increase their precision.
Results across the post-test-through-four years post-treatment are consistent with those
found for the one-year post-treatment analyses (see Esbensen et al., 2012); the effect sizes,
however, are somewhat smaller (see Table 2). In the one-year post-treatment analyses, program
impact was significant at the .05 level for a total of 11 of 33 outcomes and an additional three
were marginally significant at the .10 level (pro-social peers, pro-social involvement, and lying
neutralizations). Combining the data for the entire four years (waves 2-6) post-treatment, we find
10 significant differences, including eight of the same outcomes that were significant at one-year
post treatment. The following list identifies the differences for post-test-through-four years post-
treatment; those identified with an asterisk were also noted in the one-year post-treatment
104
This document is a research report submitted to the U.S. Department of Justice. This report has not been published by the Department. Opinions or points of view expressed are those of the author(s)
and do not necessarily reflect the official position or policies of the U.S. Department of Justice.
analyses. Three outcomes were significant at one-year post treatment but not for post-test-
through-four years post treatment (self-centeredness, peer pressure, and delinquent associations).
Lower rates of gang membership (24% reduction in odds)*
More positive attitudes to police (ES = .058)*
More positive attitudes about police in classrooms (ES = .144)*
Less positive attitudes about gangs (ES = .094)*
More use of refusal skills (ES = .049)*
Higher collective efficacy (ES = .096)*
Less use of hitting neutralizations (ES = .079)*
Less anger (ES = .049)*
Higher levels of altruism (ES = .058)
Less risk seeking (ES = .053)
INSERT TABLE 2 ABOUT HERE
With respect to the three specific program goals, the odds of belonging to a gang during
the post-test-through-four years post-program were 24 percent lower for the G.R.E.A.T. students,
and they continued to have more positive attitudes toward the police in general and to officers in
the classroom, compared to non-G.R.E.A.T students. Estimates of program impact did not reach
statistical significance, however, for delinquency (general or violent offending). Importantly, the
treatment group continued to express less favorable attitudes about gangs, and several risk
factors associated with gang membership were also found to be less pronounced among the
G.R.E.A.T. students. Students who had participated in the program were more risk aversive,
expressed better anger control, and employed fewer neutralizations regarding the use of violence
in response to different scenarios. Additionally, as described above, several measures were
105
This document is a research report submitted to the U.S. Department of Justice. This report has not been published by the Department. Opinions or points of view expressed are those of the author(s)
and do not necessarily reflect the official position or policies of the U.S. Department of Justice.
developed and included in the analyses to assess skills taught in the G.R.E.A.T. lessons. For
example, the curriculum teaches (through students’ role-playing) strategies for students to use to
avoid undesired activities in which their friends encourage them to participate. Students in the
treatment group were more apt to report use of these refusal techniques. The G.R.E.A.T. students
also reported higher levels of altruism and collective efficacy; that is, they indicated that they
value doing things for others (e.g., “It feels good to do something without expecting anything in
return”) and that they can make a difference in their communities (e.g., “It is my responsibility to
do something about problems in our community”). These values are reflected in a component of
the G.R.E.A.T. program called the “Making My School a G.R.E.A.T. Place” project. This
G.R.E.A.T. project provides students the opportunity to have an impact on their environment by
improving their school and/or surrounding area. The project is intended to be an ongoing part of
the program and to be completed by the end of the 13th lesson.
In contrast to these positive program effects, our long-term (post-test-through-four-years
post-program) analyses failed to discern a difference between the G.R.E.A.T. students and the
control group on a range of peer-related factors: pro-social peers, peer pressure, negative peer
commitment, positive peer commitment, and delinquent peers. Three of these potential outcomes
were marginally significant (p<.10) in the one-year post-treatment analyses (pro-social peers,
peer pressure, and delinquent peers), suggesting that the peer effect is muted over time. The
program also did not produce statistically significant differences for several social skills or risk
factors emphasized in one or more lessons: conflict resolution, calming others, active listening,
problem solving, empathy, self-efficacy, awareness of services, pro-social involvement,
neutralizations for lying and stealing, guilt, school commitment, self-centeredness, and
impulsivity. The latter two outcomes are sub-components of the larger self-control measure
106
This document is a research report submitted to the U.S. Department of Justice. This report has not been published by the Department. Opinions or points of view expressed are those of the author(s)
and do not necessarily reflect the official position or policies of the U.S. Department of Justice.
developed by Grasmick et al. (1993). Program impact for two other components of self-control
(risk seeking and anger) did reach significance. These aspects of the program that did not
differentiate the groups suggest that perhaps attitudes are more easily influenced than is
behavior. A large proportion of these remaining non-significant factors are social skills variables
representing program components that teach students factual information or how to modify their
behavior (e.g., availability of services, active listening, calming others, problem-solving). That
is, students are instructed on where to find assistance when needed and on the importance of
listening to others when they speak, how to calm others who are upset, and constructive (and
non-violent) ways to solve problems that arise.
Site-Specific Analyses Post-Test-Through-Four Years Post-Treatment
One of the evaluation objectives was to address the transportability of the program. That
is, can G.R.E.A.T. be effectively taught in a variety of settings? To address this issue, we
included seven diverse cities in the study and, in this set of analyses, we explore the extent to
which the aggregate-level differences are replicated in the seven different cities. As seen in Table
3, the findings are quite mixed. At one year post-treatment (the first columns for each site), the
overall findings are largely replicated in three of the sites (Albuquerque, the DFW area site, and
Portland). A few program effects (including lower odds of gang membership) were noted in
Philadelphia, but null findings were found in Greeley, Nashville, and Chicago (see Table 3).
It is important to consider whether these differences across sites in program impact
reflect genuine differences in effectiveness or result from a combination of smaller sample sizes
and chance variation inevitable among estimates of limited precision. Interaction tests give clear
evidence that differences in impact across sites are statistically reliable for only G.R.E.A.T.
attitudes toward police and negative peer commitment. For both, p = .0011, which surpasses the
107
This document is a research report submitted to the U.S. Department of Justice. This report has not been published by the Department. Opinions or points of view expressed are those of the author(s)
and do not necessarily reflect the official position or policies of the U.S. Department of Justice.
Bonferroni corrected value of p < .0015 (for p < .05, 33 tests). For the entire set of 33 outcomes,
a total of 4 tests reached the nominal level of p < .05 and 6 reached the nominal level of p < .10,
which is somewhat more than chance, but not notably so. Also recall that we did not find
significant school level variance in program impact for any outcomes. Whether the differences
among sites reflect chance fluctuations or genuine differences in effectiveness, the results of
Table 3 make clear that any given implementation of the program may or may not achieve results
consistent with the overall average.
The results for site-specific program impact across all four years post-treatment (the
second columns for each site in Table 3) are quite similar to those found at one-year post-
treatment. Once again, results in Albuquerque, Portland, and the Texas site resemble the
aggregate results. Philadelphia experienced a few positive outcomes, while Chicago and Greeley
once again had null findings. For post-test-through-four years post-treatment, however, the
G.R.E.A.T. students in Nashville reported five negative program effects (more susceptibility to
peer pressure, more commitment to negative peers, less school commitment, and greater
neutralizations for lying and stealing). Overall, the site-specific results are fairly robust with the
post-test-through-four years post-treatment results quite similar overall to those found for one-
year post-treatment with the caveat that the one-year post-treatment effect sizes, as is the case
with the full-sample results, are somewhat larger.
INSERT TABLES 3 ABOUT HERE
Pre-existing Risk Analyses Post-Test-through-Four Years Post-Treatment
To test for the possibility that the G.R.E.A.T. program may be more suitable for high-risk
youth, we used Wave 1 data to identify students at risk for gang membership. Specifically, we
used sex, race/ethnicity, and 35 attitudinal and behavioral measures (the 33 outcome measures
108
This document is a research report submitted to the U.S. Department of Justice. This report has not been published by the Department. Opinions or points of view expressed are those of the author(s)
and do not necessarily reflect the official position or policies of the U.S. Department of Justice.
plus school and community disorder) from wave 1 as predictors of being a gang member in any
subsequent wave (i.e., waves 2 through 6). Then we saved the predicted probabilities as the risk
measure. While there is no set standard for classifying risk, we dichotomized the risk measure
and identified the top 25% as at risk (a method used, e.g., by Farrington and Loeber, 2000; Hill
et al., 1999). To minimize missing data, we substituted scale means for any missing Wave 1
predictors when computing the risk score. None of the treatment by risk interactions is
significant, but to test for the possibility that effects may change over time, we also examined
risk by treatment by time interactions. A number of significant three way interactions emerged,
and the pattern is consistent. The three way interactions suggest that most of the beneficial
impact is associated with the high-risk students in the early waves and that the treatment/control
difference for high-risk youth fades over time. There is some evidence that the treatment is
increasingly beneficial for low-risk youths over time, but that pattern is far from consistent.
Table 4 provides a summary of the analyses of differential impact in relation to risk. The
variables are coded so the main effects retain their original meaning.11 Four of the 33 risk by
treatment interactions reached the .1 level of significance but none reached the .05 level, a
pattern that could easily arise by chance. Twelve of the three-way interactions (risk by treatment
by time) were significant at the .05 level and four more reached the .1 level. Furthermore,
significance levels for three outcomes surpassed the Bonferroni correction criterion of p < .0015,
a total of seven reached p < .01, giving strong evidence of genuine rather than chance effects for
the dataset as a whole. Figures 1 and 2 provide examples of the three-way interactions for the
four combinations of high vs. low risk and G.R.E.A.T. vs. control. Figure 1 shows that, for
G.R.E.A.T. attitudes toward police, the treatment and control groups are comparable at the
11 The overall impact effects reported are similar to, but not exactly the same as, those reported for the aggregate level analyses above (Table 2) due to the fact that this model adds risk level as a predictor and all its interactions with treatment condition and time (both linear and squared).
109
This document is a research report submitted to the U.S. Department of Justice. This report has not been published by the Department. Opinions or points of view expressed are those of the author(s)
and do not necessarily reflect the official position or policies of the U.S. Department of Justice.

pretest for both high risk and low risk youth. In waves 2 and 3, the treatment group shifts toward
more favorable attitudes than the control group, and the resulting difference is more pronounced
among high-risk youth. Over waves 4 through 6, the treatment versus control difference largely
disappears for the high-risk youth, while a moderate difference remains for the low risk youth.
For gang membership, Figure 2 shows that, among the high-risk youth, a somewhat higher
proportion of control rather than treatment youth were gang members, and the G.R.E.A.T.
program led to greater reductions in membership for the treatment group than controls through
waves 2 and 3. By wave 6, however, this treatment effect was no longer apparent. Rates of gang
membership were much lower in the low-risk group, of course, but we see suggestions of a
beneficial program effect gradually emerging so that at wave 6, the rate of gang membership was
only half as high in the treatment group as the control group.
INSERT TABLE 4 ABOUT HERE
INSERT FIGURES 1 & 2 ABOUT HERE
Discussion
Schools are a desirable location to offer universal programs with an emphasis on
preventing an array of adolescent problem behaviors including bullying, drug use, dating
violence, gang affiliation, and others (Jimerson, Nickerson, Mayer, and Furlong, 2012). While
school-based violence prevention/intervention programs are widespread, knowledge of their
effectiveness is often lacking (Alford and Derzon, 2012; Gottfredson, 2001). Given teacher and
administrator concern about the “loss of instructional time” to non-academic activities, school
administrators increasingly rely upon “evidence-based practices” when making decisions about
110
This document is a research report submitted to the U.S. Department of Justice. This report has not been published by the Department. Opinions or points of view expressed are those of the author(s)
and do not necessarily reflect the official position or policies of the U.S. Department of Justice.
which, if any, programs to allow into their schools. The G.R.E.A.T. program is one primary
prevention program that, based on our evaluation, holds promise.
In addition to increased placement of prevention programming in schools, the past twenty
years have seen a rise in the presence of police officers on school campuses, as both School
Resource Officers (e.g., Finn and McDevitt, 2005; Na and Gottfredson, 2011; Petteruti, 2011)
and prevention program providers (e.g., DARE and G.R.E.A.T.). The research reported here
addresses the efficacy of a program that utilizes law enforcement officers to deliver a gang
prevention and violence reduction program.
The G.R.E.A.T. program is one choice that school administrators have when selecting
from a vast list of prevention programs. G.R.E.A.T. is currently rated as "promising" by OJJDP
and by Crime Solutions, and designated as "Level 2" (effective) in the Helping America’s Youth
rating scale (www.findyouthinfo.gov). These designations, while initially based upon findings
from two previously published evaluations of the original G.R.E.A.T. program, have
incorporated and are now based on the short-term results reported from the current evaluation of
the revised G.R.E.A.T. program (Esbensen et al., 2012). To recap those earlier studies, a cross-
sectional study conducted in 1995 found that G.R.E.A.T. students were substantially “better”
than non-G.R.E.A.T. students on a variety of attitudinal and behavioral outcomes (Esbensen and
Osgood, 1999). A more rigorous longitudinal evaluation conducted between 1995 and 1999
found less support for the program (in terms of the number of significant differences, effect
sizes, and the presence of delayed—rather than immediate--effects) (Esbensen et al., 2001). Still,
due to the fact that most of the results were in the direction of positive programmatic effects,
G.R.E.A.T. was deemed by raters as a program holding “promise.” This was particularly true
111
This document is a research report submitted to the U.S. Department of Justice. This report has not been published by the Department. Opinions or points of view expressed are those of the author(s)
and do not necessarily reflect the official position or policies of the U.S. Department of Justice.

given the relatively short program dosage (i.e., nine one-hour lessons delivered over a span of
nine weeks).
Previous critiques of the original program and earlier evaluations raised several concerns.
First, some commentators labeled G.R.E.A.T. a “failed program” based on a lack of significant
effects on delinquency or gang membership (Ludwig, 2005; Klein and Maxson, 2006).
Additionally, when positive programmatic effects were found between G.R.E.A.T. and non-
G.R.E.A.T. students, effect sizes were modest (Klein and Maxson, 2006). Third, two well-known
gang researchers suggested that the lack of significant program effects were not surprising, given
the program’s emphasis on factors related to general delinquency (as opposed to gang-specific
issues), its modeling after the failed DARE program, and the fact that it targeted a population at
low risk of gang involvement (Klein and Maxson, 2006). Finally, the earlier longitudinal
evaluation was criticized for the extent of sample attrition occurring during the examination
period (Ludwig, 2005).
The G.R.E.A.T. program underwent a substantial overhaul following a curriculum review
(see Esbensen et al., 2002; Esbensen et al., 2011, for a detailed account of the program review).
Many of the changes were sparked by findings from these early evaluations. The program was
expanded from nine to 13 lessons, and substantial effort was made to link specific program
lessons to evidence-based risk factors for gang joining and delinquency found in prior research.
Practitioners and researchers versed in gangs and school-based prevention were brought together
to offer suggestions for program modifications. Then, professional curriculum writers were
employed to develop the specific program lessons. This effort led to the “revised” G.R.E.A.T.
program that is the focus of the current study.
112
This document is a research report submitted to the U.S. Department of Justice. This report has not been published by the Department. Opinions or points of view expressed are those of the author(s)
and do not necessarily reflect the official position or policies of the U.S. Department of Justice.
After the revised program was fully implemented in 2003, there was a renewed interest in
assessing the effectiveness of the G.R.E.A.T. program. Our most recent work (Esbensen et al.,
2012), based on a longitudinal evaluation design that included full random assignment and
improved active consent and retention rates, reported that a relatively low dosage (13 lessons)
primary prevention program can have measurable effects on a diverse sample of students one-
year post-treatment. The current manuscript extends that research by reporting the results of
treatment effects up to four years post-treatment. We also address two additional questions: (1)
were the aggregate results replicated in each of the seven study sites; and (2) did the results vary
based on youths’ pre-existing levels of risk?
G.R.E.A.T. Goals and Objectives
The post-test-to-four-year post-program analyses examined direct effects of G.R.E.A.T.
on the three main program goals (preventing gang involvement, reducing delinquency and
violence, and improving views of law enforcement) as well as on a number of risk factors
associated with gang affiliation that were targeted in the curriculum. Results identify positive
program effects on a number (10 of 33) of these program objectives. Compared with students in
the control classrooms, students in G.R.E.A.T. classrooms expressed more positive attitudes to
the police and lower odds of gang membership. They also reported more use of refusal skills;
lower support for neutralizations regarding violence; less favorable attitudes about gangs; lower
levels of risk-seeking and anger; higher levels of altruism; and a higher degree of collective
efficacy. It is important to highlight that eight of the ten differences found across four years post-
treatment were also evident among the eleven differences one-year post-program delivery,
indicating a sustained, long-term program effect on those outcomes.
113
This document is a research report submitted to the U.S. Department of Justice. This report has not been published by the Department. Opinions or points of view expressed are those of the author(s)
and do not necessarily reflect the official position or policies of the U.S. Department of Justice.
The effect sizes are small (and program rating schemes weight this important aspect of
program impact) and this fact remains a criticism lodged by reviewers and by rating schemes.
The Blueprints program, for example, declined to classify the revised program as “promising,”
due in large part to the small effect sizes (personal communication from Sharon Mihalic, 2013).
In our view, that assessment fails to take into account the limited scope and cost of the
G.R.E.A.T. program. It is important to note that we are independent evaluators, not program
developers, and we have no stake in this program’s success, financially or otherwise. From our
first introduction to the G.R.E.A.T. program in the early 1990s, our shared sentiment was and
remains skeptical that there would be a measurable effect of a nine- or thirteen-lesson program
with the average lesson being less than 40 minutes, further diluted by absenteeism and
scheduling issues. Finding such beneficial program effects across multiple studies has surprised
us, and their consistency forces us to take them seriously. We ask not only ourselves, but the
critics as well, what effect size is reasonable to expect given the low dosage and the general
audience targeted by this program, and how large must the effects be to justify the use of a
program requiring such limited investment?
The revised program and the most recent evaluation design overcome many of the
limitations critics noted for the original program and evaluations of it. The program itself is now
more “evidence-based,” focused on key risk factors found to be important for gang joining.
Additionally, more pedagogically-sound strategies (such as active learning as opposed to didactic
lecture) comprise a bulk of the program lessons. These two factors provide reason for optimism
that the revised program should be more effective at preventing gang membership than its
original configuration. These program revisions may be responsible for the divergence in
findings related to gang membership between the current evaluation and its earlier counterparts.
114
This document is a research report submitted to the U.S. Department of Justice. This report has not been published by the Department. Opinions or points of view expressed are those of the author(s)
and do not necessarily reflect the official position or policies of the U.S. Department of Justice.
Specifically, the increased focus of the revised curriculum on theoretically- and empirically-
based risk factors for gang joining, coupled with a more effective “skills-based” programmatic
structure, may be the primary reasons why the current study finds G.R.E.A.T. participants report
reduced odds of gang joining, relative to their non-G.R.E.A.T. counterparts. Conversely,
programmatic effects may be more easily uncovered based upon the higher rates of study
participation relative to the previous longitudinal study.
All this being said and despite a number of significant effects in favor of the G.R.E.A.T.
program, our current results also include a good number of effects that failed to reach statistical
significance. Below we focus specifically on some of the findings among the social skills and
peer-related measures. We focus on these two areas because of consistent (non-)effects. Before
discussing them, however, we remind readers that chance may well be the source of the weaker
results for these outcomes. The lack of significance is definitely not proof of “no effect,” and
differences in program impact between these outcomes and the others are rarely if ever
statistically significant (judging from their standard errors and implied confidence intervals).
Social skills.
Our overall lack of findings with regard to a number of social skills may engender
disappointment. In discussing the lack of change in a number of skills among G.R.E.A.T.
students, we speculated previously that effecting attitude change may be easier than stimulating
behavioral change. That is, there were a greater proportion of attitudinal than skills-based
behavioral changes among the significant differences found between G.R.E.A.T. and control
students, and a greater proportion of skills-based factors among the non-significant differences.
One skill for which we did find a significant difference, however, was G.R.E.A.T. students’
greater use of refusal skills. In our classroom observations of lesson delivery, we noted that this
115
This document is a research report submitted to the U.S. Department of Justice. This report has not been published by the Department. Opinions or points of view expressed are those of the author(s)
and do not necessarily reflect the official position or policies of the U.S. Department of Justice.
component, more than other social skills components, utilized role-plays between students and
the officer, with the officer attempting to lure the student into deviant behavior and the student
practicing a host of methods to resist involvement. Students relished this exercise, actively
paying attention and participating. We suggest it is possible that students’ greater interest in and
ability to practice this skill may have produced the positive results, and that offering students
more opportunity to rehearse the other social skills may yield the intended programmatic effect.
Peer effects.
Two of the three program effects (resistance to peer pressure and association with
delinquent peers) that were found one-year post-treatment but not for the full four years post-
treatment are related to the role of the peer group, and one additional peer outcome that reached
marginal significance (p<.10) at one year post-treatment also failed to reach significance across
the entire four years post-treatment. Two other peer-related variables (commitment to positive
and to negative peers) also failed to reach significance at both time periods. These results raise
two issues: (1) can an individual-targeted program impact peer factors, and (2) if yes, can these
results be sustained over time? The answer to the first question is mixed; there were modest
differences between treatment and control students on the peer-related outcomes and risk factors
at one-year post-treatment. The answer to the second question appears to be no; for the four
years post-treatment as a whole, peer-related differences for the full sample were no longer
statistically significant. These results, while disappointing, may perhaps be expected: Peers play
a major role in the lives of adolescents and a few brief lessons encouraging youth to avoid
negative peer influences may not be sufficient to overcome these influences to achieve the
intended outcome.12
12 We temper this with the reminder that program effects appear to vary by site and at least in one site, the program does produce significant and lasting differences on peer-related variables.
116
This document is a research report submitted to the U.S. Department of Justice. This report has not been published by the Department. Opinions or points of view expressed are those of the author(s)
and do not necessarily reflect the official position or policies of the U.S. Department of Justice.
Program Effects by Site
Some questions are raised by the site-specific results regarding the utility of the
G.R.E.A.T. program as a general gang prevention program, applicable in a variety of settings.
Three quite diverse cities (Albuquerque, a Dallas-Fort Worth suburb, and Portland) experienced
program results similar to the larger sample. These sites represent cities with a large Hispanic
population (Albuquerque), a city that has the largest percentage of white residents in the U.S.A.
(Portland), and a city that is part of a large megalopolis (the DFW area site). One city has a long
history of gangs (Albuquerque) while the other two have relatively new gang problems. The
cities with null findings are also quite diverse – one is among the largest cities in the nation
(Chicago) with pockets of extreme disadvantage and high rates of violent crime while the other
city (Greeley) is the smallest in the sample (less than 100,000 inhabitants) but with a pronounced
gang problem that emerged in the past two decades. A few program effects (notably, lower odds
of gang involvement and less positive attitudes about gangs) were found in Philadelphia, a city
similar to Chicago in a number of ways, being large and having neighborhoods facing long-
standing poverty, violence, and gang activity.
These findings highlight the importance of conducting multi-site evaluations, not only to
assess the transportability of the program or policy but to allow for the possibility that contextual
effects in some sites may not allow for the detection of program effects (Type II error). For
example, while one of our considerations in selecting the final sites for the evaluation was
program saturation (i.e., we excluded sites in which the G.R.E.A.T. program had a long history,
thereby introducing the possibility of program contamination in the control group), it was only
after agreements had been obtained that we learned that the Nashville Police Department had an
extensive involvement in the schools, teaching the G.R.E.A.T. elementary-level component in
117
This document is a research report submitted to the U.S. Department of Justice. This report has not been published by the Department. Opinions or points of view expressed are those of the author(s)
and do not necessarily reflect the official position or policies of the U.S. Department of Justice.
third or fourth grade, DARE in fifth grade, and then the G.R.E.A.T. middle school component in
sixth grade, as well as a DARE booster session in 9th grade . Thus, the absence of a positive
program effect in Nashville may be an artifact of this police saturation in the schools.
Trying to make sense of these site-specific differences led us to consider a number of
potential explanations. First, it is essential to keep in mind that differences of this magnitude are
little more than would be expected by chance alone. Next, we revisited the results and considered
a number of potential school factors (e.g., school size, school characteristics, and student
demographics) but could not isolate factors that shed light on the findings. As part of another
project we revisited all of the cities, schools, and neighborhoods in the hope that we would be
able to observe neighborhood characteristics that could help explain the disparate results, but
again, we gained no satisfactory insights.
We also examined the possibility that the site differences reflect differential program
implementation fidelity.13 Fortunately our research design allowed us to examine this possibility
as we went to great lengths to assess officer implementation fidelity by observing 492 unique
G.R.E.A.T. classroom deliveries and assigning a fidelity score (ranging from 1 to 5) to each
classroom (for more information on the assessment of implementation fidelity, see Esbensen,
Matsuda, Taylor, and Peterson, 2011). Analyses failed to identify significant differential program
effects associated with program quality; only one of the 33 potential outcomes (attitudes toward
officers in the classroom) showed a more favorable outcome for students in classrooms in which
officers implemented the program with increased fidelity (p < .05). One possibility for the
13 Given the literature regarding the importance of implementation fidelity, we investigated the relationship of program impact to the quality of G.R.E.A.T. program delivery. Each of the officers was observed an average of 15 times by trained research assistants. To address this question, we added to the base model the two-way interaction of the officer rating with classroom treatment assignment and the three-way interactions of officer rating and treatment assignment with linear and quadratic change. We avoid confounding these interactions with overall treatment effects by grand mean centering the officer rating and assigning all control classrooms the mean officer rating.
118
This document is a research report submitted to the U.S. Department of Justice. This report has not been published by the Department. Opinions or points of view expressed are those of the author(s)
and do not necessarily reflect the official position or policies of the U.S. Department of Justice.
overall null finding is that 27 of the 33 officers implemented the program with good to excellent
fidelity. Only three officers were deemed to have not implemented the program (one each in
Albuquerque, Greeley, and Philadelphia) and three (one each in the DFW site, Nashville, and
Chicago) to have marginal implementation. A seventh officer was deemed to have implemented
the program in three classrooms but, due to classroom management issues, failed to implement
the program in two other classrooms. Given the overall program fidelity, there may have been
insufficient statistical power to detect implementation effect.
Program Effects by Pre-existing Risk
The findings for pre-existing risk are complex but straight-forward. While we did not find
any risk by treatment interaction effects, we did uncover a pattern of three-way interaction of risk
by treatment by time. The three way interactions suggest that most of the beneficial impact is
associated with the high-risk students in the early waves and that the treatment/control difference
for high-risk youth fades over time. There is some evidence that the treatment is increasingly
beneficial for low-risk youths over time, but that pattern is far from consistent. What these
findings mean for universal versus targeted gang prevention programming is therefore somewhat
ambiguous, though the suggestion may be that high-risk students (as demonstrated in prior
research) have greater gains than do low-risk students, especially in the short-term, but that low-
risk students also receive program benefits.
Conclusions
The research team responsible for the current evaluation conducted the original
G.R.E.A.T. studies in the 1990s (an 11-city cross-sectional study and a 6-city longitudinal quasi-
experimental study). Our familiarity with the original program and the evaluation designs and
119
This document is a research report submitted to the U.S. Department of Justice. This report has not been published by the Department. Opinions or points of view expressed are those of the author(s)
and do not necessarily reflect the official position or policies of the U.S. Department of Justice.
subsequent results facilitate our ability to place the current results within the larger context of
school-based gang prevention programs. While we have familiarity with the program as
evaluators and did provide recommendations regarding program content and delivery based on
findings from our first evaluation, it is important to emphasize that we have not been involved in
program development; our sole role has been as program evaluators. We note that findings of
positive program effects are unfortunately rare in independent prevention trials (Eisner, 2009).
Our earlier studies of the original G.R.E.A.T. curriculum found a one-year post-treatment
program effect in the cross-sectional study (see Esbensen and Osgood, 1999) but no effect was
observed at that time period in the longitudinal quasi-experimental design (Esbensen et al.,
2001). In that latter study, we did find a sleeper or lagged effect (3 and 4 years post-treatment)
for five outcomes: more favorable attitudes to police, lower victimization, more negative
attitudes about gangs, more pro-social peers, and less risk-seeking behavior. Contrary to that
earlier longitudinal study, the current longitudinal experimental study of the revised G.R.E.A.T.
curriculum did find a positive program effect one-year post-treatment. Importantly, three of the
lagged program effects found across four years post-treatment in the earlier study were replicated
here for effects across the four years (more favorable attitudes to the police, more negative
attitudes about gangs, and less risk seeking). While the original program had no appreciable
short- or long-term effect on gang involvement, evaluation of the revised program found reduced
odds of gang membership (39% for the first 12 months and 24% across the entire 48 months
post-program). Given the results of the current evaluation, it is important to re-state that the
G.R.E.A.T. program underwent a major review and revision subsequent to the earlier evaluation
results. The original G.R.E.A.T. program was a “canned” nine lesson program with an emphasis
on didactic teaching methods. The current 13 lesson G.R.E.A.T. curriculum emphasizes skills
120
This document is a research report submitted to the U.S. Department of Justice. This report has not been published by the Department. Opinions or points of view expressed are those of the author(s)
and do not necessarily reflect the official position or policies of the U.S. Department of Justice.
building and the use of cooperative learning strategies – both strategies borrowed from other
school-based “model” or acclaimed programs.
The fact that both evaluations (of the original and revised program) found decidedly more
favorable attitudes toward the police among the G.R.E.A.T. students suggests that this kind of
law enforcement-based prevention program can have a positive impact on youth-police relations.
This is particularly important given recent findings that perceptions of police legitimacy are
often muted among gang members (particularly those embedded in criminal networks), a factor
associated with their increased involvement in crime (Papachristos, Meares, and Fagan, 2012). It
is also important to note that studies of both the original and the revised curriculum produced
evidence that the G.R.E.A.T. program is associated with more negative views of gangs. We view
these similarities in findings as suggestive of an overall consistency in the program and further
speculate that the additional program effects of the revised G.R.E.A.T. program are likely a
result of the revised and enhanced curriculum.
The current study is not without limitations. Study participants were enrolled in public
schools in seven U.S. cities. Students who attended private schools, other districts, those whose
parents declined participation, and those who were absent during survey administration periods
were not included. We attempted to survey as many eligible students as possible, making more
than 10 trips to schools to try to reach those who were habitually truant or otherwise unavailable.
We also attempted to survey students who transferred schools within the original and adjacent
districts; those who moved to districts outside of the original metro areas were typically lost.
Consequently, we may have lost a disproportionate share of gang members and other “at risk”
youth. Additionally, we have no alternative measures of delinquency or gang membership other
121
This document is a research report submitted to the U.S. Department of Justice. This report has not been published by the Department. Opinions or points of view expressed are those of the author(s)
and do not necessarily reflect the official position or policies of the U.S. Department of Justice.

than the students’ self-reports. Future studies may find it useful to collect measures of school
disciplinary reports, police reports, and other indicators.
The G.R.E.A.T. program is no panacea for the gang problems confronting many schools
and neighborhoods. However, our findings suggest that G.R.E.A.T. holds promise as a primary
gang prevention program, overall and in several of our seven individual research sites. While it is
important to note that the effect sizes are small (ranging from .05 to .14 over 48 months post-
treatment), it is equally important to emphasize that this is a low dosage program. The
curriculum consists of 13 lessons, generally delivered once a week in less than 40 minutes.
Further, realities of program delivery such as student absenteeism, teacher announcements, fire
drills, snow days, officer illness, and shortened day schedules mean that most of the G.R.E.A.T.
students do not receive the full recommended dosage. That statistically significant differences
were found for 11 outcome measures (and another three with marginal significance) twelve
months post-treatment and for 10 measures across four years post-treatment we find quite
surprising and certainly promising.
122
This document is a research report submitted to the U.S. Department of Justice. This report has not been published by the Department. Opinions or points of view expressed are those of the author(s)
and do not necessarily reflect the official position or policies of the U.S. Department of Justice.
References Alford, Aaron A., and James Derzon. 2012. Meta-analysis and systematic review of the
effectiveness of school-based programs to reduce multiple violent and antisocial
behavioral outcomes. In Handbook of School Violence and School Safety: International
Research and Practice, edited by S. R. Jimerson, A. B. Nickerson, M. J. Mayer and M. J.
Furlong. New York: Routledge.
Andrews, D.A., Ivan Zinger, Robert D. Hoge, James Bonta, Paul Gendreau, and Francis T.
Cullen. 1990. Does correctional treatment work? A clinically relevant and
psychologically informed meta-analysis. Criminology 38:369-404.
Battin, Sara R., Karl G. Hill, Robert D. Abbott, Richard F. Catalano, and J. David Hawkins.
1998. The contribution of gang membership to delinquency beyond delinquent friends.
Criminology 36:93-115.
Catalano, Richard F., Michael W. Arthur, J. David Hawkins, Lisa Berglund, and Jeffrey J. Olson.
1998. Comprehensive community- and school-based interventions to prevent antisocial
behavior. In Serious and Violent Juvenile Offenders: Risk Factors and Successful
Interventions, edited by R. Loeber and D. P. Farrington. Thousand Oaks, CA: Sage
Publications, Inc.
Covey, Herbert C. 2010. Street Gangs Throughout the World, second edition. Springfield, IL:
Charles C. Thomas Publishers.
Dusenbury, Linda, and Gilbert J. Botvin. 1992. Competence enhancement and the development
of positive life options. Journal of Addictive Diseases 11:29-45.
Eisner, Manuel. 2009. No effects in independent prevention trials: can we reject the cynical
view? Journal of Experimental Criminology 5: 163-183.
123
This document is a research report submitted to the U.S. Department of Justice. This report has not been published by the Department. Opinions or points of view expressed are those of the author(s)
and do not necessarily reflect the official position or policies of the U.S. Department of Justice.
Esbensen, Finn-Aage, and Elizabeth P. Deschenes. 1998. A mulitsite examination of youth gang
membership: Does gender matter? Criminology 36:799-828.
Esbensen, Finn-Aage, Adrienne Freng, Terrance J. Taylor, Dana Peterson, and D. Wayne
Osgood. 2002. Putting research into practice: The national evaluation of the Gang
Resistance Education and Training (G.R.E.A.T.) program. In Responding to gangs:
Evaluation and Research, edited by W. L. Reed and S. H. Decker. Washington, D.C.:
U.S. Department of Justice, National Institute of Justice.
Esbensen, Finn-Aage, and David Huizinga. 1993. Gangs, drugs, and delinquency in a survey of
urban youth. Criminology 31:565-589.
Esbensen, Finn-Aage, David Huizinga, and Anne W. Weiher. 1993. Gang and non-gang youth:
Differences in explanatory factors. Journal of Contemporary Criminal Justice 9:94-116.
Esbensen, Finn-Aage, Kristy N. Matsuda, Terrance J. Taylor, and Dana Peterson. 2011. Multi-
method strategy for assessing program fidelity: The national evaluation of the revised
G.R.E.A.T. program. Evaluation Review 35:14-39.
Esbensen, Finn-Aage, and Cherly L. Maxson. 2013. Youth Gangs in International Perspective:
Results from the Eurogang Program of Research. New York, NY: Springer.
Esbensen, Finn-Aage, Chris Melde, Terrance J. Taylor, and Dana Peterson. 2008. Active
parental consent in school-based research: How much is enough and how do we get it?
Evaluation Review 32:335-362.
Esbensen, Finn-Aage, and D. Wayne Osgood. 1999. Gang resistance education and training
(GREAT): Results from the national evaluation. Journal of Research in Crime and
Delinquency 36:194-225.
124
This document is a research report submitted to the U.S. Department of Justice. This report has not been published by the Department. Opinions or points of view expressed are those of the author(s)
and do not necessarily reflect the official position or policies of the U.S. Department of Justice.
Esbensen, Finn-Aage, D. Wayne Osgood, Terrance J. Taylor, Dana Peterson, and Adrienne
Freng. 2001. How great is G.R.E.A.T.?: Results from a quasi-experimental design.
Criminology and Public Policy 1:87-118.
Esbensen, Finn-Aage, Dana Peterson, Terrance J. Taylor, and Adrienne Freng. 2010. Youth
Violence: Sex and Race Differences in Offending, Victimization, and Gang Membership.
Philadelphia: Temple University Press.
Esbensen, Finn-Aage, Dana Peterson, Terrance J. Taylor, Adrienne Freng, D. Wayne Osgood,
Dena C. Carson, and Kristy N. Matsuda. 2011. "Evaluation and evolution of the Gang
Resistance Education and Training (G.R.E.A.T.) Program." Journal of School Violence
10:53-70.
Esbensen, Finn-Aage, Dana Peterson, Terrance J. Taylor, and D. Wayne Osgood. 2012. Results
from a multi-site evaluation of the G.R.E.A.T. program. Justice Quarterly 29:125-151.
Esbensen, Finn-Aage, Jr. Winfree, L. Thomas, Ni He, and Terrance J. Taylor. 2001. Young
gangs and definitional issues: When is a gang a gang and why does it matter? Crime &
Delinquency 47:105-130.
Farrington, David P., and Rolf Loeber. 2000. Some benefits of dichotomization in psychiatric
and criminological research. Criminal Behavior and Mental Health 10:100-122.
Finn, Peter, and Jack McDevitt. 2005. National Assessment of School Resource Officer
Programs: Final Project Report. Abt Associates, Inc.: Available online
at: http://www.ncjrs.gov/pdffiles1/nij/grants/209273.pdf.
Gottfredson, Denise C. 2001. Schools and Delinquency. New York, NY: Cambridge University
Press.
125
This document is a research report submitted to the U.S. Department of Justice. This report has not been published by the Department. Opinions or points of view expressed are those of the author(s)
and do not necessarily reflect the official position or policies of the U.S. Department of Justice.
Gravel, Jason, Martin Bouchard, Karine Descormiers, Jennifer S. Wong, and Carlo Morselli.
2013. Keeping promises: A systematic review and new classification of gang control
strategies. Journal of Criminal Justice 41: 228-241.
Grasmick, Harold G., Charles R. Tittle, Robert J. Bursik, and Bruce J. Arneklev. 1993. Testing
the core empirical implications of Gottfredson and Hirschi's General Theory of Crime.
Journal of Research in Crime and Delinquency 30:5-29.
Hagedorn, John M. 2008. A World of Gangs: Armed young men and gangsta culture.
Minneapolis, MN: University of Minnesota Press.
Hill, Karl G., James C. Howell, J. David Hawkins, and Sara R. Battin-Pearson. 1999. Childhood
risk factors for adolescent gang membership: Results from the Seattle Social
Development Project. Journal of Research in Crime and Delinquency 36:300-322.
Howell, James C. 2009. Preventing and Reducing Juvenile Delinquency: A comprehensive
Framework. Thousand Oaks, CA: Sage Publications, Inc.
———. 2012. Gangs in America's Communities. Thousand Oaks, CA: Sage Publications, Inc.
Howell, James C., and Arlen Egley, Jr. 2005. Gangs in Small Towns and Rural Areas. NYGC
Bulletin., edited by OJJDP. US Department of Justice. Washington, D.C.
Jimerson, Shane R., Amanda B. Nickerson, Matthew J. Mayer, and Michael J. Furlong, eds.
2012. Handbook of School Violence and School Safety: International Research and
Practice. 2nd ed. New York: Routledge.
Klein, Malcolm W., and Cheryl L. Maxson. 2006. Street Gang Patterns and Policies. New York:
Oxford University Press.
Lipsey, Mark W. 2009. The primary factors that characterize effective interventions with
juvenile offenders: A meta-analysis review. Victims and Offenders 4:124-147.
126
This document is a research report submitted to the U.S. Department of Justice. This report has not been published by the Department. Opinions or points of view expressed are those of the author(s)
and do not necessarily reflect the official position or policies of the U.S. Department of Justice.

Ludwig, Jens. 2005. Better gun enforcement, less crime. Criminology and Public Policy 4: 677-
716.
Maxson, Cheryl L., Jr. Egley, Arlen, Jody Miller, and Malcolm W. Klein, eds. 2013. The Modern
Gang Reader. 4th ed. New York: Oxford University Press.
Maxson, Cheryl L., and Monica L. Whitlock. 2002. Joining the gang: Gender differences in risk
factors ofr gang membership. In Gangs in America III, edited by C. R. Huff. Thousand
Oaks, CA: Sage.
Maxson, Cheryl, Monica L. Whitlock, and Malcolm W. Klein. 1998. Vulnerability to street gang
membership: Implications for practice. Social Service Review March:70-91.
Mihalic, Sharon F., Abigail A. Fagan, Katherine Irwin, Diane Ballard, and Delbert S. Elliott.
2002. Blueprints for Violence Prevention Replications: Factors for Implementation
Success. Colorado: University of Colorado, Center for the Study and Prevention of
Violence.
Mihalic, Sharon F., and Katherine Irwin. 2003. Blueprints for Violence Prevention: From
Research to Real-World Settings—Factors Influencing the Successful Replication of
Model Programs. Youth Violence and Juvenile Justice 1 (4):307-329.
Na, Chongmin, and Denise C. Gottfredson. 2011. Police officers in schools: Effects of school
crime and the processing of offending behaviors. Justice Quarterly.
Office of Juvenile Justice and Delinquency Prevention. 2010. Model Programs
Guide. http://www.ojjdp.gov/mpg/
Papachristos, Andrew V., Tracy L. Meares, and Jeffrey Fagan. 2012. Why do criminals obey the
law? The influence of legitimacy and social networks on active gun offenders. Journal of
Criminal Law and Criminology 102: 397-440.
127
This document is a research report submitted to the U.S. Department of Justice. This report has not been published by the Department. Opinions or points of view expressed are those of the author(s)
and do not necessarily reflect the official position or policies of the U.S. Department of Justice.
Peterson, Dana, and Kirstin A. Morgan. Forthcoming. Sex differences and the overlap in risk
factors for gang membership and violence. Journal of Crime and Justice.
Petteruti, Amanda. 2011. Education Under Arrest: The Case Against Police in Schools.
Washington, D.C.: Justice Policy Institute.
Pyrooz, David C., Andrew M. Fox, and Scott H. Decker. 2010. Racial and ethnic heterogeneity,
economic disadvantage, and gangs: A macro-level study of gang membership in urban
America. Justice Quarterly 27:867-892.
Rasbash, Jon, Fiona Steele, William J. Browne, and Harvey Goldstein. 2009. A User's Guide to
MLwiN, Version 2.10. Bristol, U.K.: Bristol University.
Reed, Winifred L., and Scott H. Decker. 2002. Responding to gangs: Evaluation and Research.
Washington, D.C.: U.S. Department of Justice, National Institute of Justice.
Sherman, Lawrence W., Denise C. Gottfredson, Doris MacKenzie, John Eck, Peter Reuter, and
Shawn D. Bushway. 1997. Preventing Crime: What Works, What Doesn't, What's
Promising. Washington, D.C.: Department of Justice, Office of Justice Programs.
Thornberry, Terence P. 1998. Membership in youth gangs and involvement in serious and
violent offending. In Serious and Violent Juvenile Offenders: Risk Factors and
Successful Interventions, edited by R. Loeber and D. P. Farrington. Thousand Oaks, CA:
Sage Publications, Inc.
Thornberry, Terence P., Marvin D. Krohn, Alan J. Lizotte, C. A. Smith, and Kimberly Tobin.
2003. Gangs and Delinquency in Developmental Perspective. New York: Cambridge.
Winfree, Jr. L. Thomas, Dana Peterson Lynskey, and James R. Maupin. 1999.
Developing local police and federal law enforcement partnerships: G.R.E.A.T. as
a case study of policy implementation. Criminal Justice Review 24:145-168.
128
This document is a research report submitted to the U.S. Department of Justice. This report has not been published by the Department. Opinions or points of view expressed are those of the author(s)
and do not necessarily reflect the official position or policies of the U.S. Department of Justice.
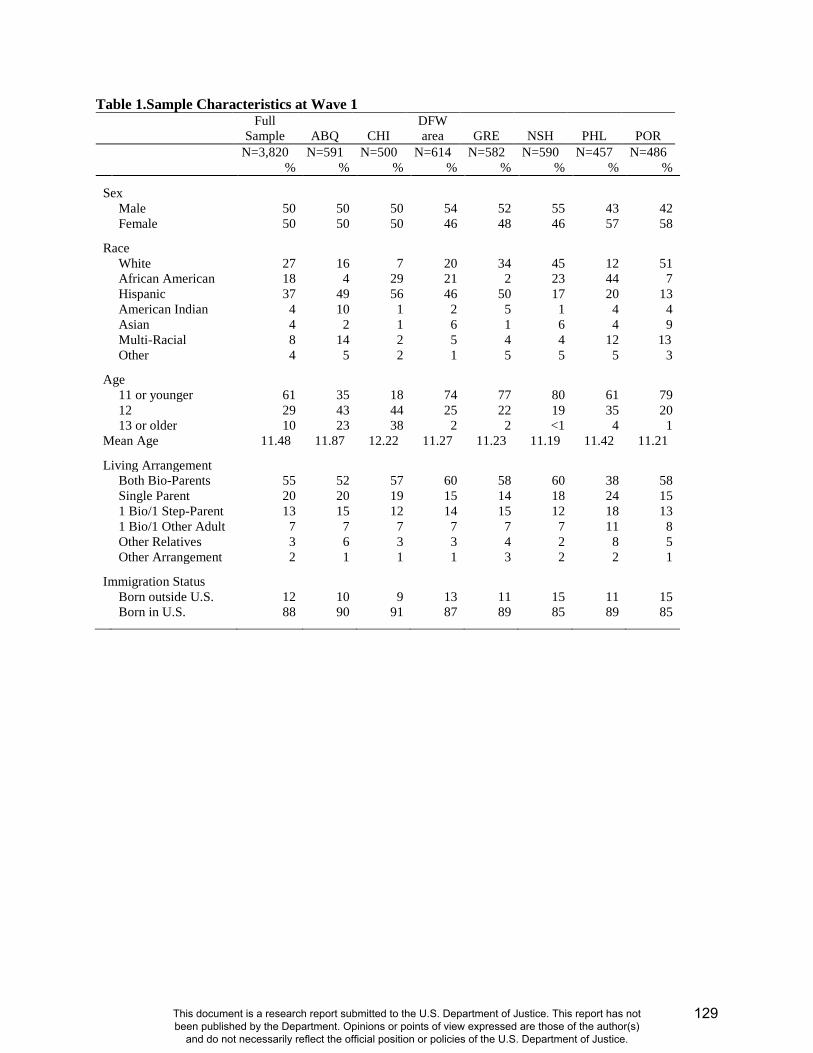
Table 1.Sample Characteristics at Wave 1 Full
Sample ABQ CHI DFW area GRE NSH PHL POR
N=3,820 N=591 N=500 N=614 N=582 N=590 N=457 N=486 % % % % % % % %
Sex Male 50 50 50 54 52 55 43 42 Female 50 50 50 46 48 46 57 58
Race White 27 16 7 20 34 45 12 51 African American 18 4 29 21 2 23 44 7 Hispanic 37 49 56 46 50 17 20 13 American Indian 4 10 1 2 5 1 4 4 Asian 4 2 1 6 1 6 4 9 Multi-Racial 8 14 2 5 4 4 12 13 Other 4 5 2 1 5 5 5 3
Age 11 or younger 61 35 18 74 77 80 61 79 12 29 43 44 25 22 19 35 20 13 or older 10 23 38 2 2 <1 4 1 Mean Age 11.48 11.87 12.22 11.27 11.23 11.19 11.42 11.21
Living Arrangement Both Bio-Parents 55 52 57 60 58 60 38 58 Single Parent 20 20 19 15 14 18 24 15 1 Bio/1 Step-Parent 13 15 12 14 15 12 18 13 1 Bio/1 Other Adult 7 7 7 7 7 7 11 8 Other Relatives 3 6 3 3 4 2 8 5 Other Arrangement 2 1 1 1 3 2 2 1
Immigration Status Born outside U.S. 12 10 9 13 11 15 11 15 Born in U.S. 88 90 91 87 89 85 89 85
129
This document is a research report submitted to the U.S. Department of Justice. This report has not been published by the Department. Opinions or points of view expressed are those of the author(s)
and do not necessarily reflect the official position or policies of the U.S. Department of Justice.
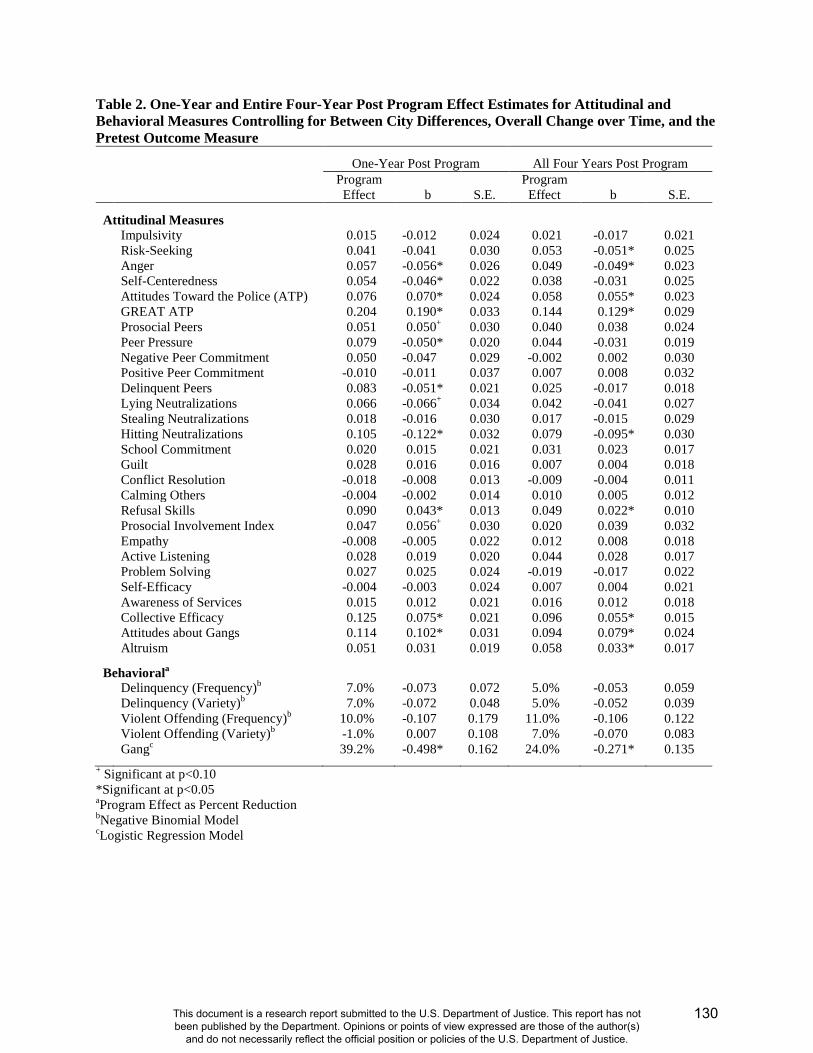
Table 2. One-Year and Entire Four-Year Post Program Effect Estimates for Attitudinal and Behavioral Measures Controlling for Between City Differences, Overall Change over Time, and the Pretest Outcome Measure
One-Year Post Program All Four Years Post Program Program
Effect b S.E. Program Effect b S.E.
Attitudinal Measures Impulsivity 0.015 -0.012 0.024 0.021 -0.017 0.021 Risk-Seeking 0.041 -0.041 0.030 0.053 -0.051* 0.025 Anger 0.057 -0.056* 0.026 0.049 -0.049* 0.023 Self-Centeredness 0.054 -0.046* 0.022 0.038 -0.031 0.025 Attitudes Toward the Police (ATP) 0.076 0.070* 0.024 0.058 0.055* 0.023 GREAT ATP 0.204 0.190* 0.033 0.144 0.129* 0.029 Prosocial Peers 0.051 0.050+ 0.030 0.040 0.038 0.024 Peer Pressure 0.079 -0.050* 0.020 0.044 -0.031 0.019 Negative Peer Commitment 0.050 -0.047 0.029 -0.002 0.002 0.030 Positive Peer Commitment -0.010 -0.011 0.037 0.007 0.008 0.032 Delinquent Peers 0.083 -0.051* 0.021 0.025 -0.017 0.018 Lying Neutralizations 0.066 -0.066+ 0.034 0.042 -0.041 0.027 Stealing Neutralizations 0.018 -0.016 0.030 0.017 -0.015 0.029 Hitting Neutralizations 0.105 -0.122* 0.032 0.079 -0.095* 0.030 School Commitment 0.020 0.015 0.021 0.031 0.023 0.017 Guilt 0.028 0.016 0.016 0.007 0.004 0.018 Conflict Resolution -0.018 -0.008 0.013 -0.009 -0.004 0.011 Calming Others -0.004 -0.002 0.014 0.010 0.005 0.012 Refusal Skills 0.090 0.043* 0.013 0.049 0.022* 0.010 Prosocial Involvement Index 0.047 0.056+ 0.030 0.020 0.039 0.032 Empathy -0.008 -0.005 0.022 0.012 0.008 0.018 Active Listening 0.028 0.019 0.020 0.044 0.028 0.017 Problem Solving 0.027 0.025 0.024 -0.019 -0.017 0.022 Self-Efficacy -0.004 -0.003 0.024 0.007 0.004 0.021 Awareness of Services 0.015 0.012 0.021 0.016 0.012 0.018 Collective Efficacy 0.125 0.075* 0.021 0.096 0.055* 0.015 Attitudes about Gangs 0.114 0.102* 0.031 0.094 0.079* 0.024 Altruism 0.051 0.031 0.019 0.058 0.033* 0.017
Behaviorala Delinquency (Frequency)b 7.0% -0.073 0.072 5.0% -0.053 0.059 Delinquency (Variety)b 7.0% -0.072 0.048 5.0% -0.052 0.039 Violent Offending (Frequency)b 10.0% -0.107 0.179 11.0% -0.106 0.122 Violent Offending (Variety)b -1.0% 0.007 0.108 7.0% -0.070 0.083 Gangc 39.2% -0.498* 0.162 24.0% -0.271* 0.135
+ Significant at p<0.10 *Significant at p<0.05 aProgram Effect as Percent Reduction bNegative Binomial Model cLogistic Regression Model
130
This document is a research report submitted to the U.S. Department of Justice. This report has not been published by the Department. Opinions or points of view expressed are those of the author(s)
and do not necessarily reflect the official position or policies of the U.S. Department of Justice.
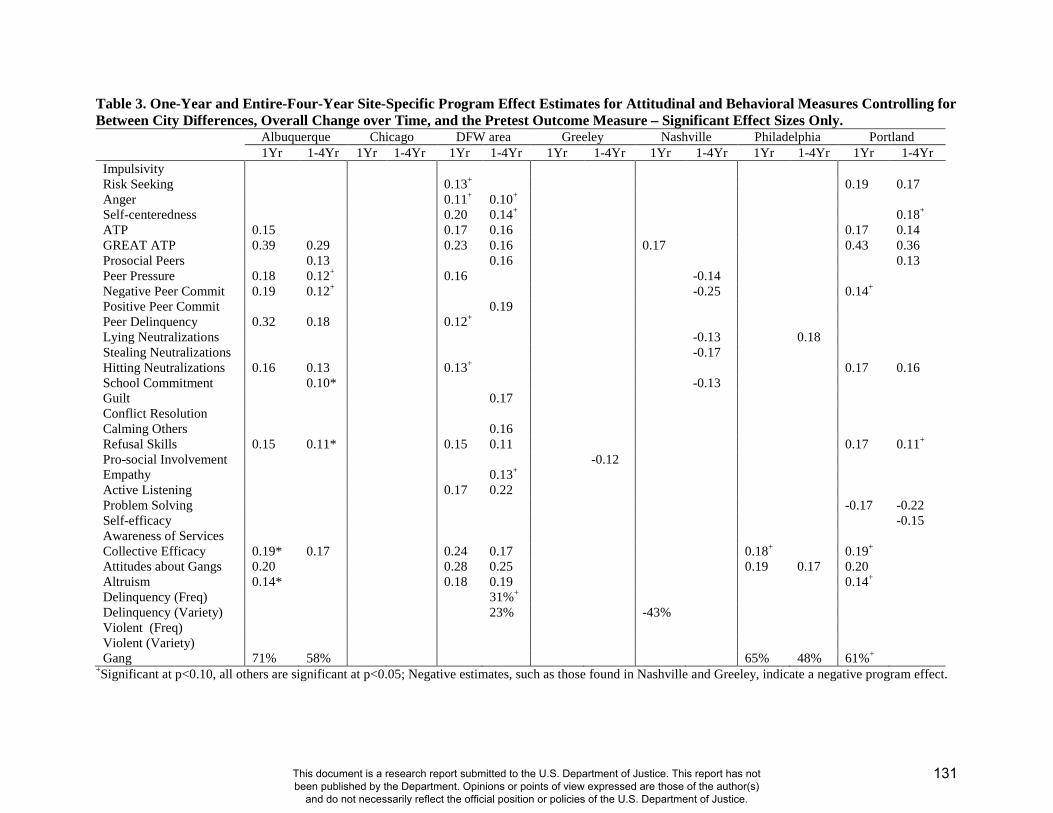
Table 3. One-Year and Entire-Four-Year Site-Specific Program Effect Estimates for Attitudinal and Behavioral Measures Controlling for Between City Differences, Overall Change over Time, and the Pretest Outcome Measure – Significant Effect Sizes Only.
Albuquerque Chicago DFW area Greeley Nashville Philadelphia Portland 1Yr 1-4Yr 1Yr 1-4Yr 1Yr 1-4Yr 1Yr 1-4Yr 1Yr 1-4Yr 1Yr 1-4Yr 1Yr 1-4Yr Impulsivity Risk Seeking 0.13+ 0.19 0.17 Anger 0.11+ 0.10+ Self-centeredness 0.20 0.14+ 0.18+ ATP 0.15 0.17 0.16 0.17 0.14 GREAT ATP 0.39 0.29 0.23 0.16 0.17 0.43 0.36 Prosocial Peers 0.13 0.16 0.13 Peer Pressure 0.18 0.12+ 0.16 -0.14 Negative Peer Commit 0.19 0.12+ -0.25 0.14+ Positive Peer Commit 0.19 Peer Delinquency 0.32 0.18 0.12+ Lying Neutralizations -0.13 0.18 Stealing Neutralizations -0.17 Hitting Neutralizations 0.16 0.13 0.13+ 0.17 0.16 School Commitment 0.10* -0.13 Guilt 0.17 Conflict Resolution Calming Others 0.16 Refusal Skills 0.15 0.11* 0.15 0.11 0.17 0.11+ Pro-social Involvement -0.12 Empathy 0.13+ Active Listening 0.17 0.22 Problem Solving -0.17 -0.22 Self-efficacy -0.15 Awareness of Services Collective Efficacy 0.19* 0.17 0.24 0.17 0.18+ 0.19+ Attitudes about Gangs 0.20 0.28 0.25 0.19 0.17 0.20 Altruism 0.14* 0.18 0.19 0.14+ Delinquency (Freq) 31%+ Delinquency (Variety) 23% -43% Violent (Freq) Violent (Variety) Gang 71% 58% 65% 48% 61%+
+Significant at p<0.10, all others are significant at p<0.05; Negative estimates, such as those found in Nashville and Greeley, indicate a negative program effect.
131
This document is a research report submitted to the U.S. Department of Justice. This report has not been published by the Department. Opinions or points of view expressed are those of the author(s)
and do not necessarily reflect the official position or policies of the U.S. Department of Justice.
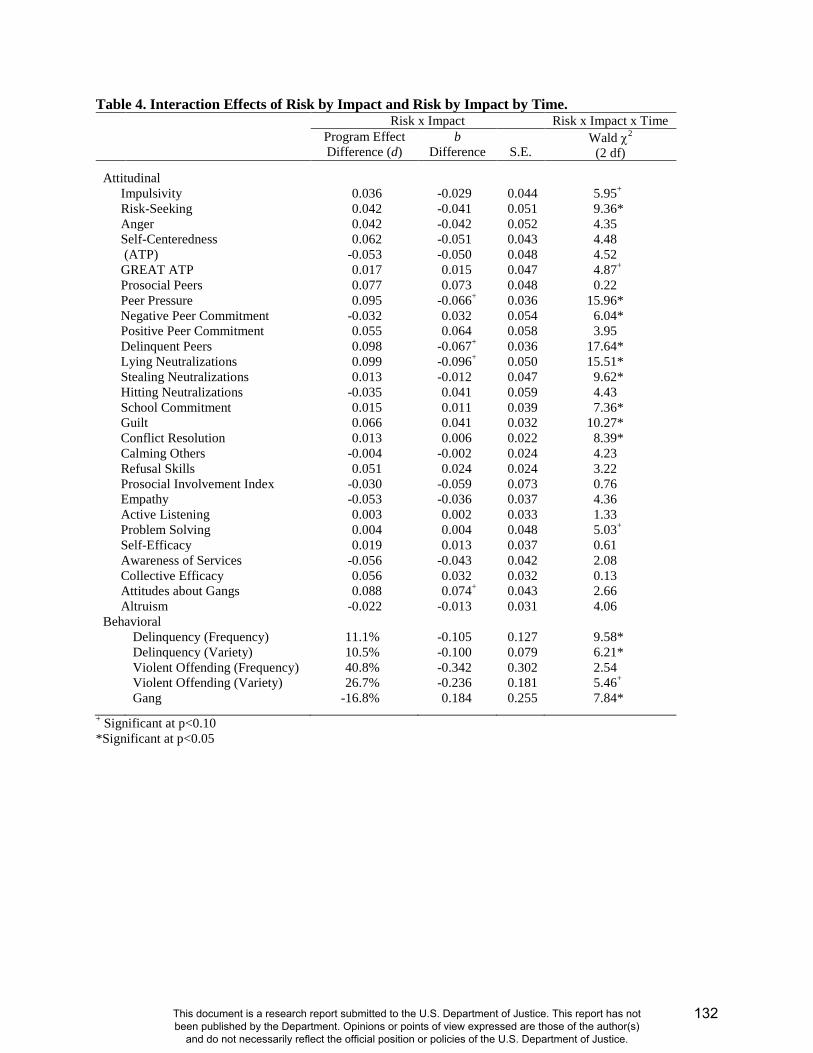
Table 4. Interaction Effects of Risk by Impact and Risk by Impact by Time. Risk x Impact Risk x Impact x Time
Program Effect Difference (d)
b Difference
S.E.
Wald χ2 (2 df)
Attitudinal Impulsivity 0.036 -0.029 0.044 5.95+ Risk-Seeking 0.042 -0.041 0.051 9.36* Anger 0.042 -0.042 0.052 4.35 Self-Centeredness 0.062 -0.051 0.043 4.48 (ATP) -0.053 -0.050 0.048 4.52 GREAT ATP 0.017 0.015 0.047 4.87+ Prosocial Peers 0.077 0.073 0.048 0.22 Peer Pressure 0.095 -0.066+ 0.036 15.96* Negative Peer Commitment -0.032 0.032 0.054 6.04* Positive Peer Commitment 0.055 0.064 0.058 3.95 Delinquent Peers 0.098 -0.067+ 0.036 17.64* Lying Neutralizations 0.099 -0.096+ 0.050 15.51* Stealing Neutralizations 0.013 -0.012 0.047 9.62* Hitting Neutralizations -0.035 0.041 0.059 4.43 School Commitment 0.015 0.011 0.039 7.36* Guilt 0.066 0.041 0.032 10.27* Conflict Resolution 0.013 0.006 0.022 8.39* Calming Others -0.004 -0.002 0.024 4.23 Refusal Skills 0.051 0.024 0.024 3.22 Prosocial Involvement Index -0.030 -0.059 0.073 0.76 Empathy -0.053 -0.036 0.037 4.36 Active Listening 0.003 0.002 0.033 1.33 Problem Solving 0.004 0.004 0.048 5.03+ Self-Efficacy 0.019 0.013 0.037 0.61 Awareness of Services -0.056 -0.043 0.042 2.08 Collective Efficacy 0.056 0.032 0.032 0.13 Attitudes about Gangs 0.088 0.074+ 0.043 2.66 Altruism -0.022 -0.013 0.031 4.06 Behavioral Delinquency (Frequency) 11.1% -0.105 0.127 9.58* Delinquency (Variety) 10.5% -0.100 0.079 6.21* Violent Offending (Frequency) 40.8% -0.342 0.302 2.54 Violent Offending (Variety) 26.7% -0.236 0.181 5.46+ Gang -16.8% 0.184 0.255 7.84*
+ Significant at p<0.10 *Significant at p<0.05
132
This document is a research report submitted to the U.S. Department of Justice. This report has not been published by the Department. Opinions or points of view expressed are those of the author(s)
and do not necessarily reflect the official position or policies of the U.S. Department of Justice.
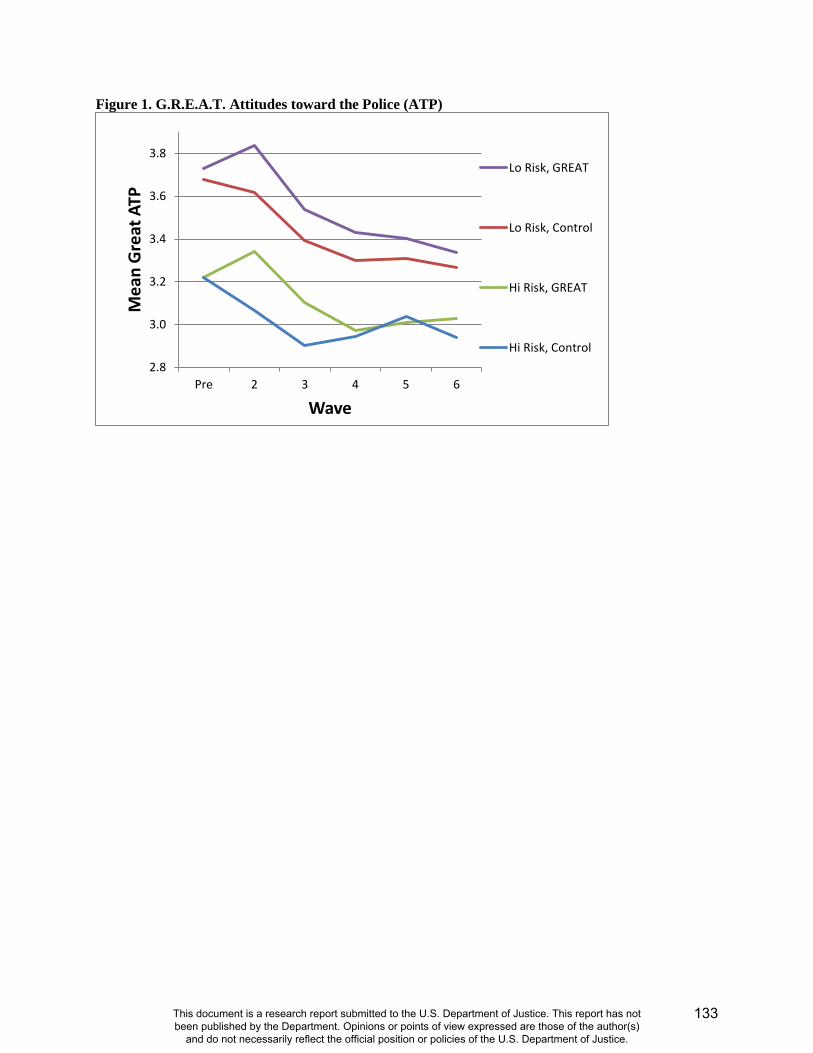
Figure 1. G.R.E.A.T. Attitudes toward the Police (ATP)
2.8
3.0
3.2
3.4
3.6
3.8
Pre 2 3 4 5 6
Mea
n G
reat
ATP
Wave
Lo Risk, GREAT
Lo Risk, Control
Hi Risk, GREAT
Hi Risk, Control
133
This document is a research report submitted to the U.S. Department of Justice. This report has not been published by the Department. Opinions or points of view expressed are those of the author(s)
and do not necessarily reflect the official position or policies of the U.S. Department of Justice.

Figure 2. Gang Membership
0.00
0.05
0.10
0.15
0.20
0.25
Pre 2 3 4 5 6
Gan
g M
embe
r (pr
opor
tion)
Wave
Hi Risk, Control
Hi Risk, GREAT
Lo Risk, Control
Lo Risk, GREAT
134
This document is a research report submitted to the U.S. Department of Justice. This report has not been published by the Department. Opinions or points of view expressed are those of the author(s)
and do not necessarily reflect the official position or policies of the U.S. Department of Justice.
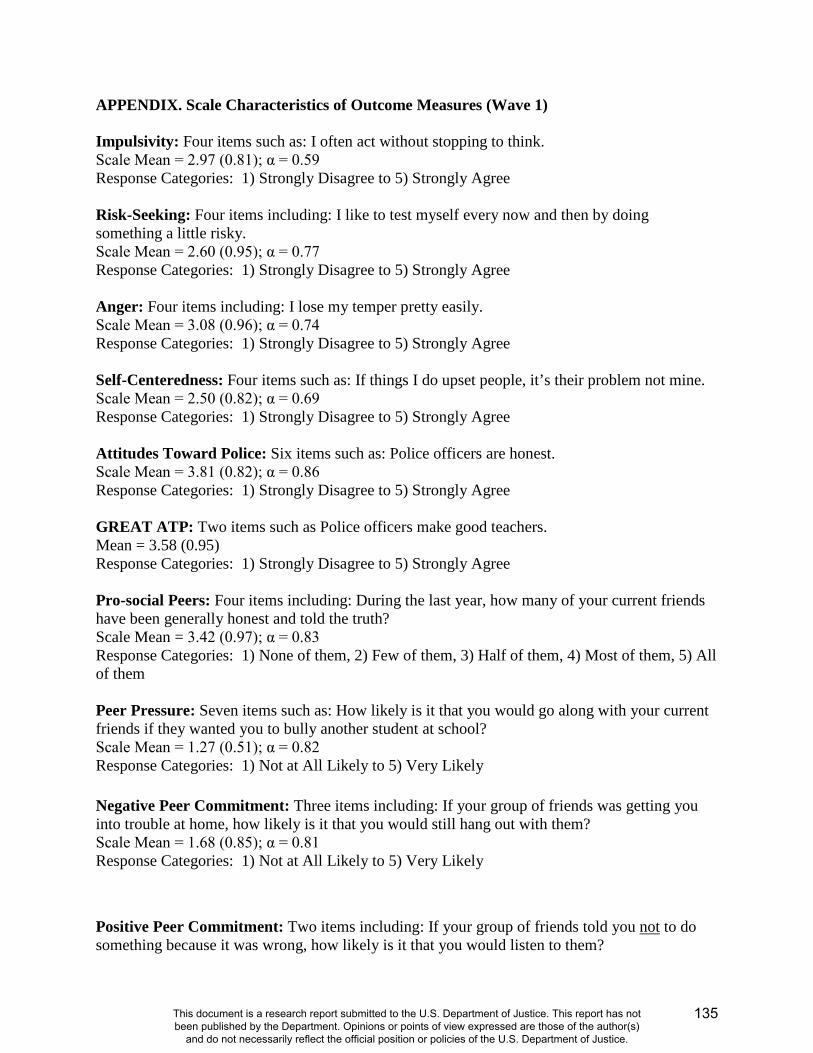
APPENDIX. Scale Characteristics of Outcome Measures (Wave 1)
Impulsivity: Four items such as: I often act without stopping to think. Scale Mean = 2.97 (0.81); α = 0.59 Response Categories: 1) Strongly Disagree to 5) Strongly Agree Risk-Seeking: Four items including: I like to test myself every now and then by doing something a little risky. Scale Mean = 2.60 (0.95); α = 0.77 Response Categories: 1) Strongly Disagree to 5) Strongly Agree Anger: Four items including: I lose my temper pretty easily. Scale Mean = 3.08 (0.96); α = 0.74 Response Categories: 1) Strongly Disagree to 5) Strongly Agree Self-Centeredness: Four items such as: If things I do upset people, it’s their problem not mine. Scale Mean = 2.50 (0.82); α = 0.69 Response Categories: 1) Strongly Disagree to 5) Strongly Agree Attitudes Toward Police: Six items such as: Police officers are honest. Scale Mean = 3.81 (0.82); α = 0.86 Response Categories: 1) Strongly Disagree to 5) Strongly Agree GREAT ATP: Two items such as Police officers make good teachers. Mean = 3.58 (0.95) Response Categories: 1) Strongly Disagree to 5) Strongly Agree Pro-social Peers: Four items including: During the last year, how many of your current friends have been generally honest and told the truth? Scale Mean = 3.42 (0.97); α = 0.83 Response Categories: 1) None of them, 2) Few of them, 3) Half of them, 4) Most of them, 5) All of them Peer Pressure: Seven items such as: How likely is it that you would go along with your current friends if they wanted you to bully another student at school? Scale Mean = 1.27 (0.51); α = 0.82 Response Categories: 1) Not at All Likely to 5) Very Likely Negative Peer Commitment: Three items including: If your group of friends was getting you into trouble at home, how likely is it that you would still hang out with them? Scale Mean = 1.68 (0.85); α = 0.81 Response Categories: 1) Not at All Likely to 5) Very Likely Positive Peer Commitment: Two items including: If your group of friends told you not to do something because it was wrong, how likely is it that you would listen to them?
135
This document is a research report submitted to the U.S. Department of Justice. This report has not been published by the Department. Opinions or points of view expressed are those of the author(s)
and do not necessarily reflect the official position or policies of the U.S. Department of Justice.
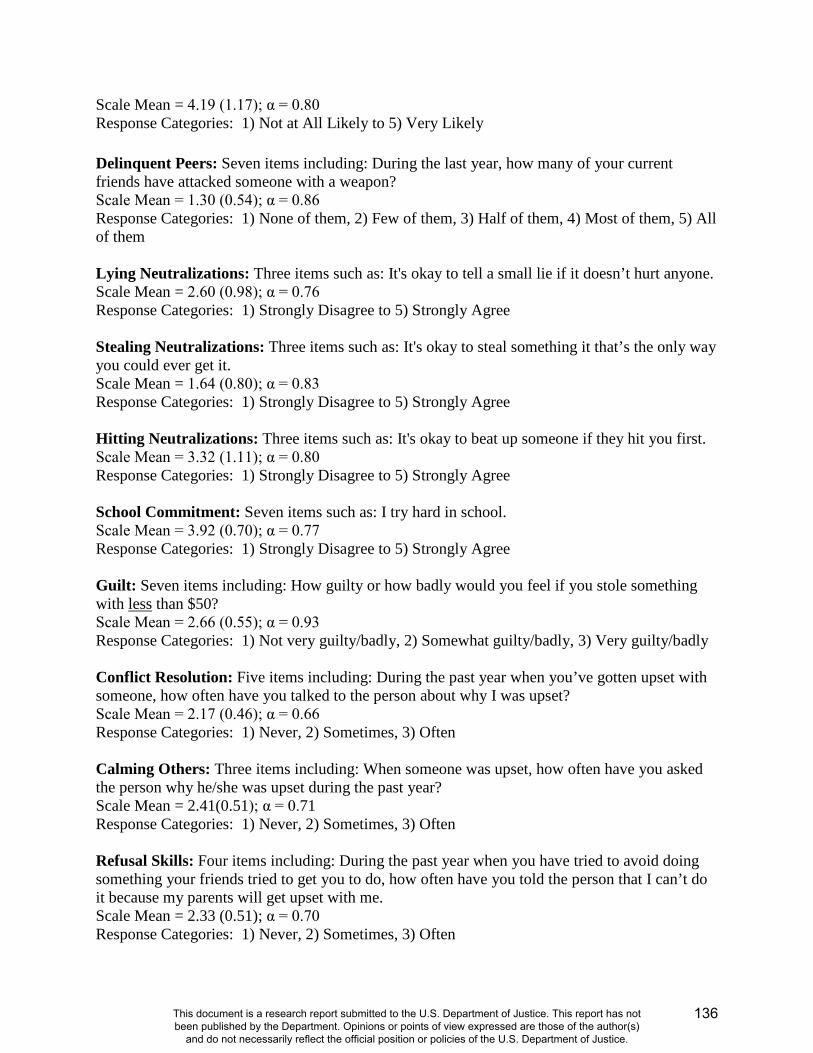
Scale Mean = 4.19 (1.17); α = 0.80 Response Categories: 1) Not at All Likely to 5) Very Likely Delinquent Peers: Seven items including: During the last year, how many of your current friends have attacked someone with a weapon? Scale Mean = 1.30 (0.54); α = 0.86 Response Categories: 1) None of them, 2) Few of them, 3) Half of them, 4) Most of them, 5) All of them Lying Neutralizations: Three items such as: It's okay to tell a small lie if it doesn’t hurt anyone. Scale Mean = 2.60 (0.98); α = 0.76 Response Categories: 1) Strongly Disagree to 5) Strongly Agree Stealing Neutralizations: Three items such as: It's okay to steal something it that’s the only way you could ever get it. Scale Mean = 1.64 (0.80); α = 0.83 Response Categories: 1) Strongly Disagree to 5) Strongly Agree Hitting Neutralizations: Three items such as: It's okay to beat up someone if they hit you first. Scale Mean = 3.32 (1.11); α = 0.80 Response Categories: 1) Strongly Disagree to 5) Strongly Agree School Commitment: Seven items such as: I try hard in school. Scale Mean = 3.92 (0.70); α = 0.77 Response Categories: 1) Strongly Disagree to 5) Strongly Agree Guilt: Seven items including: How guilty or how badly would you feel if you stole something with less than $50? Scale Mean = 2.66 (0.55); α = 0.93 Response Categories: 1) Not very guilty/badly, 2) Somewhat guilty/badly, 3) Very guilty/badly Conflict Resolution: Five items including: During the past year when you’ve gotten upset with someone, how often have you talked to the person about why I was upset? Scale Mean = 2.17 (0.46); α = 0.66 Response Categories: 1) Never, 2) Sometimes, 3) Often Calming Others: Three items including: When someone was upset, how often have you asked the person why he/she was upset during the past year? Scale Mean = 2.41(0.51); α = 0.71 Response Categories: 1) Never, 2) Sometimes, 3) Often Refusal Skills: Four items including: During the past year when you have tried to avoid doing something your friends tried to get you to do, how often have you told the person that I can’t do it because my parents will get upset with me. Scale Mean = 2.33 (0.51); α = 0.70 Response Categories: 1) Never, 2) Sometimes, 3) Often
136
This document is a research report submitted to the U.S. Department of Justice. This report has not been published by the Department. Opinions or points of view expressed are those of the author(s)
and do not necessarily reflect the official position or policies of the U.S. Department of Justice.
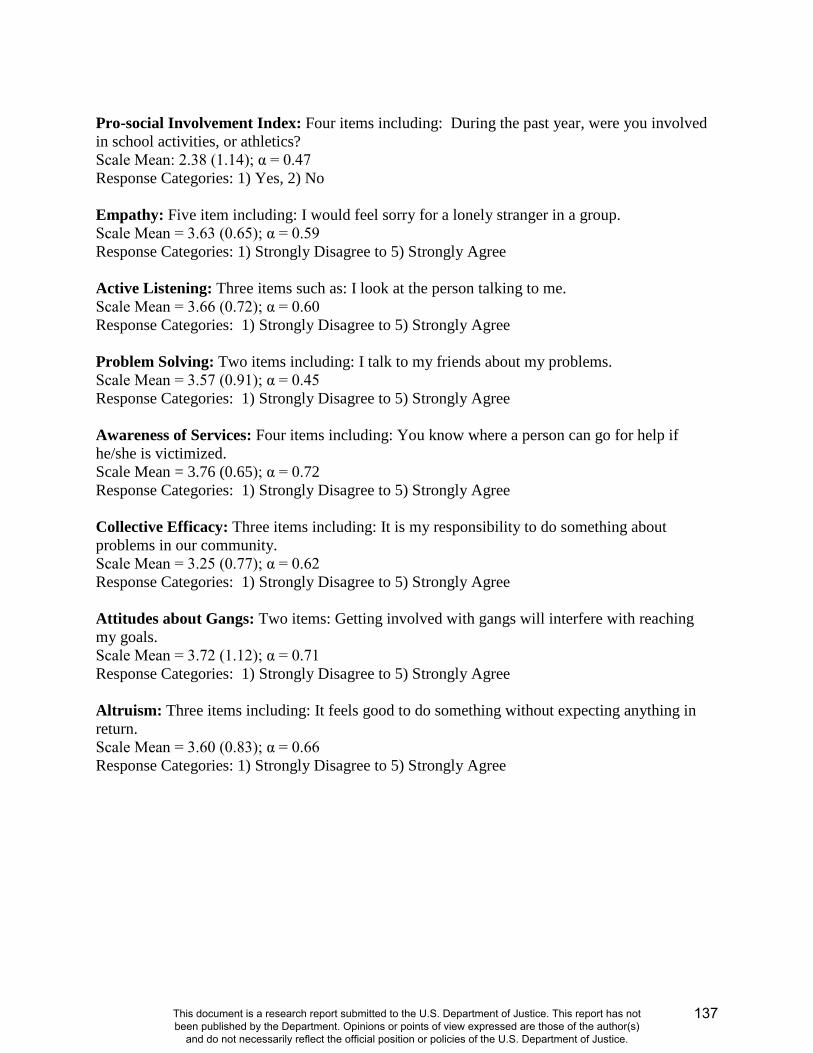
Pro-social Involvement Index: Four items including: During the past year, were you involved in school activities, or athletics? Scale Mean: 2.38 (1.14); α = 0.47 Response Categories: 1) Yes, 2) No Empathy: Five item including: I would feel sorry for a lonely stranger in a group. Scale Mean = 3.63 (0.65); α = 0.59 Response Categories: 1) Strongly Disagree to 5) Strongly Agree Active Listening: Three items such as: I look at the person talking to me. Scale Mean = 3.66 (0.72); α = 0.60 Response Categories: 1) Strongly Disagree to 5) Strongly Agree Problem Solving: Two items including: I talk to my friends about my problems. Scale Mean = 3.57 (0.91); α = 0.45 Response Categories: 1) Strongly Disagree to 5) Strongly Agree Awareness of Services: Four items including: You know where a person can go for help if he/she is victimized. Scale Mean = 3.76 (0.65); α = 0.72 Response Categories: 1) Strongly Disagree to 5) Strongly Agree Collective Efficacy: Three items including: It is my responsibility to do something about problems in our community. Scale Mean = 3.25 (0.77); α = 0.62 Response Categories: 1) Strongly Disagree to 5) Strongly Agree Attitudes about Gangs: Two items: Getting involved with gangs will interfere with reaching my goals. Scale Mean = 3.72 (1.12); α = 0.71 Response Categories: 1) Strongly Disagree to 5) Strongly Agree Altruism: Three items including: It feels good to do something without expecting anything in return. Scale Mean = 3.60 (0.83); α = 0.66 Response Categories: 1) Strongly Disagree to 5) Strongly Agree
137
This document is a research report submitted to the U.S. Department of Justice. This report has not been published by the Department. Opinions or points of view expressed are those of the author(s)
and do not necessarily reflect the official position or policies of the U.S. Department of Justice.
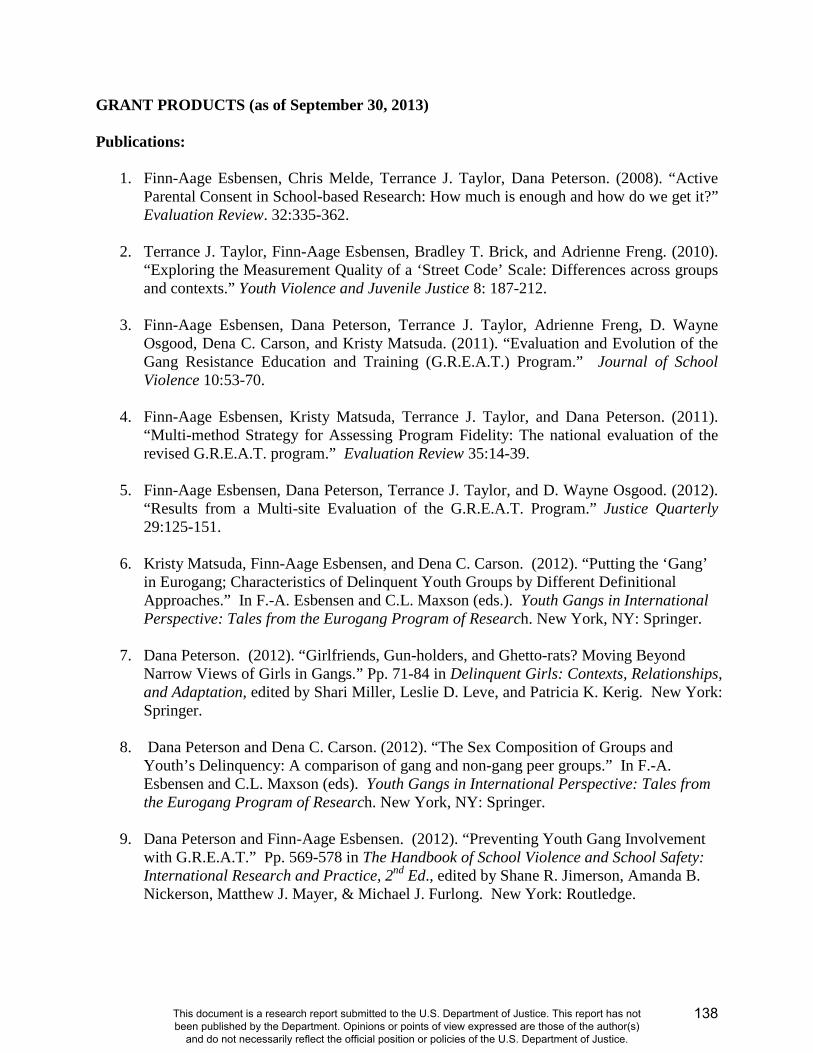
GRANT PRODUCTS (as of September 30, 2013) Publications:
1. Finn-Aage Esbensen, Chris Melde, Terrance J. Taylor, Dana Peterson. (2008). “Active Parental Consent in School-based Research: How much is enough and how do we get it?” Evaluation Review. 32:335-362.
2. Terrance J. Taylor, Finn-Aage Esbensen, Bradley T. Brick, and Adrienne Freng. (2010).
“Exploring the Measurement Quality of a ‘Street Code’ Scale: Differences across groups and contexts.” Youth Violence and Juvenile Justice 8: 187-212.
3. Finn-Aage Esbensen, Dana Peterson, Terrance J. Taylor, Adrienne Freng, D. Wayne
Osgood, Dena C. Carson, and Kristy Matsuda. (2011). “Evaluation and Evolution of the Gang Resistance Education and Training (G.R.E.A.T.) Program.” Journal of School Violence 10:53-70.
4. Finn-Aage Esbensen, Kristy Matsuda, Terrance J. Taylor, and Dana Peterson. (2011).
“Multi-method Strategy for Assessing Program Fidelity: The national evaluation of the revised G.R.E.A.T. program.” Evaluation Review 35:14-39.
5. Finn-Aage Esbensen, Dana Peterson, Terrance J. Taylor, and D. Wayne Osgood. (2012).
“Results from a Multi-site Evaluation of the G.R.E.A.T. Program.” Justice Quarterly 29:125-151.
6. Kristy Matsuda, Finn-Aage Esbensen, and Dena C. Carson. (2012). “Putting the ‘Gang’
in Eurogang; Characteristics of Delinquent Youth Groups by Different Definitional Approaches.” In F.-A. Esbensen and C.L. Maxson (eds.). Youth Gangs in International Perspective: Tales from the Eurogang Program of Research. New York, NY: Springer.
7. Dana Peterson. (2012). “Girlfriends, Gun-holders, and Ghetto-rats? Moving Beyond
Narrow Views of Girls in Gangs.” Pp. 71-84 in Delinquent Girls: Contexts, Relationships, and Adaptation, edited by Shari Miller, Leslie D. Leve, and Patricia K. Kerig. New York: Springer.
8. Dana Peterson and Dena C. Carson. (2012). “The Sex Composition of Groups and Youth’s Delinquency: A comparison of gang and non-gang peer groups.” In F.-A. Esbensen and C.L. Maxson (eds). Youth Gangs in International Perspective: Tales from the Eurogang Program of Research. New York, NY: Springer.
9. Dana Peterson and Finn-Aage Esbensen. (2012). “Preventing Youth Gang Involvement
with G.R.E.A.T.” Pp. 569-578 in The Handbook of School Violence and School Safety: International Research and Practice, 2nd Ed., edited by Shane R. Jimerson, Amanda B. Nickerson, Matthew J. Mayer, & Michael J. Furlong. New York: Routledge.
138
This document is a research report submitted to the U.S. Department of Justice. This report has not been published by the Department. Opinions or points of view expressed are those of the author(s)
and do not necessarily reflect the official position or policies of the U.S. Department of Justice.
10. Finn-Aage Esbensen and Dena C. Carson. (2012). “Who Are the Gangsters?: An examination of the age, race/ethnicity, and sex of self-reported gang members in a seven city study of American youth.” Journal of Contemporary Criminal Justice 28:462-478.
11. Chris Melde and Finn-Aage Esbensen. (2013). “Gangs and Violence: Disentangling the Impact of Gang Membership on the Levels and Nature of Offending.” Journal of Quantitative Criminology 29:143-166.
12. Kristy Matsuda, Chris Melde, Adrienne Freng, TJ Taylor & Finn-Aage Esbensen. (2013). “Gang Membership and Adherence to the ‘Code of the Streets.’” Justice Quarterly 30:440-468.
13. Dena C. Carson. (2013). “Perceptions of Prosocial and Delinquent Peer Behavior and the
Effect on Delinquent Attitudes: A Longitudinal Study.” Journal of Criminal Justice 41, 151-161.
14. Finn-Aage Esbensen, Dana Peterson, Terrance J. Taylor, and D. Wayne Osgood. (2013).
“Is G.R.E.A.T Effective? Program Implementation Quality and Results from the National Evaluation of the Gang Resistance Education and Training (G.R.E.A.T.) Program.” In Cheryl L. Maxson, Jody Miller, Malcolm Klein, and Arlen Egley (Eds.) The Modern Gang Reader, 4th edition. New York: Oxford University Press.
15. Dena C. Carson, Finn-Aage Esbensen, and T.J. Taylor. (2013). “A Longitudinal Analysis
of the Relationship between School Victimization and Student Mobility.” Youth Violence and Juvenile Justice 11:275-295.
16. Stephanie A Wiley, Lee Ann Slocum, and Finn-Aage Esbensen. (2013). “The Unintended Consequences of Being Stopped or Arrested: An exploration of the labeling mechanisms through which police contact leads to subsequent delinquency.” Criminology 51:
17. Finn-Aage Esbensen and L. Thomas Winfree, Jr. (2013). “Motivations for Gang Joining: Does context matter?” In Klaus Boers, Thomas Feltes, Joerg Kinzig, Lawrence W. Sherman, Franz Streng, and Gerson Trueg (Eds.) Criminology, Crime Policy, and Penal Law: Festschrift for Hans-Juergen Kerner on the Occasion of his 70th Birthday. Tuebingen, Germany: Mohr Publishing.
18. Dana Peterson and Kirstin Morgan. (2013). “Sex Differences and the Overlap in Youths’ Risk Factors for Onset of Violence and Gang Involvement.” Journal of Crime and Justice (online, DOI:10.1080/0735648X.2013.830393)
19. Dena C. Carson and Finn-Aage Esbensen. Forthcoming. “The Mediating Effects of Delinquent Attitudes on Race, Race Heterogeneity, and Violent Offending.” Journal of Crime and Justice.
139
This document is a research report submitted to the U.S. Department of Justice. This report has not been published by the Department. Opinions or points of view expressed are those of the author(s)
and do not necessarily reflect the official position or policies of the U.S. Department of Justice.
20. Stephanie A. Wiley and Finn-Aage Esbensen. Forthcoming. “The Effect of Police Contact: Does Official Intervention Result in Deviance Amplification” Crime & Delinquency
21. Chris Melde and Finn-Aage Esbensen. Forthcoming. “The Relative Impact of Gang
Status Transitions: Identifying the mechanisms of change in delinquency” Journal of Research in Crime and Delinquency
22. Finn-Aage Esbensen, D. Wayne Osgood, Dana Peterson, Terrance J. Taylor, and Dena C. Carson. (2013). “Short and Long Term Outcome Results from a Multi-site Evaluation of the G.R.E.A.T. Program.” Criminology and Public Policy
23. Dena C. Carson, Dana Peterson, and Finn-Aage Esbensen. Forthcoming. “Youth Gang Desistance: An examination of different operational definitions of desistance on the motivations, methods, and consequences associated with leaving the gang.” Criminal Justice Review
Reports:
1. Finn-Aage Esbensen, Terrance J. Taylor, Bradley T. Brick, and Dana Peterson. 2007. 2007 Report to Schools and Communities. National Evaluation of the Gang Resistance Education and Training (G.R.E.A.T.) Program, Department of Criminology and Criminal Justice, University of Missouri-St. Louis.
2. Dena C. Carson, Finn-Aage Esbensen, Terrance J. Taylor, and Dana Peterson. August
2008. Results from Surveys and Interviews with G.R.E.A.T.-trained Officers. National Evaluation of the Gang Resistance Education and Training (G.R.E.A.T.) Program, Department of Criminology and Criminal Justice, University of Missouri-St. Louis.
3. Finn-Aage Esbensen, Dana Peterson, Terrance J. Taylor, Vanessa R. Panfil, and Bradley
T. Brick. 2008. 2008 Report to Schools and Communities: Anti-Social Norms among a Sample of Middle-School Students. National Evaluation of the Gang Resistance Education and Training (G.R.E.A.T.) Program, Department of Criminology and Criminal Justice, University of Missouri-St. Louis.
4. Krystle M. Leugoud, Finn-Aage Esbensen, Bradley T. Brick, and Terrance J. Taylor.
March 2009. Observing the Implementer: Description of Findings, Recommendations, and Conclusions from GREAT Program Implementation Observations. National Evaluation of the Gang Resistance Education and Training (G.R.E.A.T.) Program, Department of Criminology and Criminal Justice, University of Missouri-St. Louis.
5. Dana Peterson, Vanessa R. Panfil, Finn-Aage Esbensen, and Terrance J. Taylor. June
2009. School Personnel Survey Report. National Evaluation of the Gang Resistance Education and Training (G.R.E.A.T.) Program, Department of Criminology and Criminal Justice, University of Missouri-St. Louis.
140
This document is a research report submitted to the U.S. Department of Justice. This report has not been published by the Department. Opinions or points of view expressed are those of the author(s)
and do not necessarily reflect the official position or policies of the U.S. Department of Justice.
6. Terrance J. Taylor, Finn-Aage Esbensen, and Dana Peterson. June 2009. G.R.E.A.T.
Officer Training (GOT) Report. National Evaluation of the Gang Resistance Education and Training (G.R.E.A.T.) Program, Department of Criminology and Criminal Justice, University of Missouri-St. Louis.
7. Finn-Aage Esbensen, Dana Peterson, and Terrance J. Taylor. 2009. 2009 Report to
Schools and Communities: Program Implementation and Preliminary Outcome Results. National Evaluation of the Gang Resistance Education and Training (G.R.E.A.T.) Program, Department of Criminology and Criminal Justice, University of Missouri-St. Louis.
8. Matsuda, Kristy, Finn-Aage Esbensen, Dana Peterson, Terrance J. Taylor. 2010. 2010
Report to Schools and Communities: School Safety and Victimization. National Evaluation of the Gang Resistance Education and Training (G.R.E.A.T.) Program, Department of Criminology and Criminal Justice, University of Missouri-St. Louis.
9. Finn-Aage Esbensen, Dana Peterson, Terrance J. Taylor, and D. Wayne Osgood. 2012. Is
G.R.E.A.T. effective? Does the program prevent gang joining? Results from the National evaluation of G.R.E.A.T. Program, Department of Criminology and Criminal Justice, University of Missouri-St. Louis.
Dissertations:
1. Bradley T. Brick. “Examining Individual and Community Predictors of Formal Sanctioning in an Adolescent Sample.” 2009. Unpublished Ph.D. Dissertation, Department of Criminology and Criminal Justice, University of Missouri-St. Louis.
2. Dena C. Carson. “Examining the Effect of Changes in the Peer Group on attitudes: A
Longitudinal Study. 2011. Unpublished Ph.D. Dissertation, Department of Criminology and Criminal Justice, University of Missouri-St. Louis.
3. J. Michael Vecchio. “The Role of Violence with and across Self-identified Gang Youth.” Expected Completion, Spring, 2014. Department of Criminology and Criminal Justice, University of Missouri-St. Louis.
4. Stephanie A. Wiley. “The Amplification of Deviance Following Police Contact: An Examination of Individual and Contextual Factors.” Expected Completion, Spring, 2014. Department of Criminology and Criminal Justice, University of Missouri-St. Louis.
141
This document is a research report submitted to the U.S. Department of Justice. This report has not been published by the Department. Opinions or points of view expressed are those of the author(s)
and do not necessarily reflect the official position or policies of the U.S. Department of Justice.
Presentations:
1. Finn-Aage Esbensen, Chris Melde, Dana Peterson, and Terrance J. Taylor. “Obtaining Active Parental Consent for a School-based Evaluation.” Annual Meeting of the Academy of Criminal Justice Sciences, Seattle, WA, March 2007.
2. Finn-Aage Esbensen. “Process and Outcome Evaluation of the G.R.E.A.T. Program.”
Report to the National Policy Board, International Association of Chiefs of Police, New Orleans, LA, October 12, 2007
3. Terrance J. Taylor, Nick Miofsky, and Finn-Aage Esbensen. “(Foreign) Born in the USA:
Immigration, Youth Victimization, and Awareness of Victim Assistance.” American Society of Criminology, Atlanta, GA, November 2007.
4. Dena C. Carson, Finn-Aage Esbensen, and Terrance J. Taylor “An Examination of
Officers' Attitudes about a School-Based Community-Oriented Policing Strategy.” Western Society of Criminology, Sacramento, CA, February 2008.
5. Dena C. Carson, Finn-Aage Esbensen, Terrance J. Taylor, and Dana Peterson. 2008.
National Evaluation of the Gang Resistance Education and Training (GREAT) Program: Results from Surveys and Interviews with GREAT-trained Officers. University of Missouri-St. Louis.
6. Finn-Aage Esbensen and Chris Melde. “Strategies to Enhance Program Fidelity.”
National Institute of Justice Conference, Crystal City, VA. July, 2008.
7. Finn-Aage Esbensen. “Progress Report on the Evaluation of GREAT.” National GREAT Conference, St. Louis, MO. July 2008.
8. Finn-Aage Esbensen, Bradley T. Brick, Chris Melde, Dana Peterson, Terrance J. Taylor,
and Dena C. Carson. “An Empirical Assessment of the Eurogang Funneling Approach to Establish Gang Membership.” European Society of Criminology, Edinburgh, Scotland, September 2008.
9. Finn-Aage Esbensen. “Preliminary Short-term Results from the Evaluation of the
G.R.E.A.T. Program.” Report to the GREAT National Policy Board, San Diego, CA. November 2008.
10. Finn-Aage Esbensen, Bradley T. Brick, Terrance J. Taylor, Dana Peterson, Chris Melde,
and Dena C. Carson. “Dueling Banjos: Does definition matter?”American Society of Criminology, St. Louis, MO. November 2008.
11. Chris Melde, Finn-Aage Esbensen, Terrance J. Taylor, Dana Peterson. “Reducing Initial
Loss Rates Associated with Active Parental Consent.” American Society of Criminology, St. Louis, MO. November, 2008.
142
This document is a research report submitted to the U.S. Department of Justice. This report has not been published by the Department. Opinions or points of view expressed are those of the author(s)
and do not necessarily reflect the official position or policies of the U.S. Department of Justice.
12. Terrance J. Taylor, Dana Peterson, and Adrienne Freng. “Strategies for Reducing Attrition across Waves.” American Society of Criminology, St. Louis, MO. November, 2008.
13. Krystle M. Leugoud, Bradley T. Brick, and Finn-Aage Esbensen. “The Use of
Observations to Assess Program Fidelity.” American Society of Criminology, St. Louis, MO. November 2008.
14. Dena C. Carson, Terrance J. Taylor, Dana Peterson, and Finn-Aage Esbensen.
“Alternative Measures of Program Implementation.” American Society of Criminology, St. Louis, MO. November 2008.
15. Bradley T. Brick. “Race, Social Context, and Social Control: An Examination of Racial
Disparity in School Punishment.” American Society of Criminology, St. Louis, MO. November 2008.
16. Adrienne Freng, Finn-Aage Esbensen, Dana Peterson, and Terrance J. Taylor. “The
Gang Experience and the Marginalization of Females.” American Society of Criminology, St. Louis, MO. November 2008.
17. Finn-Aage Esbensen. Presentation to National Policy Board. Baltimore, MD. April 2009.
18. Finn-Aage Esbensen, Dana Peterson, and Terrance J. Taylor. “The Validity of the
Filtering and Funneling Methods of Defining Gang Membership.” European Society of Criminology, Ljubljana, Slovenia. September 2009.
19. Bradley T. Brick. “Minority Threat in Schools: Racial Status, Social Context, and Social
Control.” American Society of Criminology, Philadelphia, PA. November 2009.
20. Dana Peterson and Finn-Aage Esbensen. “Gang Sex Composition Effects: Selection or Social Facilitation?” American Society of Criminology, Philadelphia, PA. November 2009.
21. John Michael Vecchio, Terrance J. Taylor, and Finn-Aage Esbensen. “Self-control,
Delinquent Lifestyles, and Subsequent Victimization.” American Society of Criminology, Philadelphia, PA. November 2009.
22. Dena C. Carson. “The Influence of Peer Group Composition on Delinquent Beliefs.”
American Society of Criminology, Philadelphia, PA. November 2009.
23. Terrance J. Taylor, Finn-Aage Esbensen, Bradley T. Brick, and Adrienne Freng. “Exploring the Measurement Quality of an Attitudinal Scale of Street Code- Related Violence: Similarities and Differences across Groups and Contexts.” Western Society of Criminology, Honolulu, HI, February 2010.
143
This document is a research report submitted to the U.S. Department of Justice. This report has not been published by the Department. Opinions or points of view expressed are those of the author(s)
and do not necessarily reflect the official position or policies of the U.S. Department of Justice.
24. Dena C. Carson. “The Moderating Effects of Race on the Relationship between Delinquent Attitudes and Delinquency.” Western Society of Criminology, Honolulu, HI, February 2010.
25. Kristy Matsuda, Finn-Aage Esbensen, and Dena C. Carson. “Putting the ‘Gang’ in
Eurogang: Characteristics of Delinquent Youth Groups by Different Definitional Approaches.” Eurogang X Workshop. Neustadt an der Weinstrasse, Germany, June 2010.
26. Dana Peterson, Dena C. Carson, and Finn-Aage Esbensen. “Sex Composition of Gangs and Youth Gang Member Delinquency: An Examination of Selection and Social Facilitation Using the Eurogang Definition.” Eurogang X Workshop. Neustadt an der Weinstrasse, Germany, June 2010.
27. Hyon Namgung, Terrance J. Taylor, Finn-Aage Esbensen. “Exploring the Role of Different Policing Models of School-Based Prevention Efforts on Changes in Youths’ Attitudes towards the Police.” American Society of Criminology, San Francisco, CA, November 2010.
28. Dena C. Carson. “Changes in Youth Offending: An Examination of the Interdependence
of Self-control and Social bonds.” American Society of Criminology, San Francisco, CA, November 2010.
29. Stephanie A. Wiley and Finn-Aage Esbensen. “Predicting Substance Use in Juveniles: A
Test of an Integrated Model.” American Society of Criminology, San Francisco, CA, November 2010.
30. J. Michael Vecchio, Dana Peterson, and Finn-Aage Esbensen. “The apostasy of the gang:
Motivations for youth gang desistance.” American Society of Criminology, San Francisco, CA, November 2010.
31. Finn-Aage Esbensen, Dana Peterson, Terrance J. Taylor, and D. Wayne Osgood.
“G.R.E.A.T. is Great.” American Society of Criminology, San Francisco, CA, November 2010.
32. Dana Peterson and Kirstin Morgan. “Risky Business: Risk Factor Predictions of Girls’
and Boys’ Gang Involvement.” American Society of Criminology, San Francisco, CA, November 2010.
33. Kristy Matsuda and Finn-Aage Esbensen “The Missing Gang Members: Measuring Gang
Careers using Longitudinal Data.” American Society of Criminology, San Francisco, CA, November 2010.
34. Lee Slocum, Terrance J. Taylor, and Finn-Aage Esbensen. “Contextual Determinants of
Youths’ Willingness to Report Crime.” American Society of Criminology, San Francisco, CA, November 2010.
144
This document is a research report submitted to the U.S. Department of Justice. This report has not been published by the Department. Opinions or points of view expressed are those of the author(s)
and do not necessarily reflect the official position or policies of the U.S. Department of Justice.

35. Dena C. Carson and Finn-Aage Esbensen. “Differentiating Delinquent Groups from Gangs: Moving Beyond Offending.” Western Society of Criminology, Vancouver, BC, Canada, February 2011.
36. Kristy Matsuda and Finn-Aage Esbensen. “Gang Structures in a National School-Based
Sample of Youth: A test of Maxson and Klein’s gang typology.” Western Society of Criminology, Vancouver, BC, Canada, February 2011.
37. Finn-Aage Esbensen. “Promising Results from the National Evaluation of the G.R.E.A.T.
Program” 10th Annual Youth Violence Prevention Conference. University of Missouri-St. Louis, St. Louis, MO, April 2011.
38. Finn-Aage Esbensen. “G.R.E.A.T. Evaluation: Preliminary Findings.” National Gang
Symposium, Orlando, FL, June 2011.
39. Finn-Aage Esbensen. “Process and Outcome Evaluation of the Gang Resistance Education and Training (G.R.E.A.T.) Program.” Children’s Justice and Safety Conference, OJJDP, Washington, DC, October 2011.
40. Kristy Matsuda, Finn-Aage Esbensen, and Dana Peterson. “The Effect of Gang Structures
on Gang Member Attitudes and Behavior: An Empirical Examination.” American Society of Criminology, Washington, DC, November 2011.
41. Chris Melde and Finn-Aage Esbensen. “The Proximate Impact of Gang Desistance: A
Turning Point Framework.” American Society of Criminology, Washington, DC, November 2011.
42. Stephanie A. Wiley and Finn-Aage Esbensen. “Revisiting Labeling Theory: Does
Official Intervention Result in Deviance Amplification?” American Society of Criminology, Washington, DC, November 2011.
43. Kirstin A. Morgan. “Exposure to Risk: Examining the Impact of Risk Factors on Gang
Involvement.” American Society of Criminology, Washington, DC, November 2011.
44. Adrienne Freng, Chris Melde, Kristy N. Matsuda, and Terrance J. Taylor. “Gang Membership and Adherence to the Code of the Streets.” American Society of Criminology, Washington, DC, November 2011.
45. Dana Peterson and Kirstin A. Morgan. “Sex Differences in Gang Risk Factors across
Adolescence: Implications for Gang Prevention.” American Society of Criminology, Washington, DC, November 2011.
46. J. Michael Vecchio. “Exploring and Theorizing Youth Gang Leaving.” American Society
of Criminology, Washington, DC, November 2011.
47. Dena C. Carson. “Examining the Effect of Peers on Changes in Attitudes: A Longitudinal Analysis.” American Society of Criminology, Washington, DC, November 2011.
145
This document is a research report submitted to the U.S. Department of Justice. This report has not been published by the Department. Opinions or points of view expressed are those of the author(s)
and do not necessarily reflect the official position or policies of the U.S. Department of Justice.
48. Dena C. Carson, Terrance J. Taylor, and Finn-Aage Esbensen. “A Longitudinal Analysis
of In-School Victimization as a Risk Factor for School Mobility.” Western Society of Criminology, Newport Beach, CA, February 2012.
49. Stephanie A. Wiley. “Revisiting Labeling Theory: What factors affect future
delinquency?” Western Society of Criminology, Newport Beach, CA, February 2012.
50. Chris Melde and Finn-Aage Esbensen. “Gangs and Violence: Disentangling the Impact of Gang Membership on the Level and Nature of Offending.” Academy of Criminal Justice Sciences Annual Meeting, New York, NY, March 2012.
51. Finn-Aage Esbensen and Dena C. Carson. “Who are the Gangsters?: An Examination of
the Age, Race/Ethnicity, Sex, and Immigration Status of Self-reported Gang Members in a Seven City Study of American Youth.” European Society of Criminology, Bilbao, Spain, September 2012.
52. Finn-Aage Esbensen, Dana Peterson, Terrance J. Taylor, and D. Wayne Osgood. “The
Gang Resistance Education and Training (G.R.E.A.T.): Results from a Multi-Site, Randomized Control Trial.” American Society of Criminology, Chicago, IL, November 2012.
53. Dena C. Carson and Finn-Aage Esbensen. “Youth Gangs and Non-gang Delinquent Peer
Groups: What’s the Difference?” American Society of Criminology, Chicago, IL, November 2012.
54. Terrance J. Taylor, Dena C. Carson, and Finn-Aage Esbensen. “Do social skills mediate
the self-control – violence relationship?” American Society of Criminology, Chicago, IL, November 2012.
55. Stephanie A. Wiley and Finn Aage-Esbensen. “The Negative Consequences of Police
Contact for Gang Youth.” American Society of Criminology, Chicago, IL, November 2012.
56. J. Michael Vecchio. “Pathways Into and Out of Youth Gangs” American Society of
Criminology, Chicago, IL, November 2012.
57. Adrienne Freng, Dena C. Carson, and Finn-Aage Esbensen. “The Racial Composition of Gangs.” American Society of Criminology, Chicago, IL, November 2012.
58. Dana Peterson, Dena C. Carson, and Eric Fowler. “Sex composition of groups and members’ victimization: A replication and extension.” American Society of Criminology, Chicago, IL, November 2012.
59. Kirstin Morgan. “The impact of duration of risk exposure on gang involvement.” Poster presented at American Society of Criminology, Chicago, IL, November 2012.
146
This document is a research report submitted to the U.S. Department of Justice. This report has not been published by the Department. Opinions or points of view expressed are those of the author(s)
and do not necessarily reflect the official position or policies of the U.S. Department of Justice.
60. Lee Ann Slocum, Terrance J. Taylor, and Finn-Aage Esbensen. “The Code of Silence in Schools: An Assessment of a Socio-Ecological Model of Youths’ Willingness to Report School Misbehavior.” American Society of Criminology, Chicago, IL
61. Dena C. Carson, Finn-Aage Esbensen, and Dana Peterson. “A Multi-Method Exploration of Gang Desistance.” Eurogang Program of Research Meeting, June 2013. University of Kent, Canterbury, UK.
62. Chris Melde, Finn-Aage Esbensen, and Dena Carson. “Gang Membership and Involvement in Violence among U.S. Adolescents: A Test of Construct Validity.” Eurogang Program of Research Meeting, June 2013. University of Kent, Canterbury, UK
63. Dena C. Carson, Finn-Aage Esbensen, and Dana Peterson. “A Mixed-Methods Investigation of the Motives, Methods, and Consequences of Gang Desistance.” Annual Meetings of the European Society of Criminology, September 2013. Budapest, Hungary
64. Stephanie A. Wiley, Lee Ann Slocum, and Finn-Aage Esbensen. “The Unintended Consequences of Being Stopped or Arrested: An Exploration of the Labeling Mechanisms through Which Police Contact Leads to Subsequent Delinquency.” European Society of Criminology, Budapest, Hungary, September 2013.
147
This document is a research report submitted to the U.S. Department of Justice. This report has not been published by the Department. Opinions or points of view expressed are those of the author(s)
and do not necessarily reflect the official position or policies of the U.S. Department of Justice.

National Evaluation of the Gang Resistance Education and Training (G.R.E.A.T.) Program
G.R.E.A.T. Officer Training (G.O.T.) Report
Prepared by:
Terrance J. Taylor, Ph.D.
Finn-Aage Esbensen, Ph.D.
University of Missouri-St. Louis
Dana Peterson, Ph.D.
University at Albany
June, 2009
This project was supported by Award No. 2006-JV-FX-0011 awarded by the National Institute of Justice, Office of Justice Programs, U.S. Department of Justice. This research was made possible, in part, by the support and participation of seven school districts, including the School District of Philadelphia. The opinions, findings, and conclusions or recommendations expressed in this paper are those of the authors and do not necessarily reflect the views of the Department of Justice or of the seven participating school districts.
For questions about this report or for more information about the evaluation, please contact:
G.R.E.A.T. Evaluation Department of Criminology & Criminal Justice
University of Missouri-St. Louis St. Louis, MO 63121-4499
Phone: (314) 516-4777 Fax: (314) 516-5048
148
This document is a research report submitted to the U.S. Department of Justice. This report has not been published by the Department. Opinions or points of view expressed are those of the author(s)
and do not necessarily reflect the official position or policies of the U.S. Department of Justice.
Gang Resistance Education and Training (G.R.E.A.T.)
The Gang Resistance Education and Training (G.R.E.A.T.) program is a primary gang
and delinquency prevention program delivered by law enforcement officers in school settings.
The original G.R.E.A.T. program was developed in 1991 by Phoenix-area law enforcement
agencies and quickly adopted by agencies throughout the United States. This curriculum
contained nine lecture-based lessons to be taught primarily in middle-school grades. Results
from an earlier National Evaluation of the G.R.E.A.T. program (1995-2001) found no
differences between G.R.E.A.T. and non-G.R.E.A.T. youths in terms of key behavioral outcomes
the program intended to affect (i.e., involvement in gangs and delinquent behavior).
Based in part on these findings, the G.R.E.A.T. program underwent a critical review that
resulted in substantial program modifications. The revised curriculum consists of 13 lessons
aimed at teaching youths the life-skills (e.g., communication and refusal skills, conflict
resolution and anger management techniques) thought necessary to prevent involvement in gangs
and delinquency. The program’s two main goals are 1) to help youths avoid gang membership,
violence, and criminal activity, and 2) to help youths develop a positive relationship with law
enforcement. The revised G.R.E.A.T. curriculum was piloted in 2001, and full-scale
implementation began in 2003.
Process and Outcome Evaluation of G.R.E.A.T.
In 2006, following a competitive peer review process, the National Institute of Justice
awarded the University of Missouri-St. Louis funding to conduct an evaluation of the revised
G.R.E.A.T. program. This process and outcome evaluation consists of a number of different
components, including student surveys (see Esbensen et al. 2007, 2008, 2009); classroom
149
This document is a research report submitted to the U.S. Department of Justice. This report has not been published by the Department. Opinions or points of view expressed are those of the author(s)
and do not necessarily reflect the official position or policies of the U.S. Department of Justice.

observations in both G.R.E.A.T. and non-G.R.E.A.T. classrooms (see Leugoud et al. 2009);
surveys of school personnel (see Peterson et al. 2009); surveys and interviews with G.R.E.A.T.
officers and G.R.E.A.T. supervisors (see Carson et al. 2009); and observations of G.R.E.AT.
Officer Training (G.O.T.) and G.R.E.A.T. Families sessions. This report provides information
from the G.R.E.A.T. Officer Training (G.O.T.) component of the evaluation.
Overview of G.R.E.A.T. Officer Training (G.O.T.)
This report provides descriptive information about the G.O.T. structure and content.
Additionally, information collected from observations of eight G.O.T. sessions is included. To
this end, researchers attended G.O.T.s in Frisco, TX and Philadelphia, PA (June, 2006); Phoenix,
AZ (July, 2007); La Crosse, WI (August, 2007; June, 2008); Portland, OR (August, 2007;
August, 2008); and Orlando, FL (July, 2008).
G.R.E.A.T. Officer Training (G.O.T.) is intended to prepare officers to deliver the
G.R.E.A.T. program in schools. Since this is often a departure from the normal duties of law
enforcement officers, training is intended to be multi-faceted, rigorous, and comprehensive. The
primary goals of G.O.T. are to familiarize officers with the G.R.E.A.T. program curriculum and
to provide skills needed to successfully teach the program to the target audience (i.e.,
elementary- and middle-school youths). Training officers about the substance of the G.R.E.A.T.
program and methods of working with the target audience is an essential component of program
fidelity (i.e., delivering the program in the field as intended). Additional insights into program
fidelity were assessed through observations of officers delivering the G.R.E.A.T. curriculum in
the evaluation classrooms. (For information on observations of G.R.E.A.T. program delivery in
the school setting, see Leugoud et al. 2009). Surveys and interviews with officers (see Carson et
al. 2008) and surveys of teachers (see Peterson et al. 2009) allowed for triangulation of program
150
This document is a research report submitted to the U.S. Department of Justice. This report has not been published by the Department. Opinions or points of view expressed are those of the author(s)
and do not necessarily reflect the official position or policies of the U.S. Department of Justice.
fidelity. Based on these sources, we conclude that the vast majority of officers were successful
in implementing the program as desired. The purpose of this report is to answer the following
question: To what extent does the G.O.T. account for this quality of program implementation?
G.O.T. Structure
Two different G.R.E.A.T. Officer Trainings (G.O.T.s) are available to officers interested
in becoming G.R.E.A.T. instructors: 1) a 40-hour (i.e., one-week) training for officers with prior
teaching experience, and 2) an 80-hour (i.e., two-week) training for officers with no prior
teaching experience. The 80-hour G.O.T. includes more officer-student modeling of the
G.R.E.A.T. lessons (i.e., “teach-backs”), more detailed information related to the logistics
associated with classroom management, and an additional section on the “transitions” from law-
enforcement/patrol to G.R.E.A.T. instructor, since these topics are important for officers new to
the G.R.E.A.T. program and school environments. Specifics of these two different trainings are
described below.
Both types of G.O.T. have a similar group of staff. There is one training supervisor who
oversees the training. Approximately 5-8 trainers (i.e., officers certified by the National Training
Team [NTT] to instruct others how to teach the G.R.E.A.T. program) are present. One staff
member from the Institute for Intergovernmental Research [IIR] is in attendance to provide
technical assistance to trainers and trainees. One “professional educator” (i.e., a classroom
teacher) is in attendance for part of the training to provide trainees with a session related to
teaching theory and pedagogy. Finally, a “gang expert” provides trainees with a session devoted
to gang trends and characteristics.
151
This document is a research report submitted to the U.S. Department of Justice. This report has not been published by the Department. Opinions or points of view expressed are those of the author(s)
and do not necessarily reflect the official position or policies of the U.S. Department of Justice.
40-Hour Training
The description presented in this report highlights one model of 40-hour trainings and
one model of 80-hour trainings. Trainings observed illustrated some degree of flexibility in the
ordering of topical areas and time schedules. Several of these are noted throughout this report.
On the night immediately preceding training, members of the training team meet to
arrange the room, discuss strategies for effective training sessions, and, if they do not already
know one another, meet and greet. Each day typically begins and ends with a staff meeting
restricted to members of the training team. The morning staff meeting allows the trainers to
revisit the previous day’s session, cover any last minute adjustments to the upcoming day’s
session, and get settled in for the day. The evening staff meetings allows the trainers to review
the day’s progress, discuss any issues which arose during the day (e.g., format, discipline), and
discuss the following day’s session. Additionally, the training supervisors present feedback to
the day’s presenters about their performance, identifying any areas for improvement and/or
highlighting particular strengths that the presenter illustrated during the day. Thus, these staff
meetings provide a confidential setting where the trainers can provide honest feedback about
how the training is going, while also receiving feedback about personal performance. Each of
the staff meetings (morning and evening) is scheduled for approximately 30 minutes, although
that time is flexible depending on the day’s events.
After the morning staff meeting ends, the day begins for the trainees. Trainees are
welcomed and an overview of the day’s objectives is presented.
152
This document is a research report submitted to the U.S. Department of Justice. This report has not been published by the Department. Opinions or points of view expressed are those of the author(s)
and do not necessarily reflect the official position or policies of the U.S. Department of Justice.

Day 1
As with each other training day, the first session begins with a staff meeting for the
trainers. Trainers are typically familiar with each other already, but this allows them to re-
acquaint themselves with one another. After the initial greetings, the training supervisor reminds
the trainers of the training rules, provides an overview of the trainees (e.g., where they are from,
the demographic characteristics of the group) and the training (e.g., goals, objectives, format,
schedule), and provides each group with his/her list of “teams.” These teams (i.e., 5-8 trainees)
become the foundation for much of the later training (addressed later). The initial staff meeting
concludes after trainers are given a brief question and answer session with the training leader.
The G.O.T. generally begins at 8am; trainees are prompted to take their designated seats
(name tents identify the assigned seating), where binders containing the course information are
already awaiting. The training leader provides a welcome statement and briefly explains the
purpose of the training (i.e., to provide trainees with knowledge of the G.R.E.A.T. curriculum
and relevant classroom skills needed to deliver the curriculum). The training supervisor
introduces him/herself, including information about his/her agency, background in law
enforcement, and experience with the G.R.E.A.T. program. The training supervisor then asks
each of the training staff to introduce themselves, providing similar information. Once each of
the trainers has completed introductions, trainees are asked to introduce themselves individually.
After the introduction phase, trainees are informed of their teams (i.e., trainer and other trainees).
Trainees are asked to complete some brief paperwork for recordkeeping. This process takes
approximately one hour, after which there is a short break (approximately 10 minutes).
After the break, the trainers and trainees reconvene. One member of the training team is
designated to provide an overview of the G.R.E.A.T. program. This overview includes
153
This document is a research report submitted to the U.S. Department of Justice. This report has not been published by the Department. Opinions or points of view expressed are those of the author(s)
and do not necessarily reflect the official position or policies of the U.S. Department of Justice.
information on the history and development of G.R.E.A.T., how the program is structured (e.g.,
roles of Bureau of Justice Assistance and G.R.E.A.T. National Policy Board), and what it is
intended to do (i.e., reduce youth violence and gang membership and improve police –
community relations). Trainees are encouraged to look at the binder containing the curriculum
and familiarize themselves with the material. The overview of the G.R.E.A.T. program takes
approximately 40 minutes, after which there is another short break (approximately 10 minutes).
After the second break, the training resumes. At this point, a professional educator (e.g.,
classroom teacher) provides an overview of basic educational theory. Trainees are informed of
the importance of recognizing different learning styles and basic pedagogical methods to
stimulate student learning. This section on educational theory also typically involves some
exercises for the trainees. The educational theory component typically lasts two hours, after
which trainees are released for a one-hour lunch break.
After lunch, trainers and trainees reconvene for a group photo followed by a short break
(approximately five minutes). This process typically lasts approximately 30 minutes.
After the photo, training resumes. The professional educator presents additional
information on best practices in classroom instruction. This second component of the
educational theory training lasts approximately one-hour, after which there is a short break
(approximately 10 minutes). The educational component focuses on three primary areas. First, a
general overview of the target population is covered. This section focuses on the period of
adolescence, including physical, emotional, social, and intellectual changes occurring in youth
during this time. The second component focuses on different types of learning styles (i.e., visual,
audio, and kinesthetic). During this component, the educator presents information on how some
students learn best by watching, some by hearing, and some by doing. Discussion of these
154
This document is a research report submitted to the U.S. Department of Justice. This report has not been published by the Department. Opinions or points of view expressed are those of the author(s)
and do not necessarily reflect the official position or policies of the U.S. Department of Justice.
learning styles serve as a transition to discussion of the importance of incorporating different
types of teaching styles and classroom examples and exercises to meet the needs of students with
different learning styles.
After the break, a different member of the training staff provides an introduction and
overview of the first two lessons of the elementary school curriculum. It is stressed that while
the core G.R.E.A.T. program is aimed at youths in middle school (the period when they are most
likely to become involved with gangs), the elementary curriculum is an important component of
G.R.E.A.T. It is stated that reaching youths in their elementary years is important because it
allows prevention before most youths have been directly exposed to gangs. The first two lessons
are briefly modeled by the instructor for approximately 50 minutes. This is followed by a short
break (approximately 10 minutes).
After the break, Lessons 3 – 6 of the elementary component are covered. The key points
of the lesson are highlighted and briefly modeled for approximately 50 minutes. This is again
followed by a short break (approximately 10 minutes).
After the final break, the officers convene to their team meetings. The first day’s team
meeting provides an opportunity for officers to meet the other members of their teams and their
team leader. Introductions are exchanged and the team leader informs the officers what to expect
during the rest of the week. Additionally, the team leader informs his/her team that the officers
should feel comfortable approaching the team leader with questions, concerns, or advice during
the duration of the training. The trainees’ day concludes after the team meeting, while the team
leaders reconvene for the afternoon staff meeting.
155
This document is a research report submitted to the U.S. Department of Justice. This report has not been published by the Department. Opinions or points of view expressed are those of the author(s)
and do not necessarily reflect the official position or policies of the U.S. Department of Justice.
Days 2 & 3
The team leaders and training supervisor reconvene at approximately 7:30 AM for a staff
meeting. Trainees arrive approximately 30 minutes later to take their seats. Seating is assigned
by trainers and changes each day, so trainees must find their assigned seats prior to the start of
the day. Each morning, trainees arrive to find additional G.R.E.A.T.-related trinkets waiting for
them at their seats. After a brief welcome and some “ice-breaker” activities (e.g., trivia where
trainees answering correctly get additional G.R.E.A.T.-related prizes), the training supervisor
outlines the day’s goals and objectives.
In the sample outline included (Appendix A), a national gang expert provides an
overview of gang issues lasting approximately four hours during the morning of Day 2.1 The
gang expert is typically an officer who has worked in gang enforcement. Information about
trends in gang activity and methods of identifying gang members (e.g., tattoos) and gang activity
(e.g., graffiti) in communities are provided.
After the gang trends session, there is a lunch break lasting approximately one hour.
Once lunch is over, the training turns to the middle school curriculum. The remainder of Days 2
and 3 are devoted entirely to this aspect, which is considered the core program. Lessons are
either “modeled” or “overviewed” by one member of the training team. The modeling consists
of the presenter teaching the lesson as he/she would in the classroom, using a block of about 50
minutes. Whenever there are key points, the trainer sometimes calls a “time-out” to break from
the teaching role and add the additional information as a sidebar; in other cases, a trainer models
the entire lesson “in character” and holds additional material until after the lesson is completely
1 It should be noted that the “gang trends” session often varies in when it is delivered due to scheduling issues. For example, in one training observed, the gang trends section was presented after lunch on Day 3 and lasted two (rather than four) hours. This illustrates that not all of the trainings are structured in identical manners, although the content included is nearly identical across trainings.
156
This document is a research report submitted to the U.S. Department of Justice. This report has not been published by the Department. Opinions or points of view expressed are those of the author(s)
and do not necessarily reflect the official position or policies of the U.S. Department of Justice.
modeled. This allows the trainees to see how members of the training team actually present the
lesson, which is expected to carry over into the actual classroom setting. In some sessions,
trainees were instructed to act as “typical middle-school students,” while in others they were
simply instructed to follow along and participate in the lesson. Lesson overviews are shorter
(approximately 30-35 minutes), where the trainer covers the key points of the lesson without
taking on the role of a classroom teacher.
Day 4
After the morning staff meeting, Day 4 begins with a typical introduction of the day’s
goals and objectives. Trainees then complete a multiple-choice test about the G.R.E.A.T. goals
and content, followed by a review of the correct answers (approximately one hour). Each trainee
then models one lesson in front of the class, providing an opportunity to practice public
speaking, present one G.R.E.A.T. lesson, and receive feedback on the presentations. Lessons are
chosen by trainees during team meetings earlier in the week, so trainees have a chance to
practice before presenting to the class. Short (approximately 5 minute) breaks are structured
between lesson modeling.
Day 5
Day 5 begins after the morning staff meeting. The day’s goals and objectives are
presented before training moves to the remainder of the G.R.E.A.T. curriculum. Approximately
45 minutes are devoted to each of the remaining G.R.E.A.T. components (G.R.E.A.T. Families
and the G.R.E.A.T. Summer component) and Issues of G.R.E.A.T. Concern, with ten minute
breaks structured between each section. The G.R.E.A.T. Families section provides an overview
157
This document is a research report submitted to the U.S. Department of Justice. This report has not been published by the Department. Opinions or points of view expressed are those of the author(s)
and do not necessarily reflect the official position or policies of the U.S. Department of Justice.
of the importance of having families involved in youth prevention programs, key components of
the G.R.E.A.T. Families curriculum are highlighted, and examples of popular G.R.E.A.T.
Families activities are provided. Similarly, the G.R.E.A.T. Summer component is highlighted as
an important and fun way in which the G.R.E.A.T. curriculum can be supplemented. As the
Summer component varies across sites, ideas are presented for innovative methods of
implementing a summer program and logistical issues associated with moving out of the
classroom. The “Issues of G.R.E.A.T. Concern” section covers information about the
G.R.E.A.T. program, including copyright information, where to get course materials, and
additional information about how the G.R.E.A.T. program is structured. The 40-hour training
concludes with a “final evaluation” which thanks trainees and trainers for their participation and
a “pep talk” about the importance of the G.R.E.A.T. program as a method of reducing youth
violence and gang activity. While the content of these sections were consistent across
observations, it is important to highlight that some trainings covered this topical material on days
other than Day 5.
80-Hour Training
The 80-hour training sessions are similar in format to the 40-hour sessions. The main
difference between the two is that the 80-hour sessions are aimed at officers who have limited
teaching experience. Thus, the 80-hour training devotes a week to trainees practicing teaching
the lessons. Additionally, two components are unique to the 80-hour training: 1) Public Speaking
and 2) Transitions.
Public speaking is a skill obviously required for instructors. The 80-hour training session
incorporates public speaking components for the participants during each day. These begin with
158
This document is a research report submitted to the U.S. Department of Justice. This report has not been published by the Department. Opinions or points of view expressed are those of the author(s)
and do not necessarily reflect the official position or policies of the U.S. Department of Justice.
smaller exercises, eventually building to a “walk-through” of a G.R.E.A.T. lesson. For example,
one popular exercise at the beginning of the training session involves trainees being called to the
front of the room, one at a time, where they receive an index card from the training supervisor.
Each index card has a word (e.g., corn, snow, socks) on it. Participants are expected to talk to
the rest of the class about the selected word for two minutes. Gradually, the public speaking
exercises become more elaborate. On Day 2 of the 80-hour training, participants are expected to
give a three-minute demonstration speech to the rest of the trainees. Topics are quite broad, and
can generally be anything that participants choose, as long as the topic is not “police-related.”
Sample topics include “how to tie your shoes,” “changing a car tire,” and “how to prepare [insert
food here].” The 80-hour training session concludes its public speaking component by having
trainees individually overview a G.R.E.A.T. lesson in front of the class. To facilitate learning,
trainees present their overviews to other members of their teams and team leaders throughout the
week (i.e., “coaching facilitations”). This allows trainees to practice and receive feedback before
presenting to the entire group.
The “Transitions” section is a unique component intended to help officers change their
orientation from law enforcement to prevention program provider. Since few of the officers in
the 80-hour training sessions have experience teaching in schools, the Transitions section
provides an important segue for officers to broaden their views of policing. As stated by one of
the trainers presenting this section, officers need to learn that “what works in the streets often
doesn’t work in the classroom.” Thus, it is important that officers view their participation in the
G.R.E.A.T. program as a transition to a new role, one that provides the officers with a unique
opportunity to work in an unfamiliar role within a community. For example, while officers may
be accustomed to visiting schools for law enforcement-related duties, the school community (and
159
This document is a research report submitted to the U.S. Department of Justice. This report has not been published by the Department. Opinions or points of view expressed are those of the author(s)
and do not necessarily reflect the official position or policies of the U.S. Department of Justice.

subsequent role of the officer) is different when an officer is teaching the G.R.E.A.T. program.
Officers learn about adolescents, the middle school environment, and alternatives to the
“enforcement” role that officers typically have while on patrol.
Assessments of G.R.E.A.T. Officer Training (G.O.T)
As previously stated, one of the goals of the National Evaluation of G.R.E.A.T. was to
assess the quality of the G.O.T.s. To this end, members of the research team observed a total of
eight G.O.T.s conducted between June 2006 and August 2008. A diversity of locations and
times were selected (two trainings observed in each of two sites, one training observed in six
sites) with at least one training observed in each of the five G.R.E.A.T. regions2 [Midwest (2),
Northeast (1), Southeast (1), Southwest (2), and West (2)]. Observers were expected to evaluate
the training on multiple criteria, including: 1) coverage of the G.R.E.A.T. components (primarily
the middle-school component), 2) styles and strategies for modeling effective classroom
delivery, and 3) adherence to the training guidelines. The overarching goal was to assess the
extent to which G.O.T. prepared officers for delivering the G.R.E.A.T. program in the field.3
G.O.T. Structure
The structure of G.R.E.A.T. Officer Training presented above provides one example of
the organizational “flow” used in the G.O.T.s. While each of the trainings observed covered the
same curricular content, the organization of that content varied across the trainings. For
2 G.R.E.A.T. regions will soon be reduced from five to four: 1) West, 2) Southwest, 3) Southeast, and 4) Midwest Atlantic. The Midwest Atlantic region will encompass most of what are currently the Northeast and Midwest regions, although some of the specific regional boundaries will be modified. 3 Observations of 522 G.R.E.A.T. sessions were also conducted “in the field” (i.e., middle-school classrooms) to assess program fidelity. Results of those observations are reported in a separate document (Leugoud et al 2009).
160
This document is a research report submitted to the U.S. Department of Justice. This report has not been published by the Department. Opinions or points of view expressed are those of the author(s)
and do not necessarily reflect the official position or policies of the U.S. Department of Justice.

example, in one session, the G.R.E.A.T. Core Curriculum was covered after the G.R.E.A.T.
Families, G.R.E.A.T. Summer, and Issues of G.R.E.A.T. Concern segments. In two other
sessions, the Gang Component was covered at the end of training. Discussions with training
supervisors illustrated that the curricular areas sometimes needed to be rearranged to
accommodate members of the training team. One observer highlighted that the implications of
organizing the curriculum is important, noting “reorganization of agenda does not seem to work
as well; it seems odd to do G.R.E.A.T. Families and Summer before Core; Issues of G.R.E.A.T.
Concern also seems as though it would be more effective after Core.”
This flexibility in the ordering of training sections must be highlighted, as it can impact
the natural flow of the curriculum content. The G.R.E.A.T. curriculum is based upon a
“building-block” approach where each lesson builds upon the prior lesson. It is recommended
that the training be assessed to also reflect this approach.
G.O.T. Trainers
Trainers must receive additional certification from G.R.E.A.T. to be eligible to serve as
trainers; thus, these trainers should be considered the most qualified to teach trainees how to
deliver the program. Observers generally noted that trainers were good at covering the key
points of the program during training, although the trainers varied in terms of their familiarity
with the program, presentation styles, and “comfort level” with individual lessons.
Trainers should also represent a broad diversity of the locales in which the G.R.E.A.T.
program is delivered. G.O.T. trainers in the observed trainings represented a broad cross-section
of officers implementing the G.R.E.A.T. curriculum, including a mix of males and females,
members of different racial and ethnic groups, and officers from a broad range of agencies.
161
This document is a research report submitted to the U.S. Department of Justice. This report has not been published by the Department. Opinions or points of view expressed are those of the author(s)
and do not necessarily reflect the official position or policies of the U.S. Department of Justice.
Discussions with training supervisors highlighted the importance of the “right mix” of trainers in
the G.O.T.s. Trainers are invited to participate in trainings, and the trainers often work together
in different training sessions. Observers of the G.O.T.s noted the diversity of the training teams,
as well as the positive working relationship these trainers had during the training sessions.
One issue which arose consistently in the observations that needs to be addressed is
trainers’ behaviors when they are not leading the training. In most cases, trainers were working
on various tasks in the back of the room when they were not responsible for leading the training
(e.g., modeling lessons). In each of the trainings observed, there were instances when the
trainers at the back of the room became loud and somewhat disruptive while someone else was
speaking. In some cases, this was when another trainer was modeling a lesson; in other cases,
this occurred when trainees were presenting. As noted by one observer:
“Early in the day, the trainers’ behavior was very distracting. While this changed once the training turned to the G.R.E.A.T. material, the trainees’ behavior often became disruptive when the trainers were modeling the program. It seemed that the trainees were more attentive and responsive to the presentations by the other trainees and the trainers more attentive and responsive to the presentations by the other trainers today. This training seems to be on the edge at times, with trainers potentially losing their credibility with and respect of the trainees (and vice versa). This is in stark contrast to the verbal messages that are shared by the trainers about the importance of establishing and maintaining credibility.”
It is imperative that trainers consistently conduct themselves in a manner consistent with
the ground rules provided for trainees. Even when not in front of the room, they must remember
that they are “modeling” appropriate behavior. While some minor disruptions may be expected,
it is crucial that such disruptions be kept to a minimum.
Additionally, during one G.O.T., the training supervisor was viewed as contributing very
little to the training, other than introducing the other trainers when it was their turn to lead the
class. According to this observer, “Cost saving comment – what is role of training supervisor?
162
This document is a research report submitted to the U.S. Department of Justice. This report has not been published by the Department. Opinions or points of view expressed are those of the author(s)
and do not necessarily reflect the official position or policies of the U.S. Department of Justice.
X really didn’t do anything and often wasn’t even paying attention to what was going on.” Other
observers commented on the role of the training supervisor. For example, one noted that:
“It was interesting to hear the training supervisor describe his role as a ‘cheerleader.’ This perfectly described the role he has been playing. He keeps a very positive environment for the training. His role is to evaluate the performance of the training team, while the training team members are expected to evaluate the performance of the participants on their ‘team.’”
The training supervisor noted by the second observer was also noted to be actively involved in
nearly all aspects of the training, spending most of the G.O.T. presenting, facilitating trainers’
modeling, and assessing trainers’ performance. These observations highlight the discrepancy in
the role (and utility) of the training supervisor across trainings, and leads to a recommendation
that the role of the training supervisor be clearly delineated and consistently implemented across
the G.O.T. sessions.
G.O.T. Participants
Officers attending the G.O.T. sessions varied across the training observed. One G.O.T.,
for example, was held by a “host” agency where nearly all of the trainees were from that agency.
Another G.O.T., however, had only two officers (out of approximately 40 trainees) from the
locale in which the training was held, with the remainder coming from multiple agencies
representing a broad cross-section of the United States. Thus, the composition of participants
varied across trainings.
Participants differed in their reasons for attending G.O.T. In some cases, officers
indicated that they had volunteered to attend, in other cases officers indicated that they were
assigned by their agency to attend, either because the agency was planning on implementing the
G.R.E.A.T. program or because the officer had moved into a new assignment that involved
163
This document is a research report submitted to the U.S. Department of Justice. This report has not been published by the Department. Opinions or points of view expressed are those of the author(s)
and do not necessarily reflect the official position or policies of the U.S. Department of Justice.
becoming a G.R.E.A.T. officer. The diversity of reasons why officers attended training was
summarized by one observer:
“3 re-trys for the certification [i.e., not successful at completing training on two
prior attempts], one because of inter-agency politics; one of the men on his team
was chief of a reservation police department who does not have the manpower in
his department to implement program, politics of his job is why he is here. One
officer is ‘right out of the army and very enthusiastic.’… Two officers from a
particular city were “forced” to come here by department, they told team leader
they had been trying to get out of this assignment for the last month but were
unable to do so, leader seemed to think that they were just burdened by coming
here because they also teach DARE; stated their attitude was “ok” but nothing
negative enough that would prevent them from doing fine in the field, another
team leader said “as long as you are willing to work” (in regard to the officers);
another officer from this group had been trying to get to this training for the last
[several] years (since 1998) and finally got to come here, he is very excited about
the training.”
This demonstrates the range of reasons why officers attend the G.O.T. sessions.4 Each of the
observed training sessions involved staff meeting discussions about why their team members
were at G.O.T. Trainers appear cognizant of the varied reasons why officers are in attendance
and take a reasonable approach to work with officers, regardless of why they are there.
Observers also noted that trainees (and in some cases, trainers), tended to “lose steam”
towards the end of the morning (i.e., shortly before lunch) or late afternoon (i.e., shortly before
4 It also corresponds well with results reported from surveys of G.R.E.A.T.-trained officers in the seven cities participating in the National Evaluation (Carson et al. 2008).
164
This document is a research report submitted to the U.S. Department of Justice. This report has not been published by the Department. Opinions or points of view expressed are those of the author(s)
and do not necessarily reflect the official position or policies of the U.S. Department of Justice.
the end) of training days. This is perhaps not surprising, given the amount of material covered
during the trainings. As stated by one trainer at the beginning of the week, G.R.E.A.T. training
is “unlike any police training you’ve had because you have to participate” and the training is full
of material. Observers noted no specific sections that seemed to lose participants’ interests more
than others. Additionally, the structure of the trainings appears to do a reasonable job of
providing breaks throughout the day to allow participants to decompress and refocus.
Interestingly, observers consistently noted that the breaks could be best described as “working
breaks” with trainers and trainees mingling to talk about the G.O.T. and/or the G.R.E.A.T.
program.
Observers also suggested a number of areas that may enhance trainees’ experiences in the
G.O.T. sessions. One issue which consistently arose was observers’ statements regarding
trainees’ lack of note-taking during the training. While the binders provide substantial material
necessary for officers during training, trainees should be explicitly encouraged to take notes.
These will be the materials on which officers primarily rely to deliver the G.R.E.A.T. curriculum
once they leave training. By encouraging note-taking, trainers could better ensure that trainees
were paying attention (rather than causing distractions) and also reinforce important issues by
advising trainees to “check their notes.” This would also provide trainees with additional
material to take with them when they leave training. Note-taking by participants, however, is not
explicitly encouraged and may be informally (although perhaps unintentionally) discouraged.
For example, the importance of taking notes among trainees may be hindered through early
notification that the test will be “open book” and all answers can be found in the binders. There
appears to be little reason to inform trainees about this beforehand, as the test is a relatively
simple multiple-choice assessment.
165
This document is a research report submitted to the U.S. Department of Justice. This report has not been published by the Department. Opinions or points of view expressed are those of the author(s)
and do not necessarily reflect the official position or policies of the U.S. Department of Justice.
The second component involves highlighting the extended teacher activities.
Observations of G.O.T. provided mixed evidence as to how much attention was paid to these
supplemental materials. For example, some observations noted that the extended teaching
materials associated with each lesson were covered in detail and trainees were strongly
encouraged to elicit teachers’ implementation of the activities to supplement the G.R.E.A.T.
program, other observations indicated that the teacher activities were briefly covered, and other
observations indicated that the extended teacher activities were given little attention during
training. Given survey findings that teachers5 rarely implement the extended teacher activities,
often because they are unaware of them, it is recommended that the importance of these activities
be highlighted throughout G.O.T. sessions.
A third issue involves the perceptions of what middle school students are typically like.
While the observers typically noted the high quality of the training teams (see above) and
education specialists (see below), they also consistently noted the negative perceptions that
trainees seemed to have about middle school students. While this is perhaps not surprising,
observers noted that trainers and education specialists often did not dispel the negative
stereotypes of students held by officers. Since some trainings expected trainees to “act like
typical middle school students,” and officers had negative perceptions of middle school students,
it is perhaps not surprising that observers noted disruptions arising during some of the lessons.
Some of the trainees took the act to the extreme, faux confronting trainers or simply not paying
attention during the lesson modeling. It is recommended that the G.R.E.A.T. National Training
Team reconsider whether it is necessary to tell the trainees to act like students. If so, it is
5 Findings from surveys of school personnel at the National Evaluation of G.R.E.A.T. schools are discussed in more detail in a separate report (Peterson et al. 2009).
166
This document is a research report submitted to the U.S. Department of Justice. This report has not been published by the Department. Opinions or points of view expressed are those of the author(s)
and do not necessarily reflect the official position or policies of the U.S. Department of Justice.
important to develop a mechanism where the negative stereotypes can be addressed and framed
within a positive framework in training.
Education Specialists
Education specialists assist by providing educational-related sections during each of the
G.O.T.s. These education specialists cover material related to characteristics of adolescence,
classroom settings, school operations, learning disabilities, and effective methods of teaching
pedagogy. Observers noted the “buy-in” to the G.R.E.A.T. program exhibited by the Education
Specialists, demonstrated through their statements about being excited about the program and
stressing the importance of prevention.
Observers also highlighted the role that the Education Specialists played during the
G.O.T. sessions observed. Assessments indicated that the Education Specialists have an
important role, particularly during the 80-hour training sessions. As officers attending the 80-
hour sessions typically do not have the classroom experience of officers attending the 40-hour
trainings, the importance of topics covered by the Educator is important to prepare officers for
their role as educators when delivering the G.R.E.A.T. curriculum. Observers noted that the
Education Specialists generally did a good job covering the key issues associated with the
content areas necessary for officers to be reasonably expected to succeed in G.R.E.A.T. program
delivery.
Observers did note, however, some areas which could be improved. While each of the
Educators covered the key areas, they varied in the amount of coverage of each section. For
example, some Educators were better than others at making the “educational theory” section
applicable to the officers. Some of the material covered (e.g., Maslow’s hierarchy of needs) may
167
This document is a research report submitted to the U.S. Department of Justice. This report has not been published by the Department. Opinions or points of view expressed are those of the author(s)
and do not necessarily reflect the official position or policies of the U.S. Department of Justice.
be important information to have available, but its utility for officers delivering the G.R.E.A.T.
program is questionable. Similarly, specific characteristics associated with learning disabilities
may be less important than highlighting the importance that officers are tolerant of students with
differential needs and that officers work closely with classroom teachers to find ways of
effectively teaching the G.R.E.A.T. curriculum to all students.
A second issue which should be reexamined is the time that the Education Specialists
attend the G.O.T. sessions. The Educators were typically at training for the beginning of the
training, presented their section when scheduled, and then left the training. It is recommended
that G.R.E.A.T. consider having these Education Specialists play a larger role during the one day
they are on site for the 40-hour training and consider expanding their on-site time to two days
during 80-hour sessions. The G.O.T. observations highlight that the Educators have substantial
expertise which may be particularly helpful for G.O.T. participants. Such contributions could
include, but not be limited to, providing additional “helpful hints” for participants at the
conclusion of each modeled lesson, assisting trainers in answering questions related to working
with school personnel to get the G.R.E.A.T. program into the schools, and highlighting ways in
which classroom teachers may take an expanded role in reinforcing the lessons of G.R.E.A.T. In
short, it appears that the Education Specialists’ contributions to training remain somewhat under-
utilized.
The Gang Component
As one key goal of the G.R.E.A.T. curriculum is to prevent youth from becoming gang
members, it is imperative that officers are familiar with issues related to gangs and gang
membership. This is a particularly difficult task, however, for a national program as gangs are
168
This document is a research report submitted to the U.S. Department of Justice. This report has not been published by the Department. Opinions or points of view expressed are those of the author(s)
and do not necessarily reflect the official position or policies of the U.S. Department of Justice.
typically localized in nature. That is, gangs vary across communities. Observers of the training
sessions, however, noted a number of concerns with the “gang component” of trainings.
Specifically, these training sessions often presented gangs as highly organized and national (or
international) in scope. In some cases, this was the primary message of the gang expert. In other
cases, this arose in the discussions after the gang expert had given his (in all observations, the
Gang Expert was male) presentation. Regardless of the timing, observers consistently noted that
the “take home message” from the gang component was based on stereotypical notions of gangs
and gang members.
The gang component of G.O.T. may need to be re-assessed. We note the difficulty posed
by the structure of a national-level program aimed at typically localized problems. That is, it is
difficult to maintain consistency in the gang component across training sessions when the nature
of the gang problem facing officers varies by locale. We are unable to provide specific
suggestions as to how this may be best accomplished, however, as it may require substantial
restructuring of training sessions. For example, trainees attending G.O.T. sessions often come
from a number of different jurisdictions. One possible approach would involve that, whenever
possible, trainees come from the same jurisdiction. Gang experts from the jurisdiction in which
the training is held could possibly be hired as consultants to provide the gang component.
Conversely, the gang component could be restructured in a manner to highlight the similarities
and differences (i.e., patterns and deviations) across gangs in multiple communities. Such an
approach could focus on the risk factors associated with gang membership and how the
G.R.E.A.T. program is suited to specifically address these risk factors. One potential approach
would be to contract with IIR to have their gang experts provide the gang component.
Additionally, incorporating the gang typology devised by Cheryl Maxson and Malcolm Klein
169
This document is a research report submitted to the U.S. Department of Justice. This report has not been published by the Department. Opinions or points of view expressed are those of the author(s)
and do not necessarily reflect the official position or policies of the U.S. Department of Justice.
(1995) and/or bringing in a “gang scholar” familiar with the research could serve as mechanisms
for addressing the variation in gangs across locales but also to emphasize that most gangs are not
“traditional” gangs.
Coverage of the G.R.E.A.T. Components
The G.R.E.A.T. program has four main components: 1) the middle-school curriculum, 2)
the elementary-school curriculum, 3) the family curriculum (i.e., G.R.E.A.T. Families), and 4)
the summer curriculum. Observers were particularly attentive to the coverage of the middle-
school and families components during G.O.T.s.
Observers noted that trainers generally did a good job in highlighting key elements of the
G.R.E.A.T. program, including the “skills-building” approach, importance of delivering the
program exactly as intended, the program’s use of “scientifically-proven” content and delivery
mechanisms, and its intention to supplement (rather than replace all) other programs.
Additionally, the history of the G.R.E.A.T. program and its revisions over time were covered
well. In some ways, the program’s strengths may be somewhat overstated. For example, the
previous National Evaluation’s more positive cross-sectional findings are stressed, while the less
favorable longitudinal findings are not covered, and in at least one instance a trainer told trainees
that the “results [of the ongoing evaluation] are not available yet, but [(s)he is] pretty certain they
will show the same positive results.” This is an optimistic assessment, but one consistent with
preliminary analyses (see Esbensen et al. 2009).6
G.O.T. trainers generally did a good job covering the content of the core G.R.E.A.T.
curriculum. This was accomplished through two mechanisms: overviews and lesson modeling.
6 The Principal Investigator first reported preliminary results examining data collected during the first three waves of student surveys to the National Policy Board in December 2008.
170
This document is a research report submitted to the U.S. Department of Justice. This report has not been published by the Department. Opinions or points of view expressed are those of the author(s)
and do not necessarily reflect the official position or policies of the U.S. Department of Justice.
Each of the trainings observed contained extensive lesson modeling. The process of lesson
modeling involved a trainer delivering the curriculum as (s)he would in a normal classroom
setting. That is, trainers shifted to an “instructor mode” where they acted as if they were
presenting to a classroom of middle school students. Trainees assumed the role of students,
participating in the exercises that middle schools students are expected to complete. In most
cases, trainees were instructed to “act like adults but ask middle school questions” during the
lesson models.
Trainers generally covered the lesson content exactly as presented in the binder. In most
cases, trainers had a copy of curriculum with them while modeling and looked down to read
sections verbatim. Trainers varied in terms of their “flow” of presenting the material, with some
trainers appearing more comfortable in front of the classroom than others. Each of the trainers
illustrated a different presentation style, demonstrating a range of approaches to introducing
individual personality into the structured lessons. Thus, trainees were exposed to different
teaching styles and could be expected to recognize that the curriculum may be somewhat
“canned” but the presentation of the material is not.
Trainers also modeled the activities in the G.R.E.A.T. lessons. Trainers again illustrated
different styles in running the exercises. For example, some of the trainers appeared to be more
comfortable (and thus generally more effective) in eliciting participation from the “students.”
Additionally, some “instructors” were better able to maintain student attention than others, and
some trainers were more successful than others at dealing with inattentive or disruptive students.
It is important to note, however, that the exercises were generally modeled as intended and
trainers modeled different methods of appropriate classroom management strategies.
171
This document is a research report submitted to the U.S. Department of Justice. This report has not been published by the Department. Opinions or points of view expressed are those of the author(s)
and do not necessarily reflect the official position or policies of the U.S. Department of Justice.
Utilization of Teaching Aids/Targeting Different Learning Styles
One of the key issues addressed by the Education Specialist is different types of learning
styles used by students. Differences between auditory and visual learners, for example, were
extensively covered. During the modeling of lessons, trainers highlighted the importance of
meeting the needs of different types of learners by using different teaching methodologies.
Some instructors made more extensive use of visual aids (such as flip charts) than others, while
others employed more extensive use of classroom discussions. Thus, the modeling of lessons
reinforced many of the recommendations provided by the Education Specialists.
Observers often noted, however, that these skills were not consistently explicitly
reinforced during trainees’ presentations. While trainers discuss the importance of classroom
management and model mechanisms for effectively managing classrooms throughout the
curriculum, observers consistently noted that a substantial number of trainees did not practice
these skills during their presentations. Additionally, while the training highlights the importance
of reaching different types of learners (such as through the use of visual aids), the use of such
materials were notably absent from many trainees’ presentations. More importantly, trainers
rarely addressed this deficiency. Trainees may benefit from a consistent reinforcement of such
“helpful hints” as they will be expected to use these skills after leaving training.
Time Management
Observers also noted the importance of time management during the training sessions.
To reiterate, trainers are modeling the important elements of teaching the G.R.E.A.T. program.
Thus, it is important that trainers adhere to appropriate time limits during the training sessions to
highlight the importance of adhering to time frames while in the classroom. In short, even when
172
This document is a research report submitted to the U.S. Department of Justice. This report has not been published by the Department. Opinions or points of view expressed are those of the author(s)
and do not necessarily reflect the official position or policies of the U.S. Department of Justice.
trainers are not modeling a lesson, their role as trainers (i.e., “modelers” of the G.R.E.A.T.
program) remains important throughout the course.
One issue that arises throughout the observations of G.R.E.A.T. Officer Training sessions
relates to the time devoted to modeling lessons. Course syllabi typically devoted one hour to
modeling each G.R.E.A.T. lesson. With few exceptions, trainers completed the lesson within the
one-hour block devoted to each lesson and training leaders enforced the specified time frames.
A few instances arose, however, when trainers were unable to complete the entire lesson in the
specified hour. When this occurred, trainers typically skipped the review of the program goals,
although in a few instances, entire components of the lessons were skipped.
While the one-hour blocks devoted to each lesson may be conducive to training sessions,
our observations of G.R.E.A.T. program delivery in the classrooms suggest that few middle-
school classes allow a full hour to complete the G.R.E.A.T. lessons. Officers typically have
about 35 minutes to deliver the G.R.E.A.T. lesson. By the time students are in their seats and all
“housekeeping” issues are completed, officers generally have 30 to 40 minutes to complete the
lesson. Thus, it is recommended that training reflect realistic time frames which officers will
typically encounter when delivering the lessons in schools. Modeling lessons in an hour block
during training appears to overestimate the amount of time available to officers when they
implement the program in the field. This discrepancy may decrease the likelihood that officers
will be prepared to deliver the program with fidelity in the schools. This is particularly true if
trainers are unable to complete the entire lesson in the hour block devoted to the lesson in G.O.T.
173
This document is a research report submitted to the U.S. Department of Justice. This report has not been published by the Department. Opinions or points of view expressed are those of the author(s)
and do not necessarily reflect the official position or policies of the U.S. Department of Justice.
Rules and Rule Enforcement during G.R.E.A.T. Officer Training
Participants are expected to follow set rules when attending G.O.T.s. Trainers cover
these ground rules at the beginning of the training sessions, and staff meetings are often used as a
setting in which trainers decide how to handle rule violations by participants. Observers noted
that the training rules were made explicit at the beginning of the training sessions. Some ground
rules were consistent across trainings (e.g., respect of trainers and other participants, no
inappropriate jokes or comments) while others (e.g., appropriate attire) varied across settings.
Observers also noted instances when participants violated ground rules and how these
violations were handled by the training teams. Two specific instances involved inappropriate
attire. In one training session, a trainee wore clothing that exposed undergarments, while in
another G.O.T. a participant wore shorts on one day and jeans on another. In the underwear
case, the training team decided to announce a new G.R.E.A.T. rule that no underwear could be
shown and the trainee was advised of this. In the other instance, the Training Supervisor
reminded the trainee of the dress code and told him to wear more appropriate clothing the next
day. When this officer showed up wearing inappropriate attire the next day, the Training
Supervisor contacted the trainee’s departmental supervisor and asked him to intervene. A third
incident involved an officer having too many drinks in the bar one night and continued making
lewd phone calls to one of the trainer’s rooms throughout the night. The officer’s agency was
contacted the next day, and the officer was promptly sent home. More common, however, were
“minor infractions,” such as trainees being tardy in the morning or after breaks. These situations
were handled by team leaders in one-on-one meetings with violators. Each of these methods
worked to suitably resolve the situation.
174
This document is a research report submitted to the U.S. Department of Justice. This report has not been published by the Department. Opinions or points of view expressed are those of the author(s)
and do not necessarily reflect the official position or policies of the U.S. Department of Justice.
The Binders
Trainees are provided with several binders at the beginning of training. Materials
included involve rules for training, the G.R.E.A.T. curriculum, and presentations by Education
Specialists and Gang Experts. The materials included in these binders are comprehensive and
provide trainees with the necessary information to succeed in G.O.T. and in delivering the
program. In several instances, however, additional materials were provided to trainees
immediately preceding coverage of the content. Trainees were then instructed to place the
additional materials in their binders. While this approach may work in some instances, observers
consistently noted disruptions associated with providing additional materials to be placed in the
binders. In some cases, the wrong handouts were distributed; in other cases, trainers assumed
that the material was already included in the binders and no handouts were distributed. When
handouts were being distributed, trainees were often conversing with one another, making it
difficult for the trainer to maintain attention. When materials were not in the binders, both
trainers and trainees appeared confused, with trainers referring trainees to the binders, and
trainees flipping through the binders and/or asking other trainees where to find the material. It is
recommended that, whenever possible, all relevant information be included in the binders prior
to their circulation to trainees. When additional materials must be distributed, it is recommended
that these materials are distributed at a predetermined point (e.g., immediately before or during a
scheduled break) to minimize disruptions and maintain training flow.
Recommendations
This report highlights observations of G.R.E.A.T. Officer Training (G.O.T.) conducted
by members of the National Evaluation of G.R.E.A.T. Members of the research team observed a
175
This document is a research report submitted to the U.S. Department of Justice. This report has not been published by the Department. Opinions or points of view expressed are those of the author(s)
and do not necessarily reflect the official position or policies of the U.S. Department of Justice.
total of eight trainings, including 40- and 80-hour sessions, in each of the G.R.E.A.T. regions
between 2006 and 2008. Each component of the trainings was assessed, and recommendations
are provided.
These observations led to a number of conclusions, including:
1) Training sessions cover the key components of G.R.E.A.T. (especially the “core” middle-
school component) in a manner that trainees should reasonably understand the
G.R.E.A.T. program upon completion of training. The lesson contents are sufficiently
covered by the trainers both in their lesson modeling and the content included in the
binders.
2) Training sessions are generally well-organized, have consistent rules and discipline for
rule infractions, and adherence to specified time-frames. Observers noted that trainers
worked together before, during, and after training days to ensure everything was on
schedule. The morning and afternoon staff meetings provide a good setting for prepping
for the day’s events and re-capping the day’s session. These staff meetings were
particularly useful as a method of gathering feedback from other trainers about how the
training sessions were operating and providing feedback about the status of trainees’
progression. Of particular note were the collaborative efforts to identify and handle
potential problems and take a proactive approach to dealing with them.
3) Trainers do a good job of modeling the G.R.E.A.T. lessons and classroom management
strategies. This modeling presents trainees with the ability to see how G.R.E.A.T. is
expected to be delivered in a classroom setting. Observers noted that trainers illustrated
different instructional styles, providing trainees with an opportunity to see different
176
This document is a research report submitted to the U.S. Department of Justice. This report has not been published by the Department. Opinions or points of view expressed are those of the author(s)
and do not necessarily reflect the official position or policies of the U.S. Department of Justice.
methods of classroom instruction, which may be used once the officers begin delivering
the program in their communities.
4) Education specialists do a good job of covering key topics associated with adolescence,
issues of importance to schools, and teaching pedagogy. Observers consistently noted
that the education specialists were well-prepared, knowledgeable about the topics, had a
good rapport with trainers, and were able to convey necessary information to trainees in
an easy-to-comprehend format.
Observers noted a number of areas which may deserve additional consideration in efforts
to improve G.R.E.A.T. Officer Training. Specifically, the following suggestions are presented:
1) The ordering of how G.R.E.A.T. components are presented during G.O.T.s should be
assessed to determine the best “flow” of the curriculum. Observers noted that the timing
in which lesson content was covered varied across trainings and that this sometimes made
for awkward transitions. As the G.R.E.A.T. curriculum is structured in a “building-block
approach” where each lesson builds upon prior lessons, trainings should be structured in a
similar manner. Once a standard training schedule is developed, every effort should be
made to maintain consistency in this training structure.
2) The time-frames devoted to lesson modeling may be inconsistent with the amount of time
officers have available when in the school setting. The one-hour blocks devoted to lesson
modeling in training appear to be substantially longer than actual class periods in typical
middle schools in which the program is delivered. (Our classroom observations found
that officers typically had 30 to 40 minutes to cover each lesson in the schools.) This
discrepancy may reduce the likelihood that officers are able to deliver the G.R.E.A.T.
curriculum with fidelity (and consistent with training modeling) in the classroom setting.
177
This document is a research report submitted to the U.S. Department of Justice. This report has not been published by the Department. Opinions or points of view expressed are those of the author(s)
and do not necessarily reflect the official position or policies of the U.S. Department of Justice.
3) The expertise of the Education Specialists remains somewhat untapped. The Education
Specialists provide an important contribution to the G.O.T.s, particularly the 80-hour
sessions. Expanding the availability of these Educators to more than their specific time-
block so that they are accessible by trainers and trainees during more of the G.O.T.s
deserves consideration. The Educators may be particularly suited to critique and/or
reinforce methods of effective classroom management techniques and answer questions
about how the curriculum meets the needs of different types of learners. We are not
suggesting that the Education Specialist attend the entire session, but that they are better
utilized the entire day they are currently present. Consideration, however, may be given
to extending the educator presence to two days in the 80-hour G.O.T.
4) The role of the Training Supervisors and trainers throughout the G.O.T.s should be re-
assessed. In at least one G.O.T., the role of the Training Supervisor was unclear and the
observer questioned the utility of this role. If this role is to be continued, the exact duties
and role of the Supervisor should be clearly articulated. Additionally, the role of trainers
as “program representatives” and “models” should be stressed. The importance of
trainers’ engagement in the training process, regardless of whether they are in the front or
back of the room, must be consistent. Observers consistently noted disruptions resulting
from trainers talking, playing on their computers, etc., when they were not involved in
modeling lessons. It was apparent that trainees also noticed these disruptions and
observers noted that this led to several awkward situations.
5) The content of the Gang Component should be re-assessed. Youth gangs are typically
“localized” and “unstructured,” yet the content of the Gang Component often reinforces
stereotypes of gangs as highly structured, national- or international-level organized crime
178
This document is a research report submitted to the U.S. Department of Justice. This report has not been published by the Department. Opinions or points of view expressed are those of the author(s)
and do not necessarily reflect the official position or policies of the U.S. Department of Justice.

groups. While the Gang Experts often began by talking about “localized,” “unstructured”
groups, training often turned to coverage of stereotypical gangs once trainees began
participating. Trainees would be better equipped to prevent gang-involvement if they
understand the nature of the youth gangs in their areas. Conversely, experts who can
relate specific risk factors for gang membership to the G.R.E.A.T. program may be
sought. The established pipeline between G.R.E.A.T. and IIR provides one mechanism
in which this could be addressed rather easily, as IIR has a number of national gang
experts at their disposal. These experts should be incorporated into G.R.E.A.T. Officer
Training sessions. Additionally, incorporating the gang typology devised by Cheryl
Maxson and Malcolm Klein (1995) and/or bringing in a “gang scholar” familiar with the
research could serve as mechanisms for addressing the variation in gangs across locales
but also to emphasize that most gangs are not “traditional” gangs.
6) It is recommended that trainees be encouraged to take notes in their binders during
training. Observers noted that trainees rarely took notes and sometimes lost interest
during the training sessions. Encouraging note-taking would help trainees follow along
more closely with the lessons while they were being modeled and provide additional
information that would be useful once they began delivering the program in the field.
7) It is recommended that trainers reconsider the utility of announcing at the beginning of
training that the final test is “open book.” The multiple choice exam is not particularly
taxing and all of the information is included in the binders. Encouraging trainees to take
notes throughout training with the expectation that the exam will be rigorous should
increase trainees’ attention to content throughout the sessions. Additionally, announcing
that the test is “open book” immediately before test administration also has the potential
179
This document is a research report submitted to the U.S. Department of Justice. This report has not been published by the Department. Opinions or points of view expressed are those of the author(s)
and do not necessarily reflect the official position or policies of the U.S. Department of Justice.
to increase morale among trainees (who, having been encouraged to pay close attention
throughout, should feel more prepared for the exam) and leave trainees with a positive
impression of trainers upon the completion of training (i.e., trainees will be “pleasantly
surprised” that the trainers “gave them a break” by making the test open book).
8) It is recommended that instructing trainees to “act like middle-school students” during the
lessons be reconsidered. Observers noted that trainees often slipped into the role without
being instructed and/or that trainees often acted more disruptive than typical middle-
school students.
9) Along these same lines, it is recommended that trainers and education specialists
emphasize the positive aspects of middle-school students throughout training. Observers
noted that this information was covered, but trainees often expressed negative views of
youths of this age group anyway. In most cases, trainees’ misperceptions were not
corrected by trainers or Educators. Focusing on the positive aspects of working with
youths should be a major emphasis throughout training. Such positive messages may
have several beneficial effects including, but not limited to, reinforcing the “Transitions”
session messages, getting trainees excited about the program, and facilitating the mindset
among officers that students should be treated with respect. This last component—
treating students with respect—has been found to be one of the most important methods
of shaping youths’ attitudes towards police in a positive manner. Noting that this is one
of the main goals of the G.R.E.A.T. program, this recommendation should not be taken
lightly.
10) It is recommended that attention be paid to ensuring binders have all information to be
used in the day’s lesson prior to the beginning of the training day. Observers noted
180
This document is a research report submitted to the U.S. Department of Justice. This report has not been published by the Department. Opinions or points of view expressed are those of the author(s)
and do not necessarily reflect the official position or policies of the U.S. Department of Justice.
instances where trainers requested trainees “check their binders” for missing material
during lesson modeling. Such instances led to confusion between both trainers and
trainees, with trainers referring trainees to the binders, and trainees flipping through the
binders and/or asking other trainees where to find the material. Although uncommon,
such instances detracted from successful training efforts. It is recommended that the use
of Extended Teacher Activities be made a priority during training. Trainers should
express to trainees the importance of sharing these materials with teachers in G.R.E.A.T.
classrooms. Results from surveys of teachers and administrators found that many were
unaware that such activities were available and some indicated frustration by indicating
that they would have used the activities in their classes if they had been available
(Peterson et al. 2009). Given the pressure on schools to meet local, state, and federal
educational standards, making these Extended Teacher Activities available, illustrating to
school personnel how the lessons fit within core testing areas, and encouraging teachers
to utilize the activities seems a particularly important component for the sustainability of
the G.R.E.A.T. program. Stressing and reinforcing the need for extensive
communication with the classroom teachers should be made explicit throughout G.O.T.
sessions.
Conclusions
The purpose of this report is to answer the following question: To what extent does the
G.R.E.A.T. Officer Training (G.O.T.) account for the quality of program implementation?
Previous reports have documented that the G.R.E.A.T. program is offered in schools with
considerable fidelity, as measured through observations of officers delivering the program in
181
This document is a research report submitted to the U.S. Department of Justice. This report has not been published by the Department. Opinions or points of view expressed are those of the author(s)
and do not necessarily reflect the official position or policies of the U.S. Department of Justice.
classrooms (see Leugoud et al. 2009), surveys and interviews with G.R.E.A.T. officers and
supervisors (see Carson et al. 2008), and surveys of school personnel (see Peterson et al. 2009).
Preliminary analyses of the first three waves of student survey data also illustrate short-term
program effectiveness (see Esbensen et al. 2009).
To provide additional insight into the G.R.E.A.T. process, this report documents
descriptive information about the G.O.T. structure and content collected from observations of
eight G.O.T. sessions in each of the G.R.E.A.T. regions between 2006 and 2008. Since
delivering the G.R.E.A.T. program in schools is often a departure from the normal duties of law
enforcement officers, training is intended to be multi-faceted, rigorous, and comprehensive.
Training officers about the substance of the G.R.E.A.T. program and methods of working with
the target audience is an essential component of program fidelity (i.e., delivering the program in
the field as intended). Thus, the primary goals of the G.O.T.s are to familiarize officers with the
G.R.E.A.T. program curriculum and to provide skills needed to successfully teach the program to
the target audience (i.e., elementary- and middle-school youths).
The observations documented in this report illustrate that G.R.E.A.T. Officer Trainings
are generally quite good at covering the G.R.E.A.T. curricular content and skills needed for
officers to deliver the program in schools. In short, it is reasonable to expect that trainees will
leave G.O.T.s with the knowledge and skills to become successful G.R.E.A.T. officers, although
some recommendations for continued refinement and success are included throughout this report.
182
This document is a research report submitted to the U.S. Department of Justice. This report has not been published by the Department. Opinions or points of view expressed are those of the author(s)
and do not necessarily reflect the official position or policies of the U.S. Department of Justice.
REFERENCES
Carson, Dena C., Finn-Aage Esbensen, Terrance J. Taylor, and Dana Peterson. 2008. National Evaluation of the Gang Resistance Education and Training (G.R.E.A.T.) Program: Results from Surveys and Interviews with G.R.E.A.T.-Trained Officers. St. Louis, Missouri: University of Missouri-St. Louis Esbensen, Finn-Aage, Dana Peterson, and Terrance J. Taylor. 2009. National Evaluation of the Gang Resistance Education and Training (G.R.E.A.T.) Program: 2009 Report to Schools and Communities: Program Implementation Quality and Preliminary Outcome Results. St. Louis, MO: University of Missouri-St. Louis. Esbensen, Finn-Aage, Dana Peterson, Terrance J. Taylor, Vanessa R. Panfil, and Bradley T. Brick. 2008. National Evaluation of the Gang Resistance and Training (G.R.E.A.T.) Program: 2008 Report to Schools and Communities: Anti-Social Norms among a Sample of Middle-School Students. St. Louis, Missouri: University of Missouri-St. Louis. Esbensen, Finn-Aage, Terrance J. Taylor, Bradley T. Brick, and Dana Peterson. 2007. National Evaluation of the Gang Resistance Education and Training (G.R.E.A.T.) Program: 2007 Report to Schools and Communities. St. Louis, Missouri: University of Missouri-St. Louis. Leugoud, Krystle M., Finn-Aage Esbensen, Bradley T. Brick, and Terrance J. Taylor. 2009. National Evaluation of the Gang Resistance Education and Training (G.R.E.A.T.) Program: Observing the Implementer: Description of Findings, Recommendations, and Conclusions from G.R.E.A.T. Program Implementation Observations. St. Louis, Missouri: University of Missouri-St. Louis. Maxson, Cheryl L., and Malcolm Klein. 1995. Investigating gang structures. Journal of Gang Research 3 (1): 33–40. Peterson, Dana, Venessa R. Panfil, Finn-Aage Esbensen, and Terrance J. Taylor. 2009. National Evaluation of the Gang Resistance Education and Training (G.R.E.A.T.) Program: School Personnel Survey Report. St. Louis, Missouri: University of Missouri-St. Louis.
183
This document is a research report submitted to the U.S. Department of Justice. This report has not been published by the Department. Opinions or points of view expressed are those of the author(s)
and do not necessarily reflect the official position or policies of the U.S. Department of Justice.

For more information about the Gang Resistance Education and Training (G.R.E.A.T.) Program, see the official G.R.E.A.T. website located at http://www.great-online.org/ . For more information about youth gangs and effective responses, see the official website of the National Youth Gang Center located at http://www.iir.com/nygc/ . For more information on the earlier National Evaluation of G.R.E.A.T., consult the following: Esbensen, Finn-Aage. 2004. Evaluating G.R.E.A.T.: A school-based gang prevention program – Research in Policy. Washington, D.C.: U.S. Department of Justice, Office of Justice Programs. Available online at: http://www.ncjrs.gov/pdffiles1/nij/198604.pdf . Esbensen, Finn-Aage, Adrienne Freng, Terrance J. Taylor, Dana Peterson, and D. Wayne Osgood. 2002. The National Evaluation of the Gang Resistance Education and Training (G.R.E.A.T.) Program. Pp.139-167 in Winifred L. Reed and Scott H. Decker (Eds.), Responding to Gangs: Evaluation and Research. Washington, D.C.: U.S. Department of Justice, National Institute of Justice. Available online at: http://www.ncjrs.gov/pdffiles1/nij/190351.pdf . Esbensen, Finn-Aage, D. Wayne Osgood, Terrance J. Taylor, Dana Peterson, and Adrienne Freng. 2001. How Great is G.R.E.A.T.?: Results from a quasi-experimental design. Criminology & Public Policy 1 (1): 87-118. Winfree, L. Thomas, Jr., Dana Peterson Lynskey, and James R. Maupin. 1999. Developing Local Police and Federal Law Enforcement Partnerships: G.R.E.A.T. as a case study of policy implementation. Criminal Justice Review 24 (2): 145-168.
184
This document is a research report submitted to the U.S. Department of Justice. This report has not been published by the Department. Opinions or points of view expressed are those of the author(s)
and do not necessarily reflect the official position or policies of the U.S. Department of Justice.

DAY 1 07:00 - 07:30 Staff Meeting 08:00 - 09:00 Welcome and Introductions 09:00 - 09:10 Break 09:10 - 09:50 Background of G.R.E.A.T. 09:50 - 10:00 Break 10:00 - 12:00 Educational Theory 12:00 - 01:00 Lunch 01:00 - 01:20 Photo 01:20 - 01:25 Break 01:25 - 02:25 Educational Theory (continued) 02:25 - 02:35 Break 02:35 - 03:25 Elementary Curriculum – Introduction and Lessons 1–2 03:25 - 03:35 Break 03:35 - 04:25 Elementary Curriculum – Lessons 3–6 04:25 - 04:30 Break 04:30 - 05:00 Team Meetings 05:00 - 05:30 Staff Meeting DAY 2 07:30 - 08:00 Staff Meeting 08:00 - 08:05 Day’s Objectives 08:05 - 12:05 National Gang Trends 12:05 - 01:05 Lunch 01:05 - 01:55 Overview Lesson #1 01:55 - 02:05 Break 02:05 – 02:40 Overview Lesson #2 02:40 - 02:50 Break 02:50 – 03:50 Model Lesson #3 03:50 - 04:00 Break 04:00 – 05:00 Model Lesson #4 05:00 - 05:30 Staff Meeting DAY 3 07:30 - 08:00 Staff Meeting 08:00 - 08:05 Day’s Objectives 08:05 - 08:55 Model Lesson #5 08:55 - 09:25 Overview Lesson #6 09:25 - 09:35 Break 09:35 - 10:25 Model Lesson #7 10:25 – 10:55 Overview Lesson #8 10:55 - 11:05 Break 11:05 - 11:55 Model Lesson #9 11:55 - 12:55 Lunch 12:55 - 01:25 Overview Lesson #10 01:25 - 01:55 Overview Lesson #11 01:55 - 02:05 Break 02:05 - 02:55 Model Lesson #12 02:55 - 03:05 Break 03:05 - 03:35 Overview Lesson #13 03:35 - 05:00 Team Meetings with assistance Staff Meeting – will occur after teams receive their Lesson assignments and are reviewing their Lesson information
185
This document is a research report submitted to the U.S. Department of Justice. This report has not been published by the Department. Opinions or points of view expressed are those of the author(s)
and do not necessarily reflect the official position or policies of the U.S. Department of Justice.
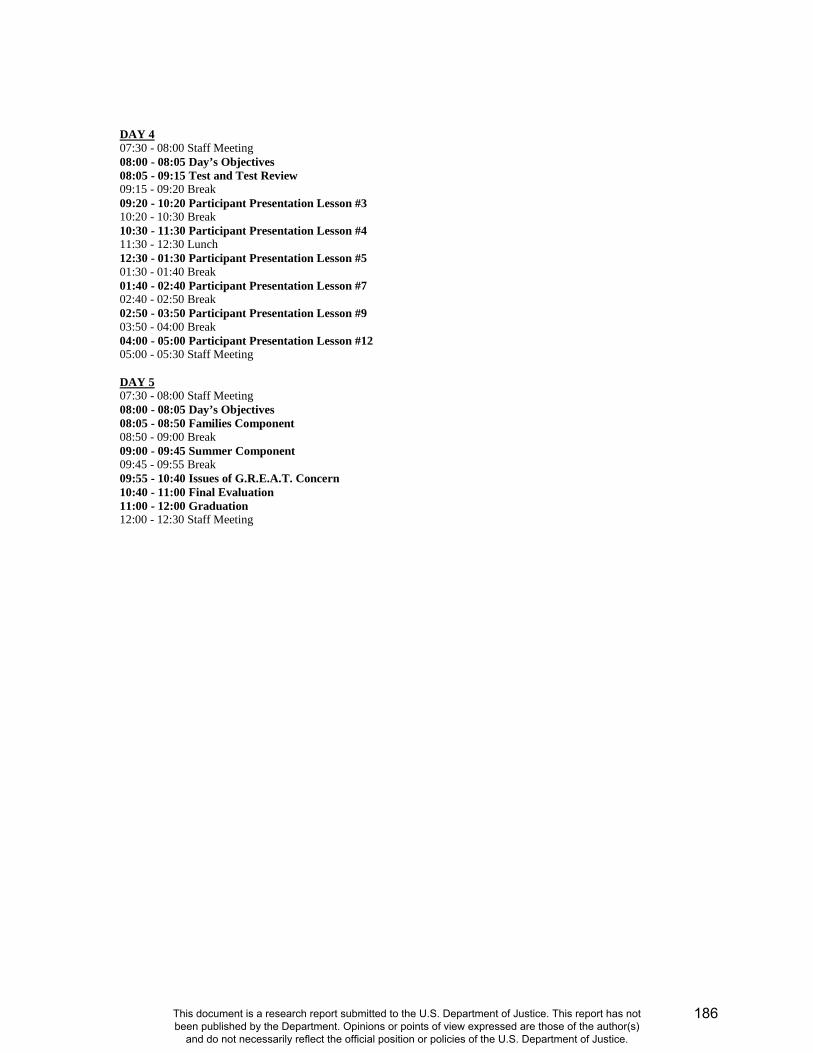
DAY 4 07:30 - 08:00 Staff Meeting 08:00 - 08:05 Day’s Objectives 08:05 - 09:15 Test and Test Review 09:15 - 09:20 Break 09:20 - 10:20 Participant Presentation Lesson #3 10:20 - 10:30 Break 10:30 - 11:30 Participant Presentation Lesson #4 11:30 - 12:30 Lunch 12:30 - 01:30 Participant Presentation Lesson #5 01:30 - 01:40 Break 01:40 - 02:40 Participant Presentation Lesson #7 02:40 - 02:50 Break 02:50 - 03:50 Participant Presentation Lesson #9 03:50 - 04:00 Break 04:00 - 05:00 Participant Presentation Lesson #12 05:00 - 05:30 Staff Meeting DAY 5 07:30 - 08:00 Staff Meeting 08:00 - 08:05 Day’s Objectives 08:05 - 08:50 Families Component 08:50 - 09:00 Break 09:00 - 09:45 Summer Component 09:45 - 09:55 Break 09:55 - 10:40 Issues of G.R.E.A.T. Concern 10:40 - 11:00 Final Evaluation 11:00 - 12:00 Graduation 12:00 - 12:30 Staff Meeting
186
This document is a research report submitted to the U.S. Department of Justice. This report has not been published by the Department. Opinions or points of view expressed are those of the author(s)
and do not necessarily reflect the official position or policies of the U.S. Department of Justice.

DAY 1 07:00 – 07:30 Staff Meeting 08:00 – 09:00 Welcome/Introduction/Orientation 09:00 – 09:10 Break 09:10 – 10:10 Background of G.R.E.A.T. 10:10 – 10:20 Break 10:20 – 11:20 Transitions 11:20 – 12:20 Lunch 12:20 – 01:20 Transitions (cont.) 01:20 – 01:30 Break 01:30 – 04:30 Public Speaking 04:30 – 05:00 Team Meetings 05:00 – 05:30 Staff Meeting DAY 2 07:30 – 08:00 Staff Meeting 08:00 – 08:05 Day’s Objectives 08:05 – 12:00 Learning Theory/Instructional Methodologies 12:00 – 01:00 Lunch 01:00 – 03:30 Learning Theory/Instructional Methodologies 03:40 – 05:00 Team Meetings/Participant Assistance 05:00 – 05:30 Staff Meetings DAY 3 07:30 – 08:00 Staff Meeting 08:00 – 08:05 Day’s Objectives 08:05 – 12:00 Demonstration Speeches 12:00 – 01:00 Lunch 01:00 – 01:20 Photo 01:20 – 02:05 Overview Lesson #1 02:05 – 02:15 Break 02:15 – 03:15 Model Lesson #2 03:15 – 03:25 Break 03:25 – 04:25 Model Lesson #3 04:25 – 04:35 Break 04:35 – 05:00 Team Meetings 05:00 – 05:30 Staff Meetings DAY 4 07:30 – 08:00 Staff Meeting 08:00 – 08:05 Day’s Objectives 08:05 – 09:05 Model Lesson #4 09:05 – 09:15 Break 09:15 – 10:15 Model Lesson #5 10:15 – 10:25 Break 10:25 – 11:25 Model Lesson #6 11:25 – 12:25 Lunch 12:25 – 01:25 Model Lesson #7 01:25 – 01:35 Break 01:35 – 02:35 Model Lesson #8 02:35 – 02:45 Break 02:45 – 03:45 Model Lesson #9 03:45 – 03:55 Break 03:55 – 04:55 Model Lesson #10 04:55 – 05:00 Wrap-up
187
This document is a research report submitted to the U.S. Department of Justice. This report has not been published by the Department. Opinions or points of view expressed are those of the author(s)
and do not necessarily reflect the official position or policies of the U.S. Department of Justice.

DAY 5 07:30 – 08:00 Staff Meeting 08:00 – 08:05 Day’s Objectives 08:05 – 09:05 Model Lesson #11 09:05 – 09:15 Break 09:15 – 10:15 Model Lesson #12 10:15 – 10:25 Break 10:25 – 11:25 Overview Lesson #13/Test Preview 11:25 – 12:25 Lunch 12:25 – 01:45 Test and Test Review 01:45 – 01:55 Break 01:55 – 02:35 Elementary Component – Intro & Overview Lessons 1-2 02:35 – 02:45 Break 02:45 – 03:25 Elementary Component – Overview Lessons 3-6 03:25 – 03:35 Break 03:35 – 04:20 Family Component 04:20 – 05:00 Team Meeting/Lesson Assignments/Homework 05:00 – 05:30 Staff Meeting DAY 6 07:30 – 08:00 Staff Meeting 08:00 – 08:10 Day’s Objectives 08:10 – 12:10 National Gang Trends 12:10 – 01:10 Lunch 01:10 – 02:10 Summer Component 02:10 – 02:20 Break 02:20 – 02:50 Model of Walk-Through 02:50 – 05:00 Team Meetings/ Walk-Throughs 05:00 – 05:30 Staff Meeting DAY 7 07:30 – 08:00 Staff Meeting 08:00 – 08:05 Day’s Objectives 08:05 – 11:45 20 Minute Coaching of Lesson Facilitations 11:45 – 12:45 Lunch 12:45 – 03:00 20 Minute Coaching of Lesson Facilitations 03:00 – 05:00 Team Meeting/Participant Assistance 05:00 – 05:30 Staff Meeting DAY 8 07:30 – 08:00 Staff Meeting 08:00 – 08:05 Day’s Objectives 08:05 – 12:00 Final Lesson Facilitations 12:00 – 01:00 Lunch 01:00 – 05:00 Final Lesson Facilitations DAY 9 07:30 – 08:00 Staff Meeting 08:00 – 08:05 Day’s Objectives 08:05 – 12:00 Final Lesson Facilitations 12:00 – 01:00 Lunch 01:00 – 05:00 Final Lesson Facilitations DAY 10 07:30 – 08:00 Staff Meeting 08:00 – 08:05 Day’s Objectives 08:05 – 09:05 Issues of G.R.E.A.T. Concern 09:05 – 09:15 Break 09:15 – 09:40 Final Evaluation 10:00 – 11:00 Graduation 11:15 – 12:00 Staff Meeting
188
This document is a research report submitted to the U.S. Department of Justice. This report has not been published by the Department. Opinions or points of view expressed are those of the author(s)
and do not necessarily reflect the official position or policies of the U.S. Department of Justice.
National Evaluation of the Gang Resistance Education and Training (G.R.E.A.T.) Program
Results from Surveys and Interviews with
G.R.E.A.T.-trained Officers
Prepared by:
Dena C. Carson, M.A. Finn-Aage Esbensen, Ph.D. Terrance J. Taylor, Ph.D.
Dana Peterson, Ph.D.
August, 2008
This project was supported by Award No. 2006-JV-FX-0011 awarded by the National Institute of Justice, Office of Justice Programs, U.S. Department of Justice. This research was made possible, in part, by the support and participation of seven school districts, including the School District of Philadelphia. The opinions, findings, and conclusions or recommendations expressed in this paper are those of the authors and do not necessarily reflect the views of the Department of Justice or of the seven participating school districts.
For questions about this report or for more information about the evaluation, please contact:
G.R.E.A.T. Evaluation Department of Criminology & Criminal Justice
University of Missouri-St. Louis St. Louis, MO 63121-4499
Phone: (314) 516-4777 Fax: (314) 516-5048
189
This document is a research report submitted to the U.S. Department of Justice. This report has not been published by the Department. Opinions or points of view expressed are those of the author(s)
and do not necessarily reflect the official position or policies of the U.S. Department of Justice.
National Evaluation of the Gang Resistance Education and Training (G.R.E.A.T.) Program: Results from Surveys and Interviews with G.R.E.A.T.-trained Officers Executive Summary
The process and outcome evaluation of the Gang Resistance Education and Training (G.R.E.A.T.) program includes several different components including surveys with G.R.E.A.T.-trained officers in each of the seven study locations (Albuquerque, NM; Portland, OR; Greeley, CO; Nashville, TN; Philadelphia, PA; Chicago, IL; and a Dallas/Fort Worth, TX location) as well as interviews with officers teaching the program in the 25 of the 31 target schools and their supervisors. A total of 205 survey packets were sent to G.R.E.A.T.-trained officers in seven cities. Overall, 137 officers returned completed surveys for a response rate of 66.8 percent. This report presents the results of these surveys as well as the interviews.
In addition to examining the results for the total sample, this report separates the results by teaching models. The seven cities represent three distinct strategies for incorporating the G.R.E.A.T. program into their agencies: overtime model, SRO model, and community services model. In the overtime model, officers teach the G.R.E.A.T. program on an overtime basis in addition to their primary assignment (Portland). School resource officers (SROs) teach the program as part of their other duties in the school in the SRO Model (Albuquerque, Nashville, Greeley, and Dallas/Fort Worth area agency). In the community services model, officers teach as part of the specialized units to which they are assigned (Philadelphia and Chicago).
The results show that, in general, officers enjoy being G.R.E.A.T. officers and are committed to teaching the program. However, being a G.R.E.A.T. officer has a downside. In the majority of the cities, officers, as well as supervisors, stated that G.R.E.A.T. officers are viewed in a negative light by other officers. Also, officers reported that teaching the G.R.E.A.T. program does have a negative effect on their career, in terms of offering fewer opportunities for overtime and not enhancing chances for promotion.
Officers also stated the G.R.E.A.T. program is appropriate in terms of content, but does not necessarily meet their community’s needs. In other words, they believe that G.R.E.A.T. is beneficial to students and a valuable program, but do not believe that it is capable of reducing larger community problems. This assertion is expected because G.R.E.A.T. is intended to aid only in the reduction of gang membership in the targeted youth population using an individual-level approach. It is not meant to “fix” all of the community’s delinquency problems. The officers reported that their communities do experience delinquency and gang problems, but do not believe that people feel threatened by these problems. In addition, officers believed that the G.R.E.A.T. program is capable of building partnerships between police officers, youth, schools, and the community. Officers also felt that the G.R.E.A.T. program’s lessons were effective in meeting the goals of the program and had the appropriate amount of information. They frequently named Lesson 4: Goal-Setting and Lesson 5: Decision-Making among their favorites and the most effective. However, the officers consistently noted time constraints as one of the main difficulties for implementing all the G.R.E.A.T. lessons effectively.
Generally, in terms of teaching models, this report indicates that officers teaching on an overtime basis have most favorable attitudes about teaching the G.R.E.A.T. program, followed by SRO officers. Although officers teaching as part of the community services model tended to have positive attitudes about the G.R.E.A.T. program, they had less favorable attitudes when compared with the other two models.
190
This document is a research report submitted to the U.S. Department of Justice. This report has not been published by the Department. Opinions or points of view expressed are those of the author(s)
and do not necessarily reflect the official position or policies of the U.S. Department of Justice.
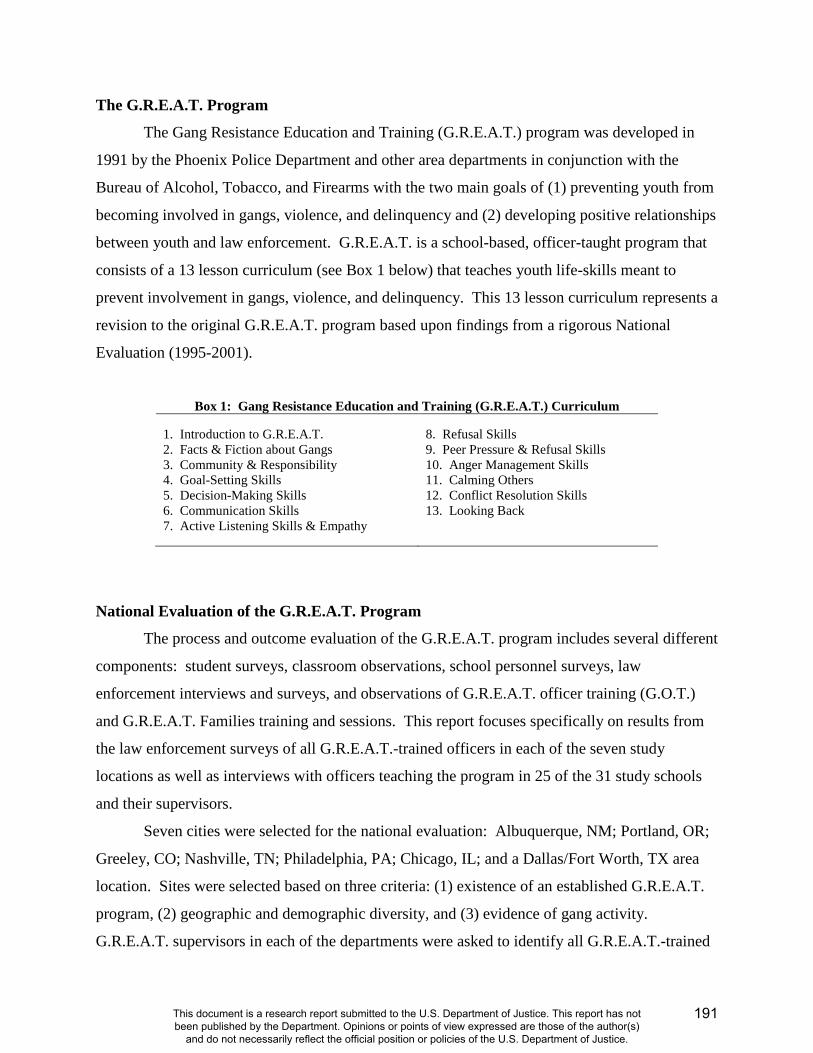
The G.R.E.A.T. Program
The Gang Resistance Education and Training (G.R.E.A.T.) program was developed in
1991 by the Phoenix Police Department and other area departments in conjunction with the
Bureau of Alcohol, Tobacco, and Firearms with the two main goals of (1) preventing youth from
becoming involved in gangs, violence, and delinquency and (2) developing positive relationships
between youth and law enforcement. G.R.E.A.T. is a school-based, officer-taught program that
consists of a 13 lesson curriculum (see Box 1 below) that teaches youth life-skills meant to
prevent involvement in gangs, violence, and delinquency. This 13 lesson curriculum represents a
revision to the original G.R.E.A.T. program based upon findings from a rigorous National
Evaluation (1995-2001).
Box 1: Gang Resistance Education and Training (G.R.E.A.T.) Curriculum
1. Introduction to G.R.E.A.T. 8. Refusal Skills 2. Facts & Fiction about Gangs 9. Peer Pressure & Refusal Skills 3. Community & Responsibility 10. Anger Management Skills 4. Goal-Setting Skills 11. Calming Others 5. Decision-Making Skills 12. Conflict Resolution Skills 6. Communication Skills 13. Looking Back 7. Active Listening Skills & Empathy
National Evaluation of the G.R.E.A.T. Program
The process and outcome evaluation of the G.R.E.A.T. program includes several different
components: student surveys, classroom observations, school personnel surveys, law
enforcement interviews and surveys, and observations of G.R.E.A.T. officer training (G.O.T.)
and G.R.E.A.T. Families training and sessions. This report focuses specifically on results from
the law enforcement surveys of all G.R.E.A.T.-trained officers in each of the seven study
locations as well as interviews with officers teaching the program in 25 of the 31 study schools
and their supervisors.
Seven cities were selected for the national evaluation: Albuquerque, NM; Portland, OR;
Greeley, CO; Nashville, TN; Philadelphia, PA; Chicago, IL; and a Dallas/Fort Worth, TX area
location. Sites were selected based on three criteria: (1) existence of an established G.R.E.A.T.
program, (2) geographic and demographic diversity, and (3) evidence of gang activity.
G.R.E.A.T. supervisors in each of the departments were asked to identify all G.R.E.A.T.-trained
191
This document is a research report submitted to the U.S. Department of Justice. This report has not been published by the Department. Opinions or points of view expressed are those of the author(s)
and do not necessarily reflect the official position or policies of the U.S. Department of Justice.
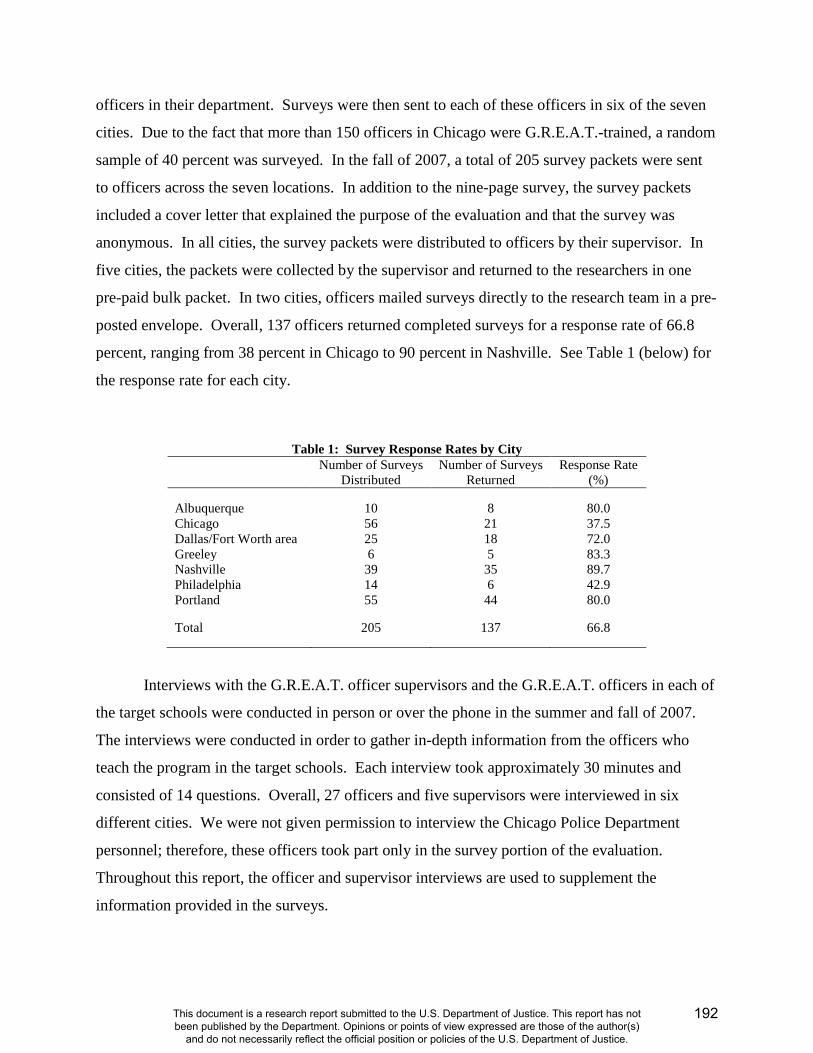
officers in their department. Surveys were then sent to each of these officers in six of the seven
cities. Due to the fact that more than 150 officers in Chicago were G.R.E.A.T.-trained, a random
sample of 40 percent was surveyed. In the fall of 2007, a total of 205 survey packets were sent
to officers across the seven locations. In addition to the nine-page survey, the survey packets
included a cover letter that explained the purpose of the evaluation and that the survey was
anonymous. In all cities, the survey packets were distributed to officers by their supervisor. In
five cities, the packets were collected by the supervisor and returned to the researchers in one
pre-paid bulk packet. In two cities, officers mailed surveys directly to the research team in a pre-
posted envelope. Overall, 137 officers returned completed surveys for a response rate of 66.8
percent, ranging from 38 percent in Chicago to 90 percent in Nashville. See Table 1 (below) for
the response rate for each city.
Table 1: Survey Response Rates by City Number of Surveys
Distributed Number of Surveys
Returned Response Rate
(%) Albuquerque 10 8 80.0 Chicago 56 21 37.5 Dallas/Fort Worth area 25 18 72.0 Greeley 6 5 83.3 Nashville 39 35 89.7 Philadelphia 14 6 42.9 Portland 55 44 80.0 Total 205 137 66.8
Interviews with the G.R.E.A.T. officer supervisors and the G.R.E.A.T. officers in each of
the target schools were conducted in person or over the phone in the summer and fall of 2007.
The interviews were conducted in order to gather in-depth information from the officers who
teach the program in the target schools. Each interview took approximately 30 minutes and
consisted of 14 questions. Overall, 27 officers and five supervisors were interviewed in six
different cities. We were not given permission to interview the Chicago Police Department
personnel; therefore, these officers took part only in the survey portion of the evaluation.
Throughout this report, the officer and supervisor interviews are used to supplement the
information provided in the surveys.
192
This document is a research report submitted to the U.S. Department of Justice. This report has not been published by the Department. Opinions or points of view expressed are those of the author(s)
and do not necessarily reflect the official position or policies of the U.S. Department of Justice.
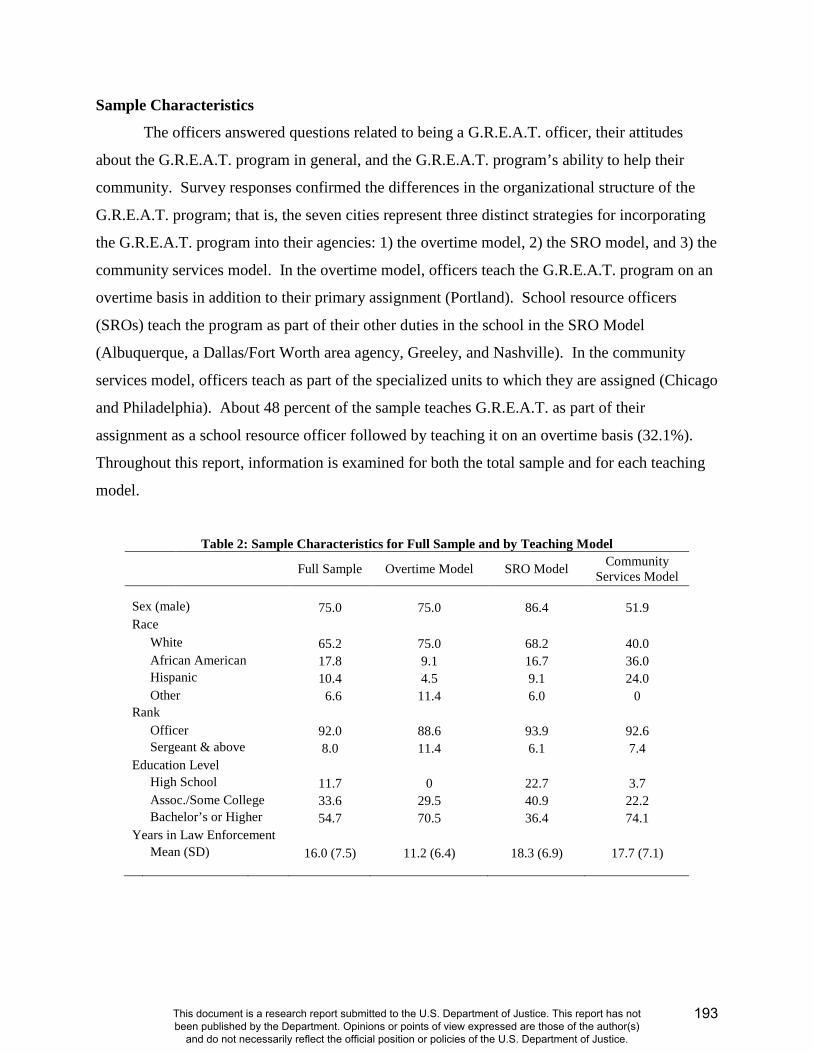
Sample Characteristics
The officers answered questions related to being a G.R.E.A.T. officer, their attitudes
about the G.R.E.A.T. program in general, and the G.R.E.A.T. program’s ability to help their
community. Survey responses confirmed the differences in the organizational structure of the
G.R.E.A.T. program; that is, the seven cities represent three distinct strategies for incorporating
the G.R.E.A.T. program into their agencies: 1) the overtime model, 2) the SRO model, and 3) the
community services model. In the overtime model, officers teach the G.R.E.A.T. program on an
overtime basis in addition to their primary assignment (Portland). School resource officers
(SROs) teach the program as part of their other duties in the school in the SRO Model
(Albuquerque, a Dallas/Fort Worth area agency, Greeley, and Nashville). In the community
services model, officers teach as part of the specialized units to which they are assigned (Chicago
and Philadelphia). About 48 percent of the sample teaches G.R.E.A.T. as part of their
assignment as a school resource officer followed by teaching it on an overtime basis (32.1%).
Throughout this report, information is examined for both the total sample and for each teaching
model.
Table 2: Sample Characteristics for Full Sample and by Teaching Model
Full Sample Overtime Model SRO Model Community
Services Model Sex (male) 75.0 75.0 86.4 51.9 Race White 65.2 75.0 68.2 40.0 African American 17.8 9.1 16.7 36.0 Hispanic 10.4 4.5 9.1 24.0 Other 6.6 11.4 6.0 0 Rank Officer 92.0 88.6 93.9 92.6 Sergeant & above 8.0 11.4 6.1 7.4 Education Level High School 11.7 0 22.7 3.7 Assoc./Some College 33.6 29.5 40.9 22.2 Bachelor’s or Higher 54.7 70.5 36.4 74.1 Years in Law Enforcement Mean (SD) 16.0 (7.5) 11.2 (6.4) 18.3 (6.9) 17.7 (7.1)
193
This document is a research report submitted to the U.S. Department of Justice. This report has not been published by the Department. Opinions or points of view expressed are those of the author(s)
and do not necessarily reflect the official position or policies of the U.S. Department of Justice.
Table 2 (above) presents the demographic characteristics of the entire group of officers
surveyed, as well as separately by teaching model. The sample is comprised primarily of white
(65%), male (75%) officers (92%) who have had at least some college education (88%). Also,
there is an average of 16 years of experience in law enforcement, with a range from 2 to 39
years. The community services agencies included more female officers (48%) and more officers
who were African-American (36%) and Hispanic (24%) than was the case in the other types of
agencies. This difference may well be an artifact of the larger demographic characteristics of
those two cities (i.e., Chicago and Philadelphia).
Being a G.R.E.A.T. Officer
The law enforcement survey and interview process inquired about different aspects of
being a G.R.E.A.T. officer, including the reasons why the officer became involved in the
G.R.E.A.T. program, their training to become a G.R.E.A.T. officer, likes and dislikes about
being a G.R.E.A.T. officer, and how being involved in the G.R.E.A.T. program has affected their
career.
Reasons for Becoming a G.R.E.A.T. Officer
Officers were asked why they decided to become a G.R.E.A.T. officer; their responses
were dichotomized into community policing oriented reasons or non-community policing
oriented reasons. Items considered as community policing oriented responses were the
following: “I wanted to teach” or “I wanted to prevent kids from joining gangs.” Conversely,
items considered not based in community policing were as follows: “I was assigned,” “I wanted
to get out of other duties,” and “I saw it as an opportunity for promotion later.” Overall, the
majority (85.3%) of the survey sample became involved with G.R.E.A.T. for community
policing oriented reasons (see Table 3, below). This finding was consistent across all teaching
models. During the interviews, however, the majority of the officers stated that they taught
G.R.E.A.T. because they were assigned or required to do so as part of their regular assignment
(e.g., SRO duties). Correspondingly, just six of the 27 officers interviewed indicated working
with kids/students as their reason for becoming a G.R.E.A.T. officer.
194
This document is a research report submitted to the U.S. Department of Justice. This report has not been published by the Department. Opinions or points of view expressed are those of the author(s)
and do not necessarily reflect the official position or policies of the U.S. Department of Justice.
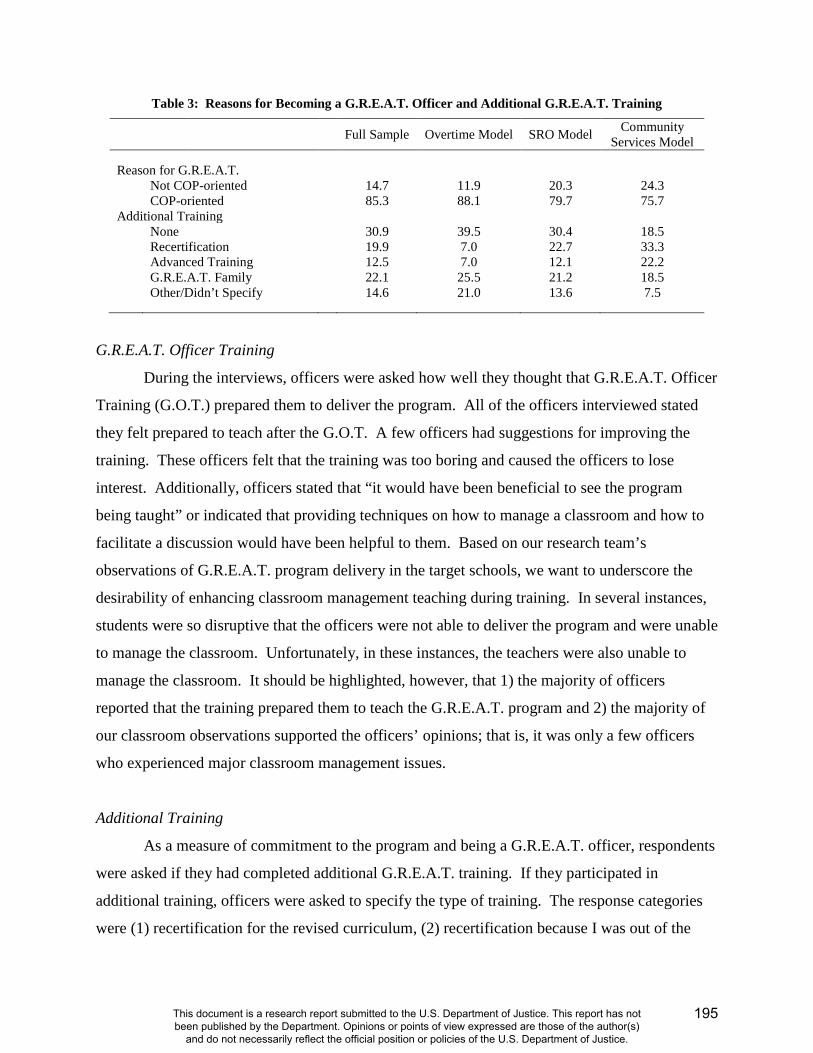
Table 3: Reasons for Becoming a G.R.E.A.T. Officer and Additional G.R.E.A.T. Training
Full Sample Overtime Model SRO Model Community Services Model
Reason for G.R.E.A.T. Not COP-oriented 14.7 11.9 20.3 24.3 COP-oriented 85.3 88.1 79.7 75.7 Additional Training None 30.9 39.5 30.4 18.5 Recertification 19.9 7.0 22.7 33.3 Advanced Training 12.5 7.0 12.1 22.2 G.R.E.A.T. Family 22.1 25.5 21.2 18.5 Other/Didn’t Specify 14.6 21.0 13.6 7.5
G.R.E.A.T. Officer Training
During the interviews, officers were asked how well they thought that G.R.E.A.T. Officer
Training (G.O.T.) prepared them to deliver the program. All of the officers interviewed stated
they felt prepared to teach after the G.O.T. A few officers had suggestions for improving the
training. These officers felt that the training was too boring and caused the officers to lose
interest. Additionally, officers stated that “it would have been beneficial to see the program
being taught” or indicated that providing techniques on how to manage a classroom and how to
facilitate a discussion would have been helpful to them. Based on our research team’s
observations of G.R.E.A.T. program delivery in the target schools, we want to underscore the
desirability of enhancing classroom management teaching during training. In several instances,
students were so disruptive that the officers were not able to deliver the program and were unable
to manage the classroom. Unfortunately, in these instances, the teachers were also unable to
manage the classroom. It should be highlighted, however, that 1) the majority of officers
reported that the training prepared them to teach the G.R.E.A.T. program and 2) the majority of
our classroom observations supported the officers’ opinions; that is, it was only a few officers
who experienced major classroom management issues.
Additional Training
As a measure of commitment to the program and being a G.R.E.A.T. officer, respondents
were asked if they had completed additional G.R.E.A.T. training. If they participated in
additional training, officers were asked to specify the type of training. The response categories
were (1) recertification for the revised curriculum, (2) recertification because I was out of the
195
This document is a research report submitted to the U.S. Department of Justice. This report has not been published by the Department. Opinions or points of view expressed are those of the author(s)
and do not necessarily reflect the official position or policies of the U.S. Department of Justice.
classroom too long, (3) advanced training, such as to become a member of the National Training
Team, (4) other types of additional training. In the event that an officer indicated participating in
more than one type of additional training, the highest numbered response was used. For
example, if an officer circled both recertification for the new curriculum and advanced training,
then his/her response was coded as advanced training. As shown in Table 3 (above), a majority
of the officers in the total sample had completed at least some form of additional training
(69.1%). The majority of these officers indicated that they participated in G.R.E.A.T. Families
training. In addition, across the overtime (60.5%), SRO (69.6%), and community services
(81.5%) models, the majority of officers indicated that they had participated in additional
training. Responses from officers in the overtime model indicated that the majority had
additional training in the G.R.E.A.T. Families component. However, officers teaching
G.R.E.A.T. as part of the SRO model and community services model indicated recertification for
the new curriculum as the most frequent type of additional training.
Likes and Dislikes of Being a G.R.E.A.T. Officer
Officers were asked what they liked most and disliked most about participation in the
G.R.E.A.T. program. The results are shown in Table 4 (below). Response categories for what
an officer likes about being a G.R.E.A.T. officer were: (1) working with the kids, (2) having a
positive influence on kids, (3) getting out of other duties, (4) building bridges with the
educational community, and (5) other likes. The officers were asked to circle all that applied to
them and then write in what they liked the most out of all the reasons they circled. The majority
of the officers indicated that they liked being a G.R.E.A.T. officer most because it gave them the
opportunity to work with children or have a positive influence on children (96.2% of the total
sample). These finding were consistent across all the teaching models with no significant
differences found between them. Notably, results in Table 4 indicate that none of the officers
stated that they like being a G.R.E.A.T. officer because it allows them to get out of other duties.
In addition to inquiring about the positive aspects of being a G.R.E.A.T. officer, the
survey also asked officers what they dislike about being involved in G.R.E.A.T. Response
categories included: (1) the politics, (2) the way G.R.E.A.T. officers are viewed by other
officers, (3) loss of chances for overtime pay, (4) losing touch with duties on the street, (5) I
don’t believe the program works, and (6) other dislikes. Again, the officers were asked to circle
196
This document is a research report submitted to the U.S. Department of Justice. This report has not been published by the Department. Opinions or points of view expressed are those of the author(s)
and do not necessarily reflect the official position or policies of the U.S. Department of Justice.
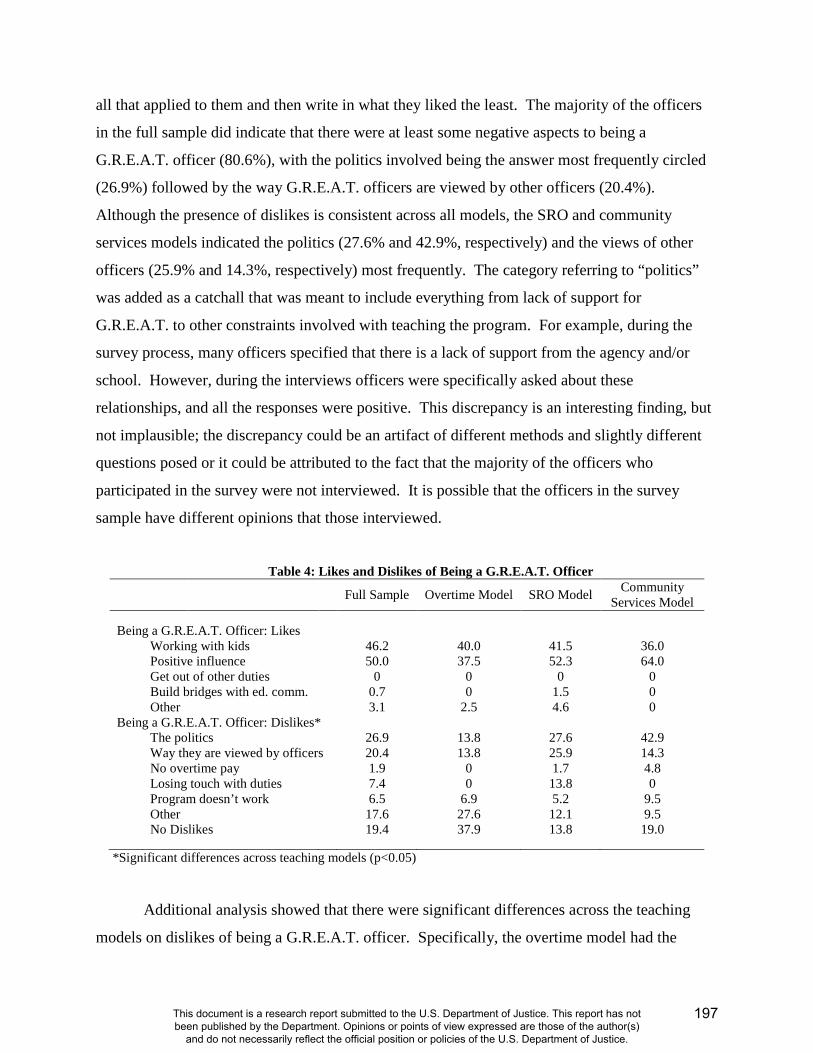
all that applied to them and then write in what they liked the least. The majority of the officers
in the full sample did indicate that there were at least some negative aspects to being a
G.R.E.A.T. officer (80.6%), with the politics involved being the answer most frequently circled
(26.9%) followed by the way G.R.E.A.T. officers are viewed by other officers (20.4%).
Although the presence of dislikes is consistent across all models, the SRO and community
services models indicated the politics (27.6% and 42.9%, respectively) and the views of other
officers (25.9% and 14.3%, respectively) most frequently. The category referring to “politics”
was added as a catchall that was meant to include everything from lack of support for
G.R.E.A.T. to other constraints involved with teaching the program. For example, during the
survey process, many officers specified that there is a lack of support from the agency and/or
school. However, during the interviews officers were specifically asked about these
relationships, and all the responses were positive. This discrepancy is an interesting finding, but
not implausible; the discrepancy could be an artifact of different methods and slightly different
questions posed or it could be attributed to the fact that the majority of the officers who
participated in the survey were not interviewed. It is possible that the officers in the survey
sample have different opinions that those interviewed.
Table 4: Likes and Dislikes of Being a G.R.E.A.T. Officer
Full Sample Overtime Model SRO Model Community Services Model
Being a G.R.E.A.T. Officer: Likes Working with kids 46.2 40.0 41.5 36.0 Positive influence 50.0 37.5 52.3 64.0 Get out of other duties 0 0 0 0 Build bridges with ed. comm. 0.7 0 1.5 0 Other 3.1 2.5 4.6 0 Being a G.R.E.A.T. Officer: Dislikes* The politics 26.9 13.8 27.6 42.9 Way they are viewed by officers 20.4 13.8 25.9 14.3 No overtime pay 1.9 0 1.7 4.8 Losing touch with duties 7.4 0 13.8 0 Program doesn’t work 6.5 6.9 5.2 9.5 Other 17.6 27.6 12.1 9.5 No Dislikes 19.4 37.9 13.8 19.0
*Significant differences across teaching models (p<0.05)
Additional analysis showed that there were significant differences across the teaching
models on dislikes of being a G.R.E.A.T. officer. Specifically, the overtime model had the
197
This document is a research report submitted to the U.S. Department of Justice. This report has not been published by the Department. Opinions or points of view expressed are those of the author(s)
and do not necessarily reflect the official position or policies of the U.S. Department of Justice.
highest percentage of officers indicating that there were no negative aspects to being a
G.R.E.A.T. officer (37.9%) compared with other teaching models. The overtime model was also
unique in that it had the highest percentage of “other” responses (27.6%). These responses were
mainly specific to problems surrounding teaching G.R.E.A.T. on an overtime basis (e.g.,
juggling both officer and teaching duties, commuting to and from schools). During the interview
process, several officers indicated that time constraints, classroom management issues, and
reaching the kids both in and out of the classroom were the main challenges to implementing the
G.R.E.A.T. program. Three of the officers teaching as part of their duties as SROs in the
Dallas/Fort Worth area agency specifically indicated that the lessons are too long to fit into a
typical class period. It is expected that problems surrounding lesson length would vary by site
because schools differ in the amount of time allowed per class period and in the amount of time
given to the officer to teach each lesson. In addition, a small number of officers indicated in the
interviews that “no reinforcement at home” and “only getting to spend a limited time with
students” are challenges to program success.
Career Effects
In addition to the dislikes mentioned above, officers also have opinions about how being
a G.R.E.A.T. officer affects their career. To measure career effects, officers were asked to
respond to the questions presented in Table 5 (below). Across the full sample and the teaching
models, the majority of the officers indicated that being a G.R.E.A.T. officer does not improve
their chances for promotion, allows them fewer opportunities for overtime, and that teaching
G.R.E.A.T. is not perceived well by other officers. Notably, officers who teach as part of the
community services model have significantly less favorable responses to the career effect
questions. As discussed above, many officers dislike teaching G.R.E.A.T. because of how they
are viewed by other officers. These officers tended to indicate in both the interviews and surveys
that they were viewed as “lazy” or “kiddie cops.” Furthermore, one supervisor stated in the
interview that G.R.E.A.T. officers are “looked down upon by other officers.” Importantly,
officers teaching G.R.E.A.T. on a strictly overtime basis have more favorable opinions of the
program’s effect on their career relative to officers teaching in other models. Portland officers
were significantly more likely to believe that involvement in the G.R.E.A.T. program improves
198
This document is a research report submitted to the U.S. Department of Justice. This report has not been published by the Department. Opinions or points of view expressed are those of the author(s)
and do not necessarily reflect the official position or policies of the U.S. Department of Justice.
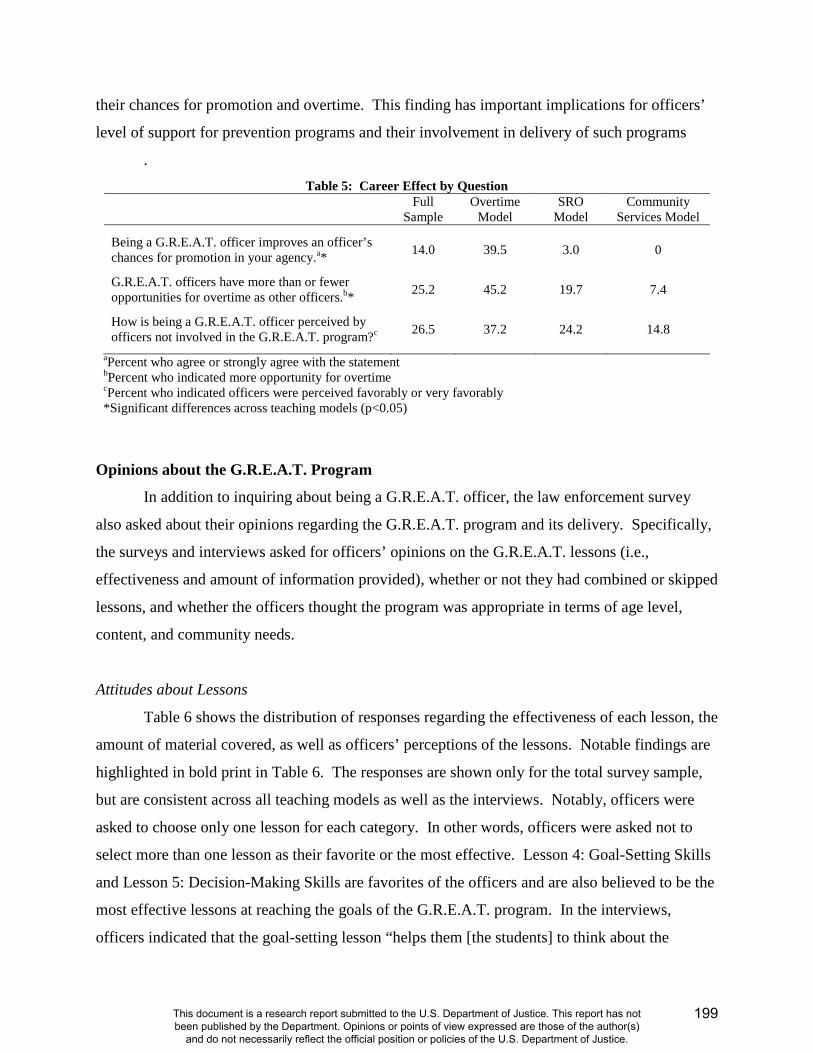
their chances for promotion and overtime. This finding has important implications for officers’
level of support for prevention programs and their involvement in delivery of such programs
. Table 5: Career Effect by Question
Full Sample
Overtime Model
SRO Model
Community Services Model
Being a G.R.E.A.T. officer improves an officer’s chances for promotion in your agency.a* 14.0 39.5 3.0 0
G.R.E.A.T. officers have more than or fewer opportunities for overtime as other officers.b* 25.2 45.2 19.7 7.4
How is being a G.R.E.A.T. officer perceived by officers not involved in the G.R.E.A.T. program?c 26.5 37.2 24.2 14.8
aPercent who agree or strongly agree with the statement bPercent who indicated more opportunity for overtime cPercent who indicated officers were perceived favorably or very favorably *Significant differences across teaching models (p<0.05)
Opinions about the G.R.E.A.T. Program
In addition to inquiring about being a G.R.E.A.T. officer, the law enforcement survey
also asked about their opinions regarding the G.R.E.A.T. program and its delivery. Specifically,
the surveys and interviews asked for officers’ opinions on the G.R.E.A.T. lessons (i.e.,
effectiveness and amount of information provided), whether or not they had combined or skipped
lessons, and whether the officers thought the program was appropriate in terms of age level,
content, and community needs.
Attitudes about Lessons
Table 6 shows the distribution of responses regarding the effectiveness of each lesson, the
amount of material covered, as well as officers’ perceptions of the lessons. Notable findings are
highlighted in bold print in Table 6. The responses are shown only for the total survey sample,
but are consistent across all teaching models as well as the interviews. Notably, officers were
asked to choose only one lesson for each category. In other words, officers were asked not to
select more than one lesson as their favorite or the most effective. Lesson 4: Goal-Setting Skills
and Lesson 5: Decision-Making Skills are favorites of the officers and are also believed to be the
most effective lessons at reaching the goals of the G.R.E.A.T. program. In the interviews,
officers indicated that the goal-setting lesson “helps them [the students] to think about the
199
This document is a research report submitted to the U.S. Department of Justice. This report has not been published by the Department. Opinions or points of view expressed are those of the author(s)
and do not necessarily reflect the official position or policies of the U.S. Department of Justice.
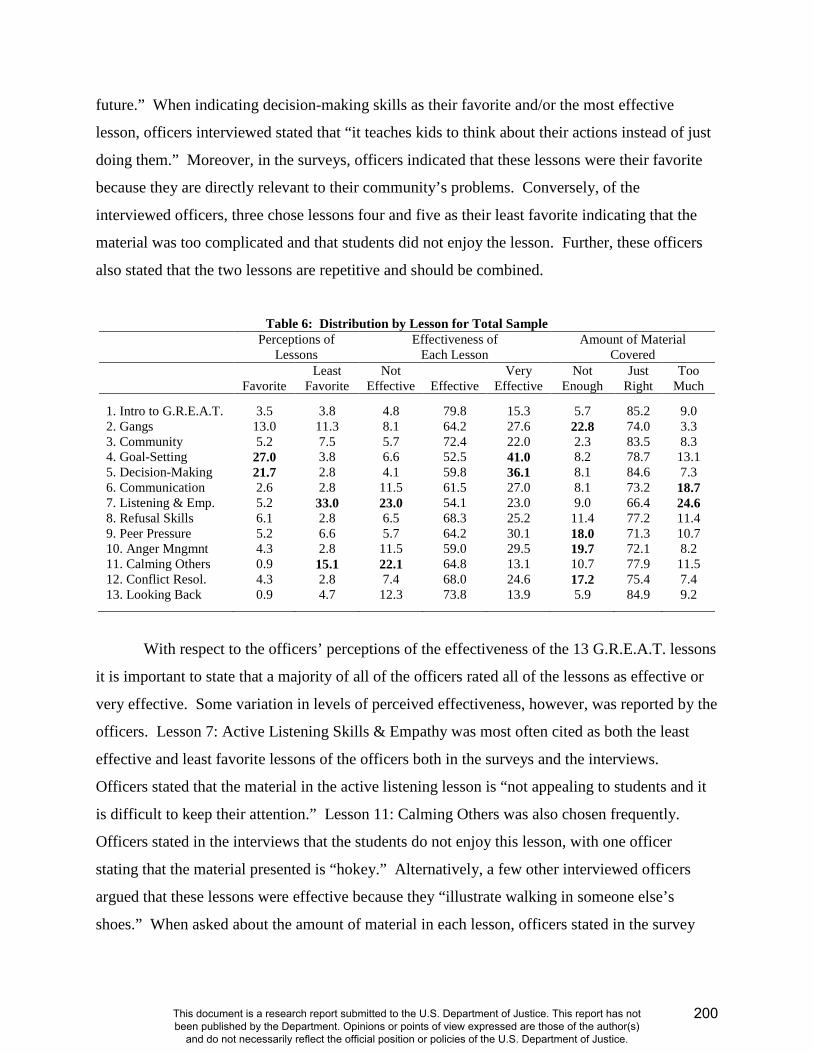
future.” When indicating decision-making skills as their favorite and/or the most effective
lesson, officers interviewed stated that “it teaches kids to think about their actions instead of just
doing them.” Moreover, in the surveys, officers indicated that these lessons were their favorite
because they are directly relevant to their community’s problems. Conversely, of the
interviewed officers, three chose lessons four and five as their least favorite indicating that the
material was too complicated and that students did not enjoy the lesson. Further, these officers
also stated that the two lessons are repetitive and should be combined.
Table 6: Distribution by Lesson for Total Sample
Perceptions of Lessons
Effectiveness of Each Lesson
Amount of Material Covered
Favorite
Least Favorite
Not Effective Effective
Very Effective
Not Enough
Just Right
Too Much
1. Intro to G.R.E.A.T. 3.5 3.8 4.8 79.8 15.3 5.7 85.2 9.0 2. Gangs 13.0 11.3 8.1 64.2 27.6 22.8 74.0 3.3 3. Community 5.2 7.5 5.7 72.4 22.0 2.3 83.5 8.3 4. Goal-Setting 27.0 3.8 6.6 52.5 41.0 8.2 78.7 13.1 5. Decision-Making 21.7 2.8 4.1 59.8 36.1 8.1 84.6 7.3 6. Communication 2.6 2.8 11.5 61.5 27.0 8.1 73.2 18.7 7. Listening & Emp. 5.2 33.0 23.0 54.1 23.0 9.0 66.4 24.6 8. Refusal Skills 6.1 2.8 6.5 68.3 25.2 11.4 77.2 11.4 9. Peer Pressure 5.2 6.6 5.7 64.2 30.1 18.0 71.3 10.7 10. Anger Mngmnt 4.3 2.8 11.5 59.0 29.5 19.7 72.1 8.2 11. Calming Others 0.9 15.1 22.1 64.8 13.1 10.7 77.9 11.5 12. Conflict Resol. 4.3 2.8 7.4 68.0 24.6 17.2 75.4 7.4 13. Looking Back 0.9 4.7 12.3 73.8 13.9 5.9 84.9 9.2
With respect to the officers’ perceptions of the effectiveness of the 13 G.R.E.A.T. lessons
it is important to state that a majority of all of the officers rated all of the lessons as effective or
very effective. Some variation in levels of perceived effectiveness, however, was reported by the
officers. Lesson 7: Active Listening Skills & Empathy was most often cited as both the least
effective and least favorite lessons of the officers both in the surveys and the interviews.
Officers stated that the material in the active listening lesson is “not appealing to students and it
is difficult to keep their attention.” Lesson 11: Calming Others was also chosen frequently.
Officers stated in the interviews that the students do not enjoy this lesson, with one officer
stating that the material presented is “hokey.” Alternatively, a few other interviewed officers
argued that these lessons were effective because they “illustrate walking in someone else’s
shoes.” When asked about the amount of material in each lesson, officers stated in the survey
200
This document is a research report submitted to the U.S. Department of Justice. This report has not been published by the Department. Opinions or points of view expressed are those of the author(s)
and do not necessarily reflect the official position or policies of the U.S. Department of Justice.
portion that the active listening and empathy lesson (#7) as well as Lesson 6: Communication
Skills had too much information. One officer stated that the information presented in this lesson
(#6) is “redundant.” Both the survey respondents and the interviewees indicated that Lesson 2:
Facts and Fiction about Gangs, Lesson 9: Peer Pressure and Refusal Skills, and Lesson 10:
Anger Management Skills do not have enough information. For example, in regard to Lesson 2,
one officer said that more information should be provided that “applies to the local areas because
there are different gangs in different areas.” During the interviews, some officers made general
comments about the lessons including recommending that the information (gang statistics) and
the language (particularly for the “Life in the Middle” role-plays present in each lesson) be
updated. For example, one officer stated that the language in Life in the Middle is “geeky.”
Also, when making general comments about the lessons, officers stated that time constraints are
a problem during implementation, an issue that arises in the next section as well.
Combining or Skipping Lessons
Officers were also asked about combining or skipping lessons while teaching the program
(not shown in table). Overall, only 31.7 percent of the officers surveyed stated that they had
combined or skipped a lesson. Of the officers who combine or skip lessons, they typically skip
those near the end of the 13-week period (i.e., lessons 8 through 13) (76.5%). The majority of
the officers stated that they typically skip or combine lessons because of time constraints
(62.2%). These findings were consistent across teaching models as well as the interviews.
Officers noted in the interviews that they normally did not pick which lessons to combine, stating
that it depends on outside factors (e.g., time constraints due to fire drills or other duties).
Additionally, officers stated that they modified the lessons by spending less time on the activities
and just lecturing on the subject matter. According to our classroom observations of officers
delivering the program (N = 522), combining or skipping lessons was the exception rather than
the rule. Program Appropriateness
There were a total of eight questions asking about program appropriateness in terms of
age level, content, and community needs. The distribution of positive responses to these
questions is shown in Table 7. Overall, the majority of the officers in the total sample were
201
This document is a research report submitted to the U.S. Department of Justice. This report has not been published by the Department. Opinions or points of view expressed are those of the author(s)
and do not necessarily reflect the official position or policies of the U.S. Department of Justice.
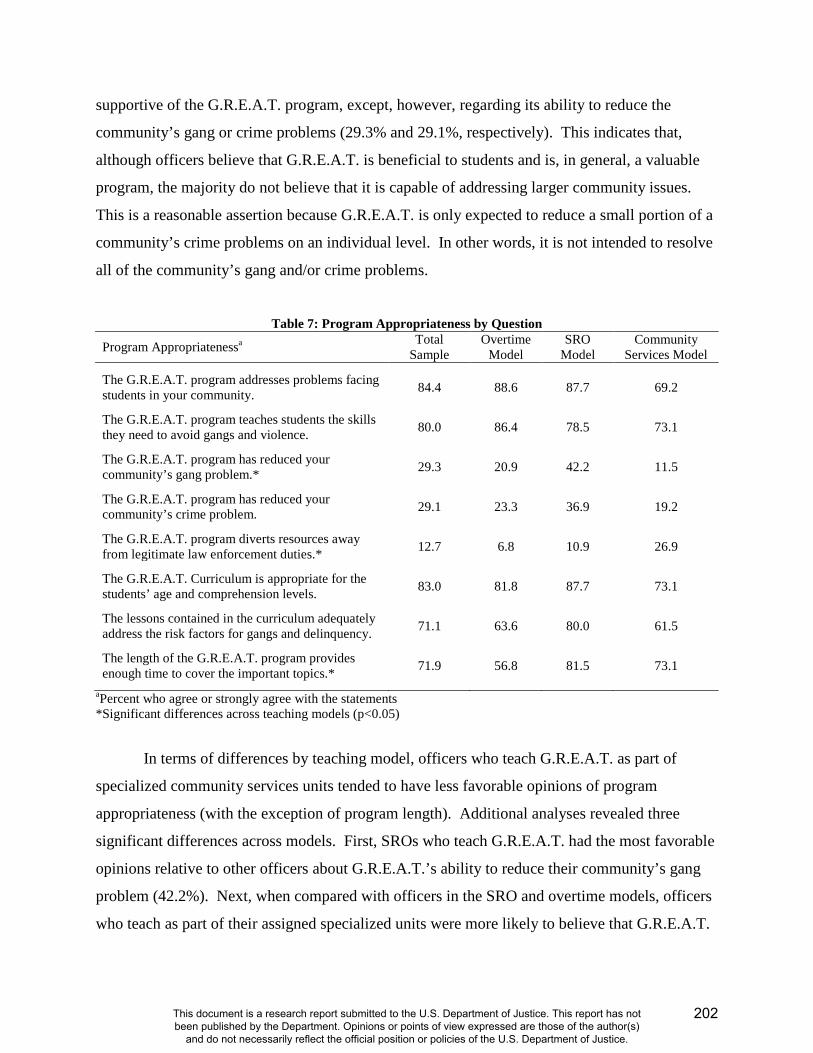
supportive of the G.R.E.A.T. program, except, however, regarding its ability to reduce the
community’s gang or crime problems (29.3% and 29.1%, respectively). This indicates that,
although officers believe that G.R.E.A.T. is beneficial to students and is, in general, a valuable
program, the majority do not believe that it is capable of addressing larger community issues.
This is a reasonable assertion because G.R.E.A.T. is only expected to reduce a small portion of a
community’s crime problems on an individual level. In other words, it is not intended to resolve
all of the community’s gang and/or crime problems.
Table 7: Program Appropriateness by Question
Program Appropriatenessa Total Sample
Overtime Model
SRO Model
Community Services Model
The G.R.E.A.T. program addresses problems facing students in your community. 84.4 88.6 87.7 69.2
The G.R.E.A.T. program teaches students the skills they need to avoid gangs and violence. 80.0 86.4 78.5 73.1
The G.R.E.A.T. program has reduced your community’s gang problem.*
29.3 20.9 42.2 11.5
The G.R.E.A.T. program has reduced your community’s crime problem. 29.1 23.3 36.9 19.2
The G.R.E.A.T. program diverts resources away from legitimate law enforcement duties.*
12.7 6.8 10.9 26.9
The G.R.E.A.T. Curriculum is appropriate for the students’ age and comprehension levels. 83.0 81.8 87.7 73.1
The lessons contained in the curriculum adequately address the risk factors for gangs and delinquency. 71.1 63.6 80.0 61.5
The length of the G.R.E.A.T. program provides enough time to cover the important topics.*
71.9 56.8 81.5 73.1
aPercent who agree or strongly agree with the statements *Significant differences across teaching models (p<0.05)
In terms of differences by teaching model, officers who teach G.R.E.A.T. as part of
specialized community services units tended to have less favorable opinions of program
appropriateness (with the exception of program length). Additional analyses revealed three
significant differences across models. First, SROs who teach G.R.E.A.T. had the most favorable
opinions relative to other officers about G.R.E.A.T.’s ability to reduce their community’s gang
problem (42.2%). Next, when compared with officers in the SRO and overtime models, officers
who teach as part of their assigned specialized units were more likely to believe that G.R.E.A.T.
202
This document is a research report submitted to the U.S. Department of Justice. This report has not been published by the Department. Opinions or points of view expressed are those of the author(s)
and do not necessarily reflect the official position or policies of the U.S. Department of Justice.
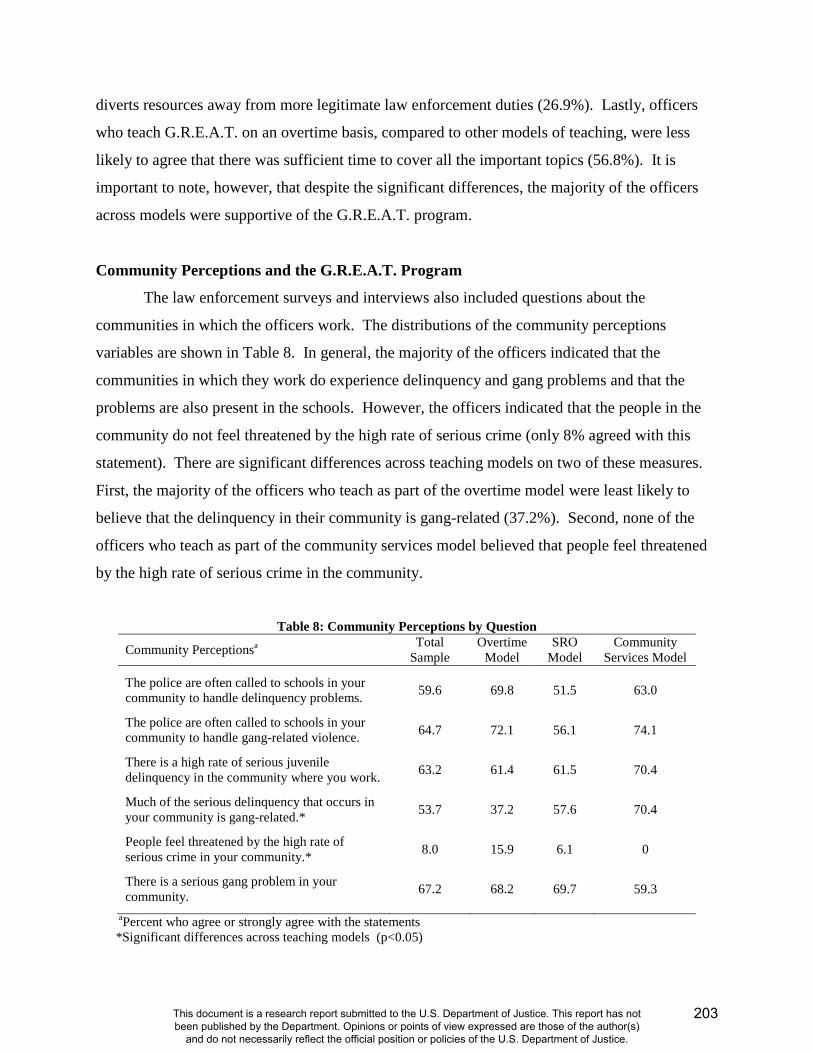
diverts resources away from more legitimate law enforcement duties (26.9%). Lastly, officers
who teach G.R.E.A.T. on an overtime basis, compared to other models of teaching, were less
likely to agree that there was sufficient time to cover all the important topics (56.8%). It is
important to note, however, that despite the significant differences, the majority of the officers
across models were supportive of the G.R.E.A.T. program.
Community Perceptions and the G.R.E.A.T. Program
The law enforcement surveys and interviews also included questions about the
communities in which the officers work. The distributions of the community perceptions
variables are shown in Table 8. In general, the majority of the officers indicated that the
communities in which they work do experience delinquency and gang problems and that the
problems are also present in the schools. However, the officers indicated that the people in the
community do not feel threatened by the high rate of serious crime (only 8% agreed with this
statement). There are significant differences across teaching models on two of these measures.
First, the majority of the officers who teach as part of the overtime model were least likely to
believe that the delinquency in their community is gang-related (37.2%). Second, none of the
officers who teach as part of the community services model believed that people feel threatened
by the high rate of serious crime in the community.
Table 8: Community Perceptions by Question
Community Perceptionsa Total Sample
Overtime Model
SRO Model
Community Services Model
The police are often called to schools in your community to handle delinquency problems. 59.6 69.8 51.5 63.0
The police are often called to schools in your community to handle gang-related violence. 64.7 72.1 56.1 74.1
There is a high rate of serious juvenile delinquency in the community where you work. 63.2 61.4 61.5 70.4
Much of the serious delinquency that occurs in your community is gang-related.* 53.7 37.2 57.6 70.4
People feel threatened by the high rate of serious crime in your community.* 8.0 15.9 6.1 0
There is a serious gang problem in your community. 67.2 68.2 69.7 59.3
aPercent who agree or strongly agree with the statements *Significant differences across teaching models (p<0.05)
203
This document is a research report submitted to the U.S. Department of Justice. This report has not been published by the Department. Opinions or points of view expressed are those of the author(s)
and do not necessarily reflect the official position or policies of the U.S. Department of Justice.
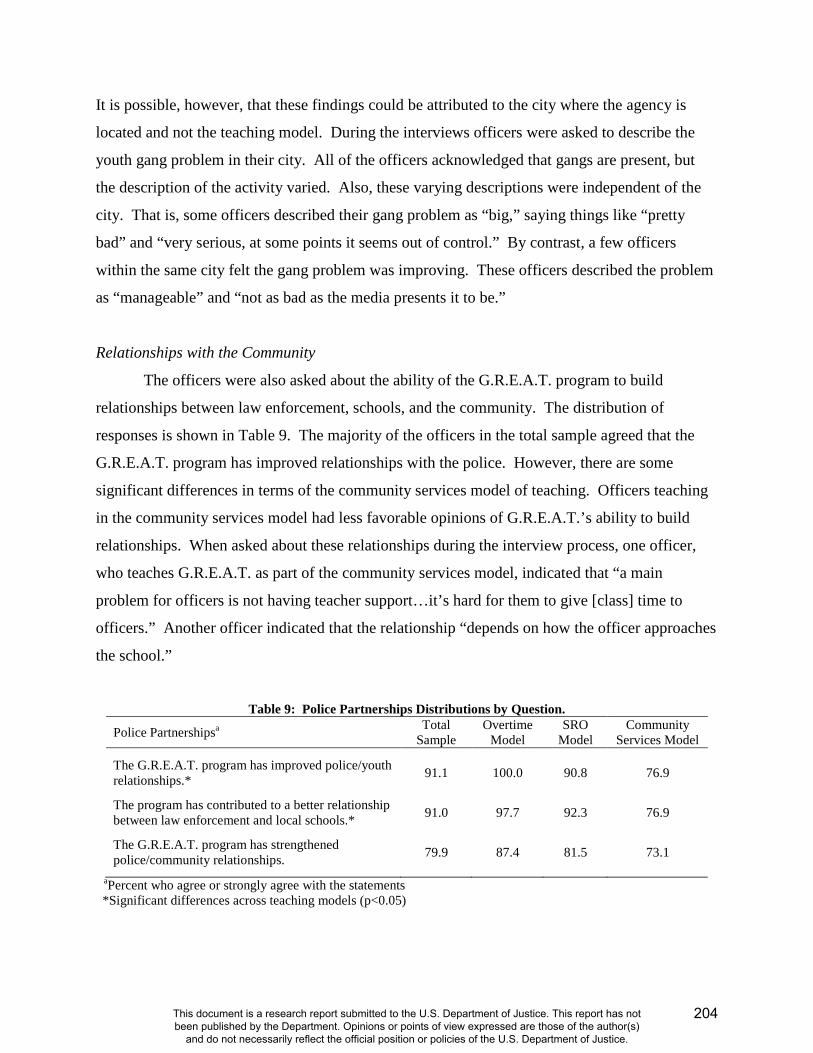
It is possible, however, that these findings could be attributed to the city where the agency is
located and not the teaching model. During the interviews officers were asked to describe the
youth gang problem in their city. All of the officers acknowledged that gangs are present, but
the description of the activity varied. Also, these varying descriptions were independent of the
city. That is, some officers described their gang problem as “big,” saying things like “pretty
bad” and “very serious, at some points it seems out of control.” By contrast, a few officers
within the same city felt the gang problem was improving. These officers described the problem
as “manageable” and “not as bad as the media presents it to be.”
Relationships with the Community
The officers were also asked about the ability of the G.R.E.A.T. program to build
relationships between law enforcement, schools, and the community. The distribution of
responses is shown in Table 9. The majority of the officers in the total sample agreed that the
G.R.E.A.T. program has improved relationships with the police. However, there are some
significant differences in terms of the community services model of teaching. Officers teaching
in the community services model had less favorable opinions of G.R.E.A.T.’s ability to build
relationships. When asked about these relationships during the interview process, one officer,
who teaches G.R.E.A.T. as part of the community services model, indicated that “a main
problem for officers is not having teacher support…it’s hard for them to give [class] time to
officers.” Another officer indicated that the relationship “depends on how the officer approaches
the school.”
Table 9: Police Partnerships Distributions by Question.
Police Partnershipsa Total Sample
Overtime Model
SRO Model
Community Services Model
The G.R.E.A.T. program has improved police/youth relationships.*
91.1 100.0 90.8 76.9
The program has contributed to a better relationship between law enforcement and local schools.*
91.0 97.7 92.3 76.9
The G.R.E.A.T. program has strengthened police/community relationships. 79.9 87.4 81.5 73.1
aPercent who agree or strongly agree with the statements *Significant differences across teaching models (p<0.05)
204
This document is a research report submitted to the U.S. Department of Justice. This report has not been published by the Department. Opinions or points of view expressed are those of the author(s)
and do not necessarily reflect the official position or policies of the U.S. Department of Justice.
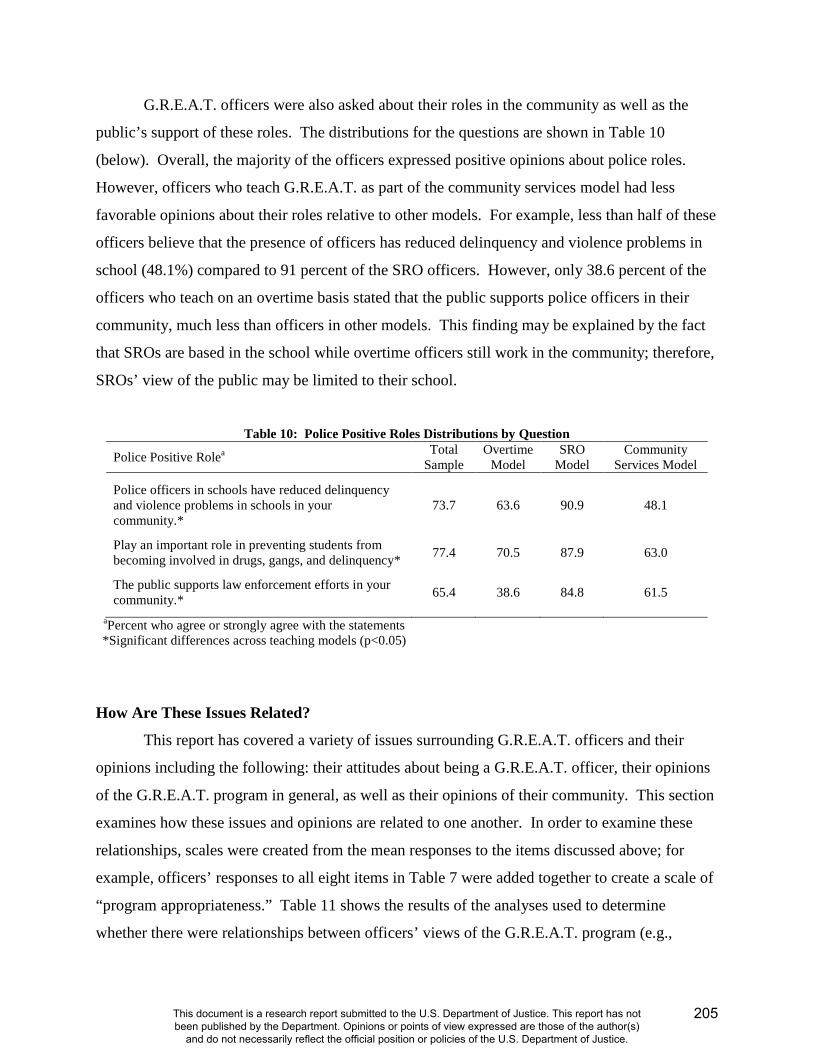
G.R.E.A.T. officers were also asked about their roles in the community as well as the
public’s support of these roles. The distributions for the questions are shown in Table 10
(below). Overall, the majority of the officers expressed positive opinions about police roles.
However, officers who teach G.R.E.A.T. as part of the community services model had less
favorable opinions about their roles relative to other models. For example, less than half of these
officers believe that the presence of officers has reduced delinquency and violence problems in
school (48.1%) compared to 91 percent of the SRO officers. However, only 38.6 percent of the
officers who teach on an overtime basis stated that the public supports police officers in their
community, much less than officers in other models. This finding may be explained by the fact
that SROs are based in the school while overtime officers still work in the community; therefore,
SROs’ view of the public may be limited to their school.
Table 10: Police Positive Roles Distributions by Question
Police Positive Rolea Total Sample
Overtime Model
SRO Model
Community Services Model
Police officers in schools have reduced delinquency and violence problems in schools in your community.*
73.7 63.6 90.9 48.1
Play an important role in preventing students from becoming involved in drugs, gangs, and delinquency*
77.4 70.5 87.9 63.0
The public supports law enforcement efforts in your community.*
65.4 38.6 84.8 61.5
aPercent who agree or strongly agree with the statements *Significant differences across teaching models (p<0.05) How Are These Issues Related?
This report has covered a variety of issues surrounding G.R.E.A.T. officers and their
opinions including the following: their attitudes about being a G.R.E.A.T. officer, their opinions
of the G.R.E.A.T. program in general, as well as their opinions of their community. This section
examines how these issues and opinions are related to one another. In order to examine these
relationships, scales were created from the mean responses to the items discussed above; for
example, officers’ responses to all eight items in Table 7 were added together to create a scale of
“program appropriateness.” Table 11 shows the results of the analyses used to determine
whether there were relationships between officers’ views of the G.R.E.A.T. program (e.g.,
205
This document is a research report submitted to the U.S. Department of Justice. This report has not been published by the Department. Opinions or points of view expressed are those of the author(s)
and do not necessarily reflect the official position or policies of the U.S. Department of Justice.
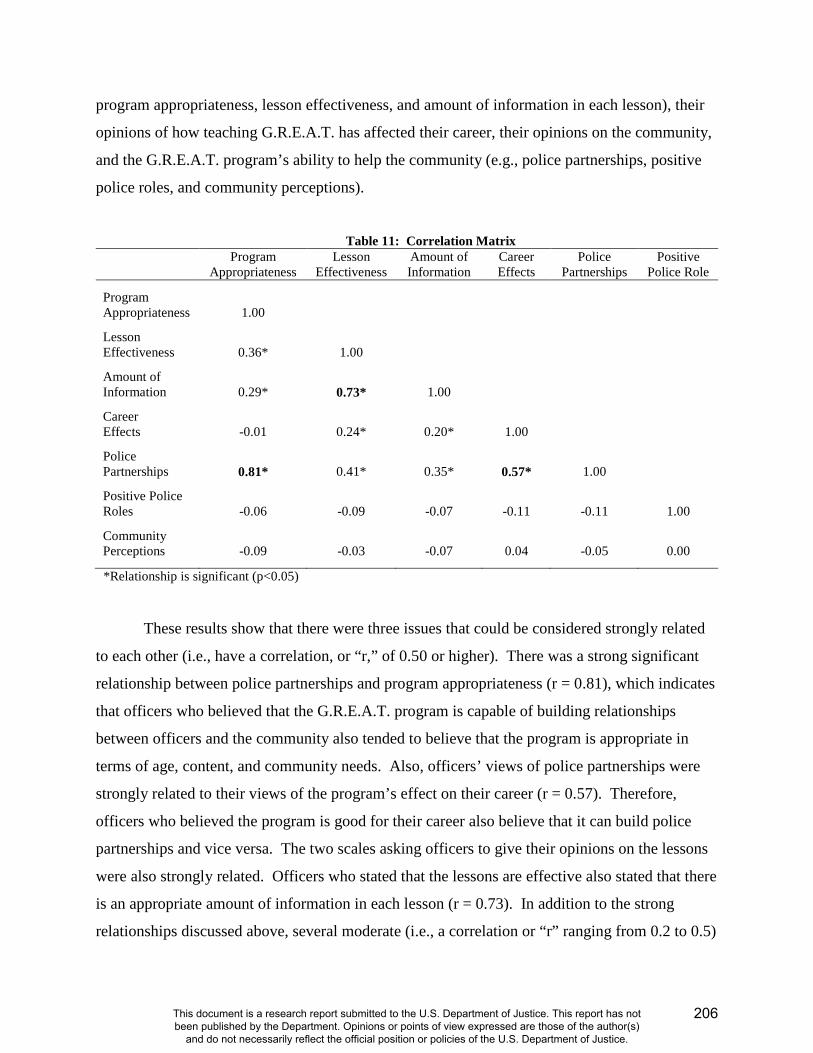
program appropriateness, lesson effectiveness, and amount of information in each lesson), their
opinions of how teaching G.R.E.A.T. has affected their career, their opinions on the community,
and the G.R.E.A.T. program’s ability to help the community (e.g., police partnerships, positive
police roles, and community perceptions).
Table 11: Correlation Matrix
Program Appropriateness
Lesson Effectiveness
Amount of Information
Career Effects
Police Partnerships
Positive Police Role
Program Appropriateness 1.00
Lesson Effectiveness 0.36* 1.00
Amount of Information 0.29* 0.73* 1.00
Career Effects -0.01 0.24* 0.20* 1.00
Police Partnerships 0.81* 0.41* 0.35* 0.57* 1.00
Positive Police Roles -0.06 -0.09 -0.07 -0.11 -0.11 1.00
Community Perceptions -0.09 -0.03 -0.07 0.04 -0.05 0.00
*Relationship is significant (p<0.05)
These results show that there were three issues that could be considered strongly related
to each other (i.e., have a correlation, or “r,” of 0.50 or higher). There was a strong significant
relationship between police partnerships and program appropriateness (r = 0.81), which indicates
that officers who believed that the G.R.E.A.T. program is capable of building relationships
between officers and the community also tended to believe that the program is appropriate in
terms of age, content, and community needs. Also, officers’ views of police partnerships were
strongly related to their views of the program’s effect on their career (r = 0.57). Therefore,
officers who believed the program is good for their career also believe that it can build police
partnerships and vice versa. The two scales asking officers to give their opinions on the lessons
were also strongly related. Officers who stated that the lessons are effective also stated that there
is an appropriate amount of information in each lesson (r = 0.73). In addition to the strong
relationships discussed above, several moderate (i.e., a correlation or “r” ranging from 0.2 to 0.5)
206
This document is a research report submitted to the U.S. Department of Justice. This report has not been published by the Department. Opinions or points of view expressed are those of the author(s)
and do not necessarily reflect the official position or policies of the U.S. Department of Justice.

relationships were found. Opinions on lesson effectiveness are moderately correlated with views
on program appropriateness (r = 0.36), police partnerships (r = 0.41), and career effects (r =
0.24), indicating that officers who felt the lessons were effective also thought that program was
appropriate, built partnerships, and had a positive career effect. Likewise, views of the amount
of information in each lesson are also correlated with program appropriateness (r = 0.29), police
partnerships (r = 0.35), and career effects (r = 0.20).
Summary
This report specifically focused on the law enforcement surveys and interviews collected
during the national evaluation of the G.R.E.A.T. program. It provides information on the
demographic characteristics of the officers as well as their opinions about teaching G.R.E.A.T.,
the G.R.E.A.T. program in general, and their perceptions of G.R.E.A.T.’s ability to benefit their
communities. The results show that, in general, officers enjoy being G.R.E.A.T. officers and are
committed to teaching the program. However, being a G.R.E.A.T. officer has a downside. In
the majority of the cities, officers, as well as supervisors, stated that G.R.E.A.T. officers are
viewed in a negative light by other officers and are considered “lazy” or as “kiddie cops.”
Portland officers (i.e., overtime model) typically had the most favorable opinions on how they
are viewed by other officers. Also, officers reported that teaching the G.R.E.A.T. program does
have a negative effect on their career, in terms of offering fewer opportunities for overtime and
not enhancing chances for promotion.
In general, officers stated the G.R.E.A.T. program is appropriate in terms of content, but
does not necessarily meet their community’s needs. In other words, they believe that G.R.E.A.T.
is beneficial to students and a valuable program, but do not believe that it is capable of reducing
larger community problems. This assertion is expected because G.R.E.A.T. is intended to aid
only in the reduction of gang membership in the youth population. Because it uses an
individual-level approach, it is not meant to “fix” all of the community’s delinquency problems.
The officers reported that their communities do experience delinquency and gang problems, but
do not believe that people feel threatened by these problems. In addition, officers believed that
the G.R.E.A.T. program is capable of building partnerships between police officers, youth,
schools, and the community. Officers also felt in general that the G.R.E.A.T. program’s lessons
207
This document is a research report submitted to the U.S. Department of Justice. This report has not been published by the Department. Opinions or points of view expressed are those of the author(s)
and do not necessarily reflect the official position or policies of the U.S. Department of Justice.
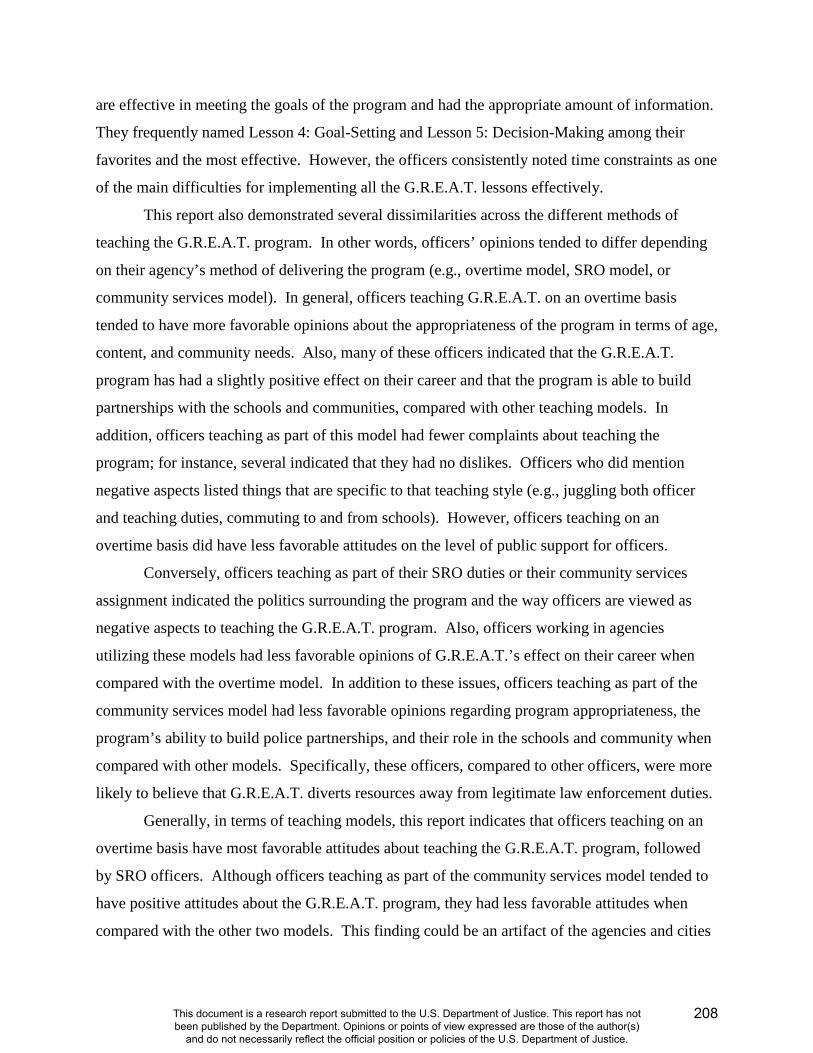
are effective in meeting the goals of the program and had the appropriate amount of information.
They frequently named Lesson 4: Goal-Setting and Lesson 5: Decision-Making among their
favorites and the most effective. However, the officers consistently noted time constraints as one
of the main difficulties for implementing all the G.R.E.A.T. lessons effectively.
This report also demonstrated several dissimilarities across the different methods of
teaching the G.R.E.A.T. program. In other words, officers’ opinions tended to differ depending
on their agency’s method of delivering the program (e.g., overtime model, SRO model, or
community services model). In general, officers teaching G.R.E.A.T. on an overtime basis
tended to have more favorable opinions about the appropriateness of the program in terms of age,
content, and community needs. Also, many of these officers indicated that the G.R.E.A.T.
program has had a slightly positive effect on their career and that the program is able to build
partnerships with the schools and communities, compared with other teaching models. In
addition, officers teaching as part of this model had fewer complaints about teaching the
program; for instance, several indicated that they had no dislikes. Officers who did mention
negative aspects listed things that are specific to that teaching style (e.g., juggling both officer
and teaching duties, commuting to and from schools). However, officers teaching on an
overtime basis did have less favorable attitudes on the level of public support for officers.
Conversely, officers teaching as part of their SRO duties or their community services
assignment indicated the politics surrounding the program and the way officers are viewed as
negative aspects to teaching the G.R.E.A.T. program. Also, officers working in agencies
utilizing these models had less favorable opinions of G.R.E.A.T.’s effect on their career when
compared with the overtime model. In addition to these issues, officers teaching as part of the
community services model had less favorable opinions regarding program appropriateness, the
program’s ability to build police partnerships, and their role in the schools and community when
compared with other models. Specifically, these officers, compared to other officers, were more
likely to believe that G.R.E.A.T. diverts resources away from legitimate law enforcement duties.
Generally, in terms of teaching models, this report indicates that officers teaching on an
overtime basis have most favorable attitudes about teaching the G.R.E.A.T. program, followed
by SRO officers. Although officers teaching as part of the community services model tended to
have positive attitudes about the G.R.E.A.T. program, they had less favorable attitudes when
compared with the other two models. This finding could be an artifact of the agencies and cities
208
This document is a research report submitted to the U.S. Department of Justice. This report has not been published by the Department. Opinions or points of view expressed are those of the author(s)
and do not necessarily reflect the official position or policies of the U.S. Department of Justice.
(e.g., Chicago and Philadelphia) employing the community services model. These departments
and cities are geographically larger and are likely to differ culturally from other law enforcement
agencies across the country. This information, in combination with low response rates in
Chicago and Philadelphia (38% and 43% respectively), may limit the representativeness of the
community services sample included in this report. In other words, the responses of these two
departments may not accurately portray the opinions of all officers teaching as part of the
community services model.
209
This document is a research report submitted to the U.S. Department of Justice. This report has not been published by the Department. Opinions or points of view expressed are those of the author(s)
and do not necessarily reflect the official position or policies of the U.S. Department of Justice.
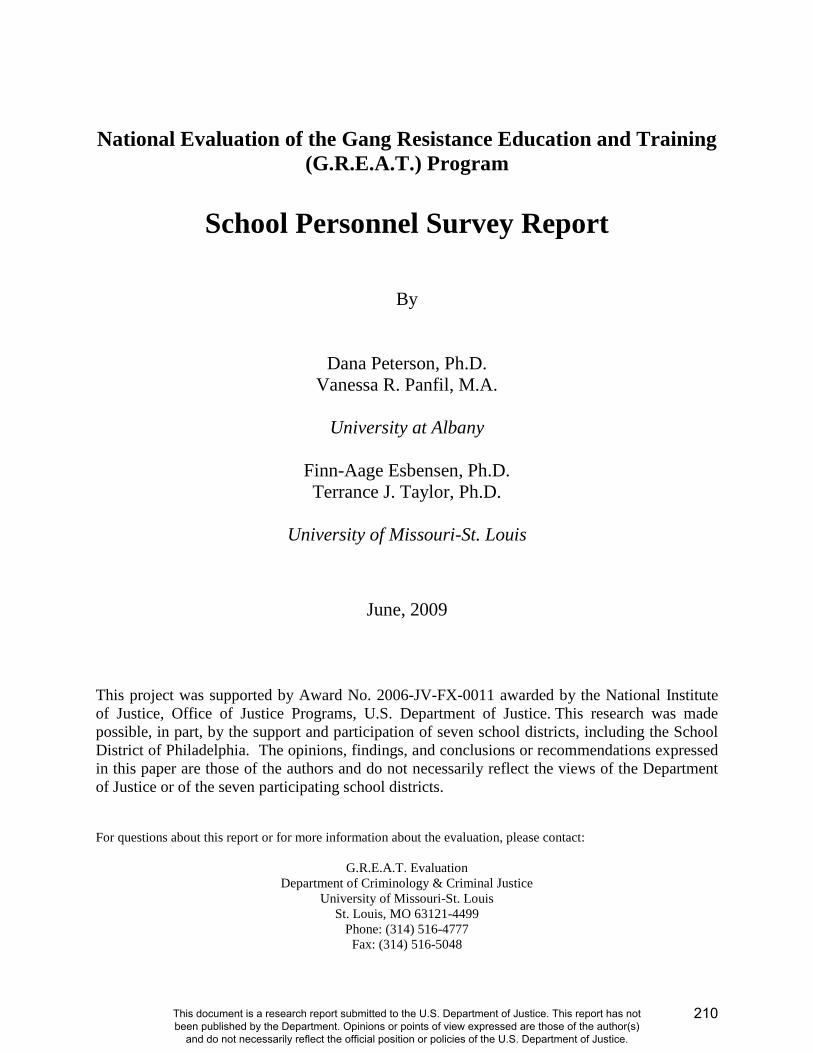
National Evaluation of the Gang Resistance Education and Training (G.R.E.A.T.) Program
School Personnel Survey Report
By
Dana Peterson, Ph.D. Vanessa R. Panfil, M.A.
University at Albany
Finn-Aage Esbensen, Ph.D. Terrance J. Taylor, Ph.D.
University of Missouri-St. Louis
June, 2009
This project was supported by Award No. 2006-JV-FX-0011 awarded by the National Institute of Justice, Office of Justice Programs, U.S. Department of Justice. This research was made possible, in part, by the support and participation of seven school districts, including the School District of Philadelphia. The opinions, findings, and conclusions or recommendations expressed in this paper are those of the authors and do not necessarily reflect the views of the Department of Justice or of the seven participating school districts.
For questions about this report or for more information about the evaluation, please contact:
G.R.E.A.T. Evaluation Department of Criminology & Criminal Justice
University of Missouri-St. Louis St. Louis, MO 63121-4499
Phone: (314) 516-4777 Fax: (314) 516-5048
210
This document is a research report submitted to the U.S. Department of Justice. This report has not been published by the Department. Opinions or points of view expressed are those of the author(s)
and do not necessarily reflect the official position or policies of the U.S. Department of Justice.
National Evaluation of the Gang Resistance Education and Training (G.R.E.A.T.) Program: School Personnel Survey Report
Executive Summary
The process and outcome evaluation of the Gang Resistance Education and Training (G.R.E.A.T.) program consists of several components, including surveys of administrators and teachers in the middle schools participating in the evaluation. Surveys were distributed to all administrators and G.R.E.A.T.-grade level (i.e., 6th or 7th) teachers and coordinators in the seven study locations (Albuquerque, NM; Portland, OR; Greeley, CO; Nashville, TN; Philadelphia, PA; Chicago, IL; and a Dallas/Fort Worth, TX location). Of 373 surveys distributed, 230 were returned (62% completion rate). This report details the results of those surveys, in which respondents gave their opinions about a variety of issues, including disorder in their schools, perceptions of their work environment, fear of crime and actual victimization experiences within or around their schools, views of the roles of law enforcement officers and prevention programs in schools, and, for those who indicated they were familiar with the program, opinions about the G.R.E.A.T. program and G.R.E.A.T. officer. The goal of the school personnel survey was to better understand the context in which the G.R.E.A.T. program is offered, as well as factors that might influence variation in opinions about the G.R.E.A.T. program and G.R.E.A.T. officers. There appears to be a good deal of support for both the G.R.E.A.T. program and officers. The majority of educators believed the program taught skills necessary for youths to avoid delinquency and gangs, addressed problems faced by their students, and improved student-police relations, but only about half agreed that the program played a significant role in reducing youth gang participation in their schools and communities. Similarly, the G.R.E.A.T. officer teaching the program was viewed favorably by the majority of respondents, in terms of both preparation and delivery of program and their interactions in the classroom. Despite this overall positive assessment, results indicated that some officers struggled with classroom management or failed to attend on scheduled days. These favorable views of program and officer are most strongly tied to positive views of law enforcement officers and prevention programs in schools and do not appear to be related to problems in schools such as delinquency and gangs, to fear of crime or crime victimization, to job satisfaction or other perceptions about school as a work environment, or to whether the respondents’ school has a School Resource Officer. Importantly, views of the G.R.E.A.T. program and the G.R.E.A.T. officer are related to each other; many school personnel felt that the success of the program hinges upon the officer. School personnel in whose classrooms G.R.E.A.T. had been taught also provided comments about their role in the program. Most played at least some role in the program, although this was largely classroom management activities, while many used the time for grading or other paperwork. Aspects of the current educational climate, such as meeting standards set forth in the “No Child Left Behind” act, provide challenges to delivery and reinforcement of the G.R.E.A.T. program. Almost half did not incorporate G.R.E.A.T. lesson content into their own curricula, mostly due to lack of time (a large concern was covering material for mandated testing), but also because it was not relevant to their subject. Similarly, most did not use extended teacher activities associated with G.R.E.A.T. lessons, often due to lack of time, but almost as often because they had not been made aware of the activities by the G.R.E.A.T. officer. The report concludes with recommendations based on findings from the School Personnel Survey.
211
This document is a research report submitted to the U.S. Department of Justice. This report has not been published by the Department. Opinions or points of view expressed are those of the author(s)
and do not necessarily reflect the official position or policies of the U.S. Department of Justice.
TABLE OF CONTENTS
Gang Resistance Education and Training (G.R.E.A.T.) 213
Process and Outcome Evaluation of G.R.E.A.T. 213
School Personnel Survey 214
Survey Distribution and Response 215
Sample Characteristics 217
School Problems, Environment, Crime and Victimization 219
School Problems 219
School/Neighborhood Crime and Delinquency 221
Fear of Crime and Experiences of Victimization at School 222
School as a Work Environment 223
Perceptions of Work Environment 224
Job Satisfaction 225
School Rules and Enforcement 226
Opinions of Law Enforcement and Prevention Programming in Schools 228
Law Enforcement Officers in Schools 228
Prevention Programs in Schools 230
Prevention Program Content and Delivery 231
Attitudes about G.R.E.A.T. 233
Opinions about the G.R.E.A.T. Program 234
Open-ended Comments about the G.R.E.A.T. Program 236
Do Opinions of G.R.E.A.T. Differ by Context? Correlational Analyses 237
Opinions about G.R.E.A.T. Officers 238
Open-ended Comments about the G.R.E.A.T. Officer 241
Do Opinions of G.R.E.A.T. Officers Differ by Context? Correlational Analyses 242
Role of Educators in the G.R.E.A.T. Program 243
Summary and Conclusion 246
References and Resources 251
212
This document is a research report submitted to the U.S. Department of Justice. This report has not been published by the Department. Opinions or points of view expressed are those of the author(s)
and do not necessarily reflect the official position or policies of the U.S. Department of Justice.
Gang Resistance Education and Training (G.R.E.A.T.)
The Gang Resistance Education and Training (G.R.E.A.T.) program is a primary gang
and delinquency prevention program delivered by law enforcement officers in school settings.
The original G.R.E.A.T. program was developed in 1991 by Phoenix-area law enforcement
agencies and quickly adopted by agencies throughout the United States. This curriculum
contained nine lecture-based lessons to be taught primarily in middle-school grades. Results
from an earlier National Evaluation of the G.R.E.A.T. program (1994-2001) found no
differences between G.R.E.A.T. and non-G.R.E.A.T. youths in terms of key behavioral outcomes
the program intended to affect (i.e., involvement in gangs and delinquent behavior).
Based in part on these findings, the G.R.E.A.T. program underwent a critical review that
resulted in substantial program modifications. The revised curriculum consists of 13 lessons
aimed at teaching youths the life-skills (e.g., communication and refusal skills, conflict
resolution and anger management techniques) thought necessary to prevent involvement in gangs
and delinquency. The program’s two main goals are 1) to help youths avoid gang membership,
violence, and criminal activity, and 2) to help youths develop a positive relationship with law
enforcement. The revised G.R.E.A.T. curriculum was piloted in 2001, with full-scale
implementation occurring in 2003.
Process and Outcome Evaluation of G.R.E.A.T.
In 2006, following a competitive peer review process, the National Institute of Justice
awarded the University of Missouri-St. Louis funding to conduct a six-year evaluation of the
revised G.R.E.A.T. program. This process and outcome evaluation consists of a number of
different components, including student surveys; classroom observations in both G.R.E.A.T. and
non-G.R.E.A.T. classrooms; surveys of school personnel and of law enforcement officers;
interviews with G.R.E.A.T. officers and G.R.E.A.T. supervisors; and observations of G.R.E.AT.
Officer Training (G.O.T.) and G.R.E.A.T. Families sessions. This report provides information
from the School Personnel Survey component of the evaluation.
Seven cities varying in size, region, and level of gang activity were selected for inclusion
in the evaluation: Albuquerque, New Mexico; Chicago, Illinois; Greeley, Colorado; Nashville,
Tennessee; Philadelphia, Pennsylvania; Portland, Oregon; and a Dallas-Fort Worth (DFW),
213
This document is a research report submitted to the U.S. Department of Justice. This report has not been published by the Department. Opinions or points of view expressed are those of the author(s)
and do not necessarily reflect the official position or policies of the U.S. Department of Justice.
Texas area location. Three criteria guided the selection of cities: 1) the existence of an
established G.R.E.A.T. program, 2) geographic and demographic diversity, and 3) evidence of
gang activity.
Once the cities were selected, the research staff worked with the primary local law
enforcement agency and the school district in each city to secure their cooperation with the
evaluation efforts which began in Fall 2006. Upon district approval of the study, four to six
public middle schools were identified within each site for study participation, and principals
were contacted. The goal of the school selection was to identify schools that, taken as a whole,
would be representative of the districts. In five of the cities, we were successful in doing so. In
Chicago1 and Philadelphia, due in part to the sheer size of these districts, we were not as
successful; even in these two instances, however, the final sample does not diverge too much
from the district as a whole. The final sample consists of 31 public middle schools in the seven
evaluation sites.
School Personnel Survey
One component of the evaluation is an anonymous self-report survey of participating
schools’ teachers and administrators in order to supplement the classroom observations of
G.R.E.A.T. program delivery and the student and law enforcement surveys. Included in the
twelve-page survey were sets of questions designed to measure a variety of perceptions,
attitudes, and experiences. School personnel were asked, for example, about disorder in their
schools, their perceptions of their work environment, fear of crime and actual victimization
experiences within or around their schools, view of the role of law enforcement officers in
schools, opinions about school-based prevention programs in general, and, for those who
1One of the five originally-selected Chicago schools, which was comprised nearly 100 percent of African American students, was unable to meet the requirements of the study and was dropped from the sample. Given time constraints (i.e., it was too late in the school year to select a comparable school and implement the G.R.E.A.T. program with fidelity), we were unable to replace the excluded school during 2006-2007. Thus, the resulting sample was largely Hispanic, while the district was largely African-American. To increase representativeness of the Chicago sample, the decision was made to add two primarily African American schools to the evaluation in the 2007-2008 school year, even though this meant that these schools would be one year behind other schools in the evaluation. In addition to this exclusion and replacement of one school in Chicago, two principals (one in the DFW area and one in Albuquerque) who were contacted declined their schools’ participation. In one case, the principal had previously been a police gang investigator and, thus, “knew the program worked.” In the other case, the principal would not agree to our study design, which called for random assignment of classrooms within schools to either receive the G.R.E.A.T. program (experimental condition) or not receive the program (control condition). In these two instances, schools were replaced with another similar school in the district.
214
This document is a research report submitted to the U.S. Department of Justice. This report has not been published by the Department. Opinions or points of view expressed are those of the author(s)
and do not necessarily reflect the official position or policies of the U.S. Department of Justice.
indicated they were familiar with the program, opinions about the G.R.E.A.T. program and
G.R.E.A.T. officer. The goal of the school personnel survey was to better understand the context
in which the G.R.E.A.T. program is offered as well as factors that might influence variation in
opinions about the G.R.E.A.T. program and G.R.E.A.T. officers.
Survey Distribution and Response
The target sample consisted of school administrators (Principal and Vice or Assistant
Principals) and all teachers and coordinators in the grade level at which G.R.E.A.T. was taught at
the school. In most of the 31 participating schools, this was the 6th grade; in five schools, this
was 7th grade.
The survey was originally distributed to 29 schools in the seven cities participating in the
National Evaluation toward the end of the spring semester of 2007 (the two Chicago schools
added in Fall 2007 completed surveys in Spring 2008). Included in survey packets were a blank
survey and a cover memo explaining the evaluation, the purpose of the survey, and the facts that
participation was voluntary and anonymous. Stapled to each packet was a small “thank-you”
present for completing the questionnaire (a happy-face “stress ball” on an elastic string).
Distribution and collection procedures varied by site and/or school: in some schools, the
Investigator or an on-site research assistant placed a packet with postage-paid return envelopes in
each teacher’s and administrator’s school mailbox; in other schools, packets were mailed to a
contact person at the school for distribution and collection, with a pre-paid FedEx Pak envelope
provided for return; and in still other schools, the Investigator personally picked up completed
surveys.
The response rate for this Spring 2007 distribution was much lower than desired, with
just 29.1% of the intended sample returning completed surveys. Rates varied considerably
across sites, from a low of 13.5% of respondents in Philadelphia completing and returning
surveys to a high of 54.2% in Chicago. At the school level, response rates ranged from zero
percent for one school each in Philadelphia and Portland to 100% in one Chicago school (the
next highest rates were 67% in another school in Chicago and 64% in one DFW area school).
In order to achieve a response rate that would enable adequate analyses of the data to
produce meaningful findings, surveys were re-distributed in Fall 2007 to 22 of the 29 schools.
Two schools had high response rates in Spring 2007, returning most, if not all, and were thus not
215
This document is a research report submitted to the U.S. Department of Justice. This report has not been published by the Department. Opinions or points of view expressed are those of the author(s)
and do not necessarily reflect the official position or policies of the U.S. Department of Justice.
re-surveyed; a third school had a change in Principal for Fall 2007 and the new principal did not
agree to re-surveying of school personnel; finally, due to teacher-union negotiations occurring in
Fall 2007, the four schools in Greeley were re-surveyed in Spring 2008. In addition, surveys
were distributed in Spring 2008 to targeted personnel in the two new schools added in Chicago.
All Spring 2008 surveys are included in the Fall 2007 group. In this second distribution effort,
most2 packets were mailed directly from the St. Louis research office to a contact person at each
school, who was in charge of distributing and collecting the surveys for return in a pre-paid
FedEx Pak envelope; in some instances, completed surveys were picked up in person by the
Investigator, who was on-site at the time. The response rate for this second distribution was still
lower than desired, but better, at 58.4%. Response rates ranged from a low of 40.4% in both
Philadelphia and the DFW area location to a high of 90% in Nashville. At the school level,
response rates ranged from zero percent at one DFW area school to 100% in Nashville.
Surveys returned in Spring 2007 and Fall 2007 (which included those collected in Spring
2008) were combined to create the final sample for analyses. To identify any duplicates (that is,
individuals who had completed both a Spring 2007 and a Fall 2007 or Spring 2008 survey),
responses to key demographic questions (e.g., sex, race/ethnicity, position held, years at school)
were compared between Spring and Fall surveys. This process identified thirty-nine school
personnel who had completed both surveys; for these, only their Spring 2007 survey was
included in the final sample. As shown in Table 1 below, the final, combined response rate was
61.7%, with a final sample of 230 non-duplicate surveys.
2 In Greeley, surveys were distributed to educators’ mailboxes by the Investigator. In one school in Albuquerque, it was discovered that the contact person had failed to distribute all of the surveys; thus, the Investigator met with each educator individually to request that s/he complete the survey. A different contact person agreed to collect them and mail them to the research office.
216
This document is a research report submitted to the U.S. Department of Justice. This report has not been published by the Department. Opinions or points of view expressed are those of the author(s)
and do not necessarily reflect the official position or policies of the U.S. Department of Justice.
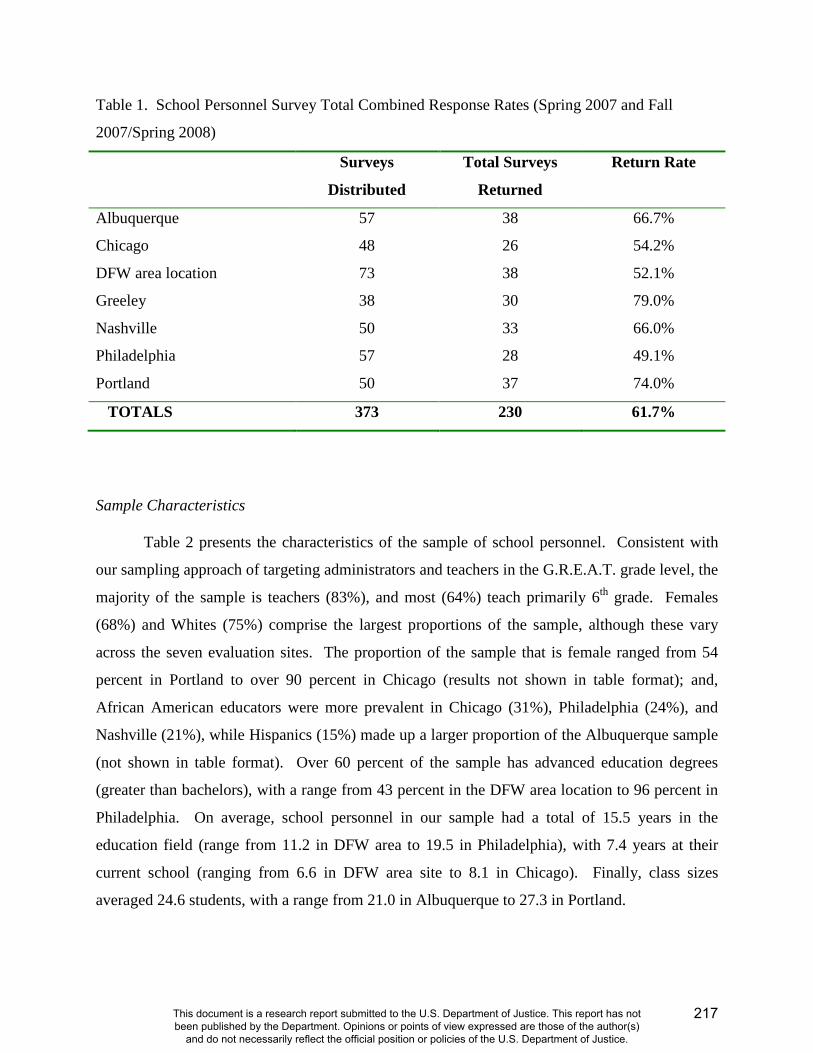
Table 1. School Personnel Survey Total Combined Response Rates (Spring 2007 and Fall
2007/Spring 2008)
Surveys
Distributed
Total Surveys
Returned
Return Rate
Albuquerque 57 38 66.7%
Chicago 48 26 54.2%
DFW area location 73 38 52.1%
Greeley 38 30 79.0%
Nashville 50 33 66.0%
Philadelphia 57 28 49.1%
Portland 50 37 74.0%
TOTALS 373 230 61.7%
Sample Characteristics
Table 2 presents the characteristics of the sample of school personnel. Consistent with
our sampling approach of targeting administrators and teachers in the G.R.E.A.T. grade level, the
majority of the sample is teachers (83%), and most (64%) teach primarily 6th grade. Females
(68%) and Whites (75%) comprise the largest proportions of the sample, although these vary
across the seven evaluation sites. The proportion of the sample that is female ranged from 54
percent in Portland to over 90 percent in Chicago (results not shown in table format); and,
African American educators were more prevalent in Chicago (31%), Philadelphia (24%), and
Nashville (21%), while Hispanics (15%) made up a larger proportion of the Albuquerque sample
(not shown in table format). Over 60 percent of the sample has advanced education degrees
(greater than bachelors), with a range from 43 percent in the DFW area location to 96 percent in
Philadelphia. On average, school personnel in our sample had a total of 15.5 years in the
education field (range from 11.2 in DFW area to 19.5 in Philadelphia), with 7.4 years at their
current school (ranging from 6.6 in DFW area site to 8.1 in Chicago). Finally, class sizes
averaged 24.6 students, with a range from 21.0 in Albuquerque to 27.3 in Portland.
217
This document is a research report submitted to the U.S. Department of Justice. This report has not been published by the Department. Opinions or points of view expressed are those of the author(s)
and do not necessarily reflect the official position or policies of the U.S. Department of Justice.

Table 2. School Personnel Sample Characteristics
N / Mean % / SD
Sex Female Male
143 67
68 32
Race White African-American Hispanic/Latino American Indian/Native American Asian/Pacific Islander Multi-racial
158 25 9 2 3
13
75 12 4 1 1 6
Primary job assignment Teacher Administrator Counselor Other
183 36 1 1
83 16 <1 <1
Grade-level taught Sixth Seventh Eighth Sixth, seventh, and eighth Multiple grades
115 24 7
22 12
64 13 4
12 7
Subject taught Health/Physical Education Language Arts Math/Computer Science Natural Sciences Social Sciences Arts/Theatre/Music Other
12 87 20 24 19 7 7
7
49 11 14 11 4 4
Highest degree attained Bachelors Masters Ph.D. Other
79
132 9 1
36 60 4
<1 Average class size 24.56 6.48
Total years in field of education 15.47 10.41
Total years at this school 7.42 6.88
In the sections that follow, we report findings that help us understand the contexts in
which the G.R.E.A.T. program is offered. Knowing more about these contexts can help us better
identify challenges in delivering the G.R.E.A.T. program and factors that might affect levels of
218
This document is a research report submitted to the U.S. Department of Justice. This report has not been published by the Department. Opinions or points of view expressed are those of the author(s)
and do not necessarily reflect the official position or policies of the U.S. Department of Justice.

support for G.R.E.A.T. The original G.R.E.A.T. curriculum was revised to improve such aspects
as dosage, delivery, and content. It may be (and our outcome evaluation results will speak to
this) that this longer curriculum, based on building skills in an active learning environment, will
be more effective than the previous curriculum in reaching G.R.E.A.T. goals. But, it is also true
that the educational environment has changed in the past 10 years, especially with the
implementation of No Child Left Behind. Consequently, it is useful to look at how perceptions
of G.R.E.A.T. vary by educators’ perceptions of issues facing their schools, their school
environment, etc. Administrators’ and teachers’ perceptions of such things as their work
environment, including school disorder, and school-based prevention programs may be related to
their opinions about the G.R.E.A.T. program and their perceptions of its potential effectiveness.
These opinions are important because they may, in turn, affect students’ perceptions of and
responsiveness to the program.
The remainder of this report is divided into four sections. The first section discusses
school personnel views of their schools’ problems and environment and their fear of crime and
actual victimization at school; the second section reviews perceptions of their schools as a work
and organizational environment; the third contains educators’ views of law enforcement and
prevention programs in schools, as well as prevention program content and delivery; and the
final section provides their views of the G.R.E.A.T. program and G.R.E.A.T. officers.
School Problems, Environment, Crime and Victimization
School Problems
School personnel were presented with a series of issues faced by some schools across the
country and asked to indicate whether these were “not a problem,” “somewhat of a problem,” or
“a big problem” in their own schools. Table 3 presents the proportion of respondents who
answered that each issue was “a big problem”; results are also presented by job position
(administrators compared to teachers) and by city.
Meeting standards set forth in “No Child Left Behind” legislation was cited by the largest
proportion (41%) of respondents as a big problem facing their schools. The extent to which
school personnel felt this was a problem varied, however, across sites, from only eight percent of
personnel in the DFW area to over 60 percent in Albuquerque and Greeley. One-third of the
219
This document is a research report submitted to the U.S. Department of Justice. This report has not been published by the Department. Opinions or points of view expressed are those of the author(s)
and do not necessarily reflect the official position or policies of the U.S. Department of Justice.
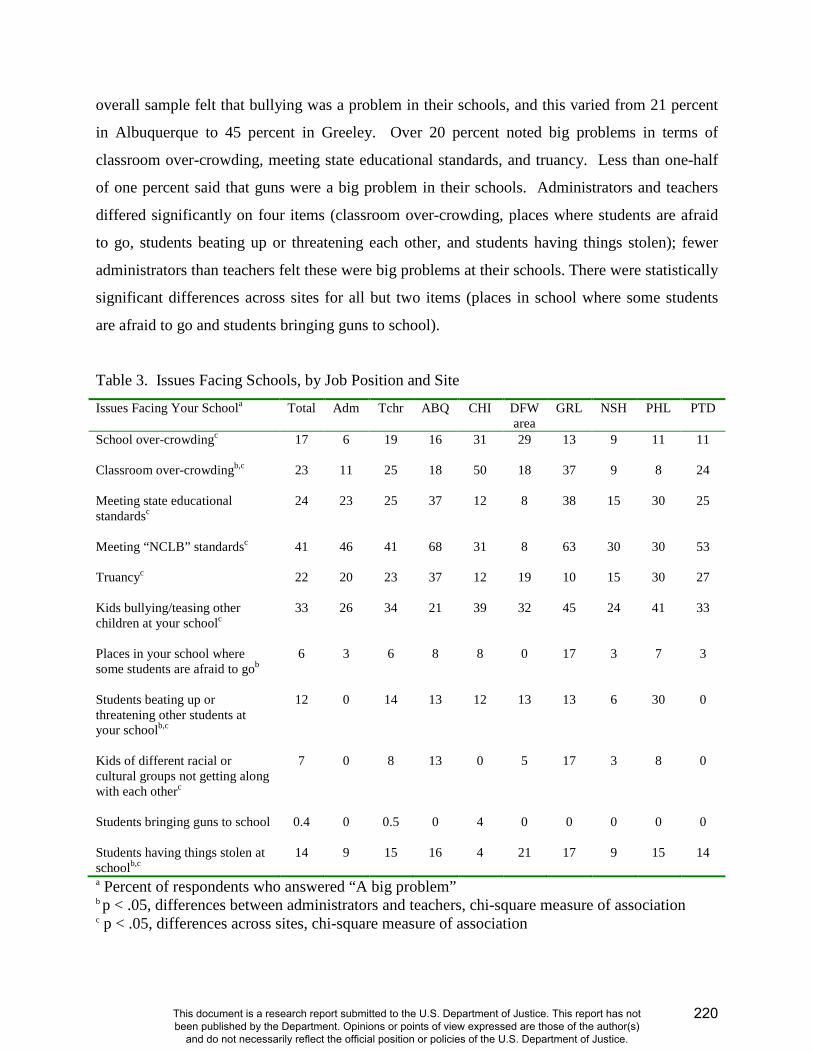
overall sample felt that bullying was a problem in their schools, and this varied from 21 percent
in Albuquerque to 45 percent in Greeley. Over 20 percent noted big problems in terms of
classroom over-crowding, meeting state educational standards, and truancy. Less than one-half
of one percent said that guns were a big problem in their schools. Administrators and teachers
differed significantly on four items (classroom over-crowding, places where students are afraid
to go, students beating up or threatening each other, and students having things stolen); fewer
administrators than teachers felt these were big problems at their schools. There were statistically
significant differences across sites for all but two items (places in school where some students
are afraid to go and students bringing guns to school).
Table 3. Issues Facing Schools, by Job Position and Site
Issues Facing Your Schoola Total Adm Tchr ABQ CHI DFW area
GRL NSH PHL PTD
School over-crowdingc
17 6 19 16 31 29 13 9 11 11
Classroom over-crowdingb,c
23 11 25 18 50 18 37 9 8 24
Meeting state educational standardsc
24 23 25 37 12 8 38 15 30 25
Meeting “NCLB” standardsc
41 46 41 68 31 8 63 30 30 53
Truancyc
22 20 23 37 12 19 10 15 30 27
Kids bullying/teasing other children at your schoolc
33 26 34 21 39 32 45 24 41 33
Places in your school where some students are afraid to gob
6 3 6 8 8 0 17 3 7 3
Students beating up or threatening other students at your schoolb,c
12 0 14 13 12 13 13 6 30 0
Kids of different racial or cultural groups not getting along with each otherc
7 0 8 13 0 5 17 3 8 0
Students bringing guns to school
0.4 0 0.5 0 4 0 0 0 0 0
Students having things stolen at schoolb,c
14 9 15 16 4 21 17 9 15 14
a Percent of respondents who answered “A big problem” b p < .05, differences between administrators and teachers, chi-square measure of association c p < .05, differences across sites, chi-square measure of association
220
This document is a research report submitted to the U.S. Department of Justice. This report has not been published by the Department. Opinions or points of view expressed are those of the author(s)
and do not necessarily reflect the official position or policies of the U.S. Department of Justice.
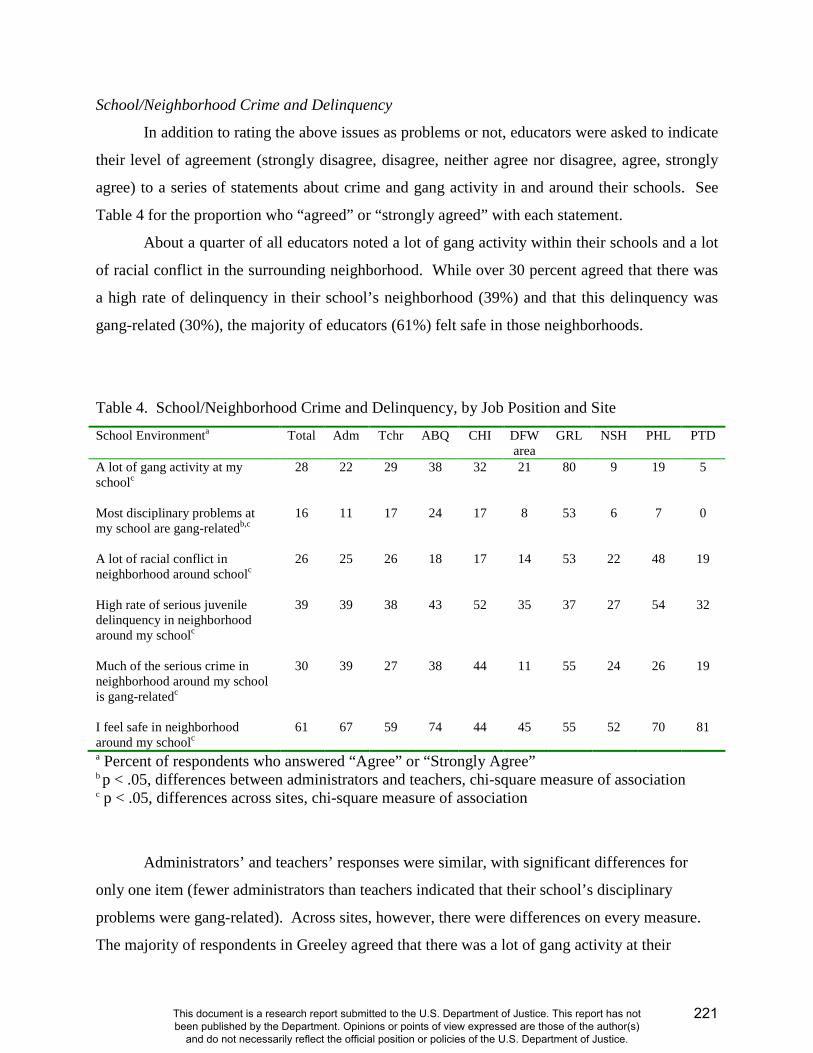
School/Neighborhood Crime and Delinquency
In addition to rating the above issues as problems or not, educators were asked to indicate
their level of agreement (strongly disagree, disagree, neither agree nor disagree, agree, strongly
agree) to a series of statements about crime and gang activity in and around their schools. See
Table 4 for the proportion who “agreed” or “strongly agreed” with each statement.
About a quarter of all educators noted a lot of gang activity within their schools and a lot
of racial conflict in the surrounding neighborhood. While over 30 percent agreed that there was
a high rate of delinquency in their school’s neighborhood (39%) and that this delinquency was
gang-related (30%), the majority of educators (61%) felt safe in those neighborhoods.
Table 4. School/Neighborhood Crime and Delinquency, by Job Position and Site
School Environmenta Total Adm Tchr ABQ CHI DFW area
GRL NSH PHL PTD
A lot of gang activity at my schoolc
28 22 29 38 32 21 80 9 19 5
Most disciplinary problems at my school are gang-relatedb,c
16 11 17 24 17 8 53 6 7 0
A lot of racial conflict in neighborhood around schoolc
26 25 26 18 17 14 53 22 48 19
High rate of serious juvenile delinquency in neighborhood around my schoolc
39 39 38 43 52 35 37 27 54 32
Much of the serious crime in neighborhood around my school is gang-relatedc
30 39 27 38 44 11 55 24 26 19
I feel safe in neighborhood around my schoolc
61 67 59 74 44 45 55 52 70 81
a Percent of respondents who answered “Agree” or “Strongly Agree” b p < .05, differences between administrators and teachers, chi-square measure of association c p < .05, differences across sites, chi-square measure of association
Administrators’ and teachers’ responses were similar, with significant differences for
only one item (fewer administrators than teachers indicated that their school’s disciplinary
problems were gang-related). Across sites, however, there were differences on every measure.
The majority of respondents in Greeley agreed that there was a lot of gang activity at their
221
This document is a research report submitted to the U.S. Department of Justice. This report has not been published by the Department. Opinions or points of view expressed are those of the author(s)
and do not necessarily reflect the official position or policies of the U.S. Department of Justice.
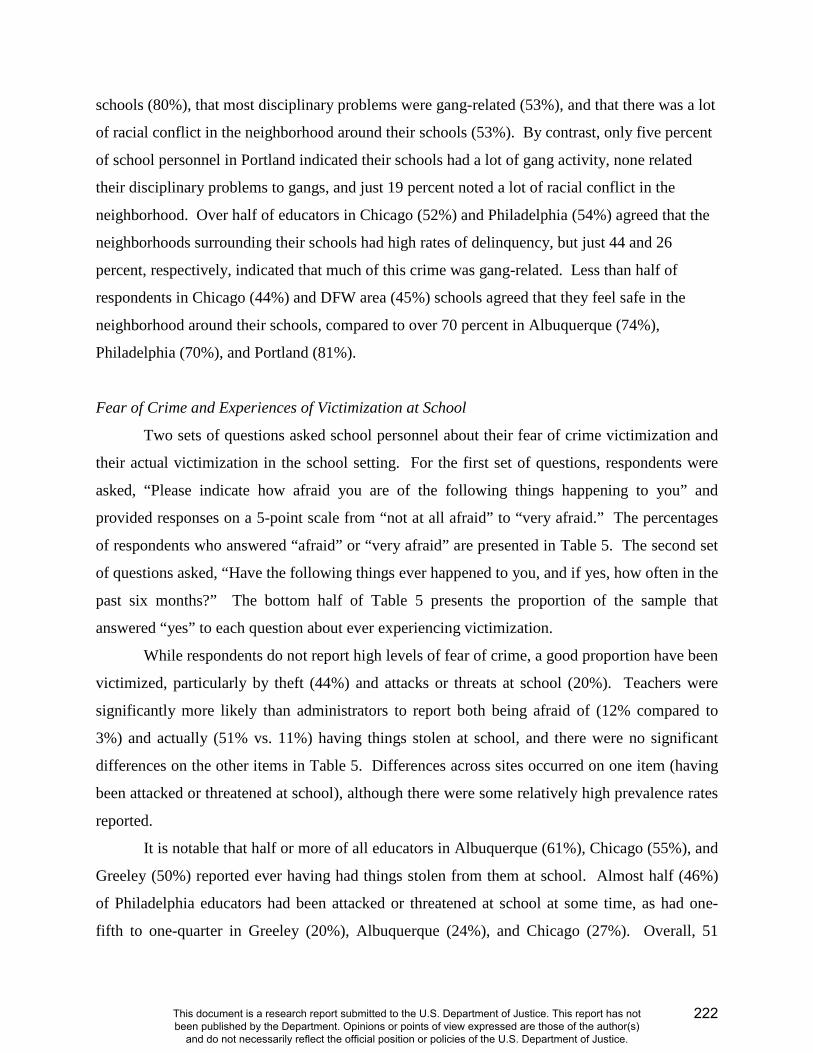
schools (80%), that most disciplinary problems were gang-related (53%), and that there was a lot
of racial conflict in the neighborhood around their schools (53%). By contrast, only five percent
of school personnel in Portland indicated their schools had a lot of gang activity, none related
their disciplinary problems to gangs, and just 19 percent noted a lot of racial conflict in the
neighborhood. Over half of educators in Chicago (52%) and Philadelphia (54%) agreed that the
neighborhoods surrounding their schools had high rates of delinquency, but just 44 and 26
percent, respectively, indicated that much of this crime was gang-related. Less than half of
respondents in Chicago (44%) and DFW area (45%) schools agreed that they feel safe in the
neighborhood around their schools, compared to over 70 percent in Albuquerque (74%),
Philadelphia (70%), and Portland (81%).
Fear of Crime and Experiences of Victimization at School
Two sets of questions asked school personnel about their fear of crime victimization and
their actual victimization in the school setting. For the first set of questions, respondents were
asked, “Please indicate how afraid you are of the following things happening to you” and
provided responses on a 5-point scale from “not at all afraid” to “very afraid.” The percentages
of respondents who answered “afraid” or “very afraid” are presented in Table 5. The second set
of questions asked, “Have the following things ever happened to you, and if yes, how often in the
past six months?” The bottom half of Table 5 presents the proportion of the sample that
answered “yes” to each question about ever experiencing victimization.
While respondents do not report high levels of fear of crime, a good proportion have been
victimized, particularly by theft (44%) and attacks or threats at school (20%). Teachers were
significantly more likely than administrators to report both being afraid of (12% compared to
3%) and actually (51% vs. 11%) having things stolen at school, and there were no significant
differences on the other items in Table 5. Differences across sites occurred on one item (having
been attacked or threatened at school), although there were some relatively high prevalence rates
reported.
It is notable that half or more of all educators in Albuquerque (61%), Chicago (55%), and
Greeley (50%) reported ever having had things stolen from them at school. Almost half (46%)
of Philadelphia educators had been attacked or threatened at school at some time, as had one-
fifth to one-quarter in Greeley (20%), Albuquerque (24%), and Chicago (27%). Overall, 51
222
This document is a research report submitted to the U.S. Department of Justice. This report has not been published by the Department. Opinions or points of view expressed are those of the author(s)
and do not necessarily reflect the official position or policies of the U.S. Department of Justice.
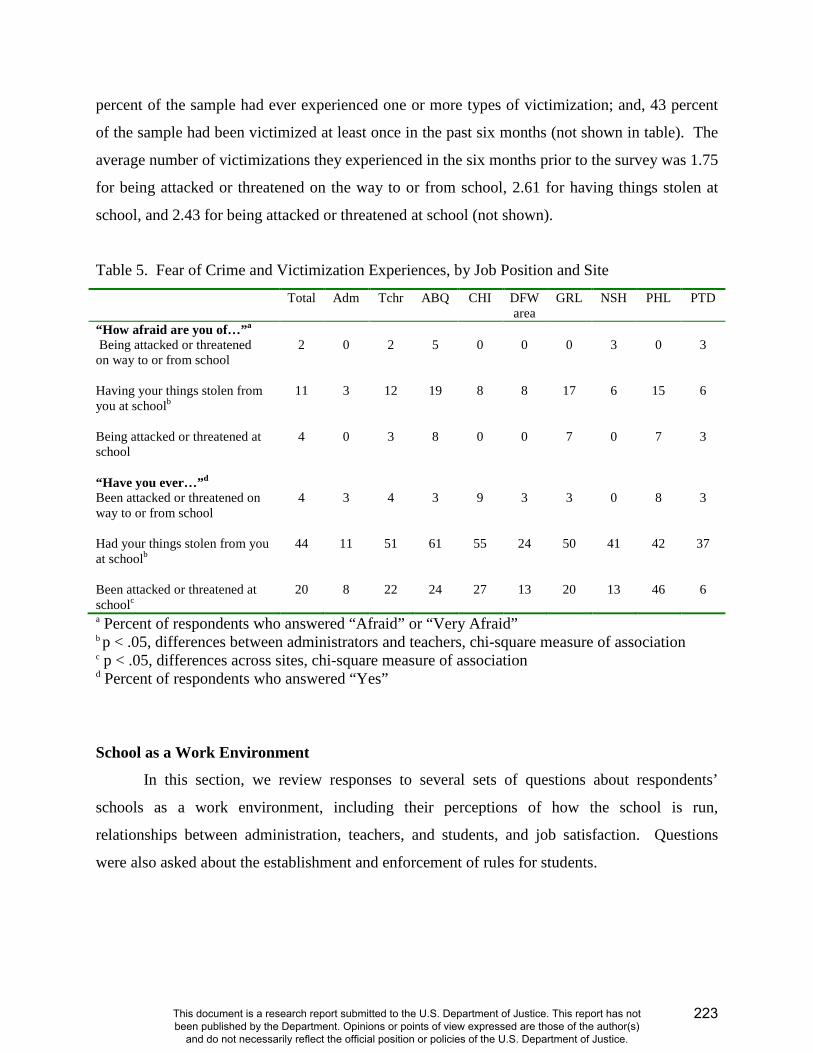
percent of the sample had ever experienced one or more types of victimization; and, 43 percent
of the sample had been victimized at least once in the past six months (not shown in table). The
average number of victimizations they experienced in the six months prior to the survey was 1.75
for being attacked or threatened on the way to or from school, 2.61 for having things stolen at
school, and 2.43 for being attacked or threatened at school (not shown).
Table 5. Fear of Crime and Victimization Experiences, by Job Position and Site
Total Adm Tchr ABQ CHI DFW area
GRL NSH PHL PTD
“How afraid are you of…”a Being attacked or threatened on way to or from school
2 0 2 5 0 0 0 3 0 3
Having your things stolen from you at schoolb
11 3 12 19 8 8 17 6 15 6
Being attacked or threatened at school
4 0 3 8 0 0 7 0 7 3
“Have you ever…”d
Been attacked or threatened on way to or from school
4 3 4 3 9 3 3 0 8 3
Had your things stolen from you at schoolb
44 11 51 61 55 24 50 41 42 37
Been attacked or threatened at schoolc
20 8 22 24 27 13 20 13 46 6
a Percent of respondents who answered “Afraid” or “Very Afraid” b p < .05, differences between administrators and teachers, chi-square measure of association c p < .05, differences across sites, chi-square measure of association d Percent of respondents who answered “Yes”
School as a Work Environment
In this section, we review responses to several sets of questions about respondents’
schools as a work environment, including their perceptions of how the school is run,
relationships between administration, teachers, and students, and job satisfaction. Questions
were also asked about the establishment and enforcement of rules for students.
223
This document is a research report submitted to the U.S. Department of Justice. This report has not been published by the Department. Opinions or points of view expressed are those of the author(s)
and do not necessarily reflect the official position or policies of the U.S. Department of Justice.
Perceptions of Work Environment
School personnel indicated their level of agreement (1 = strongly disagree; 5 = strongly
agree) with a number of statements about their work environment. Table 6 displays the
percentage who agreed or strongly agreed with each statement. Overall, two-thirds or more of
educators agreed that teachers have a say in how their schools are run (66%), that teachers are
supportive of administration (66%), that the principal gives positive reinforcement (69%), that
the respondent’s views are respected by their school administration (70%), and that the school
provides materials and equipment needed for teaching (70%); further, only 36 percent agreed
that tension exists between teachers and administrators. Only about one-quarter and one-third,
however, agreed that students have a say (24%) and that their schools have all the space they
need (31%), and 42 percent agreed that it was hard to change established procedures.
Administrators were more positive than were teachers on all items, with a greater
proportion agreeing with positively-worded statements, and a lower proportion agreeing with
negatively-worded statements. These differences were statistically significant for seven of the
10 items; there were no significant differences in levels of agreement with parents having a say
in how the school is run, with it being hard to change established procedures, or with the school
having all the space/physical arrangements needed.
Across the seven sites, few overall patterns can be discerned, but Nashville educators
were most likely to agree with parents and teachers had a say in how their schools were run and
that their views were respected by the administration; Portland educators were least likely to
agree that there was tension between teachers and administrators, and most likely to agree that
the principal praises staff and that the school has supplies and space needed; by contrast,
educators in the DFW area site were least likely to agree that students and parents have a say,
that their views are respected by administration, that teachers are supportive of administration,
and that the school has all the space needed. Statistically significant differences between sites
were found for four items in Table 6.
224
This document is a research report submitted to the U.S. Department of Justice. This report has not been published by the Department. Opinions or points of view expressed are those of the author(s)
and do not necessarily reflect the official position or policies of the U.S. Department of Justice.
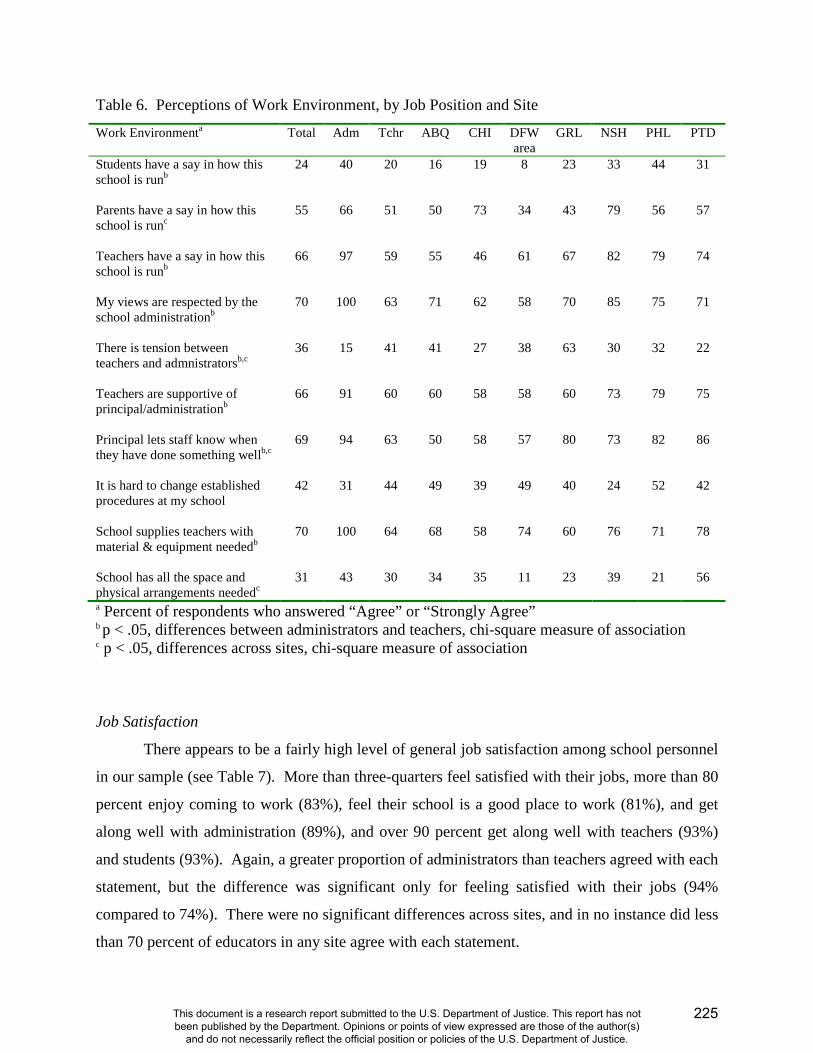
Table 6. Perceptions of Work Environment, by Job Position and Site
Work Environmenta Total Adm Tchr ABQ CHI DFW area
GRL NSH PHL PTD
Students have a say in how this school is runb
24 40 20 16 19 8 23 33 44 31
Parents have a say in how this school is runc
55 66 51 50 73 34 43 79 56 57
Teachers have a say in how this school is runb
66 97 59 55 46 61 67 82 79 74
My views are respected by the school administrationb
70 100 63 71 62 58 70 85 75 71
There is tension between teachers and admnistratorsb,c
36 15 41 41 27 38 63 30 32 22
Teachers are supportive of principal/administrationb
66 91 60 60 58 58 60 73 79 75
Principal lets staff know when they have done something wellb,c
69 94 63 50 58 57 80 73 82 86
It is hard to change established procedures at my school
42 31 44 49 39 49 40 24 52 42
School supplies teachers with material & equipment neededb
70 100 64 68 58 74 60 76 71 78
School has all the space and physical arrangements neededc
31 43 30 34 35 11 23 39 21 56
a Percent of respondents who answered “Agree” or “Strongly Agree” b p < .05, differences between administrators and teachers, chi-square measure of association c p < .05, differences across sites, chi-square measure of association
Job Satisfaction
There appears to be a fairly high level of general job satisfaction among school personnel
in our sample (see Table 7). More than three-quarters feel satisfied with their jobs, more than 80
percent enjoy coming to work (83%), feel their school is a good place to work (81%), and get
along well with administration (89%), and over 90 percent get along well with teachers (93%)
and students (93%). Again, a greater proportion of administrators than teachers agreed with each
statement, but the difference was significant only for feeling satisfied with their jobs (94%
compared to 74%). There were no significant differences across sites, and in no instance did less
than 70 percent of educators in any site agree with each statement.
225
This document is a research report submitted to the U.S. Department of Justice. This report has not been published by the Department. Opinions or points of view expressed are those of the author(s)
and do not necessarily reflect the official position or policies of the U.S. Department of Justice.
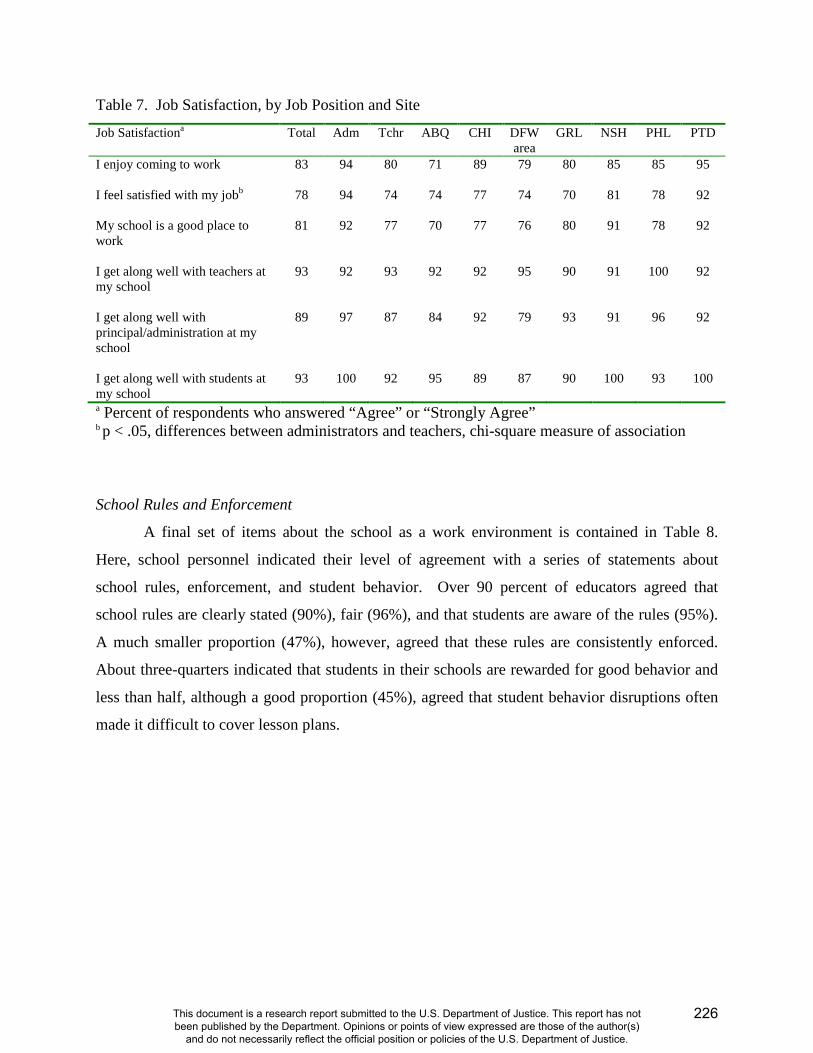
Table 7. Job Satisfaction, by Job Position and Site
Job Satisfactiona Total Adm Tchr ABQ CHI DFW area
GRL NSH PHL PTD
I enjoy coming to work
83 94 80 71 89 79 80 85 85 95
I feel satisfied with my jobb
78 94 74 74 77 74 70 81 78 92
My school is a good place to work
81 92 77 70 77 76 80 91 78 92
I get along well with teachers at my school
93 92 93 92 92 95 90 91 100 92
I get along well with principal/administration at my school
89 97 87 84 92 79 93 91 96 92
I get along well with students at my school
93 100 92 95 89 87 90 100 93 100
a Percent of respondents who answered “Agree” or “Strongly Agree” b p < .05, differences between administrators and teachers, chi-square measure of association
School Rules and Enforcement
A final set of items about the school as a work environment is contained in Table 8.
Here, school personnel indicated their level of agreement with a series of statements about
school rules, enforcement, and student behavior. Over 90 percent of educators agreed that
school rules are clearly stated (90%), fair (96%), and that students are aware of the rules (95%).
A much smaller proportion (47%), however, agreed that these rules are consistently enforced.
About three-quarters indicated that students in their schools are rewarded for good behavior and
less than half, although a good proportion (45%), agreed that student behavior disruptions often
made it difficult to cover lesson plans.
226
This document is a research report submitted to the U.S. Department of Justice. This report has not been published by the Department. Opinions or points of view expressed are those of the author(s)
and do not necessarily reflect the official position or policies of the U.S. Department of Justice.
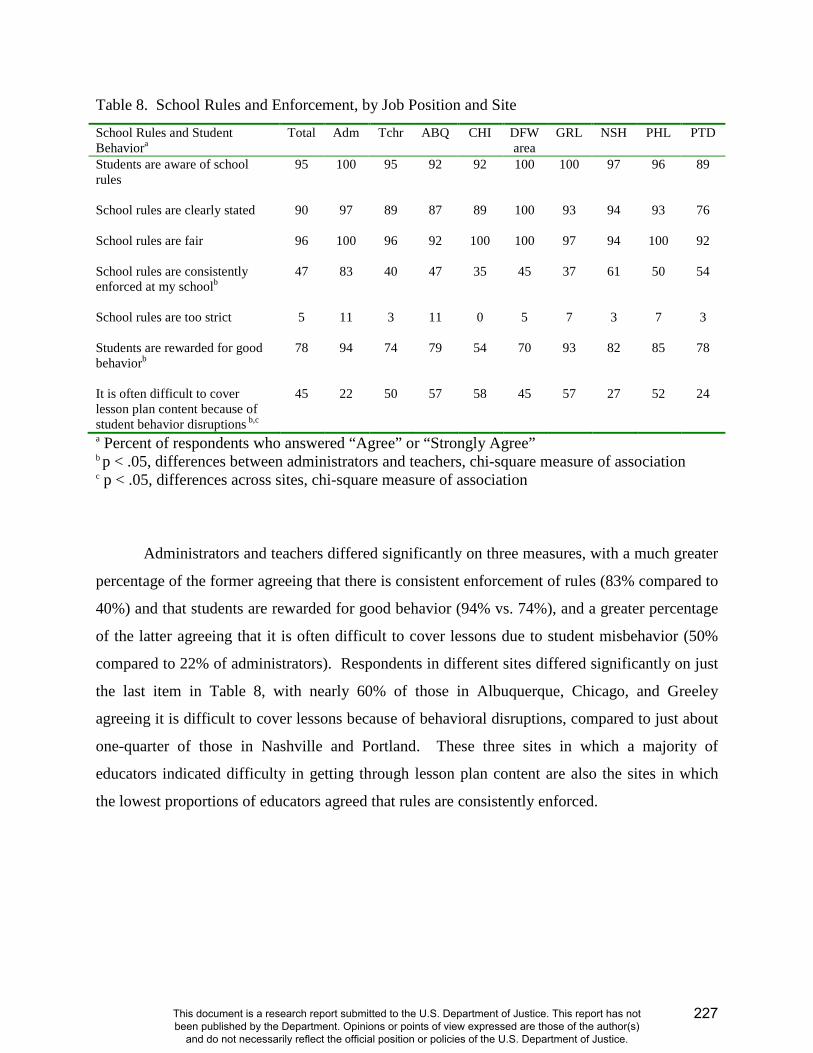
Table 8. School Rules and Enforcement, by Job Position and Site
School Rules and Student Behaviora
Total Adm Tchr ABQ CHI DFW area
GRL NSH PHL PTD
Students are aware of school rules
95 100 95 92 92 100 100 97 96 89
School rules are clearly stated
90 97 89 87 89 100 93 94 93 76
School rules are fair
96 100 96 92 100 100 97 94 100 92
School rules are consistently enforced at my schoolb
47 83 40 47 35 45 37 61 50 54
School rules are too strict
5 11 3 11 0 5 7 3 7 3
Students are rewarded for good behaviorb
78 94 74 79 54 70 93 82 85 78
It is often difficult to cover lesson plan content because of student behavior disruptions b,c
45 22 50 57 58 45 57 27 52 24
a Percent of respondents who answered “Agree” or “Strongly Agree” b p < .05, differences between administrators and teachers, chi-square measure of association c p < .05, differences across sites, chi-square measure of association
Administrators and teachers differed significantly on three measures, with a much greater
percentage of the former agreeing that there is consistent enforcement of rules (83% compared to
40%) and that students are rewarded for good behavior (94% vs. 74%), and a greater percentage
of the latter agreeing that it is often difficult to cover lessons due to student misbehavior (50%
compared to 22% of administrators). Respondents in different sites differed significantly on just
the last item in Table 8, with nearly 60% of those in Albuquerque, Chicago, and Greeley
agreeing it is difficult to cover lessons because of behavioral disruptions, compared to just about
one-quarter of those in Nashville and Portland. These three sites in which a majority of
educators indicated difficulty in getting through lesson plan content are also the sites in which
the lowest proportions of educators agreed that rules are consistently enforced.
227
This document is a research report submitted to the U.S. Department of Justice. This report has not been published by the Department. Opinions or points of view expressed are those of the author(s)
and do not necessarily reflect the official position or policies of the U.S. Department of Justice.
Opinions of Law Enforcement and Prevention Programming in Schools
Since the G.R.E.A.T. program is delivered by law enforcement officers, school personnel
views of law enforcement officers in schools, in general, were assessed. Similarly, educators
were queried about their attitudes about the role of schools in prevention of delinquency and
about prevention program content and delivery. Attitudes about school-based prevention in
general may be related to views of the G.R.E.A.T. program in particular (assessed in a later
section).
Law Enforcement Officers in Schools
School personnel were generally positive about the role of law enforcement officers in
schools (see Table 9), with the majority feeling safer when police officers were in their schools
(65%), agreeing that having officers in schools improves students’ perceptions of law
enforcement (74%), supporting law enforcement in schools (91%), and believing that police play
an important role in prevention (80%). There was less agreement that having police officers in
schools has reduced problems of delinquency and violence (41%) or that police officers make
good teachers3 (55%). Further, less than 40% of school personnel agreed that police often
respond to their schools for delinquency or gang-related violence. Finally, the proportion of
respondents who indicated that their schools had a School Resource Officer (SRO) assigned
from the city or county law enforcement agency is shown in the last row of Table 9, with 74
percent overall responding “yes.” This ranged, however, from 29 and 41 percent in Philadelphia
and Chicago, respectively, to 100 percent in both the DFW area and Nashville schools.
Additional analyses (not shown) indicated that attitudes about law enforcement in schools were
related to whether the respondent’s school had an assigned SRO: those who reported their
schools had a SRO had a statistically significantly higher mean on a scale of attitudes about
police (created by summing responses to all items except the last in Table 9) than did those
whose schools did not have a SRO. That is, those whose schools had an SRO had more positive
views of law enforcement officers in schools.
3 A large proportion (36%), however, selected “neither agree nor disagree,” perhaps indicating that many did not feel they could adequately answer this question; many may not have had the opportunity, for example, to observe an officer in a teaching role.
228
This document is a research report submitted to the U.S. Department of Justice. This report has not been published by the Department. Opinions or points of view expressed are those of the author(s)
and do not necessarily reflect the official position or policies of the U.S. Department of Justice.
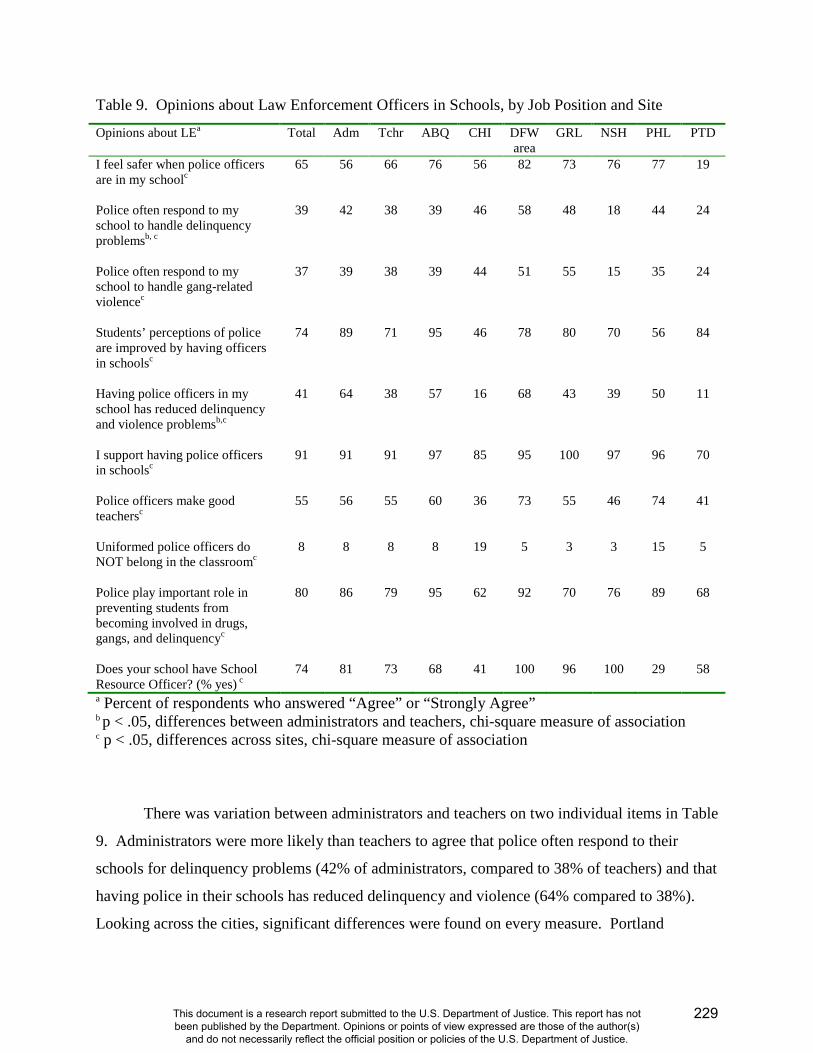
Table 9. Opinions about Law Enforcement Officers in Schools, by Job Position and Site
Opinions about LEa Total Adm Tchr ABQ CHI DFW area
GRL NSH PHL PTD
I feel safer when police officers are in my schoolc
65 56 66 76 56 82 73 76 77 19
Police often respond to my school to handle delinquency problemsb, c
39 42 38 39 46 58 48 18 44 24
Police often respond to my school to handle gang-related violencec
37 39 38 39 44 51 55 15 35 24
Students’ perceptions of police are improved by having officers in schoolsc
74 89 71 95 46 78 80 70 56 84
Having police officers in my school has reduced delinquency and violence problemsb,c
41 64 38 57 16 68 43 39 50 11
I support having police officers in schoolsc
91 91 91 97 85 95 100 97 96 70
Police officers make good teachersc
55 56 55 60 36 73 55 46 74 41
Uniformed police officers do NOT belong in the classroomc
8 8 8 8 19 5 3 3 15 5
Police play important role in preventing students from becoming involved in drugs, gangs, and delinquencyc
80 86 79 95 62 92 70 76 89 68
Does your school have School Resource Officer? (% yes) c
74 81 73 68 41 100 96 100 29 58
a Percent of respondents who answered “Agree” or “Strongly Agree” b p < .05, differences between administrators and teachers, chi-square measure of association c p < .05, differences across sites, chi-square measure of association
There was variation between administrators and teachers on two individual items in Table
9. Administrators were more likely than teachers to agree that police often respond to their
schools for delinquency problems (42% of administrators, compared to 38% of teachers) and that
having police in their schools has reduced delinquency and violence (64% compared to 38%).
Looking across the cities, significant differences were found on every measure. Portland
229
This document is a research report submitted to the U.S. Department of Justice. This report has not been published by the Department. Opinions or points of view expressed are those of the author(s)
and do not necessarily reflect the official position or policies of the U.S. Department of Justice.

educators were least likely to agree they feel safer with police in schools (19%, although 51%
responded “neither agree nor disagree”), to agree that having officers in schools has reduced
delinquency and violence (11%), to support having police officers in schools (70%), to believe
that police make good teachers (41%), and to agree that police play an important prevention role
(68%). By contrast, educators in the DFW area site were most likely to agree that they feel safe
with police in schools (82%), that officers have reduced delinquency/violence problems (68%),
that police make good teachers (73%), and that police play an important prevention role (92%).
Prevention Programs in Schools
School personnel were also generally positive about school-based prevention programs
(see Table 10). Most agreed that such programs can deter youth from drugs, delinquency, and
gang involvement (80%) and that it is part of a school’s responsibility to prevent students from
becoming involved in these behaviors (81%). Few agreed that schools should focus on “the
basics” rather than prevention (8%), that such programs are disruptive to teaching of the required
curriculum (10%), or that there are too many prevention programs in their schools (3%). Sixty-
four percent even indicated that they would like to see more prevention programs in their
schools. Just 56 percent, however, went so far as to agree that teachers should incorporate
prevention program lessons into their own curricula.
Differences between administrators and teachers reached statistical significance on one
measure: a greater proportion of administrators (12%) than teachers (7%) agreed that schools
should focus on the basics. Administrators were also more likely (74%) than teachers (51%) to
believe that teachers should incorporate prevention program lessons, but this difference was not
statistically significant. One site difference was statistically significant; the proportion of
educators who agreed that they would like to see more prevention programs in their schools
ranged from a low of 42 percent in Portland to a high of 89 percent in Philadelphia.
230
This document is a research report submitted to the U.S. Department of Justice. This report has not been published by the Department. Opinions or points of view expressed are those of the author(s)
and do not necessarily reflect the official position or policies of the U.S. Department of Justice.
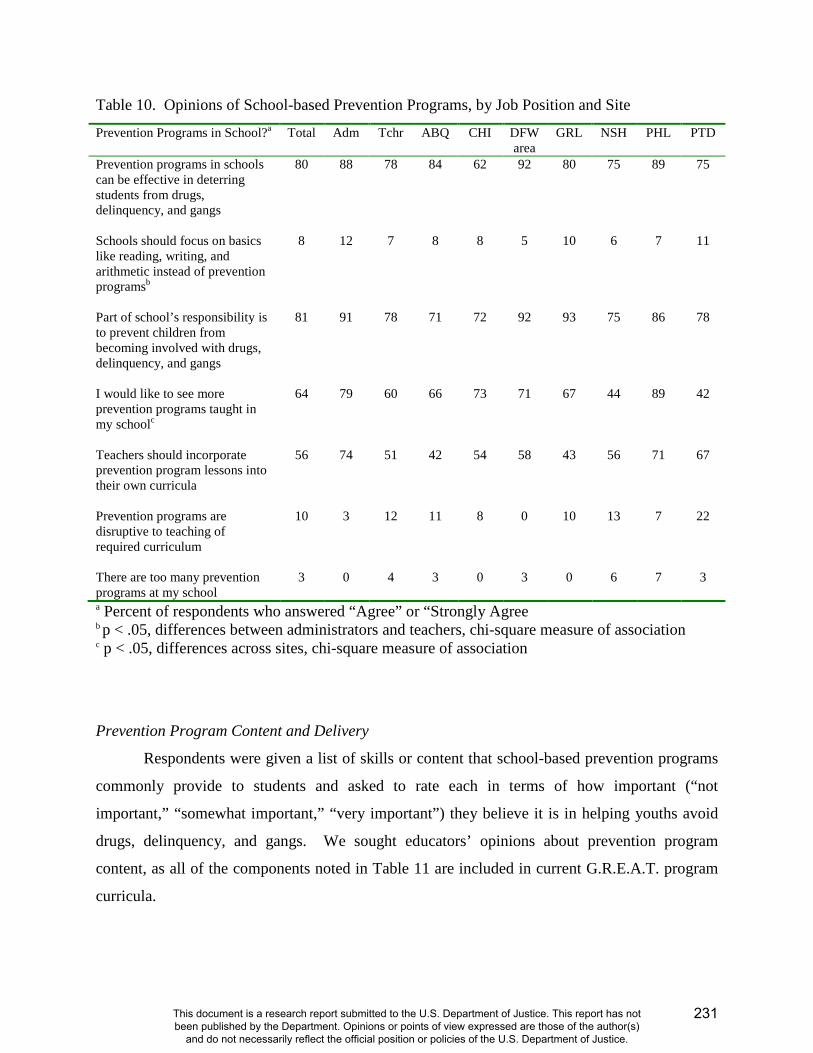
Table 10. Opinions of School-based Prevention Programs, by Job Position and Site
Prevention Programs in School?a Total Adm Tchr ABQ CHI DFW area
GRL NSH PHL PTD
Prevention programs in schools can be effective in deterring students from drugs, delinquency, and gangs
80 88 78 84 62 92 80 75 89 75
Schools should focus on basics like reading, writing, and arithmetic instead of prevention programsb
8 12 7 8 8 5 10 6 7 11
Part of school’s responsibility is to prevent children from becoming involved with drugs, delinquency, and gangs
81 91 78 71 72 92 93 75 86 78
I would like to see more prevention programs taught in my schoolc
64 79 60 66 73 71 67 44 89 42
Teachers should incorporate prevention program lessons into their own curricula
56 74 51 42 54 58 43 56 71 67
Prevention programs are disruptive to teaching of required curriculum
10 3 12 11 8 0 10 13 7 22
There are too many prevention programs at my school
3 0 4 3 0 3 0 6 7 3
a Percent of respondents who answered “Agree” or “Strongly Agree b p < .05, differences between administrators and teachers, chi-square measure of association c p < .05, differences across sites, chi-square measure of association
Prevention Program Content and Delivery
Respondents were given a list of skills or content that school-based prevention programs
commonly provide to students and asked to rate each in terms of how important (“not
important,” “somewhat important,” “very important”) they believe it is in helping youths avoid
drugs, delinquency, and gangs. We sought educators’ opinions about prevention program
content, as all of the components noted in Table 11 are included in current G.R.E.A.T. program
curricula.
231
This document is a research report submitted to the U.S. Department of Justice. This report has not been published by the Department. Opinions or points of view expressed are those of the author(s)
and do not necessarily reflect the official position or policies of the U.S. Department of Justice.
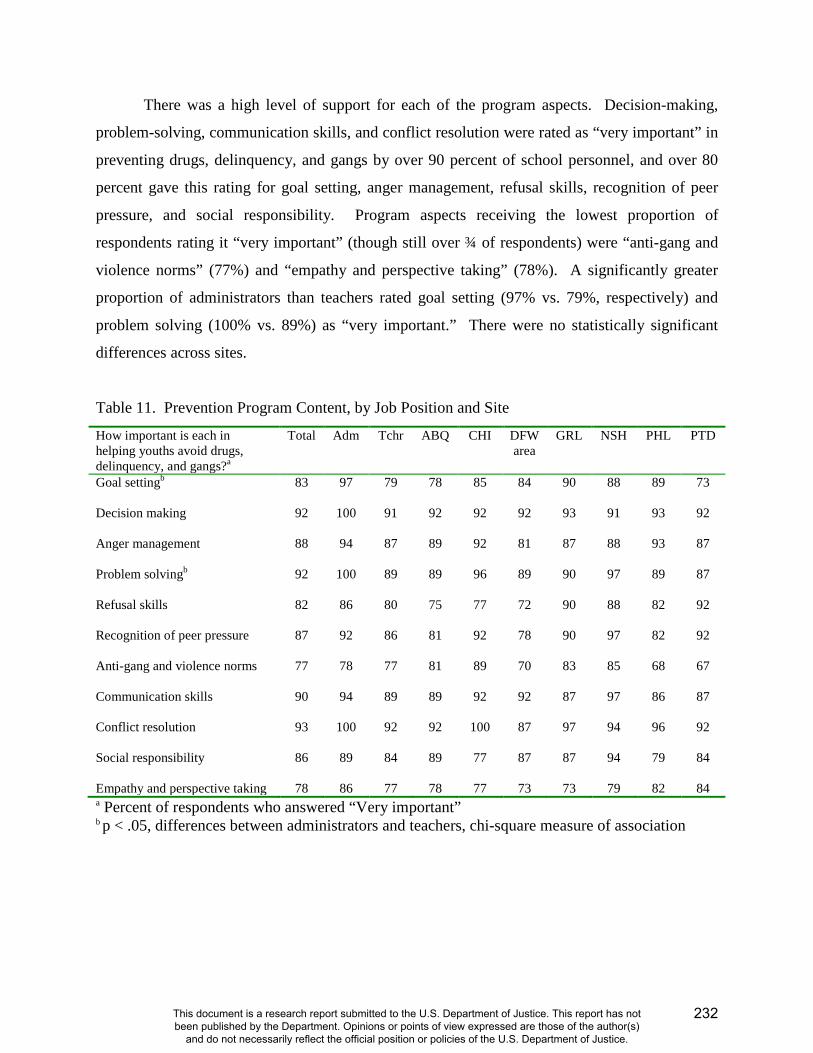
There was a high level of support for each of the program aspects. Decision-making,
problem-solving, communication skills, and conflict resolution were rated as “very important” in
preventing drugs, delinquency, and gangs by over 90 percent of school personnel, and over 80
percent gave this rating for goal setting, anger management, refusal skills, recognition of peer
pressure, and social responsibility. Program aspects receiving the lowest proportion of
respondents rating it “very important” (though still over ¾ of respondents) were “anti-gang and
violence norms” (77%) and “empathy and perspective taking” (78%). A significantly greater
proportion of administrators than teachers rated goal setting (97% vs. 79%, respectively) and
problem solving (100% vs. 89%) as “very important.” There were no statistically significant
differences across sites.
Table 11. Prevention Program Content, by Job Position and Site
How important is each in helping youths avoid drugs, delinquency, and gangs?a
Total Adm Tchr ABQ CHI DFW area
GRL NSH PHL PTD
Goal settingb
83 97 79 78 85 84 90 88 89 73
Decision making
92 100 91 92 92 92 93 91 93 92
Anger management
88 94 87 89 92 81 87 88 93 87
Problem solvingb
92 100 89 89 96 89 90 97 89 87
Refusal skills
82 86 80 75 77 72 90 88 82 92
Recognition of peer pressure
87 92 86 81 92 78 90 97 82 92
Anti-gang and violence norms
77 78 77 81 89 70 83 85 68 67
Communication skills
90 94 89 89 92 92 87 97 86 87
Conflict resolution
93 100 92 92 100 87 97 94 96 92
Social responsibility
86 89 84 89 77 87 87 94 79 84
Empathy and perspective taking 78 86 77 78 77 73 73 79 82 84 a Percent of respondents who answered “Very important” b p < .05, differences between administrators and teachers, chi-square measure of association
232
This document is a research report submitted to the U.S. Department of Justice. This report has not been published by the Department. Opinions or points of view expressed are those of the author(s)
and do not necessarily reflect the official position or policies of the U.S. Department of Justice.
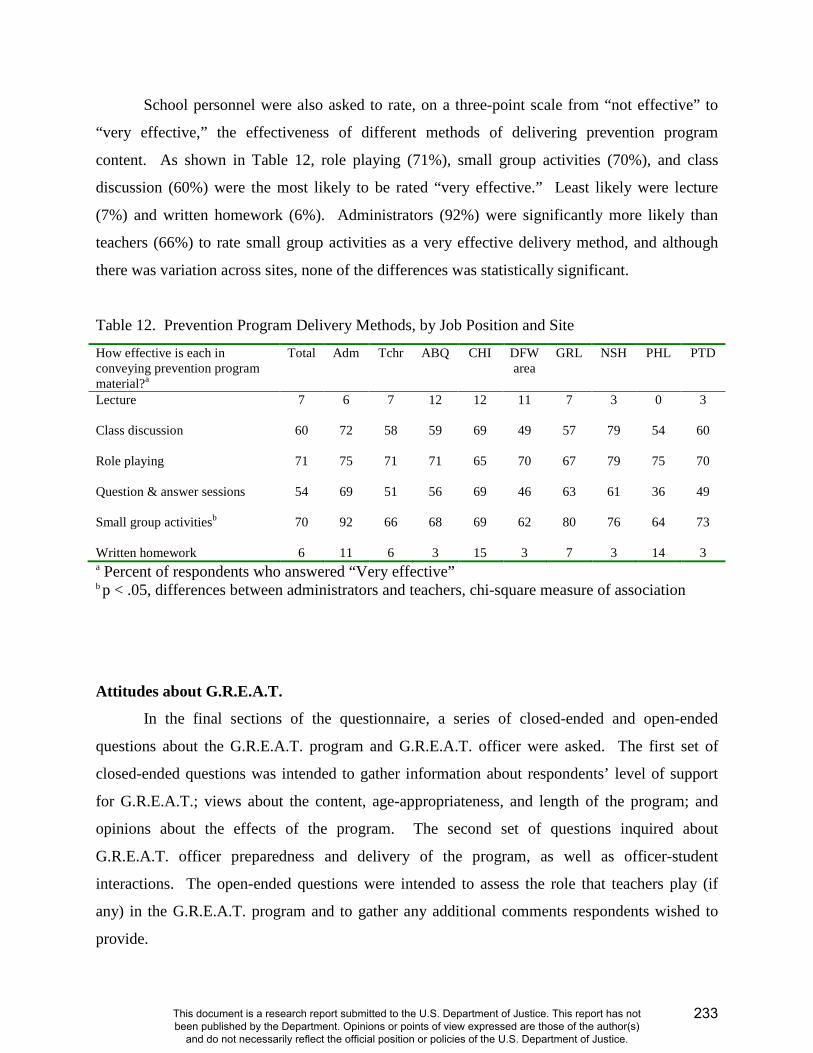
School personnel were also asked to rate, on a three-point scale from “not effective” to
“very effective,” the effectiveness of different methods of delivering prevention program
content. As shown in Table 12, role playing (71%), small group activities (70%), and class
discussion (60%) were the most likely to be rated “very effective.” Least likely were lecture
(7%) and written homework (6%). Administrators (92%) were significantly more likely than
teachers (66%) to rate small group activities as a very effective delivery method, and although
there was variation across sites, none of the differences was statistically significant.
Table 12. Prevention Program Delivery Methods, by Job Position and Site
How effective is each in conveying prevention program material?a
Total Adm Tchr ABQ CHI DFW area
GRL NSH PHL PTD
Lecture
7 6 7 12 12 11 7 3 0 3
Class discussion
60 72 58 59 69 49 57 79 54 60
Role playing
71 75 71 71 65 70 67 79 75 70
Question & answer sessions
54 69 51 56 69 46 63 61 36 49
Small group activitiesb
70 92 66 68 69 62 80 76 64 73
Written homework 6 11 6 3 15 3 7 3 14 3 a Percent of respondents who answered “Very effective” b p < .05, differences between administrators and teachers, chi-square measure of association
Attitudes about G.R.E.A.T.
In the final sections of the questionnaire, a series of closed-ended and open-ended
questions about the G.R.E.A.T. program and G.R.E.A.T. officer were asked. The first set of
closed-ended questions was intended to gather information about respondents’ level of support
for G.R.E.A.T.; views about the content, age-appropriateness, and length of the program; and
opinions about the effects of the program. The second set of questions inquired about
G.R.E.A.T. officer preparedness and delivery of the program, as well as officer-student
interactions. The open-ended questions were intended to assess the role that teachers play (if
any) in the G.R.E.A.T. program and to gather any additional comments respondents wished to
provide.
233
This document is a research report submitted to the U.S. Department of Justice. This report has not been published by the Department. Opinions or points of view expressed are those of the author(s)
and do not necessarily reflect the official position or policies of the U.S. Department of Justice.
Opinions about the G.R.E.A.T. Program
Toward the end of the questionnaire, respondents were asked, “Are you familiar with the
G.R.E.A.T. program?” Those who answered “no” were instructed to skip the two sections of
questions regarding the G.R.E.A.T. program and the G.R.E.A.T. officer. Most of the participants
(186 or 82% of the sample) answered that they were familiar with the program; this includes 92
percent of administrators and 79 percent of teachers. Familiarity with G.R.E.A.T. across the
seven sites ranged from 74 percent (Albuquerque and DFW area) to 93 percent (Greeley and
Philadelphia).
School personnel as a whole responded positively about the G.R.E.A.T. program (see
Table 13). Nearly 90 percent, for example, are in favor of having the program in their schools.
In regard to specific statements about program materials and length, 90 percent feel that the
curriculum is appropriate for students’ age and comprehension levels, but fewer agreed that
G.R.E.A.T. program materials are appealing to students (77%), that the length of the G.R.E.A.T.
curriculum (45-60 minutes a week for 13 weeks) provides enough time to cover the important,
relevant topics (63%), or that officers teaching the G.R.E.A.T. program have enough time during
the class period to sufficiently cover the educational materials for each lesson (62%).
School personnel were also asked their opinions about the effects of the G.R.E.A.T.
program, and there was a good deal of agreement that G.R.E.A.T. reaches many of its goals.
Over 80 percent agreed that G.R.E.A.T. teaches students the skills they need to avoid gangs and
violence (82%), that G.R.E.A.T. improves students’ perceptions of the police (85%), and that
G.R.E.A.T. addresses problems facing students in their schools (86%). Interestingly, however,
only about half agreed it played a significant role in reducing youth gang participation in their
schools (54%) and communities (47%).
Administrators and teachers differed significantly on four items, with a greater
percentage of administrators agreeing that G.R.E.A.T. addressed problems of students in their
schools, that G.R.E.A.T. reduces youth gang participation in their communities, that the
program was of sufficient length, and that there was sufficient class time for G.R.E.A.T. There
was only one significant difference across sites: just 39 and 41 percent of school personnel in
Nashville and Portland, respectively, agreed that G.R.E.A.T. reduces gang participation in their
234
This document is a research report submitted to the U.S. Department of Justice. This report has not been published by the Department. Opinions or points of view expressed are those of the author(s)
and do not necessarily reflect the official position or policies of the U.S. Department of Justice.
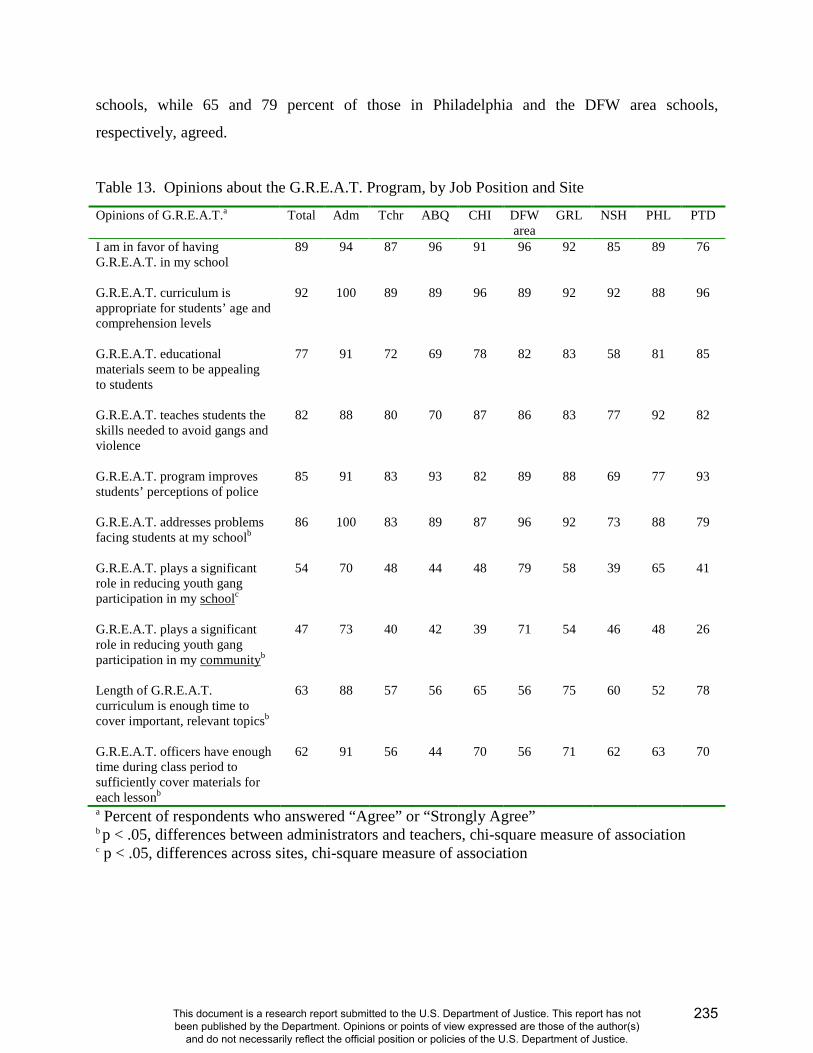
schools, while 65 and 79 percent of those in Philadelphia and the DFW area schools,
respectively, agreed.
Table 13. Opinions about the G.R.E.A.T. Program, by Job Position and Site
Opinions of G.R.E.A.T.a Total Adm Tchr ABQ CHI DFW area
GRL NSH PHL PTD
I am in favor of having G.R.E.A.T. in my school
89 94 87 96 91 96 92 85 89 76
G.R.E.A.T. curriculum is appropriate for students’ age and comprehension levels
92 100 89 89 96 89 92 92 88 96
G.R.E.A.T. educational materials seem to be appealing to students
77 91 72 69 78 82 83 58 81 85
G.R.E.A.T. teaches students the skills needed to avoid gangs and violence
82 88 80 70 87 86 83 77 92 82
G.R.E.A.T. program improves students’ perceptions of police
85 91 83 93 82 89 88 69 77 93
G.R.E.A.T. addresses problems facing students at my schoolb
86 100 83 89 87 96 92 73 88 79
G.R.E.A.T. plays a significant role in reducing youth gang participation in my schoolc
54 70 48 44 48 79 58 39 65 41
G.R.E.A.T. plays a significant role in reducing youth gang participation in my communityb
47 73 40 42 39 71 54 46 48 26
Length of G.R.E.A.T. curriculum is enough time to cover important, relevant topicsb
63 88 57 56 65 56 75 60 52 78
G.R.E.A.T. officers have enough time during class period to sufficiently cover materials for each lessonb
62 91 56 44 70 56 71 62 63 70
a Percent of respondents who answered “Agree” or “Strongly Agree” b p < .05, differences between administrators and teachers, chi-square measure of association c p < .05, differences across sites, chi-square measure of association
235
This document is a research report submitted to the U.S. Department of Justice. This report has not been published by the Department. Opinions or points of view expressed are those of the author(s)
and do not necessarily reflect the official position or policies of the U.S. Department of Justice.

Open-ended Comments about the G.R.E.A.T. Program
Each respondent who reported that G.R.E.A.T. had been taught in her/his classroom
(n=96) was asked to answer a series of five open-ended questions about their involvement with
the G.R.E.A.T. program; 78 respondents provided comments on at least one of the five
questions. The last of these questions (the remainder are discussed in another section) asked,
“Do you have any additional comments you would like to make about the G.R.E.A.T. program?”
Fifty educators (52% of the 96 who had had G.R.E.A.T. in their classrooms or 64% of the 78
who answered the open-ended questions) offered comments. Most of the responses (n=35 or
70% of those who answered this question) were in regard to the program itself, although 24 also
offered specific comments about the G.R.E.A.T. officer, which will be discussed in a later
section.
Of the 35 program-related comments, the overwhelming majority (n=29 or 83%) were
positive in nature, four were negative, and an additional two can be considered neutral.
Educators feel that the G.R.E.A.T. program is, among other things, “wonderful,” “amazing,”
“engaging,” and, of course, “great.” They also indicated that they see changes in their students,
asserting that “students seem more mature, confident, and happy after attending the program,”
“…more empathy for others has developed,” and that the program “actually brought a lot of
students out of their [illegible] shell.” A few recognized that the program assisted them in their
own teaching, for example, “GREAT is a very effective and valuable support to my curriculum”
and “GREAT content effectively meets state standards for health education which are not
necessarily addressed in other curricula…” In addition, a number of school personnel wrote that
they believe the program to be effective, though one respondent suggested that G.R.E.A.T.
would be more effective in grades 3-4. By contrast, a number of respondents indicated a desire
for the program to continue or return to their schools, one suggested expanding the program
throughout the school year, and one even suggested extending it into high school.
The negative comments were in regard to length of the program, suggesting that students’
interest waned (“Why 13 weeks? It is way too long. The kids were done week 6.”), the fact that
prevention programming cuts into an already-crowded curriculum (“There is never enough time
to do the basics and prevention programs. We need all the help we can get!”), and apparent
inconsistency in program delivery (“Too inconsistent”). Finally, one educator wrote that, “We
need prevention programs but I do not think G.R.E.A.T. is working at this time.”
236
This document is a research report submitted to the U.S. Department of Justice. This report has not been published by the Department. Opinions or points of view expressed are those of the author(s)
and do not necessarily reflect the official position or policies of the U.S. Department of Justice.
Do Opinions of G.R.E.A.T. Differ by Context? Correlational Analyses
A series of bivariate correlations was conducted to determine what relationships, if any,
exist between the various factors examined above (Tables 3-12) and attitudes about the
G.R.E.A.T. program (Table 13). It was thought, for example, that school personnel who
perceive their schools to be facing issues of crime, disorder, or gangs might have more positive
views and be more supportive of the G.R.E.A.T. program, which is designed to address many of
these issues, than would educators in less disordered school environments. Similarly, school
personnel who have more negative, compared to more positive, views of police officers or
prevention programs in schools may have less favorable views about G.R.E.A.T., a prevention
program taught by law enforcement officers in schools.
For these analyses, scales were constructed by summing respondents’ answers to series of
individual items and obtaining the average of these responses, to get a sense of how the
respondents feel about the issue or concept overall.4 For the questions in Table 13, two scales
were created; the first represents general attitudes about the G.R.E.A.T. program and is
comprised of the first eight questions, and the second is a scale representing attitudes about the
length of the program, comprised of the last two questions in Table 13. These correlational
analyses were restricted to those who had answered “yes” to the question, “Are you familiar with
the G.R.E.A.T. program?”
Administrators and teachers differed on both the attitudes about G.R.E.A.T. and length of
G.R.E.A.T. scales, with administrators having higher means indicating more positive views of
the program and greater agreement that program length was sufficient. It is important to note,
though, that means were high for both groups. Attitudes about G.R.E.A.T., but not about the
length of the program, varied across sites, with DFW area, Greeley, and Philadelphia
respondents having the highest scale means. A number of factors were found to be significantly
correlated with respondents’ attitudes about G.R.E.A.T., but only one was related to perceptions
4 For all scales, the following methods were used: first, factor analyses of items contained within sets of questions (a set of questions is displayed in each table of this report) was conducted to determine whether the items measure a single underlying concept. For three sets of questions (fear of crime, school environment, and job satisfaction), the items represented one underlying concept. For the remainder, two or more factors were found, indicating that the items represented two or more subscales or concepts. Second, reliability analyses were conducted to determine how well the items in a scale measured the underlying concept. The Cronbach’s alpha reliability coefficients for all scales were .64 or higher, indicating acceptable levels for both the total scale (all items of the table) and for the identified subscales. Unless otherwise noted, the correlational analyses in this section and in the next section (about the G.R.E.A.T. officer) were conducted with the total scales, as findings (magnitude and direction of relationship) did not differ by using the subscales.
237
This document is a research report submitted to the U.S. Department of Justice. This report has not been published by the Department. Opinions or points of view expressed are those of the author(s)
and do not necessarily reflect the official position or policies of the U.S. Department of Justice.
about the length of the program. Opinions about whether the length of the G.R.E.A.T.
curriculum is appropriate and whether there is enough time during the class period to cover the
lessons were associated only with positive views of prevention programs in schools. The
following factors were related to more positive attitudes about G.R.E.A.T.: greater fear of
victimization in and around school (top half of Table 5) and greater presence of school rules that
are known and enforced (Table 8) were weakly correlated (r=.16 to .22); and more positive
attitudes about law enforcement officers (Table 9) and prevention programs in schools (Table
10) were both moderately correlated (r=.44 to .55). These analyses indicate that opinions about
the G.R.E.A.T. program are most strongly tied to educators’ views of the roles of police officers
and prevention programming in schools: the more they support their presence, the greater their
support for G.R.E.A.T. (and vice versa).
A number of factors were also found not to be associated with respondents’ opinions of
G.R.E.A.T. Reports of the presence of school problems (Table 3), perceptions of crime and
disorder in their school environment (Table 4), perceptions of their work environment (Table 6),
and level of job satisfaction (Table 7) were not related to educators’ attitudes about G.R.E.A.T.
In addition, there were no significant differences in attitudes about G.R.E.AT. between
respondents who reported ever having been victimized (bottom of Table 5) and those who had
not or between respondents who reported SROs in their schools and those who did not. These
findings mean that school personnel who describe many issues as “big problems” in their
schools, who perceive their schools as having issues with violence and gangs, who perceive their
work environment negatively, who are dissatisfied with their jobs, or who have been victims of
crime in or around their schools are not more or less likely than others to have positive (or
negative) views about the G.R.E.A.T. program.
Opinions about the G.R.E.A.T. Officer
Respondents were also asked whether the G.R.E.A.T. program had ever been taught in
their classrooms. Because the subsequent set of questions inquired specifically about the
G.R.E.A.T. officers, respondents who had never had the program taught in their classrooms (and,
thus, would not have had the experience to adequately answer the questions) were asked to skip
to the final section of the survey. Most of the respondents answered that the program had not
238
This document is a research report submitted to the U.S. Department of Justice. This report has not been published by the Department. Opinions or points of view expressed are those of the author(s)
and do not necessarily reflect the official position or policies of the U.S. Department of Justice.
been taught in their classrooms, but a large proportion responded “yes” (n=96 representing 42%
of the sample and 52% of those who were familiar with the program); across sites, the range was
from 32 percent in the DFW area site to 76 percent in Philadelphia. This included 38 percent (n
= 12) of administrators and 55 percent (n = 78) of teachers. These respondents were asked to
think about the most recent time the program had been offered in their classroom and provide
their level of agreement with the statements contained in Table 14. Responses of only those who
reported both being familiar with the G.R.E.A.T. program and having had the program taught in
their class are included in these analyses.
There were no statistically significant differences between administrators and teachers or
across sites on any items, but a few cross-site differences of note are discussed below. In terms
of officer preparedness and delivery of G.R.E.A.T., a greater percentage of educators agreed that
the G.R.E.A.T. officer appeared adequately trained in delivering lesson content (85%) than in
teaching and classroom management (74%); this was still the large majority of the sample, but
there was variation across sites, as just 56 percent of Portland educators agreed, compared to 100
percent in the DFW area site. About a third of Portland respondents disagreed that the officer
was adequately trained in teaching and behavior management (results not shown in table). Most
respondents indicated that the officer was punctual (80%) and attended class on scheduled days
(86%). While the percentage who agreed with these statements was over 70 percent across the
sites, it is worth noting that a fairly large proportion of Portland educators responded “disagree”
or “strongly disagree” (results not shown in table): 24 percent disagreed that officers were
punctual (as did 15% in Albuquerque), and 22 percent disagreed that officers attended when
scheduled (as did 27% in Nashville and 23% in Albuquerque). Just 14 percent overall agreed
that the officer often strayed from the lesson plan, though this varied across sites from zero (in
the DFW area) to 36 percent (in Nashville, also the site in which the lowest proportion agreed
that the officer was adequately trained to deliver lesson content).
A second set of statements in Table 14 dealt with officers’ interactions in the classroom.
A little over half (56%) of respondents indicated that the G.R.E.A.T. officer incorporated them
into the teaching of the program (see related discussion in the next section). While only 14
percent overall agreed that the officer had difficulty controlling the class, this number was 22
percent in Portland (the site in which the lowest proportion agreed that the officer was
adequately trained in classroom management). Of the items in Table 14, school personnel
239
This document is a research report submitted to the U.S. Department of Justice. This report has not been published by the Department. Opinions or points of view expressed are those of the author(s)
and do not necessarily reflect the official position or policies of the U.S. Department of Justice.
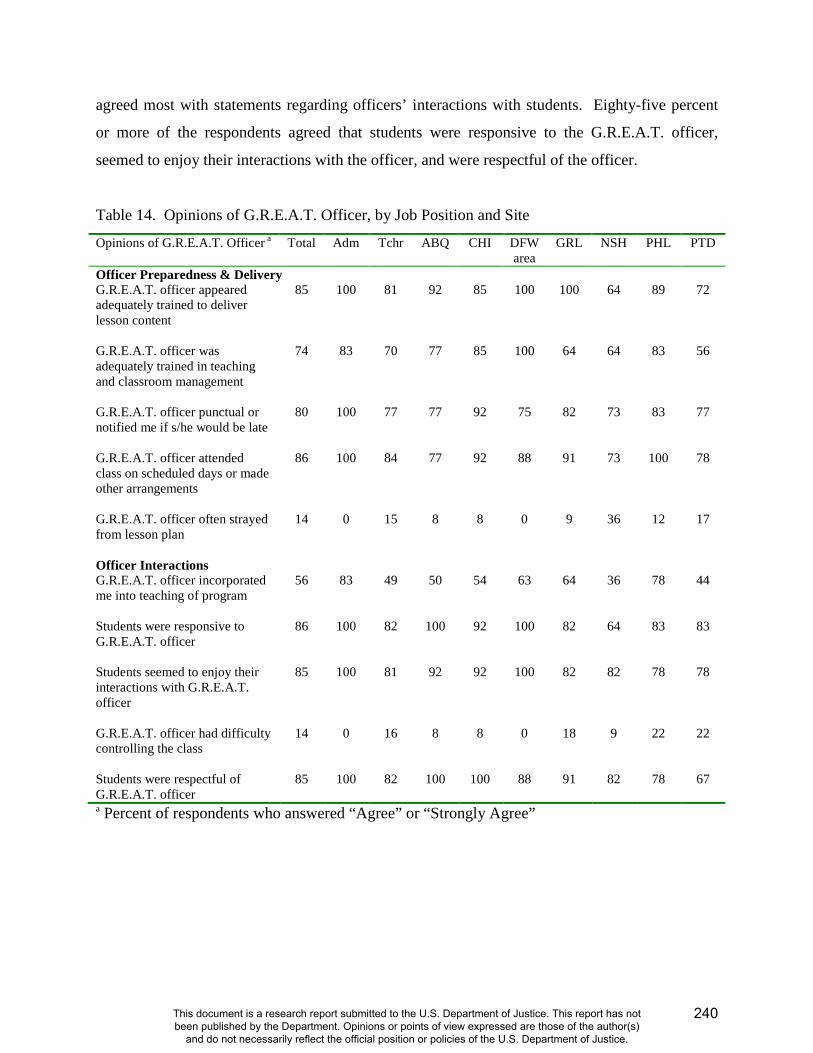
agreed most with statements regarding officers’ interactions with students. Eighty-five percent
or more of the respondents agreed that students were responsive to the G.R.E.A.T. officer,
seemed to enjoy their interactions with the officer, and were respectful of the officer.
Table 14. Opinions of G.R.E.A.T. Officer, by Job Position and Site
Opinions of G.R.E.A.T. Officer a Total Adm Tchr ABQ CHI DFW area
GRL NSH PHL PTD
Officer Preparedness & Delivery G.R.E.A.T. officer appeared adequately trained to deliver lesson content
85 100 81 92 85 100 100 64 89 72
G.R.E.A.T. officer was adequately trained in teaching and classroom management
74 83 70 77 85 100 64 64 83 56
G.R.E.A.T. officer punctual or notified me if s/he would be late
80 100 77 77 92 75 82 73 83 77
G.R.E.A.T. officer attended class on scheduled days or made other arrangements
86 100 84 77 92 88 91 73 100 78
G.R.E.A.T. officer often strayed from lesson plan
14 0 15 8 8 0 9 36 12 17
Officer Interactions G.R.E.A.T. officer incorporated me into teaching of program
56 83 49 50 54 63 64 36 78 44
Students were responsive to G.R.E.A.T. officer
86 100 82 100 92 100 82 64 83 83
Students seemed to enjoy their interactions with G.R.E.A.T. officer
85 100 81 92 92 100 82 82 78 78
G.R.E.A.T. officer had difficulty controlling the class
14 0 16 8 8 0 18 9 22 22
Students were respectful of G.R.E.A.T. officer
85 100 82 100 100 88 91 82 78 67
a Percent of respondents who answered “Agree” or “Strongly Agree”
240
This document is a research report submitted to the U.S. Department of Justice. This report has not been published by the Department. Opinions or points of view expressed are those of the author(s)
and do not necessarily reflect the official position or policies of the U.S. Department of Justice.
Open-ended Comments about the G.R.E.A.T. Officer
When asked in the open-ended comments section of the survey if they had “any
additional comments about the G.R.E.A.T. program,” many school personnel responded with
comments about the G.R.E.A.T. officer. Of the 49 who responded to the question, 24 (49%)
gave comments about the officer. Of those 24, fifteen respondents (63% of those who
commented about the officer) made positive statements about the officer, such as s/he was
“wonderful,” “helpful,” “awesome” and “a fantastic teacher.” Some school personnel also
thought that students were responsive to the officers (e.g., “We need to keep our SROs and the
GREAT program. It was very positively received by the students.”), and others commented that
the G.R.E.A.T. program helped with school- and student-police relations (“GREAT officers are
friendly and have established a good relationship with the school,” “…relationships between
students and police are so much better,” and “The kids have a chance to get to know the SRO
and they ask him questions. They are also not afraid to go to him, if they need anything.”).
Several did not have such a positive experience with their officers. Six of the 24 (25%)
who made comments about the officer had negative feedback, such as s/he rushed activities, had
difficulty with classroom management, or did not use recommended modes of teaching (e.g.,
“The officer often lectured or put the kids in group work; Did not do as many of the activities to
practice skills.”). Others indicated that the officer did not show up when scheduled (e.g., “Our
SRO often doesn’t teach on scheduled days and it really disappoints the students when he
doesn’t show up” and “Also the officer frequently cancelled class without advance notice.”).
One educator even commented that s/he “was personally offended that my kids were addressed
by the street ‘jive’,” because “inner-city kids are intelligent and capable.” This respondent went
on to write, “I want my kids to give respect and model responsibility for actions. I was not happy
when I felt the guest officer, when he tried to control them, modeled disrespect in tone and words
to them.”
An additional three respondents made comments that can be considered more neutral in
nature, and their general message was that the success of G.R.E.A.T. hinges upon the officer.
These sentiments are as follows: “A good officer is great. An unorganized or unprepared or loss
in control of class is not as good;” “The officer is key to whether the program is effective or
not;” and “I think it’s a wonderful and effective program if the appropriate officer is presenting
the material. Generally, an officer that has the ability to connect with the kids.”
241
This document is a research report submitted to the U.S. Department of Justice. This report has not been published by the Department. Opinions or points of view expressed are those of the author(s)
and do not necessarily reflect the official position or policies of the U.S. Department of Justice.
Do Opinions of G.R.E.A.T. Officer Differ by Context? Correlational Analyses
Another series of bivariate correlations was conducted to determine whether school
personnel’s perceptions of a variety of factors were related to their views about the G.R.E.A.T.
officers teaching the program. For these analyses, two scales about the G.R.E.A.T. officer were
constructed from the items contained in Table 14. The first, which can be conceived of as
representing issues related to G.R.E.A.T. officer training and delivery of the program, was
created by summing responses to the first five items in the table; the second, which represents
officers’ interactions with students and teachers in the classroom, is comprised of the second five
items of Table 14. The responses of only those who answered that they were both familiar with
the G.R.E.A.T. program and had had the program taught in their classrooms were included in
these analyses.
There were no differences between administrators and teachers or between cities on
either of the scales relating to the G.R.E.A.T. officer. Only two “contextual factors” were
correlated with views about the G.R.E.A.T. officer. Having more positive views of prevention
programs in schools was weakly correlated (r=.27) with more positive views of G.R.E.A.T.
officer interactions in the classroom, but was not related to views of how well the G.R.E.A.T.
officer was trained or delivered the program. In addition, the more favorable the respondents’
attitudes toward law enforcement in schools, the more positive their attitudes about both
G.R.E.A.T. officer training/delivery (r=.43) and G.R.E.A.T. officer interactions (r=.39), though
having an SRO assigned to the school was not related. These correlations also mean that
respondents who have more positive views about the G.R.E.A.T. officer have more positive
views of prevention programs and law enforcement officers in schools. Finally, the relationship
between respondents’ views of the G.R.E.A.T. officer and their opinions about the program are
also supported in correlational analyses, which demonstrate a significant and moderate
correlation (r=.61) between both officer preparedness and officer interactions and attitudes about
G.R.E.A.T.
242
This document is a research report submitted to the U.S. Department of Justice. This report has not been published by the Department. Opinions or points of view expressed are those of the author(s)
and do not necessarily reflect the official position or policies of the U.S. Department of Justice.
Role of Educators in the G.R.E.A.T. Program
Finally, a series of open-ended questions asked about the role of educators in the
G.R.E.A.T. program and the extent to which educators incorporated G.R.E.A.T. into their own
teaching.5 The first of these questions was “When G.R.E.A.T. was delivered in your classroom,
what role, if any, did you play in the program?” A number of educators (n= 12 or 16% of the 77
who responded to the question) indicated that they did not play a role in the program. One
educator who did not play a role expressed a desire to be involved, writing, “I feel it should be
more of a team-teaching model.” By contrast, most educators noted at least some role. These
roles ranged from being an “observer” or “just listening” (10%) and engaging in classroom
management activities (35%) to assisting the officer (34%) and actively participating in
discussion or activities (25%). The most common role mentioned was classroom management
and discipline activities (e.g., “I helped with discipline issues,” “class control,” and “helping kids
stay on task”) as the extent of their involvement. Another frequent mention was “assisting the
officer,” which included “distributing materials…explaining and encouraging GREAT projects,”
“helping students with questions. Some clarification of workbook,” and “I assisted the officer
with grouping, passing out materials, and organizing groups,” or, more vaguely, such responses
as “assisting officer when asked.” Active participation was indicated by some, for example,
“facilitated/supported discussions,” “the officer incorporated me into role-playing skits,” and “I
assisted in discussion, discussion groups, and taught follow-up lessons in class, put info on our
class website and provided activities, reflection, and assessment activities for students each
week.”
Seventy-two school personnel provided responses to the second question, “How did you
generally use the time when G.R.E.A.T. was being delivered in your classroom?” and many
provided more than one response. A good number of educators (n=22 or 31% of those who
answered the question) used the time as an opportunity for grading or planning (though some
noted that they also listened and/or helped with classroom management), and, despite program
expectations that should have been and perhaps had been conveyed, two indicated they had left
the classroom to run errands in the school. Others listened or observed (about 42%), engaged in
5 In G.R.E.A.T. Officer Training, trainees are instructed that they should meet with teachers prior to the start of the program, to discuss the program and expectations of the teacher. Such expectations include the teacher being present in the classroom when the curriculum is being taught, assisting with classroom management, etc. In addition, trainees are encouraged/instructed to give the teachers a set of extended-teaching activities that correspond to each lesson, to use outside of G.R.E.A.T. instruction time.
243
This document is a research report submitted to the U.S. Department of Justice. This report has not been published by the Department. Opinions or points of view expressed are those of the author(s)
and do not necessarily reflect the official position or policies of the U.S. Department of Justice.
classroom management and discipline (about 31%), assisted the officer as necessary and/or
participated in some manner (about 20% each). Two wrote that they used the time as an
opportunity to plan how to incorporate G.R.E.A.T.: “worked on lessons to incorporate the
GREAT lessons into my own” and “to prepare for the enrichment activities that were provided
by the officer…”
The third open-ended question was “Did you incorporate G.R.E.A.T. lessons/content
into your own lesson plans? (If no, why not? If yes, how?)” Many (n=34 or 45% of the 75 who
answered the question) educators did not incorporate G.R.E.A.T. lesson content into their own
teaching. The primary reason was lack of time (n=16 or 49% of those who did not incorporate
G.R.E.A.T. content). Many teachers responded that with standards, mandated testing, and
preparation for these assessments, there was no time for outside activities: “massive amount of
state science standards I have to teach,” “too much to cover already!” Another group (n=10 or
30% of those who did not incorporate) of school personnel indicated that G.R.E.A.T. lesson
content was not relevant to the subject they taught. Math and science were specifically
mentioned, although one math teacher found a way to make a connection: “We had a unit in
Math that dealt with data formation and collection. We used some of the statistics presented to us
through the GREAT program.” Other responses included the following: “Yes—If appropriate to
subject. This was hard because GREAT was taught in the science class. Would social studies be
more appropriate?” “Yes—very infrequently on ad hoc basis as a result of student questions.
Correlation between GREAT material and Earth Science is tough to achieve on a regular basis.”
“No—they had very little to do with math or science.” “No—made some references to it, but
mostly GREAT is a stand-alone program. GREAT content doesn’t particularly meet the needs
of state science standards, but does effectively address health standards.”
Forty-one (55% of those responding to the question) indicated that they did cover or
reinforce G.R.E.A.T. content. Teachers of such subjects as social studies, language arts, and
health appeared to view G.R.E.A.T. content as supporting their own lesson plan content and/or
their efforts to meet standards; accordingly, they were likely to incorporate G.R.E.A.T. content
into their regular curricula:
• “I teach social studies and it fit in naturally when talking about cultures and
communicating.”
• “Reading/writing support—the use of literacy to enhance the curriculum.”
244
This document is a research report submitted to the U.S. Department of Justice. This report has not been published by the Department. Opinions or points of view expressed are those of the author(s)
and do not necessarily reflect the official position or policies of the U.S. Department of Justice.
• “I would explain the economic side of gang activities.”
• “I used topics like staying away from drugs and gangs as journal topics, my
students wrote journal like list 10 ways to avoid violence or what can we do as a
classroom to help promote peace at the school (From that journal, my students
wanted to make posters, we put the posters in the hall).”
Others mentioned that the topics or skills covered in G.R.E.A.T. naturally come up in
their teaching: “Many of the topics—responding to peer pressure, problem-solving, social
responsibility, etc.—arise during the school year.” Finally, several instructors used G.R.E.A.T.
content to address students’ behavior, for example, “Character development. I could incorporate
lessons from GREAT when students got in trouble for different things” and “I incorporated
GREAT lessons when my students had difficulties with others in the class. For example,
fighting, hitting, peer pressure from other students not only in their class but outside of class.”
Finally, respondents were asked in a fourth open-ended question, “Did you utilize any of
the extended-teacher activities included in the G.R.E.A.T. workbook? If no, why not? If yes,
which ones?” The majority of educators (n=61 or 84% of the 73 who answered this question)
responded that they did not use them, and reasons were neatly grouped into two main categories.
These key reasons were lack of knowledge of the existence of the activities and lack of time.
Twenty-one (34% of those who said no) respondents noted that they were not aware of the
activities, that the officer had not informed them. At least one person who responded this way
seemed dismayed that s/he had not known, appearing as though s/he might have used them
otherwise: “I didn’t know there were any!! :-(” Twenty-six (43% of those who said no)
responded that they did not use them because of lack of time to incorporate such activities. A
few additional reasons for not using the activities were that they were not relevant to the subject
(n=2), the “opportunity did not present itself” (n=1) and that the activities were “boring” (n=1).
Of the 12 respondents (16% of those who answered the question) who did use the
activities, none specified which of the activities they incorporated (they either simply wrote
“Yes” that they used them or also wrote that they did not recall which activities were used),
although three indicated they used them all.
245
This document is a research report submitted to the U.S. Department of Justice. This report has not been published by the Department. Opinions or points of view expressed are those of the author(s)
and do not necessarily reflect the official position or policies of the U.S. Department of Justice.
Summary and Conclusion
This report provided findings from the National Evaluation of the Gang Resistance
Education and Training (G.R.E.A.T.) program’s School Personnel Survey, conducted in Spring
and Fall 2007 (with surveys re-distributed to Greeley schools and distributed for the first time to
the two additional Chicago schools in Spring 2008). Administrators and teachers in the
G.R.E.A.T. grade levels (6th or 7th) in 31 participating schools in seven cities were asked to
provide their responses to an anonymous questionnaire; 230 (62%) completed the surveys. As
discussed throughout the report, school personnel were asked their perceptions of problems
facing their schools, crime and gangs in their schools and surrounding neighborhoods, fear of
crime and victimization experiences, their school as a work environment, law enforcement
officers and prevention programs in schools, and prevention program content and delivery. It
was thought that these opinions may be related to their views of the G.R.E.A.T. program and the
officers teaching the program; this is the focus of this summary, after a few comments about
some specific findings about law enforcement and prevention programs in schools.
Educators were generally positive about having law enforcement officers in schools.
Most respondents’ schools had a School Resource Officer (SRO), and these respondents had the
most positive attitudes about police in schools. In addition, school personnel were supportive of
prevention programs in schools and the role of schools in prevention, although only about half
agreed that teachers should incorporate prevention program lessons into their own curricula.
These findings generally bode well for the G.R.E.A.T. program. In regard to program content
and delivery, over 70 percent rated the components in Table 11 as “very important” in helping
youths avoid drugs, delinquency, and gangs, with decision-making, problem-solving, and
conflict resolution skills receiving this rating by over 90 percent. The G.R.E.A.T. curriculum
includes all of the 11 components, with an emphasis on a skills-building approach that
culminates in activities designed to allow students to practice conflict resolution. The
G.R.E.A.T. program also utilizes mostly “active teaching” methods such as small group
activities and role-playing, which were rated as “very effective” means of prevention program
delivery by 70 percent or more of respondents, as well as class discussion, rated very effective by
60 percent. The G.R.E.A.T. program is not designed to be delivered using such didactic methods
as lecture and written homework, rated as “very effective” by only six and seven percent of
school personnel.
246
This document is a research report submitted to the U.S. Department of Justice. This report has not been published by the Department. Opinions or points of view expressed are those of the author(s)
and do not necessarily reflect the official position or policies of the U.S. Department of Justice.
School personnel who were familiar with G.R.E.A.T. had positive views of the program,
with about 90 percent in favor of having the program in their schools. Most believed the
program materials to be appropriate and appealing, though fewer agreed that the length of the
curriculum or the class time allotted were enough to cover the topics and materials. The majority
of educators believed the program taught skills necessary to avoid delinquency and gangs,
addressed problems faced by their students, and improved student-police relations (the latter a
key goal of G.R.E.A.T.), but only about half agreed that the program played a significant role in
reducing youth gang participation in their schools and communities. Respondents’ views about
G.R.E.A.T. were related to several attitudes elicited in the earlier sections of the survey;
specifically, greater fear of crime in and around school, greater perception of existence and
enforcement of school rules, and more positive views of law enforcement and prevention
programs in school were all related to more favorable views of G.R.E.A.T., and vice versa.
The G.R.E.A.T. officer teaching the program was also viewed favorably by the majority
of respondents, in terms of both preparation and delivery of program and their interactions in the
classroom. Despite this overall positive assessment, responses to both the closed-ended and
open-ended questions indicated that some officers struggled with classroom management or
failed to attend on scheduled days. Open-ended comments revealed that many educators
believed the success of the program to be tied to the officer, and additional analyses showed that
respondents’ views of the program were related to their views about the officer teaching the
program. Views of the G.R.E.A.T. officer were also positively related to attitudes about law
enforcement officers and prevention programs in schools.
School personnel in whose classrooms G.R.E.A.T. had been taught also provided
comments about their role in the program, and several findings are worth reiterating. Most
educators played at least some role in the program; although this was largely classroom
management activities, some assisted the officer and others actively participated. Many used the
time for grading or other paperwork. Almost half (45%) did not incorporate G.R.E.A.T. lesson
content into their own curricula, mostly due to lack of time (a large concern was the amount of
material to cover for mandated testing), but also because it was not relevant to their subject. The
other 55 percent, especially those in relevant courses such as social studies, language arts, and
health, did cover or reinforce G.R.E.A.T. content. Most (84%) did not use extended teacher
247
This document is a research report submitted to the U.S. Department of Justice. This report has not been published by the Department. Opinions or points of view expressed are those of the author(s)
and do not necessarily reflect the official position or policies of the U.S. Department of Justice.
activities associated with G.R.E.A.T. lessons, often due to lack of time, but almost as often
because they had not been made aware of the activities by the G.R.E.A.T. officer.
We close this report with a number of recommendations that can be drawn from these
findings from school personnel. Although educators were very positive overall about the
G.R.E.A.T. program and officers, the findings suggest a number of steps that can be taken to
potentially improve school personnel attitudes even more and make the experience of the
G.R.E.A.T. program in schools even better.
1) The length of the curriculum and of each lesson may need to be revisited. Just over 60
percent of respondents agreed that the length of the curriculum is enough to cover
important topics and that officers have enough time during the class period to cover each
lesson (almost 40% indicated that the program was not long enough and that officers did
not have adequate time for each lesson). It may be difficult to increase the length of the
curriculum: at 13 weeks, officers already have a challenge to complete the program in a
semester (if that is their goal), taking into account assemblies, field trips, mandated
testing, snow days, and other disruptions to the schedule. And, while class periods
cannot necessarily be lengthened, our observations of G.R.E.A.T. Officer Trainings
(GOTs) indicate a possible resolution: in trainings, lessons are modeled in a 50-60 minute
time frame, while the average class time available is about 35 minutes (see Taylor,
Esbensen, and Peterson 2009). In our report on GOT observations, we recommend that
lessons be modeled and that officers practice modeling lessons in a shorter time frame
that more realistically represents what officers will face when implementing the program
in schools.
2) Officers should be encouraged in the GOTs to ensure they distribute the extended teacher
activities to their classroom teachers, discuss their importance in reinforcing the program
lessons, and remind teachers of the activities throughout the course of program delivery.
Our observations of GOTs found variation in the extent to which these activities were
covered, with some trainings covering their content in detail and strongly encouraging
officers to work with teachers to implement them and other trainings covering them
briefly or giving them little attention at all (see Taylor, Esbensen, and Peterson 2009 for a
complete report of our GOT observations).
248
This document is a research report submitted to the U.S. Department of Justice. This report has not been published by the Department. Opinions or points of view expressed are those of the author(s)
and do not necessarily reflect the official position or policies of the U.S. Department of Justice.
3) In GOTs, strongly encourage officers to work with schools to offer the G.R.E.A.T.
program in subjects that have similar or related content. This will, as intended, assist
teachers in achieving mandated standards (a great concern as far as time and a limitation
to reinforcing G.R.E.A.T. in their own curricula), while also providing integration of and
continuity in G.R.E.A.T. content and skills, to better drive home the lessons and allow
students multiple opportunities for exposure and practice. Such courses include language
arts, health, and social studies. Respondents who taught subjects such as math, science,
and physical education rarely, if ever, incorporated G.R.E.A.T. content/lessons into their
own curricula or used extended teacher activities, as they viewed them as not relevant to
their subjects.
4) Although the proportion was small, a not-insignificant percentage of respondents
indicated that G.R.E.A.T. officers had difficulty controlling the class (14% overall
agreed, with a range of 0-22% across sites). Our classroom observations of program
delivery also found that some officers struggled with classroom management (see
Leugoud, Esbensen, Brick, and Taylor 2009 for a complete report of observations).
These findings may suggest that more attention to classroom management techniques in
GOT would benefit officers in the field; GOT trainers might consider encouraging
trainees to practice such techniques during their lesson modeling or in a separate activity
(so that they may focus on content and delivery during modeling).
5) GOTs should ensure that they stress the importance of punctuality, dependability, and
communication; in a few sites (Albuquerque, Nashville, and Portland), over 20 percent of
respondents disagreed that the officer was punctual or notified the teacher if s/he would
be late and that the officer attended when scheduled or made other arrangements. This
was also noted in a number of our classroom observations of program delivery. Officers
should make every effort to be on time each scheduled day or to contact the teacher to
notify her/him and re-schedule. It is also the case that teachers should be communicative
with officers; our observers noted several times when officers arrived to teach the
program and learned only then of an assembly or field trip that prohibited teaching that
day.
249
This document is a research report submitted to the U.S. Department of Justice. This report has not been published by the Department. Opinions or points of view expressed are those of the author(s)
and do not necessarily reflect the official position or policies of the U.S. Department of Justice.

In sum, there appears to be a good deal of support for both the G.R.E.A.T. program and
officers. These views are most strongly tied to views of the role of law enforcement officers and
prevention programs in schools and do not appear to be related to problems in schools such as
delinquency and gangs, to fear of crime or crime victimization, to job satisfaction or other
perceptions about school as a work environment, or to whether the respondents’ school has a
School Resource Officer. Aspects of the current educational climate, such as meeting standards
set forth in the “No Child Left Behind” act, provide challenges to delivery and reinforcement of
the G.R.E.A.T. program that can be addressed, in part, by locating the program in specific
subjects. Finally, views of G.R.E.A.T. and the G.R.E.A.T. officer are related to each other, an
important tie that provides avenues for improving even more the overall positive attitudes of
school personnel.
250
This document is a research report submitted to the U.S. Department of Justice. This report has not been published by the Department. Opinions or points of view expressed are those of the author(s)
and do not necessarily reflect the official position or policies of the U.S. Department of Justice.
References and Resources
Leugoud, Krystle M., Finn-Aage Esbensen, Bradley T. Brick, and Terrance J. Taylor. 2009. National Evaluation of the Gang Resistance Education and Training (G.R.E.A.T.) Program: Observing the Implementer: Description of Findings, Recommendations, and Conclusions from G.R.E.A.T. Program Implementation Observations. St Louis, Missouri: University of Missouri-St. Louis. Taylor, Terrance J., Finn-Aage Esbensen, and Dana Peterson. 2009. National Evaluation of the Gang Resistance Education and Training (G.R.E.A.T.) Program: G.R.E.A.T. Officer Training (GOT) Report. St. Louis, Missouri: University of Missouri-St. Louis.
For more information about the Gang Resistance Education and Training (G.R.E.A.T.)
Program, see the official G.R.E.A.T. website located at http://www.great-online.org/ .
For more information about youth gangs and effective responses, see the official website of
the National Youth Gang Center located at http://www.iir.com/nygc/ .
For more information on the earlier National Evaluation of G.R.E.A.T., consult the following (NOTE: Peterson & Esbensen 2004 contains results of the previous School Personnel Survey): Esbensen, Finn-Aage. 2004. Evaluating G.R.E.A.T.: A School-based Gang Prevention Program – Research in Policy. Washington, D.C.: U.S. Department of Justice, Office of Justice Programs. Available online at: http://www.ncjrs.gov/pdffiles1/nij/198604.pdf . Esbensen, Finn-Aage, Adrienne Freng, Terrance J. Taylor, Dana Peterson, and D. Wayne Osgood. 2002. The National Evaluation of the Gang Resistance Education and Training (G.R.E.A.T.) Program. Pp.139-167 in Winifred L. Reed and Scott H. Decker (Eds.), Responding to Gangs: Evaluation and Research. Washington, D.C.: U.S. Department of Justice, National Institute of Justice. Available online at: http://www.ncjrs.gov/pdffiles1/nij/190351.pdf . Esbensen, Finn-Aage, D. Wayne Osgood, Terrance J. Taylor, Dana Peterson, and Adrienne Freng. 2001. How Great is G.R.E.A.T.?: Results from a Quasi-experimental Design. Criminology & Public Policy 1 (1): 87-118. Peterson, Dana and Finn-Aage Esbensen. 2004. The Outlook is G.R.E.A.T.: What Educators Say about School-Based Prevention and the Gang Resistance Education and Training (G.R.E.A.T.) Program.” Evaluation Review 28(3): 218-45. Winfree, L. Thomas, Jr., Dana Peterson Lynskey, and James R. Maupin. 1999. Developing Local Police and Federal Law Enforcement Partnerships: G.R.E.A.T. as a Case Study of Policy Implementation. Criminal Justice Review 24 (2): 145-168.
251
This document is a research report submitted to the U.S. Department of Justice. This report has not been published by the Department. Opinions or points of view expressed are those of the author(s)
and do not necessarily reflect the official position or policies of the U.S. Department of Justice.
National Evaluation of the Gang Resistance Education and
Training (G.R.E.A.T.) Program
Observing the Implementer: Description of Findings, Recommendations, and
Conclusions from G.R.E.A.T. Program Implementation Observations
Prepared by:
Krystle M. Leugoud Finn-Aage Esbensen
Bradley T. Brick Terrance J. Taylor
Department of Criminology and Criminal Justice University of Missouri-St. Louis
March, 2009 (Revised: April, 2010)
This project was supported by Award No. 2006-JV-FX-0011 awarded by the National Institute of Justice, Office of Justice Programs, U.S. Department of Justice. This research was made possible, in part, by the support and participation of seven school districts, including the School District of Philadelphia. The opinions, findings, and conclusions or recommendations expressed in this paper are those of the authors and do not necessarily reflect the views of the Department of Justice or of the seven participating school districts.
For questions about this report or for more information about the evaluation, please contact:
G.R.E.A.T. Evaluation Department of Criminology & Criminal Justice
University of Missouri-St. Louis St. Louis, MO 63121-4499
Phone: (314) 516-4777 Fax: (314) 516-5048
252
This document is a research report submitted to the U.S. Department of Justice. This report has not been published by the Department. Opinions or points of view expressed are those of the author(s)
and do not necessarily reflect the official position or policies of the U.S. Department of Justice.
Observing the Implementer: Description of Findings, Recommendations, and Conclusions
from G.R.E.A.T. Program Implementation Observations
ABSTRACT
As part of the process evaluation for the National Evaluation of the G.R.E.A.T. program,
this report summarizes the findings from direct observations of program implementation. For
this component of the evaluation, trained research assistants observed G.R.E.A.T.-trained police
officers as they taught the G.R.E.A.T. program to middle school youth. With a total of 492
unique and separate observations, this report explores the following topics in relation to
program fidelity: 1) adherence to suggested time frames/time management, 2) coverage of
topical areas/lesson adherence, 3) overall quality of the lesson, 4) discussions, activities, and
student participation, 5) officer teaching characteristics and interactions with students, 6)
student final projects, 7) atypical situations that disrupted the flow of the lessons, 8) the extent
and nature of combined lessons, and 9) officer implementation fidelity. This report also
addresses observer reliability through the analysis of 26 sets of inter-rater reliability
observations. Findings are discussed in relation to implementation and program fidelity across
sites. Recommendations for strengthening future implementation of the G.R.E.A.T. program are
suggested based on observers’ qualitative comments and analysis of completed observation
instruments.
253
This document is a research report submitted to the U.S. Department of Justice. This report has not been published by the Department. Opinions or points of view expressed are those of the author(s)
and do not necessarily reflect the official position or policies of the U.S. Department of Justice.
EXECUTIVE SUMMARY
The current report provides an in-depth examination of G.R.E.A.T. program delivery by
officers within schools. Both University of Missouri-St. Louis “in-house” (i.e., UMSL
researchers) and “on-site” (i.e., trained undergraduate and graduate students residing within or
near the seven study sites) research assistants used structured instruments derived from the
G.R.E.A.T. Instructor’s Manual to assess issues of program fidelity. The purpose of these
observations was to determine the extent to which officers delivered the G.R.E.A.T. program in
the field “as intended” (i.e., as developed and conveyed during G.R.E.A.T. Officer Training). A
total of 520 classroom observations covering 33 officers in the seven G.R.E.A.T. Evaluation sites
were conducted.
While often excluded from program evaluations, assessments of program fidelity are
critical components of successful evaluations. Program fidelity assessments allow insight into
the context of outcome results by uncovering successful strategies used in the program, as well
as barriers to successful implementation. The purpose of this report is to provide an assessment
of how the G.R.E.A.T. program is delivered in the field, with a particular emphasis on quality of
discussions and activities, adherence to suggested time frames, coverage of the topical areas,
overall lesson adherence, and the overall quality of the lessons. Illustrations of successful
strategies, as well as areas where improvement is needed, are included.
Results illustrate an overall strong fidelity to the G.R.E.A.T. program by officers
delivering the program in the classrooms. It is important to highlight that 27 of the 33 officers
were considered to have implemented the G.R.E.A.T. program with average or better than
average fidelity. That is, if treatment effect is detected in the outcome evaluation, then it
would be feasible to attribute this effect to the G.R.E.A.T. program. Three additional officers
254
This document is a research report submitted to the U.S. Department of Justice. This report has not been published by the Department. Opinions or points of view expressed are those of the author(s)
and do not necessarily reflect the official position or policies of the U.S. Department of Justice.
delivered the program with below average fidelity but students in these classrooms still
received a sufficient amount of the program (dosage) with sufficient fidelity (program
adherence) to link outcome effects to the program. Only three officers failed to teach the
program with sufficient fidelity to reasonably expect the program to have any effect on the
students in those classrooms. The clear majority of officers were classified as having good to
excellent time management skills, adherence to suggested program time frames, making
considerable effort to cover all topical areas in each lesson, and stimulating student interest and
participation. Variations were found across officers, but typically not across classrooms; that is,
officers were generally consistent in their program delivery when teaching in different
classrooms.
The observations also identified a number of areas where difficulties arose, detracting
from program fidelity. These were generally due to situations outside of the control of officers.
Examples include shortened school days (i.e., schedule changes) or other policing duties which
pulled officers from the classroom. Other situations, however, could be addressed by officers
delivering the program. For example, officers sometimes had difficulties with disruptive
students, often in combination with inattentive teachers. A diligent attempt at improving teacher
involvement, as well as communication between G.R.E.A.T. officers and classroom teachers,
may be warranted.
This report presents a detailed discussion of the observation findings. Themes which
arose from the observations are highlighted, and information for understanding how the
G.R.E.A.T. program operates “in the field” is provided. Finally, recommendations for ways to
enhance program fidelity are offered.
255
This document is a research report submitted to the U.S. Department of Justice. This report has not been published by the Department. Opinions or points of view expressed are those of the author(s)
and do not necessarily reflect the official position or policies of the U.S. Department of Justice.
INTRODUCTION
Process evaluations are an important component of outcome evaluations of social
programs. Whereas an outcome evaluation focuses on the success or failure of a program to
produce a desired effect, process evaluations assess program fidelity – that is, the extent to which
proper program implementation occurs. By utilizing both components in the evaluation of a
program, evaluators are able to link program effects to the actual program.
Process evaluations that look at program fidelity provide evaluators with more
information as to why a program does or does not work compared to stand-alone outcome
evaluations (Melde, Esbensen, and Tusinski, 2006; Summerfelt, 2003). Evaluating program
implementation is essential to understanding the program and how its components fit together to
create a program that works. Failure to use a process evaluation in conjunction with an outcome
evaluation may lead to faulty conclusions about the program and the strength of its components
(Dusenbury, Brannigan, Falco, and Hansen, 2003). Without proper implementation, program
effects may not be as strong or long-lasting as the program providers intended (Dusenbury et al.,
2003). This report discusses one aspect of the process evaluation for the National Evaluation of
the G.R.E.A.T. program - the use of classroom observations of program implementation.
Classroom observations provide an important mechanism by which researchers may
determine the implementation of a program because use of this technique involves direct
observation of the implementation as it exists in the field (Melde et al., 2006). Results from such
observations can then be used to determine the level of implementation within classrooms. For
this process evaluation, we chose to use both quantitative and qualitative components from the
classroom observation instrument in order to gain a thorough understanding of the manner in
which the program was taught, the level to which the delivery adhered to the actual material, and
256
This document is a research report submitted to the U.S. Department of Justice. This report has not been published by the Department. Opinions or points of view expressed are those of the author(s)
and do not necessarily reflect the official position or policies of the U.S. Department of Justice.

the way teachers, officers, and students responded to the program, its messages, and techniques
of teaching. Because this program is offered nationwide, a number of factors can influence
program fidelity (e.g., officer characteristics and teaching styles, student and classroom
characteristics, and school setting). With observations from 33 officers teaching G.R.E.A.T. in
31 different schools, we are able to examine the role of these factors.
This report addresses the use of observations to determine program fidelity in the areas of
dosage, adherence, and quality. More specifically, we examine the components of the
observations that include adherence to suggested timeframes, coverage of topical areas/lesson
adherence, and overall quality of the lessons. Qualitative comments gathered from the
observations are used to derive general conclusions as to the following: 1) classroom
discussions; 2) activities and student participation; 3) information about officers; 4) the nature of
student final projects; and 5) atypical situations that officers faced in the classrooms (i.e.,
something that occurred that interrupted the natural flow of the lesson).
OVERVIEW OF THE PROGRAM
The G.R.E.A.T. program is a school-based, officer-instructed program that targets
primarily middle school students in the sixth and seventh grades across the country. The
program is preventative in that it aims to provide students with the tools and skills necessary to
resist delinquency, youth violence, and gang membership. As such, the program focuses on the
following four skill areas: 1) personal skills (goal-setting, decision making, anger management);
2) resiliency skills (message analysis, problem solving); 3) resistance skills (refusal skills,
recognition of peer pressure, anti-gang and anti-violence norms); and 4) social skills
(communication skills, conflict resolution, social responsibility, empathy/perspective taking).
257
This document is a research report submitted to the U.S. Department of Justice. This report has not been published by the Department. Opinions or points of view expressed are those of the author(s)
and do not necessarily reflect the official position or policies of the U.S. Department of Justice.
The G.R.E.A.T. program consists of thirteen 30-45 minute lessons that are designed to be
taught in sequential order, with no more than one to two lessons taught to students each week.
The program is predicated on a skills-building approach; that is, as the students are exposed to
new skills or information they must be allowed to practice these newly acquired skills.
Subsequent program components build on prior lessons (and sections within each lesson) in a
logical manner.
An important characteristic of the G.R.E.A.T. program is that police officers go to the
classrooms and teach students each lesson. This is partially to build a community partnership
between students and officers and to enhance the development of positive attitudes towards the
police. While improving student attitudes toward the police is one of the stated goals of the
program, it also appears that the officers had another unintended role in the classroom; many of
the officers observed in the course of this evaluation told students stories about their experiences
as police officers. The stories they told reinforced the G.R.E.A.T. lessons by highlighting the
consequences of illegal activity (e.g., they told stories about people they had arrested in the past,
people who had been injured or hurt others because of bad decisions, and some even related their
own stories of peer pressure and drug use/resistance in their past).
G.R.E.A.T. Lesson Overview:
The G.R.E.A.T. program consists of the following thirteen 30-45 minute lessons:
• Lesson 1 – Welcome to G.R.E.A.T. - acts as the introduction to the program and
introduces the relationship between gangs, violence, drug abuse, and crime.
• Lesson 2 – What’s the Real Deal - consists of message analysis skills and “facts and
fictions” about gangs.
258
This document is a research report submitted to the U.S. Department of Justice. This report has not been published by the Department. Opinions or points of view expressed are those of the author(s)
and do not necessarily reflect the official position or policies of the U.S. Department of Justice.
• Lesson 3 – It’s About Us - focuses on different communities and how students are a part
of these, including their responsibilities to their community or communities.
• Lesson 4 – Where Do We Go From Here - introduces students to the concept of goals and
how to set realistic and achievable aspirations.
• Lesson 5 – Decisions, Decisions, Decisions - focuses on decision-making, in which
students learn the G.R.E.A.T. decision making model and the impact their decisions have
on their goals; students are able to practice making positive decisions.
• Lesson 6 – Do You Hear What I’m Saying? - teaches the importance of listening to
others and the difference between verbal and non-verbal communication.
• Lesson 7 – Walk in Someone Else’s Shoes - instructs students in active listening skills
and how to identify others’ emotional states through empathy-building techniques.
• Lesson 8 – Say It Like You Mean It - teaches refusal skills so students may resist peer-
pressure to engage in deviant or delinquent acts; this includes learning about body
language and tone of voice.
• Lesson 9 – Getting Along Without Going Along - consists of recognizing peer pressure
and other influences that may push students into delinquency.
• Lesson 10 – Keeping Your Cool - teaches students to keep calm in the face of anger with
anger management tips and practicing the “cooling-off” technique.
• Lesson 11 – Keeping It Together - consists of recognizing anger in others and learning to
calm them.
• Lesson 12 – Working It Out - teaches students to work through problems without fighting
and provides tips for conflict resolution, practice of such, and information about where to
go for help in their communities.
259
This document is a research report submitted to the U.S. Department of Justice. This report has not been published by the Department. Opinions or points of view expressed are those of the author(s)
and do not necessarily reflect the official position or policies of the U.S. Department of Justice.
• Lesson 13 – Looking Back - consists of a program review and the presentation and
discussion of student final projects.
One program component that officers assign during Lesson 1 and provide several
reminders throughout the program is the student final project. These projects are intended to
capture the main messages of the G.R.E.A.T. program and/or to motivate students to think about
positive ways to improve their schools and communities. Through this process of completing a
final project, students often make others who are not in the program aware of the main messages
of G.R.E.A.T. Although the Instructor’s Manual suggests that each student think of and
complete their own project, some officers combined the projects into one large class project to be
better able to monitor students while they completed their project. It should also be noted that
several officers instructed their students to think of a project that could be done and then to write
a short paper about what the project would consist of and how the students could accomplish the
tasks if they were to put their ideas into practice (without actually completing the project).
The G.R.E.A.T. program also includes a short skit at the beginning and end of each
lesson, entitled “Life in the Middle.” This introduction and review of the day’s lesson are
structured into a skit so that students may either just read them aloud, or they may actually act
them out for the classroom. The program materials also include parent letters to encourage
parents to ask their children what they are learning in the program, as well as extended teacher
activities that are optional for teachers to use. These consist of additional ideas for teachers to
incorporate G.R.E.A.T. messages within other subject matter and/or class periods. These
activities are suggested in the Instructor’s Manual, which all officers receive at training;
however, it is up to the individual officer to inform the teacher of these possible activities.
Because these activities take place during class time not devoted to the program, the observations
260
This document is a research report submitted to the U.S. Department of Justice. This report has not been published by the Department. Opinions or points of view expressed are those of the author(s)
and do not necessarily reflect the official position or policies of the U.S. Department of Justice.
in this study were unable to capture the extent of, and/or use of this supplemental material (see
the School Personnel Report for discussion of teacher use of these extended teacher activities).
DATA AND METHODS
Two different sets of observations were collected: 1) observations of lessons being taught
and 2) observations of both treatment and control classrooms during which time the program was
not being taught. Observations of control classrooms were important to determine whether there
were any unique characteristics of the different classrooms (e.g., physical arrangement of
classrooms, resources available to students, etc.) that might produce systematic differences
between treatment and control classrooms. Additionally, these observations allowed us to
determine if there were any systematic differences between teachers in whose classes G.R.E.A.T.
was taught compared with teachers in the control classes. While the random assignment of
classrooms should have controlled for this potential problem, we nonetheless wanted
independent confirmation that there was no confounding effect associated with the classroom
assignment. A total of 108 control observations were completed in both treatment and control
classrooms. Based on these observations, we did not find any substantive differences between
the treatment and control teachers or classrooms. In fact, in some instances the same teacher
would have both control and treatment classes throughout the day. For the remainder of this
report, we will focus on the 492 observations of treatment classrooms. We will also report on
the results of 26 sets of inter-rater reliability observations completed in treatment classrooms.
261
This document is a research report submitted to the U.S. Department of Justice. This report has not been published by the Department. Opinions or points of view expressed are those of the author(s)
and do not necessarily reflect the official position or policies of the U.S. Department of Justice.
Procedures
Both “in-house” (i.e., members of the UMSL Research Team) and “on-site” (i.e.,
advanced undergraduate and graduate students hired from universities in each respective site)
observers assessed program fidelity by visiting classrooms in which officers were delivering the
G.R.E.A.T. program. It was initially intended for all observers to come together for two days of
training so that uniformity in observing could be attained; however, such a strategy became
unworkable within the time constraints of the grant award and when G.R.E.A.T. instruction
began in each school. In-house research assistants were provided training on the program and
through observing the G.R.E.A.T. Officer Training sessions. All observers were provided
training on how to use the observation instrument and instructed on the extent of documentation
necessary. As completed observation instruments arrived at the central research office (upon
completion of a classroom observation, observers e-mailed or mailed them to the UMSL office
where they were reviewed and then sorted and filed by city and classroom), the Principal
Investigator and senior researchers reviewed the observation reports for quality control purposes
and contacted observers to give them feedback on the observational process.
Observation Instruments
In order to receive uniform observational reports, researchers created an observation
checklist instrument from the G.R.E.A.T. Instructor’s Manual as an outline of each lesson.
These checklists included all aspects of the lessons that officers were to teach from the
Instructor’s Manual. Components of these instruments included total time spent on the lesson,
total time spent on each section of the lesson, general qualitative comments, a checklist of lesson
components, and a rating system at the end of the checklist for observers to rate how interested
262
This document is a research report submitted to the U.S. Department of Justice. This report has not been published by the Department. Opinions or points of view expressed are those of the author(s)
and do not necessarily reflect the official position or policies of the U.S. Department of Justice.
students appeared to be in the discussions and activities. Observers were then asked to rate the
lesson and the officer based on adherence to suggested time frames, coverage of topical areas,
overall lesson adherence, and overall quality of the lesson. Finally, observers were instructed to
write comments assessing the quality of student discussions/activities and the lesson in general.
This approach mirrors that successfully used in prior studies (see Melde et al., 2006, Sellers et
al., 1998).
In-house Ranking
Observers indicated in their reports whether program components were taught and the
time spent on each lesson component; these data were entered into an SPSS database to facilitate
assessment of program fidelity. We examined the length of time spent on each section of the
lesson and the overall time devoted to each lesson. Further, each on-site observer also included
rankings of the quality of discussions, activities, adherence to suggested time frames, coverage of
the topical areas, overall lesson adherence, and the overall quality of the lesson. After reviewing
each observation and its components, one of the UMSL research assistants conducted an in-
house ranking for each of the items scored by the observers in the field. These in-house rankings
were completed based on the information given in the observation instrument. This allowed for
two rating systems, one in which the person observing rated the lesson and one in which the in-
house researchers rated the lesson based on the completed observations. This was done in order
to achieve consistency on the rankings as the observations were completed by numerous
researchers at the seven evaluation sites.
“In-house” observers were employed at UMSL and their work was devoted entirely to the
project. “On-site” observers were recruited through contact with colleagues at local universities.
263
This document is a research report submitted to the U.S. Department of Justice. This report has not been published by the Department. Opinions or points of view expressed are those of the author(s)
and do not necessarily reflect the official position or policies of the U.S. Department of Justice.
Known colleagues at local universities were contacted and asked to refer students who they
considered to be particularly qualified to conduct these duties. Additionally, we requested that
job announcements be posted in the local universities. Potential observers were screened and
hired by senior researchers at UMSL. This approach yielded mixed results across the sites. In
six sites, “on-site observers” were located and hired. In one of these sites, scheduling conflicts
arose during the study period which limited the lessons observed by on-site personnel; thus, “in-
house” observers attempted to pick up observations when possible. In one site, no on-site
observers were located, necessitating in-house researchers to complete all observations in the
site. Clearly, this required considerable additional travel and expense and resulted in fewer
observations than initially intended. In spite of such logistical issues, we were still successful in
completing at least six observations per officer in all seven sites.
Table 1 displays the total number of observations by lesson and officer that are included
in this report. There were a total of 492 separate and unique observations.1 Lesson 2 was the
most frequently observed lesson across all cities and schools (53 observations). Lesson 10 had
the fewest observations with a total of 29. Each lesson was observed at least once in every site
with only four exceptions (Lessons 12 and 13 were not observed in Chicago and Lessons 7 and
11 in Nashville). The average number of observations per officer in this study was 15 times.
1 In addition to unique observations, 26 observations were conducted for inter-rater reliability (IRR). A total of 26 IRR observations were completed with the ‘regular’ observer and one IRR observer; two sets of IRR observations were completed with the ‘regular’ observer and two IRR observers. Thus, the total number of IRR observations is 28; however this report will use the number of ‘sets’ of observations (n=26).
264
This document is a research report submitted to the U.S. Department of Justice. This report has not been published by the Department. Opinions or points of view expressed are those of the author(s)
and do not necessarily reflect the official position or policies of the U.S. Department of Justice.
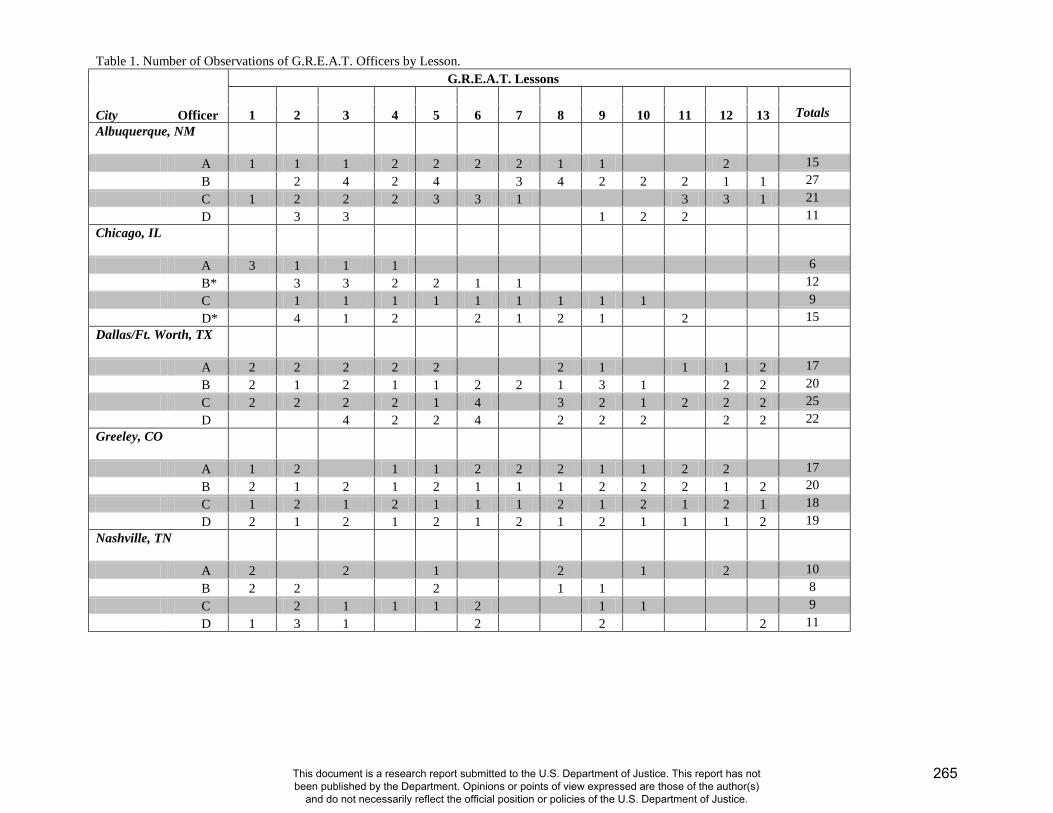
Table 1. Number of Observations of G.R.E.A.T. Officers by Lesson. G.R.E.A.T. Lessons
City Officer 1 2 3 4 5 6 7 8 9 10 11 12 13 Totals Albuquerque, NM
A 1 1 1 2 2 2 2 1 1 2 15 B 2 4 2 4 3 4 2 2 2 1 1 27 C 1 2 2 2 3 3 1 3 3 1 21 D 3 3 1 2 2 11
Chicago, IL
A 3 1 1 1 6 B* 3 3 2 2 1 1 12
C 1 1 1 1 1 1 1 1 1 9 D* 4 1 2 2 1 2 1 2 15
Dallas/Ft. Worth, TX
A 2 2 2 2 2 2 1 1 1 2 17 B 2 1 2 1 1 2 2 1 3 1 2 2 20 C 2 2 2 2 1 4 3 2 1 2 2 2 25 D 4 2 2 4 2 2 2 2 2 22
Greeley, CO
A 1 2 1 1 2 2 2 1 1 2 2 17 B 2 1 2 1 2 1 1 1 2 2 2 1 2 20 C 1 2 1 2 1 1 1 2 1 2 1 2 1 18 D 2 1 2 1 2 1 2 1 2 1 1 1 2 19
Nashville, TN
A 2 2 1 2 1 2 10 B 2 2 2 1 1 8 C 2 1 1 1 2 1 1 9 D 1 3 1 2 2 2 11
265
This document is a research report submitted to the U.S. Department of Justice. This report has not been published by the Department. Opinions or points of view expressed are those of the author(s)
and do not necessarily reflect the official position or policies of the U.S. Department of Justice.
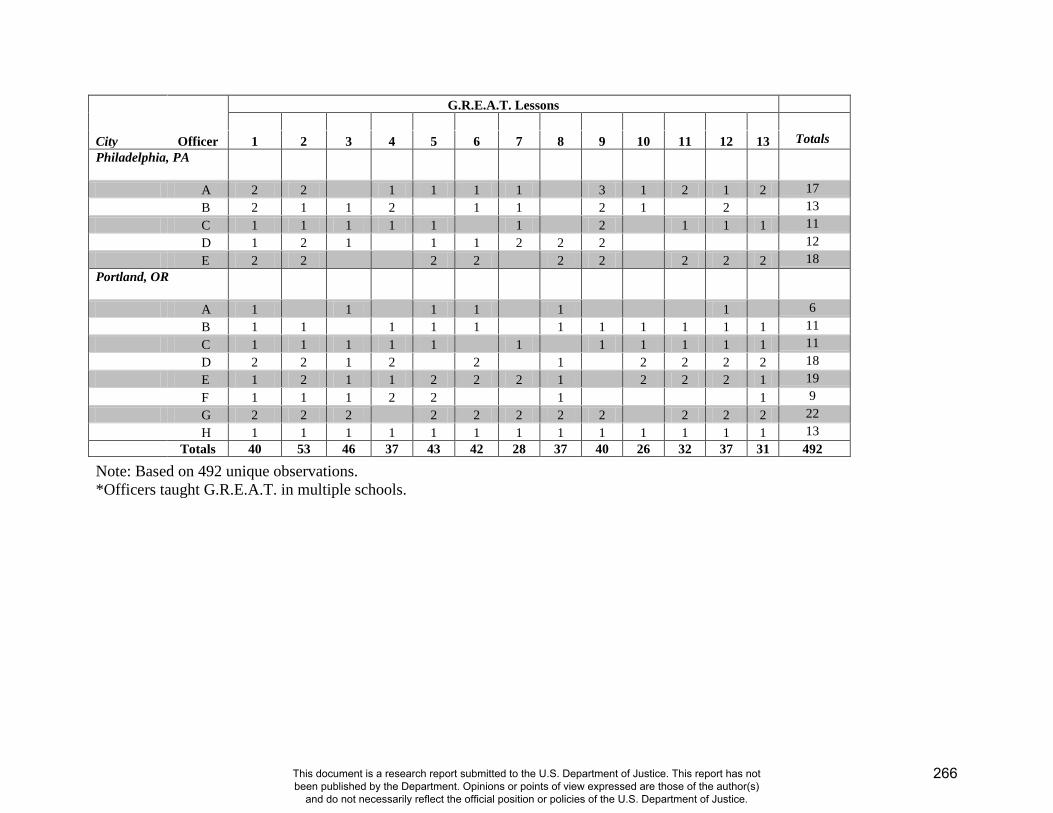
Note: Based on 492 unique observations. *Officers taught G.R.E.A.T. in multiple schools.
G.R.E.A.T. Lessons
City Officer 1 2 3 4 5 6 7 8 9 10 11 12 13 Totals Philadelphia, PA
A 2 2
1 1 1 1
3 1 2 1 2 17 B 2 1 1 2
1 1
2 1
2
13
C 1 1 1 1 1
1
2
1 1 1 11 D 1 2 1
1 1 2 2 2
12
E 2 2
2 2
2 2
2 2 2 18 Portland, OR
A 1
1
1 1
1
1
6 B 1 1
1 1 1
1 1 1 1 1 1 11
C 1 1 1 1 1
1
1 1 1 1 1 11 D 2 2 1 2
2
1
2 2 2 2 18
E 1 2 1 1 2 2 2 1
2 2 2 1 19 F 1 1 1 2 2
1
1 9
G 2 2 2
2 2 2 2 2
2 2 2 22 H 1 1 1 1 1 1 1 1 1 1 1 1 1 13 Totals 40 53 46 37 43 42 28 37 40 26 32 37 31 492
266
This document is a research report submitted to the U.S. Department of Justice. This report has not been published by the Department. Opinions or points of view expressed are those of the author(s)
and do not necessarily reflect the official position or policies of the U.S. Department of Justice.
Inter-rater Reliability
Throughout the observation period, steps were taken to provide inter-rater reliability
assessments of the observations. As a general rule, UMSL research staff conducted the inter-rater
reliability assessments but in a few instances, the on-site observers did so. A total of 26
classroom observations were included in the inter-rater reliability (IRR) observations - that is,
two researchers observed the same lesson in the same classroom and independently took notes.
The observations from the “regular” observer were treated as any other report with the exception
that they were flagged to allow for subsequent comparison with the second observer’s report.
To determine the inter-rater reliability concordance, both the qualitative and quantitative
components of the two sets of observations were compared and contrasted. The primary
determinant of reliability was observer indication that lesson components were taught by the
officer. Observers completed IRR observations for 14 of the 33 total officers; therefore, almost
half of the officers included in this evaluation were observed by multiple researchers.
The overall inter-rater reliability percentage of agreement was a respectable 85.43
percent; 11 of the IRR observations had a concordance rate of 90 percent or higher, seven sets of
observations were between 80 and 89 percent, six were between 69 and 79 percent, and only two
were less than 69 percent (46% and 29%). These last two IRR observations were from one
officer who was determined to have delivered the program with such low quality that one could
not conclude that the program was actually taught with sufficient fidelity to have the desired
program effect.
267
This document is a research report submitted to the U.S. Department of Justice. This report has not been published by the Department. Opinions or points of view expressed are those of the author(s)
and do not necessarily reflect the official position or policies of the U.S. Department of Justice.
RESULTS
Time Management and Adherence to Suggested Time Frames
Adherence to suggested time frames for the program is related to time management on
the part of the officers in that it impacts whether all components of the lessons could be taught.
The clear majority of officers had good to excellent time management skills. This is despite the
different school schedules and class time allocated for the program across schools and sites.
When officers appeared to have trouble adhering to the suggested time frames, it was either
because of disruptive student behavior or an atypical situation (something that occurred that
interrupted the natural flow of the lesson).
Officers used a variety of methods in order to keep the students focused, which appeared
to greatly increase their adherence to suggested time frames. In this regard, officer strengths
appeared to be calling on a limited number of students in order to complete a discussion without
losing valuable time. Another technique that allowed officers to complete lessons on time was
their ability to control student behavior. One observer noted how an officer did this,
“The officer exercised good classroom management. To control classroom volume, the officer would use phrases like, ‘folks, what is with the noise?’ and ‘show respect!’ At one point the officer warned them that if they continued to talk, he would wait until they were ready. He notified them that they have a choice to be quiet or not. If not, the consequence would be that they would have to conduct more work at home.”
One officer whose classes proved problematic stopped a lesson in order to have a “heart-
to-heart” talk with the students about why they were participating in the G.R.E.A.T. program and
what benefits came from the program, even if it did not seem like it at the time. After this talk,
the students in this officer’s class appeared to calm down and focus their attention on the officer.
Another officer had an inventive idea for controlling students when they were rowdy and
would not be quiet. After several reminders to students that they must stay in their seats and quit
268
This document is a research report submitted to the U.S. Department of Justice. This report has not been published by the Department. Opinions or points of view expressed are those of the author(s)
and do not necessarily reflect the official position or policies of the U.S. Department of Justice.
talking, the officer finally stopped the lesson and told the students they would be doing a
different activity. He told students to sit in their chairs and be quiet. As an activity, he
introduced the concept of listening to his police radio (which he turned on in class, but did not
turn the volume up all the way). He instructed students to write down everything they heard on
the radio, and they had to be quiet while doing so in order to hear it. After about five minutes,
the officer turned off the radio and asked what students heard, and then he interpreted what they
heard on the radio and told them what it meant. The observer in this instance noted that this
activity had a positive effect on students in that they quieted down and sat in their chairs for the
remainder of the lesson.
Those officers who had trouble controlling student behavior in their classrooms did not
fare as well on adherence to suggested time frames because the students themselves became
disruptive to the officers, and it was often hard for officers to stay on topic. Those who had
trouble controlling behavior or who had problem students appeared to struggle for the majority
of the lesson with correcting behavior, and thus lost valuable time in each lesson. In some of
these instances, student behavior was made worse when the regular classroom teacher left the
room during lesson delivery or if teachers did nothing to correct student misbehavior during the
lessons, leaving discipline and teaching to the officer.
If officers had problems with adherence to suggested times and it was not because of
student behavior, it was often because of an atypical situation. Some of the atypical scenarios
that arose were fire drills, announcements, school assemblies, state testing, activity day
schedules, and field trips. Some of these instances would affect an entire class (e.g. if the fire
drill was during the G.R.E.A.T. lesson, then all students were affected). If the situation involved
school assemblies (such as recognizing honor students), then the situation tended to affect about
269
This document is a research report submitted to the U.S. Department of Justice. This report has not been published by the Department. Opinions or points of view expressed are those of the author(s)
and do not necessarily reflect the official position or policies of the U.S. Department of Justice.
half the class as those who made the honor roll were called out of class. In these instances, the
officer continued teaching the G.R.E.A.T. lesson to those students who remained in the class. In
the case of fire drills, officers stopped instructing and began again after the drill ended.
A common trend throughout the observers’ notes was that officers often did not know
ahead of time when scheduled activities were taking place at the school; and therefore, could not
prepare for the situation. Sometimes observers noted that the officer came to class at the
regularly scheduled time and therefore missed part of the “re-scheduled” or shortened class
period. When officers had less time due to a school schedule conflict, they quickly taught the
lessons and appeared to make an effort to cover the main points of the lesson before leaving the
class. The part of the lessons that officers most often skipped for the sake of time appeared to be
the Wrap-Up section of the lessons, which consisted of a review of the day’s activities. The
second most skipped section of the lessons due to time constraints were the Introductions to the
lessons, which familiarized students with what the lesson was going to cover that day. It should
be noted that when officers left out the Introduction aspect of the activities, they still allowed
students to participate and read aloud the “Life in the Middle” (LIM) skit. This is consistent with
training guidelines about how officers are to handle time management (i.e., skimming
introductions and wrap-ups if necessary, but always including LIM). It also appeared in the clear
majority of observations that students thoroughly enjoyed the LIM component of each lesson.
Some officers, in spite of outside occurrences, still exhibited excellent time management
skills. It was common for these officers to do so by shortening discussions, activities, and
student writing projects. It appeared that officers covered the main components of each part of
the lessons, but may have eliminated some of the time students had to complete such activities.
Those officers who chose this method of delivering the lesson in the face of a shortened class
270
This document is a research report submitted to the U.S. Department of Justice. This report has not been published by the Department. Opinions or points of view expressed are those of the author(s)
and do not necessarily reflect the official position or policies of the U.S. Department of Justice.
period tended to have better on-site and in-house implementation scores due to the fact that they
still taught the lesson as intended, but merely shortened some of the time frames for each section
of the lesson.
Some officers had more time than was necessary to teach the entire lesson for the day.
These officers tended to fill the extra time by allowing students more time for discussion and
completion of workbook activities; some filled the extra time with stories based on their
experiences working with suspects. Students appeared to really enjoy it when officers had time
to answer their questions in relation to what they did on patrol, and students appeared interested
when officers related G.R.E.A.T. material to their experiences on patrol.
Again, the majority of officers had good or excellent time management skills. Among
the few exceptions to this was one officer who was noted as a “slow talker” by numerous
observers - and therefore had trouble getting through the entire lesson. Instead, this officer
would thoroughly cover the first part of the lesson until time ran out, at which point the officer
would end the lesson and appeared to not come back to the missed sections. Another officer
taught 62% of his lessons in 20 minutes or less. This officer was deemed to have poor time
management because this officer combined lessons, therefore not covering any particular lesson
in great detail. Combining lessons appeared to be due to the fact that this officer was being
reassigned at the end of the calendar year (December) and therefore unable to finish the
curriculum after the winter break.
Adherence to Suggested Time Frames and Fidelity Scores for Officers
For the purpose of assessing program fidelity, we determined that any lesson taught in 20
minutes or less would be deemed as not implemented as intended. This is because 20 minutes is
271
This document is a research report submitted to the U.S. Department of Justice. This report has not been published by the Department. Opinions or points of view expressed are those of the author(s)
and do not necessarily reflect the official position or policies of the U.S. Department of Justice.
about (or a little under) half of the estimated time for each lesson. When using this criteria, the
majority of officers (n=19) had no lessons completed in 20 minutes or less and another nine
officers had only one observed lesson completed in this time frame. Table 2 shows the number
of officers that taught lessons in 20 minutes or less. It can be assumed that those officers who
taught only one, two, or even three lessons in 20 minutes or less may have done so because of
influences beyond their controls (atypical situations). Therefore, it appears only one officer had
poor adherence to suggested time frames, and this was an officer who was being reassigned at
the end of the year. This finding is supported by the qualitative comments offered in the
observations and by the officer implementation score assigned in-house. Such a score was based
on all six topical areas where observers could rate officers. It was determined that only three
officers had the lowest implementation score (poor), and of these officers, only one was given
this low score based on poor time management.
Table 2. Number of Officers Teaching Lessons in 20 Minutes or Less.
# of Lessons under 20 min.
# of Officers
0 19
1 9
2 3
3 1
More than 3 1
In the area of adherence to suggested time frames, it appears that the atypical scenarios,
which tended to result in less class time to teach, presented officers with the most problems.
Therefore, a recommendation for future implementation would be to increase and/or strengthen
272
This document is a research report submitted to the U.S. Department of Justice. This report has not been published by the Department. Opinions or points of view expressed are those of the author(s)
and do not necessarily reflect the official position or policies of the U.S. Department of Justice.
communication between teachers and the officer. If the lines of communication are open (in that
officers know how to contact teachers and teachers know how to contact officers), officers may
be more prepared to deal with these atypical scenarios. In situations where the teachers and
officers have each other’s contact information, they should be encouraged to communicate
scheduling changes well in advance. If officers can plan for some of these scenarios, they may
be able to teach a quality lesson even though there is less time to do so. In addition, officers
might be encouraged each week to review the next week’s schedule with the teacher, in hopes of
learning about schedule changes.
Because student misbehavior also became a problem for some officers, regular
communication between the officer and teacher should again be encouraged. If officers and
teachers give each other mutual feedback, then the officer may feel more compelled to ask for
the teacher’s help in disciplining students when they prove to be a distraction. In classes where
the teacher was attentive to the lesson, officer, and students, the teacher was better able to help
the officer maintain control of students. Further, it appeared that students were slightly more
receptive to their teachers when s/he corrected their behavior compared to when it was just the
officer correcting behavior. This type of recommendation would require teachers to be in the
classrooms and to pay attention to student behavior when officers are teaching the lessons.
Observers noted that many teachers left the room while the officer was there, or used the time as
a planning period, or they simply read a book or played computer games. Although districts may
require the teacher to stay in the classroom while G.R.E.A.T. is being taught, observers often
commented that the teacher left the classroom for parts of, or the majority of the lesson. Perhaps
officers could enlist teacher help from the beginning by visiting, or setting up a meeting, with the
273
This document is a research report submitted to the U.S. Department of Justice. This report has not been published by the Department. Opinions or points of view expressed are those of the author(s)
and do not necessarily reflect the official position or policies of the U.S. Department of Justice.

teacher before the program begins so that they can both plan a course of mutual action for when
students misbehave and do not listen.
A final recommendation would be for teachers not to interrupt the lesson when the officer
is teaching. A few teachers would call students over to their desks for meetings, or would
actively grade student assignments while giving feedback to the student. In these scenarios, the
officer and the lesson were both interrupted and it appeared difficult for the officer to stay on
topic. In addition, when teachers called students aside during the lessons, observers noted that
other students would watch what the teacher and student were doing, even if they were in the
back of the classroom. This is an additional area which can be addressed through officer –
teacher communication.
Coverage of Topical Areas/Lesson Adherence
Officers appeared to make considerable effort to cover all topical areas in each lesson
even when they were short on time. Those who had “excellent” adherence had near perfect
coverage of the topical areas and they followed the lesson plans and components from the
G.R.E.A.T. manual in the order in which they were intended to be presented. These officers also
adhered to the intended discussions and activities and made sure that students were instructed to
talk or discuss correct topics.
Officers who had “average” coverage of topical areas and average lesson adherence
tended to teach the program as intended; however, some of their lessons may have been
combined, and thus the officer was not able to review all topics in one class period. Another
characteristic of officers’ average coverage of topical areas and lesson adherence was when they
covered all or most topics, but they did so out of order. Presenting lesson components out of
274
This document is a research report submitted to the U.S. Department of Justice. This report has not been published by the Department. Opinions or points of view expressed are those of the author(s)
and do not necessarily reflect the official position or policies of the U.S. Department of Justice.
order is counted against officers in this study because G.R.E.A.T. is a skills building program, in
which the topics are intended to be taught sequentially so as to build-on and strengthen skills
learned in prior lessons. Each lesson itself also builds on skills learned within the same lesson.
Other officers received average topical coverage and lesson adherence ranking because
they tended to lecture instead of pushing students to discuss and participate in activities. The
Instructor’s Manual and G.R.E.A.T. Officer Trainings (GOT) indicate that officers should not
rely exclusively on lectures, but instead should strive to include students in active learning
techniques by having them participate in discussions, group activities, and by sharing their
written answers. An example of this is when officers would attempt to start a discussion by
asking a question. If no one volunteered, they would answer the question themselves. This
differed from officers who had excellent lesson adherence and coverage of topical areas because
these officers would call on students if no one volunteered. Those officers with excellent
adherence would often ask every student to share his/her answer and they would sometimes
bring in small gifts for students who did participate. This seemed to set a tone for the classroom
that students should feel free to participate. Those officers who had average implementation
generally would not institute these ideas; and therefore, their lessons tended to be focused more
on lectures than student activities. Officers who tended to have “poor” coverage of topical
areas and lesson adherence were ranked as such because they combined lessons (necessitating a
reduction in the content/topical areas of each lesson) or because their presentation of the material
was so disorganized that it was difficult for the observer to note each topical area covered. One
observer commented,
“The officer rambles so it is hard to follow the lesson; officer talks a lot about personal life and experiences such as family and past arrests.”
275
This document is a research report submitted to the U.S. Department of Justice. This report has not been published by the Department. Opinions or points of view expressed are those of the author(s)
and do not necessarily reflect the official position or policies of the U.S. Department of Justice.
The other characteristic that led officers to have poor lesson adherence/coverage of
topical areas was going over lesson components in great detail, which generally resulted in the
officer not being able to finish the lesson in its entirety. When officers slowed down the lessons,
it not only added to students losing attention to the program components, but also did not allow
the officer to finish the lessons.
Those officers who covered topical areas in an exceptional manner nonetheless would
experience difficulty covering all topical areas when an atypical situation occurred. When
officers were seemingly surprised by an atypical situation or student behavior problems, they
would skip topical areas as needed in order to be able to finish the lesson in the designated class
period. One teaching method that appeared to allow officers to stay on topic was to have class
discussions, led by the officer, instead of breaking students into small groups for discussion,
which tended to result in students getting off topic. This technique had the added benefit of
allowing the officer to be able to participate in the conversation and s/he could then clarify
concepts for students if they had trouble understanding, instead of waiting to come back together
as a class and discovering students did not understand what they were to be discussing. This
technique required students to stay on-topic during discussions and allowed officers to cover
topical areas more thoroughly.
When officers with lower lesson adherence faced an atypical situation, it tended to result
in the officer getting off-track in the lesson. Atypical factors consisted of, on average, shortened
class periods due to an “activity schedule,” fire drill, or snow day. Officers also had to manage
teaching lessons during instances when some students were not in the classroom because of an
award ceremony. Field trips in other classes also contributed to some students not being in the
classroom when the officer arrived, although this only occurred twice. Further, when it began
276
This document is a research report submitted to the U.S. Department of Justice. This report has not been published by the Department. Opinions or points of view expressed are those of the author(s)
and do not necessarily reflect the official position or policies of the U.S. Department of Justice.

snowing outside, students often got distracted. Albuquerque experienced an unusually wet
winter when the observations were being completed, and it was noted in several observations
that students ran to the window to watch the snow fall. When officers faced these situations,
they tended to not cover all topical areas, and would sometimes present the lesson out-of-order.
An example of this is when one officer decided to draw student attention away from the window
by completing the activity first, instead of after teaching the lesson and discussions. Completing
the sections of the lesson out of order slightly counted against officers in scoring lesson
adherence and coverage of topical areas.
Recommendations to help officers with future coverage of topical areas and lesson
adherence would be to have officers review the specific lesson and components they will be
teaching that day. Perhaps then, if a situation arises where the officer is unable to teach the
entire lesson, he/she may pick the main topics and still provide a quality lesson. This ability
requires that officers familiarize themselves with the program and its components to the extent
that they know which topics can be covered quickly in the face of impromptu problems.
Trainers at the G.R.E.A.T. Officer Trainings (GOTs) might suggest to officers that they consider
using guided class discussion rather than group activities if time is short. Further, officers should
try to stay within the time estimates for each section of a lesson. Although this may be stressed
in training, it appears that in practice this is harder to implement and deserves special attention
from officers.
Overall Quality of Lessons
Lessons were as good as the officers were at teaching them and as good as the students
were at behaving and being involved in the lessons. Our observations of lesson delivery lead us
277
This document is a research report submitted to the U.S. Department of Justice. This report has not been published by the Department. Opinions or points of view expressed are those of the author(s)
and do not necessarily reflect the official position or policies of the U.S. Department of Justice.

to conclude that the vast majority of lessons were taught in a manner consistent with the training
provided at the GOT. It appeared the best quality lesson resulted from a strong and supportive
relationship between officer and teacher, and positive and respectful student behavior. When
teachers helped officers maintain classroom control, the lessons tended to run smoothly and
quickly. Further, when teachers reinforced points of the lessons by being involved in
discussions, the students appeared to have greater interest in the program and showed more
respect and were better behaved overall. In a classroom where the teacher appeared to have a
positive relationship with the officer, the observer noted the following,
“Students raise hands and ask questions. The teacher is involved in the discussion on how to improve your community; teacher stresses keeping the community and neighborhood nice and the school clean.”
Another positive relationship appeared when one observer noted, “(The) teacher walked around
the room to check students’ (G.R.E.A.T.) books and quietly ensured that they were completing
the activities.”
When teachers ignored student misbehavior, used the telephone in the classroom, left the
room, or interrupted the lessons themselves, then student behavior tended to become a problem
in the classroom. Students appeared to not take the program as seriously if they had teachers
who were not involved and/or listening to the classroom instruction. This was especially the
case when teachers would call students over to their desk to give students grades or talk to them
about an assignment. In such an instance one observer noted,
“(The) teacher was not only completely uninvolved in the G.R.E.A.T. program, but was disrupting the discussion by calling out students to bring their (unrelated) journal assignments to her and going over their journals with them while the officer was teaching the lesson. Also, the teacher did not control students when they were loud or not paying attention. The officer just tried to talk over them.”
Occasionally, researchers noticed such things as “funny” comments and student
suggestions and ideas that were contrary to the G.R.E.A.T. program content. In one class, during
278
This document is a research report submitted to the U.S. Department of Justice. This report has not been published by the Department. Opinions or points of view expressed are those of the author(s)
and do not necessarily reflect the official position or policies of the U.S. Department of Justice.
a skit in which students were supposed to reject delinquent behavior, a boy in this class agreed to
spray paint the boys’ bathroom (instead of refusing the peer pressure to do so). This required the
officer to take an additional five minutes to explain to the student and the class that this was not
the correct response and why this behavior was unacceptable.
One classroom in particular displayed very disrespectful behavior toward the officer
during one lesson. The teacher had the students write apology letters to the officer and to
apologize as a class when the officer arrived for the next G.R.E.A.T. lesson. This technique
seemed to work as students were subsequently much more respectful toward the officer.
Because the overall quality of the lesson heavily relied on teacher and student behavior,
the importance of forging a relationship with the teacher(s) in whose classes they will be
teaching should be stressed to the officers. If the officer attempts to relay his/her frustrations and
suggestions in relation to students and student behavior, then teachers may be able to assist
officers in maintaining student control during the lesson delivery. If officers and teachers can
come together and cooperatively agree to help each other, then the overall quality of lessons can
only improve. A synergistic approach between teachers and the program is stressed to officers at
G.R.E.A.T. Officer Training and can be enhanced through use of the extended teacher activities.
Discussions, Activities and Student Participation
Students appeared to enjoy discussions more when they were able to ask officers about
their jobs, weapons, and stories from “the streets.” In classes where a School Resource Officer
(SRO) taught students, the students were very interested in stories from their schools, such as
gang incidents and fights that the officer helped to control. Students tended to like discussions
about the G.R.E.A.T. material, as well; however, students appeared to be less interested in the
279
This document is a research report submitted to the U.S. Department of Justice. This report has not been published by the Department. Opinions or points of view expressed are those of the author(s)
and do not necessarily reflect the official position or policies of the U.S. Department of Justice.
follow-up discussions of activities they completed in groups or as a class. These follow-up
discussions generally occurred after a student activity and after students wrote about the activity
in their workbooks. When it came time to discuss the students’ written answers, officers often
had to push for answers by calling on students if there were no volunteers. One observer noted
that this problem was alleviated by the officer changing these discussions so that they were done
as a class and not in small groups, with the officer overseeing all aspects of the follow-up
discussions.
“Compared to the other officers, this officer’s method of doing the review questions as a class, as opposed to giving the students time to answer them independently, generated more discussion. This may be because students may not always understand the questions, but doing it as a class offers the officer the opportunity to paraphrase the questions when necessary. This method is also less time consuming.”
To facilitate discussion, officers should be encouraged to review lessons in advance in
order to be better prepared to highlight lesson goals and objectives. This enhanced familiarity
with the teaching goals of each section would allow the officer to guide the discussions by
informing students about the lesson goals. When students know what to look for from the
beginning of the activity, they may feel more compelled to answer questions afterward as they
would have prepared the answers during the activity. Further, this would give the officer greater
comfort with the material and allow him/her to rephrase questions from the student workbook in
order to encourage student participation in these discussions.
Students appeared to enjoy activities, especially the ones that required getting out of their
chairs and acting in front of the class. One activity that students enjoyed was the “refusal skills
practice” (Lesson 9), which required the officer to give each student a possible peer pressure
scenario which they were to refuse using one of the skills they learned in the program. One
observer noted, “Because both officers and students could be creative in this activity, it tended to
result in students laughing and having a good time.” In one class, the students begged the officer
280
This document is a research report submitted to the U.S. Department of Justice. This report has not been published by the Department. Opinions or points of view expressed are those of the author(s)
and do not necessarily reflect the official position or policies of the U.S. Department of Justice.
to be able to refuse more scenarios. Students also appeared to enjoy other activities, although in
some classes (usually in disordered schools or when teachers were not present) it was often hard
for the officer to keep control of students if they were instructed to complete the activities in
small groups, as the G.R.E.A.T. program suggests.
Student participation tended to be good overall; however, there was a definite pattern of
low student participation in the early morning and in the last class period before school
dismissal. In one class, the schedule was such that the officer began the lesson (about 15
minutes), then had to break for lunch (about 30 minutes) and then return to class to finish the
G.R.E.A.T. lesson (this is a schedule to be avoided). This caused the officer to have to vie for
student attention, and therefore, resulted in less time for the officer to present the material.
Several observers noted that after lunch, the students tended to be more disruptive and it was
hard for the officer to finish the lesson in a timely manner because of student disruptions and bad
behavior.
Overall students seemed to enjoy the program. Across the multiple schools, there was
similarity in the “flow” of the G.R.E.A.T. program. The program tended to start with the
students being shy in front of the officers; however after Lesson 2, student participation
increased. Around Lesson 10, student participation started to wane again. Observers noted
student enthusiasm and participation lessened as the program progressed as indicated by the
following statement, “Students show a definite decline in participation and enthusiasm as
compared to earlier in the program.” Students generally appeared to enjoy learning about gangs
(“Facts and Fictions about Gangs,” in Lesson 2), but did not appear to care as much for the
second half of the program in which they learn anger management skills, how to calm others, and
conflict resolution skills (Lessons 10, 11, and 12). In all classes, student participation was
281
This document is a research report submitted to the U.S. Department of Justice. This report has not been published by the Department. Opinions or points of view expressed are those of the author(s)
and do not necessarily reflect the official position or policies of the U.S. Department of Justice.

enhanced when officers dispersed small prizes for those who participated in discussions and
activities. In the GOT, the facilitators inform the officers that G.R.E.A.T.-logo items can be
found online from the official G.R.E.A.T. website. Some officers used these items, while others
were able to bring items with their department logo, and still other officers would bring small
gifts like pencils and erasers.
Officers may also be able to increase student participation by using “name tents,” which
was a technique suggested in the GOT. These “tents” consist of a piece of construction paper
folded to sit upright or hang over the front of a student’s desk. Students can keep these name
tents in their G.R.E.A.T. workbooks and put them on their desks so that officers can familiarize
themselves with student names. The ability to identify students by name had two positive
consequences: 1) it allowed the officer to better lead class discussion and 2) officers were able to
call specific students out for negative behavior and quickly move on with the lesson. Officers
appeared to encounter more disciplinary problems when they did not know student names and
therefore could not reprimand them or call attention to them during the lessons. In these cases,
the officers would often say things like, “hey, young man in the corner,” which did not
necessarily have the same effect as addressing the student by his/her name. If teachers did not
intervene in these situations, it was not uncommon for the officers to lose control of the students
and the lessons appeared to suffer in quality as a result.
The initial shyness of students that was noted in many of the observations of Lesson One
suggests that officers may want to introduce ice-breaker games in the first and/or second lesson.
Such ice-breakers are intended to increase familiarity and comfort; as students become more
comfortable with the officer they will be more likely to participate in discussions of personal
topics included in the G.R.E.A.T. lessons. Several observers noted that students were
282
This document is a research report submitted to the U.S. Department of Justice. This report has not been published by the Department. Opinions or points of view expressed are those of the author(s)
and do not necessarily reflect the official position or policies of the U.S. Department of Justice.
comfortable with the SROs because they had seen them on the school grounds and had some
prior exposure to these officers. Several examples of potential ice-breaker activities include:
throwing around a bean bag and naming one’s favorite dessert or forming a circle and playing a
short game of catch while naming funny television shows. Such activities would serve to
introduce officers during a fun activity rather than beginning with a formal lesson delivery.
Officer Teaching Characteristics and Interactions with Students
One cannot forget the difficulty officers may have in managing their time between patrol,
SRO and other duties, and teaching the G.R.E.A.T. program. Some of the officers in this study
were school resource officers who were stationed at the school or within a school district and
generally did not focus their time on street patrol duties. In these cases, the main issue these
officers encountered was when they were needed to respond to a school disturbance. When this
occurred, officers left the classroom but usually returned after a short absence to continue
teaching the lesson. This type of interruption did not tend to impact the G.R.E.A.T. lessons as
much as when officers were called back to patrol duty to assist another officer. In a few
instances, observers noted that the regular classroom teacher wrapped up the lesson for the
officer, but the more common situation was for the officers to excuse themselves from the class
and return to that lesson the following week.
Despite these slight interruptions, overall officers did well in the classrooms when
teaching the G.R.E.A.T. program. Even if a particular officer was rated as average or below
average in program implementation, observers still noted that officers were interacting in a
positive manner with students. Officers commonly told stories of juveniles they encountered on
the streets while on patrol and the bad decisions some of these teenagers made. Many officers
283
This document is a research report submitted to the U.S. Department of Justice. This report has not been published by the Department. Opinions or points of view expressed are those of the author(s)
and do not necessarily reflect the official position or policies of the U.S. Department of Justice.
attempted to teach students “life lessons” and be a positive role model for them. One officer put
his name and cell phone number on the chalkboard and told students to write it down and to call
him if they ever needed help or had questions or just needed to talk with someone.
Overall, the majority of officers maintained a positive attitude when teaching and tried to
be a positive influence on the students. Many officers provided examples from their own
childhood and school experiences. One officer told a story about a friend when they were both
teenagers; this officer pointed out that because his friend made bad decisions he ended up in
prison. Another officer shared his story about a time in high school when two friends asked him
to smoke marijuana with them; this officer pointed out that in hindsight they were probably not
such good friends. The officer explained what went through his mind in this situation and how
he said ‘no’ to the offer of drugs.
There were a few observations in which officers made derogatory comments and/or
insensitive remarks toward students. In one class, for instance, the observer wrote the following
commentary:
“Officer still picks on the students and says: ‘I know you’re a rumor-spreader; you look like a rumor-spreader,’ to one girl; a bit of chauvinism/stereotyping going on; when (the officer) gave the scenario, it was two girl students, one who spread a rumor about the other; officer said, ‘cuz it’s always girls, huh?’ Later, ‘guys can just drop it, but not when it comes to girls, eh?’ ‘Guys forget about it in like, what, two minutes, and girls? Girls carry it for two years.’ Most students seem okay with this type of talk, but a few looked uncomfortable, especially when comments were directed at them.”
Recommendations to increase positive relationships between officers and students
include the provision of an officer phone number or general hotline for students to call when they
are facing trouble or need advice. Although one officer gave students his cell phone number, it
might be a better idea for those officers who teach many students to give the non-emergency
phone number to the police station or create a hotline or a designated officer who is to receive
284
This document is a research report submitted to the U.S. Department of Justice. This report has not been published by the Department. Opinions or points of view expressed are those of the author(s)
and do not necessarily reflect the official position or policies of the U.S. Department of Justice.
calls from G.R.E.A.T. students. This potential for interaction between officer and students may
help reinforce the concepts of the G.R.E.A.T. program for students beyond the school year in
which they were taught and allow the positive relationships the officers hope to establish with
students to be maintained over time.
Another recommendation is for officers to stay upbeat and positive. Although the
majority of officers in this study were positive and acted as positive role-models, a few officers
were not quite as positive. We could not determine from the observations if the officers who
made negative comments to students were new, did not like teaching G.R.E.A.T., or if this was
their general demeanor. GOT trainers may want to re-enforce the importance of a positive
presentation of self when the officers are teaching G.R.E.A.T.
Student Final Projects
Based on observer comments, it appeared that the G.R.E.A.T. student projects assigned in
Lesson 1 and due during Lesson 13 did not always go as planned. It was not clear from the
observations if students enjoyed these projects and if they understood how these projects fit into
the G.R.E.A.T. curriculum. The low completion rates of the projects may hint that students did
not understand that this project was to be the culmination of information they learned in the
program and their chance to show others in their schools how to apply what they learned.
Many observers noted that almost half of students in most classes did not complete the
project. The final project is intended to be adaptable to numerous school and community
environments; therefore, officers are instructed in both trainings and the manual that they have
considerable freedom with regard to appropriate G.R.E.A.T. projects. In this regard, some
officers assigned each student an individual project of their choosing, others decided it would be
285
This document is a research report submitted to the U.S. Department of Justice. This report has not been published by the Department. Opinions or points of view expressed are those of the author(s)
and do not necessarily reflect the official position or policies of the U.S. Department of Justice.
better to do one project as a class, one officer turned the project over to the teacher who decided
to complete a class project, and still other officers had students make posters or write a short
paper (1-2 paragraphs) about what they would do if they were to do a project and how they
would complete it. Only one officer did not assign or even address the final project.
Some examples of complications associated with the projects follow. In one class, the
observer noted that 17 out of 25 students did not complete a project. This was a class in which
students were expected to think of, design, and complete their own projects. In another class
where students were also supposed to complete their own projects, the observer noted, “Over
two-thirds of the students did not complete project or take project seriously. The students
laughed about not having completed the project.”
As may be expected, classes that initiated a group project were more likely to complete
the final project than were classes that did individual projects. Completed student projects
included the following: 1) one class implemented an after-school program titled “Stay Active,”
designed to encourage physical fitness and discourage the use of drugs, alcohol, and cigarettes;
2) one student wrote about expanding bus services in the school district to those students not
currently served; 3) another student decided to implement a program called “Making Recycling
Fun,” which was an idea to install a small basketball hoop over recycling bins already in the
schools so students might feel more compelled to recycle paper products; and 4) another student
suggested that the G.R.E.A.T. graduates work with the local police department in order to get
more officers in the schools to increase student safety and “overall peacefulness.”
To increase student project completion rates, officers may want to consider offering
incentives for completing the projects. For example, one officer worked with the classroom
teacher so that those who completed a project received 100 points and those not completing the
286
This document is a research report submitted to the U.S. Department of Justice. This report has not been published by the Department. Opinions or points of view expressed are those of the author(s)
and do not necessarily reflect the official position or policies of the U.S. Department of Justice.
project received no points toward a grade in the class. Another officer offered small prizes to
students who completed their projects. These prizes included G.R.E.A.T. t-shirts, pencils,
erasers, and rulers. Yet another officer told students they must present a project idea or they
would not receive a G.R.E.A.T. graduation party. This appeared to work in that all students
completed the project in that class. Officers might also be encouraged to have students discuss
their projects and challenges throughout the curriculum or to describe projects completed by
previous classes, highlighting the fact that students found these school/community improvements
helpful and useful in their daily lives. Showing students the impact these projects can have on
their communities appears to enhance student interest. This would help reinforce the importance
of the student projects and also provide examples of potential projects to students who are having
difficulty deciding on a project. By being aware of student projects, officers could link lesson
components to the projects, thereby reinforcing how the projects relate to the skills they are
being taught in the G.R.E.A.T. program. Teachers could also be encouraged to remind students
about the importance of completing their projects.
Atypical Situations
In this study, atypical situations occurred when something external to the officer
disrupted the regular flow of the lesson. The most common atypical occurrence was an outside
influence (n=57), such as an activity day schedule, snow day, fire drill, or some other event that
required the school to shorten class periods. Sometimes these shorter periods resulted from field
trips the students took in another class or assemblies that were held at the school which
necessitated the shortening of class periods throughout the day. The weather outside also proved
to be a distraction in classroom that had windows. When it snowed or when it stormed, typically
287
This document is a research report submitted to the U.S. Department of Justice. This report has not been published by the Department. Opinions or points of view expressed are those of the author(s)
and do not necessarily reflect the official position or policies of the U.S. Department of Justice.
student attention was drawn to what was going on outside. One observer noted in Albuquerque
that when it started to snow, students ran over to the windows, which required the officer to take
five minutes out of the lesson delivery. It should be noted that outside influences also occurred
when the officers’ job duties required them to leave during the middle of a lesson in order to
attend to SRO or patrol duties.
Unique and rare outside influences also occurred, such as when a mouse was present in
one classroom during the delivery of an entire lesson. Another officer encountered a group of
school principals from China that was touring the school and stopped in this officer’s class
because they had never before seen police officers in schools. These principals stayed in the
classroom for 30 minutes and asked questions of the officer. When this occurred, the officer was
unable to finish the G.R.E.A.T. lesson in that class.
Another atypical situation was when the class had a substitute teacher (n=14). This was
considered atypical because it usually resulted in the students being more disruptive during the
lesson. Classes tended to be slightly disorganized when substitute teachers were present (causing
lessons to start late). The substitute teachers also were unfamiliar with student names and were
less able to assist the officer with classroom control of student behavior, resulting in some of
these lessons not being completed.
One last example of an atypical situation was the presence of a substitute officer (n=4) in
the classroom. This occurred only at one site where the officers taught the G.R.E.A.T. program
on their days off; however, if they had to go to court or work overtime, another officer would
teach the class at the scheduled time. Having a different officer was considered an atypical
situation because the new officer often did not know student names and sometimes was not
familiar with the particular lesson he/she had to teach that day. The substitute officers were
288
This document is a research report submitted to the U.S. Department of Justice. This report has not been published by the Department. Opinions or points of view expressed are those of the author(s)
and do not necessarily reflect the official position or policies of the U.S. Department of Justice.
G.R.E.A.T.-trained, but observers noted that these officers appeared unsure of their lesson
delivery. This required the substitute officers to proceed slowly through the lessons in
comparison to the officer who regularly taught these classrooms. Importantly, student behavior
did not seem to suffer when there was a substitute officer.
Atypical situations will be omnipresent during the implementation of school-based
programs. This reality should be discussed in the GOT so officers will be better able to adjust to
these unexpected situations. Suggestions could be given by the trainers as to how the officers
could make accommodations in these situations. As mentioned above, one strategy to minimize
the effect of atypical situations is for officers to review their lesson at the beginning of the day so
that they can more readily adjust to atypical situations. While officers generally did not know
when an atypical situation would occur, some situations (e.g., shortened class schedule or change
in school schedule) could be avoided through better communication between the officer and
teacher. The bottom line, however, is that officers need to be flexible and patient with schools,
teachers, and students because things do not always go as planned in the classroom.
Combined Lessons: Why, how, and how often?
Contrary to concerns that had been raised by some of the G.R.E.A.T. Regional
Administrators, we did not find officers combining lessons on a regular basis nor did there
appear to be any systematic pattern to the instances in which lessons were combined. It appears
safe to conclude that when officers did combine lessons, it was in response to external
conditions. In the following paragraphs, we detail these cases in which we observed officers
combine the teaching of two lessons during one class period.
289
This document is a research report submitted to the U.S. Department of Justice. This report has not been published by the Department. Opinions or points of view expressed are those of the author(s)
and do not necessarily reflect the official position or policies of the U.S. Department of Justice.

The combining of lessons was most common in Albuquerque (n=16 lessons combined),
but it was also the site with the most disruption to the school schedule due to an unusually snowy
winter. Three of four officers in this site were observed combining lessons. One officer with a
poor implementation rating accounted for eight of these combined lessons. This particular
officer took a number of personal or vacation days that contributed to the need to combine
lessons in order to finish the program on schedule. Compounding these numerous absences was
the officer’s failure to communicate with either the teachers or the schools about these absences,
resulting in considerable confusion about program delivery. This officer appeared to combine
almost every lesson and therefore did not have any particular lessons that were always combined.
When this officer combined lessons, he usually turned them into a strictly lecture-based format,
with some student discussion, but little or no student activities or group work.
For the other officers in this city, it appeared officers combined lessons toward the end of
the program for either personal reasons or based on their opinions of the core component of each
lesson. One officer combined some of the last lessons because of personal reasons that required
him to be out of the school. Another officer determined that Lessons 12 and 13 should be
combined because Lesson 13 “was just review.” It appeared this officer failed to realize the core
component of Lesson 13 was for students to present their final projects and what they had
learned throughout the program, and not necessarily just to review the entire program.
Two officers in Nashville combined a total of five lessons. However, one officer who
combined two lessons did so because early in the program there were many students absent in
the class. Therefore, when he came the next week, he reviewed the second lesson and then
taught the third lesson in its entirety. In these circumstances, the lesson for the day was within
the estimated time frames, with the review of the prior lesson only taking approximately five to
290
This document is a research report submitted to the U.S. Department of Justice. This report has not been published by the Department. Opinions or points of view expressed are those of the author(s)
and do not necessarily reflect the official position or policies of the U.S. Department of Justice.

ten minutes of class time. This officer combined only Lessons 2 and 3 for this particular
circumstance of having many absences in the class during the previous lesson. The other
Nashville officer combined a total of three lessons because he was under the impression the
program had to be completed by December. When he realized he had until the summer to finish
the program, he discontinued combining lessons. Observers noted on the last combined lesson
checklist that this officer was performing “double duty at the high school,” which required him
to leave the middle school (where he taught the program) on a regular basis. However, this
officer would finish the previous lesson before starting the next lesson.
One officer in Greeley combined Lessons 11 and 12. In this situation, the officer gave
students the definitions of key terms and allowed minimal classroom discussion, but no
activities. Lesson 12 lasted for 18 minutes; we do not know how long Lesson 11 lasted.
One officer in Portland combined four lessons, but this was due to the special nature of
the officer-teaching relationship, where officers from this city taught the program while working
overtime or on days off. Therefore, the lessons were sometimes not delivered every week, based
on the officers’ schedule. Because of this, one officer had other responsibilities, such as patrol
duties, and therefore had to combine lessons near the end of the program in order to be able to
finish before the end of the school year. When this officer combined lessons, it appeared that
s/he was able to still spend almost up to the estimated time frame for each lesson because this
school district had classes that generally lasted from 50 to 65 minutes. Thus, when this officer
combined lessons, it did not affect the time spent on each lesson.
One Chicago officer combined three lessons because he was finishing the previous lesson
before moving on to the next lesson. This officer would teach a lesson until the class period
ended. If there was still part of the lesson remaining, the officer would finish it at the beginning
291
This document is a research report submitted to the U.S. Department of Justice. This report has not been published by the Department. Opinions or points of view expressed are those of the author(s)
and do not necessarily reflect the official position or policies of the U.S. Department of Justice.
of the next class meeting. Therefore, when this officer combined lessons, he did so not to cut-out
content within each lesson, but to thoroughly cover the material within each lesson in its entirety.
To summarize, of the 33 officers observed, eight were noted as combining lessons. With
the exception of one officer, the combining of lessons did not appear to be a calculated attempt to
reduce the length or coverage of G.R.E.A.T. lessons. Rather, the officers taught more than one
lesson in a class period in order to complete the prior lesson (that had not been completed during
the scheduled time) or to accommodate restricted time frames for completing the program. We
should note that, in the course of the evaluation, we heard rumors that officers in one of the
participating agencies had been instructed to teach the program by the book and not to combine
lessons; the supervisor was apparently under the impression that their officers were being
evaluated and wanted his agency to receive a positive review. Clearly this suggests that there
may have been an evaluation bias in this particular site and that officers generally did combine
lessons in this city.
Officer Implementation Fidelity
To determine officer implementation fidelity, we used the qualitative comments from
completed observations and both the on-site and in-house rankings of discussions, activities, time
adherence, coverage of topical areas, and overall quality of the G.R.E.A.T. lesson. The officers
were then placed into one of five categories based on the rankings and qualitative comments.
These categories consisted of: those with poor implementation (n=3), below average
implementation (n=3), average implementation (n=10), above average implementation (n=8),
and excellent implementation (n=9). It is important to highlight that 27 of the 33 officers were
considered to have implemented the G.R.E.A.T. program with average or better than average
292
This document is a research report submitted to the U.S. Department of Justice. This report has not been published by the Department. Opinions or points of view expressed are those of the author(s)
and do not necessarily reflect the official position or policies of the U.S. Department of Justice.
fidelity. That is, if treatment effect is detected in the outcome evaluation, then it would be
feasible to attribute this effect to the G.R.E.A.T. program. Three additional officers delivered
the program with below average fidelity, but students in these classrooms still received a
sufficient amount of the program (dosage) with sufficient fidelity (program adherence) to link
outcome effects to the program. Only three officers failed to teach the program with sufficient
fidelity to reasonably expect the program to have any effect on the students in those classrooms.
Those officers who were determined to have poor implementation (n=3) were deemed to
have not implemented the G.R.E.A.T. program with sufficient fidelity to reasonably expect
program effects. These officers consistently eliminated student discussions and activities, and
tended to deliver the lessons in a lecture format. These officers either failed to cover main
topical areas or failed to complete the lessons. In some of the observed instances, these officers
combined sections within the lessons, so that the topical areas were obscured to the point of not
being recognized by observers.
The three officers judged to have below average implementation of the G.R.E.A.T.
program tended to be inconsistent in their delivery of lessons across classrooms and across
lessons. These officers appeared to suffer from lack of time management skills, therefore
requiring them to omit parts of the lessons, such as discussions and activities. Further, these
officers also tended to exclude some of the topical areas in their delivery of the lesson. All of
these characteristics appeared to be due to poor time management skills, where the officers
would start the lessons and teach the individual sections in order, and then run out of time and
not be able to complete the lesson. These officers did not go back to finish the lessons in the
following class periods. These officers were considered to have implemented the program, but
not well.
293
This document is a research report submitted to the U.S. Department of Justice. This report has not been published by the Department. Opinions or points of view expressed are those of the author(s)
and do not necessarily reflect the official position or policies of the U.S. Department of Justice.
Ten officers were judged to have delivered the program with average implementation
fidelity. These officers tended to have reasonably good time management skills, but this group
included many of the officers that combined two lessons in one class period. Some of these
officers also tended to skip either the Introduction or the Wrap-up sections. Even though these
sections serve as an overview of the lesson and a re-cap of the day’s activities and topics, they
are nonetheless important lesson components. Most officers omitted only one of these sections,
not both. These officers led worthy student activities and students were allowed to participate in
the lesson, discussions, and activities.
The eight officers implementing lessons in an above average fashion tended to do so by
finding a balance between the positive and negative aspects of implementing a school-based
program. For instance, if an officer’s implementation of a lesson was interrupted by a school
fire-drill, then the officer would adapt to the circumstances and cut-out less important aspects of
the lesson, such as the Wrap-up, while still maintaining the integrity of the lesson by covering all
topical areas. These officers tended to have a tight and succinct program delivery and appeared
very knowledgeable and comfortable with the program material. These officers also tended to
use examples from their patrol duties to supplement the lessons’ messages. These officers
covered all topical areas, although some skipped the Wrap-up section if time did not permit.
Further, if these officers were short on time, they tended to adapt the activity to the
circumstances. For example, one officer took a small-group activity and turned it into a
classroom activity where he maintained control of the students and kept them focused while still
allowing all students to participate and learn.
The remaining nine officers exhibited excellent program implementation. These officers
showed great confidence with the G.R.E.A.T. material and were able to deliver lessons without
294
This document is a research report submitted to the U.S. Department of Justice. This report has not been published by the Department. Opinions or points of view expressed are those of the author(s)
and do not necessarily reflect the official position or policies of the U.S. Department of Justice.
referring to the manual or the lesson outline. These officers adapted to atypical circumstances in
the classrooms quickly and with efficiency. Further, these officers tended to correct negative
student behavior without having to disrupt the flow of the lesson. These officers appeared to
benefit from a strong officer-teacher relationship, where the teacher often stepped in to help the
officer with student problems while s/he continued to teach the lesson. These officers showed
enthusiasm about teaching and being in the classroom, were able to answer student questions
without missing a beat, and were able to orchestrate student discussion and activities in spite of
the typical interruptions encountered in the school setting. These officers often brought in small
prizes to reward student participation and often enhanced lessons with examples and stories from
their patrol duties.
CONCLUSION
One major component of the process evaluation of the G.R.E.A.T. program was the
observation of program delivery. During the first two years of the funding period, members of
the evaluation team observed officers teaching the program at the 31 schools participating in the
evaluation (29 schools in AY2006 – 2007 and 2 schools in AY2007 – 2008). A total of 520
G.R.E.A.T. classroom observations provide the data represented in this report. An additional
108 control classrooms were observed to allow for assessment of the possibility of non-random
bias of the sample. Our observations allowed us to conclude that there were no systematic
differences between the G.R.E.A.T. classes and the non-G.R.E.A.T. control classes. As such,
this report focused on the 520 observations of G.R.E.A.T. program delivery. Importantly, we
structured the observation schedules to allow us to assess the fidelity of the program delivery for
classrooms, officers, and lessons. Specifically, all G.R.E.A.T. classrooms were observed a
295
This document is a research report submitted to the U.S. Department of Justice. This report has not been published by the Department. Opinions or points of view expressed are those of the author(s)
and do not necessarily reflect the official position or policies of the U.S. Department of Justice.
minimum of four times; this allows us to categorize each classroom according to its treatment
level. All officers were observed teaching the program an average of 15 times; this allows us to
assess the extent to which each officer adhered to program standards and to rate each officer’s
quality of implementation. Additionally, each lesson was observed an average of 40 times by a
number of different observers across a variety of school settings. This allows us to address
implementation issues associated with each of the 13 G.R.E.A.T. lessons.
Based on the observations summarized above, we provide three summary or concluding
statements about program implementation fidelity. First, we did not observe any systematic
differences in program delivery between different classes taught by the same officer. That is,
each officer appeared to have similar levels of program implementation quality in all of his/her
classrooms. One exception was noted; one officer taught the program in a very disruptive
classroom in which the observers concluded that the program was not delivered. Four other
classrooms taught by this same officer were rated as having average implementation. Second,
with respect to officer level of implementation, there was a high degree of consistency in
observer ratings and assessments of program implement fidelity. As reported above, 27 officers
were rated as implementing the program with average to excellent fidelity, three officers had
below average fidelity scores, and three other officers failed to meet minimum standards of
implementation fidelity. Third, there was considerable consistency in observers’ assessments of
the various lessons. All of the lessons appeared to engage the students, although some lessons
suffered when officers significantly changed the lesson outline by eliminating student
discussions and activities. Of those officers who tended to alter the majority of the lessons they
taught, student behavior appeared to worsen and students did not appear to be grasping the
overall concepts taught within each lesson. However, when officers implemented lessons in an
296
This document is a research report submitted to the U.S. Department of Justice. This report has not been published by the Department. Opinions or points of view expressed are those of the author(s)
and do not necessarily reflect the official position or policies of the U.S. Department of Justice.
average to excellent fashion, students appeared interested in the lessons and tended to complete
the final project. To conclude, our structured observation outline provided guidelines for
observers to record information concerning lesson content, officer adherence to program
components, and student participation/reaction to the program. Based upon 520 observations of
G.R.E.A.T. lessons, we conclude that, if taught with fidelity, the G.R.E.A.T. program is age-
appropriate and keeps students interested and engaged in the program throughout all 13 lessons.
Recommendations
• Open and continued communication between officers and teachers is a necessity.
If the lines of communication are kept open in regard to such things as scheduling
conflicts, illnesses, or situations that preclude the officer from teaching the
G.R.E.A.T. lesson of the day, both officers and teachers will benefit from
knowing this in advance. If the officer has a scheduling conflict or if there is a
schedule change at the school, this information should be conveyed in a timely
manner to allow teachers and officers to better plan their class periods and
program delivery.
• Not only do the lines of communication between officer and teacher need to be
open; they also need to be used. If officers and teachers communicate, officers
will also be able to communicate to teachers potential problems they are having
with students in the class. If teachers know of problems, then they may deal with
them at a time of their choosing, instead of during the G.R.E.A.T. lesson. If lines
of communication stay open before, during, and after school, then teachers may
not have to interrupt lessons to communicate with officers and/or students.
297
This document is a research report submitted to the U.S. Department of Justice. This report has not been published by the Department. Opinions or points of view expressed are those of the author(s)
and do not necessarily reflect the official position or policies of the U.S. Department of Justice.
• Officers are encouraged to review their GOT Manual and/or the lesson(s) they
will be teaching each day in order to reduce the potential that they will skip or
inappropriately adapt sections of the lesson.
• After time in the classroom, officers may unknowingly adapt program material to
their own needs and desires. Although the program is intended to be adaptable to
differing school environments, it appeared that when an officer chose to modify
program elements it was due to choice or an atypical experience. The changes that
come from the latter reason are less worrisome as atypical situations are
unavoidable. However, when officers knowingly or unknowingly adapt the
material to their desires, the program risks losing its skills-building approach.
• Officers need to remember some of the simple ideas they learned in training (e.g.,
the use of name tents and “ice breakers”). Name tents allow officers to call-on
students by name and enable officers to directly address students who are causing
disruptions in the classroom. One goal of the G.R.E.A.T. program is to improve
students’ attitudes toward the police by allowing students to become familiar with
officers in a non-threatening environment. Using name tents to get to know
students can help officers achieve this goal. “Ice breakers” can also assist in
breaking barriers between students and officers. By increasing student comfort
these activities encourage students to participate in class activities and discussions
sooner rather than later in the program.
• As taught in training, officers must remember to leave their stress and outside
problems on the school-house steps. Although it can sometimes be difficult for an
officer not to do, it appeared that when officers made insensitive and/or
298
This document is a research report submitted to the U.S. Department of Justice. This report has not been published by the Department. Opinions or points of view expressed are those of the author(s)
and do not necessarily reflect the official position or policies of the U.S. Department of Justice.
derogatory comments to students, it was out of frustration or due to a negative
attitude toward the lesson or the students.
• Police departments may consider not wasting precious resources on officers by
sending them to training if they are not interested in teaching students the
G.R.E.A.T. program in the first place. If officers are not interested in interacting
with students or if they lack the patience for such tasks, they should be
encouraged to maintain their officer duties and let another officer who appreciates
the subtleties of teaching students attend training and implement the program.
• To increase positive relationships in general between police departments and
middle school students, police departments may want to consider instituting a
phone line for students to call if they need help in non-emergency situations. This
may help students view the entire police department as being helpful and effective
and not just the officer that comes into their school to teach them. This would help
to broaden one of the main goals of the G.R.E.A.T. program in improving officer
and student relationships.
• Finally, officers and teachers may want to discuss the necessity of a final project
for students. If students understand the project is a culmination of what they have
learned over the school year, they may be more apt to complete the project and/or
take it more seriously. In addition, officers should encourage teachers to provide
credit for the final project as those teachers who did offer grades to students for
the projects tended to have higher rates of student participation.
299
This document is a research report submitted to the U.S. Department of Justice. This report has not been published by the Department. Opinions or points of view expressed are those of the author(s)
and do not necessarily reflect the official position or policies of the U.S. Department of Justice.
References Dusenbury, Linda, Rosalind Brannigan, Mathea Falco, William B. Hansen (2003) “A review of
research on fidelity of implementation: Implications for drug abuse prevention in school settings.” Health Education Research, 18(2): 237-56.
Melde, Chris, Finn-Aage Esbensen, Karin Tusinski (2006) “Addressing program fidelity using
onsite observations and program provider descriptions of program delivery.” Evaluation Review, 30(6): 714-40.
Sellers, Christine S., Terrance J. Taylor, Finn-Aage Esbensen (1998) “Reality check: Evaluating
a school-based gang prevention model.” Evaluation Review, 22(5): 590-608. Summerfelt, Wm. Thomas (2003) “Program strength and fidelity in evaluation.” Applied
Developmental Science, 7(2): 55-61.
300
This document is a research report submitted to the U.S. Department of Justice. This report has not been published by the Department. Opinions or points of view expressed are those of the author(s)
and do not necessarily reflect the official position or policies of the U.S. Department of Justice.
National Evaluation of the
Gang Resistance Education and Training (G.R.E.A.T) Program:
2007 Report to Schools and Communities
by
Finn-Aage Esbensen, Ph.D.
Terrance J. Taylor, Ph.D.
Bradley T. Brick, M.A.
Dana Peterson, Ph.D.
This research was made possible, in part, by the support and participation of seven school districts, including the School District of Philadelphia. This project was supported by Award No. 2006-JV-FX-0011 awarded by the National Institute of Justice, Office of Justice Programs, U.S. Department of Justice. We would also like to thank the numerous school administrators, teachers, students, and law enforcement officers for their involvement and assistance in this study. The opinions, findings, and conclusions or recommendations expressed in this publication are those of the authors and do not necessarily reflect the views of the Department of Justice or of the seven participating school districts.
For questions about this report or for more information about the evaluation, please contact:
G.R.E.A.T. Evaluation Department of Criminology & Criminal Justice
University of Missouri-St. Louis St. Louis, MO 63121-4499
Phone: (314) 516-4777 Fax: (314) 516-5048
301
This document is a research report submitted to the U.S. Department of Justice. This report has not been published by the Department. Opinions or points of view expressed are those of the author(s)
and do not necessarily reflect the official position or policies of the U.S. Department of Justice.
We would like to thank the numerous project staff for their work on this study:
Adrienne Freng, Ph.D.
Mountain City Site Coordinator
Research Assistants
Brad Brick
Desiree Coleman
Kelly Cutler
Steven Downing
Erin Flannery
Teri Gulledge
Laura Hastings
Sara Hoover
Joelle Jones
Russell Jewell
Graham Jones
Krystle Leugoud
Nicole Logan
Meredith McKinney
Chris Melde
Nick Miofski
Adrian Molina
Skyler Pimple
Katie Polzer
Zachary Robbins
Aaron Sego
Brad Stevens
Candice Tate
Karin Tusinski
Sarah Young
302
This document is a research report submitted to the U.S. Department of Justice. This report has not been published by the Department. Opinions or points of view expressed are those of the author(s)
and do not necessarily reflect the official position or policies of the U.S. Department of Justice.

The G.R.E.A.T. Lessons
1. Welcome to G.R.E.A.T. – An introductory lessondesigned to provide students with basic knowledgeabout the connection between gangs, violence, drugabuse, and crime
2. What’s the Real Deal? – Designed to help studentslearn ways to analyze information sources anddevelop realistic beliefs about gangs and violence
3. It’s About Us – A lesson to help students learnabout their communities (e.g., family, school,residential area) and their responsibilities
4. Where Do We Go From Here? – Designed to helpstudents learn ways of developing realistic andachievable goals
5. Decisions, Decisions, Decisions – A lesson to helpstudents develop decision-making skills
6. Do You Hear What I Am Saying? – Designed tohelp students develop effective verbal and non-verbal communication skills
7. Walk in Someone Else’s Shoes – A lesson to helpstudents develop active listening and empathyskills, with a particular emphasis on understandingvictims of crime and violence
8. Say It Like You Mean It – Designed to helpstudents develop effective refusal skills
9. Getting Along Without Going Along – A lessonto reinforce and practice the refusal skills learned inLesson 8
10. Keeping Your Cool – A lesson to help studentsunderstand signs of anger and ways to manage theemotion
11. Keeping It Together – Designed to help studentsuse the anger skills learned in Lesson 10 and applythem to interpersonal situations where conflicts andviolence are possible
12. Working It Out – A lesson to help studentsdevelop effective conflict resolution techniques
13. Looking Back – Designed to conclude theG.R.E.A.T. program with an emphasis on theimportance of conflict resolution skills as a way toavoid gangs and violence. Students also presenttheir projects aimed at improving their schools.
The Gang Resistance Education and Training (G.R.E.A.T.) Program
The Gang Resistance Education and
Training (G.R.E.A.T.) program is a gang
and delinquency prevention program
delivered by law enforcement officers
within a school setting. Developed as a
local program in 1991 by Phoenix area law
enforcement agencies, the program quickly
spread throughout the United States. The
original G.R.E.A.T. program operated as a
nine-lesson lecture-based curriculum taught
primarily in middle-school settings.
Results from an earlier National Evaluation
of the G.R.E.A.T. program found no
differences between G.R.E.A.T. and non-
G.R.E.A.T. youths in terms of behavioral
characteristics (i.e., gang membership and
involvement in delinquent behavior).
Based in part on these findings, the
G.R.E.A.T. program underwent a critical
review that resulted in substantial program
modifications. The revised curriculum (see
box at right) consists of 13 lessons aimed at
teaching youths the life-skills (e.g.,
communication and refusal skills, as well as
conflict resolution and anger management
techniques) necessary to prevent
involvement in gang behavior and
delinquency. The revised G.R.E.A.T.
303
This document is a research report submitted to the U.S. Department of Justice. This report has not been published by the Department. Opinions or points of view expressed are those of the author(s)
and do not necessarily reflect the official position or policies of the U.S. Department of Justice.

curriculum was piloted in January 2001 with full-scale implementation occurring the following
year.
The program’s two main goals are:
1. To help youths avoid gang membership, violence, and criminal activity.
2. To help youths develop a positive relationship with law enforcement.
The National Evaluation of G.R.E.A.T.
In 2006, following a competitive peer review process, the National Institute of Justice
awarded the University of Missouri-St. Louis funding to conduct the National Evaluation of the
G.R.E.A.T. program. The evaluation consists of a number of different components, including
student surveys, classroom observations, surveys of teachers and law enforcement officers,
interviews with G.R.E.A.T. officers and G.R.E.A.T. supervisors, and observations of G.R.E.AT.
Officer Training (G.O.T.) and G.R.E.A.T. Family sessions.
The current report provides city-level information obtained from more than 3,600
students enrolled in 186 different classrooms in 29 schools in seven cities across the continental
United States during the 2006-2007 school year. This report is the first of a series of annual
reports intended to provide school personnel, law enforcement, and other interested community
members with information about issues related to youth attitudes and behaviors in their
communities. Data described herein are drawn from the pre-test survey of students (i.e.,
assessments prior to G.R.E.A.T. implementation), which asked students a variety of questions
about students’ attitudes and behaviors associated with gangs, violence, experience with and
perceptions of police. The questions were drawn from a variety of empirical studies assessing
key risk and protective factors associated with youth problem behaviors.
Site Selection
During the summer of 2006, efforts were made to identify cities for inclusion in the
National Evaluation of G.R.E.A.T. Site selection was based upon three main criteria: 1)
existence of an established G.R.E.A.T. program, 2) geographic and demographic diversity, and
3) evidence of gang activity. This site selection process was carried out in a series of steps.
304
This document is a research report submitted to the U.S. Department of Justice. This report has not been published by the Department. Opinions or points of view expressed are those of the author(s)
and do not necessarily reflect the official position or policies of the U.S. Department of Justice.
First, the research staff contacted the G.R.E.A.T. Regional Administrators1 and Bureau of Justice
Assistance2 personnel to identify locales with institutionalized programs. Consideration was
given to factors such as the length of time the program had been in operation, number of
G.R.E.A.T.-trained officers, number of schools in which the program was offered, and the
components of the G.R.E.A.T. program implemented. Second, once this list of agencies was
constructed, the research staff contacted representatives in these cities to obtain more
information about the delivery of the G.R.E.A.T. program. Third, given the focus of the
program, information about gang activity in these potential cities was obtained from the National
Youth Gang Center. Ultimately, a list of seven cities varying in size, region, and level of gang
activity were identified.
Once the cities were selected, the research staff worked with the primary local law
enforcement agency and the school district in each city to secure their cooperation. Upon
district approval, either four or five schools were identified for study participation and principals
were contacted. The goal of the school selection was to identify schools that, taken as a whole,
would be representative of the districts. Once initial agreement to participate was obtained from
the school administrator, more detailed discussions/meetings were held between school
personnel, G.R.E.A.T. officers, and the research team. Whenever possible, face-to-face meetings
were held, but in some instances final arrangements were made via telephone. School and police
personnel were informed of the purpose of the evaluation, issues related to the random
assignment of classrooms to the treatment condition (i.e., receive G.R.E.A.T./not receive
G.R.E.A.T.), procedures to obtain active parental consent for students in these classrooms,
scheduling the G.R.E.A.T. program delivery, and other logistical issues associated with the study
design.
1 G.R.E.A.T. is a national program overseen by the G.R.E.A.T. National Policy Board (NPB). For administrative purposes, responsibilities for program oversight are held by (or “given to”) agencies operating in different geographic regions: Northeast, Midwest, Southeast, Southwest, and West. Additionally, two federal partners—the Bureau of Alcohol, Tobacco, Firearms, and Explosives (BATF) and the Federal Law Enforcement Training Center (FLETC)—are involved in program training and oversight. 2 The Bureau of Justice Assistance (BJA) oversees the allocation of federal funds and grant compliance associated with the G.R.E.A.T. program.
305
This document is a research report submitted to the U.S. Department of Justice. This report has not been published by the Department. Opinions or points of view expressed are those of the author(s)
and do not necessarily reflect the official position or policies of the U.S. Department of Justice.
Student Sample
To maintain the scientific rigor of the evaluation design, in each participating school,
classrooms were randomly assigned to treatment (i.e., G.R.E.A.T.) or control condition. All
students in the selected classrooms were eligible to participate in the evaluation. The 186
participating classrooms had a total of 4,653 students enrolled at the beginning of the data
collection process.
Federal law considers youth under the age of 18 a “special population” requiring
additional safeguards in research. The consent of the youth’s parent/guardian is required for the
youth’s participation in any research study. Parental consent generally takes one of two forms:
1) passive consent (i.e., parents must specify that their child be excluded from participation) or,
2) active consent (i.e., parents must specify that their child be included in participation).
Active parental consent procedures were implemented as part of this evaluation. The
research staff worked closely with the principals and classroom teachers during the consent
process. Teachers distributed and collected “consent form packets.” Each packet included a
cover letter explaining the purpose of the evaluation and an informed consent form (explaining
the risks and benefits of the students’ participation) for parents/guardians to read, sign, and return
to the teacher. When allowed by the districts, the research staff provided monetary
compensation to the teachers directly for their assistance. In some instances, district regulations
prohibited such compensation; in these cases, compensation was provided as a donation to the
school or district made in honor of the teachers. Students were also provided a small personal
radio in exchange for returning a completed consent form. These radios were provided to
students regardless of whether the parent/guardian granted or withheld consent for the youth to
participate in the study. Overall, 89.6 percent of youths (N=4,169) returned a completed consent
form, with 78.9 percent of parents/guardians (N=3,671) allowing their child’s participation.
Table 1 presents the demographic information of the National Evaluation of G.R.E.A.T.
sample for the entire group of youths, as well as separately by site. The sample is evenly split
between males and females, most (56%) youth reside with both biological parents, and the
majority (88%) was born in the United States. The sample is racially/ethnically diverse, with
Hispanic youths representing the modal category (38%). Approximately 2/3 of the youth (62%)
were aged 11 or younger, representing the fact that 24 of the 29 schools delivered the G.R.E.A.T.
program in 6th grade; three schools in Midwest City and one school each in Northeast and
306
This document is a research report submitted to the U.S. Department of Justice. This report has not been published by the Department. Opinions or points of view expressed are those of the author(s)
and do not necessarily reflect the official position or policies of the U.S. Department of Justice.
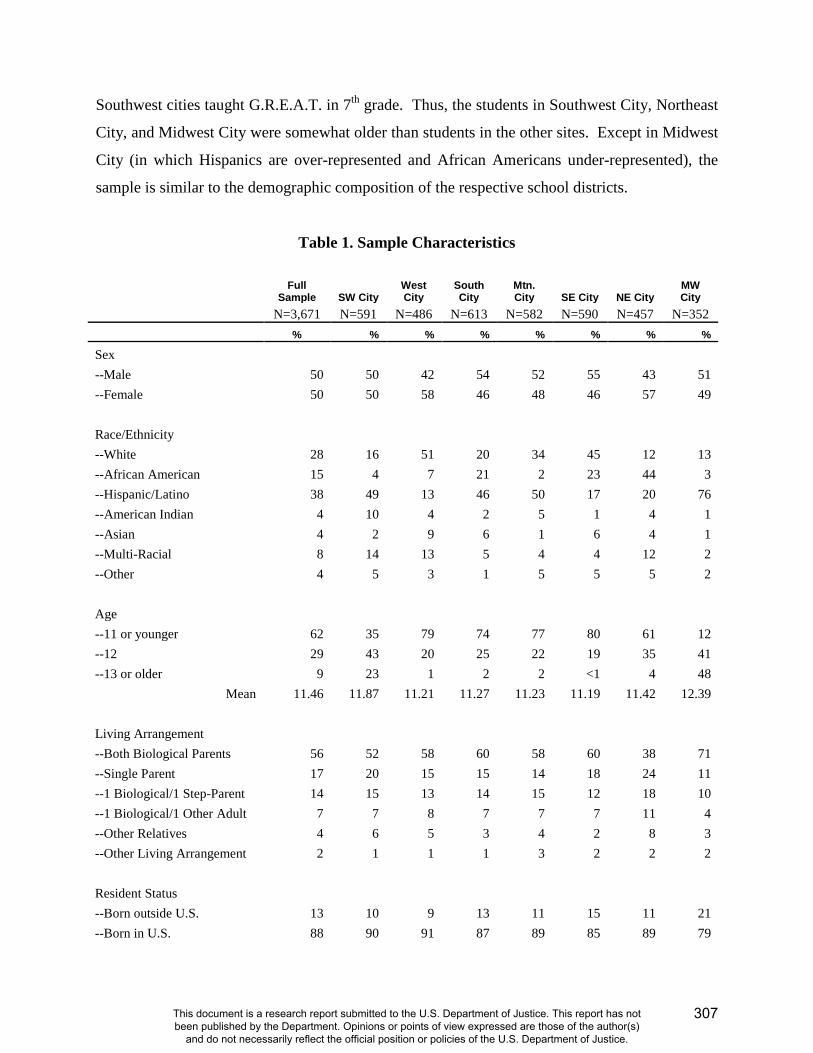
Southwest cities taught G.R.E.A.T. in 7th grade. Thus, the students in Southwest City, Northeast
City, and Midwest City were somewhat older than students in the other sites. Except in Midwest
City (in which Hispanics are over-represented and African Americans under-represented), the
sample is similar to the demographic composition of the respective school districts.
Table 1. Sample Characteristics
Full Sample SW City
West City
South City
Mtn. City SE City NE City
MW City
N=3,671 N=591 N=486 N=613 N=582 N=590 N=457 N=352 % % % % % % % %
Sex --Male 50 50 42 54 52 55 43 51 --Female 50 50 58 46 48 46 57 49
Race/Ethnicity --White 28 16 51 20 34 45 12 13 --African American 15 4 7 21 2 23 44 3 --Hispanic/Latino 38 49 13 46 50 17 20 76 --American Indian 4 10 4 2 5 1 4 1 --Asian 4 2 9 6 1 6 4 1 --Multi-Racial 8 14 13 5 4 4 12 2 --Other 4 5 3 1 5 5 5 2
Age --11 or younger 62 35 79 74 77 80 61 12 --12 29 43 20 25 22 19 35 41 --13 or older 9 23 1 2 2 <1 4 48
Mean 11.46 11.87 11.21 11.27 11.23 11.19 11.42 12.39
Living Arrangement --Both Biological Parents 56 52 58 60 58 60 38 71 --Single Parent 17 20 15 15 14 18 24 11 --1 Biological/1 Step-Parent 14 15 13 14 15 12 18 10 --1 Biological/1 Other Adult 7 7 8 7 7 7 11 4 --Other Relatives 4 6 5 3 4 2 8 3 --Other Living Arrangement 2 1 1 1 3 2 2 2
Resident Status --Born outside U.S. 13 10 9 13 11 15 11 21 --Born in U.S. 88 90 91 87 89 85 89 79
307
This document is a research report submitted to the U.S. Department of Justice. This report has not been published by the Department. Opinions or points of view expressed are those of the author(s)
and do not necessarily reflect the official position or policies of the U.S. Department of Justice.
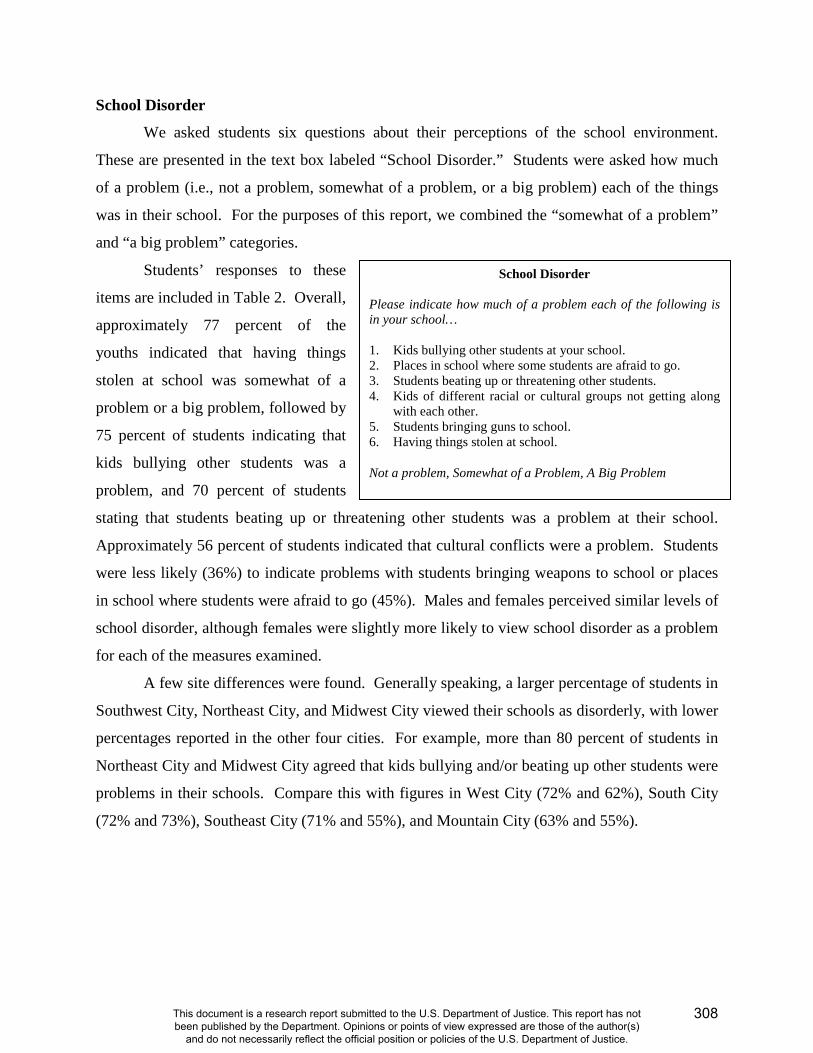
School Disorder
We asked students six questions about their perceptions of the school environment.
These are presented in the text box labeled “School Disorder.” Students were asked how much
of a problem (i.e., not a problem, somewhat of a problem, or a big problem) each of the things
was in their school. For the purposes of this report, we combined the “somewhat of a problem”
and “a big problem” categories.
Students’ responses to these
items are included in Table 2. Overall,
approximately 77 percent of the
youths indicated that having things
stolen at school was somewhat of a
problem or a big problem, followed by
75 percent of students indicating that
kids bullying other students was a
problem, and 70 percent of students
stating that students beating up or threatening other students was a problem at their school.
Approximately 56 percent of students indicated that cultural conflicts were a problem. Students
were less likely (36%) to indicate problems with students bringing weapons to school or places
in school where students were afraid to go (45%). Males and females perceived similar levels of
school disorder, although females were slightly more likely to view school disorder as a problem
for each of the measures examined.
A few site differences were found. Generally speaking, a larger percentage of students in
Southwest City, Northeast City, and Midwest City viewed their schools as disorderly, with lower
percentages reported in the other four cities. For example, more than 80 percent of students in
Northeast City and Midwest City agreed that kids bullying and/or beating up other students were
problems in their schools. Compare this with figures in West City (72% and 62%), South City
(72% and 73%), Southeast City (71% and 55%), and Mountain City (63% and 55%).
School Disorder
Please indicate how much of a problem each of the following is in your school…
1. Kids bullying other students at your school.2. Places in school where some students are afraid to go.3. Students beating up or threatening other students.4. Kids of different racial or cultural groups not getting along
with each other.5. Students bringing guns to school.6. Having things stolen at school.
Not a problem, Somewhat of a Problem, A Big Problem
308
This document is a research report submitted to the U.S. Department of Justice. This report has not been published by the Department. Opinions or points of view expressed are those of the author(s)
and do not necessarily reflect the official position or policies of the U.S. Department of Justice.
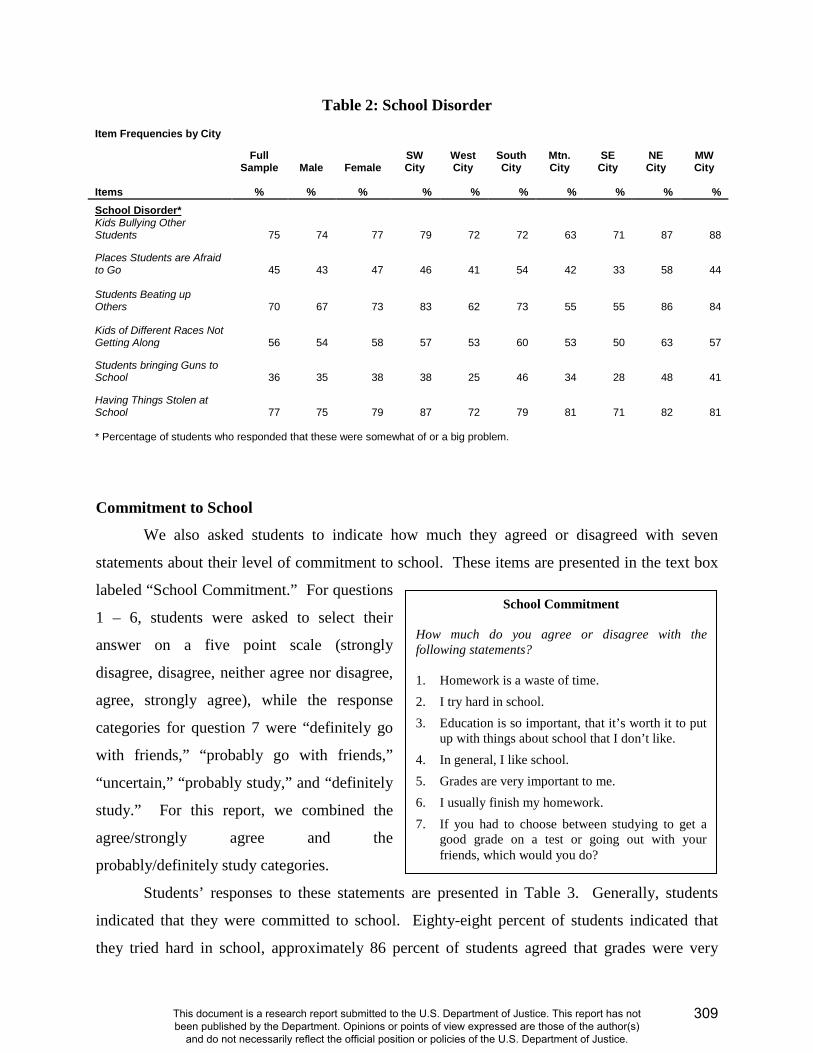
Table 2: School Disorder
Item Frequencies by City
Full Sample Male Female
SW City
West City
South City
Mtn. City
SE City
NE City
MW City
Items % % % % % % % % % % School Disorder* Kids Bullying Other Students 75 74 77 79 72 72 63 71 87 88
Places Students are Afraid to Go 45 43 47 46 41 54 42 33 58 44
Students Beating up Others 70 67 73 83 62 73 55 55 86 84
Kids of Different Races Not Getting Along 56 54 58 57 53 60 53 50 63 57
Students bringing Guns to School 36 35 38 38 25 46 34 28 48 41
Having Things Stolen at School 77 75 79 87 72 79 81 71 82 81
* Percentage of students who responded that these were somewhat of or a big problem.
Commitment to School
We also asked students to indicate how much they agreed or disagreed with seven
statements about their level of commitment to school. These items are presented in the text box
labeled “School Commitment.” For questions
1 – 6, students were asked to select their
answer on a five point scale (strongly
disagree, disagree, neither agree nor disagree,
agree, strongly agree), while the response
categories for question 7 were “definitely go
with friends,” “probably go with friends,”
“uncertain,” “probably study,” and “definitely
study.” For this report, we combined the
agree/strongly agree and the
probably/definitely study categories.
Students’ responses to these statements are presented in Table 3. Generally, students
indicated that they were committed to school. Eighty-eight percent of students indicated that
they tried hard in school, approximately 86 percent of students agreed that grades were very
School Commitment
How much do you agree or disagree with the following statements?
1. Homework is a waste of time.2. I try hard in school.3. Education is so important, that it’s worth it to put
up with things about school that I don’t like.4. In general, I like school.5. Grades are very important to me.6. I usually finish my homework.7. If you had to choose between studying to get a
good grade on a test or going out with yourfriends, which would you do?
309
This document is a research report submitted to the U.S. Department of Justice. This report has not been published by the Department. Opinions or points of view expressed are those of the author(s)
and do not necessarily reflect the official position or policies of the U.S. Department of Justice.
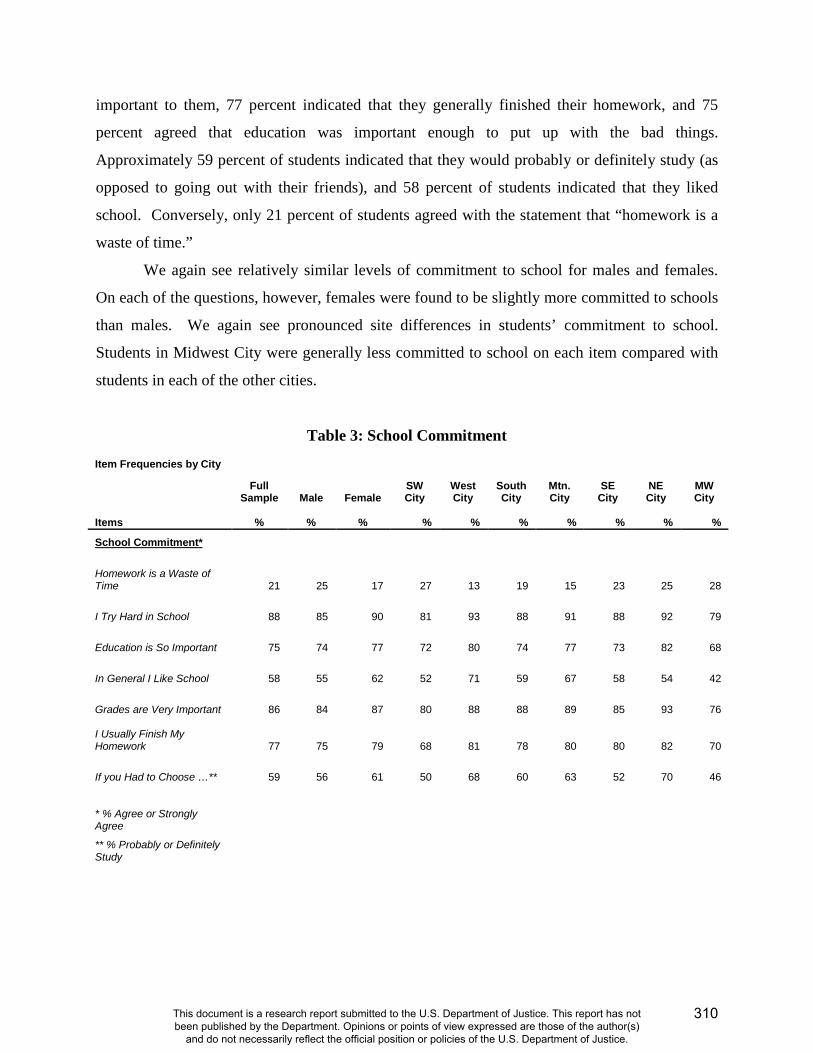
important to them, 77 percent indicated that they generally finished their homework, and 75
percent agreed that education was important enough to put up with the bad things.
Approximately 59 percent of students indicated that they would probably or definitely study (as
opposed to going out with their friends), and 58 percent of students indicated that they liked
school. Conversely, only 21 percent of students agreed with the statement that “homework is a
waste of time.”
We again see relatively similar levels of commitment to school for males and females.
On each of the questions, however, females were found to be slightly more committed to schools
than males. We again see pronounced site differences in students’ commitment to school.
Students in Midwest City were generally less committed to school on each item compared with
students in each of the other cities.
Table 3: School Commitment
Item Frequencies by City
Full Sample Male Female
SW City
West City
South City
Mtn. City
SE City
NE City
MW City
Items % % % % % % % % % %
School Commitment*
Homework is a Waste of Time 21 25 17 27 13 19 15 23 25 28
I Try Hard in School 88 85 90 81 93 88 91 88 92 79
Education is So Important 75 74 77 72 80 74 77 73 82 68
In General I Like School 58 55 62 52 71 59 67 58 54 42
Grades are Very Important 86 84 87 80 88 88 89 85 93 76
I Usually Finish My Homework 77 75 79 68 81 78 80 80 82 70
If you Had to Choose …** 59 56 61 50 68 60 63 52 70 46
* % Agree or StronglyAgree
** % Probably or Definitely Study
310
This document is a research report submitted to the U.S. Department of Justice. This report has not been published by the Department. Opinions or points of view expressed are those of the author(s)
and do not necessarily reflect the official position or policies of the U.S. Department of Justice.

Delinquency, Drug Use, and Gang Membership
Students were also asked
to indicate the number of times in
the past six months that they had
engaged in a number of
delinquent activities, been
involved with gangs, used drugs,
and been victimized. The
questions used to examine these
issues are presented in the text
boxes labeled “Delinquency &
Gang Membership,” “Drug Use,”
and “Victimization.”
Table 4 presents the
percentage of students who
reported engaging in these
behaviors one or more times
during the past six months. Table
5 presents the percentage of
students who answered
affirmatively to the gang
membership questions.
Clearly, these items tap a broad range of offenses, ranging from status offenses to serious,
violent offenses. Given the relatively young age of the sample, it is perhaps not surprising that a
substantial minority of students reported engaging in these activities. The most common
offenses were lying about age and hitting someone (22%) and damaging property (18%). Less
common were things such as skipping school, avoiding paying for things, and stealing something
worth less than $50 (approximately 11% for each offense). Very few students reported
committing offenses such as vandalism, serious theft, burglary, robbery, and drug dealing (5% or
less for each offense).
Delinquency & Gang Membership
Delinquency During the past 6 months, how many times have you… 1. Skipped classes without an excuse?2. Lied about your age to get into some place or to buy something?3. Avoided paying for things such as movies, bus, or subway rides?4. Purposely damaged or destroyed property that did not belong to
you?5. Carried a hidden weapon for protection?6. Illegally spray painted a wall or a building?7. Stolen or tried to steal something worth less than $50?8. Stolen or tried to steal something worth more than $50?9. Gone into or tried to go into a building to steal something?10. Hit someone with the idea of hurting him/her?11. Attacked someone with a weapon?12. Used a weapon or force to get money or things from people?13. Been involved in gang fights?14. Sold marijuana or other illegal drugs? Gang Membership
1. Have you ever been a gang member?
2. Are you now in a gang?
3. Do you consider your group of friends to be a gang?
311
This document is a research report submitted to the U.S. Department of Justice. This report has not been published by the Department. Opinions or points of view expressed are those of the author(s)
and do not necessarily reflect the official position or policies of the U.S. Department of Justice.
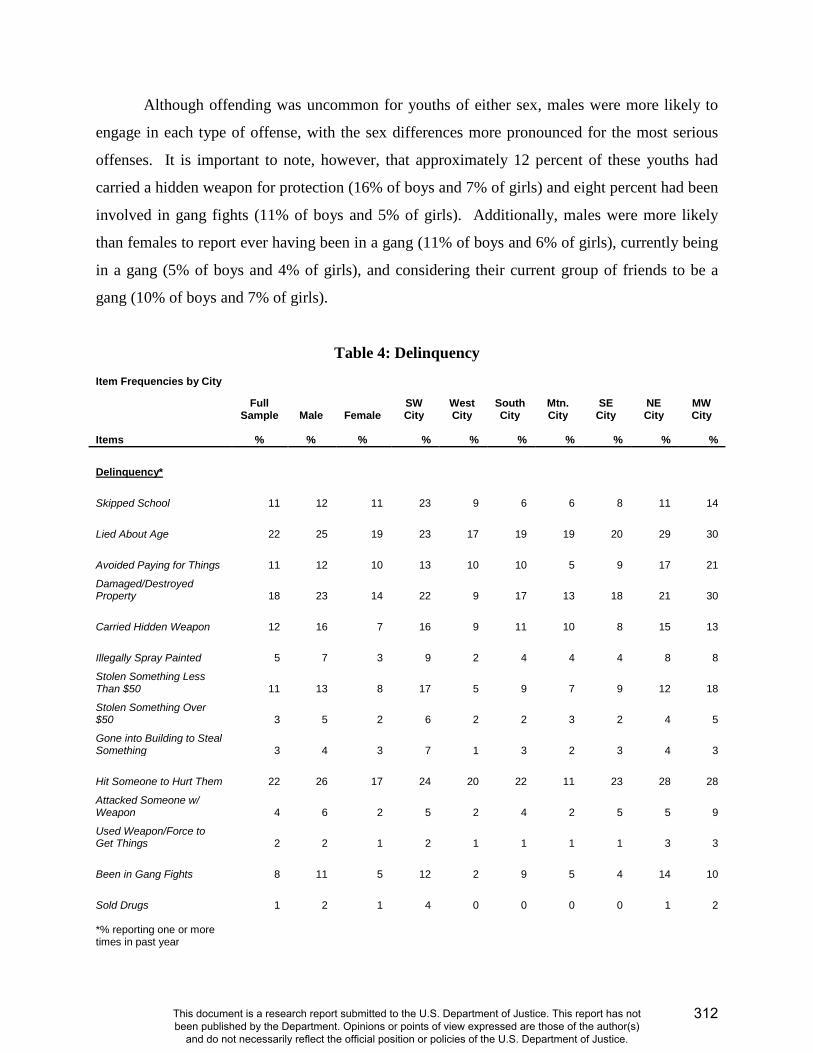
Although offending was uncommon for youths of either sex, males were more likely to
engage in each type of offense, with the sex differences more pronounced for the most serious
offenses. It is important to note, however, that approximately 12 percent of these youths had
carried a hidden weapon for protection (16% of boys and 7% of girls) and eight percent had been
involved in gang fights (11% of boys and 5% of girls). Additionally, males were more likely
than females to report ever having been in a gang (11% of boys and 6% of girls), currently being
in a gang (5% of boys and 4% of girls), and considering their current group of friends to be a
gang (10% of boys and 7% of girls).
Table 4: Delinquency
Item Frequencies by City
Full Sample Male Female
SW City
West City
South City
Mtn. City
SE City
NE City
MW City
Items % % % % % % % % % %
Delinquency*
Skipped School 11 12 11 23 9 6 6 8 11 14
Lied About Age 22 25 19 23 17 19 19 20 29 30
Avoided Paying for Things 11 12 10 13 10 10 5 9 17 21
Damaged/Destroyed Property 18 23 14 22 9 17 13 18 21 30
Carried Hidden Weapon 12 16 7 16 9 11 10 8 15 13
Illegally Spray Painted 5 7 3 9 2 4 4 4 8 8
Stolen Something Less Than $50 11 13 8 17 5 9 7 9 12 18
Stolen Something Over $50 3 5 2 6 2 2 3 2 4 5
Gone into Building to Steal Something 3 4 3 7 1 3 2 3 4 3
Hit Someone to Hurt Them 22 26 17 24 20 22 11 23 28 28
Attacked Someone w/ Weapon 4 6 2 5 2 4 2 5 5 9
Used Weapon/Force to Get Things 2 2 1 2 1 1 1 1 3 3
Been in Gang Fights 8 11 5 12 2 9 5 4 14 10
Sold Drugs 1 2 1 4 0 0 0 0 1 2
*% reporting one or more times in past year
312
This document is a research report submitted to the U.S. Department of Justice. This report has not been published by the Department. Opinions or points of view expressed are those of the author(s)
and do not necessarily reflect the official position or policies of the U.S. Department of Justice.
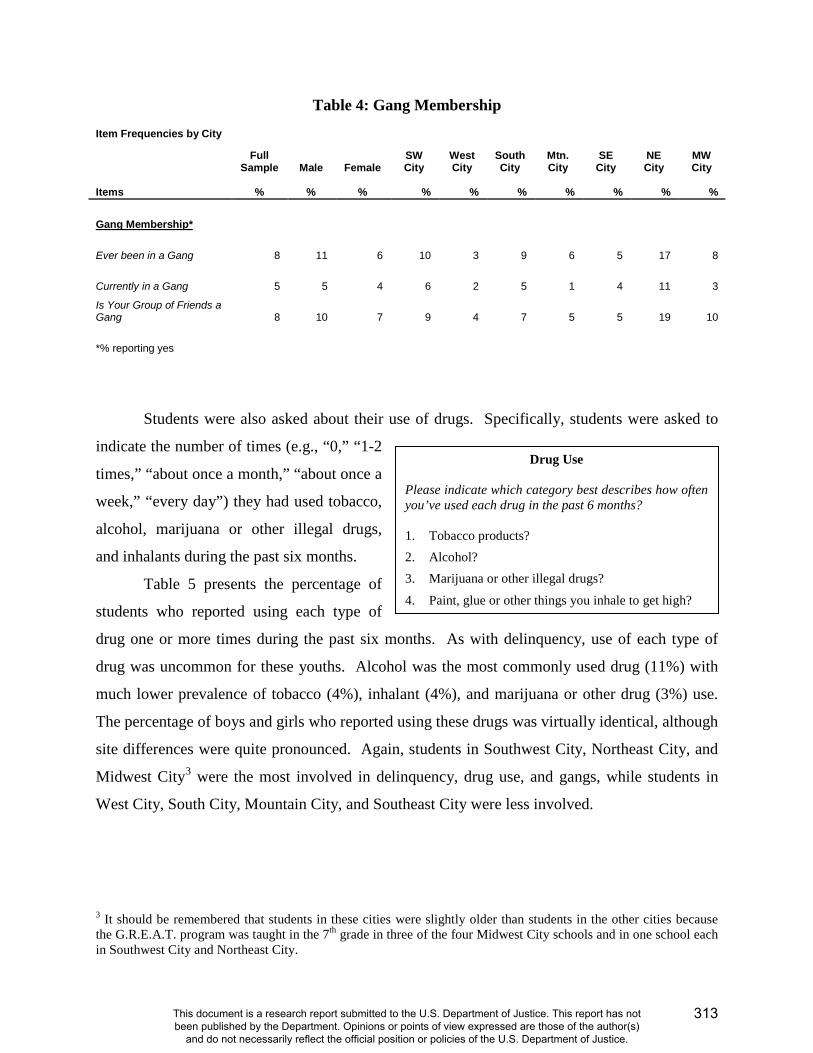
Table 4: Gang Membership
Item Frequencies by City
Full Sample Male Female
SW City
West City
South City
Mtn. City
SE City
NE City
MW City
Items % % % % % % % % % %
Gang Membership*
Ever been in a Gang 8 11 6 10 3 9 6 5 17 8
Currently in a Gang 5 5 4 6 2 5 1 4 11 3
Is Your Group of Friends a Gang 8 10 7 9 4 7 5 5 19 10
*% reporting yes
Students were also asked about their use of drugs. Specifically, students were asked to
indicate the number of times (e.g., “0,” “1-2
times,” “about once a month,” “about once a
week,” “every day”) they had used tobacco,
alcohol, marijuana or other illegal drugs,
and inhalants during the past six months.
Table 5 presents the percentage of
students who reported using each type of
drug one or more times during the past six months. As with delinquency, use of each type of
drug was uncommon for these youths. Alcohol was the most commonly used drug (11%) with
much lower prevalence of tobacco (4%), inhalant (4%), and marijuana or other drug (3%) use.
The percentage of boys and girls who reported using these drugs was virtually identical, although
site differences were quite pronounced. Again, students in Southwest City, Northeast City, and
Midwest City3 were the most involved in delinquency, drug use, and gangs, while students in
West City, South City, Mountain City, and Southeast City were less involved.
3 It should be remembered that students in these cities were slightly older than students in the other cities because the G.R.E.A.T. program was taught in the 7th grade in three of the four Midwest City schools and in one school each in Southwest City and Northeast City.
Drug Use
Please indicate which category best describes how often you’ve used each drug in the past 6 months?
1. Tobacco products?2. Alcohol?3. Marijuana or other illegal drugs?
4. Paint, glue or other things you inhale to get high?
313
This document is a research report submitted to the U.S. Department of Justice. This report has not been published by the Department. Opinions or points of view expressed are those of the author(s)
and do not necessarily reflect the official position or policies of the U.S. Department of Justice.

Table 5: Drug Use
Item Frequencies by City
Full Sample Male Female
SW City
West City
South City
Mtn. City
SE City
NE City
MW City
Items % % % % % % % % % %
Drug Use*
Used Tobacco 4 4 3 8 2 2 3 2 3 6
Drank Alcohol 11 12 10 17 7 9 9 4 7 25
Used Marijuana/Other Drugs 3 3 2 9 1 1 2 1 1 5
Used Paint/Glue/Inhalants 4 4 5 7 2 4 2 5 1 9 *% reporting one or more times in past year
Finally, students were asked about the extent to which they had experienced different
types of victimization, both in school and out of
school, during the prior six months. These
questions again address a range of victimization
experiences, including theft, bullying, assault,
aggravated assault, and robbery. The individual
questions used to assess victimization are
presented in the text box labeled
“Victimization.”
Table 6 presents the percentage of
students who reported having experienced each
type of victimization during the past six months.
Theft was the most common victimization
reported by these students. Forty-eight percent
of students indicated that they had been the
victim of theft while in school and 39 percent
indicated that they had been theft victims
outside of school. In general, students were
Victimization
How many times in the last 6 months have you… School-Related Victimization
1. Been attacked or threatened on your way to or from school?
2. Had your things stolen from you at school?
3. Been attacked or threatened at school?
4. Had mean rumors or lies spread about you at school?
5. Had sexual jokes, comments, or gestures made to you at school?
6. Been made fun of at school because of your looks or the way you talk?
7. Been bullied at school?
Out-of-School Victimization
1. Been hit by someone trying to hurt you?
2. Had someone use a weapon or force to get money or things from you?
3. Been attacked by someone with a weapon or by someone trying to seriously hurt or kill you?
4. Had some of your things stolen from you?
314
This document is a research report submitted to the U.S. Department of Justice. This report has not been published by the Department. Opinions or points of view expressed are those of the author(s)
and do not necessarily reflect the official position or policies of the U.S. Department of Justice.
more likely to report being victims at school, as opposed to being victimized outside of school.
Part of this may be due to the fact that some of the school-related victimizations may be
considered less serious than the out-of-school victimizations. (That is, the out-of-school
victimizations measured are generally violent offenses, while the school-related victimizations
include a broad range of items including rumors or lies, being made fun of, etc.) It is still
important to note the relatively large percentage of students who experienced school-related
victimizations: 44 percent of students reported having mean rumors or lies spread about them, 35
percent had been made fun of for their looks or the way they talked, 25 percent had had sexual
jokes or comments made about them at school, and 21 percent said they had been bullied at
school during the past six months. Violent victimizations were less common at school, but still
noteworthy. Of particular import, 21 percent of students said that they had been attacked or
threatened at school, and 20 percent indicated that this had happened to them on their way to or
from school. Violence outside of school was less common, with robbery and aggravated assault
victimizations particularly rare.
Males were more likely than females to experience serious violent victimization, both in
and out of school. For example, 24 percent of boys had been attacked or threatened on their way
to or from school or while at school, compared with 17 and 18 percent of girls, respectively.
Similarly, six percent of boys had been the victims of aggravated assault and five percent the
victims of robbery (both offenses occurring outside of school), compared with two percent of
girls experiencing these types of serious violent victimization. The percentage of males and
females who reported victimizations such as theft and bullying-type behaviors were similar. The
only type of victimization experienced by girls more than boys was having had mean rumors or
lies spread about them at school: 48 percent of girls, compared with 40 percent of boys, indicated
that this had happened to them in the past six months.
Unlike the clear site differences we saw earlier, victimization experiences seem to be
similar across settings. A slightly greater percentage of students living in Southwest City,
Northeast City, and Midwest City report having experienced most types of victimization
compared with the students in other sites, but the percentage differences across cities are rather
minimal. Thus, it generally appears that students from each site experience similar likelihoods of
being victimized.
315
This document is a research report submitted to the U.S. Department of Justice. This report has not been published by the Department. Opinions or points of view expressed are those of the author(s)
and do not necessarily reflect the official position or policies of the U.S. Department of Justice.
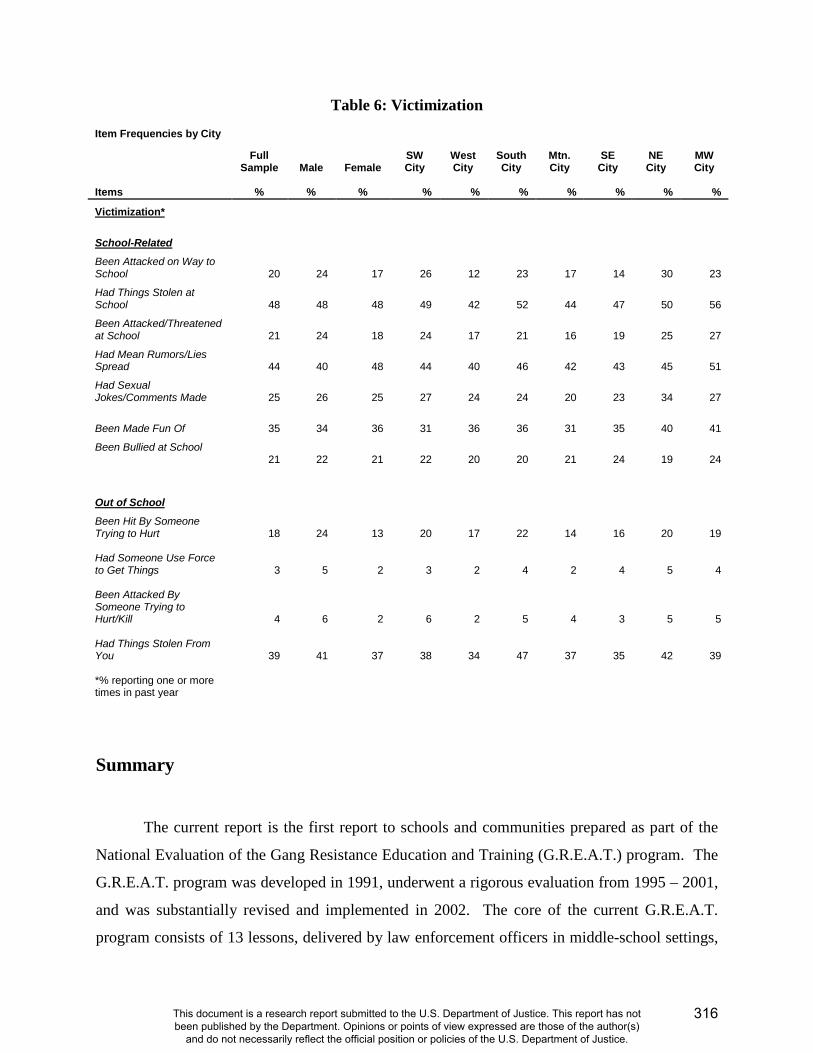
Table 6: Victimization
Item Frequencies by City
Full Sample Male Female
SW City
West City
South City
Mtn. City
SE City
NE City
MW City
Items % % % % % % % % % %
Victimization*
School-Related
Been Attacked on Way to School 20 24 17 26 12 23 17 14 30 23
Had Things Stolen at School 48 48 48 49 42 52 44 47 50 56
Been Attacked/Threatened at School 21 24 18 24 17 21 16 19 25 27
Had Mean Rumors/Lies Spread 44 40 48 44 40 46 42 43 45 51
Had Sexual Jokes/Comments Made 25 26 25 27 24 24 20 23 34 27
Been Made Fun Of 35 34 36 31 36 36 31 35 40 41
Been Bullied at School 21 22 21 22 20 20 21 24 19 24
Out of School
Been Hit By Someone Trying to Hurt 18 24 13 20 17 22 14 16 20 19 Had Someone Use Force to Get Things 3 5 2 3 2 4 2 4 5 4 Been Attacked By Someone Trying to Hurt/Kill 4 6 2 6 2 5 4 3 5 5 Had Things Stolen From You 39 41 37 38 34 47 37 35 42 39 *% reporting one or more times in past year
Summary
The current report is the first report to schools and communities prepared as part of the
National Evaluation of the Gang Resistance Education and Training (G.R.E.A.T.) program. The
G.R.E.A.T. program was developed in 1991, underwent a rigorous evaluation from 1995 – 2001,
and was substantially revised and implemented in 2002. The core of the current G.R.E.A.T.
program consists of 13 lessons, delivered by law enforcement officers in middle-school settings,
316
This document is a research report submitted to the U.S. Department of Justice. This report has not been published by the Department. Opinions or points of view expressed are those of the author(s)
and do not necessarily reflect the official position or policies of the U.S. Department of Justice.
intended to meet two main goals: 1) help youths avoid gang membership, violence, and criminal
activity; and 2) help youths develop a positive relationship with law enforcement.
The University of Missouri-St. Louis is evaluating the current G.R.E.A.T. program in
seven cities. Students have been pre-tested (surveyed prior to implementation of the G.R.E.A.T.
program) and post-tested (surveyed shortly after the G.R.E.A.T. program was completed). We
will continue to follow the same students, surveying them in their current school one time each
year until 2010, to assess the impact that the G.R.E.A.T. program has on students’ attitudes and
behaviors. Program outcomes have not yet been assessed, but these will be shared in the future.
The current report provides descriptive information about some areas of interest for
schools, police, and communities participating in the National Evaluation of G.R.E.A.T.
Specifically, we have focused on issues related to youths’ perceptions of and commitment to
school; their involvement in delinquency, drug use, and gangs; and their victimization
experiences during the prior six months. Our results show that students are generally committed
to school and few of these students are involved in delinquency and drug use. Those students
who are involved in delinquency are generally involved in relatively minor types of offending.
Victimization experienced by these students is generally more common at school, but the types
of victimization typically involve non-violent experiences. A substantial percentage of students,
however, perceive their schools to be disorderly. Perceptions that theft is a problem at school are
particularly salient for these youths. This is consistent with the relatively large percentage of
students who reported having things stolen at school during the prior six months.
Our results also illustrate both similarities and differences between males and females
and between youths residing in different cities. While males and females reported similar
perceptions of school disorder, commitment to school, and drug use, more males were involved
in delinquency, gangs, and serious victimization. Additionally, youths in Southwest City,
Northeast City, and Midwest City were more likely than other youths to view their schools as
disorderly, report lower commitment to school, engage in more delinquency and drug use, and
belong to gangs. Conversely, victimization prevalence was relatively similar across each of the
study settings.
317
This document is a research report submitted to the U.S. Department of Justice. This report has not been published by the Department. Opinions or points of view expressed are those of the author(s)
and do not necessarily reflect the official position or policies of the U.S. Department of Justice.
For more information about the Gang Resistance Education and Training (G.R.E.A.T.) Program,
see the official G.R.E.A.T. website located at http://www.great-online.org/ .
For more information about youth gangs and effective responses, see the official website of the
National Youth Gang Center located at http://www.iir.com/nygc/ .
For more information on the earlier National Evaluation of G.R.E.A.T., consult the following:
Finn-Aage Esbensen. 2004. Evaluating G.R.E.A.T.: A school-based gang prevention program – Research in Policy. Washington, D.C.: U.S. Department of Justice, Office of Justice Programs. Available online at: http://www.ncjrs.gov/pdffiles1/nij/198604.pdf . Esbensen, Finn-Aage, Adrienne Freng, Terrance J. Taylor, Dana Peterson, and D. Wayne Osgood. 2002. The National Evaluation of the Gang Resistance Education and Training (G.R.E.A.T.) Program. Pp.139-167 in Winifred L. Reed and Scott H. Decker (Eds.), Responding to Gangs: Evaluation and Research. Washington, D.C.: U.S. Department of Justice, National Institute of Justice. Available online at: http://www.ncjrs.gov/pdffiles1/nij/190351.pdf . Esbensen, Finn-Aage, D. Wayne Osgood, Terrance J. Taylor, Dana Peterson, and Adrienne Freng. 2001. How Great is G.R.E.A.T.?: Results from a quasi-experimental design. Criminology & Public Policy 1 (1): 87-118. Winfree, L. Thomas, Jr., Dana Peterson Lynskey, and James R. Maupin. 1999. Developing Local Police and Federal Law Enforcement Partnerships: G.R.E.A.T. as a case study of policy implementation. Criminal Justice Review 24 (2): 145-168.
318
This document is a research report submitted to the U.S. Department of Justice. This report has not been published by the Department. Opinions or points of view expressed are those of the author(s)
and do not necessarily reflect the official position or policies of the U.S. Department of Justice.
National Evaluation of the
Gang Resistance Education and Training (G.R.E.A.T) Program
2008 Report to Schools and Communities:
Anti-Social Norms among a
Sample of Middle-School Students
by
Finn-Aage Esbensen, Ph.D.
Dana Peterson, Ph.D.
Terrance J. Taylor, Ph.D.
Vanessa R. Panfil
Bradley T. Brick, M.A.
This research was made possible, in part, by the support and participation of seven school districts, including the School District of Philadelphia. This project was supported by Award No. 2006-JV-FX-0011 awarded by the National Institute of Justice, Office of Justice Programs, U.S. Department of Justice. We would also like to thank the numerous school administrators, teachers, students, and law enforcement officers for their involvement and assistance in this study. The opinions, findings, and conclusions or recommendations expressed in this publication are those of the authors and do not necessarily reflect the views of the Department of Justice or of the seven participating school districts.
For questions about this report or for more information about the evaluation, please contact:
G.R.E.A.T. Evaluation Department of Criminology & Criminal Justice
University of Missouri-St. Louis St. Louis, MO 63121-4499
Phone: (314) 516-4777 Fax: (314) 516-5048
319
This document is a research report submitted to the U.S. Department of Justice. This report has not been published by the Department. Opinions or points of view expressed are those of the author(s)
and do not necessarily reflect the official position or policies of the U.S. Department of Justice.
We would like to thank the numerous project staff for their work on this study:
Adrienne Freng, Ph.D.
Greeley Site Coordinator
Research Assistants
Jared Armstrong
Elizabeth Atwood
Adam Baggett
Brad Brick
Dena Carson
Desiree Coleman
Kelly Cutler
Steven Downing
Erin Flannery
Teri Gulledge
Laura Hastings
Sara Hoover
Joelle Jones
Russell Jewell
Graham Jones
Krystle Leugoud
Nicole Logan
Kristyn McCord
Meredith McKinney
Chris Melde
Nick Miofski
Adrian Molina
Vanessa Panfil
Skyler Pimple
Katie Polzer
Zachary Robbins
Aaron Sego
Brad Stevens
Candice Tate
Mia Taylor
Karin Tusinski
Ben Voss
Sarah Young
320
This document is a research report submitted to the U.S. Department of Justice. This report has not been published by the Department. Opinions or points of view expressed are those of the author(s)
and do not necessarily reflect the official position or policies of the U.S. Department of Justice.
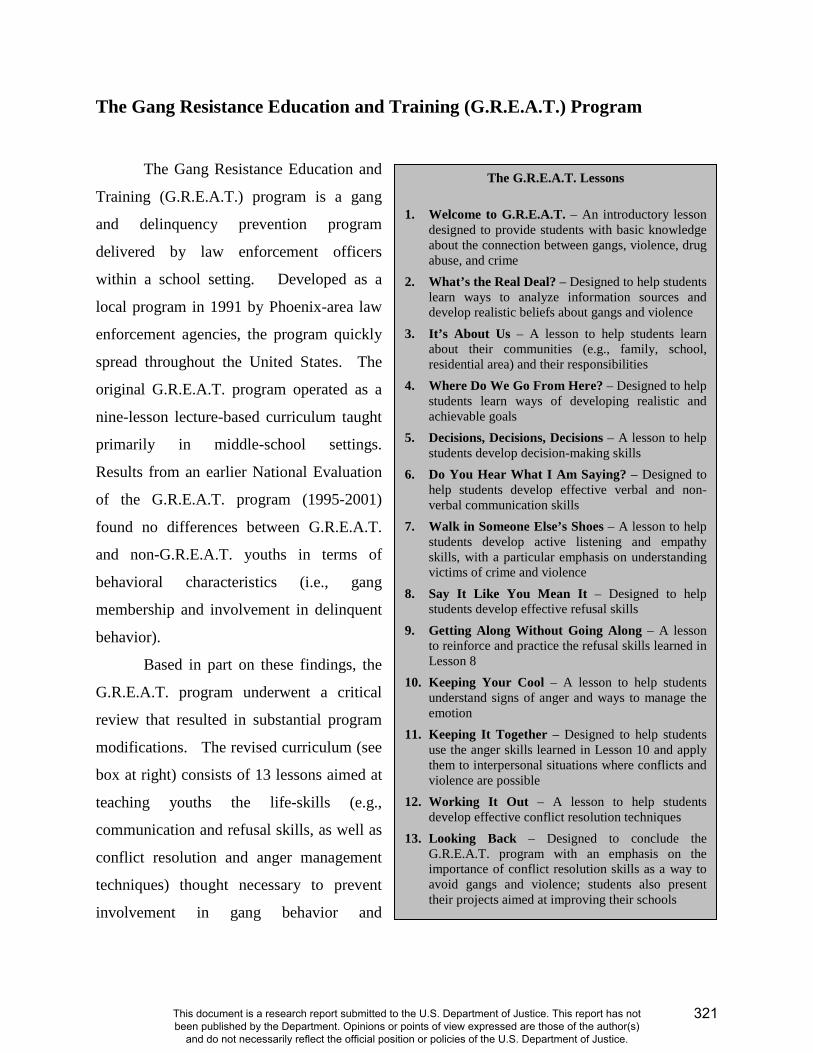
The G.R.E.A.T. Lessons
1. Welcome to G.R.E.A.T. – An introductory lessondesigned to provide students with basic knowledgeabout the connection between gangs, violence, drugabuse, and crime
2. What’s the Real Deal? – Designed to help studentslearn ways to analyze information sources anddevelop realistic beliefs about gangs and violence
3. It’s About Us – A lesson to help students learnabout their communities (e.g., family, school,residential area) and their responsibilities
4. Where Do We Go From Here? – Designed to helpstudents learn ways of developing realistic andachievable goals
5. Decisions, Decisions, Decisions – A lesson to helpstudents develop decision-making skills
6. Do You Hear What I Am Saying? – Designed tohelp students develop effective verbal and non-verbal communication skills
7. Walk in Someone Else’s Shoes – A lesson to helpstudents develop active listening and empathyskills, with a particular emphasis on understandingvictims of crime and violence
8. Say It Like You Mean It – Designed to helpstudents develop effective refusal skills
9. Getting Along Without Going Along – A lessonto reinforce and practice the refusal skills learned inLesson 8
10. Keeping Your Cool – A lesson to help studentsunderstand signs of anger and ways to manage theemotion
11. Keeping It Together – Designed to help studentsuse the anger skills learned in Lesson 10 and applythem to interpersonal situations where conflicts andviolence are possible
12. Working It Out – A lesson to help studentsdevelop effective conflict resolution techniques
13. Looking Back – Designed to conclude theG.R.E.A.T. program with an emphasis on theimportance of conflict resolution skills as a way toavoid gangs and violence; students also presenttheir projects aimed at improving their schools
The Gang Resistance Education and Training (G.R.E.A.T.) Program
The Gang Resistance Education and
Training (G.R.E.A.T.) program is a gang
and delinquency prevention program
delivered by law enforcement officers
within a school setting. Developed as a
local program in 1991 by Phoenix-area law
enforcement agencies, the program quickly
spread throughout the United States. The
original G.R.E.A.T. program operated as a
nine-lesson lecture-based curriculum taught
primarily in middle-school settings.
Results from an earlier National Evaluation
of the G.R.E.A.T. program (1995-2001)
found no differences between G.R.E.A.T.
and non-G.R.E.A.T. youths in terms of
behavioral characteristics (i.e., gang
membership and involvement in delinquent
behavior).
Based in part on these findings, the
G.R.E.A.T. program underwent a critical
review that resulted in substantial program
modifications. The revised curriculum (see
box at right) consists of 13 lessons aimed at
teaching youths the life-skills (e.g.,
communication and refusal skills, as well as
conflict resolution and anger management
techniques) thought necessary to prevent
involvement in gang behavior and
321
This document is a research report submitted to the U.S. Department of Justice. This report has not been published by the Department. Opinions or points of view expressed are those of the author(s)
and do not necessarily reflect the official position or policies of the U.S. Department of Justice.
delinquency. The revised G.R.E.A.T. curriculum was piloted in 2001, with full-scale
implementation occurring in 2003.
The program’s two main goals are:
1. To help youths avoid gang membership, violence, and criminal activity.
2. To help youths develop a positive relationship with law enforcement.
The National Evaluation of G.R.E.A.T. In 2006, following a competitive peer review process, the National Institute of Justice
awarded the University of Missouri-St. Louis funding to conduct the National Evaluation of the
G.R.E.A.T. program. The evaluation consists of a number of different components, including
student surveys; classroom observations in both G.R.E.A.T. and non-G.R.E.A.T. classrooms;
surveys of teachers, school administrators, and law enforcement officers; interviews with
G.R.E.A.T. officers and G.R.E.A.T. supervisors; and observations of G.R.E.AT. Officer Training
(G.O.T.) and G.R.E.A.T. Families sessions.
The current report provides information obtained from more than 3,800 students enrolled
in 195 different classrooms in 31 schools in seven cities across the continental United States
during the 2007-2008 school year. This report is the second in a series of annual reports
intended to provide school personnel, law enforcement, and other interested community
members with information about issues related to self-reported youth attitudes and behaviors in
their schools and communities. With the exception of the sample demographic information, the
data described herein are drawn from the one-year follow-up survey of students (i.e., assessments
one year following G.R.E.A.T. program implementation), conducted during the 2007-08 school
year, which asked students a variety of questions about their attitudes and behaviors associated
with gangs and violence and their experience with and perceptions of police. The survey
questions were drawn from a variety of empirical studies assessing key risk and protective
factors associated with youth problem behaviors. In this year’s report, we focus upon youths’
responses to a series of attitudinal questions that tap “anti-social norms.”
322
This document is a research report submitted to the U.S. Department of Justice. This report has not been published by the Department. Opinions or points of view expressed are those of the author(s)
and do not necessarily reflect the official position or policies of the U.S. Department of Justice.
Site Selection
During the summer of 2006, efforts were made to identify cities for inclusion in the
National Evaluation of G.R.E.A.T. Site selection was based on three main criteria: 1) existence
of an established G.R.E.A.T. program, 2) geographic and demographic diversity, and 3) evidence
of gang activity. This site selection process was carried out in a series of steps. First, the
research staff contacted the G.R.E.A.T. Regional Administrators1 and Bureau of Justice
Assistance2 personnel to identify locales with institutionalized programs. Consideration was
given to factors such as the length of time the program had been in operation, number of
G.R.E.A.T.-trained officers, number of schools in which the program was offered, and the
components of the G.R.E.A.T. program implemented.3 Second, once this list of agencies was
constructed, the research staff contacted representatives in these cities to obtain more
information about the delivery of the G.R.E.A.T. program. Third, given the focus of the
program, information about gang activity in these potential cities was obtained from the National
Youth Gang Center. Ultimately, a list of seven cities varying in size, region, and level of gang
activity were identified: Albuquerque, New Mexico; Chicago, Illinois; Greeley, Colorado;
Nashville, Tennessee; Philadelphia, Pennsylvania; Portland, Oregon; and a Dallas-Fort Worth
(DFW), Texas area location.
Once the cities were selected, the research staff worked with the primary local law
enforcement agency and the school district in each city to secure their cooperation. Upon district
approval, schools were identified for study participation, and principals were contacted. The
goal of the school selection was to identify schools that, taken as a whole, would be
representative of the districts. Once initial agreement to participate was obtained from the school
administrator, more detailed discussions/meetings were held between school personnel,
G.R.E.A.T. officers, and the research team. Whenever possible, face-to-face meetings were
1 G.R.E.A.T. is a national program overseen by the G.R.E.A.T. National Policy Board (NPB). For administrative purposes, responsibilities for program oversight are held by (or “given to”) agencies operating in different geographic regions: Northeast, Midwest, Southeast, Southwest, and West. Additionally, two federal partners—the Bureau of Alcohol, Tobacco, Firearms, and Explosives (BATF) and the Federal Law Enforcement Training Center (FLETC)—are involved in program training and oversight. 2 The Bureau of Justice Assistance (BJA) oversees the allocation of federal funds and grant compliance associated with the G.R.E.A.T. program. 3 In addition to the “core” middle school curriculum described in this report, three additional components are available for communities to adopt: an Elementary School component, a Summer component, and G.R.E.A.T. Families. Funders required the National Evaluation to assess both the middle school and Families components; thus, implementation of these components became part of the site selection criteria.
323
This document is a research report submitted to the U.S. Department of Justice. This report has not been published by the Department. Opinions or points of view expressed are those of the author(s)
and do not necessarily reflect the official position or policies of the U.S. Department of Justice.
held, but in some instances final arrangements were made via telephone. School and police
personnel were informed of the purpose of the evaluation, issues related to the random
assignment of classrooms to the treatment or control condition (i.e., receive G.R.E.A.T./not
receive G.R.E.A.T.), procedures to obtain active parental consent for students in these
classrooms, scheduling G.R.E.A.T. program delivery, and other logistical issues associated with
the study design.
Student Sample
To maintain the scientific rigor of the evaluation design, in each participating school,
classrooms were randomly assigned to the treatment (i.e., G.R.E.A.T.) or control condition. All
students in the selected classrooms were eligible to participate in the evaluation. The 195
participating classrooms had a total of 4,905 students enrolled at the beginning of the data
collection process.
Federal law considers youth under the age of 18 to be a “special population” requiring
additional safeguards in research. The consent of the youth’s parent/guardian is required for the
youth’s participation in any research study. Parental consent generally takes one of two forms:
1) passive consent (i.e., parents must specify in writing that their child be excluded from
participation) or 2) active consent (i.e., parents must specify in writing that their child be
included in participation).
Active parental consent procedures were implemented in this evaluation. The research
staff worked closely with the principals and classroom teachers during the consent process.
Teachers distributed and collected “consent form packets.” Each packet included a cover letter
explaining the purpose of the evaluation and an informed consent form (explaining the risks and
benefits of the students’ participation) for parents/guardians to read, sign, and return to the
teacher. When allowed by the districts, the research staff provided monetary compensation to
the teachers directly for their assistance. In some instances, district regulations prohibited such
compensation; in these cases, compensation was provided as a donation, made in honor of the
teachers, to the school or district. Students were also given a small personal radio, calculator, or
tote bag in exchange for returning a completed consent form. These rewards were provided to
students regardless of whether the parent/guardian granted or withheld consent for the youth to
324
This document is a research report submitted to the U.S. Department of Justice. This report has not been published by the Department. Opinions or points of view expressed are those of the author(s)
and do not necessarily reflect the official position or policies of the U.S. Department of Justice.
participate in the study. Overall, 89.1 percent of youths (N=4,372) returned a completed consent
form, with 77.9 percent of parents/guardians (N=3,820) allowing their child’s participation.
To date, students in all 31 schools have completed pre-test surveys (prior to
implementation of the G.R.E.A.T. program) with a completion rate of 98.3 percent and post-test
surveys (shortly after completion of the G.R.E.A.T. program) with a completion rate of 94.6
percent. Students in 29 of the 31 schools have also completed the first annual follow-up survey
(one year after pre-test surveys were administered) with a completion rate of 83.8 percent. As
discussed in more detail in Footnote 4, below, two additional schools in Chicago were added to
the sample one year after the evaluation began in the other 29 schools; thus, students in those two
new schools have completed pre- and post-tests, but they will not complete their first annual
follow-up survey until the 2008-09 school year.
Student Sample Characteristics
Table 1 presents the demographic information of the National Evaluation of G.R.E.A.T.
sample for the entire group of youths, as well as separately by site, according to students’
responses to the pre-test survey; thus, this table includes information for students in all 31
schools. The sample is evenly split between males and females; most (55%) youths reside with
both biological parents; and the majority (88%) was born in the United States. The sample is
racially/ethnically diverse, with Hispanic youths (37%), White youths (27%), and African-
American (17%) youths accounting for 81 percent of the sample.
Approximately two-thirds of the youths (61%) were aged 11 or younger at the pre-test,
representing the fact that 26 of the 31 schools delivered the G.R.E.A.T. program in 6th grade;
three of the six Chicago schools and two of four schools in Albuquerque taught G.R.E.A.T. in 7th
grade. Thus, the students in Chicago and Albuquerque were somewhat older than students in the
other sites. Except in Chicago (in which Hispanics are over-represented and African Americans
under-represented), the sample is similar to the demographic composition of the respective
school districts.4
4 This disproportionate representation in Chicago occurred despite efforts by the research team to recruit schools that would be representative overall of Chicago Public Schools. One of the five originally-selected schools, which was comprised of nearly 100 percent African American students, was unable to meet the requirements of the study and was dropped from the sample. Given time constraints (i.e., too late in the school year to select a comparable school and implement the program with fidelity), we were unable to replace the excluded school during 2006-2007. Thus, the resulting sample was largely Hispanic, while the district was largely African-American. To increase
325
This document is a research report submitted to the U.S. Department of Justice. This report has not been published by the Department. Opinions or points of view expressed are those of the author(s)
and do not necessarily reflect the official position or policies of the U.S. Department of Justice.
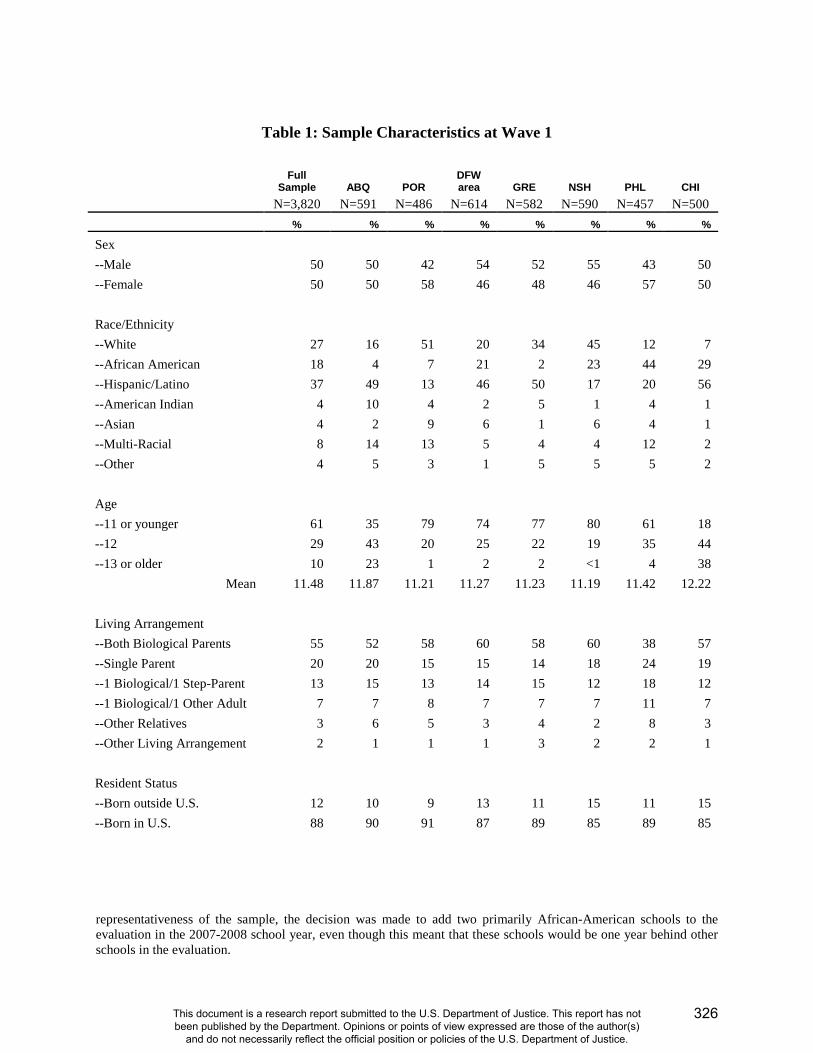
Table 1: Sample Characteristics at Wave 1
Full Sample ABQ POR
DFW area GRE NSH PHL CHI
N=3,820 N=591 N=486 N=614 N=582 N=590 N=457 N=500 % % % % % % % %
Sex --Male 50 50 42 54 52 55 43 50 --Female 50 50 58 46 48 46 57 50 Race/Ethnicity --White 27 16 51 20 34 45 12 7 --African American 18 4 7 21 2 23 44 29 --Hispanic/Latino 37 49 13 46 50 17 20 56 --American Indian 4 10 4 2 5 1 4 1 --Asian 4 2 9 6 1 6 4 1 --Multi-Racial 8 14 13 5 4 4 12 2 --Other 4 5 3 1 5 5 5 2 Age --11 or younger 61 35 79 74 77 80 61 18 --12 29 43 20 25 22 19 35 44 --13 or older 10 23 1 2 2 <1 4 38
Mean 11.48 11.87 11.21 11.27 11.23 11.19 11.42 12.22 Living Arrangement --Both Biological Parents 55 52 58 60 58 60 38 57 --Single Parent 20 20 15 15 14 18 24 19 --1 Biological/1 Step-Parent 13 15 13 14 15 12 18 12 --1 Biological/1 Other Adult 7 7 8 7 7 7 11 7 --Other Relatives 3 6 5 3 4 2 8 3 --Other Living Arrangement 2 1 1 1 3 2 2 1 Resident Status --Born outside U.S. 12 10 9 13 11 15 11 15 --Born in U.S. 88 90 91 87 89 85 89 85
representativeness of the sample, the decision was made to add two primarily African-American schools to the evaluation in the 2007-2008 school year, even though this meant that these schools would be one year behind other schools in the evaluation.
326
This document is a research report submitted to the U.S. Department of Justice. This report has not been published by the Department. Opinions or points of view expressed are those of the author(s)
and do not necessarily reflect the official position or policies of the U.S. Department of Justice.
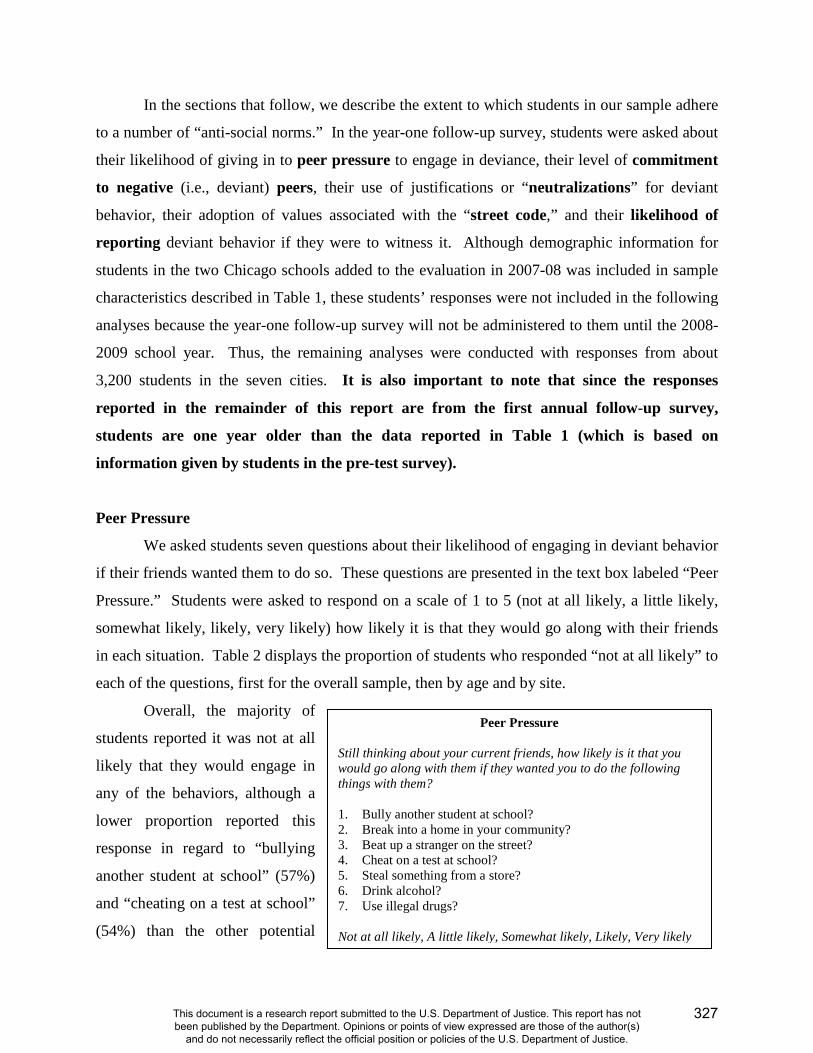
In the sections that follow, we describe the extent to which students in our sample adhere
to a number of “anti-social norms.” In the year-one follow-up survey, students were asked about
their likelihood of giving in to peer pressure to engage in deviance, their level of commitment
to negative (i.e., deviant) peers, their use of justifications or “neutralizations” for deviant
behavior, their adoption of values associated with the “street code,” and their likelihood of
reporting deviant behavior if they were to witness it. Although demographic information for
students in the two Chicago schools added to the evaluation in 2007-08 was included in sample
characteristics described in Table 1, these students’ responses were not included in the following
analyses because the year-one follow-up survey will not be administered to them until the 2008-
2009 school year. Thus, the remaining analyses were conducted with responses from about
3,200 students in the seven cities. It is also important to note that since the responses
reported in the remainder of this report are from the first annual follow-up survey,
students are one year older than the data reported in Table 1 (which is based on
information given by students in the pre-test survey).
Peer Pressure
We asked students seven questions about their likelihood of engaging in deviant behavior
if their friends wanted them to do so. These questions are presented in the text box labeled “Peer
Pressure.” Students were asked to respond on a scale of 1 to 5 (not at all likely, a little likely,
somewhat likely, likely, very likely) how likely it is that they would go along with their friends
in each situation. Table 2 displays the proportion of students who responded “not at all likely” to
each of the questions, first for the overall sample, then by age and by site.
Overall, the majority of
students reported it was not at all
likely that they would engage in
any of the behaviors, although a
lower proportion reported this
response in regard to “bullying
another student at school” (57%)
and “cheating on a test at school”
(54%) than the other potential
Peer Pressure
Still thinking about your current friends, how likely is it that you would go along with them if they wanted you to do the following things with them? 1. Bully another student at school? 2. Break into a home in your community? 3. Beat up a stranger on the street? 4. Cheat on a test at school? 5. Steal something from a store? 6. Drink alcohol? 7. Use illegal drugs? Not at all likely, A little likely, Somewhat likely, Likely, Very likely
327
This document is a research report submitted to the U.S. Department of Justice. This report has not been published by the Department. Opinions or points of view expressed are those of the author(s)
and do not necessarily reflect the official position or policies of the U.S. Department of Justice.
behaviors. Very few youths reported that it was “likely” or “very likely” that they would give in
to peer pressure and go along with friends (these results not shown in Table 2). The largest
proportion was for cheating on a test: twelve percent of students indicated it was likely/very
likely they would do this if friends wanted them to. Approximately seven percent of students
indicated that it was likely or very likely they would go along with friends if they wanted to bully
another student at school or that they would drink alcohol with friends.
Differences between students of different ages5 were found, as can be seen in Table 2.
Twelve-year-olds in the sample were less likely than 14-year-olds to report that they would
engage in any of the potential behaviors. Likelihood of drinking alcohol represents the greatest
disparity between the two age groups, with 85 percent of 12-year-olds and only 57 percent of 14-
year-olds reporting that they were “not at all likely” to engage in this behavior if their friends
wanted them to. Looking at the other end of the spectrum—the proportion of students who said
it was either “likely” or “very likely” they would engage in the behaviors (results not shown in
table)—the largest difference between the age groups is seen for cheating on a test: one-fifth
(20%) of 14-year-olds reported it was likely that they would do this if friends wanted them to,
compared to just seven percent of 12-year-olds.
The results by site show that, overall, with three exceptions, the majority of youths (over
50%) in all sites indicated they would not give in to peer pressure to commit deviance. The
behaviors with the biggest range across sites were cheating on a test and drinking alcohol.
Greeley had the highest percentage of students (63%) who reported it was “not at all likely” that
they would cheat on a test if their friends wanted them to, while Chicago had the lowest
percentage of students (36%) who responded this way. As for drinking alcohol, Nashville had the
highest percentage of youths (86%) who reported it was “not at all likely” that they would drink
alcohol if their friends wanted them to, and again, Chicago had the lowest percentage of youths
(58%) who responded this way. This is not to say, however, that Chicago youths were the least
pro-social on all of the items, as Albuquerque had the smallest proportion of youths stating it was
“not at all likely” they would give in to peer pressure for three of the behaviors (breaking into a
home, beating up a stranger, and using illegal drugs).
5 Throughout this report, results for 13-year-old students are not presented in the tables. The interest here is to demonstrate the differences between the youngest and oldest students in the sample.
328
This document is a research report submitted to the U.S. Department of Justice. This report has not been published by the Department. Opinions or points of view expressed are those of the author(s)
and do not necessarily reflect the official position or policies of the U.S. Department of Justice.
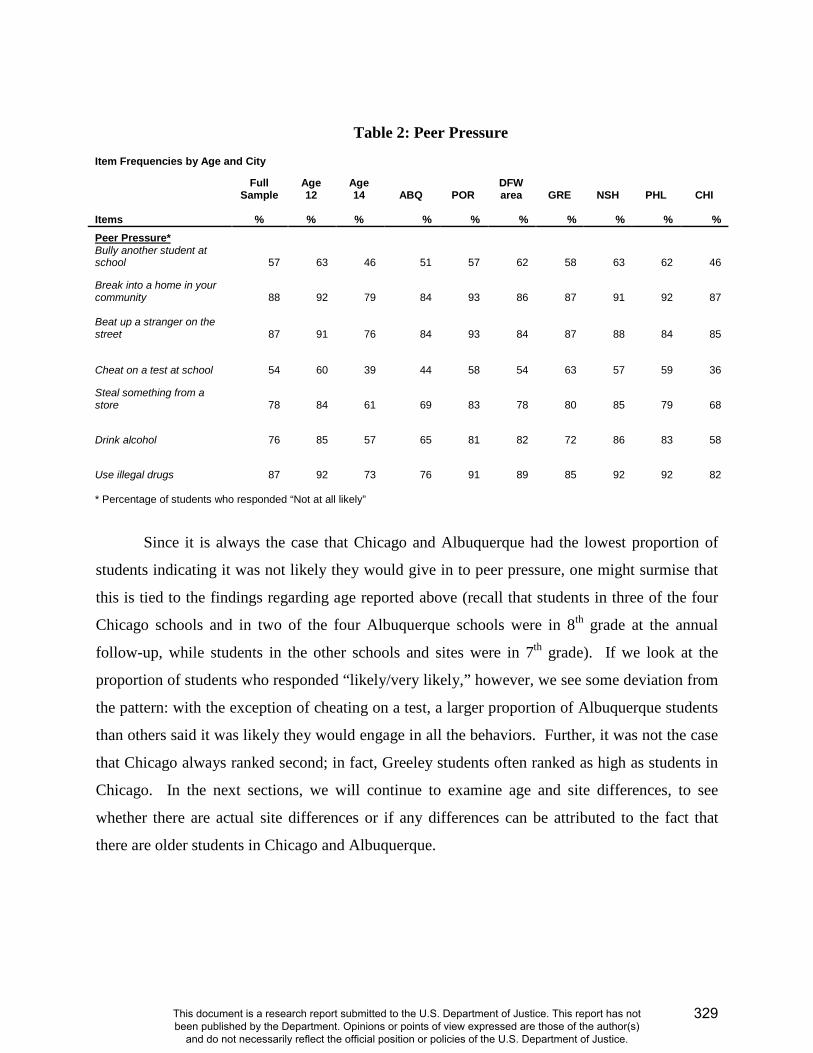
Table 2: Peer Pressure
Item Frequencies by Age and City
Full Sample
Age 12
Age 14 ABQ POR
DFW area GRE NSH PHL CHI
Items % % % % % % % % % % Peer Pressure* Bully another student at school 57 63 46 51 57 62 58 63 62 46
Break into a home in your community 88 92 79 84 93 86 87 91 92 87 Beat up a stranger on the street 87 91 76 84 93 84 87 88 84 85
Cheat on a test at school 54 60 39 44 58 54 63 57 59 36
Steal something from a store 78 84 61 69 83 78 80 85 79 68
Drink alcohol 76 85 57 65 81 82 72 86 83 58
Use illegal drugs 87 92 73 76 91 89 85 92 92 82 * Percentage of students who responded “Not at all likely”
Since it is always the case that Chicago and Albuquerque had the lowest proportion of
students indicating it was not likely they would give in to peer pressure, one might surmise that
this is tied to the findings regarding age reported above (recall that students in three of the four
Chicago schools and in two of the four Albuquerque schools were in 8th grade at the annual
follow-up, while students in the other schools and sites were in 7th grade). If we look at the
proportion of students who responded “likely/very likely,” however, we see some deviation from
the pattern: with the exception of cheating on a test, a larger proportion of Albuquerque students
than others said it was likely they would engage in all the behaviors. Further, it was not the case
that Chicago always ranked second; in fact, Greeley students often ranked as high as students in
Chicago. In the next sections, we will continue to examine age and site differences, to see
whether there are actual site differences or if any differences can be attributed to the fact that
there are older students in Chicago and Albuquerque.
329
This document is a research report submitted to the U.S. Department of Justice. This report has not been published by the Department. Opinions or points of view expressed are those of the author(s)
and do not necessarily reflect the official position or policies of the U.S. Department of Justice.
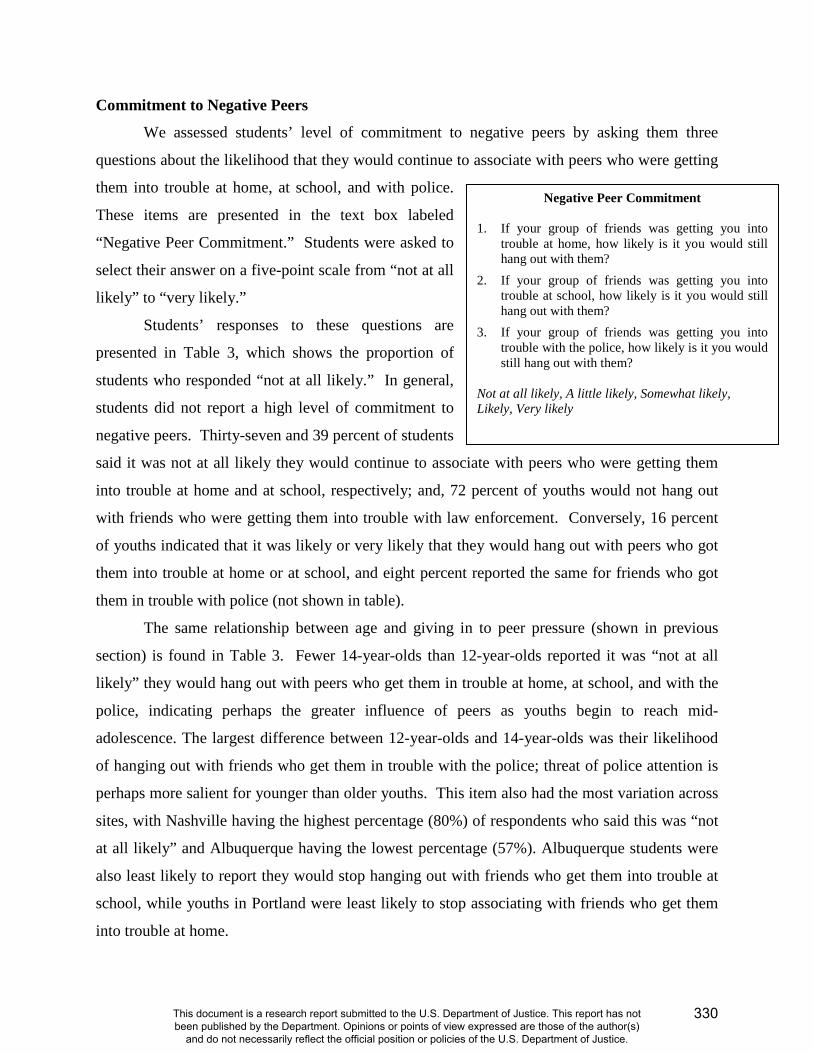
Commitment to Negative Peers
We assessed students’ level of commitment to negative peers by asking them three
questions about the likelihood that they would continue to associate with peers who were getting
them into trouble at home, at school, and with police.
These items are presented in the text box labeled
“Negative Peer Commitment.” Students were asked to
select their answer on a five-point scale from “not at all
likely” to “very likely.”
Students’ responses to these questions are
presented in Table 3, which shows the proportion of
students who responded “not at all likely.” In general,
students did not report a high level of commitment to
negative peers. Thirty-seven and 39 percent of students
said it was not at all likely they would continue to associate with peers who were getting them
into trouble at home and at school, respectively; and, 72 percent of youths would not hang out
with friends who were getting them into trouble with law enforcement. Conversely, 16 percent
of youths indicated that it was likely or very likely that they would hang out with peers who got
them into trouble at home or at school, and eight percent reported the same for friends who got
them in trouble with police (not shown in table).
The same relationship between age and giving in to peer pressure (shown in previous
section) is found in Table 3. Fewer 14-year-olds than 12-year-olds reported it was “not at all
likely” they would hang out with peers who get them in trouble at home, at school, and with the
police, indicating perhaps the greater influence of peers as youths begin to reach mid-
adolescence. The largest difference between 12-year-olds and 14-year-olds was their likelihood
of hanging out with friends who get them in trouble with the police; threat of police attention is
perhaps more salient for younger than older youths. This item also had the most variation across
sites, with Nashville having the highest percentage (80%) of respondents who said this was “not
at all likely” and Albuquerque having the lowest percentage (57%). Albuquerque students were
also least likely to report they would stop hanging out with friends who get them into trouble at
school, while youths in Portland were least likely to stop associating with friends who get them
into trouble at home.
Negative Peer Commitment 1. If your group of friends was getting you into
trouble at home, how likely is it you would still hang out with them?
2. If your group of friends was getting you into trouble at school, how likely is it you would still hang out with them?
3. If your group of friends was getting you into trouble with the police, how likely is it you would still hang out with them?
Not at all likely, A little likely, Somewhat likely, Likely, Very likely
330
This document is a research report submitted to the U.S. Department of Justice. This report has not been published by the Department. Opinions or points of view expressed are those of the author(s)
and do not necessarily reflect the official position or policies of the U.S. Department of Justice.

Table 3: Commitment to Negative Peers
Item Frequencies by Age and City
Full Sample
Age 12
Age 14 ABQ POR
DFW area GRE NSH PHL CHI
Items % % % % % % % % % % Negative Peer Commitment* Friends getting you into trouble at home, still hang out with them? 37 39 28 30 25 44 41 39 43 35 Friends getting you into trouble at school, still hang out with them? 39 42 29 29 32 44 43 40 47 38 Friends getting you into trouble with police, still hang out with them? 72 79 54 57 76 77 71 80 76 68 * % “Not at all likely”
The whole story is not told, however, by looking just at the “not at all likely” responses.
Looking at the proportion of students who indicated commitment to negative peers by
responding that it was “likely/very likely” they would still hang out with them (not shown in
table), we see that the greatest proportion for home and law enforcement items was found among
Albuquerque students, while for school, Greeley students comprised the greatest proportion.
Greeley students also made up the second-largest proportion of those who would still hang out
with friends getting them in trouble at home or with police. Thus, differences between sites are
not necessarily tied to age, as there are site differences beyond the differences we would expect
by age. That is, if differences were due solely to students’ age, we would expect that Chicago
students, followed by students in Albuquerque, would be the least likely in Table 3 to report they
would stop hanging out with friends who got them in trouble and most likely to report that they
would continue to hang out with them; this is not the case.
331
This document is a research report submitted to the U.S. Department of Justice. This report has not been published by the Department. Opinions or points of view expressed are those of the author(s)
and do not necessarily reflect the official position or policies of the U.S. Department of Justice.
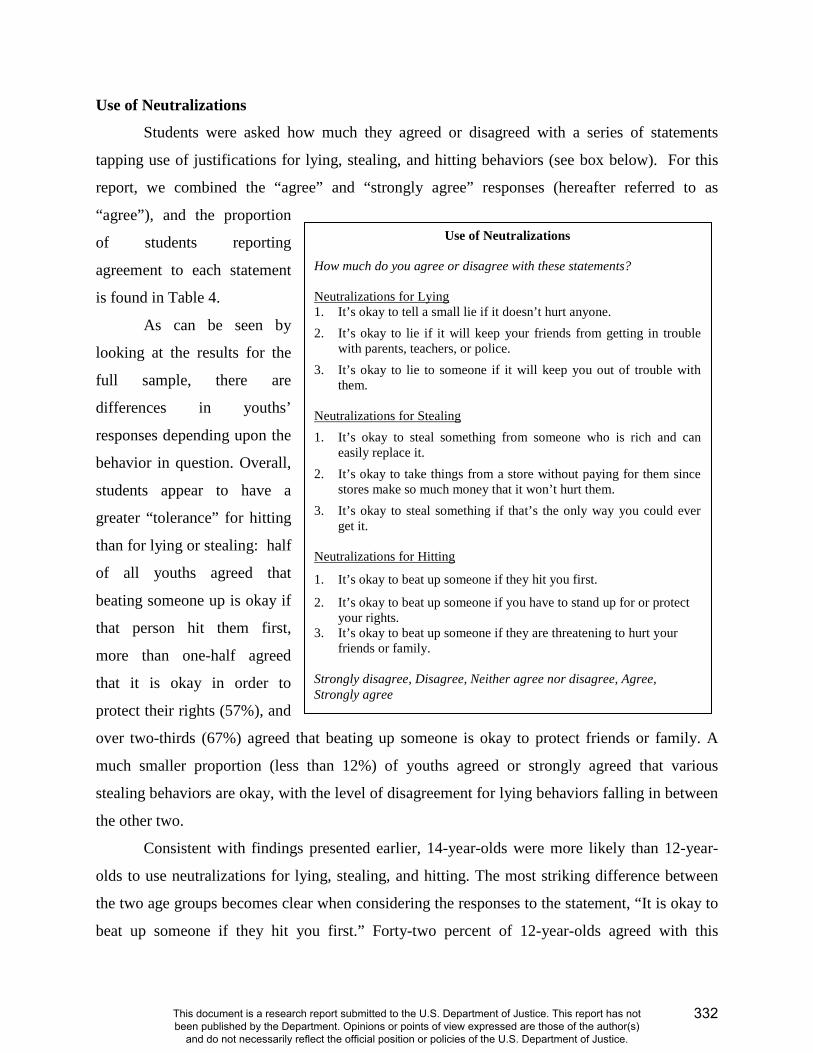
Use of Neutralizations
Students were asked how much they agreed or disagreed with a series of statements
tapping use of justifications for lying, stealing, and hitting behaviors (see box below). For this
report, we combined the “agree” and “strongly agree” responses (hereafter referred to as
“agree”), and the proportion
of students reporting
agreement to each statement
is found in Table 4.
As can be seen by
looking at the results for the
full sample, there are
differences in youths’
responses depending upon the
behavior in question. Overall,
students appear to have a
greater “tolerance” for hitting
than for lying or stealing: half
of all youths agreed that
beating someone up is okay if
that person hit them first,
more than one-half agreed
that it is okay in order to
protect their rights (57%), and
over two-thirds (67%) agreed that beating up someone is okay to protect friends or family. A
much smaller proportion (less than 12%) of youths agreed or strongly agreed that various
stealing behaviors are okay, with the level of disagreement for lying behaviors falling in between
the other two.
Consistent with findings presented earlier, 14-year-olds were more likely than 12-year-
olds to use neutralizations for lying, stealing, and hitting. The most striking difference between
the two age groups becomes clear when considering the responses to the statement, “It is okay to
beat up someone if they hit you first.” Forty-two percent of 12-year-olds agreed with this
Use of Neutralizations How much do you agree or disagree with these statements? Neutralizations for Lying 1. It’s okay to tell a small lie if it doesn’t hurt anyone.
2. It’s okay to lie if it will keep your friends from getting in trouble with parents, teachers, or police.
3. It’s okay to lie to someone if it will keep you out of trouble with them.
Neutralizations for Stealing
1. It’s okay to steal something from someone who is rich and can easily replace it.
2. It’s okay to take things from a store without paying for them since stores make so much money that it won’t hurt them.
3. It’s okay to steal something if that’s the only way you could ever get it.
Neutralizations for Hitting
1. It’s okay to beat up someone if they hit you first.
2. It’s okay to beat up someone if you have to stand up for or protect your rights.
3. It’s okay to beat up someone if they are threatening to hurt your friends or family.
Strongly disagree, Disagree, Neither agree nor disagree, Agree, Strongly agree
332
This document is a research report submitted to the U.S. Department of Justice. This report has not been published by the Department. Opinions or points of view expressed are those of the author(s)
and do not necessarily reflect the official position or policies of the U.S. Department of Justice.
statement, while 69 percent of 14-year-olds responded this way (a difference of 27%). There was
also a sizable difference of 23 percent between 12- and 14-year-olds in their responses to “It is
OK to tell a lie if it will keep your friends out of trouble.” Although there were some relatively
large differences between the 12- and 14-year-olds, the smallest differences were for the
“stealing” neutralizations. In short, stealing is not only the least acceptable form of the three
deviant behaviors to neutralize, but there is less variation across age for stealing than for the
other two forms of behavior.
In terms of site differences, the widest variation again occurs within responses to the
acceptability of beating up someone if they hit you first. Albuquerque students were the most
likely to agree, while Portland youths were the least likely to agree (65% and 36%, respectively).
On the whole, students in Philadelphia, Albuquerque, and Chicago were considerably more
likely to use neutralizations than students in the other cities, but students in the Dallas-Fort
Worth area were still more likely to use neutralizations than were Portland, Greeley, or Nashville
students; and, they actually comprised the second-largest proportion of youths who agreed that it
is okay to beat up someone to protect friends or family. Students in some cities, such as Portland
and Nashville, also showed very low “tolerance” for certain forms of behavior. Portland students
had the lowest level of agreement for all three forms of stealing and all three forms of hitting, but
were more agreeable to lying, especially small lies. Conversely, Nashville students showed the
lowest amount of agreement with the three forms of lying, agreement similar to Portland with
forms of stealing, but much higher agreement that forms of hitting are okay. These results
shown in Table 4 again call into question whether site differences can be explained by age
differences between youths. It is not always the case that Chicago and Albuquerque students
showed the greatest use of neutralizations, and in fact, a larger proportion of students in
Philadelphia, and in the DFW-area for one item, justified the use of violence in certain situations.
333
This document is a research report submitted to the U.S. Department of Justice. This report has not been published by the Department. Opinions or points of view expressed are those of the author(s)
and do not necessarily reflect the official position or policies of the U.S. Department of Justice.

Table 4: Use of Neutralizations
Item Frequencies by Age and City
Full Sample Age 12 Age 14 ABQ POR
DFW area GRE NSH PHL CHI
Items % % % % % % % % % %
Neutralizations*
OK tell small lie
46 40 59 53 43 41 42 40 48 61 OK to lie if keep friends from getting in trouble
27 20 43 35 21 26 23 20 31 39
OK to lie if keep you out of trouble 27 21 40 35 19 27 26 18 28 40
OK to steal from rich 11 7 19 14 5 13 9 7 12 17
OK to steal from store 7 4 14 11 3 8 6 3 7 10 OK to steal if only way you could ever get it 8 4 17 11 4 8 6 4 8 13 OK to beat up someone if they hit you first 50 42 69 65 36 51 42 42 63 58 OK to beat up someone to stand up for rights 57 52 70 65 39 60 51 57 68 65 OK to beat up someone to protect friends/family 64 58 73 69 52 71 54 60 73 68
*% “Agree/Strongly agree”
334
This document is a research report submitted to the U.S. Department of Justice. This report has not been published by the Department. Opinions or points of view expressed are those of the author(s)
and do not necessarily reflect the official position or policies of the U.S. Department of Justice.

Adherence to “Street Code”
The survey also included a series of questions designed to assess students’ level of
adherence to the “code of the street,” a set of values and norms adopted by some to regulate
interpersonal interaction (particularly aggression and violence) in chaotic, violent environments.
These values and norms are based on goals of gaining and maintaining respect and are achieved
by the exhibition of willingness to use violence in ways approved by or consistent with the
informal rules governing behavior. To assess students’ adoption of the street code, we asked
them to indicate their level of agreement (1 = strongly disagree, 5 = strongly agree) with seven
statements (see box titled “Street Code”). The percentage of students who “agreed” or “strongly
agreed” to each statement is shown in Table 5.
In contrast to the results regarding
neutralizations for hitting, with which a
majority of students overall agreed, for none of
the street code items did a majority of students
indicate agreement. The largest percentage
(45%) was found for the third item, “People
will take advantage of you if you don’t let
them know how tough you are,” followed by
“It is important to show others that you cannot
be intimidated” (43% agreed). Less than one-
quarter (23%) of all students agreed that it is
important to use force to teach others not to
disrespect you or that you need to threaten
people in order to be treated fairly.
The differences across age in adherence
to the street code follow the same pattern as the results for other anti-social norms, but the
differences are relatively stable across the questions. Specifically, the percentage difference
between the age groups for each question was somewhere between 14 and 20 percent, and three
questions saw differences of 17 percent. The most appreciable difference in agreement (20%) is
found for responses to the statement “If someone uses violence against you, it is important that
you use violence against him or her to get even,” with which 25 percent of 12-year-olds agreed,
Street Code
How much do you agree or disagree with the following statements? 1. When someone disrespects you, it is important
that you use physical force or aggression to teach him or her not to disrespect you.
2. If someone uses violence against you, it is important that you use violence against him or her to get even.
3. People will take advantage of you if you don’t let them know how tough you are.
4. People do not respect a person who is afraid to fight physically for his or her rights.
5. Sometimes you need to threaten people in order to get them to treat you fairly.
6. It is important to show others that you cannot be intimidated.
7. People tend to respect a person who is tough and aggressive.
Strongly disagree, Disagree, Neither agree nor disagree, Agree, Strongly agree
335
This document is a research report submitted to the U.S. Department of Justice. This report has not been published by the Department. Opinions or points of view expressed are those of the author(s)
and do not necessarily reflect the official position or policies of the U.S. Department of Justice.

but 45 percent of 14-year-olds agreed. This difference is not as large as the most disparate results
in previous analyses; that is, there appears to be less variation by age in regard to the street code
than in regard to other anti-social norms.
Table 5: Adherence to Street Code
Item Frequencies by Age and City
Full Sample
Age 12
Age 14 ABQ POR
DFW area GRE NSH PHL CHI
Items % % % % % % % % % % Street Code* When someone disrespects, important to use force to teach not to 23 18 36 25 13 24 23 18 35 29 When someone uses violence against you, important to use violence to get even 31 25 45 37 22 36 26 26 39 37 People will take advantage if not show how tough you are 45 39 55 54 28 43 38 43 61 51 People do not respect person afraid to fight physically for rights 42 37 50 47 28 43 41 34 59 45 Sometimes need to threaten to be treated fairly 23 18 32 26 15 23 20 20 36 26 Important to show others you cannot be intimidated 43 37 54 47 34 41 41 39 55 47
People respect person who is tough and aggressive 41 35 52 49 26 36 39 38 57 44
*% “Agree/Strongly agree”
Overall, Portland students showed the least agreement with street code values (see Table
5), and for the most part, the percentage who agreed is considerably lower than in any other city.
Across the board, a greater percentage of students in Philadelphia than in other sites expressed
agreement with the street code. This is consistent with previous results for hitting neutralizations
and is notable because Philadelphia students are younger than those in Chicago and
Albuquerque. Students in Albuquerque and Chicago also reported relatively high agreement,
while those in Nashville and Greeley exhibited lower levels of agreement. DFW-area students
again fell somewhere in between. The biggest cross-site difference is in the level of agreement
with the statement, “People will take advantage of you if you do not let them know how tough
336
This document is a research report submitted to the U.S. Department of Justice. This report has not been published by the Department. Opinions or points of view expressed are those of the author(s)
and do not necessarily reflect the official position or policies of the U.S. Department of Justice.
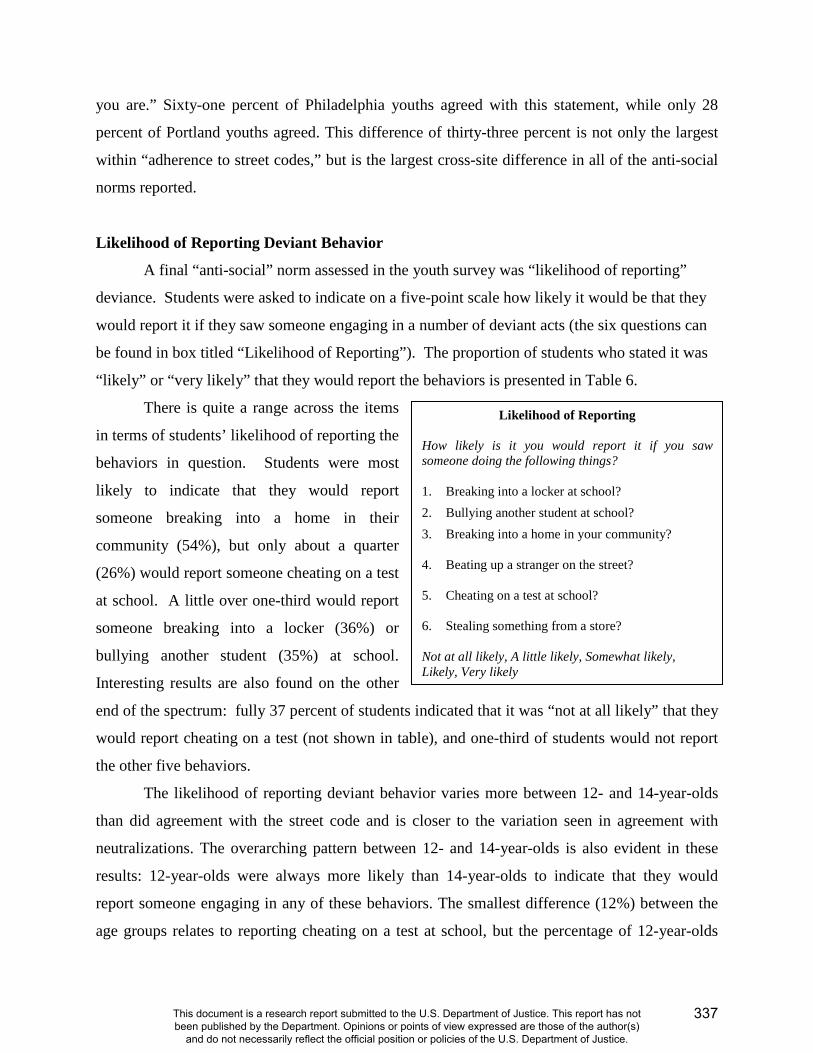
you are.” Sixty-one percent of Philadelphia youths agreed with this statement, while only 28
percent of Portland youths agreed. This difference of thirty-three percent is not only the largest
within “adherence to street codes,” but is the largest cross-site difference in all of the anti-social
norms reported.
Likelihood of Reporting Deviant Behavior
A final “anti-social” norm assessed in the youth survey was “likelihood of reporting”
deviance. Students were asked to indicate on a five-point scale how likely it would be that they
would report it if they saw someone engaging in a number of deviant acts (the six questions can
be found in box titled “Likelihood of Reporting”). The proportion of students who stated it was
“likely” or “very likely” that they would report the behaviors is presented in Table 6.
There is quite a range across the items
in terms of students’ likelihood of reporting the
behaviors in question. Students were most
likely to indicate that they would report
someone breaking into a home in their
community (54%), but only about a quarter
(26%) would report someone cheating on a test
at school. A little over one-third would report
someone breaking into a locker (36%) or
bullying another student (35%) at school.
Interesting results are also found on the other
end of the spectrum: fully 37 percent of students indicated that it was “not at all likely” that they
would report cheating on a test (not shown in table), and one-third of students would not report
the other five behaviors.
The likelihood of reporting deviant behavior varies more between 12- and 14-year-olds
than did agreement with the street code and is closer to the variation seen in agreement with
neutralizations. The overarching pattern between 12- and 14-year-olds is also evident in these
results: 12-year-olds were always more likely than 14-year-olds to indicate that they would
report someone engaging in any of these behaviors. The smallest difference (12%) between the
age groups relates to reporting cheating on a test at school, but the percentage of 12-year-olds
Likelihood of Reporting How likely is it you would report it if you saw someone doing the following things? 1. Breaking into a locker at school?
2. Bullying another student at school?
3. Breaking into a home in your community? 4. Beating up a stranger on the street? 5. Cheating on a test at school? 6. Stealing something from a store? Not at all likely, A little likely, Somewhat likely, Likely, Very likely
337
This document is a research report submitted to the U.S. Department of Justice. This report has not been published by the Department. Opinions or points of view expressed are those of the author(s)
and do not necessarily reflect the official position or policies of the U.S. Department of Justice.
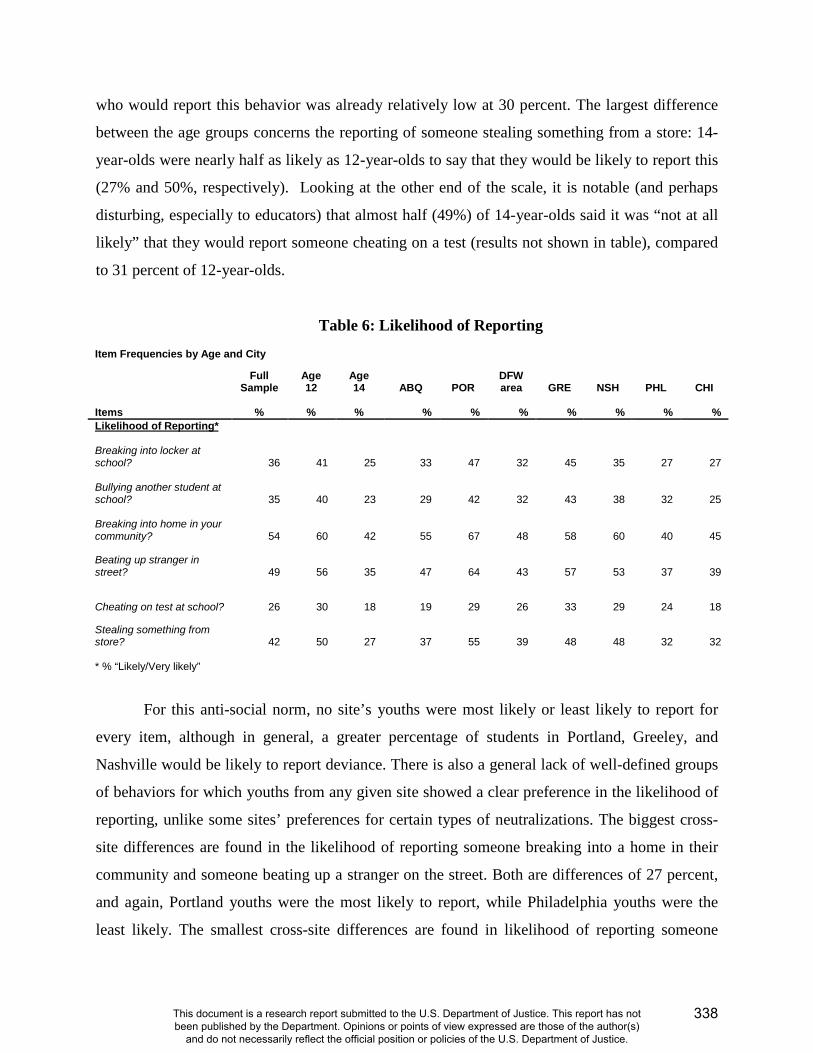
who would report this behavior was already relatively low at 30 percent. The largest difference
between the age groups concerns the reporting of someone stealing something from a store: 14-
year-olds were nearly half as likely as 12-year-olds to say that they would be likely to report this
(27% and 50%, respectively). Looking at the other end of the scale, it is notable (and perhaps
disturbing, especially to educators) that almost half (49%) of 14-year-olds said it was “not at all
likely” that they would report someone cheating on a test (results not shown in table), compared
to 31 percent of 12-year-olds.
Table 6: Likelihood of Reporting
Item Frequencies by Age and City
Full Sample
Age 12
Age 14 ABQ POR
DFW area GRE NSH PHL CHI
Items % % % % % % % % % % Likelihood of Reporting* Breaking into locker at school? 36 41 25 33 47 32 45 35 27 27 Bullying another student at school? 35 40 23 29 42 32 43 38 32 25 Breaking into home in your community? 54 60 42 55 67 48 58 60 40 45
Beating up stranger in street? 49 56 35 47 64 43 57 53 37 39
Cheating on test at school? 26 30 18 19 29 26 33 29 24 18
Stealing something from store? 42 50 27 37 55 39 48 48 32 32 * % “Likely/Very likely”
For this anti-social norm, no site’s youths were most likely or least likely to report for
every item, although in general, a greater percentage of students in Portland, Greeley, and
Nashville would be likely to report deviance. There is also a general lack of well-defined groups
of behaviors for which youths from any given site showed a clear preference in the likelihood of
reporting, unlike some sites’ preferences for certain types of neutralizations. The biggest cross-
site differences are found in the likelihood of reporting someone breaking into a home in their
community and someone beating up a stranger on the street. Both are differences of 27 percent,
and again, Portland youths were the most likely to report, while Philadelphia youths were the
least likely. The smallest cross-site differences are found in likelihood of reporting someone
338
This document is a research report submitted to the U.S. Department of Justice. This report has not been published by the Department. Opinions or points of view expressed are those of the author(s)
and do not necessarily reflect the official position or policies of the U.S. Department of Justice.
bullying another student and cheating on a test at school. Both are differences of 14 percent, and
in this case, Greeley youths were the most likely to report, while Albuquerque youths were the
least likely to report. Similar results are found when looking at the other end of the scale (not
shown in table): a greater percentage of students in Philadelphia than in other sites responded
that it was “not at all likely” they would report breaking into a locker, breaking into a home, or
stealing something from a store and these students were highly represented (along with students
in the DFW-area, Chicago, and Albuquerque) for the other behaviors as well. Interestingly, it is
the DFW-area location that had the highest proportion (41%) of students who would not report
someone beating up a stranger in the street. All of these results give more evidence that site
differences are not necessarily age differences; there is something more that explains differences
between the cities in anti-social norms.
Summary This document is the second annual report to schools and communities prepared as part
of the National Evaluation of the Gang Resistance Education and Training (G.R.E.A.T.)
program. The G.R.E.A.T. program was developed in 1991, underwent a rigorous evaluation
from 1995 – 2001, was substantially revised as a result of that evaluation, and the new
curriculum was fully implemented in 2003. The core of the current G.R.E.A.T. program consists
of 13 lessons, delivered by law enforcement officers in middle-school settings, intended to meet
two main goals: 1) help youths avoid gang membership, violence, and criminal activity; and 2)
help youths develop a positive relationship with law enforcement.
The University of Missouri-St. Louis is evaluating the current G.R.E.A.T. program in
seven cities. Students have completed pre-test surveys (prior to implementation of the
G.R.E.A.T. program), post-test surveys (shortly after completion of the G.R.E.A.T. program),
and the first annual follow-up survey (one year after pre-test surveys were administered)6. We
will continue to follow the same students, surveying them in their current school one time each
year until 2010, to assess the impact that the G.R.E.A.T. program has on students’ attitudes and
behaviors. Program outcomes have not yet been assessed, but these will be shared in the future.
6 With the exception of the two Chicago schools added during the 2007-08 school year; these schools will complete the first annual follow-up survey during the 2008-09 school year.
339
This document is a research report submitted to the U.S. Department of Justice. This report has not been published by the Department. Opinions or points of view expressed are those of the author(s)
and do not necessarily reflect the official position or policies of the U.S. Department of Justice.

The current report provides descriptive information about some areas of interest for
schools, law enforcement, and communities participating in the National Evaluation of
G.R.E.A.T. Specifically, we have focused on issues related to youths’ adherence to anti-social
attitudes or norms, including their likelihood of giving in to peer pressure to engage in deviance,
their commitment to negative peers, their use of neutralizations for deviant behavior, their
adoption of street code values, and their likelihood of reporting others’ deviant behavior. On the
whole, we find that most students do not hold anti-social norms, but there are some interesting
deviations to the general patterns.
A majority of youths would not give in to peer pressure to engage in a variety of deviant
behaviors and nearly two-fifths would not continue to associate with peers who got them in
trouble at home or at school; over 70 percent would stop hanging out with friends who got them
in trouble with police. Very few students agreed that it was okay to steal things; about a quarter
agreed that it was okay to lie to keep friends or themselves from getting in trouble, while almost
half agreed it was okay to tell a small lie. There was much greater “tolerance” for violent than
for stealing or lying behaviors: over half of all students used neutralizations for hitting behavior,
agreeing that it was okay to beat up someone in three different situations. It was not the case,
however, that the majority of students go so far as to adopt a “street code” mentality; across the
range of street code items, less than one-quarter to less than one-half of students agreed. In
regard to students’ likelihood of reporting deviance, about one-half of students would report
deviance in their community (54% would report someone breaking into a home; 49% would
report someone beating up a stranger in the street; 42% would report someone stealing from a
store), but there was less apparent willingness to report deviance occurring at school: while over
a third would report someone breaking into a locker (36%) or bullying (35%), only one-quarter
(26%) would report cheating.
In every instance, a larger proportion of older (14-year-olds) than younger (12-year-olds)
students exhibited anti-social norms. The largest age differences (25% or greater) were in giving
in to peer pressure to drink alcohol, continuing to hang out with friends getting them into trouble
with police, and agreeing that it is okay to hit someone if they hit you first. Smallest age
differences were generally found for continuing to associate with peers getting them into trouble
at home or school and for agreement with neutralizations for stealing. Since most of the older
students are concentrated in two of our sample cities (in Chicago, students in three of four
340
This document is a research report submitted to the U.S. Department of Justice. This report has not been published by the Department. Opinions or points of view expressed are those of the author(s)
and do not necessarily reflect the official position or policies of the U.S. Department of Justice.
schools were in eighth-grade during the 2007-08 school year, as were students in two of four
schools in Albuquerque; students in all other schools and sites were in seventh-grade), one might
hypothesize that students in Chicago and Albuquerque would, by virtue of being older, be more
likely than students in the other sites to report anti-social norms. While this seems to be the case
for peer pressure to engage in deviance, results for the other anti-social norms complicates the
picture a bit. It was not, for example, Chicago and Albuquerque that had the lowest proportion
of students who would stop hanging out with peers getting them into trouble at home and school
(commitment to negative peers), but rather Albuquerque and Portland. For neutralizations,
although Chicago and Albuquerque students were most likely to agree with lying and stealing
neutralizations, Philadelphia students (and in one instance Dallas-Fort Worth area students) also
scored high on hitting neutralizations. Although Philadelphia youths seem less likely than
youths in many other cities to be influenced by peers (giving in to peer pressure and being
committed to negative peers), there appears to be a relatively stronger influence of a “street
code” mentality in Philadelphia, with a greater proportion of students in this city agreeing with
neutralizations for violence (Table 4) and with statements reflective of street code values (Table
5). It is perhaps not ironic that Philadelphia is ostensibly the city in which University of
Pennsylvania professor Elijah Anderson’s book The Code of the Street was set.
Overall, most students do not adhere to anti-social norms. There is relatively greater
adoption of anti-social attitudes among older than younger students, and there are often clear
differences across the seven sites, with the general pattern being that students in Albuquerque,
Chicago, and Philadelphia are relatively more anti-social in their attitudes than are students in
Portland, Greeley, and Nashville. Some of these site differences may be due to age, but more
likely, differences are due to influences from the contextual environments in which these
students live. Of particular concern for teachers and school administrators may be the findings
regarding school-related anti-social norms, including that only 54 percent of students said it was
not likely they would cheat on a test at school if friends wanted them to (12% said was
likely/very likely), that only 57 percent would not bully another student at school if friends
wanted them to, and that only about one-third of students would report someone breaking into a
locker, bullying another student, or cheating on a test at school.
341
This document is a research report submitted to the U.S. Department of Justice. This report has not been published by the Department. Opinions or points of view expressed are those of the author(s)
and do not necessarily reflect the official position or policies of the U.S. Department of Justice.
For more information about the Gang Resistance Education and Training (G.R.E.A.T.) Program,
see the official G.R.E.A.T. website located at http://www.great-online.org/ .
For more information about youth gangs and effective responses, see the official website of the
National Youth Gang Center located at http://www.iir.com/nygc/ .
For more information on the earlier National Evaluation of G.R.E.A.T., consult the following:
Esbensen, Finn-Aage. 2004. Evaluating G.R.E.A.T.: A school-based gang prevention program – Research in Policy. Washington, D.C.: U.S. Department of Justice, Office of Justice Programs. Available online at: http://www.ncjrs.gov/pdffiles1/nij/198604.pdf . Esbensen, Finn-Aage, Adrienne Freng, Terrance J. Taylor, Dana Peterson, and D. Wayne Osgood. 2002. The National Evaluation of the Gang Resistance Education and Training (G.R.E.A.T.) Program. Pp.139-167 in Winifred L. Reed and Scott H. Decker (Eds.), Responding to Gangs: Evaluation and Research. Washington, D.C.: U.S. Department of Justice, National Institute of Justice. Available online at: http://www.ncjrs.gov/pdffiles1/nij/190351.pdf . Esbensen, Finn-Aage, D. Wayne Osgood, Terrance J. Taylor, Dana Peterson, and Adrienne Freng. 2001. How Great is G.R.E.A.T.?: Results from a quasi-experimental design. Criminology & Public Policy 1 (1): 87-118. Winfree, L. Thomas, Jr., Dana Peterson Lynskey, and James R. Maupin. 1999. Developing Local Police and Federal Law Enforcement Partnerships: G.R.E.A.T. as a case study of policy implementation. Criminal Justice Review 24 (2): 145-168.
342
This document is a research report submitted to the U.S. Department of Justice. This report has not been published by the Department. Opinions or points of view expressed are those of the author(s)
and do not necessarily reflect the official position or policies of the U.S. Department of Justice.
National Evaluation of the
Gang Resistance Education and Training (G.R.E.A.T.) Program
2009 Report to Schools and Communities:
Program Implementation Quality and
Preliminary Outcome Results
by
Finn-Aage Esbensen, Ph.D.
Dana Peterson, Ph.D.
Terrance J. Taylor, Ph.D.
This research was made possible, in part, by the support and participation of seven school districts, including the School District of Philadelphia. This project was supported by Award No. 2006-JV-FX-0011 awarded by the National Institute of Justice, Office of Justice Programs, U.S. Department of Justice. We would also like to thank the numerous school administrators, teachers, students, and law enforcement officers for their involvement and assistance in this study. The opinions, findings, and conclusions or recommendations expressed in this publication are those of the authors and do not necessarily reflect the views of the Department of Justice or of the seven participating school districts.
For questions about this report or for more information about the evaluation, please contact:
G.R.E.A.T. Evaluation Department of Criminology & Criminal Justice
University of Missouri-St. Louis St. Louis, MO 63121-4499
Phone: (314) 516-4777 Fax: (314) 516-5048
343
This document is a research report submitted to the U.S. Department of Justice. This report has not been published by the Department. Opinions or points of view expressed are those of the author(s)
and do not necessarily reflect the official position or policies of the U.S. Department of Justice.
We would like to thank the numerous project staff for their work on this study:
Co-Investigators
Adrienne Freng, Ph.D.
D. Wayne Osgood, Ph.D.
Research Assistants
Jared Armstrong
Elizabeth Atwood
Adam Baggett
Brad Brick
Dena Carson
Desiree Coleman
Kelly Cutler
Steven Downing
Erin Flannery
Teri Gulledge
Laura Hastings
Sara Hoover
Joelle Jones
Russell Jewell
Graham Jones
Krystle Leugoud
Nicole Logan
Kristyn McCord
Meredith McKinney
Chris Melde
Jeaneé Miller
Joanna Miller
Nick Miofski
Adrian Molina
Vanessa Panfil
Skyler Pimple
Katie Polzer
Zachary Robbins
Preston Sanchez
Vanessa Sandoval
Aaron Sego
Brad Stevens
Candice Tate
Mia Taylor
Karin Tusinski
Michael Vecchio
Ben Voss
Sarah Young
344
This document is a research report submitted to the U.S. Department of Justice. This report has not been published by the Department. Opinions or points of view expressed are those of the author(s)
and do not necessarily reflect the official position or policies of the U.S. Department of Justice.
The Gang Resistance Education and Training (G.R.E.A.T.) Program The Gang Resistance Education and Training (G.R.E.A.T.) program is a gang and
delinquency prevention program delivered by law enforcement officers within a school setting.
Developed as a local program in 1991 by Phoenix-area law enforcement agencies, the program
quickly spread throughout the United States. The original G.R.E.A.T. program operated as a
nine-lesson lecture-based curriculum taught primarily in middle-school settings. Results from
an earlier National Evaluation of the G.R.E.A.T. program (1995-2001) found that the program
had an effect on several mediating variables (factors commonly identified as risk factors)
associated with gang membership and delinquency but found no differences between G.R.E.A.T.
and non-G.R.E.A.T. youths in terms of these behaviors (i.e., gang membership and involvement
in delinquent behavior).
Based in part on these findings, the G.R.E.A.T. program underwent a critical review that
resulted in substantial program modifications. The revised curriculum (see Box A) consists of
13 lessons aimed at teaching youths the life-skills (e.g., communication and refusal skills, as well
as conflict resolution and anger management techniques) thought necessary to prevent
involvement in gang behavior and delinquency. The revised G.R.E.A.T. curriculum was piloted
in 2001, with full-scale implementation occurring in 2003. Currently, the program is taught in
middle schools across the country as well as in other countries. In school districts with school-
resource officers, the G.R.E.A.T. program is generally taught by the SROs. In other
jurisdictions, law enforcement officers deliver the program as part of their assignment in
community relations divisions, while elsewhere officers teach the program on an overtime basis.
Regardless of officers’ assignments, all instructors must complete G.R.E.A.T. Officer Training
and be certified prior to their assignment to teach in the local schools. This training (one week
for officers with prior teaching experience and two weeks for others), in addition to introducing
the officers to the program, includes sections on gang trends, issues associated with the transition
from an emphasis on enforcement to one of prevention, middle school student developmental
stages, and teaching and classroom management techniques.
The program’s two main goals are:
1. To help youths avoid gang membership, violence, and criminal activity.
2. To help youths develop a positive relationship with law enforcement.
345
This document is a research report submitted to the U.S. Department of Justice. This report has not been published by the Department. Opinions or points of view expressed are those of the author(s)
and do not necessarily reflect the official position or policies of the U.S. Department of Justice.
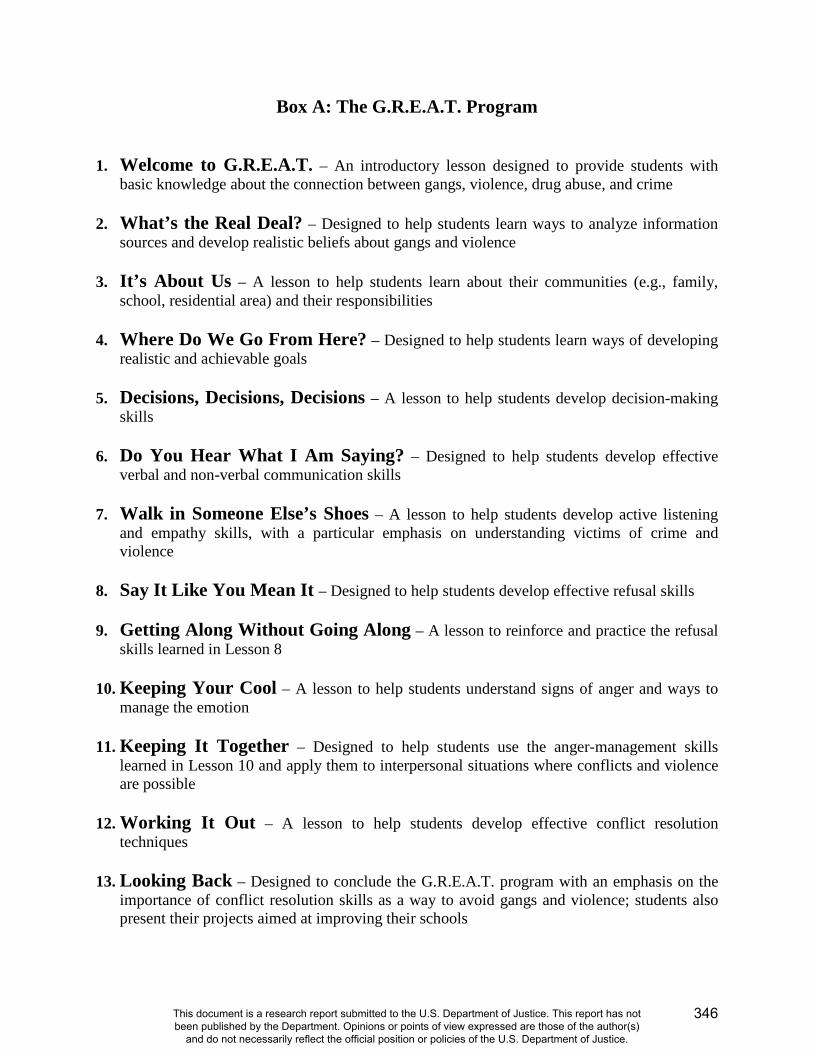
Box A: The G.R.E.A.T. Program
1. Welcome to G.R.E.A.T. – An introductory lesson designed to provide students withbasic knowledge about the connection between gangs, violence, drug abuse, and crime
2. What’s the Real Deal? – Designed to help students learn ways to analyze informationsources and develop realistic beliefs about gangs and violence
3. It’s About Us – A lesson to help students learn about their communities (e.g., family,school, residential area) and their responsibilities
4. Where Do We Go From Here? – Designed to help students learn ways of developingrealistic and achievable goals
5. Decisions, Decisions, Decisions – A lesson to help students develop decision-makingskills
6. Do You Hear What I Am Saying? – Designed to help students develop effectiveverbal and non-verbal communication skills
7. Walk in Someone Else’s Shoes – A lesson to help students develop active listeningand empathy skills, with a particular emphasis on understanding victims of crime andviolence
8. Say It Like You Mean It – Designed to help students develop effective refusal skills
9. Getting Along Without Going Along – A lesson to reinforce and practice the refusalskills learned in Lesson 8
10. Keeping Your Cool – A lesson to help students understand signs of anger and ways tomanage the emotion
11. Keeping It Together – Designed to help students use the anger-management skillslearned in Lesson 10 and apply them to interpersonal situations where conflicts and violenceare possible
12. Working It Out – A lesson to help students develop effective conflict resolutiontechniques
13. Looking Back – Designed to conclude the G.R.E.A.T. program with an emphasis on theimportance of conflict resolution skills as a way to avoid gangs and violence; students alsopresent their projects aimed at improving their schools
346
This document is a research report submitted to the U.S. Department of Justice. This report has not been published by the Department. Opinions or points of view expressed are those of the author(s)
and do not necessarily reflect the official position or policies of the U.S. Department of Justice.
The National Evaluation of G.R.E.A.T. In 2006, following a competitive peer review process, the National Institute of Justice
awarded the University of Missouri-St. Louis funding to conduct the National Evaluation of the
G.R.E.A.T. program. The evaluation consists of both process and outcome components that
include student surveys, classroom observations in G.R.E.A.T. and non-G.R.E.A.T. classrooms,
surveys of teachers, school administrators, and law enforcement officers, interviews with
G.R.E.A.T. officers and G.R.E.A.T. supervisors, and observations of G.R.E.AT. Officer Training
(G.O.T.). In this report we focus on program fidelity (i.e., actual program delivery) and
preliminary findings of program effectiveness.
As will be detailed below, we surveyed students attending 31 public middle schools in
seven cities across the country. Based upon student responses to three waves of questionnaires
(pre-test, post-test, and one-year follow-up), we are able to assess short-term program effects.
That is, we examine the extent to which students receiving G.R.E.A.T. differ from non-
G.R.E.A.T. students in terms of their delinquent activity and gang involvement. Additionally,
we examine the extent to which risk factors addressed in the G.R.E.A.T. program also
differentiate the G.R.E.A.T. students from the control group. However, prior to reporting on
these outcomes, we describe results from our efforts to assess program fidelity; that is, was the
program delivered in the manner that was intended and with sufficient quality to reasonably
expect the program to have its desired effects? To answer this question, we rely upon
approximately 500 observations of actual classroom program delivery and questionnaire
responses provided by 230 teachers and administrators in the 31 schools participating in the
evaluation.
Study Design To implement a process and outcome evaluation of a school-based program that is
offered in settings across the United States, it is important to select a sample that will be
representative of the diversity of settings in which the overall program operates. Cost and
logistics must also be factored into design decisions. Our overall strategy was to include four to
six schools in six different cities. By including multiple schools in a single city we would reduce
potential bias that could arise from including atypical schools. Having multiple cities in the
evaluation would allow for inclusion of geographically diverse areas, different sized cities and
347
This document is a research report submitted to the U.S. Department of Justice. This report has not been published by the Department. Opinions or points of view expressed are those of the author(s)
and do not necessarily reflect the official position or policies of the U.S. Department of Justice.
school districts, differential levels of gang activity, and a diversity of racial and ethnic groups.
Within each participating school, classrooms would be randomly assigned to receive G.R.E.A.T.
or to be designated as a control classroom. While apprehension about the random assignment
and subsequent exclusion of some classrooms from receiving G.R.E.A.T. was expressed by some
principals and teachers, ultimately 31 schools agreed to the design specifics.1 We now describe
the site and school selection process of the evaluation.
Site Selection
During the summer of 2006, efforts were made to identify cities for inclusion in the
National Evaluation of G.R.E.A.T. Site selection was based on three main criteria: 1) existence
of the G.R.E.A.T. program, 2) geographic and demographic diversity, and 3) evidence of gang
activity. This site selection process was carried out in a series of steps. First, the research staff
contacted the G.R.E.A.T. Regional Administrators2 and Bureau of Justice Assistance3 personnel
to identify locales with established programs. Consideration was given to factors such as the
length of time the program had been in operation, number of G.R.E.A.T.-trained officers, and the
number of schools in which the program was offered. Second, once this list of more than 50
potential agencies was constructed, the research staff contacted representatives in these cities to
obtain more information about the delivery of the G.R.E.A.T. program. Third, given the focus of
the program, information about gang activity in these potential cities was obtained from the
National Youth Gang Center. Ultimately, we selected seven cities (varying in size, region, and
level of gang activity) as our primary target sites. Given the difficulties associated with securing
permission to conduct evaluations in many school districts, we were hopeful that six of these
seven cities would cooperate.
1 Two principals who were contacted declined their schools’ participation. In one case, the principal had previously been a police gang investigator and, thus, “knew the program worked.” In the other case, the principal would not agree to our study design (i.e., random assignment of classrooms). In a third school, while the principal agreed to participate, there was resistance to the evaluation design, and this school was ultimately dropped from the study. In each instance, other schools were selected to replace the non-participating schools. 2 G.R.E.A.T. is a national program overseen by the G.R.E.A.T. National Policy Board (NPB). For administrative purposes, responsibilities for program oversight are held by (or “given to”) agencies operating in different geographic regions: Northeast, Midwest, Southeast, Southwest, and West. Additionally, two federal partners—the Bureau of Alcohol, Tobacco, Firearms, and Explosives (BATF) and the Federal Law Enforcement Training Center (FLETC)—are involved in program training and oversight. 3 The Bureau of Justice Assistance (BJA) oversees the allocation of federal funds and grant compliance associated with the G.R.E.A.T. program.
348
This document is a research report submitted to the U.S. Department of Justice. This report has not been published by the Department. Opinions or points of view expressed are those of the author(s)
and do not necessarily reflect the official position or policies of the U.S. Department of Justice.
Once these seven cities were identified, the research staff worked with the primary local
law enforcement agency and the school district in each city to seek their cooperation. Much to
our surprise, all seven districts agreed to participate. Rather than exclude one of the sites, we
decided to expand our design from six to seven cities. These participating cities are:
Albuquerque, New Mexico; Chicago, Illinois; Greeley, Colorado; Nashville, Tennessee;
Philadelphia, Pennsylvania; Portland, Oregon; and a Dallas-Fort Worth (DFW), Texas, area
location. With school district approval, we then identified potential schools for study
participation and contacted the principals. Our intent in the selection of schools was to include
schools that, taken as a whole, would be representative of the districts. Once initial agreement to
participate was obtained from the school administrator, more detailed discussions/meetings were
held between school personnel, G.R.E.A.T. officers, and the research team. Whenever possible,
face-to-face meetings were held, but in some instances final arrangements were made via
telephone. School and police personnel were informed of the purpose of the evaluation, issues
related to the random assignment of classrooms to the treatment or control condition (i.e., receive
G.R.E.A.T./not receive G.R.E.A.T.), procedures to obtain active parental consent for students in
these classrooms, scheduling G.R.E.A.T. program delivery, and other logistical issues associated
with the study design. We turn now to the process evaluation components assessing program
implementation.
Classroom Observations The G.R.E.A.T. program is intended to be taught in the same manner by officers across
all settings. In G.R.E.A.T. Officer Training, officers are instructed to teach the curriculum as
presented in the Instructor’s Manual in terms of wording, ordering, and content, and to adhere to
the suggested time frames for each component of each lesson. Members of the research team
observed officers teaching the G.R.E.A.T. program in all of the 31 participating schools; this
consisted of 520 classroom observations of 33 different officers. Each observer used a coding
sheet to document whether or not the officer taught the lesson in its entirety and as intended.
Specifically, the observer would indicate if each lesson component was addressed, the time spent
on each lesson component, whether or not specified activities were conducted as intended, and
made an assessment of the quality of student engagement. These observations allowed us to
determine the extent to which the lesson was implemented and to rate the overall program
349
This document is a research report submitted to the U.S. Department of Justice. This report has not been published by the Department. Opinions or points of view expressed are those of the author(s)
and do not necessarily reflect the official position or policies of the U.S. Department of Justice.
implementation quality of each G.R.E.A.T. classroom. Across the seven cities, there were 492
separate and unique observations plus another 28 inter-rater reliability (IRR) observations
(multiple observers assessing the same lesson in the same classroom) for a grand total of 520
observations. We are able to report summary information by both observations of lessons and
observations of officers. By lessons, we can summarize our observations as follows: Lesson 5
and Lesson 9 (44 observations apiece) were the most frequently-observed lessons across all cities
and schools. Lesson 7 had the fewest observations, with a total of 29; the average number of
observations per lesson was 40. In five sites, we were able to obtain at least one observation per
each of the 13 lessons. By officer, our observations can be summarized in this way: twenty-six
of the 33 officers were observed delivering seven or more of the 13 lessons. For 15 officers, we
had at least 17 observations of their lessons; the average per officer was 15 lessons observed.
Results from these observations indicate that, overall, the G.R.E.A.T. program was
implemented with high fidelity; 27 of the 33 officers were considered to have implemented the
G.R.E.A.T. program with average or better than average fidelity. This means that if a treatment
effect is detected in the outcome evaluation, then it would be feasible to attribute this effect to
the G.R.E.A.T. program. Three additional officers delivered the program with below average
fidelity, but students in these classrooms still received a sufficient amount of the program
(dosage) with sufficient fidelity (program adherence) to link outcome effects to the program.
Only three officers failed to teach the program with sufficient fidelity to reasonably expect the
program to have any effect on the students in those classrooms. The clear majority of officers 1)
had good to excellent time management skills, 2) adhered to suggested program time frames, 3)
made considerable effort to cover all topical areas in each lesson, and 4) stimulated student
interest and participation. Variations were found across officers, but typically not across
classrooms; that is, officers were generally consistent in their program delivery when teaching in
different classrooms.
The observations also identified a number of areas where difficulties arose, detracting
from program fidelity. These were generally due to situations outside of the control of officers.
Examples include shortened school days (i.e., schedule changes) and other policing duties that
pulled officers from the classroom. Other situations, however, could be addressed by officers
delivering the program. For example, officers sometimes had difficulties with disruptive
students, often in combination with inattentive teachers. In these situations, greater attention to
350
This document is a research report submitted to the U.S. Department of Justice. This report has not been published by the Department. Opinions or points of view expressed are those of the author(s)
and do not necessarily reflect the official position or policies of the U.S. Department of Justice.

officers’ classroom management skills (perhaps in the G.R.E.A.T. Officer Training sessions) and
greater involvement of the classroom teacher would have helped to resolve these disciplinary
situations. Improving teacher involvement, as well as communication between G.R.E.A.T.
officers and classroom teachers, may be warranted.
School Personnel Questionnaires To assess educators’ perceptions of school-based prevention programs in general and the
G.R.E.A.T. program in particular, administrators and teachers in the G.R.E.A.T. grade levels (6th
or 7th) in the 31 participating schools were asked to provide their responses to an anonymous
questionnaire; 230 (62%) completed the surveys. The survey was conducted in the spring of
2007 and again during Fall 2007 and Spring 2008. School personnel were asked their
perceptions of problems facing their schools, crime and gangs in their schools and surrounding
neighborhoods, fear of crime and victimization experiences, their school as a work environment,
law enforcement officers and prevention programs in schools, and prevention program content
and delivery. Prior research has suggested that teachers’ opinions about these topics may be
related to their views of the G.R.E.A.T. program and the officers teaching the program.
Educators were generally positive about having law enforcement officers in schools.
Most respondents’ schools had a School Resource Officer (SRO), and these respondents had the
most positive attitudes about police in schools. In addition, school personnel were supportive of
prevention programs in schools and the role of schools in prevention, although only about half
agreed that teachers should incorporate prevention program lessons into their own curricula.
These findings generally bode well for the G.R.E.A.T. program. In regard to program content
and delivery, over 70 percent rated the components in Table 1 as “very important” in helping
youths avoid drugs, delinquency, and gangs, with decision-making, problem-solving, and
conflict resolution skills receiving this rating by over 90 percent. The G.R.E.A.T. curriculum
includes all of the 11 components, with an emphasis on a skills-building approach that
culminates in activities designed to allow students to practice conflict resolution. The
G.R.E.A.T. program also utilizes mostly “active teaching” methods such as small group
activities and role-playing, which were rated as “very effective” (as opposed to “not effective” or
“somewhat effective”) means of prevention program delivery by 70 percent or more of
351
This document is a research report submitted to the U.S. Department of Justice. This report has not been published by the Department. Opinions or points of view expressed are those of the author(s)
and do not necessarily reflect the official position or policies of the U.S. Department of Justice.
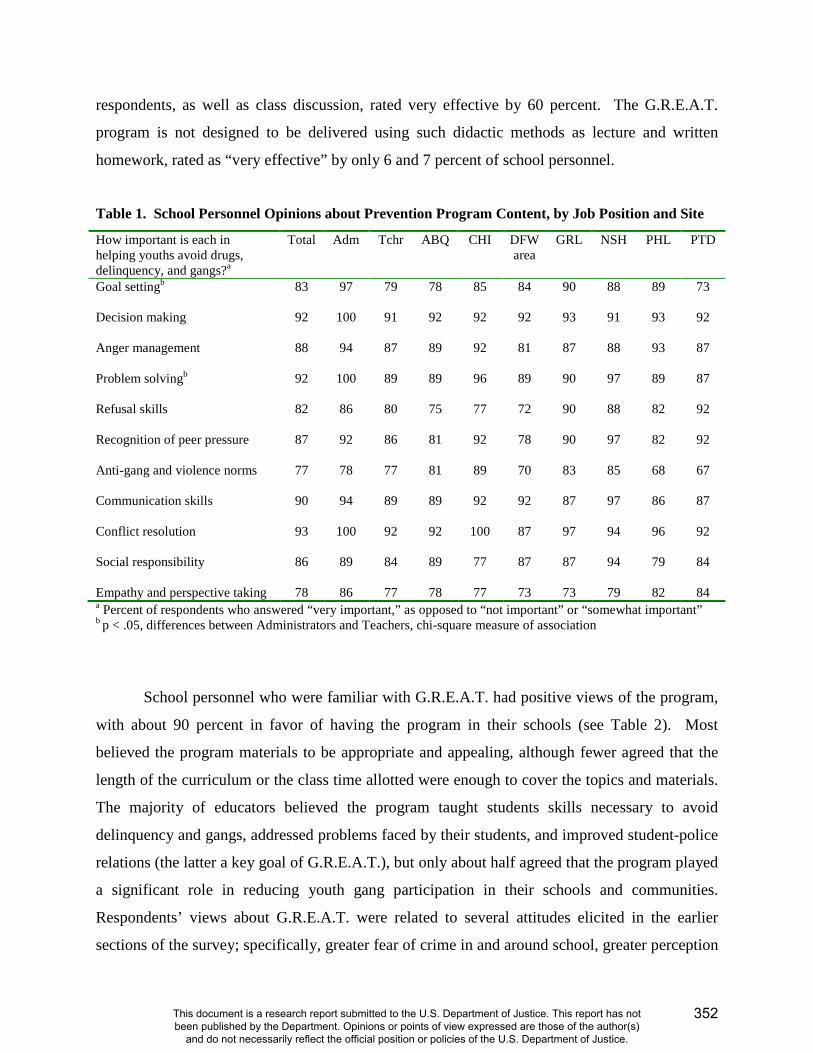
respondents, as well as class discussion, rated very effective by 60 percent. The G.R.E.A.T.
program is not designed to be delivered using such didactic methods as lecture and written
homework, rated as “very effective” by only 6 and 7 percent of school personnel.
Table 1. School Personnel Opinions about Prevention Program Content, by Job Position and Site
How important is each in helping youths avoid drugs, delinquency, and gangs?a
Total Adm Tchr ABQ CHI DFW area
GRL NSH PHL PTD
Goal settingb 83 97 79 78 85 84 90 88 89 73
Decision making 92 100 91 92 92 92 93 91 93 92
Anger management 88 94 87 89 92 81 87 88 93 87
Problem solvingb 92 100 89 89 96 89 90 97 89 87
Refusal skills 82 86 80 75 77 72 90 88 82 92
Recognition of peer pressure 87 92 86 81 92 78 90 97 82 92
Anti-gang and violence norms 77 78 77 81 89 70 83 85 68 67
Communication skills 90 94 89 89 92 92 87 97 86 87
Conflict resolution 93 100 92 92 100 87 97 94 96 92
Social responsibility 86 89 84 89 77 87 87 94 79 84
Empathy and perspective taking 78 86 77 78 77 73 73 79 82 84 a Percent of respondents who answered “very important,” as opposed to “not important” or “somewhat important” b p < .05, differences between Administrators and Teachers, chi-square measure of association
School personnel who were familiar with G.R.E.A.T. had positive views of the program,
with about 90 percent in favor of having the program in their schools (see Table 2). Most
believed the program materials to be appropriate and appealing, although fewer agreed that the
length of the curriculum or the class time allotted were enough to cover the topics and materials.
The majority of educators believed the program taught students skills necessary to avoid
delinquency and gangs, addressed problems faced by their students, and improved student-police
relations (the latter a key goal of G.R.E.A.T.), but only about half agreed that the program played
a significant role in reducing youth gang participation in their schools and communities.
Respondents’ views about G.R.E.A.T. were related to several attitudes elicited in the earlier
sections of the survey; specifically, greater fear of crime in and around school, greater perception
352
This document is a research report submitted to the U.S. Department of Justice. This report has not been published by the Department. Opinions or points of view expressed are those of the author(s)
and do not necessarily reflect the official position or policies of the U.S. Department of Justice.
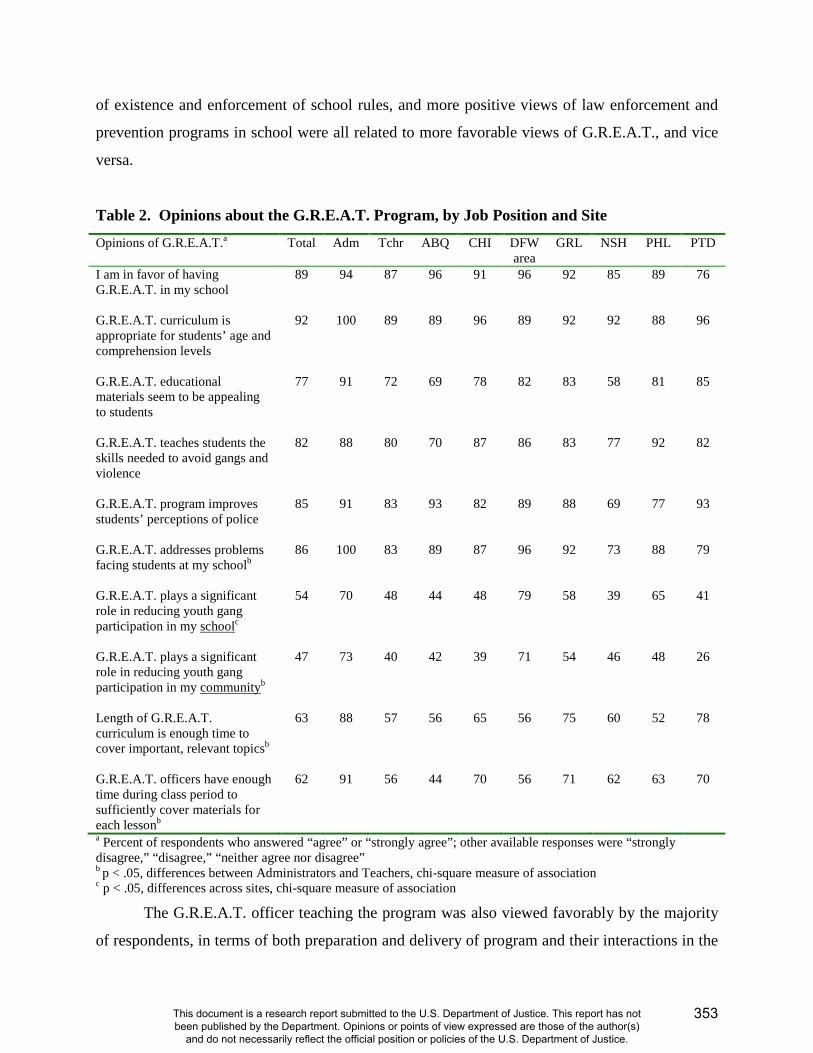
of existence and enforcement of school rules, and more positive views of law enforcement and
prevention programs in school were all related to more favorable views of G.R.E.A.T., and vice
versa.
Table 2. Opinions about the G.R.E.A.T. Program, by Job Position and Site
Opinions of G.R.E.A.T.a Total Adm Tchr ABQ CHI DFW area
GRL NSH PHL PTD
I am in favor of having G.R.E.A.T. in my school
89 94 87 96 91 96 92 85 89 76
G.R.E.A.T. curriculum is appropriate for students’ age and comprehension levels
92 100 89 89 96 89 92 92 88 96
G.R.E.A.T. educational materials seem to be appealing to students
77 91 72 69 78 82 83 58 81 85
G.R.E.A.T. teaches students the skills needed to avoid gangs and violence
82 88 80 70 87 86 83 77 92 82
G.R.E.A.T. program improves students’ perceptions of police
85 91 83 93 82 89 88 69 77 93
G.R.E.A.T. addresses problems facing students at my schoolb
86 100 83 89 87 96 92 73 88 79
G.R.E.A.T. plays a significant role in reducing youth gang participation in my schoolc
54 70 48 44 48 79 58 39 65 41
G.R.E.A.T. plays a significant role in reducing youth gang participation in my communityb
47 73 40 42 39 71 54 46 48 26
Length of G.R.E.A.T. curriculum is enough time to cover important, relevant topicsb
63 88 57 56 65 56 75 60 52 78
G.R.E.A.T. officers have enough time during class period to sufficiently cover materials for each lessonb
62 91 56 44 70 56 71 62 63 70
a Percent of respondents who answered “agree” or “strongly agree”; other available responses were “strongly disagree,” “disagree,” “neither agree nor disagree” b p < .05, differences between Administrators and Teachers, chi-square measure of association c p < .05, differences across sites, chi-square measure of association
The G.R.E.A.T. officer teaching the program was also viewed favorably by the majority
of respondents, in terms of both preparation and delivery of program and their interactions in the
353
This document is a research report submitted to the U.S. Department of Justice. This report has not been published by the Department. Opinions or points of view expressed are those of the author(s)
and do not necessarily reflect the official position or policies of the U.S. Department of Justice.

classroom. Despite this overall positive assessment, responses to both the closed-ended and
open-ended questions indicated that some officers struggled with classroom management or
failed to attend on scheduled days. Open-ended comments revealed that many educators
believed the success of the program to be tied to the officer, and additional analyses showed that
respondents’ views of the program were related to their views about the officer teaching the
program. Views of the G.R.E.A.T. officer were also related to attitudes about law enforcement
officers and prevention programs in schools; the more respondents supported officers and
prevention programs in schools, the more favorable their views of the G.R.E.A.T. officer.
School personnel in whose classrooms G.R.E.A.T. had been taught also provided
comments about their role in the program, and several findings are particularly salient. Most
educators played at least some role in the program; although this was largely classroom
management activities, some assisted the officer and others actively participated. Many used the
time for grading or other paperwork. Almost half (45%) did not incorporate G.R.E.A.T. lesson
content into their own curricula, mostly due to lack of time (a large concern was the amount of
material to cover for mandated testing), but also because it was not relevant to their subject. The
other 55 percent, especially those in relevant courses such as social studies, language arts, and
health, did cover or reinforce G.R.E.A.T. content. Most (84%) did not use extended teacher
activities associated with G.R.E.A.T. lessons, often due to lack of time, but almost as often
because they had not been made aware of the activities by the G.R.E.A.T. officer.
In sum, there appears to be a good deal of support among administrators and teachers for
both the G.R.E.A.T. program and officers. These views are most strongly tied to views of the
role of law enforcement officers and prevention programs in schools and do not appear to be
related to problems in schools such as delinquency and gangs, to fear of crime or crime
victimization, to job satisfaction or other perceptions about school as a work environment, or to
whether the respondents’ school has a School Resource Officer. Aspects of the current
educational climate, such as meeting standards set forth in the “No Child Left Behind” act,
provide challenges to delivery and reinforcement of the G.R.E.A.T. program that can be
addressed, in part, by locating the program in specific subjects. Finally, views of G.R.E.A.T. and
the G.R.E.A.T. officer are related to each other, an important tie that provides avenues for
improving even more the overall positive attitudes of school personnel.
354
This document is a research report submitted to the U.S. Department of Justice. This report has not been published by the Department. Opinions or points of view expressed are those of the author(s)
and do not necessarily reflect the official position or policies of the U.S. Department of Justice.
Effectiveness of G.R.E.A.T.
The evaluation design of this project can best be described as an experimental
longitudinal panel design. That is, classrooms in each of the participating schools were
randomly assigned to the treatment (i.e., G.R.E.A.T.) or control condition (i.e., no program
exposure), and students in these classrooms were scheduled to complete six waves of
questionnaires (pre- and post-tests followed by four annual surveys). Thus, the final sample of
students would be followed through their school experiences from 6th or 7th grade through 10th or
11th grade. Importantly, all students in the selected classrooms were eligible to participate in the
evaluation. A total of 4,905 students were enrolled in the 195 participating classrooms (102
G.R.E.A.T. and 93 control classes) in the 31 middle schools at the beginning of the data
collection process.
Active parental consent procedures were implemented in all sites. We worked closely
with the principals and classroom teachers during the consent process. Teachers distributed and
collected consent form packets. Each packet included a cover letter explaining the purpose of
the evaluation as well as an informed consent form (explaining the risks and benefits of the
students’ participation) for parents/guardians to read, sign, and return to the teacher. When
allowed by the districts, the research staff provided monetary compensation to the teachers
directly for their assistance. In some instances, district regulations prohibited such
compensation; in these cases, compensation was provided as a donation, made in honor of the
teachers, to the school or district. Students were also given a small personal radio, calculator, or
tote bag in exchange for returning a completed consent form. These rewards were provided to
students regardless of whether the parent/guardian granted or withheld consent for the youth to
participate in the study. Overall, 89.1 percent of youths (N=4,372) returned a completed consent
form, with 77.9 percent of parents/guardians (N=3,820) allowing their child’s participation.
Students completed pre-test surveys (prior to implementation of the G.R.E.A.T. program)
with a completion rate of 98.3 percent and post-test surveys (shortly after completion of the
G.R.E.A.T. program) with a completion rate of 94.6 percent. Students have also completed the
first and second annual follow-up surveys (one and two years after pre-test surveys were
administered) with completion rates of 87.3 and 82.9 percent, respectively. These response rates
are excellent, especially given the highly mobile nature of the sample; at wave 3 (one year after
355
This document is a research report submitted to the U.S. Department of Justice. This report has not been published by the Department. Opinions or points of view expressed are those of the author(s)
and do not necessarily reflect the official position or policies of the U.S. Department of Justice.
pre-tests), students were enrolled in more than 170 different schools in the seven participating
school districts (not counting those students who were no longer attending schools in the original
districts) and by wave 4 (two years after pre-tests), this number had grown to 216 different
schools (66 different schools in Philadelphia alone). We obtained permission from principals at
these schools to survey the transfer students – clearly, a time and labor intensive effort but one
well worth achieving these high response rates.
Student Sample Characteristics
Table 3 presents the demographic information of the National Evaluation of G.R.E.A.T.
sample for the entire group of youths, as well as separately by site, according to students’
responses to the pre-test survey. The sample is evenly split between males and females; most
(55%) youths reside with both biological parents; and the majority (88%) was born in the United
States. The sample is racially/ethnically diverse, with Hispanic youths (37%), White youths
(27%), and African-American (18%) youths accounting for 81 percent of the sample.
Approximately two-thirds of the youths (61%) were aged 11 or younger at the pre-test,
representing the fact that 26 of the 31 schools delivered the G.R.E.A.T. program in 6th grade;
three of the six Chicago schools and two of four schools in Albuquerque taught G.R.E.A.T. in 7th
grade. Thus, the students in Chicago and Albuquerque were somewhat older than students in the
other sites. Except in Chicago (in which Hispanics are over-represented and African Americans
under-represented), the sample is similar to the demographic composition of the respective
school districts.4
4 This disproportionate representation in Chicago occurred despite efforts by the research team to recruit schools that would be representative overall of Chicago Public Schools. One of the five originally-selected schools, which was comprised of nearly 100 percent African American students, was unable to meet the requirements of the study and was dropped from the sample. Given time constraints (i.e., too late in the school year to select a comparable school and implement the program with fidelity), we were unable to replace the excluded school during 2006-2007. Thus, the resulting sample was largely Hispanic, while the district was largely African American. To increase representativeness of the sample, the decision was made to add two primarily African American schools to the evaluation in the 2007-2008 school year, even though this meant that these schools would be one year behind other schools in the evaluation.
356
This document is a research report submitted to the U.S. Department of Justice. This report has not been published by the Department. Opinions or points of view expressed are those of the author(s)
and do not necessarily reflect the official position or policies of the U.S. Department of Justice.
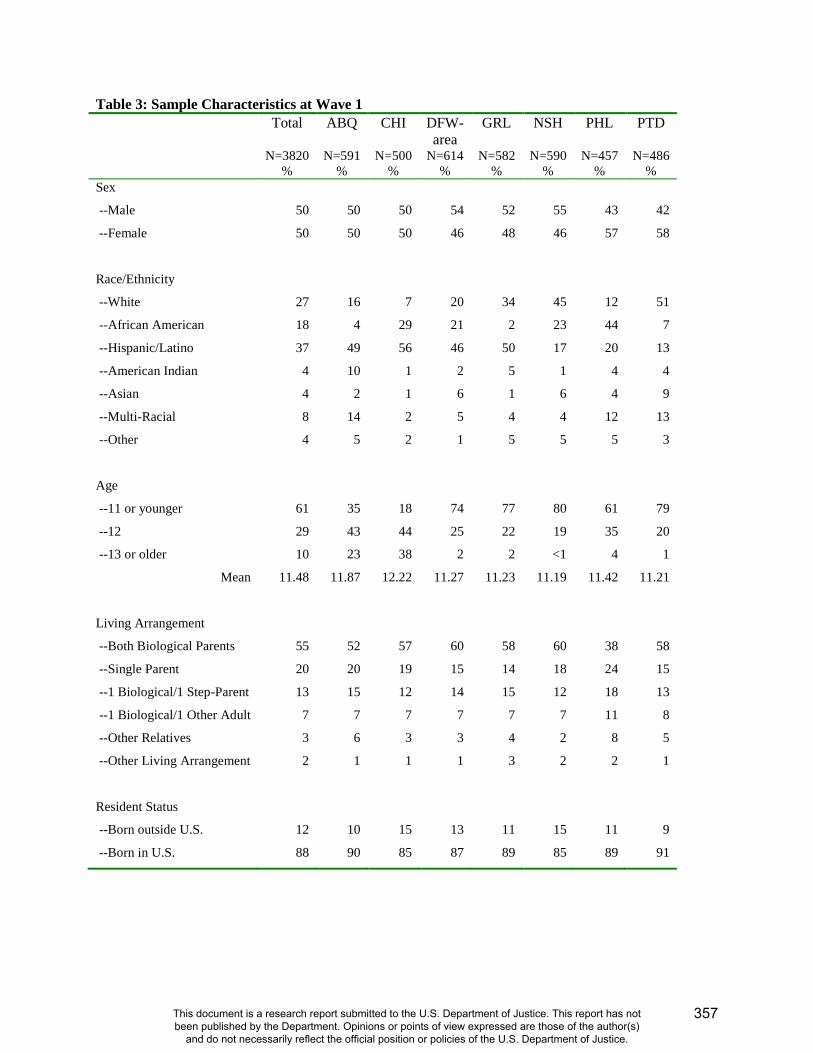
Table 3: Sample Characteristics at Wave 1 Total
N=3820 %
ABQ
N=591 %
CHI
N=500 %
DFW-area
N=614 %
GRL
N=582 %
NSH
N=590 %
PHL
N=457 %
PTD
N=486 %
Sex
--Male 50 50 50 54 52 55 43 42
--Female 50 50 50 46 48 46 57 58
Race/Ethnicity
--White 27 16 7 20 34 45 12 51
--African American 18 4 29 21 2 23 44 7
--Hispanic/Latino 37 49 56 46 50 17 20 13
--American Indian 4 10 1 2 5 1 4 4
--Asian 4 2 1 6 1 6 4 9
--Multi-Racial 8 14 2 5 4 4 12 13
--Other 4 5 2 1 5 5 5 3
Age
--11 or younger 61 35 18 74 77 80 61 79
--12 29 43 44 25 22 19 35 20
--13 or older 10 23 38 2 2 <1 4 1
Mean 11.48 11.87 12.22 11.27 11.23 11.19 11.42 11.21
Living Arrangement
--Both Biological Parents 55 52 57 60 58 60 38 58
--Single Parent 20 20 19 15 14 18 24 15
--1 Biological/1 Step-Parent 13 15 12 14 15 12 18 13
--1 Biological/1 Other Adult 7 7 7 7 7 7 11 8
--Other Relatives 3 6 3 3 4 2 8 5
--Other Living Arrangement 2 1 1 1 3 2 2 1
Resident Status
--Born outside U.S. 12 10 15 13 11 15 11 9
--Born in U.S. 88 90 85 87 89 85 89 91
357
This document is a research report submitted to the U.S. Department of Justice. This report has not been published by the Department. Opinions or points of view expressed are those of the author(s)
and do not necessarily reflect the official position or policies of the U.S. Department of Justice.
Outcome Results
To reiterate, the G.R.E.A.T. program has two primary goals: 1) to help youths avoid gang
membership, violence, and criminal activity, and 2) to help youths develop a positive
relationship with law enforcement. The curriculum consists of 13 lessons aimed at teaching
youths the life-skills (e.g., communication and refusal skills, conflict resolution and anger
management techniques) thought necessary to prevent involvement in gangs and delinquency.
To assess program effectiveness, we compare responses from students in the G.R.E.A.T. classes
to the students in the control classrooms. We utilize the pre-test and the one-year follow-up
questionnaires; these results, therefore, represent short-term program effects. The student
questionnaire contains a number of questions that tap program components, including measures
of gang membership, self-reported delinquency, and attitudes toward the police. Additionally
the survey includes questions that were drawn from a variety of empirical studies assessing key
risk and protective factors associated with youth problem behaviors.
In these preliminary analyses we included a subset of seven attitudinal measures and two
behavioral measures. The two behavioral measures allow us to assess the extent to which the
G.R.E.A.T. program impacts gang membership and involvement in illegal activity. Specifically,
we ask the students to indicate whether they are in a gang (this approach has been found in
research to be a valid and robust measure) as well as a 15-item self-reported delinquency
inventory (see Appendix for specific items). To measure positive attitudes to the police, students
were asked to respond to six questions tapping attitudes to the police (see Appendix).
Additionally, we asked a series of questions measuring the students’ attitudes about gangs (see
Appendix). These four sets of questions allow us to directly assess the program’s main goals.
G.R.E.A.T. was developed as a skills building program that identified a number of
mediating risk factors; that is, skills such as conflict resolution, empathy, and resistance skills.
We also examined the extent to which students exposed to the G.R.E.A.T. program (relative to
those who had not received G.R.E.A.T.) had improved or enhanced skills that would enable them
to better resist the lures of gang membership and resist peer pressure to engage in illegal
activities. Among these skills are the following: empathy, risk-seeking, conflict resolution skills,
resistance to peer pressure, and refusal skills. The G.R.E.A.T. program teaches lessons that
directly address these particular skills.
358
This document is a research report submitted to the U.S. Department of Justice. This report has not been published by the Department. Opinions or points of view expressed are those of the author(s)
and do not necessarily reflect the official position or policies of the U.S. Department of Justice.
Given the research design (individuals are nested within classrooms and classrooms are
nested within schools), hierarchical linear modeling techniques were used to assess program
effectiveness. The analyses revealed six statistically significant differences between the
G.R.E.A.T. and non- G.R.E.A.T. students. Specifically, the G.R.E.A.T. students compared to
non-G.R.E.A.T. students reported:
- More positive attitudes to police
- Less positive attitudes about gangs
- More use of refusal skills
- More resistance to peer pressure
- Lower rates of gang membership
- Lower rates of self-reported delinquency.
These findings address the two main program goals: 1) to reduce delinquency and gang
affiliation and 2) to improve youths’ relationships with law enforcement. Additionally, several
program-specific skills-building objectives appear to be met, especially refusal skills. There were
no statistically significant differences between the groups on measures of empathy, risk-seeking,
and conflict resolution.
At this juncture, we can say that the preliminary results are supportive of a one-year post
program effect. That is, students completing the G.R.E.A.T. program have lower rates of gang
affiliation and self-reported delinquency than do students in the control group. Additionally, the
G.R.E.A.T. students report a number of more pro-social attitudes, including more positive
attitudes to the police, than do the control students.
These results are preliminary and reflect only short-term program effect. An important
question remains: will these short-term program effects be sustained across time? The
longitudinal design of the evaluation (i.e., surveying students annually for four years post
program) will allow us to answer the question of whether the program has long-term effects on
student attitudes and behavior. These results, however, will not be available for several more
years.
359
This document is a research report submitted to the U.S. Department of Justice. This report has not been published by the Department. Opinions or points of view expressed are those of the author(s)
and do not necessarily reflect the official position or policies of the U.S. Department of Justice.
Summary
The Gang Resistance Education and Training (G.R.E.A.T.) program is a gang- and
delinquency-prevention program taught by law enforcement officers in middle schools
throughout the United States. The current National Evaluation of G.R.E.A.T. consists of both
process and outcome components that include student surveys; classroom observations in
G.R.E.A.T. and non-G.R.E.A.T. classrooms; surveys of teachers, school administrators, and law
enforcement officers; interviews with G.R.E.A.T. officers and G.R.E.A.T. supervisors; and
observations of G.R.E.AT. Officer Training (G.O.T.). In this report, we focused on three sources
of information (classroom observations, surveys of teachers and administrators, and student
surveys) to assess program fidelity (i.e., actual program delivery) and short-term program
effectiveness.
In order to determine the extent to which the program was implemented as intended
(program fidelity), members of the research team conducted 520 observations of 33 officers as
they taught the program in the 31 participating middle schools across seven cities. Overall, our
observations indicated that the G.R.E.A.T. program was implemented with high fidelity,
consistent with what officers are taught in the G.R.E.A.T. Officer Training: 27 of the 33 officers
were considered to have implemented the G.R.E.A.T. program with average or better than
average fidelity, three officers implemented with below-average, but still sufficient, fidelity,
while another three officers failed to implement the program with fidelity. The clear majority of
officers 1) had good to excellent time management skills, 2) adhered to suggested program time
frames, 3) made considerable effort to cover all topical areas in each lesson, and 4) stimulated
student interest and participation.
Sixty-two percent of administrators and teachers in the G.R.E.A.T. grade levels (6th or
7th) in the 31 middle schools provided responses to questionnaires about a variety of issues of
interest and importance to the evaluation. Their responses reveal a great deal of support for the
presence of law enforcement officers and prevention programs in schools and for both the
G.R.E.A.T. program and officers teaching the program. Two specific findings deserve note here.
First, both the observations of program delivery and the school personnel surveys pointed to
difficulties among some G.R.E.A.T. officers with classroom management and with maintaining
the agreed-upon delivery schedule (i.e., showing up to teach when scheduled). It is suggested
that greater attention to these issues in G.R.E.A.T. officer training, greater incorporation of
360
This document is a research report submitted to the U.S. Department of Justice. This report has not been published by the Department. Opinions or points of view expressed are those of the author(s)
and do not necessarily reflect the official position or policies of the U.S. Department of Justice.
classroom teachers during G.R.E.A.T. program delivery, and better communication between
G.R.E.A.T. officers and teachers can address these deficiencies. Second, the vast majority of
school personnel in whose classrooms G.R.E.A.T. had been taught reported that they did not
incorporate G.R.EA.T. lesson content into their own curricula or use the extended teacher
activities associated with each lesson. A major reason was lack of time due to mandated
curricula, but other key reasons were lack of relevance to subject matter or to the fact that the
G.R.E.A.T. officer had not informed the teacher that additional activities were available. In the
future, locating G.R.E.A.T. in relevant subjects (e.g., health, social studies, language arts) can be
beneficial in two ways: G.R.E.A.T. content will naturally be reinforced in the class curricula, and
material related to educational standards can be reinforced in G.R.E.A.T. curricula. Improving
officer-teacher communication will also help to ensure that G.R.E.A.T. is, as intended, integrated
into schools’ curricula, as opposed to existing as a stand-alone program.
For the outcome evaluation component of the evaluation, a sample of 3,820 students,
representing a consent rate of 78%, is slated to complete pre- and post-tests and four annual
follow-up surveys, following them from 6th or 7th grade through 10th or 11th grade. Analyses of
pre-test and one-year follow-up surveys revealed statistically significant differences between
students who received the G.R.E.A.T. program and students who did not on six of nine measures
selected for this preliminary analysis: G.R.E.A.T. students, compared to the control group,
reported less positive attitudes about gangs, greater use of refusal skills, greater resistance to peer
pressure, and, importantly for program-specific goals, more positive attitudes about police, lower
rates of delinquency, and less gang involvement. No significant differences between the
experimental and control groups were found for levels of empathy, tendencies toward risk-
seeking, or conflict resolution skills. Readers may notice that in the School Personnel Survey,
only about 50 percent of school personnel agreed that the G.R.E.A.T. program significantly
reduces youths’ gang participation in their schools and communities, while our outcome results
indicated that youths who received the G.R.E.A.T. program had significantly lower rates of gang
involvement than did students who did not receive the program. These findings are not
necessarily inconsistent. The G.R.E.A.T. program is not intended to prevent or reduce gang
involvement in entire communities, but rather among program participants, which it appears to
do at least in the short-term; and, to the extent that the G.R.E.A.T. program reaches a large
majority of a school’s population, we may expect to see lower rates of gang involvement at the
361
This document is a research report submitted to the U.S. Department of Justice. This report has not been published by the Department. Opinions or points of view expressed are those of the author(s)
and do not necessarily reflect the official position or policies of the U.S. Department of Justice.
school level. This is not the case in our study schools, however, as only half of the classes in one
grade received program.
In short, the G.R.E.A.T. program appears to be implemented as intended; both the
program and officer are viewed favorably by school personnel in our study schools; and the
program appears to have short-term effects on the program’s intended goals of reducing gang
and delinquency involvement and improving youth-police relations, as well as on interim risk or
skills. Because the program was implemented with fidelity and the evaluation utilized a
randomized experimental design, we can have confidence that these effects are due to the
program and not to other outside influences. Future analyses of other risk factors and skills and
additional waves of data will allow for assessment of other program effects, including whether
short-term effects reported here are sustained over the four-year follow-up period.
362
This document is a research report submitted to the U.S. Department of Justice. This report has not been published by the Department. Opinions or points of view expressed are those of the author(s)
and do not necessarily reflect the official position or policies of the U.S. Department of Justice.
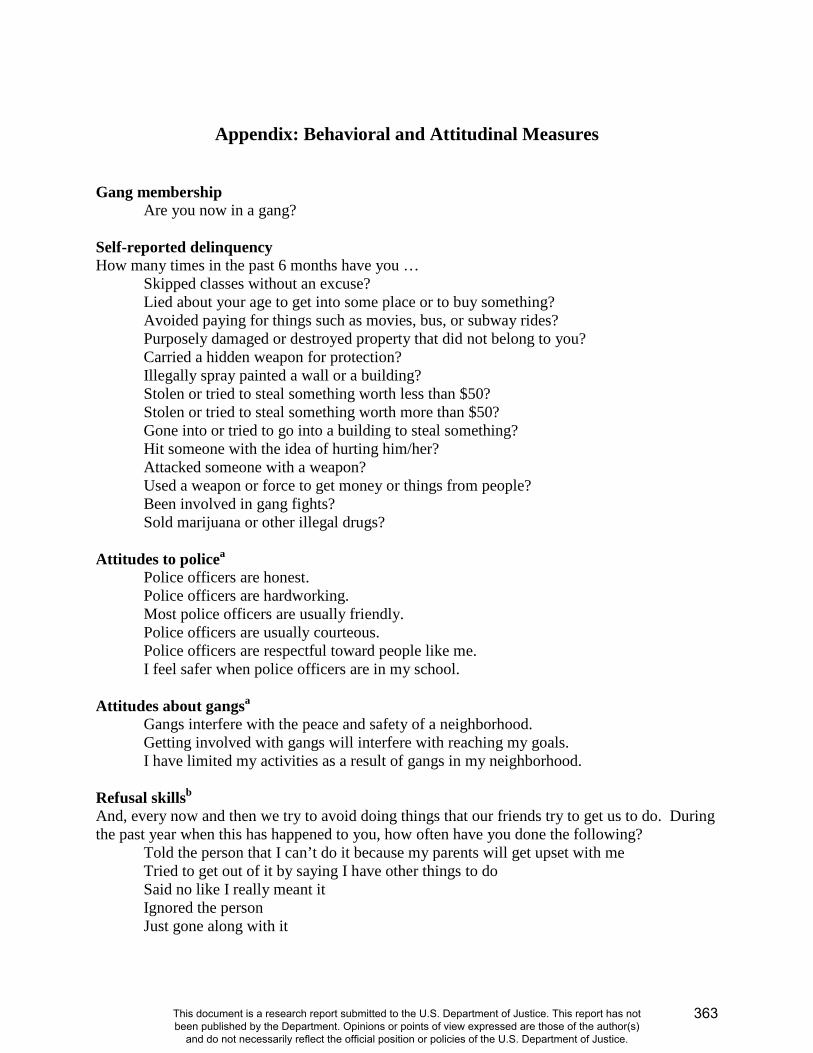
Appendix: Behavioral and Attitudinal Measures
Gang membership Are you now in a gang?
Self-reported delinquency How many times in the past 6 months have you …
Skipped classes without an excuse? Lied about your age to get into some place or to buy something? Avoided paying for things such as movies, bus, or subway rides? Purposely damaged or destroyed property that did not belong to you? Carried a hidden weapon for protection? Illegally spray painted a wall or a building? Stolen or tried to steal something worth less than $50? Stolen or tried to steal something worth more than $50? Gone into or tried to go into a building to steal something? Hit someone with the idea of hurting him/her? Attacked someone with a weapon? Used a weapon or force to get money or things from people? Been involved in gang fights? Sold marijuana or other illegal drugs?
Attitudes to policea
Police officers are honest. Police officers are hardworking. Most police officers are usually friendly. Police officers are usually courteous. Police officers are respectful toward people like me. I feel safer when police officers are in my school.
Attitudes about gangsa Gangs interfere with the peace and safety of a neighborhood. Getting involved with gangs will interfere with reaching my goals. I have limited my activities as a result of gangs in my neighborhood.
Refusal skillsb And, every now and then we try to avoid doing things that our friends try to get us to do. During the past year when this has happened to you, how often have you done the following?
Told the person that I can’t do it because my parents will get upset with me Tried to get out of it by saying I have other things to do Said no like I really meant it Ignored the person Just gone along with it
363
This document is a research report submitted to the U.S. Department of Justice. This report has not been published by the Department. Opinions or points of view expressed are those of the author(s)
and do not necessarily reflect the official position or policies of the U.S. Department of Justice.

Resistance to peer pressurec Still thinking about your current friends, how likely is it that you would go along with them if they wanted you to do the following things with them?
Bully another student at school Break into a home in your community Beat up a stranger on the street Cheat on a test at school Steal something from a store Drink alcohol Use illegal drugs
Empathya I would feel sorry for a lonely stranger in a group. I worry about how other people feel. I feel happy when I see other people celebrating. Seeing other people cry has no effect on me.
Risk seekinga I like to test myself every now and then by doing something a little risky. Sometimes I will take a risk just for the fun of it. I sometimes find it exciting to do things for which I might get in trouble. Excitement and adventure are more important to me than security
Conflict resolutionb Every now and then we get upset with other people. During the past year when you’ve gotten upset with someone, how often have you done the following?
Talked to the person about why I was upset Tried to figure out why I was upset Did nothing and just stayed angry for a while Told the person off or yelled at them Hit the person
a Responses: 1) Strongly Disagree 2) Disagree 3) Neither Agree nor Disagree 4) Agree 5) Strongly Agree b Responses: 1) Never 2) Sometimes 3) Often c Responses: 1) Not at All Likely 2) A Little Likely 3) Somewhat Likely 4) Likely 5) Very Likely
364
This document is a research report submitted to the U.S. Department of Justice. This report has not been published by the Department. Opinions or points of view expressed are those of the author(s)
and do not necessarily reflect the official position or policies of the U.S. Department of Justice.
For more information about the Gang Resistance Education and Training (G.R.E.A.T.) Program, see the official G.R.E.A.T. website located at http://www.great-online.org/ .
For more information about youth gangs and effective responses, see the official website of the National Youth Gang Center located at http://www.iir.com/nygc/ .
For more information on the earlier National Evaluation of G.R.E.A.T., consult the following:
Esbensen, Finn-Aage. 2004. Evaluating G.R.E.A.T.: A School-based Gang Prevention Program – Research in Policy. Washington, D.C.: U.S. Department of Justice, Office of Justice Programs. Available online at: http://www.ncjrs.gov/pdffiles1/nij/198604.pdf .
Esbensen, Finn-Aage, Adrienne Freng, Terrance J. Taylor, Dana Peterson, and D. Wayne Osgood. 2002. The National Evaluation of the Gang Resistance Education and Training (G.R.E.A.T.) Program. Pp.139-167 in Winifred L. Reed and Scott H. Decker (Eds.), Responding to Gangs: Evaluation and Research. Washington, D.C.: U.S. Department of Justice, National Institute of Justice. Available online at: http://www.ncjrs.gov/pdffiles1/nij/190351.pdf .
Esbensen, Finn-Aage, D. Wayne Osgood, Terrance J. Taylor, Dana Peterson, and Adrienne Freng. 2001. How Great is G.R.E.A.T.?: Results from a Quasi-experimental Design. Criminology & Public Policy 1 (1): 87-118.
Peterson, Dana and Finn-Aage Esbensen. 2004. The Outlook is G.R.E.A.T.: What Educators Say about School-Based Prevention and the Gang Resistance Education and Training (G.R.E.A.T.) Program.” Evaluation Review 28(3): 218-45.
For more information on the current National Evaluation of G.R.E.A.T., consult the following:
Finn-Aage Esbensen, Terrance J. Taylor, Bradley T. Brick, and Dana Peterson. 2007. 2007 Report to Schools and Communities. National Evaluation of the Gang Resistance Education and Training (G.R.E.A.T.) Program, Department of Criminology and Criminal Justice, University of Missouri-St. Louis.
Dena Carson, Finn-Aage Esbensen, Terrance J. Taylor, and Dana Peterson. August 2008. Results from Surveys and Interviews with G.R.E.A.T.-trained Officers. National Evaluation of the Gang Resistance Education and Training (G.R.E.A.T.) Program, Department of Criminology and Criminal Justice, University of Missouri-St. Louis.
Finn-Aage Esbensen, Dana Peterson, Terrance J. Taylor, Vanessa R. Panfil, and Bradley T. Brick. 2008. 2008 Report to Schools and Communities: Anti-Social Norms among a Sample of Middle-School Students. National Evaluation of the Gang Resistance Education and Training (G.R.E.A.T.) Program, Department of Criminology and Criminal Justice, University of Missouri-St. Louis.
Krystle M. Leugoud, Finn-Aage Esbensen, Bradley T. Brick, and Terrance J. Taylor. March 2009. Observing the Implementer: Description of Findings, Recommendations, and Conclusions from GREAT Program Implementation Observations. National Evaluation of the Gang Resistance Education and Training (G.R.E.A.T.) Program, Department of Criminology and Criminal Justice, University of Missouri-St. Louis.
Dana Peterson, Vanessa R. Panfil, Finn-Aage Esbensen, and Terrance J. Taylor. June 2009. School Personnel Survey Report. National Evaluation of the Gang Resistance Education and Training (G.R.E.A.T.) Program, Department of Criminology and Criminal Justice, University of Missouri-St. Louis.
Terrance J. Taylor, Finn-Aage Esbensen, and Dana Peterson. June 2009. G.R.E.A.T. Officer Training (GOT) Report. National Evaluation of the Gang Resistance Education and Training (G.R.E.A.T.) Program, Department of Criminology and Criminal Justice, University of Missouri-St. Louis.
365
This document is a research report submitted to the U.S. Department of Justice. This report has not been published by the Department. Opinions or points of view expressed are those of the author(s)
and do not necessarily reflect the official position or policies of the U.S. Department of Justice.
National Evaluation of the
Gang Resistance Education and Training (G.R.E.A.T) Program
2010 Report to Schools and Communities:
School Safety and Victimization By
Kristy N. Matsuda, Ph.D.
Finn-Aage Esbensen, Ph.D.
Dana Peterson, Ph.D.
Terrance J. Taylor, Ph.D.
This research was made possible, in part, by the support and participation of seven school districts, including the School District of Philadelphia. This project was supported by Award No. 2006-JV-FX-0011 awarded by the National Institute of Justice, Office of Justice Programs, U.S. Department of Justice. We would also like to thank the numerous school administrators, teachers, students, and law enforcement officers for their involvement and assistance in this study. The opinions, findings, and conclusions or recommendations expressed in this publication are those of the authors and do not necessarily reflect the views of the Department of Justice or of the seven participating school districts.
For questions about this report or for more information about the evaluation, please contact:
G.R.E.A.T. Evaluation Department of Criminology & Criminal Justice
University of Missouri-St. Louis St. Louis, MO 63121-4499
Phone: (314) 516-4777 Fax: (314) 516-5048
366
This document is a research report submitted to the U.S. Department of Justice. This report has not been published by the Department. Opinions or points of view expressed are those of the author(s)
and do not necessarily reflect the official position or policies of the U.S. Department of Justice.
We would like to thank the numerous project staff for their work on this study:
Adrienne Freng, Ph.D. Greeley Site Coordinator
D. Wayne Osgood, Ph.D.
Research Assistants
Jared Armstrong
Elizabeth Atwood
Adam Baggett
Brad Brick
Cara Bumgardner
Dena Carson
Desiree Coleman
Kelly Cutler
Steven Downing
Erin Flannery
Teri Gulledge
Mikh Gunderman
Laura Hastings
Sara Hoover
Joelle Jones
Russell Jewell
Graham Jones
Krystle Leugoud
Nicole Logan
Kristyn McCord
Meredith McKinney
Chris Melde
Jeaneé Miller
Nick Miofski
Adrian Molina
Hyon Namgung
Sergio Olivares
Vanessa Panfil
Skyler Pimple
Katie Polzer
Zachary Robbins
Aaron Sego
Brad Stevens
Candice Tate
Mia Taylor
Saundra Trujillo
Karin Tusinski
Michael Vecchio
Ben Voss
Christina Watson
Stephanie Wiley
Sarah Young
367
This document is a research report submitted to the U.S. Department of Justice. This report has not been published by the Department. Opinions or points of view expressed are those of the author(s)
and do not necessarily reflect the official position or policies of the U.S. Department of Justice.

The G.R.E.A.T. Lessons
1. Welcome to G.R.E.A.T. – An introductory lessondesigned to provide students with basic knowledgeabout the connection between gangs, violence, drugabuse, and crime
2. What’s the Real Deal? – Designed to help studentslearn ways to analyze information sources anddevelop realistic beliefs about gangs and violence
3. It’s About Us – A lesson to help students learnabout their communities (e.g., family, school,residential area) and their responsibilities
4. Where Do We Go From Here? – Designed to helpstudents learn ways of developing realistic andachievable goals
5. Decisions, Decisions, Decisions – A lesson to helpstudents develop decision-making skills
6. Do You Hear What I Am Saying? – Designed tohelp students develop effective verbal and non-verbal communication skills
7. Walk in Someone Else’s Shoes – A lesson to helpstudents develop active listening and empathyskills, with a particular emphasis on understandingvictims of crime and violence
8. Say It Like You Mean It – Designed to helpstudents develop effective refusal skills
9. Getting Along Without Going Along – A lessonto reinforce and practice the refusal skills learned inLesson 8
10. Keeping Your Cool – A lesson to help studentsunderstand signs of anger and ways to manage theemotion
11. Keeping It Together – Designed to help studentsuse the anger skills learned in Lesson 10 and applythem to interpersonal situations where conflicts andviolence are possible
12. Working It Out – A lesson to help studentsdevelop effective conflict resolution techniques
13. Looking Back – Designed to conclude theG.R.E.A.T. program with an emphasis on theimportance of conflict resolution skills as a way toavoid gangs and violence; students also presenttheir projects aimed at improving their schools
The Gang Resistance Education and Training (G.R.E.A.T.) Program
The Gang Resistance Education and
Training (G.R.E.A.T.) program is a gang
and delinquency prevention program
delivered by law enforcement officers
within a school setting. Developed as a
local program in 1991 by Phoenix-area law
enforcement agencies, the program quickly
spread throughout the United States. The
original G.R.E.A.T. program operated as a
nine-lesson lecture-based curriculum taught
primarily in middle-school settings.
Results from an earlier National Evaluation
of the G.R.E.A.T. program (1995-2001)
found no differences between G.R.E.A.T.
and non-G.R.E.A.T. youths in terms of
behavioral characteristics (i.e., gang
membership and involvement in delinquent
behavior).
Based in part on these findings, the
G.R.E.A.T. program underwent a critical
review that resulted in substantial program
modifications. The revised curriculum (see
box at right) consists of 13 lessons aimed at
teaching youths the life-skills (e.g.,
communication and refusal skills, as well as
conflict resolution and anger management
techniques) thought necessary to prevent
involvement in gang behavior and
368
This document is a research report submitted to the U.S. Department of Justice. This report has not been published by the Department. Opinions or points of view expressed are those of the author(s)
and do not necessarily reflect the official position or policies of the U.S. Department of Justice.
delinquency. The revised G.R.E.A.T. curriculum was piloted in 2001, with full-scale
implementation occurring in 2003.
The program’s two main goals are:
1. To help youths avoid gang membership, violence, and criminal activity.
2. To help youths develop a positive relationship with law enforcement.
The National Evaluation of G.R.E.A.T. In 2006, following a competitive peer review process, the National Institute of Justice
awarded the University of Missouri-St. Louis funding to conduct the National Evaluation of the
G.R.E.A.T. program. The evaluation consists of a number of different components, including
student surveys; classroom observations in both G.R.E.A.T. and non-G.R.E.A.T. classrooms;
surveys of teachers, school administrators, and law enforcement officers; interviews with
G.R.E.A.T. officers and G.R.E.A.T. supervisors; and observations of G.R.E.AT. Officer Training
(G.O.T.) and G.R.E.A.T. Families sessions.
The current report provides information obtained from more than 2,880 students enrolled
in 216 schools in seven cities across the continental United States during the 2009-2010 school
year. This report is the fourth in a series of annual reports intended to provide school personnel,
law enforcement, and other interested community members with information about issues related
to self-reported youth attitudes and behaviors in their schools and communities. Data described
herein are drawn largely from the three-year follow-up survey of students (i.e., assessments three
years following G.R.E.A.T. program implementation), conducted during the 2009-2010 school
year. The survey questions were drawn from a variety of empirical studies assessing key risk
and protective factors associated with youth problem behaviors. In this year’s report, we focus
upon youths’ perceptions of disorder, and fear of and actual victimization in schools and
communities. We also include students’ reports of the likelihood they would report a
variety of school-based offenses and their perceptions of school safety.
369
This document is a research report submitted to the U.S. Department of Justice. This report has not been published by the Department. Opinions or points of view expressed are those of the author(s)
and do not necessarily reflect the official position or policies of the U.S. Department of Justice.
Site Selection
During the summer of 2006, efforts were made to identify cities for inclusion in the
National Evaluation of G.R.E.A.T. Site selection was based on three main criteria: 1) existence
of an established G.R.E.A.T. program, 2) geographic and demographic diversity, and 3) evidence
of gang activity. This site selection process was carried out in a series of steps. First, the
research staff contacted the G.R.E.A.T. Regional Administrators1 and Bureau of Justice
Assistance2 personnel to identify locales with institutionalized programs. Consideration was
given to factors such as the length of time the program had been in operation, number of
G.R.E.A.T.-trained officers, number of schools in which the program was offered, and the
components of the G.R.E.A.T. program implemented.3 Second, once this list of agencies was
constructed, the research staff contacted representatives in these cities to obtain more
information about the delivery of the G.R.E.A.T. program. Third, given the focus of the
program, information about gang activity in these potential cities was obtained from the National
Gang Center. Ultimately, a list of seven cities varying in size, region, and level of gang activity
were identified: Albuquerque, New Mexico; Chicago, Illinois; Greeley, Colorado; Nashville,
Tennessee; Philadelphia, Pennsylvania; Portland, Oregon; and a Dallas-Fort Worth (DFW),
Texas area location.
Once the cities were selected, the research staff worked with the primary local law
enforcement agency and the school district in each city to secure their cooperation. Upon district
approval, schools were identified for study participation, and principals were contacted. The
goal of the school selection was to identify schools that, taken as a whole, would be
representative of the districts. Once initial agreement to participate was obtained from the school
administrator, more detailed discussions/meetings were held between school personnel,
1 G.R.E.A.T. is a national program overseen by the G.R.E.A.T. National Policy Board (NPB). For administrative purposes, responsibilities for program oversight are held by (or “given to”) agencies operating in different geographic regions: 1) West, 2) Southwest, 3) Southeast, and 4) Midwest Atlantic. Additionally, two federal partners—the Bureau of Justice Assistance (BJA) and the Federal Law Enforcement Training Center (FLETC)—are involved in program training and oversight.
2 The Bureau of Justice Assistance (BJA) oversees the allocation of federal funds and grant compliance associated with the G.R.E.A.T. program.
3 In addition to the “core” middle school curriculum described in this report, three additional components are available for communities to adopt: an Elementary School component, a Summer component, and G.R.E.A.T. Families. Funders required the National Evaluation to assess both the middle school and Families components; thus, implementation of these components became part of the site selection criteria.
370
This document is a research report submitted to the U.S. Department of Justice. This report has not been published by the Department. Opinions or points of view expressed are those of the author(s)
and do not necessarily reflect the official position or policies of the U.S. Department of Justice.
G.R.E.A.T. officers, and the research team. Whenever possible, face-to-face meetings were
held, but in some instances final arrangements were made via telephone. School and police
personnel were informed of the purpose of the evaluation, issues related to the random
assignment of classrooms to the treatment or control condition (i.e., receive G.R.E.A.T./not
receive G.R.E.A.T.), procedures to obtain active parental consent for students in these
classrooms, scheduling G.R.E.A.T. program delivery, and other logistical issues associated with
the study design.
Student Sample
To maintain the scientific rigor of the evaluation design, in each participating school,
classrooms were randomly assigned to the treatment (i.e., G.R.E.A.T.) or control condition. All
students in the selected classrooms were eligible to participate in the evaluation. The 195
participating classrooms had a total of 4,905 students enrolled at the beginning of the data
collection process.
Federal law considers youth under the age of 18 to be a “special population” requiring
additional safeguards in research. The consent of the youth’s parent/guardian is required for the
youth’s participation in any research study. Parental consent generally takes one of two forms:
1) passive consent (i.e., parents must specify in writing that their child be excluded from
participation) or 2) active consent (i.e., parents must specify in writing that their child may be
included in the study).
Active parental consent procedures were implemented in this evaluation. The research
staff worked closely with the principals and classroom teachers during the consent process.
Teachers distributed and collected “consent form packets.” Each packet included a cover letter
explaining the purpose of the evaluation and an informed consent form (explaining the risks and
benefits of the students’ participation) for parents/guardians to read, sign, and return to the
teacher. When allowed by the districts, the research staff provided monetary compensation to
the teachers directly for their assistance. In some instances, district regulations prohibited such
compensation; in these cases, compensation was provided as a donation, made in honor of the
teachers, to the school or district. Students were also given a small personal radio, calculator, or
tote bag in exchange for returning a completed consent form. These rewards were provided to
students regardless of whether the parent/guardian granted or withheld consent for the youth to
371
This document is a research report submitted to the U.S. Department of Justice. This report has not been published by the Department. Opinions or points of view expressed are those of the author(s)
and do not necessarily reflect the official position or policies of the U.S. Department of Justice.
participate in the study. Overall, 89.1 percent of youths (N=4,372) returned a completed consent
form, with 77.9 percent of parents/guardians (N=3,820) allowing their child’s participation.
To date, students from all of the original 31 schools have completed pre-test surveys
(prior to implementation of the G.R.E.A.T. program) with a completion rate of 98.3 percent,
post-test surveys (shortly after completion of the G.R.E.A.T. program) with a completion rate of
94.6 percent, one-year follow up surveys with a completion rate of 87.3 percent, and two-year
follow-up surveys with a completion rate of 82.8 percent. Students from 29 of the original 31
schools have also completed the three year follow-up survey with a completion rate of 75.2
percent. Because one original school in the Chicago sample was ultimately unable to adhere to
the research design and was excluded from the study, two additional schools in Chicago were
added to the sample one year after the evaluation began in the other 29 schools; thus, students
from those two new schools have completed the two year follow-up, but they will not complete
their third year follow-up survey until the 2010-2011 school year.
This report utilizes the results of the three year follow-up survey from the 29 original
schools and the two year follow-up survey results from the two additional Chicago schools.
Although the sample was originally drawn from 31 middle schools in 2006-2007, by the
time these surveys were completed during the 2009-2010 school year, students were
enrolled in 216 different schools. A majority (95.8%) of the students we surveyed were in
high school during this survey period, with the remaining 4.2 percent in middle school.
Student Sample Characteristics
Table 1 presents the demographic characteristics and academic grades of the National
Evaluation of G.R.E.A.T. sample for the group of youths surveyed at the three year follow-up
and the two additional Chicago schools who completed their two year follow-up in AY 2009-
2010. In total, the responses from 2,881 students were included in this report. The sample was
evenly split between males and females and was racially/ethnically diverse, though the
race/ethnic breakdown varied by site. Overall, Latino youth accounted for 40 percent of the
sample, White youth were a little over one quarter of the sample (26.7%), and Black youth were
17.1 percent of the sample. In addition, 8.8 percent and 7.4 percent of youths identified their
race/ethnic backgrounds as “multi-racial” or “other” (such as Native American or Asian),
372
This document is a research report submitted to the U.S. Department of Justice. This report has not been published by the Department. Opinions or points of view expressed are those of the author(s)
and do not necessarily reflect the official position or policies of the U.S. Department of Justice.
respectively. The mean age of the sample this year was 14.49 years. As stated earlier, most of
the youth made the transition from middle to high school in this academic year.
To assess students’ academic achievement, the survey asked, “Looking at all of your
grades at school, would you say you were closest to a… 1) straight A student, 2) B student, 3) C
student, 4) D student, 5) F student, 6) Something else.” Students most commonly reported they
were B students (46.3%), then C students (29.3%), straight A students (16.2%), D (5%), and F
(2.1%). There were statistically significant differences (i.e., the differences were greater than
expected by chance) in academic achievement by site, sex, and race/ethnicity. Table 1 shows
students in Portland and Nashville report the largest proportion of straight As. A majority of
students in the DFW area report being B students. Chicago, Albuquerque, and Philadelphia
students were overrepresented as C students. Academic achievement also varied by sex and
race/ethnicity (not shown in table). Females reported greater academic achievement than male
students (Females: A=19.3%, B=47.4%, C=26.5%, D=4.5%, F=1.4%, Males: A=13.0%,
B=45.0%, C=32.4%, D=5.6%, F=2.8%). White youth were more likely to report being straight A
students than any other racial/ethnic group, while Latino youth were least likely to report straight
As (Straight As: White=27.6%, Black=10.3%, Latino=9.6%, Other=24.5%, Multi-
racial=16.7%).
Students provided information on their perceptions of school disorder and
neighborhood disorder, their fear of victimization at school and in the neighborhood, their
actual victimization experiences in the six months prior to the survey administration, their
likelihood of reporting school-based crimes, and their perceptions of school safety. In this
report, we detail students’ responses in each of these areas. We also explore how experiences
with school and neighborhood safety differ across sex, race/ethnicity, and academic
achievement.
373
This document is a research report submitted to the U.S. Department of Justice. This report has not been published by the Department. Opinions or points of view expressed are those of the author(s)
and do not necessarily reflect the official position or policies of the U.S. Department of Justice.
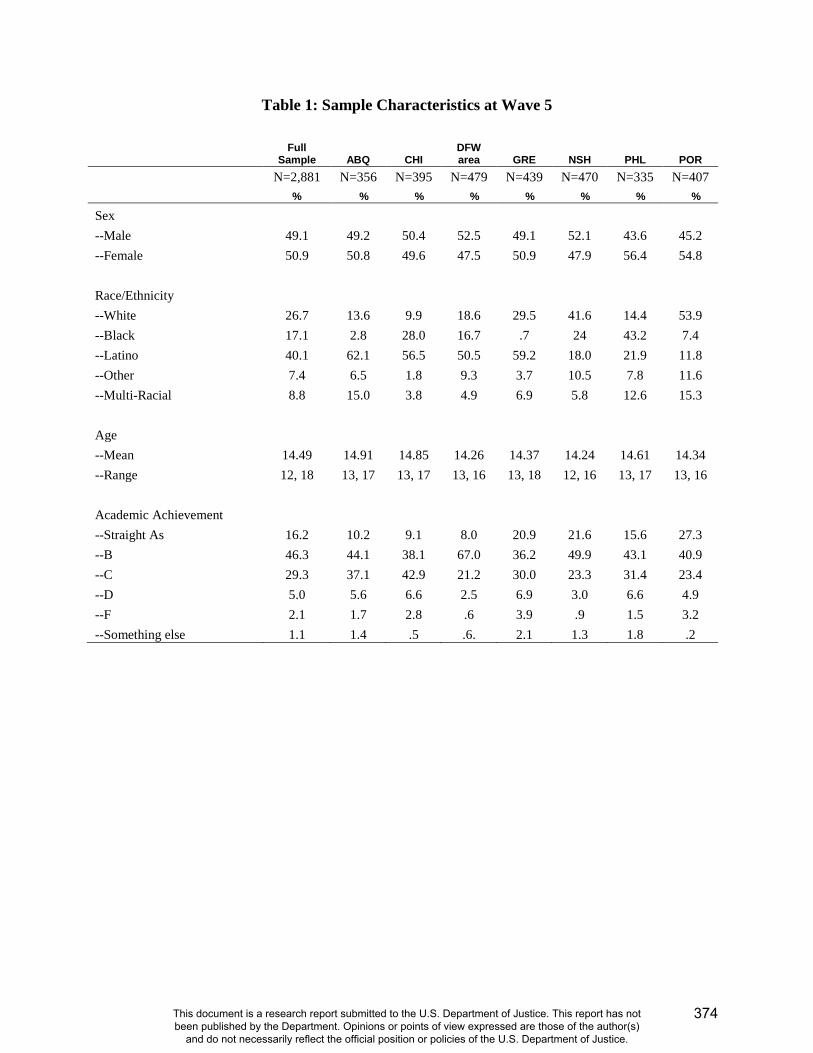
Table 1: Sample Characteristics at Wave 5
Full Sample ABQ CHI
DFW area GRE NSH PHL POR
N=2,881 N=356 N=395 N=479 N=439 N=470 N=335 N=407 % % % % % % % %
Sex --Male 49.1 49.2 50.4 52.5 49.1 52.1 43.6 45.2 --Female 50.9 50.8 49.6 47.5 50.9 47.9 56.4 54.8
Race/Ethnicity --White 26.7 13.6 9.9 18.6 29.5 41.6 14.4 53.9 --Black 17.1 2.8 28.0 16.7 .7 24 43.2 7.4 --Latino 40.1 62.1 56.5 50.5 59.2 18.0 21.9 11.8 --Other 7.4 6.5 1.8 9.3 3.7 10.5 7.8 11.6 --Multi-Racial 8.8 15.0 3.8 4.9 6.9 5.8 12.6 15.3
Age --Mean 14.49 14.91 14.85 14.26 14.37 14.24 14.61 14.34 --Range 12, 18 13, 17 13, 17 13, 16 13, 18 12, 16 13, 17 13, 16
Academic Achievement --Straight As 16.2 10.2 9.1 8.0 20.9 21.6 15.6 27.3 --B 46.3 44.1 38.1 67.0 36.2 49.9 43.1 40.9 --C 29.3 37.1 42.9 21.2 30.0 23.3 31.4 23.4 --D 5.0 5.6 6.6 2.5 6.9 3.0 6.6 4.9 --F 2.1 1.7 2.8 .6 3.9 .9 1.5 3.2 --Something else 1.1 1.4 .5 .6. 2.1 1.3 1.8 .2
374
This document is a research report submitted to the U.S. Department of Justice. This report has not been published by the Department. Opinions or points of view expressed are those of the author(s)
and do not necessarily reflect the official position or policies of the U.S. Department of Justice.
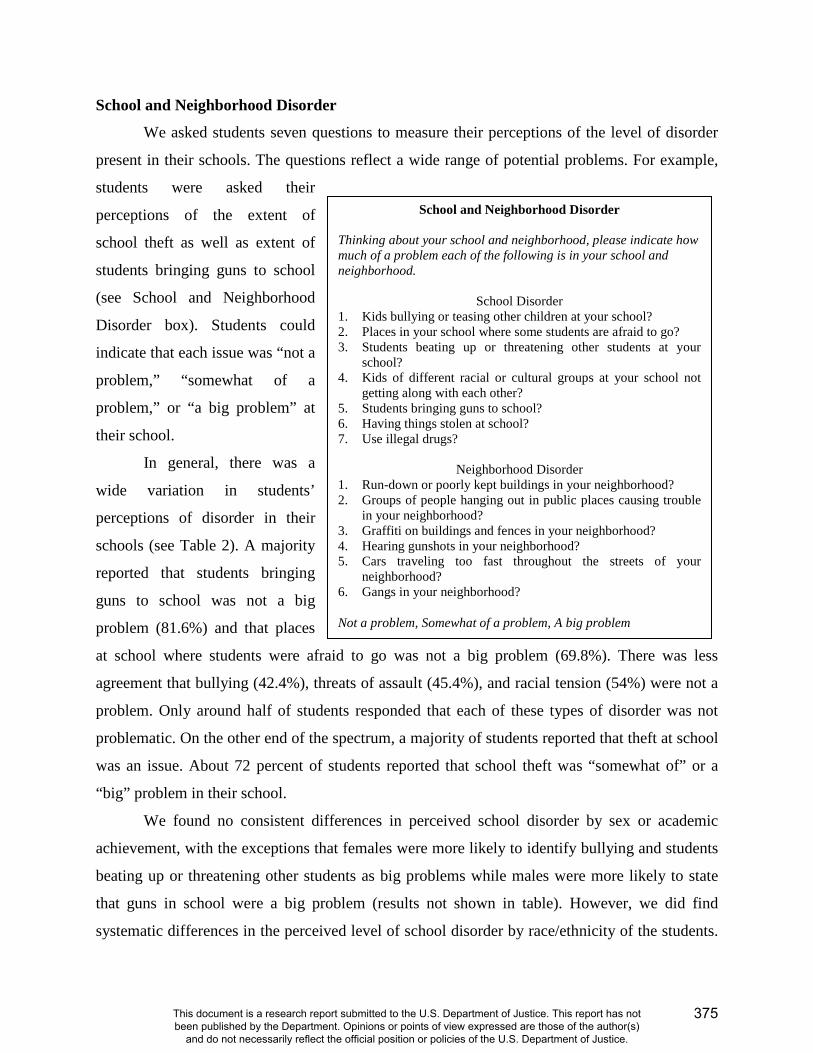
School and Neighborhood Disorder
We asked students seven questions to measure their perceptions of the level of disorder
present in their schools. The questions reflect a wide range of potential problems. For example,
students were asked their
perceptions of the extent of
school theft as well as extent of
students bringing guns to school
(see School and Neighborhood
Disorder box). Students could
indicate that each issue was “not a
problem,” “somewhat of a
problem,” or “a big problem” at
their school.
In general, there was a
wide variation in students’
perceptions of disorder in their
schools (see Table 2). A majority
reported that students bringing
guns to school was not a big
problem (81.6%) and that places
at school where students were afraid to go was not a big problem (69.8%). There was less
agreement that bullying (42.4%), threats of assault (45.4%), and racial tension (54%) were not a
problem. Only around half of students responded that each of these types of disorder was not
problematic. On the other end of the spectrum, a majority of students reported that theft at school
was an issue. About 72 percent of students reported that school theft was “somewhat of” or a
“big” problem in their school.
We found no consistent differences in perceived school disorder by sex or academic
achievement, with the exceptions that females were more likely to identify bullying and students
beating up or threatening other students as big problems while males were more likely to state
that guns in school were a big problem (results not shown in table). However, we did find
systematic differences in the perceived level of school disorder by race/ethnicity of the students.
School and Neighborhood Disorder
Thinking about your school and neighborhood, please indicate how much of a problem each of the following is in your school and neighborhood.
School Disorder1. Kids bullying or teasing other children at your school?2. Places in your school where some students are afraid to go?3. Students beating up or threatening other students at your
school?4. Kids of different racial or cultural groups at your school not
getting along with each other?5. Students bringing guns to school?6. Having things stolen at school?7. Use illegal drugs?
Neighborhood Disorder1. Run-down or poorly kept buildings in your neighborhood?2. Groups of people hanging out in public places causing trouble
in your neighborhood?3. Graffiti on buildings and fences in your neighborhood?4. Hearing gunshots in your neighborhood?5. Cars traveling too fast throughout the streets of your
neighborhood?6. Gangs in your neighborhood?
Not a problem, Somewhat of a problem, A big problem
375
This document is a research report submitted to the U.S. Department of Justice. This report has not been published by the Department. Opinions or points of view expressed are those of the author(s)
and do not necessarily reflect the official position or policies of the U.S. Department of Justice.
White students in our sample were more likely than any other racial/ethnic group to report that
each type of school disorder was “not a problem.” In contrast, Black students were more likely to
report that each type of disorder was “a big problem” in their school. The other racial/ethnic
groups and the multi-racial students reported lower levels of perceived disorder than Black
students, but consistently higher levels of disorder than White students in the sample.
Table 2 shows the percentage of youth who reported disorder as a “big” problem by
racial/ethnic category. As can be seen in the table, over four times the number of Black students
reported guns being brought to the school as a big problem compared to their White counterparts.
A similar patttern was true for every measure of school disorder. In an attempt to better
understand racial/ethnic differences, we expanded our comparison to students’ responses
regarding their neighborhood. Expanding the analysis helps to clarify whether disorder was
restricted to students’ schools or was a characteristic of the general community (with schools
simply one aspect of that larger community). The “School and Neighborhood Disorder” box
contains the six items students were asked to rate.
At least some proportion of students reported each type of neighborhood disorder as a big
problem in their communities. The most commonly (16.4%) reported type of neighborhood
disorder was cars speeding through the community (see Table 2). Only 36.2 percent of students
responded that this was NOT a problem (not shown in table). A majority of students reported
that each of the other issues was not a problem in their neighborhoods; however, as with school
disorder, a non-trivial portion of students considered each of these measures to be a big problem
(16.4% speeding cars, 14.6% gangs, 12.1% hearing gunshots, 11.5% grafitti, 11.2% people in
public causing trouble, and 7.3% run-down buildings). The racial/ethnic differences in the
perceptions of school disorder were further illuminated when examining neighborhood
differences. As with school disorder, White students reported less neighborhood disorder and
Black students reported the most disorder on every measure. Again, other minority youth
reported less neighborhood disorder than Black youth, but more than White students. These
results suggest that students’ perception of school disorder fit very closely with their perceptions
of the overall neighborhood context, which varied by race/ethnicity of the student.
We examined this issue further by looking at whether there were site differences present
across the seven cities, differences that might account, at least in part, for the race/ethnic
differences discussed above. On nearly every measure of school and neighborhood disorder,
376
This document is a research report submitted to the U.S. Department of Justice. This report has not been published by the Department. Opinions or points of view expressed are those of the author(s)
and do not necessarily reflect the official position or policies of the U.S. Department of Justice.
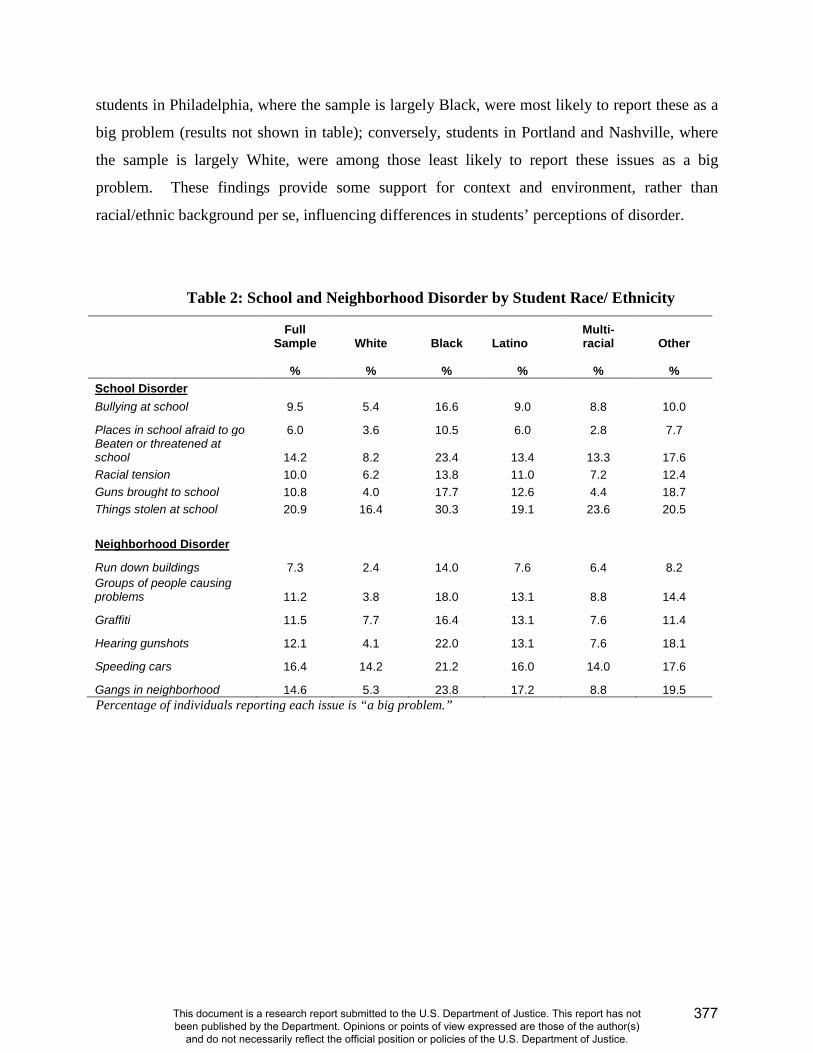
students in Philadelphia, where the sample is largely Black, were most likely to report these as a
big problem (results not shown in table); conversely, students in Portland and Nashville, where
the sample is largely White, were among those least likely to report these issues as a big
problem. These findings provide some support for context and environment, rather than
racial/ethnic background per se, influencing differences in students’ perceptions of disorder.
Table 2: School and Neighborhood Disorder by Student Race/ Ethnicity
Full Sample White Black Latino
Multi-racial Other
% % % % % % School Disorder Bullying at school 9.5 5.4 16.6 9.0 8.8 10.0
Places in school afraid to go 6.0 3.6 10.5 6.0 2.8 7.7 Beaten or threatened at school 14.2 8.2 23.4 13.4 13.3 17.6 Racial tension 10.0 6.2 13.8 11.0 7.2 12.4 Guns brought to school 10.8 4.0 17.7 12.6 4.4 18.7 Things stolen at school 20.9 16.4 30.3 19.1 23.6 20.5
Neighborhood Disorder
Run down buildings 7.3 2.4 14.0 7.6 6.4 8.2 Groups of people causing problems 11.2 3.8 18.0 13.1 8.8 14.4
Graffiti 11.5 7.7 16.4 13.1 7.6 11.4
Hearing gunshots 12.1 4.1 22.0 13.1 7.6 18.1
Speeding cars 16.4 14.2 21.2 16.0 14.0 17.6
Gangs in neighborhood 14.6 5.3 23.8 17.2 8.8 19.5 Percentage of individuals reporting each issue is “a big problem.”
377
This document is a research report submitted to the U.S. Department of Justice. This report has not been published by the Department. Opinions or points of view expressed are those of the author(s)
and do not necessarily reflect the official position or policies of the U.S. Department of Justice.
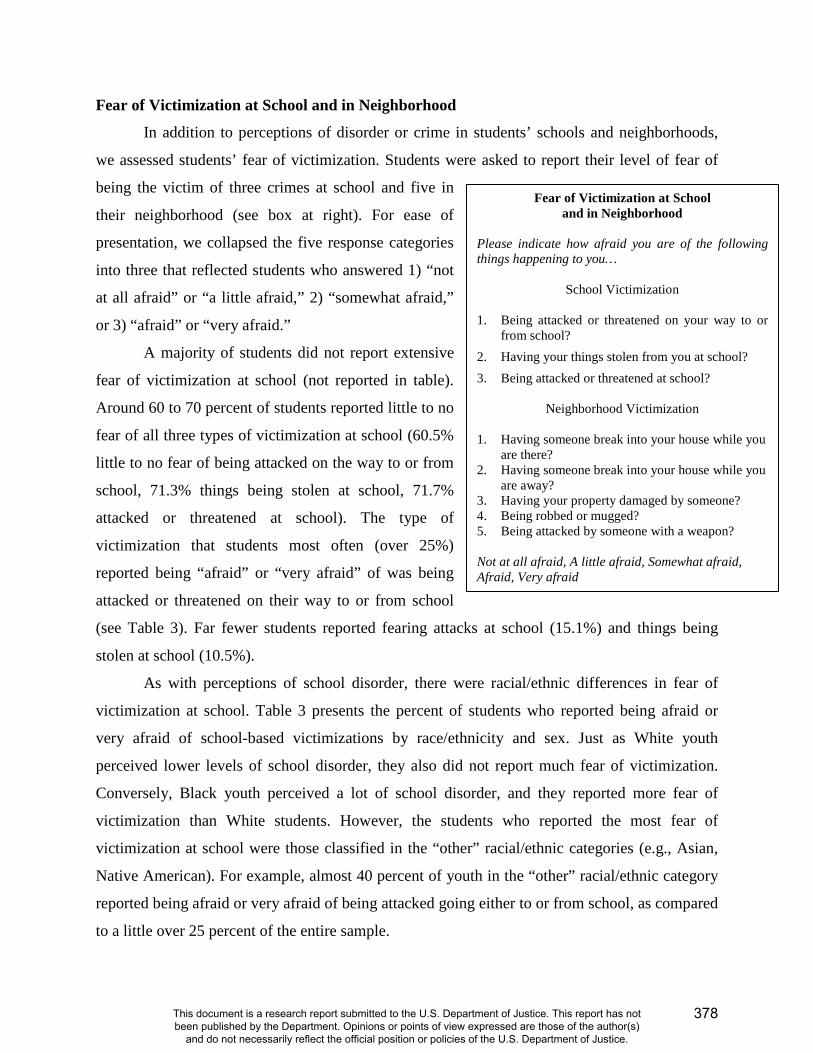
Fear of Victimization at School and in Neighborhood
In addition to perceptions of disorder or crime in students’ schools and neighborhoods,
we assessed students’ fear of victimization. Students were asked to report their level of fear of
being the victim of three crimes at school and five in
their neighborhood (see box at right). For ease of
presentation, we collapsed the five response categories
into three that reflected students who answered 1) “not
at all afraid” or “a little afraid,” 2) “somewhat afraid,”
or 3) “afraid” or “very afraid.”
A majority of students did not report extensive
fear of victimization at school (not reported in table).
Around 60 to 70 percent of students reported little to no
fear of all three types of victimization at school (60.5%
little to no fear of being attacked on the way to or from
school, 71.3% things being stolen at school, 71.7%
attacked or threatened at school). The type of
victimization that students most often (over 25%)
reported being “afraid” or “very afraid” of was being
attacked or threatened on their way to or from school
(see Table 3). Far fewer students reported fearing attacks at school (15.1%) and things being
stolen at school (10.5%).
As with perceptions of school disorder, there were racial/ethnic differences in fear of
victimization at school. Table 3 presents the percent of students who reported being afraid or
very afraid of school-based victimizations by race/ethnicity and sex. Just as White youth
perceived lower levels of school disorder, they also did not report much fear of victimization.
Conversely, Black youth perceived a lot of school disorder, and they reported more fear of
victimization than White students. However, the students who reported the most fear of
victimization at school were those classified in the “other” racial/ethnic categories (e.g., Asian,
Native American). For example, almost 40 percent of youth in the “other” racial/ethnic category
reported being afraid or very afraid of being attacked going either to or from school, as compared
to a little over 25 percent of the entire sample.
Fear of Victimization at School and in Neighborhood
Please indicate how afraid you are of the following things happening to you…
School Victimization
1. Being attacked or threatened on your way to orfrom school?
2. Having your things stolen from you at school?3. Being attacked or threatened at school?
Neighborhood Victimization
1. Having someone break into your house while youare there?
2. Having someone break into your house while youare away?
3. Having your property damaged by someone?4. Being robbed or mugged?5. Being attacked by someone with a weapon?
Not at all afraid, A little afraid, Somewhat afraid, Afraid, Very afraid
378
This document is a research report submitted to the U.S. Department of Justice. This report has not been published by the Department. Opinions or points of view expressed are those of the author(s)
and do not necessarily reflect the official position or policies of the U.S. Department of Justice.
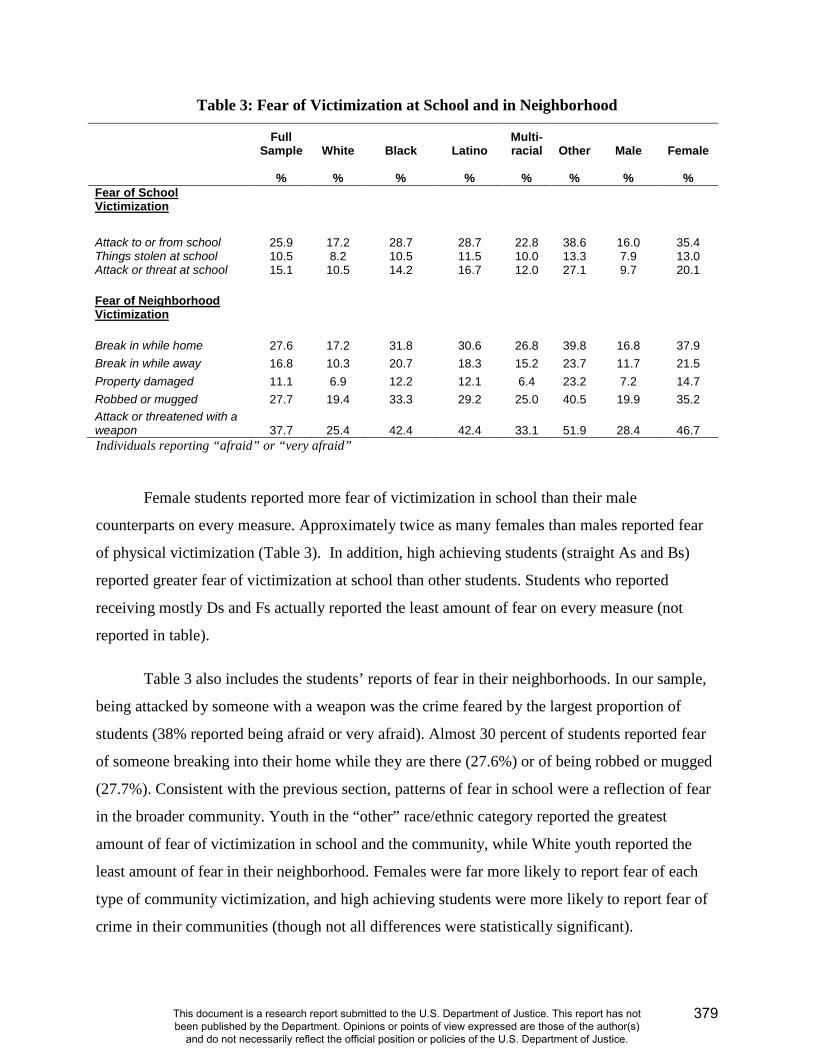
Table 3: Fear of Victimization at School and in Neighborhood
Full Sample White Black Latino
Multi-racial Other Male Female
% % % % % % % % Fear of School Victimization
Attack to or from school 25.9 17.2 28.7 28.7 22.8 38.6 16.0 35.4 Things stolen at school 10.5 8.2 10.5 11.5 10.0 13.3 7.9 13.0 Attack or threat at school 15.1 10.5 14.2 16.7 12.0 27.1 9.7 20.1 Fear of Neighborhood Victimization
Break in while home 27.6 17.2 31.8 30.6 26.8 39.8 16.8 37.9 Break in while away 16.8 10.3 20.7 18.3 15.2 23.7 11.7 21.5 Property damaged 11.1 6.9 12.2 12.1 6.4 23.2 7.2 14.7 Robbed or mugged 27.7 19.4 33.3 29.2 25.0 40.5 19.9 35.2 Attack or threatened with a weapon 37.7 25.4 42.4 42.4 33.1 51.9 28.4 46.7 Individuals reporting “afraid” or “very afraid”
Female students reported more fear of victimization in school than their male
counterparts on every measure. Approximately twice as many females than males reported fear
of physical victimization (Table 3). In addition, high achieving students (straight As and Bs)
reported greater fear of victimization at school than other students. Students who reported
receiving mostly Ds and Fs actually reported the least amount of fear on every measure (not
reported in table).
Table 3 also includes the students’ reports of fear in their neighborhoods. In our sample,
being attacked by someone with a weapon was the crime feared by the largest proportion of
students (38% reported being afraid or very afraid). Almost 30 percent of students reported fear
of someone breaking into their home while they are there (27.6%) or of being robbed or mugged
(27.7%). Consistent with the previous section, patterns of fear in school were a reflection of fear
in the broader community. Youth in the “other” race/ethnic category reported the greatest
amount of fear of victimization in school and the community, while White youth reported the
least amount of fear in their neighborhood. Females were far more likely to report fear of each
type of community victimization, and high achieving students were more likely to report fear of
crime in their communities (though not all differences were statistically significant).
379
This document is a research report submitted to the U.S. Department of Justice. This report has not been published by the Department. Opinions or points of view expressed are those of the author(s)
and do not necessarily reflect the official position or policies of the U.S. Department of Justice.
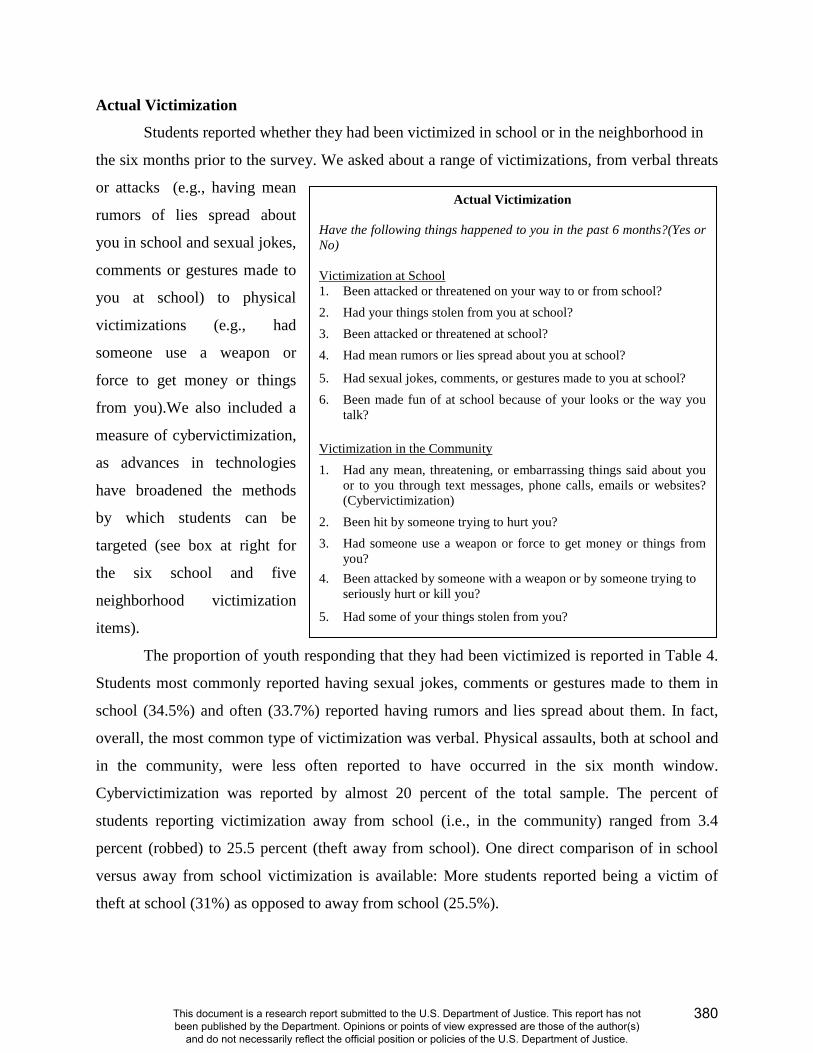
Actual Victimization
Students reported whether they had been victimized in school or in the neighborhood in
the six months prior to the survey. We asked about a range of victimizations, from verbal threats
or attacks (e.g., having mean
rumors of lies spread about
you in school and sexual jokes,
comments or gestures made to
you at school) to physical
victimizations (e.g., had
someone use a weapon or
force to get money or things
from you).We also included a
measure of cybervictimization,
as advances in technologies
have broadened the methods
by which students can be
targeted (see box at right for
the six school and five
neighborhood victimization
items).
The proportion of youth responding that they had been victimized is reported in Table 4.
Students most commonly reported having sexual jokes, comments or gestures made to them in
school (34.5%) and often (33.7%) reported having rumors and lies spread about them. In fact,
overall, the most common type of victimization was verbal. Physical assaults, both at school and
in the community, were less often reported to have occurred in the six month window.
Cybervictimization was reported by almost 20 percent of the total sample. The percent of
students reporting victimization away from school (i.e., in the community) ranged from 3.4
percent (robbed) to 25.5 percent (theft away from school). One direct comparison of in school
versus away from school victimization is available: More students reported being a victim of
theft at school (31%) as opposed to away from school (25.5%).
Actual Victimization
Have the following things happened to you in the past 6 months?(Yes or No)
Victimization at School 1. Been attacked or threatened on your way to or from school?2. Had your things stolen from you at school?3. Been attacked or threatened at school?4. Had mean rumors or lies spread about you at school?
5. Had sexual jokes, comments, or gestures made to you at school?6. Been made fun of at school because of your looks or the way you
talk?
Victimization in the Community 1. Had any mean, threatening, or embarrassing things said about you
or to you through text messages, phone calls, emails or websites? (Cybervictimization)
2. Been hit by someone trying to hurt you?3. Had someone use a weapon or force to get money or things from
you?4. Been attacked by someone with a weapon or by someone trying to
seriously hurt or kill you?
5. Had some of your things stolen from you?
380
This document is a research report submitted to the U.S. Department of Justice. This report has not been published by the Department. Opinions or points of view expressed are those of the author(s)
and do not necessarily reflect the official position or policies of the U.S. Department of Justice.
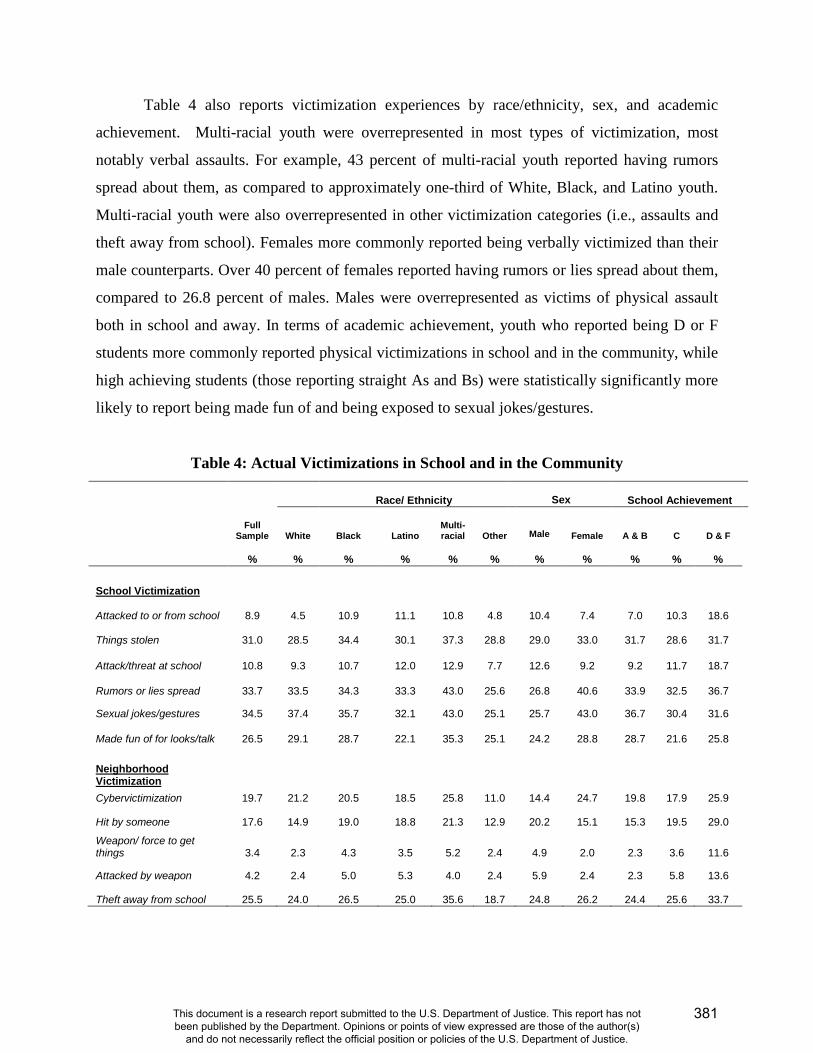
Table 4 also reports victimization experiences by race/ethnicity, sex, and academic
achievement. Multi-racial youth were overrepresented in most types of victimization, most
notably verbal assaults. For example, 43 percent of multi-racial youth reported having rumors
spread about them, as compared to approximately one-third of White, Black, and Latino youth.
Multi-racial youth were also overrepresented in other victimization categories (i.e., assaults and
theft away from school). Females more commonly reported being verbally victimized than their
male counterparts. Over 40 percent of females reported having rumors or lies spread about them,
compared to 26.8 percent of males. Males were overrepresented as victims of physical assault
both in school and away. In terms of academic achievement, youth who reported being D or F
students more commonly reported physical victimizations in school and in the community, while
high achieving students (those reporting straight As and Bs) were statistically significantly more
likely to report being made fun of and being exposed to sexual jokes/gestures.
Table 4: Actual Victimizations in School and in the Community
Race/ Ethnicity Sex School Achievement
Full Sample White Black Latino
Multi-racial Other Male Female A & B C D & F
% % % % % % % % % % %
School Victimization
Attacked to or from school 8.9 4.5 10.9 11.1 10.8 4.8 10.4 7.4 7.0 10.3 18.6
Things stolen 31.0 28.5 34.4 30.1 37.3 28.8 29.0 33.0 31.7 28.6 31.7
Attack/threat at school 10.8 9.3 10.7 12.0 12.9 7.7 12.6 9.2 9.2 11.7 18.7
Rumors or lies spread 33.7 33.5 34.3 33.3 43.0 25.6 26.8 40.6 33.9 32.5 36.7
Sexual jokes/gestures 34.5 37.4 35.7 32.1 43.0 25.1 25.7 43.0 36.7 30.4 31.6
Made fun of for looks/talk 26.5 29.1 28.7 22.1 35.3 25.1 24.2 28.8 28.7 21.6 25.8
Neighborhood Victimization Cybervictimization 19.7 21.2 20.5 18.5 25.8 11.0 14.4 24.7 19.8 17.9 25.9
Hit by someone 17.6 14.9 19.0 18.8 21.3 12.9 20.2 15.1 15.3 19.5 29.0
Weapon/ force to get things 3.4 2.3 4.3 3.5 5.2 2.4 4.9 2.0 2.3 3.6 11.6
Attacked by weapon 4.2 2.4 5.0 5.3 4.0 2.4 5.9 2.4 2.3 5.8 13.6
Theft away from school 25.5 24.0 26.5 25.0 35.6 18.7 24.8 26.2 24.4 25.6 33.7
381
This document is a research report submitted to the U.S. Department of Justice. This report has not been published by the Department. Opinions or points of view expressed are those of the author(s)
and do not necessarily reflect the official position or policies of the U.S. Department of Justice.
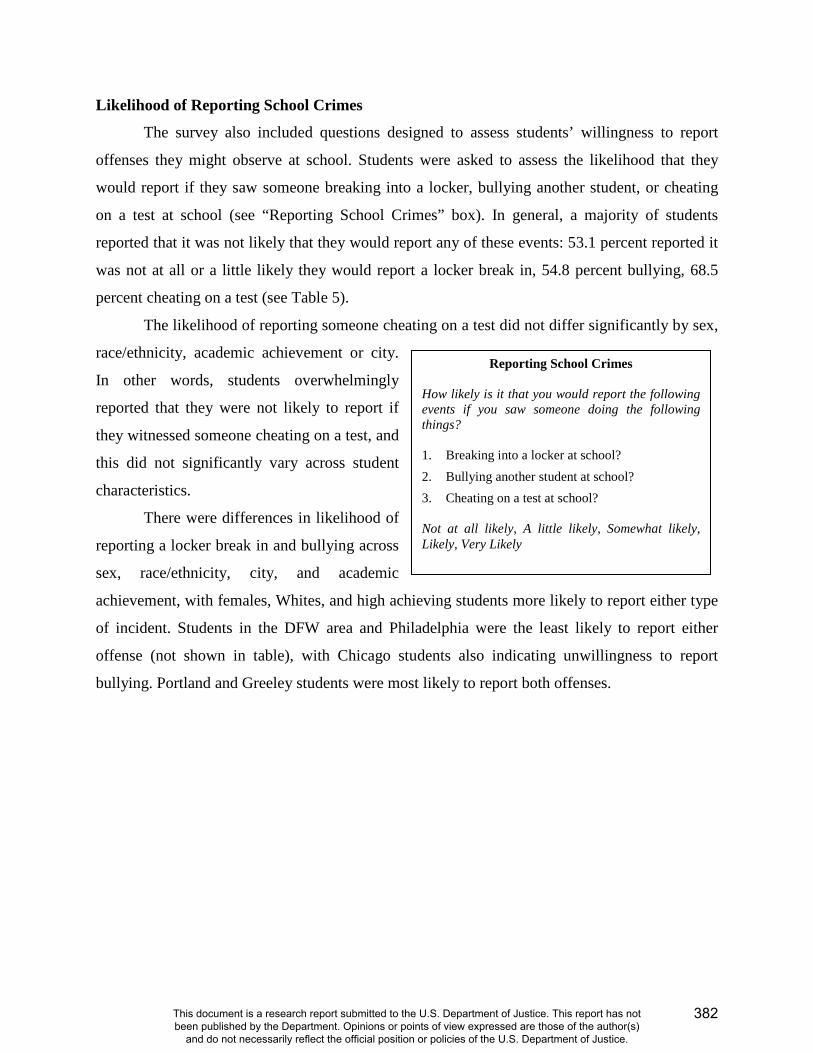
Likelihood of Reporting School Crimes
The survey also included questions designed to assess students’ willingness to report
offenses they might observe at school. Students were asked to assess the likelihood that they
would report if they saw someone breaking into a locker, bullying another student, or cheating
on a test at school (see “Reporting School Crimes” box). In general, a majority of students
reported that it was not likely that they would report any of these events: 53.1 percent reported it
was not at all or a little likely they would report a locker break in, 54.8 percent bullying, 68.5
percent cheating on a test (see Table 5).
The likelihood of reporting someone cheating on a test did not differ significantly by sex,
race/ethnicity, academic achievement or city.
In other words, students overwhelmingly
reported that they were not likely to report if
they witnessed someone cheating on a test, and
this did not significantly vary across student
characteristics.
There were differences in likelihood of
reporting a locker break in and bullying across
sex, race/ethnicity, city, and academic
achievement, with females, Whites, and high achieving students more likely to report either type
of incident. Students in the DFW area and Philadelphia were the least likely to report either
offense (not shown in table), with Chicago students also indicating unwillingness to report
bullying. Portland and Greeley students were most likely to report both offenses.
Reporting School Crimes
How likely is it that you would report the following events if you saw someone doing the following things?
1. Breaking into a locker at school?2. Bullying another student at school?3. Cheating on a test at school?
Not at all likely, A little likely, Somewhat likely, Likely, Very Likely
382
This document is a research report submitted to the U.S. Department of Justice. This report has not been published by the Department. Opinions or points of view expressed are those of the author(s)
and do not necessarily reflect the official position or policies of the U.S. Department of Justice.

Table 5: Likelihood to Report
Race/ Ethnicity Sex School Achievement
Full Sample White Black Latino
Multi-racial Other Male Female A & B C D & F
% % % % % % % % % % %
Locker Break in
Not or Little Likely 53.1 45.8 65.5 57.0 56.5 49.4 59.6 50.2 47.3 61.9 67.0
Somewhat 20.8 22.9 17.1 21.0 20.6 19.6 19.8 21.8 21.8 19.7 16.3
Likely or Very Likely 27.0 39.6 17.5 22.0 27.1 31.4 24.0 30.1 32.1 19.3 13.7
Report Bullying
Not or Little Likely 54.8 45.8 65.5 57.0 56.5 49.4 59.6 50.2 49.5 62.8 67.9
Somewhat 20.8 22.9 17.1 21.0 20.6 19.6 19.8 21.8 21.8 19.7 16.3
Likely or Very Likely 24.4 31.3 17.4 22.0 23.0 31.1 20.6 28.0 28.7 17.5 15.8
Cheating on a test
Not or Little Likely 68.5 66.6 70.7 69.4 69.0 63.8 69.1 67.7 66.3 72.1 73.0
Somewhat 16.7 16.3 14.2 17.0 16.4 21.0 16.0 17.5 18.1 14.3 13.3
Likely or Very Likely 14.8 17.1 15.1 13.7 11.7 15.2 14.9 14.8 15.6 13.6 13.8
Perceptions of School Safety
Finally, we asked students to report some additional perceptions regarding school safety.
First, we asked students whether they felt safer when police officers were present in their
schools. Almost half of all students (48.5%) agreed or strongly agreed that they felt safer when
police officers were in their schools (results not shown in a table). High achieving students,
White and other race/ethnic youth, and females were more likely to report that they felt safer.
Students reporting mostly Ds and Fs, Black youth, and males most often disagreed or strongly
disagreed with that sentiment.
We also asked students whether there was someone they could to talk to if they had a
problem at school. Students were asked to indicate whether they strongly agreed, agreed, neither
agreed nor disagreed, disagreed, or strongly disagreed that they had someone. Almost three-
fourths (71.7%) of all students agreed or strongly agreed that they had someone they could talk
383
This document is a research report submitted to the U.S. Department of Justice. This report has not been published by the Department. Opinions or points of view expressed are those of the author(s)
and do not necessarily reflect the official position or policies of the U.S. Department of Justice.

to about their school problems (not reported in a table). Importantly, youth with low levels of
school achievement were least likely to report that they had someone to speak to about their
school problems. Almost 77 percent of straight A and B students agreed or strongly agreed that
they had someone to speak to about their school problems as compared to only 58.3 percent of
students who reported earning mostly Ds and Fs. White youth were most likely to report having
someone to speak to about school problems (79.1%) as compared to 65.6 percent of Latino
youth, who were least likely to report this. Recall also that Latino youth were the least likely to
report straight As. In addition, females were more likely than males to report having someone to
speak to about their school problems (75.4% v. 67.9% respectively). Thus, having someone to
speak to about school related issues may be an important contributor to school achievement, or,
conversely, high achieving students may be more connected with and have more access to others,
be they adults or students, who can provide support.
Summary
This report provides descriptive information about some areas of interest for schools, law
enforcement, and communities participating in the National Evaluation of G.R.E.A.T. This year
we have focused on issues related to youths’ safety in their school and neighborhood. Though the
evaluation of the G.R.E.A.T. program began when the sample was in middle school, most of the
students made their transition to high school in the 2009-2010 school year. These data are based
on the most recent evaluation data and reflect youths’ attitudes and perceptions in high schools
across the seven cities. In short, we offer a recent snapshot of students’ perceptions of disorder,
fear of and actual victimization, the likelihood of reporting school problems, and perceptions of
school safety.
In general, most youth perceived their schools and neighborhoods to be orderly and safe
places. Despite the fact that school and community safety was not an overwhelming problem for
all students, disorder, fear, and actual victimization were still real and noticeable problems for
students. In addition, perceptions of school and community safety differed in important ways.
White youth were least likely to perceive school disorder, fear victimization, and (in most
cases) experience actual victimization. They were also the highest academically achieving group
and the most likely to report problems they might witness in their schools. While all minority
384
This document is a research report submitted to the U.S. Department of Justice. This report has not been published by the Department. Opinions or points of view expressed are those of the author(s)
and do not necessarily reflect the official position or policies of the U.S. Department of Justice.
youth groups experienced more disorder, fear, and victimization than White youth, Black youth
were the most likely to perceive disorder, youth of other race/ethnicity were the most likely to
fear victimization, and multi-racial youth were the most likely to actually be victimized. Females
were more likely than males to report fear of all types of victimization, but males were more
likely to actually be physically victimized, while females were more likely to be verbally
victimized. These data also show that trends in school-related disorder and fear mirrored the
broader neighborhood. In other words, racial/ethnic- and sex-based differences in perceived
disorder, fear of victimization, and actual victimization in school followed the same general
trends as in the community. Males, for example, were more likely than females to be physically
victimized both in school and in the community, and Black youth were more likely than others to
perceive disorder as problematic in their schools and neighborhoods.
Finally, a majority of youth reported having someone to talk to about their school
problems, though the youth who were least likely to report support in this area were also most
likely to be lower achieving students (i.e., male, Latino, and D & F students). Students did
indicate that having police officers in their schools made them feel safer, but it was clearly not a
consensus. Thirty-three percent of students reported that they neither agreed nor disagreed with
the sentiment, and only 48.5 percent agreed or strongly agreed with the notion. Thus, while
having police officers in schools may provide some perception of safety, results indicate that
having any supportive person in youths’ lives may be more important in helping them cope with
problems at school, such as their perception of disorder and their fear of or actual victimization.
385
This document is a research report submitted to the U.S. Department of Justice. This report has not been published by the Department. Opinions or points of view expressed are those of the author(s)
and do not necessarily reflect the official position or policies of the U.S. Department of Justice.

For more information about the National Evaluation of the Gang Resistance Education and
Training (G.R.E.A.T.) Program, see the website located
at http://www.umsl.edu/~ccj/html_files/great_evaluation.html.
For more information about the Gang Resistance Education and Training (G.R.E.A.T.) Program,
see the official G.R.E.A.T. website located at http://www.great-online.org/ .
For more information about youth gangs and effective responses, see the official website of the
National Gang Center located at http://www.nationalgangcenter.gov/ .
For more information on the earlier National Evaluation of G.R.E.A.T., consult the following:
Esbensen, Finn-Aage. 2004. Evaluating G.R.E.A.T.: A school-based gang prevention program – Research in Policy. Washington, D.C.: U.S. Department of Justice, Office of Justice Programs. Available online at: http://www.ncjrs.gov/pdffiles1/nij/198604.pdf .
Esbensen, Finn-Aage, Adrienne Freng, Terrance J. Taylor, Dana Peterson, and D. Wayne Osgood. 2002. The National Evaluation of the Gang Resistance Education and Training (G.R.E.A.T.) Program. Pp.139-167 in Winifred L. Reed and Scott H. Decker (Eds.), Responding to Gangs: Evaluation and Research. Washington, D.C.: U.S. Department of Justice, National Institute of Justice. Available online at: http://www.ncjrs.gov/pdffiles1/nij/190351.pdf .
Esbensen, Finn-Aage, D. Wayne Osgood, Terrance J. Taylor, Dana Peterson, and Adrienne Freng. 2001. How Great is G.R.E.A.T.?: Results from a quasi-experimental design. Criminology & Public Policy 1 (1): 87-118.
Winfree, L. Thomas, Jr., Dana Peterson Lynskey, and James R. Maupin. 1999. Developing Local Police and Federal Law Enforcement Partnerships: G.R.E.A.T. as a case study of policy implementation. Criminal Justice Review 24 (2): 145-168.
386
This document is a research report submitted to the U.S. Department of Justice. This report has not been published by the Department. Opinions or points of view expressed are those of the author(s)
and do not necessarily reflect the official position or policies of the U.S. Department of Justice.

Date Session Observed:_________________________________________________________
School Observed:______________________________________________________________
Teacher & Period Observed:_____________________________________________________
Officer Observed:______________________________________________________________
Lesson 1: Welcome to G.R.E.A.T.
_______ Start Time:
Lesson 1 (31-38 minute estimate)
Instructions: Please place a check mark after each area that is covered in the session. Leave the line blank when certain areas are not covered. Also, please note the actual starting time of the lesson (e.g., 12:30), as well as the approximate time spent on each part (e.g., 7 min.). After the checklist is completed, please complete the subsequent qualitative session evaluation.
I. Introduction to G.R.E.A.T. (10 minute estimate)
_______ 1. The officer introduces himself/herself to the students. _______ a. officer emphasizes training as a G.R.E.A.T. officer._______ 2. Students are asked to stand and introduce themselves. _______ 3. Officer gives a brief overview of the things they will learn today. _______ 4. Officer writes G.R.E.A.T. on the board and provides the meaning of each letter. _______ 5. Officer provides a brief history of the program. _______ 6. The officer shares the 3 main goals of the program. _______ 7. The officer discusses his/her expectations of the students for G.R.E.A.T. graduation.
_______ Actual time spent on Part I:
II. G.R.E.A.T. Ground Rules (3 minute estimate)
_______ 1. The officer informs the students that there are ground rules to be followed. _______ 2. Students instructed to open handbook to page 3 _______ 3. The officer reviews the ground rules listed in the handbook. _______ 4. Students are asked to note the blank line in their handbook. _______ a. The officer writes “We will not use physical contact during any of the
activities” on the board. _______ b. Students are instructed to write this in the blank space
in their handbooks.
_______ Actual time spent on Part II
387
This document is a research report submitted to the U.S. Department of Justice. This report has not been published by the Department. Opinions or points of view expressed are those of the author(s)
and do not necessarily reflect the official position or policies of the U.S. Department of Justice.
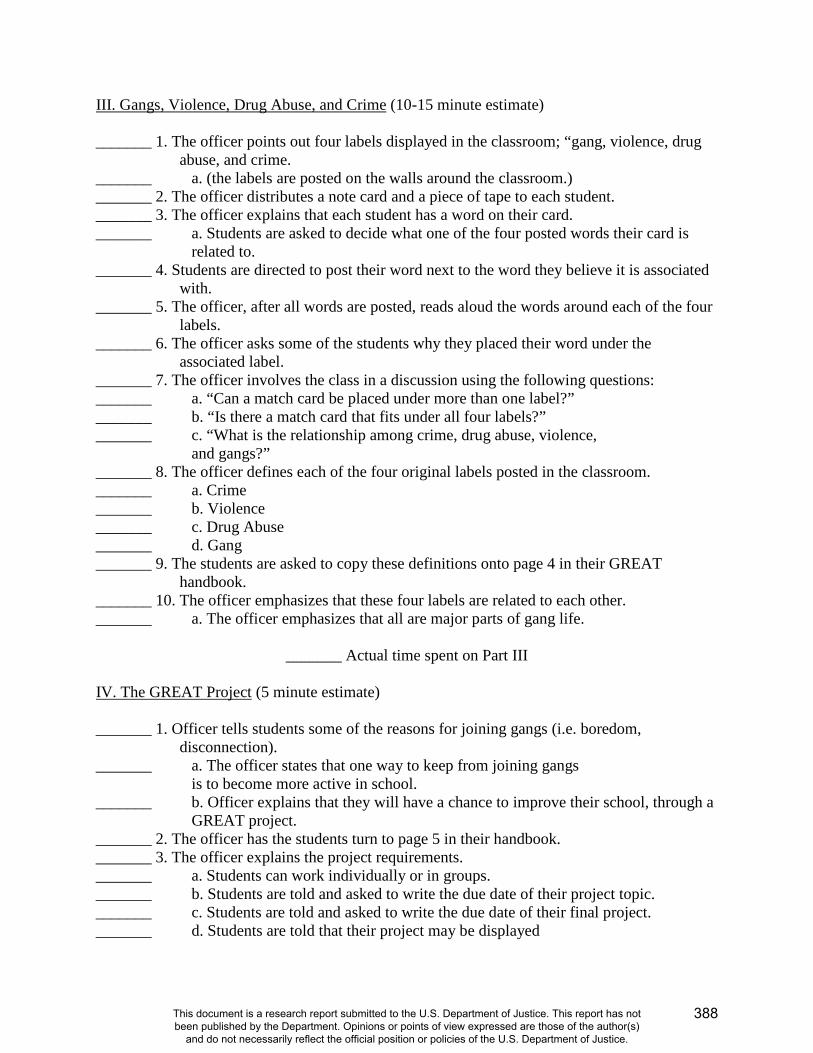
III. Gangs, Violence, Drug Abuse, and Crime (10-15 minute estimate) _______ 1. The officer points out four labels displayed in the classroom; “gang, violence, drug
abuse, and crime. _______ a. (the labels are posted on the walls around the classroom.) _______ 2. The officer distributes a note card and a piece of tape to each student. _______ 3. The officer explains that each student has a word on their card. _______ a. Students are asked to decide what one of the four posted words their card is
related to. _______ 4. Students are directed to post their word next to the word they believe it is associated
with. _______ 5. The officer, after all words are posted, reads aloud the words around each of the four
labels. _______ 6. The officer asks some of the students why they placed their word under the
associated label. _______ 7. The officer involves the class in a discussion using the following questions: _______ a. “Can a match card be placed under more than one label?” _______ b. “Is there a match card that fits under all four labels?” _______ c. “What is the relationship among crime, drug abuse, violence, and gangs?” _______ 8. The officer defines each of the four original labels posted in the classroom. _______ a. Crime _______ b. Violence _______ c. Drug Abuse _______ d. Gang _______ 9. The students are asked to copy these definitions onto page 4 in their GREAT
handbook. _______ 10. The officer emphasizes that these four labels are related to each other. _______ a. The officer emphasizes that all are major parts of gang life.
_______ Actual time spent on Part III IV. The GREAT Project (5 minute estimate) _______ 1. Officer tells students some of the reasons for joining gangs (i.e. boredom,
disconnection). _______ a. The officer states that one way to keep from joining gangs is to become more active in school. _______ b. Officer explains that they will have a chance to improve their school, through a
GREAT project. _______ 2. The officer has the students turn to page 5 in their handbook. _______ 3. The officer explains the project requirements. _______ a. Students can work individually or in groups. _______ b. Students are told and asked to write the due date of their project topic. _______ c. Students are told and asked to write the due date of their final project. _______ d. Students are told that their project may be displayed
388
This document is a research report submitted to the U.S. Department of Justice. This report has not been published by the Department. Opinions or points of view expressed are those of the author(s)
and do not necessarily reflect the official position or policies of the U.S. Department of Justice.
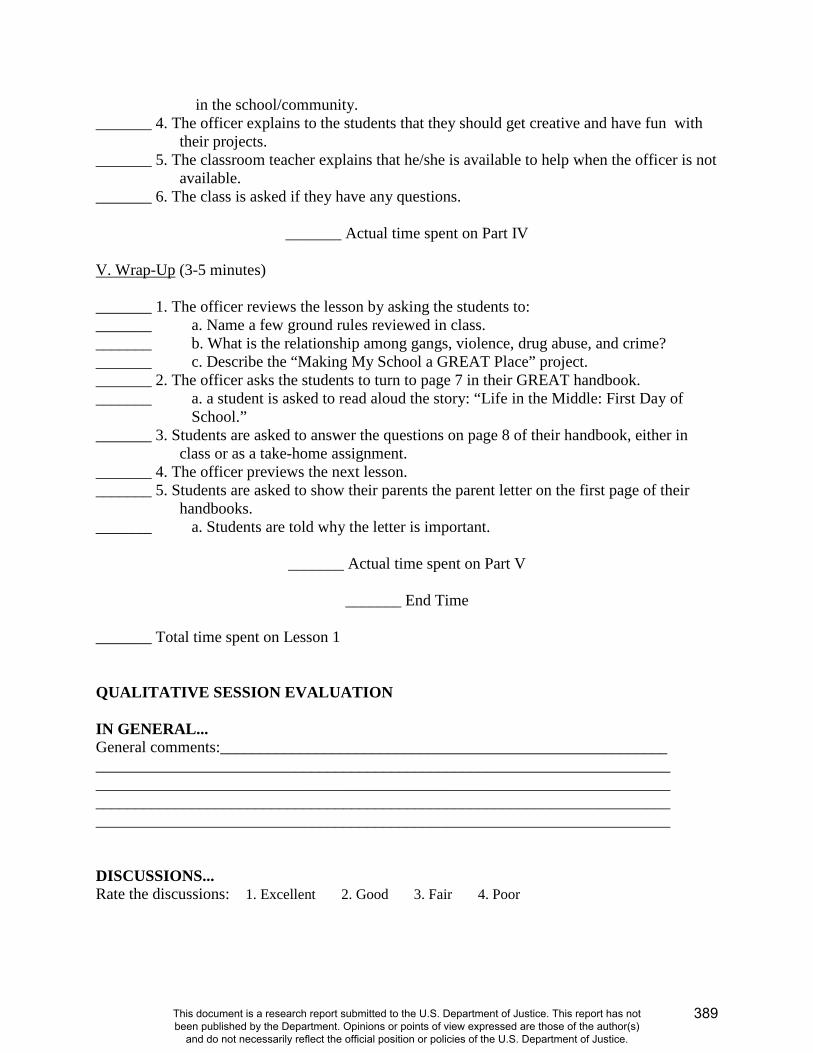
in the school/community. _______ 4. The officer explains to the students that they should get creative and have fun with
their projects. _______ 5. The classroom teacher explains that he/she is available to help when the officer is not
available. _______ 6. The class is asked if they have any questions.
_______ Actual time spent on Part IV V. Wrap-Up (3-5 minutes) _______ 1. The officer reviews the lesson by asking the students to: _______ a. Name a few ground rules reviewed in class. _______ b. What is the relationship among gangs, violence, drug abuse, and crime? _______ c. Describe the “Making My School a GREAT Place” project. _______ 2. The officer asks the students to turn to page 7 in their GREAT handbook. _______ a. a student is asked to read aloud the story: “Life in the Middle: First Day of
School.” _______ 3. Students are asked to answer the questions on page 8 of their handbook, either in
class or as a take-home assignment. _______ 4. The officer previews the next lesson. _______ 5. Students are asked to show their parents the parent letter on the first page of their
handbooks. _______ a. Students are told why the letter is important.
_______ Actual time spent on Part V
_______ End Time
_______ Total time spent on Lesson 1 QUALITATIVE SESSION EVALUATION IN GENERAL... General comments:________________________________________________________ ________________________________________________________________________ ________________________________________________________________________ ________________________________________________________________________ ________________________________________________________________________ DISCUSSIONS... Rate the discussions: 1. Excellent 2. Good 3. Fair 4. Poor
389
This document is a research report submitted to the U.S. Department of Justice. This report has not been published by the Department. Opinions or points of view expressed are those of the author(s)
and do not necessarily reflect the official position or policies of the U.S. Department of Justice.
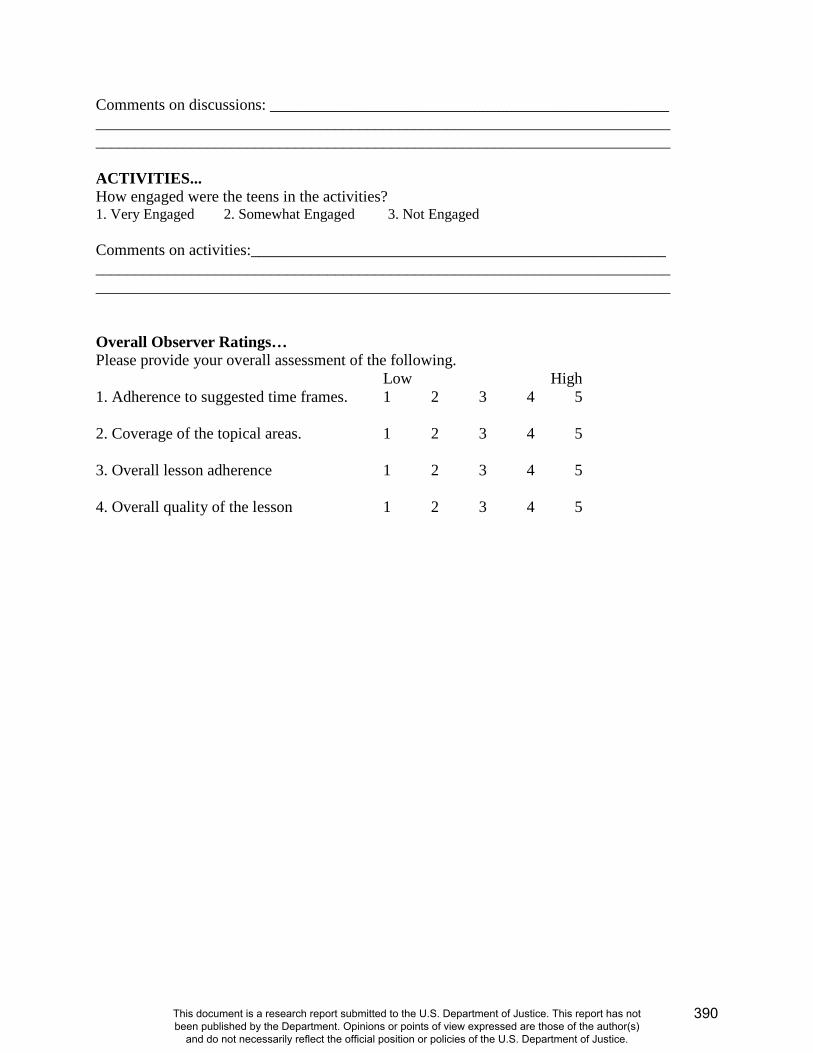
Comments on discussions: __________________________________________________ ________________________________________________________________________ ________________________________________________________________________ ACTIVITIES... How engaged were the teens in the activities? 1. Very Engaged 2. Somewhat Engaged 3. Not Engaged Comments on activities:____________________________________________________ ________________________________________________________________________ ________________________________________________________________________ Overall Observer Ratings… Please provide your overall assessment of the following. Low High 1. Adherence to suggested time frames. 1 2 3 4 5 2. Coverage of the topical areas. 1 2 3 4 5 3. Overall lesson adherence 1 2 3 4 5 4. Overall quality of the lesson 1 2 3 4 5
390
This document is a research report submitted to the U.S. Department of Justice. This report has not been published by the Department. Opinions or points of view expressed are those of the author(s)
and do not necessarily reflect the official position or policies of the U.S. Department of Justice.
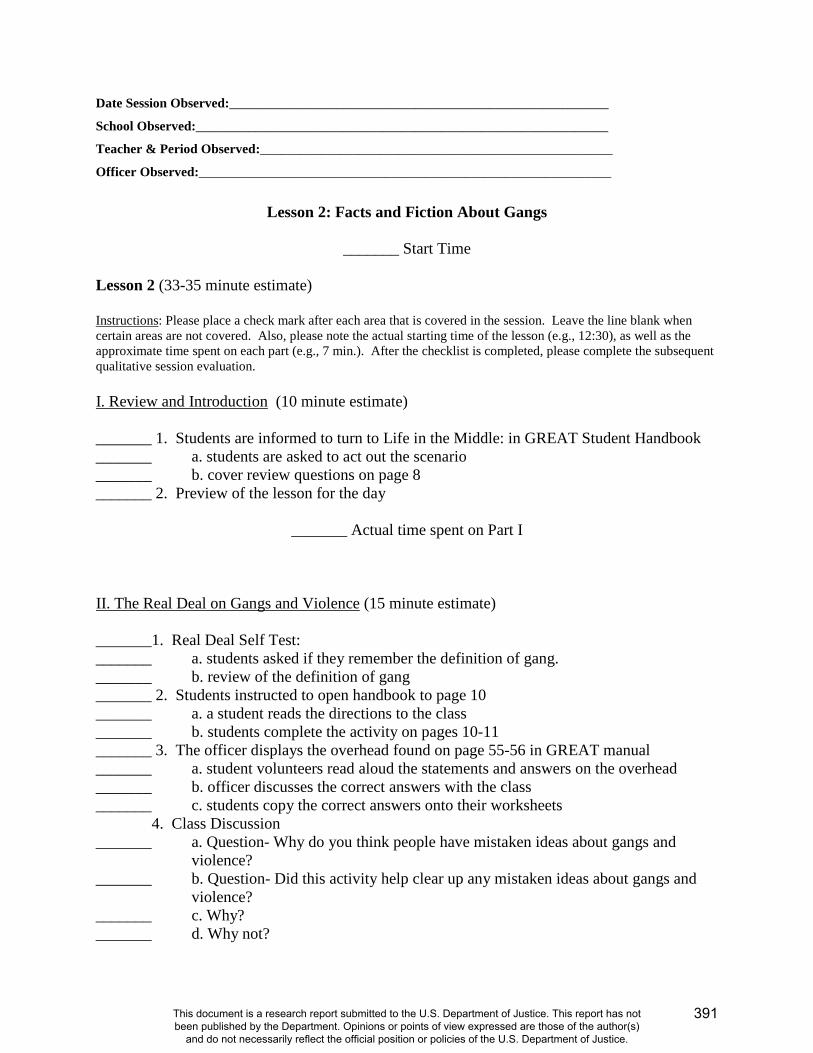
Date Session Observed:_________________________________________________________
School Observed:______________________________________________________________
Teacher & Period Observed:_____________________________________________________
Officer Observed:______________________________________________________________
Lesson 2: Facts and Fiction About Gangs
_______ Start Time Lesson 2 (33-35 minute estimate) Instructions: Please place a check mark after each area that is covered in the session. Leave the line blank when certain areas are not covered. Also, please note the actual starting time of the lesson (e.g., 12:30), as well as the approximate time spent on each part (e.g., 7 min.). After the checklist is completed, please complete the subsequent qualitative session evaluation. I. Review and Introduction (10 minute estimate) _______ 1. Students are informed to turn to Life in the Middle: in GREAT Student Handbook _______ a. students are asked to act out the scenario _______ b. cover review questions on page 8 _______ 2. Preview of the lesson for the day
_______ Actual time spent on Part I II. The Real Deal on Gangs and Violence (15 minute estimate) _______1. Real Deal Self Test: _______ a. students asked if they remember the definition of gang. _______ b. review of the definition of gang _______ 2. Students instructed to open handbook to page 10 _______ a. a student reads the directions to the class _______ b. students complete the activity on pages 10-11 _______ 3. The officer displays the overhead found on page 55-56 in GREAT manual _______ a. student volunteers read aloud the statements and answers on the overhead _______ b. officer discusses the correct answers with the class _______ c. students copy the correct answers onto their worksheets
4. Class Discussion _______ a. Question- Why do you think people have mistaken ideas about gangs and
violence? _______ b. Question- Did this activity help clear up any mistaken ideas about gangs and
violence? _______ c. Why? _______ d. Why not?
391
This document is a research report submitted to the U.S. Department of Justice. This report has not been published by the Department. Opinions or points of view expressed are those of the author(s)
and do not necessarily reflect the official position or policies of the U.S. Department of Justice.
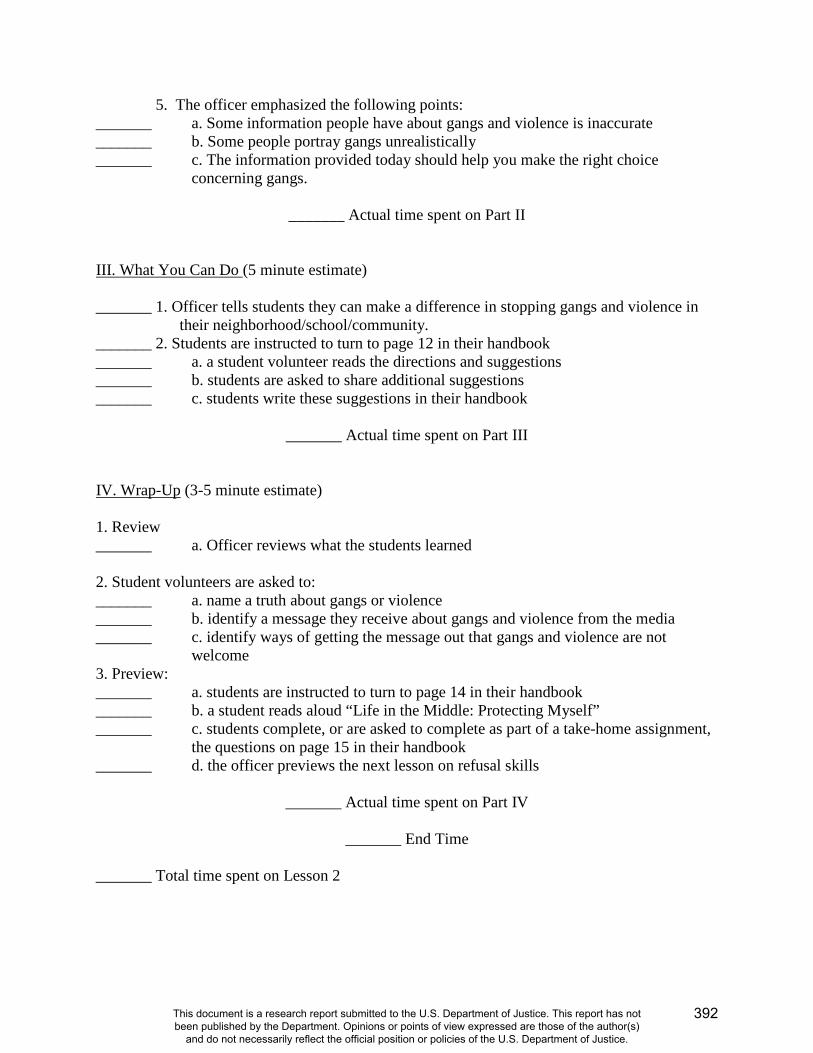
5. The officer emphasized the following points: _______ a. Some information people have about gangs and violence is inaccurate _______ b. Some people portray gangs unrealistically _______ c. The information provided today should help you make the right choice
concerning gangs.
_______ Actual time spent on Part II III. What You Can Do (5 minute estimate) _______ 1. Officer tells students they can make a difference in stopping gangs and violence in
their neighborhood/school/community. _______ 2. Students are instructed to turn to page 12 in their handbook _______ a. a student volunteer reads the directions and suggestions _______ b. students are asked to share additional suggestions _______ c. students write these suggestions in their handbook
_______ Actual time spent on Part III IV. Wrap-Up (3-5 minute estimate) 1. Review _______ a. Officer reviews what the students learned 2. Student volunteers are asked to: _______ a. name a truth about gangs or violence _______ b. identify a message they receive about gangs and violence from the media _______ c. identify ways of getting the message out that gangs and violence are not
welcome 3. Preview: _______ a. students are instructed to turn to page 14 in their handbook _______ b. a student reads aloud “Life in the Middle: Protecting Myself” _______ c. students complete, or are asked to complete as part of a take-home assignment,
the questions on page 15 in their handbook _______ d. the officer previews the next lesson on refusal skills
_______ Actual time spent on Part IV
_______ End Time
_______ Total time spent on Lesson 2
392
This document is a research report submitted to the U.S. Department of Justice. This report has not been published by the Department. Opinions or points of view expressed are those of the author(s)
and do not necessarily reflect the official position or policies of the U.S. Department of Justice.
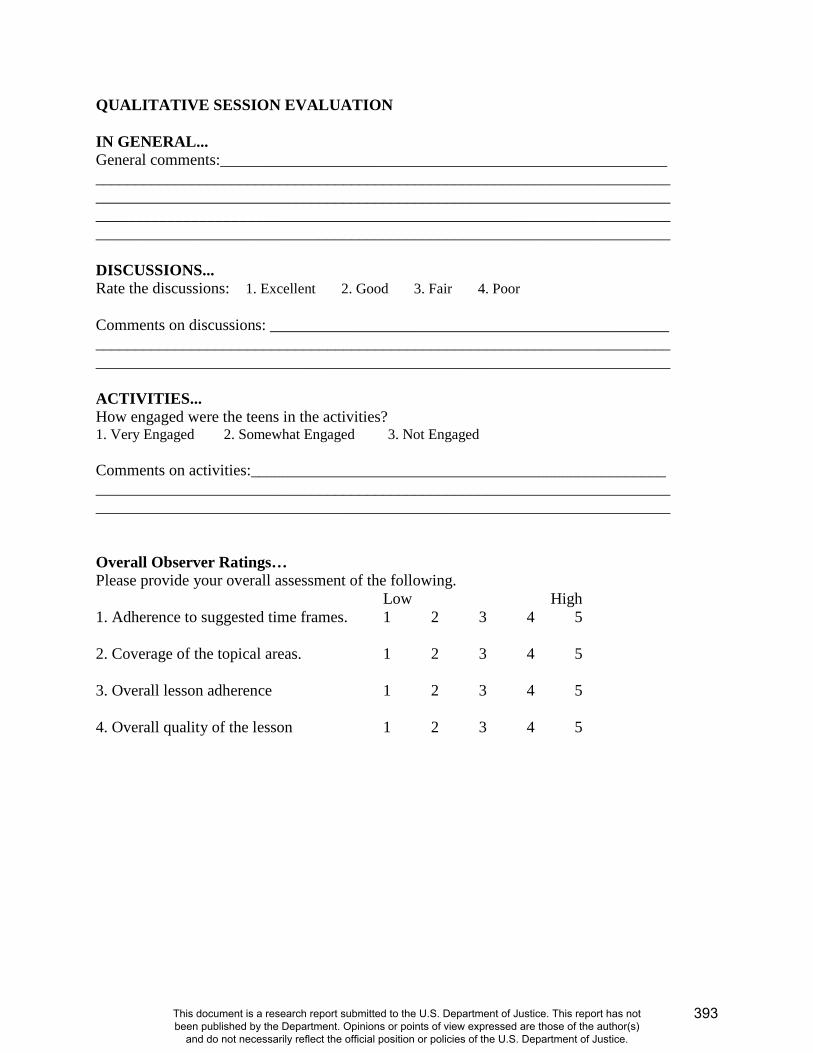
QUALITATIVE SESSION EVALUATION IN GENERAL... General comments:________________________________________________________ ________________________________________________________________________ ________________________________________________________________________ ________________________________________________________________________ ________________________________________________________________________ DISCUSSIONS... Rate the discussions: 1. Excellent 2. Good 3. Fair 4. Poor Comments on discussions: __________________________________________________ ________________________________________________________________________ ________________________________________________________________________ ACTIVITIES... How engaged were the teens in the activities? 1. Very Engaged 2. Somewhat Engaged 3. Not Engaged Comments on activities:____________________________________________________ ________________________________________________________________________ ________________________________________________________________________ Overall Observer Ratings… Please provide your overall assessment of the following. Low High 1. Adherence to suggested time frames. 1 2 3 4 5 2. Coverage of the topical areas. 1 2 3 4 5 3. Overall lesson adherence 1 2 3 4 5 4. Overall quality of the lesson 1 2 3 4 5
393
This document is a research report submitted to the U.S. Department of Justice. This report has not been published by the Department. Opinions or points of view expressed are those of the author(s)
and do not necessarily reflect the official position or policies of the U.S. Department of Justice.
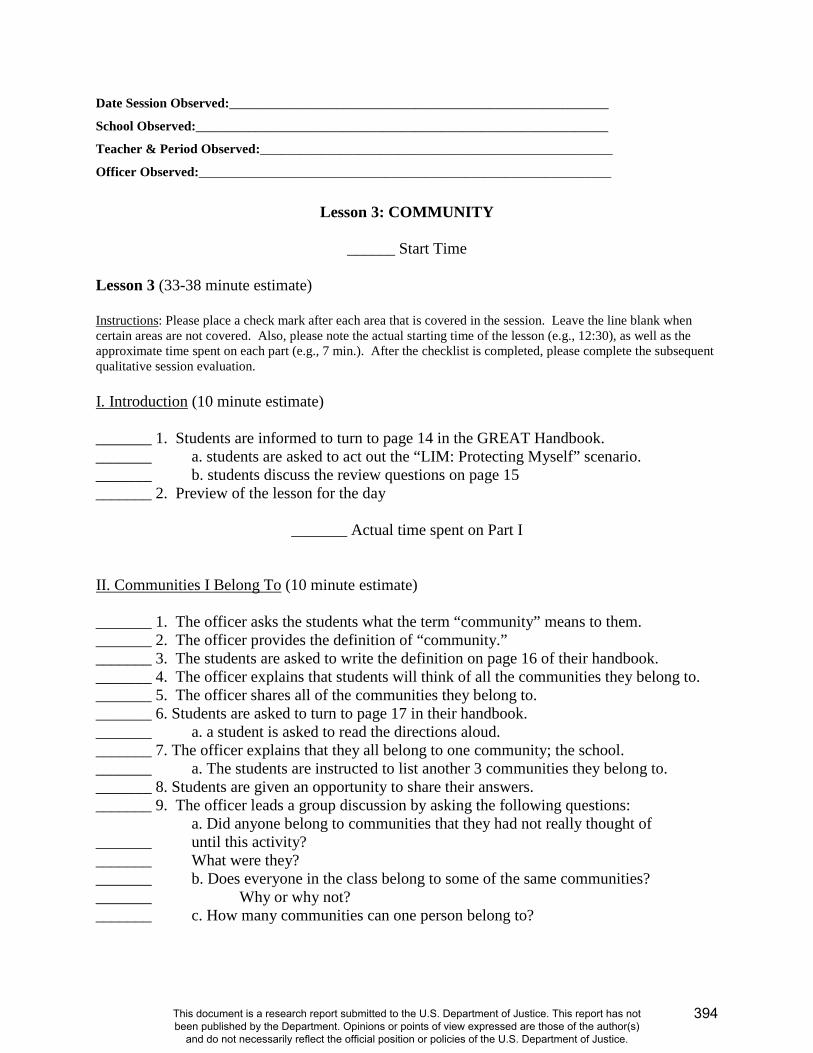
Date Session Observed:_________________________________________________________
School Observed:______________________________________________________________
Teacher & Period Observed:_____________________________________________________
Officer Observed:______________________________________________________________
Lesson 3: COMMUNITY
______ Start Time Lesson 3 (33-38 minute estimate) Instructions: Please place a check mark after each area that is covered in the session. Leave the line blank when certain areas are not covered. Also, please note the actual starting time of the lesson (e.g., 12:30), as well as the approximate time spent on each part (e.g., 7 min.). After the checklist is completed, please complete the subsequent qualitative session evaluation. I. Introduction (10 minute estimate) _______ 1. Students are informed to turn to page 14 in the GREAT Handbook. _______ a. students are asked to act out the “LIM: Protecting Myself” scenario. _______ b. students discuss the review questions on page 15 _______ 2. Preview of the lesson for the day
_______ Actual time spent on Part I II. Communities I Belong To (10 minute estimate) _______ 1. The officer asks the students what the term “community” means to them. _______ 2. The officer provides the definition of “community.” _______ 3. The students are asked to write the definition on page 16 of their handbook. _______ 4. The officer explains that students will think of all the communities they belong to. _______ 5. The officer shares all of the communities they belong to. _______ 6. Students are asked to turn to page 17 in their handbook. _______ a. a student is asked to read the directions aloud. _______ 7. The officer explains that they all belong to one community; the school. _______ a. The students are instructed to list another 3 communities they belong to. _______ 8. Students are given an opportunity to share their answers. _______ 9. The officer leads a group discussion by asking the following questions:
a. Did anyone belong to communities that they had not really thought of _______ until this activity? _______ What were they? _______ b. Does everyone in the class belong to some of the same communities? _______ Why or why not? _______ c. How many communities can one person belong to?
394
This document is a research report submitted to the U.S. Department of Justice. This report has not been published by the Department. Opinions or points of view expressed are those of the author(s)
and do not necessarily reflect the official position or policies of the U.S. Department of Justice.
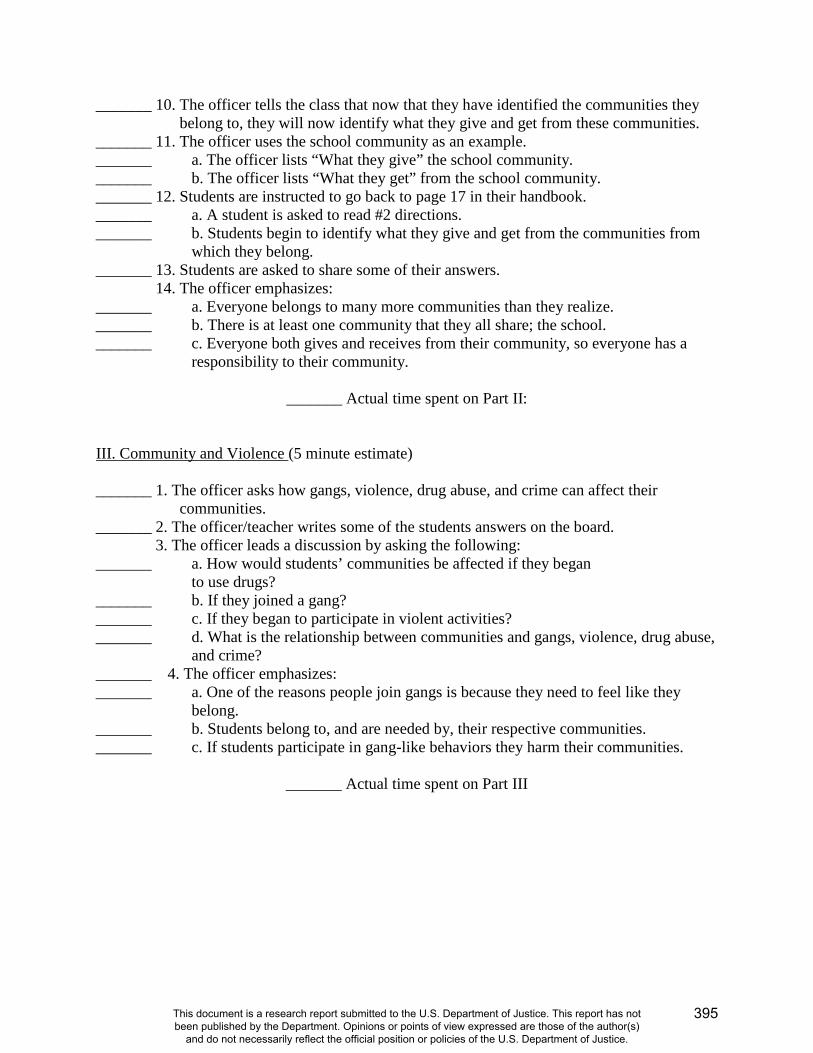
_______ 10. The officer tells the class that now that they have identified the communities they belong to, they will now identify what they give and get from these communities.
_______ 11. The officer uses the school community as an example. _______ a. The officer lists “What they give” the school community. _______ b. The officer lists “What they get” from the school community. _______ 12. Students are instructed to go back to page 17 in their handbook. _______ a. A student is asked to read #2 directions. _______ b. Students begin to identify what they give and get from the communities from
which they belong. _______ 13. Students are asked to share some of their answers.
14. The officer emphasizes: _______ a. Everyone belongs to many more communities than they realize. _______ b. There is at least one community that they all share; the school. _______ c. Everyone both gives and receives from their community, so everyone has a
responsibility to their community.
_______ Actual time spent on Part II: III. Community and Violence (5 minute estimate) _______ 1. The officer asks how gangs, violence, drug abuse, and crime can affect their
communities. _______ 2. The officer/teacher writes some of the students answers on the board.
3. The officer leads a discussion by asking the following: _______ a. How would students’ communities be affected if they began to use drugs? _______ b. If they joined a gang? _______ c. If they began to participate in violent activities? _______ d. What is the relationship between communities and gangs, violence, drug abuse,
and crime? _______ 4. The officer emphasizes: _______ a. One of the reasons people join gangs is because they need to feel like they
belong. _______ b. Students belong to, and are needed by, their respective communities. _______ c. If students participate in gang-like behaviors they harm their communities.
_______ Actual time spent on Part III
395
This document is a research report submitted to the U.S. Department of Justice. This report has not been published by the Department. Opinions or points of view expressed are those of the author(s)
and do not necessarily reflect the official position or policies of the U.S. Department of Justice.
IV. Review Project (5-10 minute estimate) _______ 1. The officer asks some students to share their ideas for their “Making My School a
GREAT Place” projects. _______ 2. Students are asked to fill out and sign the project description on page 19 in their
handbook. _______ 3. The officer/teacher review the directions. a. students are asked if they have any questions. _______ 4. The students are asked to hand in their project descriptions. _______ 5. The officer emphasizes: _______ a. The project explains what students would do to make improvements in their
school. _______ b. You should share your idea with your parent or guardian.
_______ Actual time spent on Part IV V. Wrap-Up (3-5 minute estimate) _______ 1. The officer reviews what was learned by asking the students to: _______ a. Identify a community they belong to. _______ b. Give an example of how violence, gangs, drugs, and crime can affect their
community. _______ 2. The students are asked to turn to page 24 in their handbook. _______ a. A student reads the LIM: Prank Night story aloud. _______ 3. The students are asked to complete the questions relating to that episode on page 25
of their handbook, either in class or as a take-home assignment. _______ 4. The students are instructed to give the parent letter on page 21 to their parents. _______ a. The students are told why the letter is important. _______ 5. The officer gives a brief introduction to the next lesson.
_______ Actual time spent on Part V
_______ End Time
_______ Total time spent on Lesson 3 QUALITATIVE SESSION EVALUATION IN GENERAL... General comments:________________________________________________________ ________________________________________________________________________ ________________________________________________________________________ ________________________________________________________________________ ________________________________________________________________________
396
This document is a research report submitted to the U.S. Department of Justice. This report has not been published by the Department. Opinions or points of view expressed are those of the author(s)
and do not necessarily reflect the official position or policies of the U.S. Department of Justice.
DISCUSSIONS... Rate the discussions: 1. Excellent 2. Good 3. Fair 4. Poor Comments on discussions: __________________________________________________ ________________________________________________________________________ ________________________________________________________________________ ACTIVITIES... How engaged were the teens in the activities? 1. Very Engaged 2. Somewhat Engaged 3. Not Engaged Comments on activities:____________________________________________________ ________________________________________________________________________ ________________________________________________________________________ Overall Observer Ratings… Please provide your overall assessment of the following. Low High 1. Adherence to suggested time frames. 1 2 3 4 5 2. Coverage of the topical areas. 1 2 3 4 5 3. Overall lesson adherence 1 2 3 4 5 4. Overall quality of the lesson 1 2 3 4 5
397
This document is a research report submitted to the U.S. Department of Justice. This report has not been published by the Department. Opinions or points of view expressed are those of the author(s)
and do not necessarily reflect the official position or policies of the U.S. Department of Justice.
Date Session Observed:_________________________________________________________
School Observed:______________________________________________________________
Teacher & Period Observed:_____________________________________________________
Officer Observed:______________________________________________________________
Lesson 4: Goal-Setting Skills
_______ Start Time Lesson 4 (39-45 minute estimate) Instructions: Please place a check mark after each area that is covered in the session. Leave the line blank when certain areas are not covered. Also, please note the actual starting time of the lesson (e.g., 12:30), as well as the approximate time spent on each part (e.g., 7 min.). After the checklist is completed, please complete the subsequent qualitative session evaluation. I. Introduction (10 minute estimate) _______ 1. Students are informed to turn to page 24 in their GREAT Student Handbook. _______ a. students are asked to act out the scenario; LIM: Prank Night _______ b. Students are asked to discuss review questions on page 25. _______ 2. The officer previews of the lesson for the day.
_______ Actual time spent on Part I II. Personal Goals (5 minute estimate) _______ 1. The officer asks the students what the word “goal” means. _______ 2. The officer provides the definition of “goal.” _______ 3. Students are asked to copy this definition into their handbook, on page 26. _______ 4. The students are asked to turn to page 27 in their handbook. _______ a. The officer explains to the students that they should think of goals they have for
themselves, and fill out these goals for all of the categories listed in the book. _______ 5. The officer asks the students if anyone would like to share their answers.
_______ Actual time spent on Part II III. Realistic Goal Setting (5 minute estimate) _______ 1. Officer tells the students to turn to 28 in their handbook. _______ 2. The officer asks for volunteers to read the goal-setting tips.
Actual time spent on Part III: ______
398
This document is a research report submitted to the U.S. Department of Justice. This report has not been published by the Department. Opinions or points of view expressed are those of the author(s)
and do not necessarily reflect the official position or policies of the U.S. Department of Justice.

IV. Review Personal Goals (5-7 minute estimate) _______ 1. The officer asks the class to review their goals they recorded on page 27. _______ 2. The students are give an opportunity to change their goals if they wish.
_______ Actual Time Spent on Part IV V. Reaching Your Goals (11-13 minute estimate) _______1. The officer introduces the goal of “getting into college” as a goal they should all
have. _______ a. The officer writes this goal on the chalkboard. _______ 2. The officer asks the students to name all the things that one needs to do to get into
college. _______ a. The officer/teacher writes the students’ answers on the board. _______ b. The officer adds to the list if there are any obvious answers missing. _______ 3. The officer explains how some of these goals are “ongoing” or a condition for the
goal. _______ a. The officer explains that this means you need to get good grades throughout
school. _______ 4. The officer explains that some goals are considered “steps” to achieve a goal. _______ a. The officer provides examples of steps to reach their goal. _______ 5. The officer asks students to identify the ongoing goals listed on the board. _______ a. The officer circles all of their correct answers. _______ 6. The officer asks the students to chronologically order the remaining steps to
their goals. _______ a. The officer numbers each of the steps. _______ 7. The officer tells the class that even if they fail at one or more of their goals,
they still may be able to go to college. _______ a. The officer explains that accomplishing more of these goals will make it easier
for them to go to college. _______ 8. The students are asked to identify one of their goals from page 27 in their handbooks. _______ a. A student is asked to read the instructions to the worksheet on page 29 of their
handbook. _______ b The students are asked to complete the worksheet by going through all of the
steps outlined by the officer in their example; going to college. _______ 9. The officer asks if students want to share their plan.
10. The officer emphasizes: _______ a. Goals help you control your future, and gives you something to work for. _______ b. The benefits of setting goals. _______ c. The many things that can get in the way of accomplishing your goals.
_______ Actual Time Spent on Part V
399
This document is a research report submitted to the U.S. Department of Justice. This report has not been published by the Department. Opinions or points of view expressed are those of the author(s)
and do not necessarily reflect the official position or policies of the U.S. Department of Justice.
VI. Wrap-Up (3-5 minute estimate) _______ 1. The officer reviews some of the lessons learned today: _______ a. Reviews the goal setting tips: Positive, Realistic, and Specific. _______ b. The officer shares a personal goal. _______ c. The officer shares some things needed to achieve this goal. _______ d. The officer explains why people set goals. _______ 2. The students are asked to turn to page 31 in their handbook. _______ a. A student is asked to read LIM: Weekend Plans. _______ 3. Students are asked to answer the questions on page 32, either in class or as a take-
home assignment. _______ 4. The officer previews the next lesson.
_______ Actual time spent on Part VI
_______ End Time
_______ Total time spent on Lesson 4 QUALITATIVE SESSION EVALUATION IN GENERAL... General comments:________________________________________________________ ________________________________________________________________________ ________________________________________________________________________ ________________________________________________________________________ ________________________________________________________________________ DISCUSSIONS... Rate the discussions: 1. Excellent 2. Good 3. Fair 4. Poor Comments on discussions: __________________________________________________ ________________________________________________________________________ ________________________________________________________________________ ACTIVITIES... How engaged were the teens in the activities? 1. Very Engaged 2. Somewhat Engaged 3. Not Engaged Comments on activities:____________________________________________________ ________________________________________________________________________ ________________________________________________________________________
400
This document is a research report submitted to the U.S. Department of Justice. This report has not been published by the Department. Opinions or points of view expressed are those of the author(s)
and do not necessarily reflect the official position or policies of the U.S. Department of Justice.
Overall Observer Ratings… Please provide your overall assessment of the following. Low High 1. Adherence to suggested time frames. 1 2 3 4 5 2. Coverage of the topical areas. 1 2 3 4 5 3. Overall lesson adherence 1 2 3 4 5 4. Overall quality of the lesson 1 2 3 4 5
401
This document is a research report submitted to the U.S. Department of Justice. This report has not been published by the Department. Opinions or points of view expressed are those of the author(s)
and do not necessarily reflect the official position or policies of the U.S. Department of Justice.
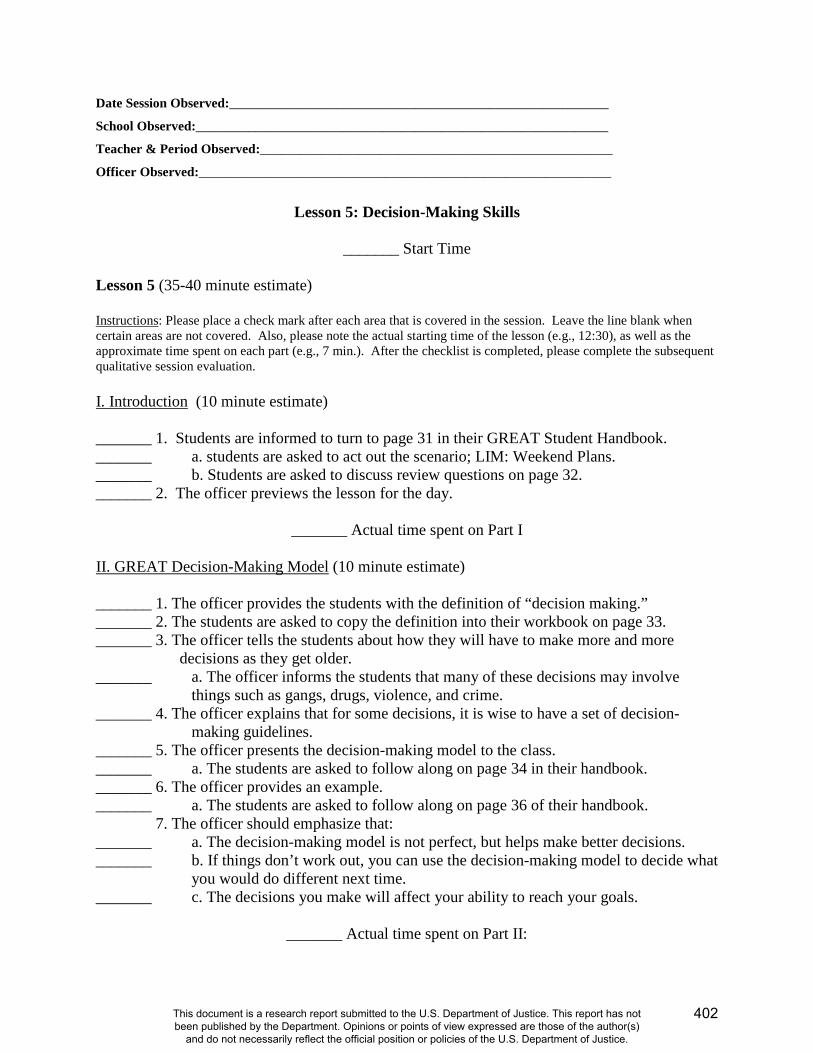
Date Session Observed:_________________________________________________________
School Observed:______________________________________________________________
Teacher & Period Observed:_____________________________________________________
Officer Observed:______________________________________________________________
Lesson 5: Decision-Making Skills
_______ Start Time Lesson 5 (35-40 minute estimate) Instructions: Please place a check mark after each area that is covered in the session. Leave the line blank when certain areas are not covered. Also, please note the actual starting time of the lesson (e.g., 12:30), as well as the approximate time spent on each part (e.g., 7 min.). After the checklist is completed, please complete the subsequent qualitative session evaluation. I. Introduction (10 minute estimate) _______ 1. Students are informed to turn to page 31 in their GREAT Student Handbook. _______ a. students are asked to act out the scenario; LIM: Weekend Plans. _______ b. Students are asked to discuss review questions on page 32. _______ 2. The officer previews the lesson for the day.
_______ Actual time spent on Part I II. GREAT Decision-Making Model (10 minute estimate) _______ 1. The officer provides the students with the definition of “decision making.” _______ 2. The students are asked to copy the definition into their workbook on page 33. _______ 3. The officer tells the students about how they will have to make more and more
decisions as they get older. _______ a. The officer informs the students that many of these decisions may involve
things such as gangs, drugs, violence, and crime. _______ 4. The officer explains that for some decisions, it is wise to have a set of decision-
making guidelines. _______ 5. The officer presents the decision-making model to the class. _______ a. The students are asked to follow along on page 34 in their handbook. _______ 6. The officer provides an example. _______ a. The students are asked to follow along on page 36 of their handbook.
7. The officer should emphasize that: _______ a. The decision-making model is not perfect, but helps make better decisions. _______ b. If things don’t work out, you can use the decision-making model to decide what
you would do different next time. _______ c. The decisions you make will affect your ability to reach your goals.
_______ Actual time spent on Part II:
402
This document is a research report submitted to the U.S. Department of Justice. This report has not been published by the Department. Opinions or points of view expressed are those of the author(s)
and do not necessarily reflect the official position or policies of the U.S. Department of Justice.

III. Decision-Making Scenarios (12-15 minute estimate) _______ 1. The officer explains the group project. _______ 2. The students are broken into groups. _______ 3. The students are asked to turn to page 37 in their handbook. _______ a. A student is asked to read the scenario and questions. _______ 4. The groups are allowed to discuss the scenarios and their answers. _______ 5. A spokesperson for one group provides their answers for the questions. _______ a. Other groups are allowed to provide their answers if different. _______ b. The students are asked to write down answers in their handbooks. _______ 6. The officer is using active listening techniques, from Lesson #7, in order to model
them for the students. _______ 7. The students are asked to turn to page 38 in their handbooks. _______ a. A student is asked to read the scenario and questions aloud. _______ 8. The groups are allowed to discuss the scenarios and their answers. _______ 9. A spokesperson for one group provides their answers for the questions. _______ a. Other groups are allowed to provide their answers is different. _______ b. The students are asked to write down answers in their handbooks. _______ 10. The officer is using active listening techniques, from Lesson #7, in order to model
them for the students. _______ 11. The officer facilitates a discussion about decision making. _______ 12. The officer should emphasize: _______ a. Some situations deserve careful consideration before a decision is made. _______ b. The GREAT model can help students make the best choice for themselves.
_______ Actual time spent on Part III IV. Wrap-Up (3-5 minute estimate) _______ 1. The officer reviews some of the lessons learned today by asking volunteers to: _______ a. Review the GREAT decision-making model. _______ b. Discuss the impact of decisions on goals. _______ 2. The students are told to turn to page 40. _______ a. A student is asked to read aloud LIM: The Party. _______ 3. The students are asked to complete the questions on page 41, either in class or as a
take-home assignment.. _______ 4. The officer previews the next lesson.
_______ Actual time spent on Part IV
_______ End Time
_______ Total time spent on Lesson 5
403
This document is a research report submitted to the U.S. Department of Justice. This report has not been published by the Department. Opinions or points of view expressed are those of the author(s)
and do not necessarily reflect the official position or policies of the U.S. Department of Justice.
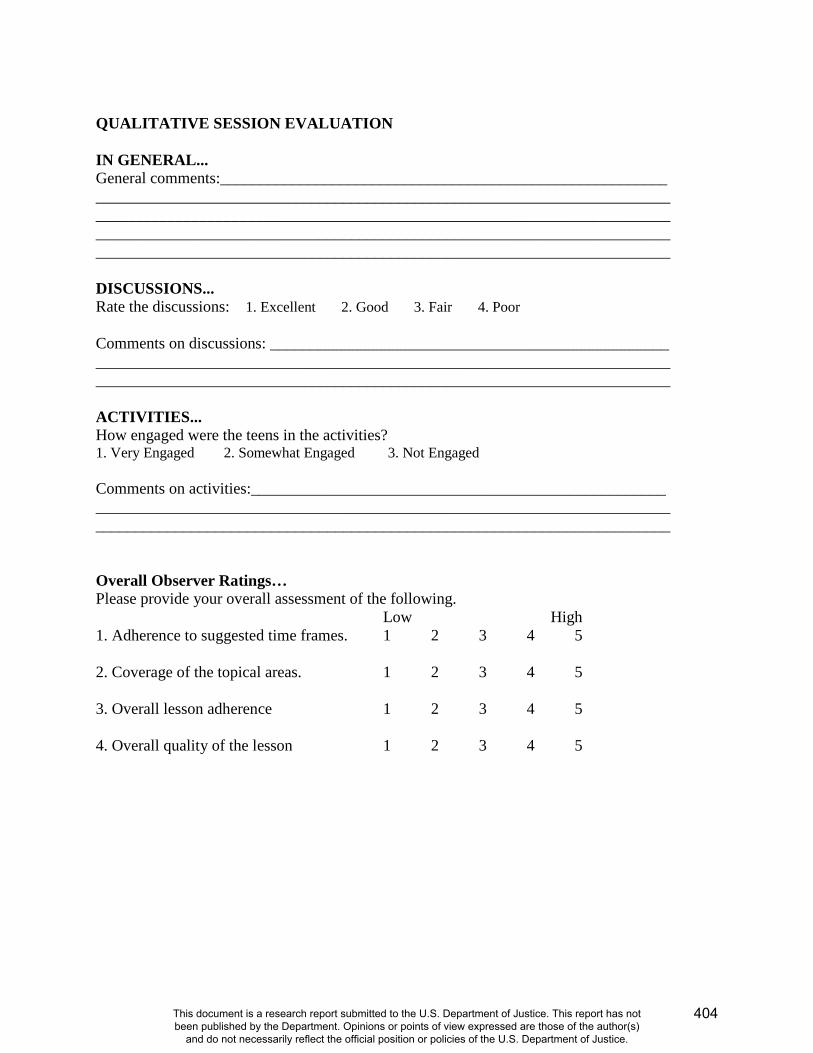
QUALITATIVE SESSION EVALUATION IN GENERAL... General comments:________________________________________________________ ________________________________________________________________________ ________________________________________________________________________ ________________________________________________________________________ ________________________________________________________________________ DISCUSSIONS... Rate the discussions: 1. Excellent 2. Good 3. Fair 4. Poor Comments on discussions: __________________________________________________ ________________________________________________________________________ ________________________________________________________________________ ACTIVITIES... How engaged were the teens in the activities? 1. Very Engaged 2. Somewhat Engaged 3. Not Engaged Comments on activities:____________________________________________________ ________________________________________________________________________ ________________________________________________________________________ Overall Observer Ratings… Please provide your overall assessment of the following. Low High 1. Adherence to suggested time frames. 1 2 3 4 5 2. Coverage of the topical areas. 1 2 3 4 5 3. Overall lesson adherence 1 2 3 4 5 4. Overall quality of the lesson 1 2 3 4 5
404
This document is a research report submitted to the U.S. Department of Justice. This report has not been published by the Department. Opinions or points of view expressed are those of the author(s)
and do not necessarily reflect the official position or policies of the U.S. Department of Justice.

Date Session Observed:_________________________________________________________
School Observed:______________________________________________________________
Teacher & Period Observed:_____________________________________________________
Officer Observed:______________________________________________________________
Lesson 6: Communication Skills
_______ Start Time Lesson 6 (31-39 minute estimate) Instructions: Please place a check mark after each area that is covered in the session. Leave the line blank when certain areas are not covered. Also, please note the actual starting time of the lesson (e.g., 12:30), as well as the approximate time spent on each part (e.g., 7 min.). After the checklist is completed, please complete the subsequent qualitative session evaluation. I. Introduction (10 minute estimate) _______ 1. Students are informed to turn to page 40 in their GREAT Student Handbook. _______ a. students are asked to act out the scenario; LIM: The Party. _______ b. Students are asked to discuss review questions on page 41. _______ 2. The officer previews the lesson for the day.
_______ Actual time spent on Part I II. What Kind of Communicator Are You? (3-5 minute estimate) _______ 1. The officer asks the class what “communication” means. _______ a. The officer provides the class the definition of communication. _______ 2. The students are asked to copy the definition onto page 42 of their handbook. _______ 3. The students are asked to turn to page 43 in their handbook. _______ a. A student is asked to read the directions aloud. _______ 4. The students are asked to complete the exercise. _______ a. The students are asked to add up their scores. _______ 5. The students are asked to turn to page 44. _______ a. A student is asked to read the directions aloud. _______ 6. The officer tells the students that this GREAT lesson will help their
communication skills.
_______ Actual time spent on Part II
405
This document is a research report submitted to the U.S. Department of Justice. This report has not been published by the Department. Opinions or points of view expressed are those of the author(s)
and do not necessarily reflect the official position or policies of the U.S. Department of Justice.
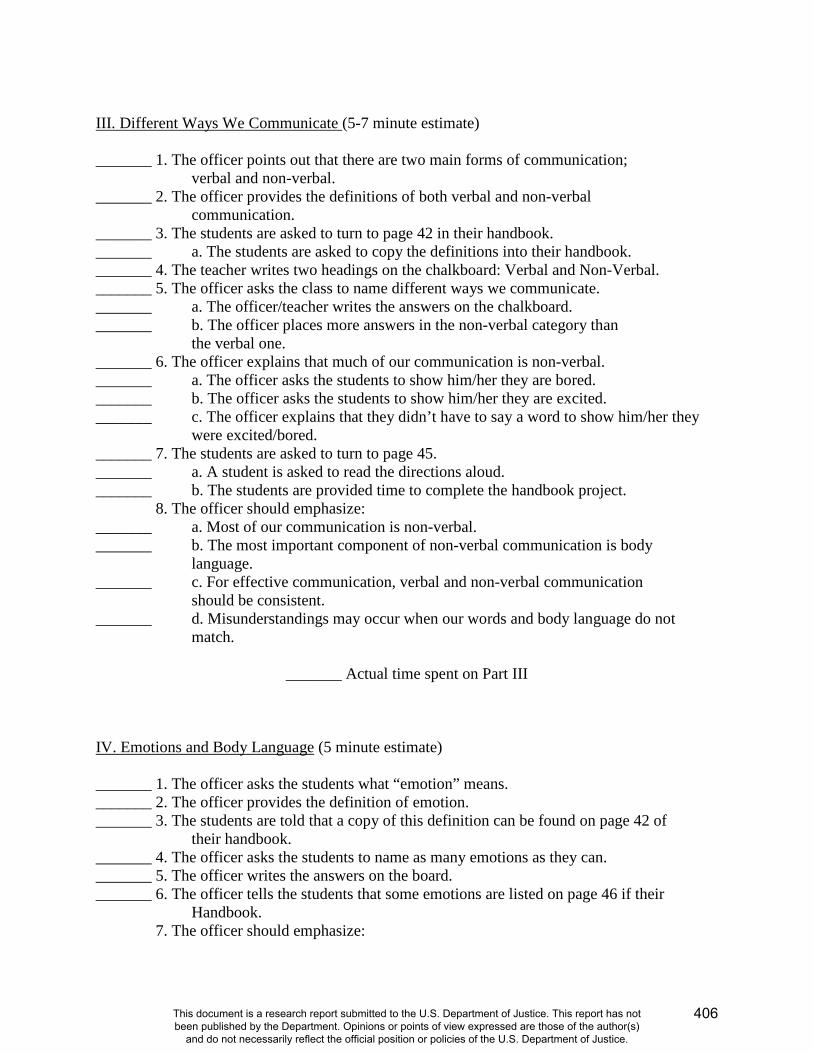
III. Different Ways We Communicate (5-7 minute estimate) _______ 1. The officer points out that there are two main forms of communication;
verbal and non-verbal. _______ 2. The officer provides the definitions of both verbal and non-verbal
communication. _______ 3. The students are asked to turn to page 42 in their handbook. _______ a. The students are asked to copy the definitions into their handbook. _______ 4. The teacher writes two headings on the chalkboard: Verbal and Non-Verbal. _______ 5. The officer asks the class to name different ways we communicate. _______ a. The officer/teacher writes the answers on the chalkboard. _______ b. The officer places more answers in the non-verbal category than the verbal one. _______ 6. The officer explains that much of our communication is non-verbal. _______ a. The officer asks the students to show him/her they are bored. _______ b. The officer asks the students to show him/her they are excited. _______ c. The officer explains that they didn’t have to say a word to show him/her they
were excited/bored. _______ 7. The students are asked to turn to page 45. _______ a. A student is asked to read the directions aloud. _______ b. The students are provided time to complete the handbook project. 8. The officer should emphasize: _______ a. Most of our communication is non-verbal. _______ b. The most important component of non-verbal communication is body language. _______ c. For effective communication, verbal and non-verbal communication
should be consistent. _______ d. Misunderstandings may occur when our words and body language do not
match.
_______ Actual time spent on Part III IV. Emotions and Body Language (5 minute estimate) _______ 1. The officer asks the students what “emotion” means. _______ 2. The officer provides the definition of emotion. _______ 3. The students are told that a copy of this definition can be found on page 42 of
their handbook. _______ 4. The officer asks the students to name as many emotions as they can. _______ 5. The officer writes the answers on the board. _______ 6. The officer tells the students that some emotions are listed on page 46 if their
Handbook. 7. The officer should emphasize:
406
This document is a research report submitted to the U.S. Department of Justice. This report has not been published by the Department. Opinions or points of view expressed are those of the author(s)
and do not necessarily reflect the official position or policies of the U.S. Department of Justice.

_______ a. People are capable of experiencing and expressing many different emotions. _______ b. Body language will often give you an idea of what emotion a person is feeling. _______ c. Being able to read body language is an important part of communication.
_______ Actual time spent on Part IV V. Body-Language Charades (5-7 minute estimate) _______ 1. The students are broken into groups. _______ a. Each group gets a scenario card. _______ 2. The groups are instructed to develop a way to demonstrate their scenario with
non-verbal communication only. _______ a. Each group selects a set of actors to demonstrate their scenario. _______ b. The rest of the class tries to guess the scenario. _______ 3. After each demonstration, the officer has the students discuss the emotions being
acted out, and the body language used to convey the message. _______ 4. After all of the demonstrations, the officer leads a whole group discussion, using the
following questions: _______ a. Was it difficult to guess what emotions were being acted out? Why or Why
not? _______ b. Was it difficult to guess what scenarios were being acted out? Why or
Why not? _______ _______ 5. The officer should emphasize: _______ a. Communication can still happen when no one can talk. _______ b. Even when people don’t talk, you can tell how they are feeling through non-
verbal communication. _______ c. When communicating with another, remember to pay attention to your body
language.
_______ Actual time spent on Part V
407
This document is a research report submitted to the U.S. Department of Justice. This report has not been published by the Department. Opinions or points of view expressed are those of the author(s)
and do not necessarily reflect the official position or policies of the U.S. Department of Justice.
VI. Wrap-Up (3-5 minute estimate) 1. The officer reviews the lesson by asking volunteers to: _______ a. Tell what the difference is between verbal and non-verbal communication. _______ b. Identify some emotions that you can read from a person’s body language. _______ 2. The officer should instruct the students to turn to page 48 in their handbook. _______ a. A student is asked to read aloud LIM: Tameka’s Birthday. _______ 3. The students are asked to complete questions on page 49 of their handbook,
either in class or as a take-home assignment. _______ 4. The officer previews the next lesson.
_______ Actual time spent on Part VI
_______ End Time
_______ Total time spent on Lesson 6 QUALITATIVE SESSION EVALUATION IN GENERAL... General comments:________________________________________________________ ________________________________________________________________________ ________________________________________________________________________ ________________________________________________________________________ ________________________________________________________________________ DISCUSSIONS... Rate the discussions: 1. Excellent 2. Good 3. Fair 4. Poor Comments on discussions: __________________________________________________ ________________________________________________________________________ ________________________________________________________________________ ACTIVITIES... How engaged were the teens in the activities? 1. Very Engaged 2. Somewhat Engaged 3. Not Engaged Comments on activities:____________________________________________________ ________________________________________________________________________ ________________________________________________________________________
408
This document is a research report submitted to the U.S. Department of Justice. This report has not been published by the Department. Opinions or points of view expressed are those of the author(s)
and do not necessarily reflect the official position or policies of the U.S. Department of Justice.

Overall Observer Ratings… Please provide your overall assessment of the following. Low High 1. Adherence to suggested time frames. 1 2 3 4 5 2. Coverage of the topical areas. 1 2 3 4 5 3. Overall lesson adherence 1 2 3 4 5 4. Overall quality of the lesson 1 2 3 4 5
409
This document is a research report submitted to the U.S. Department of Justice. This report has not been published by the Department. Opinions or points of view expressed are those of the author(s)
and do not necessarily reflect the official position or policies of the U.S. Department of Justice.
Date Session Observed:_________________________________________________________
School Observed:______________________________________________________________
Teacher & Period Observed:_____________________________________________________
Officer Observed:______________________________________________________________
Lesson 7: Active Listening Skills and Empathy
_______ Start Time Lesson 7 (29-35 minute estimate) Instructions: Please place a check mark after each area that is covered in the session. Leave the line blank when certain areas are not covered. Also, please note the actual starting time of the lesson (e.g., 12:30), as well as the approximate time spent on each part (e.g., 7 min.). After the checklist is completed, please complete the subsequent qualitative session evaluation. I. Introduction (10 minute estimate) _______ 1. Students are informed to turn to page 48 in their GREAT Student Handbook. _______ a. students are asked to act out the scenario; LIM: Tameka’s Birthday. _______ b. Students are asked to discuss review questions on page 49. _______ 2. The officer previews the lesson for the day.
_______ Actual time spent on Part I II. Active Listening (3-5 minute estimate) _______ 1. The officer explains that communication involves both talking and listening. _______ 2. The officer provides the definition of “active listening.” _______ 3. The officer instructs the students to turn to page 51 in their handbook. _______ a. The students are instructed to copy the definition into their handbook. _______ 4. The officer reads each active listening technique to the class. _______ a. The officer demonstrates each technique to the class.
_______ Actual time spent on Part II
410
This document is a research report submitted to the U.S. Department of Justice. This report has not been published by the Department. Opinions or points of view expressed are those of the author(s)
and do not necessarily reflect the official position or policies of the U.S. Department of Justice.
III. Speaker, Listener, Checker (10 minute estimate) _______ 1. The officer and teacher break the class into groups of three. _______ a. Each group is instructed to have one student represent each of the
following: the speaker, the listener, and the checker. _______ 2. The listeners are asked to refer to page 52 in their handbook. _______ a. The checkers are asked to turn to page 53 in their handbook. _______ 3. The officer tells the speakers that they have one minute to tell the listeners
what their favorite movie is and why. _______ 4. The checkers are instructed to watch the conversation and fill out the
checklist on page 53 in their handbook. _______ 5. After one minute, the checker is given one minute to discuss with the group
what he/she observed. _______ 6. The students are asked to switch roles, and repeat the same process. _______ 7. The students are asked to switch roles, and repeat the same process. 8. The officer leads the class in a discussion using the following questions: _______ a. What things did your partner do to let you know that he/she was being an active
listener? _______ b. What did it feel like to have someone actively listen to you? _______ c. When would be a good time to use active listening? 9. The officer emphasizes: _______ a. Using active listening skills allows the other person to know that you are
paying attention to what he/she is saying. _______ b. Active listening helps you understand what is being communicated better.
_______ Actual time spent on Part III IV. Define and Discuss Empathy (3-5 minute estimate) _______ 1. The officer asks the class, “What is empathy?” _______ 2. The officer provides the class with the definition of empathy. _______ 3. The students are informed that the definition is provided for them on page 51
of their handbook. _______ 4. The officer explains that feelings and emotions are the same thing.
_______ Actual time spent on Part IV V. Thinking of Others (10 minute estimate) _______ 1. The officer gives a brief overview of what the activity entails. _______ 2. The students are broken into small groups. _______ 3. The students are directed to turn to page 54 in their handbook, the “Hot Stuff”
activity. _______ a. A student is asked to read the directions aloud. _______ b. A student is asked to read the questions on page 55.
411
This document is a research report submitted to the U.S. Department of Justice. This report has not been published by the Department. Opinions or points of view expressed are those of the author(s)
and do not necessarily reflect the official position or policies of the U.S. Department of Justice.
_______ 4. Students are given time to discuss the questions in their groups. _______ 5. The officer asks the spokespeople from each group to share their answers. _______ 6. The officer uses actively listening techniques and provides positive feedback
to the students. _______ 7. The students are asked to turn to page 56 in their handbooks, the “Graffiti”
activity. _______ a. A student is asked to read the directions aloud. _______ b. A student is asked to read the questions on page 57. _______ 8. Students are given time to discuss the questions in their groups. _______ 9. The officer asks the spokespeople from each group to share their answers. _______ 10. The officer uses active listening techniques and provides positive feedback
to the students. 11. The officer should emphasize: _______ a. These are incidents that good kids sometimes get involved in that lead them to
more dangerous types of crime and violence. _______ b. If kids think about how the victims of crime feel, they might be less likely to
become involved in crime.
_______ Actual time spent on Part V VI. Wrap-Up (3-5 minute estimate) 1. The officer reviews the lesson by asking volunteers to: _______ a. List some active listening techniques. _______ b. Name some emotions. _______ c. Tell why empathy is important. _______ 2. The officer should instruct the students to turn to page 59 in their handbook. _______ a. A student is asked to read aloud LIM: The Locker Room. _______ 3. The students are asked to complete questions on page 60 of their handbook, either in class or as a take-home assignment. _______ 4. The officer previews the next lesson.
_______ Actual time spent on Part VI
_______ End Time
_______ Total time spent on Lesson 7
412
This document is a research report submitted to the U.S. Department of Justice. This report has not been published by the Department. Opinions or points of view expressed are those of the author(s)
and do not necessarily reflect the official position or policies of the U.S. Department of Justice.
QUALITATIVE SESSION EVALUATION IN GENERAL... General comments:________________________________________________________ ________________________________________________________________________ ________________________________________________________________________ ________________________________________________________________________ ________________________________________________________________________ DISCUSSIONS... Rate the discussions: 1. Excellent 2. Good 3. Fair 4. Poor Comments on discussions: __________________________________________________ ________________________________________________________________________ ________________________________________________________________________ ACTIVITIES... How engaged were the teens in the activities? 1. Very Engaged 2. Somewhat Engaged 3. Not Engaged Comments on activities:____________________________________________________ ________________________________________________________________________ ________________________________________________________________________ Overall Observer Ratings… Please provide your overall assessment of the following. Low High 1. Adherence to suggested time frames. 1 2 3 4 5 2. Coverage of the topical areas. 1 2 3 4 5 3. Overall lesson adherence 1 2 3 4 5 4. Overall quality of the lesson 1 2 3 4 5
413
This document is a research report submitted to the U.S. Department of Justice. This report has not been published by the Department. Opinions or points of view expressed are those of the author(s)
and do not necessarily reflect the official position or policies of the U.S. Department of Justice.
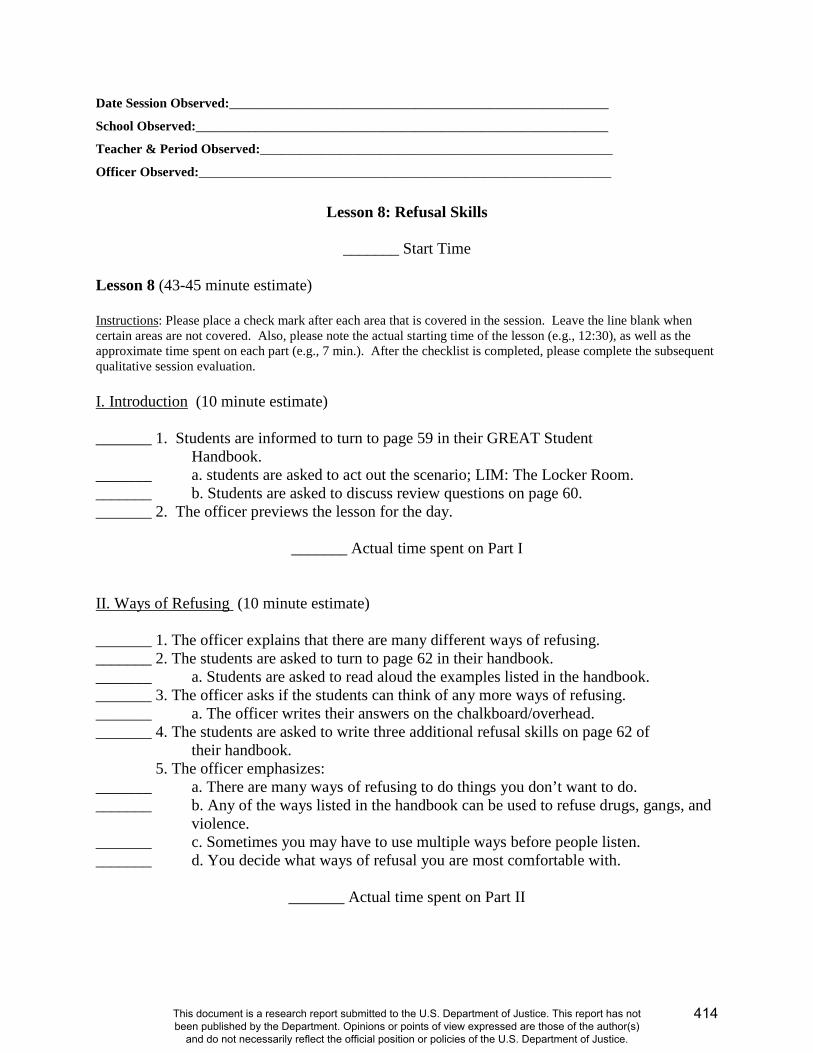
Date Session Observed:_________________________________________________________
School Observed:______________________________________________________________
Teacher & Period Observed:_____________________________________________________
Officer Observed:______________________________________________________________
Lesson 8: Refusal Skills
_______ Start Time Lesson 8 (43-45 minute estimate) Instructions: Please place a check mark after each area that is covered in the session. Leave the line blank when certain areas are not covered. Also, please note the actual starting time of the lesson (e.g., 12:30), as well as the approximate time spent on each part (e.g., 7 min.). After the checklist is completed, please complete the subsequent qualitative session evaluation. I. Introduction (10 minute estimate) _______ 1. Students are informed to turn to page 59 in their GREAT Student Handbook. _______ a. students are asked to act out the scenario; LIM: The Locker Room. _______ b. Students are asked to discuss review questions on page 60. _______ 2. The officer previews the lesson for the day.
_______ Actual time spent on Part I II. Ways of Refusing (10 minute estimate) _______ 1. The officer explains that there are many different ways of refusing. _______ 2. The students are asked to turn to page 62 in their handbook. _______ a. Students are asked to read aloud the examples listed in the handbook. _______ 3. The officer asks if the students can think of any more ways of refusing. _______ a. The officer writes their answers on the chalkboard/overhead. _______ 4. The students are asked to write three additional refusal skills on page 62 of
their handbook. 5. The officer emphasizes: _______ a. There are many ways of refusing to do things you don’t want to do. _______ b. Any of the ways listed in the handbook can be used to refuse drugs, gangs, and
violence. _______ c. Sometimes you may have to use multiple ways before people listen. _______ d. You decide what ways of refusal you are most comfortable with.
_______ Actual time spent on Part II
414
This document is a research report submitted to the U.S. Department of Justice. This report has not been published by the Department. Opinions or points of view expressed are those of the author(s)
and do not necessarily reflect the official position or policies of the U.S. Department of Justice.
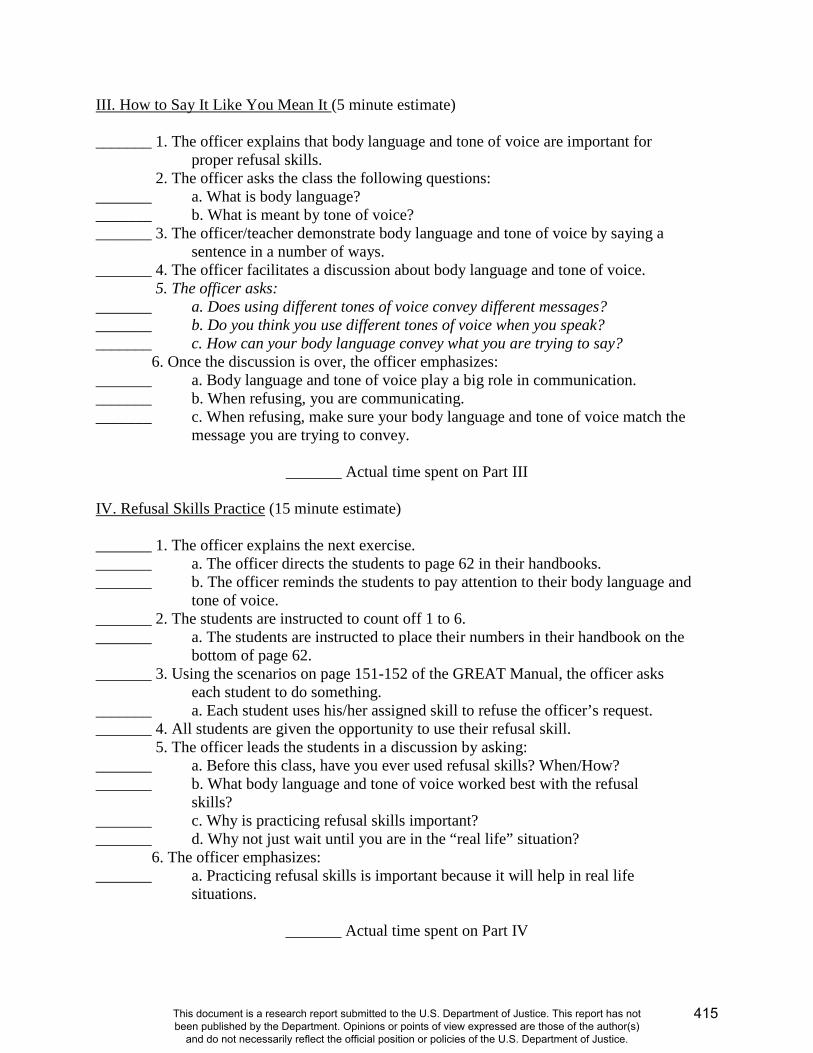
III. How to Say It Like You Mean It (5 minute estimate) _______ 1. The officer explains that body language and tone of voice are important for
proper refusal skills. 2. The officer asks the class the following questions: _______ a. What is body language? _______ b. What is meant by tone of voice? _______ 3. The officer/teacher demonstrate body language and tone of voice by saying a
sentence in a number of ways. _______ 4. The officer facilitates a discussion about body language and tone of voice.
5. The officer asks: _______ a. Does using different tones of voice convey different messages? _______ b. Do you think you use different tones of voice when you speak? _______ c. How can your body language convey what you are trying to say? 6. Once the discussion is over, the officer emphasizes: _______ a. Body language and tone of voice play a big role in communication. _______ b. When refusing, you are communicating. _______ c. When refusing, make sure your body language and tone of voice match the
message you are trying to convey.
_______ Actual time spent on Part III IV. Refusal Skills Practice (15 minute estimate) _______ 1. The officer explains the next exercise. _______ a. The officer directs the students to page 62 in their handbooks. _______ b. The officer reminds the students to pay attention to their body language and
tone of voice. _______ 2. The students are instructed to count off 1 to 6. _______ a. The students are instructed to place their numbers in their handbook on the
bottom of page 62. _______ 3. Using the scenarios on page 151-152 of the GREAT Manual, the officer asks
each student to do something. _______ a. Each student uses his/her assigned skill to refuse the officer’s request. _______ 4. All students are given the opportunity to use their refusal skill. 5. The officer leads the students in a discussion by asking: _______ a. Before this class, have you ever used refusal skills? When/How? _______ b. What body language and tone of voice worked best with the refusal skills? _______ c. Why is practicing refusal skills important? _______ d. Why not just wait until you are in the “real life” situation? 6. The officer emphasizes: _______ a. Practicing refusal skills is important because it will help in real life situations.
_______ Actual time spent on Part IV
415
This document is a research report submitted to the U.S. Department of Justice. This report has not been published by the Department. Opinions or points of view expressed are those of the author(s)
and do not necessarily reflect the official position or policies of the U.S. Department of Justice.
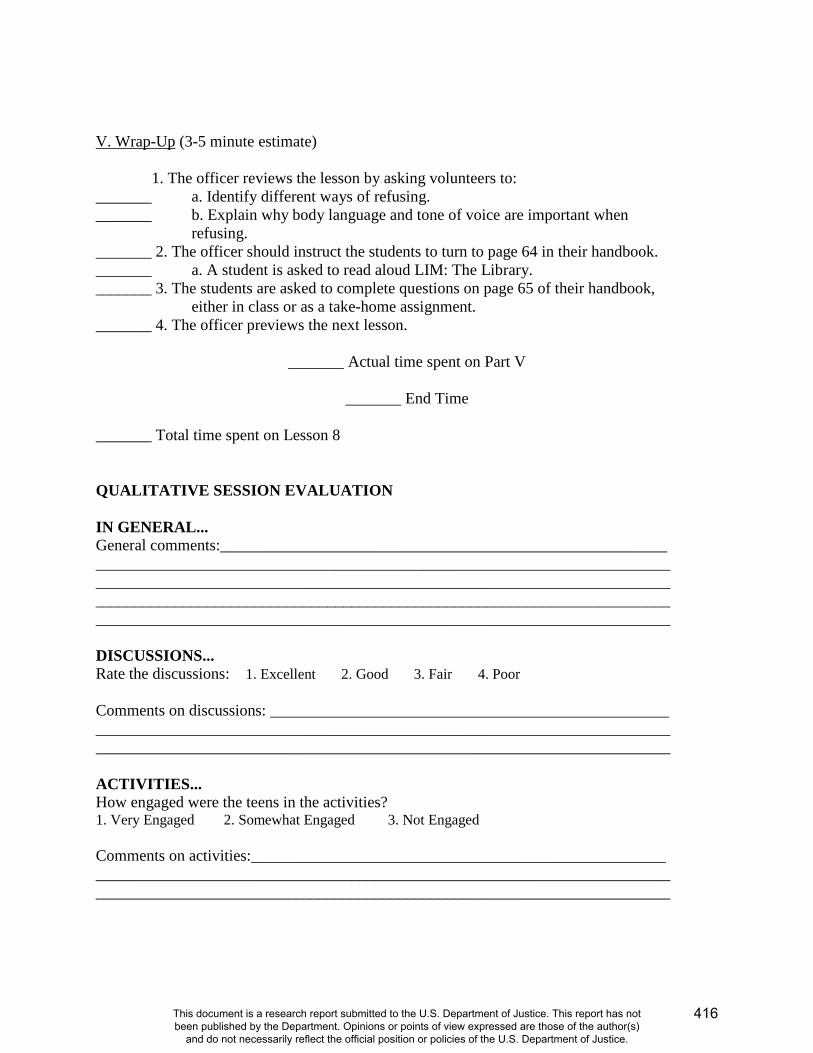
V. Wrap-Up (3-5 minute estimate) 1. The officer reviews the lesson by asking volunteers to: _______ a. Identify different ways of refusing. _______ b. Explain why body language and tone of voice are important when refusing. _______ 2. The officer should instruct the students to turn to page 64 in their handbook. _______ a. A student is asked to read aloud LIM: The Library. _______ 3. The students are asked to complete questions on page 65 of their handbook,
either in class or as a take-home assignment. _______ 4. The officer previews the next lesson.
_______ Actual time spent on Part V
_______ End Time
_______ Total time spent on Lesson 8 QUALITATIVE SESSION EVALUATION IN GENERAL... General comments:________________________________________________________ ________________________________________________________________________ ________________________________________________________________________ ________________________________________________________________________ ________________________________________________________________________ DISCUSSIONS... Rate the discussions: 1. Excellent 2. Good 3. Fair 4. Poor Comments on discussions: __________________________________________________ ________________________________________________________________________ ________________________________________________________________________ ACTIVITIES... How engaged were the teens in the activities? 1. Very Engaged 2. Somewhat Engaged 3. Not Engaged Comments on activities:____________________________________________________ ________________________________________________________________________ ________________________________________________________________________
416
This document is a research report submitted to the U.S. Department of Justice. This report has not been published by the Department. Opinions or points of view expressed are those of the author(s)
and do not necessarily reflect the official position or policies of the U.S. Department of Justice.
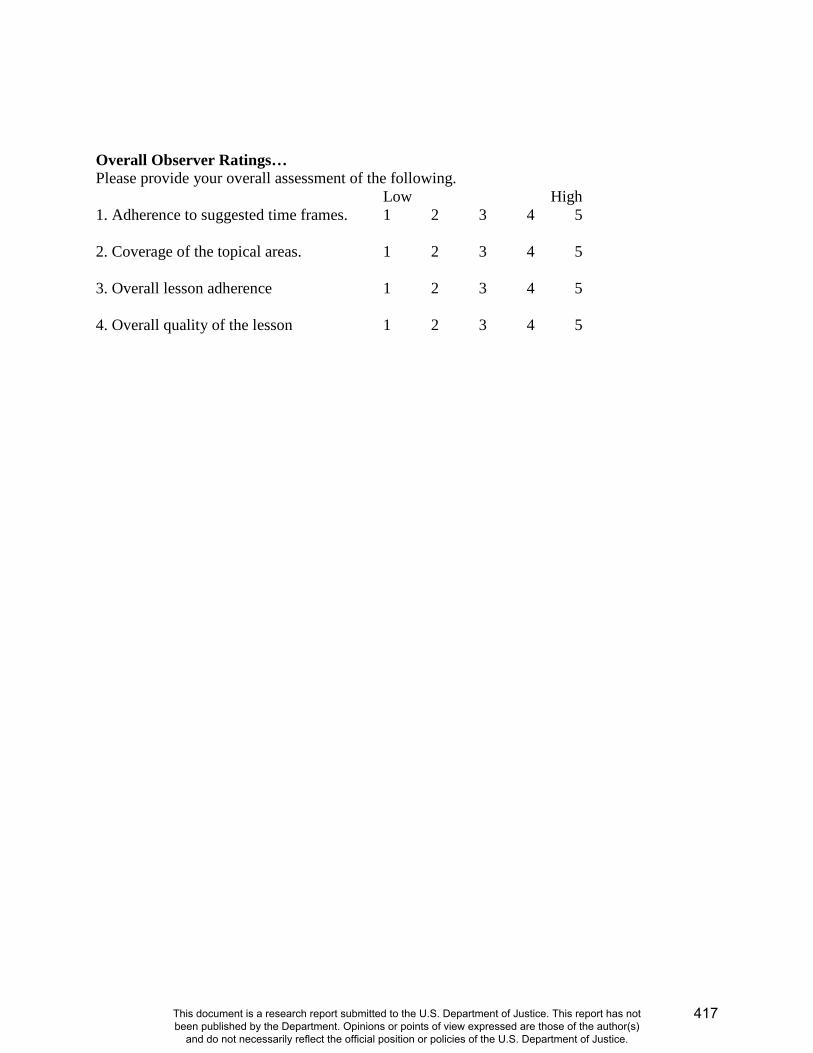
Overall Observer Ratings… Please provide your overall assessment of the following. Low High 1. Adherence to suggested time frames. 1 2 3 4 5 2. Coverage of the topical areas. 1 2 3 4 5 3. Overall lesson adherence 1 2 3 4 5 4. Overall quality of the lesson 1 2 3 4 5
417
This document is a research report submitted to the U.S. Department of Justice. This report has not been published by the Department. Opinions or points of view expressed are those of the author(s)
and do not necessarily reflect the official position or policies of the U.S. Department of Justice.
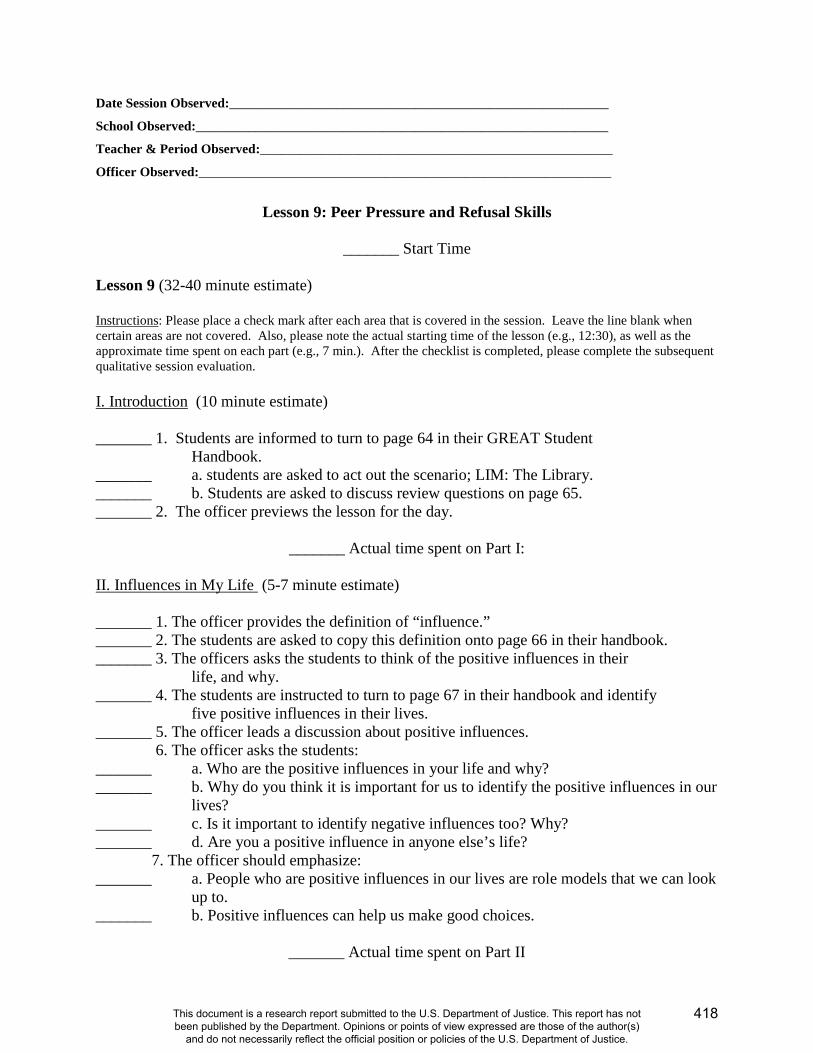
Date Session Observed:_________________________________________________________
School Observed:______________________________________________________________
Teacher & Period Observed:_____________________________________________________
Officer Observed:______________________________________________________________
Lesson 9: Peer Pressure and Refusal Skills
_______ Start Time Lesson 9 (32-40 minute estimate) Instructions: Please place a check mark after each area that is covered in the session. Leave the line blank when certain areas are not covered. Also, please note the actual starting time of the lesson (e.g., 12:30), as well as the approximate time spent on each part (e.g., 7 min.). After the checklist is completed, please complete the subsequent qualitative session evaluation. I. Introduction (10 minute estimate) _______ 1. Students are informed to turn to page 64 in their GREAT Student Handbook. _______ a. students are asked to act out the scenario; LIM: The Library. _______ b. Students are asked to discuss review questions on page 65. _______ 2. The officer previews the lesson for the day.
_______ Actual time spent on Part I: II. Influences in My Life (5-7 minute estimate) _______ 1. The officer provides the definition of “influence.” _______ 2. The students are asked to copy this definition onto page 66 in their handbook. _______ 3. The officers asks the students to think of the positive influences in their
life, and why. _______ 4. The students are instructed to turn to page 67 in their handbook and identify
five positive influences in their lives. _______ 5. The officer leads a discussion about positive influences.
6. The officer asks the students: _______ a. Who are the positive influences in your life and why? _______ b. Why do you think it is important for us to identify the positive influences in our
lives? _______ c. Is it important to identify negative influences too? Why? _______ d. Are you a positive influence in anyone else’s life? 7. The officer should emphasize: _______ a. People who are positive influences in our lives are role models that we can look
up to. _______ b. Positive influences can help us make good choices.
_______ Actual time spent on Part II
418
This document is a research report submitted to the U.S. Department of Justice. This report has not been published by the Department. Opinions or points of view expressed are those of the author(s)
and do not necessarily reflect the official position or policies of the U.S. Department of Justice.
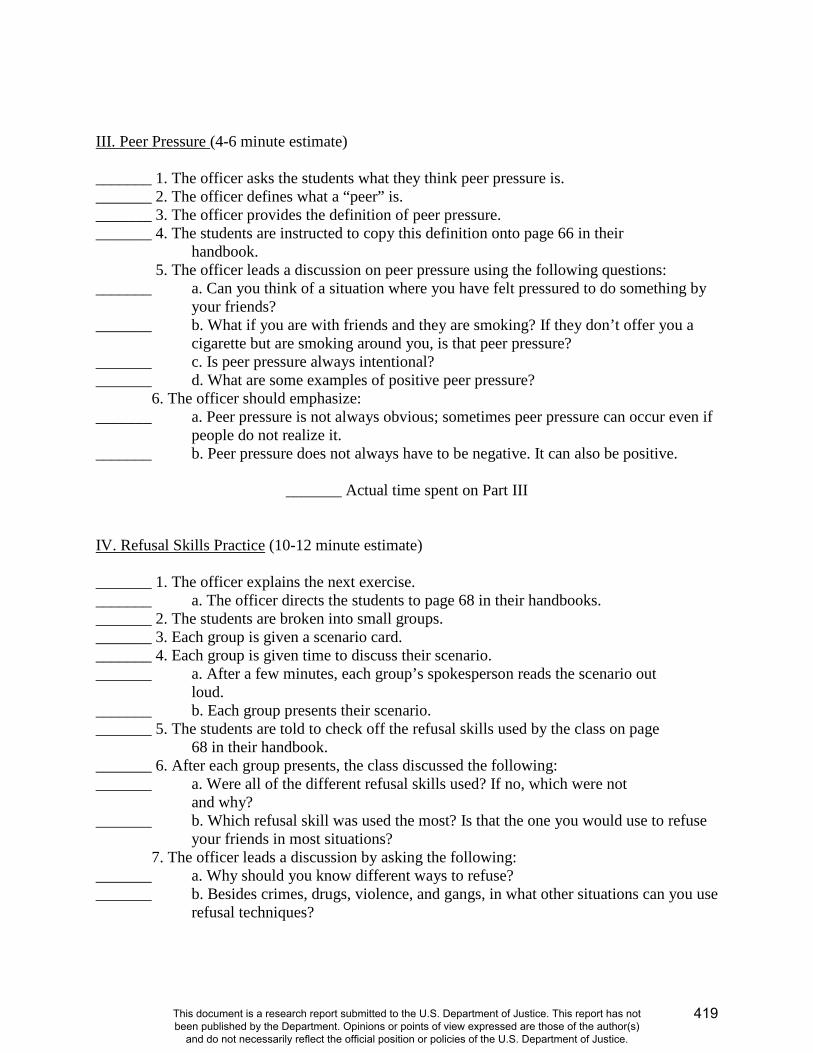
III. Peer Pressure (4-6 minute estimate) _______ 1. The officer asks the students what they think peer pressure is. _______ 2. The officer defines what a “peer” is. _______ 3. The officer provides the definition of peer pressure. _______ 4. The students are instructed to copy this definition onto page 66 in their
handbook. 5. The officer leads a discussion on peer pressure using the following questions: _______ a. Can you think of a situation where you have felt pressured to do something by
your friends? _______ b. What if you are with friends and they are smoking? If they don’t offer you a
cigarette but are smoking around you, is that peer pressure? _______ c. Is peer pressure always intentional? _______ d. What are some examples of positive peer pressure? 6. The officer should emphasize: _______ a. Peer pressure is not always obvious; sometimes peer pressure can occur even if
people do not realize it. _______ b. Peer pressure does not always have to be negative. It can also be positive.
_______ Actual time spent on Part III IV. Refusal Skills Practice (10-12 minute estimate) _______ 1. The officer explains the next exercise. _______ a. The officer directs the students to page 68 in their handbooks. _______ 2. The students are broken into small groups. _______ 3. Each group is given a scenario card. _______ 4. Each group is given time to discuss their scenario. _______ a. After a few minutes, each group’s spokesperson reads the scenario out
loud. _______ b. Each group presents their scenario. _______ 5. The students are told to check off the refusal skills used by the class on page
68 in their handbook. _______ 6. After each group presents, the class discussed the following: _______ a. Were all of the different refusal skills used? If no, which were not
and why? _______ b. Which refusal skill was used the most? Is that the one you would use to refuse
your friends in most situations? 7. The officer leads a discussion by asking the following: _______ a. Why should you know different ways to refuse? _______ b. Besides crimes, drugs, violence, and gangs, in what other situations can you use
refusal techniques?
419
This document is a research report submitted to the U.S. Department of Justice. This report has not been published by the Department. Opinions or points of view expressed are those of the author(s)
and do not necessarily reflect the official position or policies of the U.S. Department of Justice.
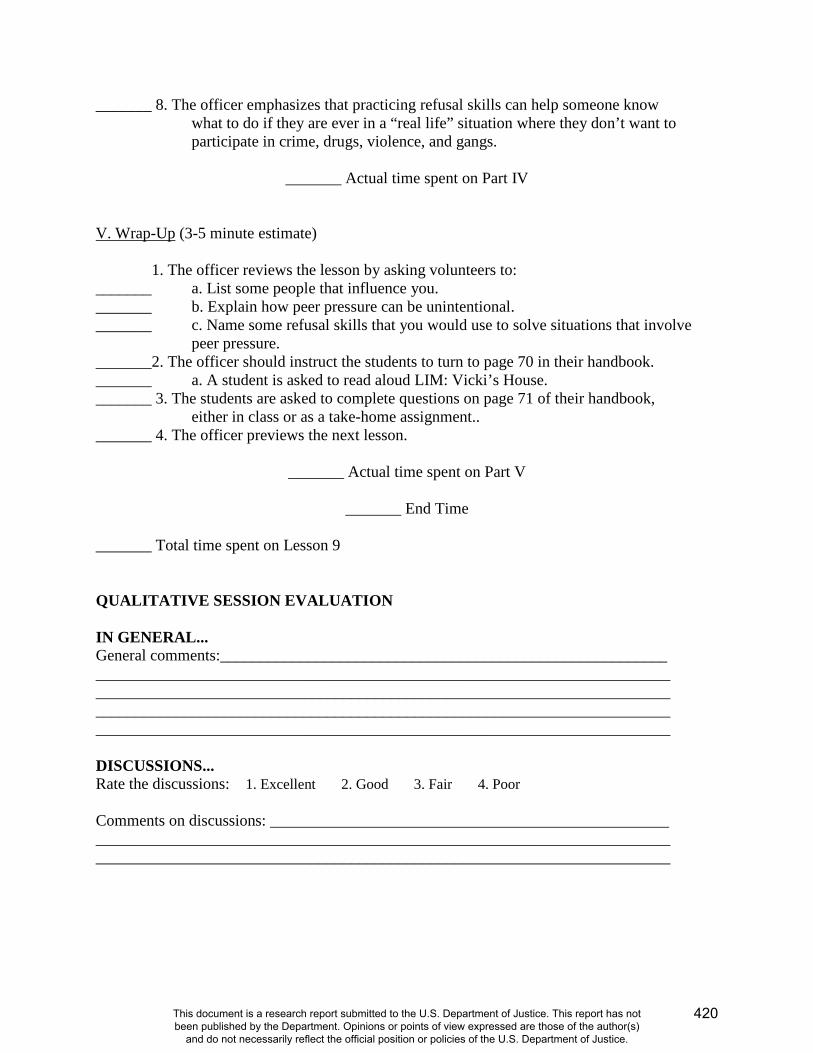
_______ 8. The officer emphasizes that practicing refusal skills can help someone know what to do if they are ever in a “real life” situation where they don’t want to participate in crime, drugs, violence, and gangs.
_______ Actual time spent on Part IV
V. Wrap-Up (3-5 minute estimate) 1. The officer reviews the lesson by asking volunteers to: _______ a. List some people that influence you. _______ b. Explain how peer pressure can be unintentional. _______ c. Name some refusal skills that you would use to solve situations that involve
peer pressure. _______2. The officer should instruct the students to turn to page 70 in their handbook. _______ a. A student is asked to read aloud LIM: Vicki’s House. _______ 3. The students are asked to complete questions on page 71 of their handbook,
either in class or as a take-home assignment.. _______ 4. The officer previews the next lesson.
_______ Actual time spent on Part V
_______ End Time
_______ Total time spent on Lesson 9 QUALITATIVE SESSION EVALUATION IN GENERAL... General comments:________________________________________________________ ________________________________________________________________________ ________________________________________________________________________ ________________________________________________________________________ ________________________________________________________________________ DISCUSSIONS... Rate the discussions: 1. Excellent 2. Good 3. Fair 4. Poor Comments on discussions: __________________________________________________ ________________________________________________________________________ ________________________________________________________________________
420
This document is a research report submitted to the U.S. Department of Justice. This report has not been published by the Department. Opinions or points of view expressed are those of the author(s)
and do not necessarily reflect the official position or policies of the U.S. Department of Justice.
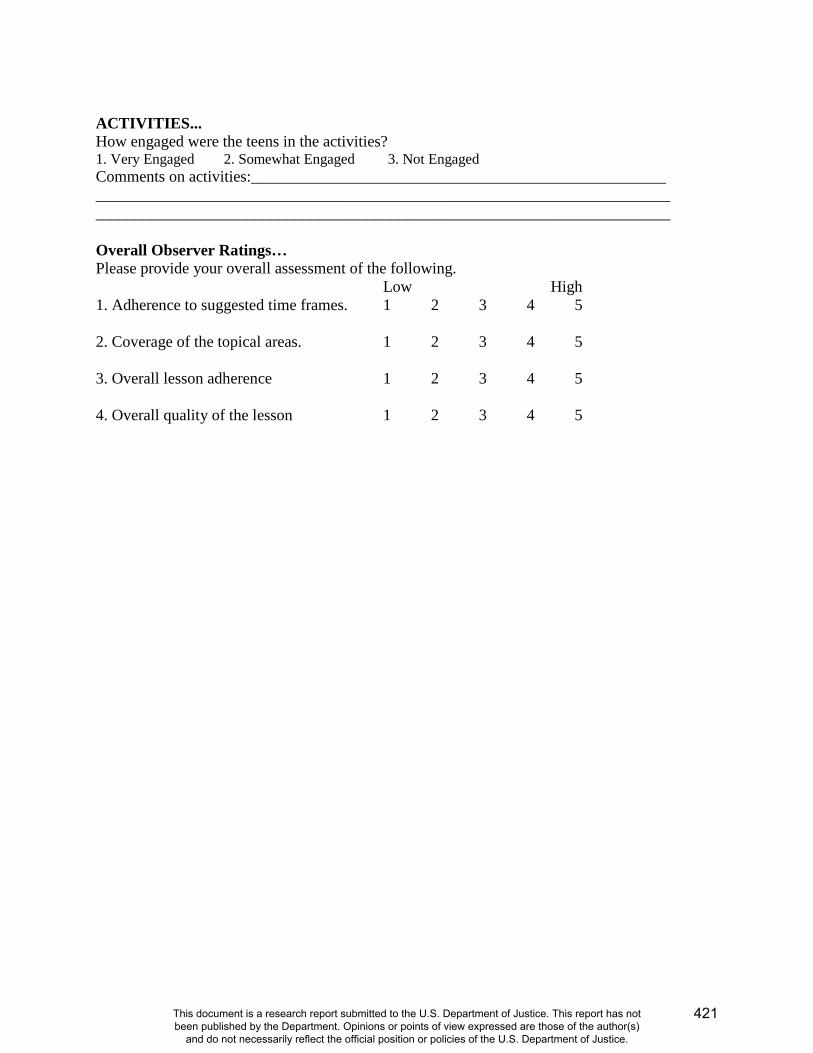
ACTIVITIES... How engaged were the teens in the activities? 1. Very Engaged 2. Somewhat Engaged 3. Not Engaged Comments on activities:____________________________________________________ ________________________________________________________________________ ________________________________________________________________________ Overall Observer Ratings… Please provide your overall assessment of the following. Low High 1. Adherence to suggested time frames. 1 2 3 4 5 2. Coverage of the topical areas. 1 2 3 4 5 3. Overall lesson adherence 1 2 3 4 5 4. Overall quality of the lesson 1 2 3 4 5
421
This document is a research report submitted to the U.S. Department of Justice. This report has not been published by the Department. Opinions or points of view expressed are those of the author(s)
and do not necessarily reflect the official position or policies of the U.S. Department of Justice.
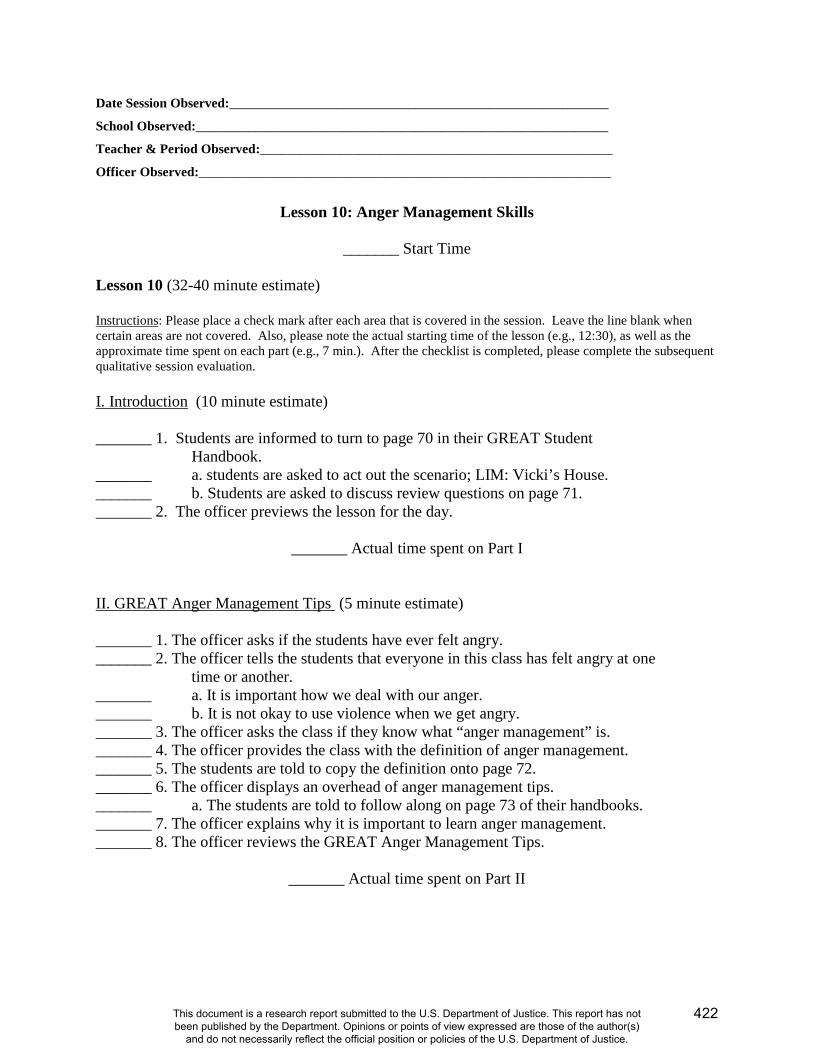
Date Session Observed:_________________________________________________________
School Observed:______________________________________________________________
Teacher & Period Observed:_____________________________________________________
Officer Observed:______________________________________________________________
Lesson 10: Anger Management Skills
_______ Start Time Lesson 10 (32-40 minute estimate) Instructions: Please place a check mark after each area that is covered in the session. Leave the line blank when certain areas are not covered. Also, please note the actual starting time of the lesson (e.g., 12:30), as well as the approximate time spent on each part (e.g., 7 min.). After the checklist is completed, please complete the subsequent qualitative session evaluation. I. Introduction (10 minute estimate) _______ 1. Students are informed to turn to page 70 in their GREAT Student Handbook. _______ a. students are asked to act out the scenario; LIM: Vicki’s House. _______ b. Students are asked to discuss review questions on page 71. _______ 2. The officer previews the lesson for the day.
_______ Actual time spent on Part I II. GREAT Anger Management Tips (5 minute estimate) _______ 1. The officer asks if the students have ever felt angry. _______ 2. The officer tells the students that everyone in this class has felt angry at one
time or another. _______ a. It is important how we deal with our anger. _______ b. It is not okay to use violence when we get angry. _______ 3. The officer asks the class if they know what “anger management” is. _______ 4. The officer provides the class with the definition of anger management. _______ 5. The students are told to copy the definition onto page 72. _______ 6. The officer displays an overhead of anger management tips. _______ a. The students are told to follow along on page 73 of their handbooks. _______ 7. The officer explains why it is important to learn anger management. _______ 8. The officer reviews the GREAT Anger Management Tips.
_______ Actual time spent on Part II
422
This document is a research report submitted to the U.S. Department of Justice. This report has not been published by the Department. Opinions or points of view expressed are those of the author(s)
and do not necessarily reflect the official position or policies of the U.S. Department of Justice.
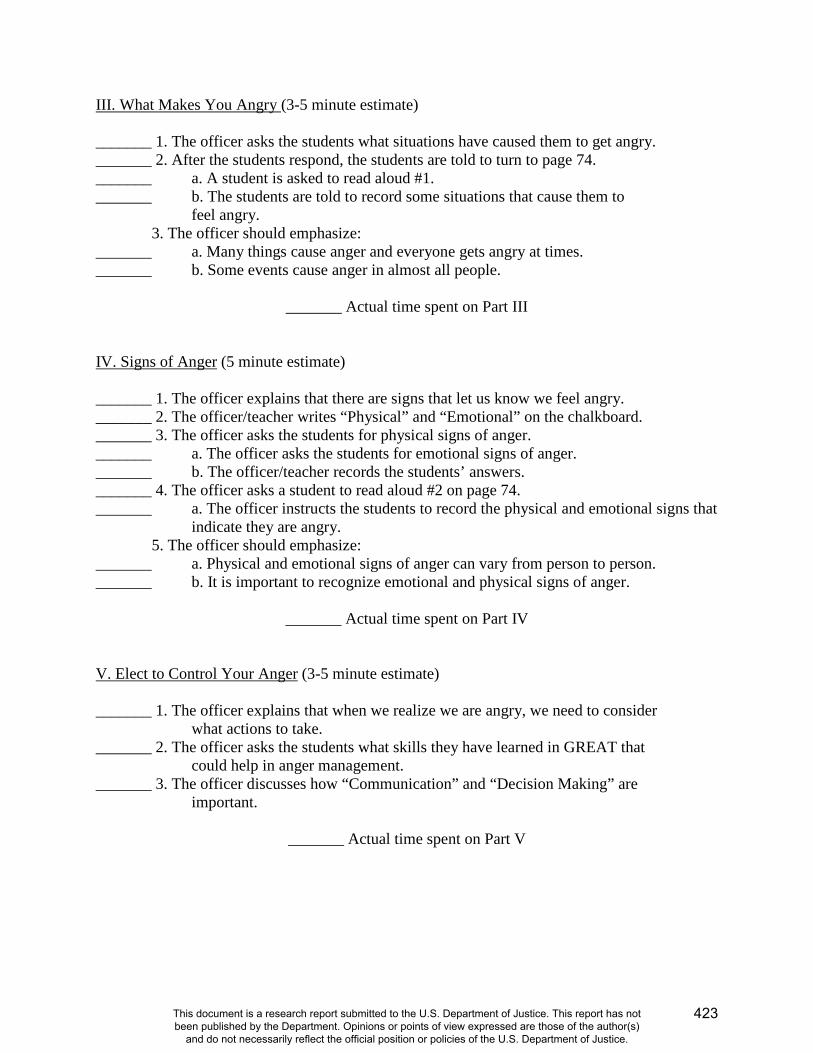
III. What Makes You Angry (3-5 minute estimate) _______ 1. The officer asks the students what situations have caused them to get angry. _______ 2. After the students respond, the students are told to turn to page 74. _______ a. A student is asked to read aloud #1. _______ b. The students are told to record some situations that cause them to
feel angry. 3. The officer should emphasize: _______ a. Many things cause anger and everyone gets angry at times. _______ b. Some events cause anger in almost all people.
_______ Actual time spent on Part III IV. Signs of Anger (5 minute estimate) _______ 1. The officer explains that there are signs that let us know we feel angry. _______ 2. The officer/teacher writes “Physical” and “Emotional” on the chalkboard. _______ 3. The officer asks the students for physical signs of anger. _______ a. The officer asks the students for emotional signs of anger. _______ b. The officer/teacher records the students’ answers. _______ 4. The officer asks a student to read aloud #2 on page 74. _______ a. The officer instructs the students to record the physical and emotional signs that
indicate they are angry. 5. The officer should emphasize: _______ a. Physical and emotional signs of anger can vary from person to person. _______ b. It is important to recognize emotional and physical signs of anger.
_______ Actual time spent on Part IV V. Elect to Control Your Anger (3-5 minute estimate) _______ 1. The officer explains that when we realize we are angry, we need to consider
what actions to take. _______ 2. The officer asks the students what skills they have learned in GREAT that
could help in anger management. _______ 3. The officer discusses how “Communication” and “Decision Making” are
important.
_______ Actual time spent on Part V
423
This document is a research report submitted to the U.S. Department of Justice. This report has not been published by the Department. Opinions or points of view expressed are those of the author(s)
and do not necessarily reflect the official position or policies of the U.S. Department of Justice.
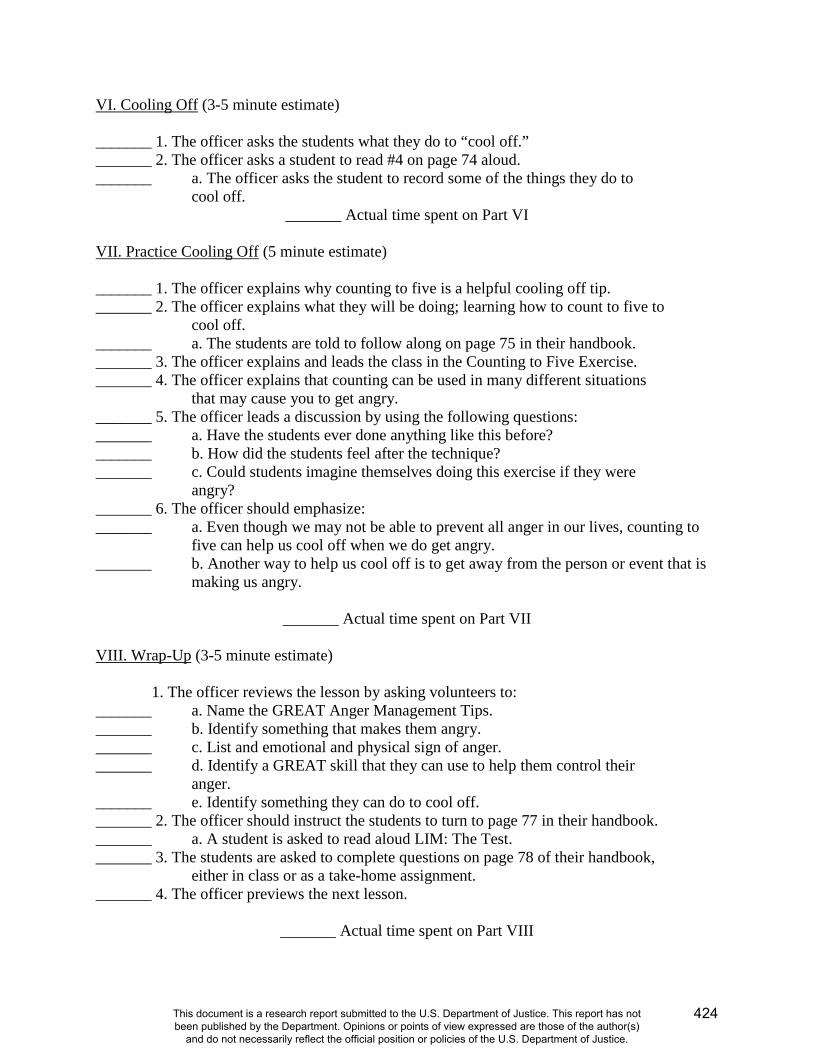
VI. Cooling Off (3-5 minute estimate) _______ 1. The officer asks the students what they do to “cool off.” _______ 2. The officer asks a student to read #4 on page 74 aloud. _______ a. The officer asks the student to record some of the things they do to
cool off. _______ Actual time spent on Part VI
VII. Practice Cooling Off (5 minute estimate) _______ 1. The officer explains why counting to five is a helpful cooling off tip. _______ 2. The officer explains what they will be doing; learning how to count to five to
cool off. _______ a. The students are told to follow along on page 75 in their handbook. _______ 3. The officer explains and leads the class in the Counting to Five Exercise. _______ 4. The officer explains that counting can be used in many different situations
that may cause you to get angry. _______ 5. The officer leads a discussion by using the following questions: _______ a. Have the students ever done anything like this before? _______ b. How did the students feel after the technique? _______ c. Could students imagine themselves doing this exercise if they were
angry? _______ 6. The officer should emphasize: _______ a. Even though we may not be able to prevent all anger in our lives, counting to
five can help us cool off when we do get angry. _______ b. Another way to help us cool off is to get away from the person or event that is
making us angry.
_______ Actual time spent on Part VII VIII. Wrap-Up (3-5 minute estimate) 1. The officer reviews the lesson by asking volunteers to: _______ a. Name the GREAT Anger Management Tips. _______ b. Identify something that makes them angry. _______ c. List and emotional and physical sign of anger. _______ d. Identify a GREAT skill that they can use to help them control their
anger. _______ e. Identify something they can do to cool off. _______ 2. The officer should instruct the students to turn to page 77 in their handbook. _______ a. A student is asked to read aloud LIM: The Test. _______ 3. The students are asked to complete questions on page 78 of their handbook,
either in class or as a take-home assignment. _______ 4. The officer previews the next lesson.
_______ Actual time spent on Part VIII
424
This document is a research report submitted to the U.S. Department of Justice. This report has not been published by the Department. Opinions or points of view expressed are those of the author(s)
and do not necessarily reflect the official position or policies of the U.S. Department of Justice.
_______ End Time
_______ Total time spent on Lesson 10 QUALITATIVE SESSION EVALUATION IN GENERAL... General comments:________________________________________________________ ________________________________________________________________________ ________________________________________________________________________ ________________________________________________________________________ ________________________________________________________________________ DISCUSSIONS... Rate the discussions: 1. Excellent 2. Good 3. Fair 4. Poor Comments on discussions: __________________________________________________ ________________________________________________________________________ ________________________________________________________________________ ACTIVITIES... How engaged were the teens in the activities? 1. Very Engaged 2. Somewhat Engaged 3. Not Engaged Comments on activities:____________________________________________________ ________________________________________________________________________ ________________________________________________________________________ Overall Observer Ratings… Please provide your overall assessment of the following. Low High 1. Adherence to suggested time frames. 1 2 3 4 5 2. Coverage of the topical areas. 1 2 3 4 5 3. Overall lesson adherence 1 2 3 4 5 4. Overall quality of the lesson 1 2 3 4 5
425
This document is a research report submitted to the U.S. Department of Justice. This report has not been published by the Department. Opinions or points of view expressed are those of the author(s)
and do not necessarily reflect the official position or policies of the U.S. Department of Justice.
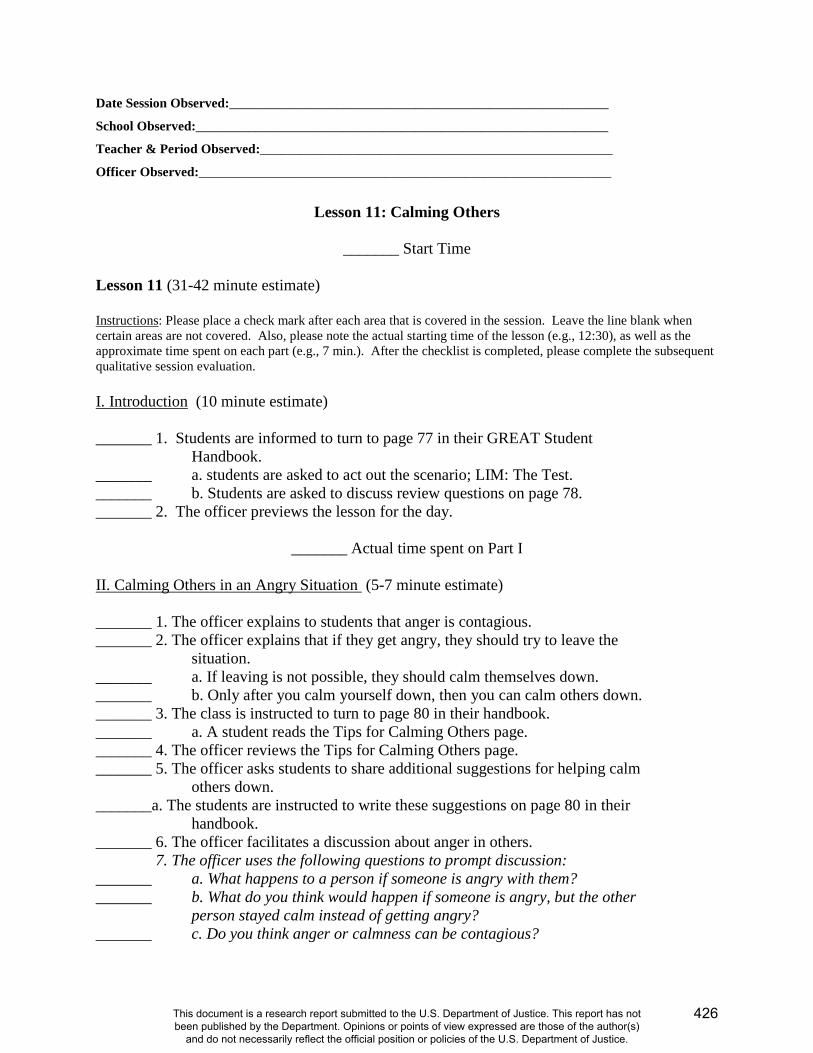
Date Session Observed:_________________________________________________________
School Observed:______________________________________________________________
Teacher & Period Observed:_____________________________________________________
Officer Observed:______________________________________________________________
Lesson 11: Calming Others
_______ Start Time Lesson 11 (31-42 minute estimate) Instructions: Please place a check mark after each area that is covered in the session. Leave the line blank when certain areas are not covered. Also, please note the actual starting time of the lesson (e.g., 12:30), as well as the approximate time spent on each part (e.g., 7 min.). After the checklist is completed, please complete the subsequent qualitative session evaluation. I. Introduction (10 minute estimate) _______ 1. Students are informed to turn to page 77 in their GREAT Student Handbook. _______ a. students are asked to act out the scenario; LIM: The Test. _______ b. Students are asked to discuss review questions on page 78. _______ 2. The officer previews the lesson for the day.
_______ Actual time spent on Part I II. Calming Others in an Angry Situation (5-7 minute estimate) _______ 1. The officer explains to students that anger is contagious. _______ 2. The officer explains that if they get angry, they should try to leave the
situation. _______ a. If leaving is not possible, they should calm themselves down. _______ b. Only after you calm yourself down, then you can calm others down. _______ 3. The class is instructed to turn to page 80 in their handbook. _______ a. A student reads the Tips for Calming Others page. _______ 4. The officer reviews the Tips for Calming Others page. _______ 5. The officer asks students to share additional suggestions for helping calm
others down. _______a. The students are instructed to write these suggestions on page 80 in their
handbook. _______ 6. The officer facilitates a discussion about anger in others. 7. The officer uses the following questions to prompt discussion: _______ a. What happens to a person if someone is angry with them? _______ b. What do you think would happen if someone is angry, but the other
person stayed calm instead of getting angry? _______ c. Do you think anger or calmness can be contagious?
426
This document is a research report submitted to the U.S. Department of Justice. This report has not been published by the Department. Opinions or points of view expressed are those of the author(s)
and do not necessarily reflect the official position or policies of the U.S. Department of Justice.
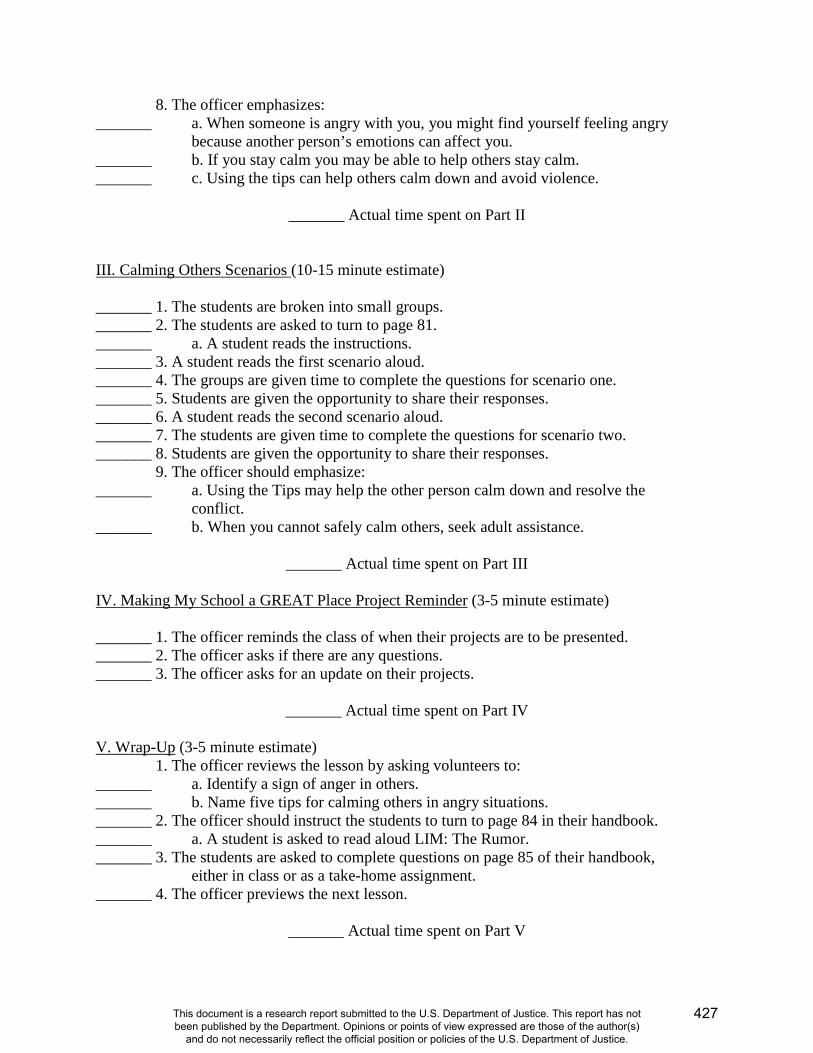
8. The officer emphasizes: _______ a. When someone is angry with you, you might find yourself feeling angry
because another person’s emotions can affect you. _______ b. If you stay calm you may be able to help others stay calm. _______ c. Using the tips can help others calm down and avoid violence.
_______ Actual time spent on Part II III. Calming Others Scenarios (10-15 minute estimate) _______ 1. The students are broken into small groups. _______ 2. The students are asked to turn to page 81. _______ a. A student reads the instructions. _______ 3. A student reads the first scenario aloud. _______ 4. The groups are given time to complete the questions for scenario one. _______ 5. Students are given the opportunity to share their responses. _______ 6. A student reads the second scenario aloud. _______ 7. The students are given time to complete the questions for scenario two. _______ 8. Students are given the opportunity to share their responses. 9. The officer should emphasize: _______ a. Using the Tips may help the other person calm down and resolve the
conflict. _______ b. When you cannot safely calm others, seek adult assistance.
_______ Actual time spent on Part III IV. Making My School a GREAT Place Project Reminder (3-5 minute estimate) _______ 1. The officer reminds the class of when their projects are to be presented. _______ 2. The officer asks if there are any questions. _______ 3. The officer asks for an update on their projects.
_______ Actual time spent on Part IV V. Wrap-Up (3-5 minute estimate) 1. The officer reviews the lesson by asking volunteers to: _______ a. Identify a sign of anger in others. _______ b. Name five tips for calming others in angry situations. _______ 2. The officer should instruct the students to turn to page 84 in their handbook. _______ a. A student is asked to read aloud LIM: The Rumor. _______ 3. The students are asked to complete questions on page 85 of their handbook,
either in class or as a take-home assignment. _______ 4. The officer previews the next lesson.
_______ Actual time spent on Part V
427
This document is a research report submitted to the U.S. Department of Justice. This report has not been published by the Department. Opinions or points of view expressed are those of the author(s)
and do not necessarily reflect the official position or policies of the U.S. Department of Justice.
_______ End Time
_______ Total time spent on Lesson 11 QUALITATIVE SESSION EVALUATION IN GENERAL... General comments:________________________________________________________ ________________________________________________________________________ ________________________________________________________________________ ________________________________________________________________________ ________________________________________________________________________ DISCUSSIONS... Rate the discussions: 1. Excellent 2. Good 3. Fair 4. Poor Comments on discussions: __________________________________________________ ________________________________________________________________________ ________________________________________________________________________ ACTIVITIES... How engaged were the teens in the activities? 1. Very Engaged 2. Somewhat Engaged 3. Not Engaged Comments on activities:____________________________________________________ ________________________________________________________________________ ________________________________________________________________________ Overall Observer Ratings… Please provide your overall assessment of the following. Low High 1. Adherence to suggested time frames. 1 2 3 4 5 2. Coverage of the topical areas. 1 2 3 4 5 3. Overall lesson adherence 1 2 3 4 5 4. Overall quality of the lesson 1 2 3 4 5
428
This document is a research report submitted to the U.S. Department of Justice. This report has not been published by the Department. Opinions or points of view expressed are those of the author(s)
and do not necessarily reflect the official position or policies of the U.S. Department of Justice.
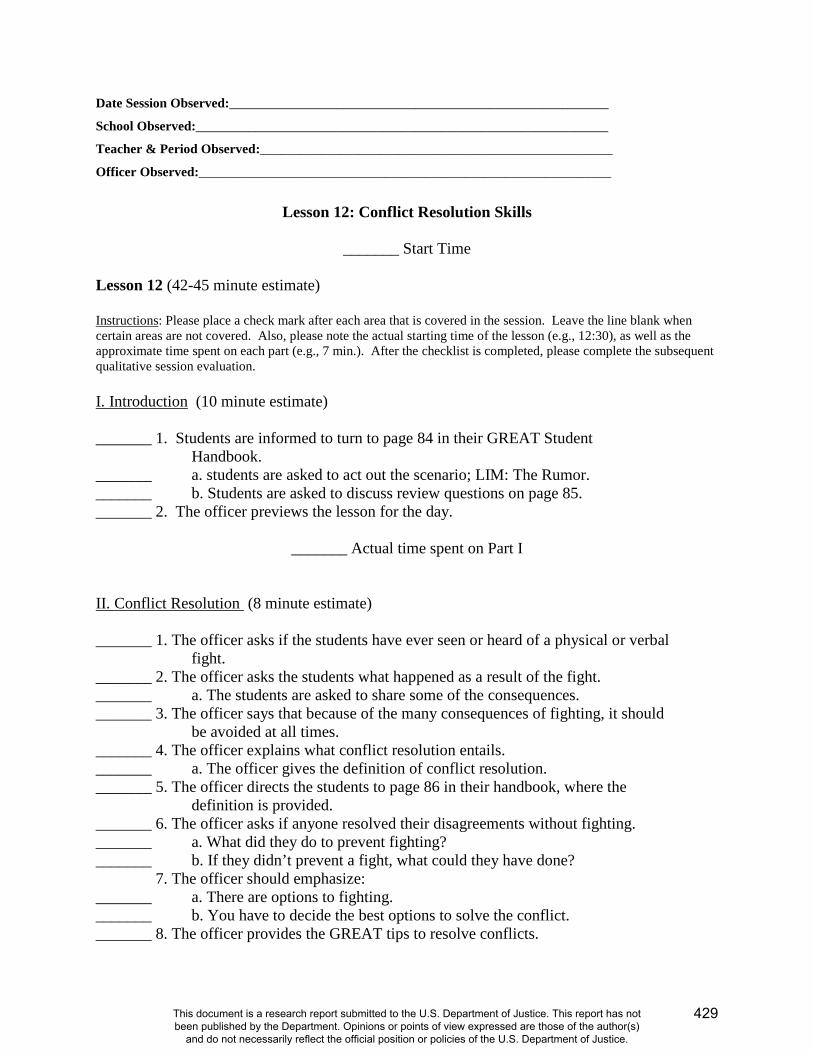
Date Session Observed:_________________________________________________________
School Observed:______________________________________________________________
Teacher & Period Observed:_____________________________________________________
Officer Observed:______________________________________________________________
Lesson 12: Conflict Resolution Skills
_______ Start Time Lesson 12 (42-45 minute estimate) Instructions: Please place a check mark after each area that is covered in the session. Leave the line blank when certain areas are not covered. Also, please note the actual starting time of the lesson (e.g., 12:30), as well as the approximate time spent on each part (e.g., 7 min.). After the checklist is completed, please complete the subsequent qualitative session evaluation. I. Introduction (10 minute estimate) _______ 1. Students are informed to turn to page 84 in their GREAT Student Handbook. _______ a. students are asked to act out the scenario; LIM: The Rumor. _______ b. Students are asked to discuss review questions on page 85. _______ 2. The officer previews the lesson for the day.
_______ Actual time spent on Part I II. Conflict Resolution (8 minute estimate) _______ 1. The officer asks if the students have ever seen or heard of a physical or verbal
fight. _______ 2. The officer asks the students what happened as a result of the fight. _______ a. The students are asked to share some of the consequences. _______ 3. The officer says that because of the many consequences of fighting, it should
be avoided at all times. _______ 4. The officer explains what conflict resolution entails. _______ a. The officer gives the definition of conflict resolution. _______ 5. The officer directs the students to page 86 in their handbook, where the
definition is provided. _______ 6. The officer asks if anyone resolved their disagreements without fighting. _______ a. What did they do to prevent fighting? _______ b. If they didn’t prevent a fight, what could they have done? 7. The officer should emphasize: _______ a. There are options to fighting. _______ b. You have to decide the best options to solve the conflict. _______ 8. The officer provides the GREAT tips to resolve conflicts.
429
This document is a research report submitted to the U.S. Department of Justice. This report has not been published by the Department. Opinions or points of view expressed are those of the author(s)
and do not necessarily reflect the official position or policies of the U.S. Department of Justice.
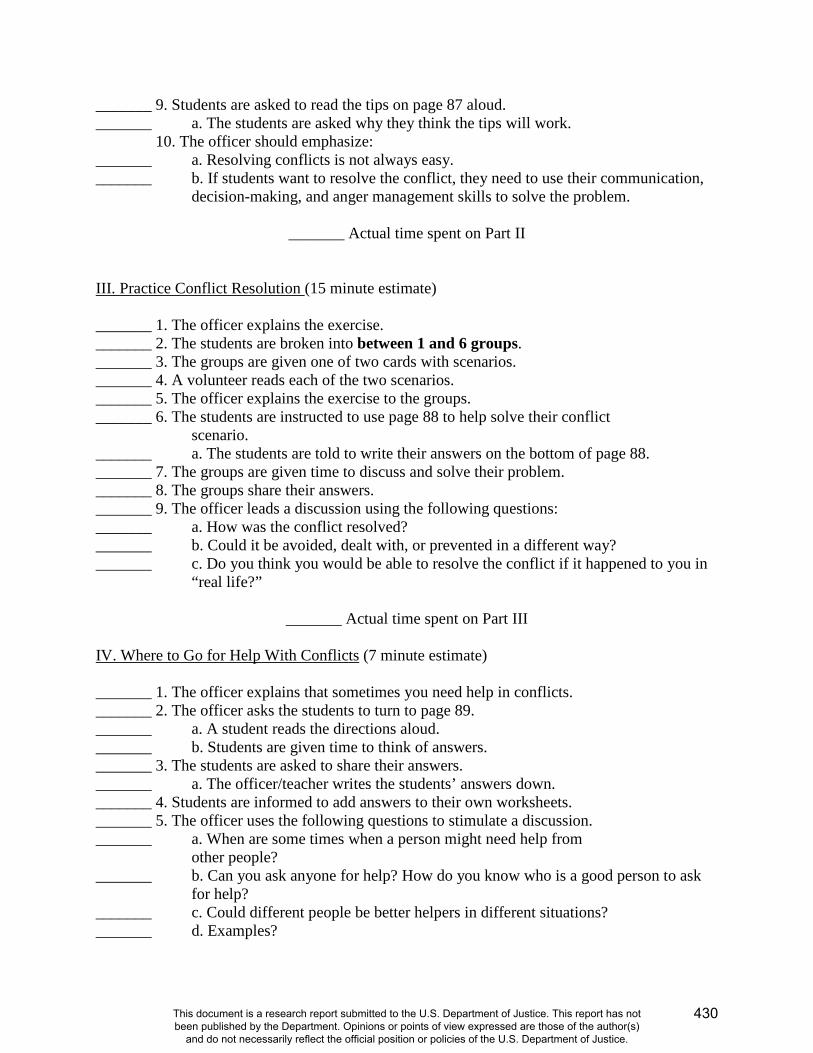
_______ 9. Students are asked to read the tips on page 87 aloud. _______ a. The students are asked why they think the tips will work. 10. The officer should emphasize: _______ a. Resolving conflicts is not always easy. _______ b. If students want to resolve the conflict, they need to use their communication,
decision-making, and anger management skills to solve the problem.
_______ Actual time spent on Part II III. Practice Conflict Resolution (15 minute estimate) _______ 1. The officer explains the exercise. _______ 2. The students are broken into between 1 and 6 groups. _______ 3. The groups are given one of two cards with scenarios. _______ 4. A volunteer reads each of the two scenarios. _______ 5. The officer explains the exercise to the groups. _______ 6. The students are instructed to use page 88 to help solve their conflict
scenario. _______ a. The students are told to write their answers on the bottom of page 88. _______ 7. The groups are given time to discuss and solve their problem. _______ 8. The groups share their answers. _______ 9. The officer leads a discussion using the following questions: _______ a. How was the conflict resolved? _______ b. Could it be avoided, dealt with, or prevented in a different way? _______ c. Do you think you would be able to resolve the conflict if it happened to you in
“real life?”
_______ Actual time spent on Part III IV. Where to Go for Help With Conflicts (7 minute estimate) _______ 1. The officer explains that sometimes you need help in conflicts. _______ 2. The officer asks the students to turn to page 89. _______ a. A student reads the directions aloud. _______ b. Students are given time to think of answers. _______ 3. The students are asked to share their answers. _______ a. The officer/teacher writes the students’ answers down. _______ 4. Students are informed to add answers to their own worksheets. _______ 5. The officer uses the following questions to stimulate a discussion. _______ a. When are some times when a person might need help from
other people? _______ b. Can you ask anyone for help? How do you know who is a good person to ask
for help? _______ c. Could different people be better helpers in different situations? _______ d. Examples?
430
This document is a research report submitted to the U.S. Department of Justice. This report has not been published by the Department. Opinions or points of view expressed are those of the author(s)
and do not necessarily reflect the official position or policies of the U.S. Department of Justice.

6. The officer should emphasize: _______ a. It is important to identify whom you can go to for help ahead of time. _______ b. That way, when you are really in trouble, you don’t have to think about whom
you can ask; you already know.
_______ Actual time spent on Part IV V. Wrap-Up (3-5 minute estimate) 1. The officer reviews the lesson by asking volunteers to: _______ a. Identify the GREAT Conflict Resolution Tips. _______ b. Name a person you can go to for help when you have a conflict. _______ 2. The officer should instruct the students to turn to page 91 in their handbook. _______ a. A student is asked to read aloud LIM: The Conflict. _______ 3. The students are asked to complete questions on page 92 of their handbook,
either in class or as a take-home assignment. _______ 4. The officer previews the next lesson.
_______ Actual time spent on Part V
_______ End Time
_______ Total time spent on Lesson 12 QUALITATIVE SESSION EVALUATION IN GENERAL... General comments:________________________________________________________ ________________________________________________________________________ ________________________________________________________________________ ________________________________________________________________________ ________________________________________________________________________ DISCUSSIONS... Rate the discussions: 1. Excellent 2. Good 3. Fair 4. Poor Comments on discussions: __________________________________________________ ________________________________________________________________________ ________________________________________________________________________ ACTIVITIES... How engaged were the teens in the activities? 1. Very Engaged 2. Somewhat Engaged 3. Not Engaged
431
This document is a research report submitted to the U.S. Department of Justice. This report has not been published by the Department. Opinions or points of view expressed are those of the author(s)
and do not necessarily reflect the official position or policies of the U.S. Department of Justice.
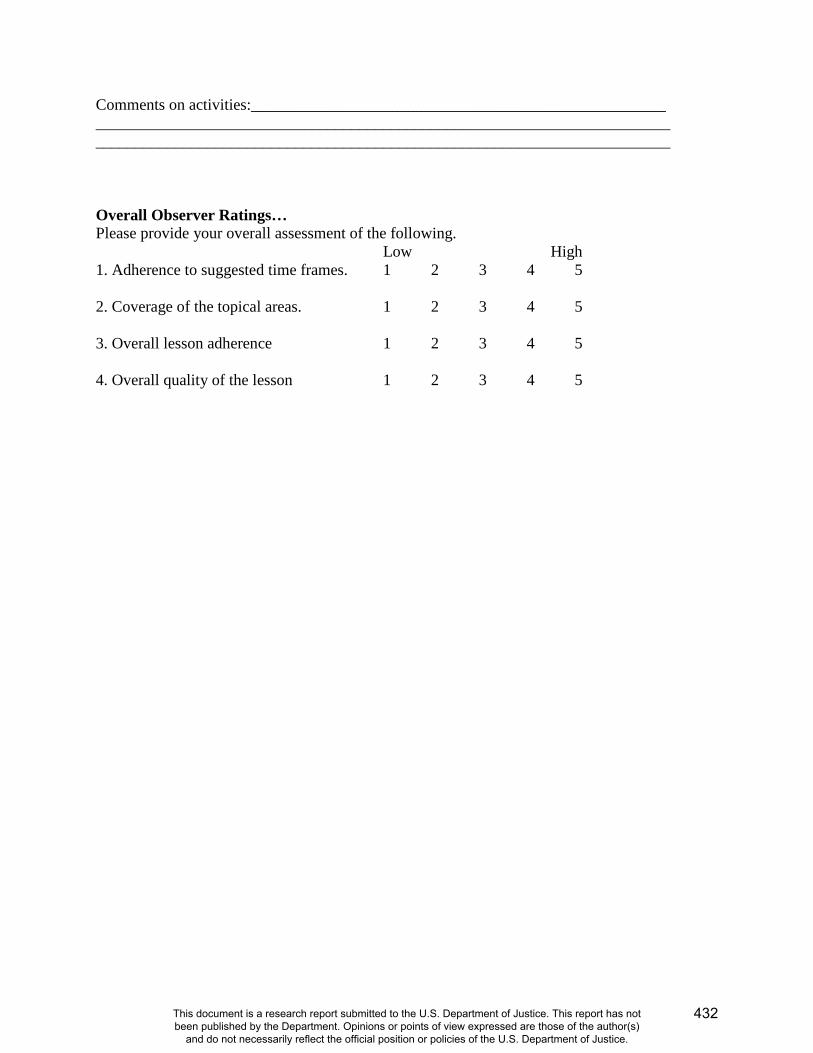
Comments on activities:____________________________________________________ ________________________________________________________________________ ________________________________________________________________________ Overall Observer Ratings… Please provide your overall assessment of the following. Low High 1. Adherence to suggested time frames. 1 2 3 4 5 2. Coverage of the topical areas. 1 2 3 4 5 3. Overall lesson adherence 1 2 3 4 5 4. Overall quality of the lesson 1 2 3 4 5
432
This document is a research report submitted to the U.S. Department of Justice. This report has not been published by the Department. Opinions or points of view expressed are those of the author(s)
and do not necessarily reflect the official position or policies of the U.S. Department of Justice.
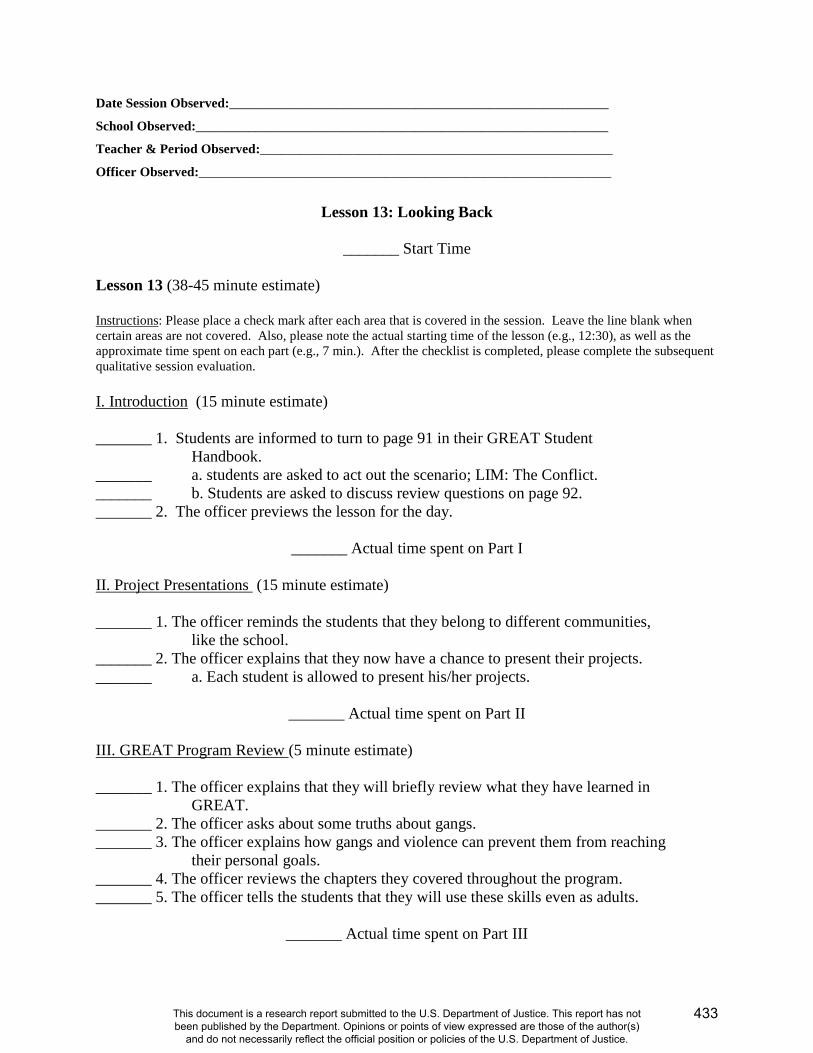
Date Session Observed:_________________________________________________________
School Observed:______________________________________________________________
Teacher & Period Observed:_____________________________________________________
Officer Observed:______________________________________________________________
Lesson 13: Looking Back
_______ Start Time Lesson 13 (38-45 minute estimate) Instructions: Please place a check mark after each area that is covered in the session. Leave the line blank when certain areas are not covered. Also, please note the actual starting time of the lesson (e.g., 12:30), as well as the approximate time spent on each part (e.g., 7 min.). After the checklist is completed, please complete the subsequent qualitative session evaluation. I. Introduction (15 minute estimate) _______ 1. Students are informed to turn to page 91 in their GREAT Student Handbook. _______ a. students are asked to act out the scenario; LIM: The Conflict. _______ b. Students are asked to discuss review questions on page 92. _______ 2. The officer previews the lesson for the day.
_______ Actual time spent on Part I II. Project Presentations (15 minute estimate) _______ 1. The officer reminds the students that they belong to different communities,
like the school. _______ 2. The officer explains that they now have a chance to present their projects. _______ a. Each student is allowed to present his/her projects.
_______ Actual time spent on Part II III. GREAT Program Review (5 minute estimate) _______ 1. The officer explains that they will briefly review what they have learned in
GREAT. _______ 2. The officer asks about some truths about gangs. _______ 3. The officer explains how gangs and violence can prevent them from reaching
their personal goals. _______ 4. The officer reviews the chapters they covered throughout the program. _______ 5. The officer tells the students that they will use these skills even as adults.
_______ Actual time spent on Part III
433
This document is a research report submitted to the U.S. Department of Justice. This report has not been published by the Department. Opinions or points of view expressed are those of the author(s)
and do not necessarily reflect the official position or policies of the U.S. Department of Justice.

IV. Officer Thank-You (3-5 minute estimate) _______ 1. The officer should personalize a closing statement. _______ 2. The officer explains if there will be a formal graduation. _______ 3. The officer tells the students to bring the parent letter on page 93 home to
their parents.
_______ Actual time spent on Part IV
_______ End Time
_______ Total time spent on Lesson 13 QUALITATIVE SESSION EVALUATION IN GENERAL... General comments:________________________________________________________ ________________________________________________________________________ ________________________________________________________________________ ________________________________________________________________________ ________________________________________________________________________ DISCUSSIONS... Rate the discussions: 1. Excellent 2. Good 3. Fair 4. Poor Comments on discussions: __________________________________________________ ________________________________________________________________________ ________________________________________________________________________ ACTIVITIES... How engaged were the teens in the activities? 1. Very Engaged 2. Somewhat Engaged 3. Not Engaged Comments on activities:____________________________________________________ ________________________________________________________________________ ________________________________________________________________________
434
This document is a research report submitted to the U.S. Department of Justice. This report has not been published by the Department. Opinions or points of view expressed are those of the author(s)
and do not necessarily reflect the official position or policies of the U.S. Department of Justice.

Overall Observer Ratings… Please provide your overall assessment of the following. Low High 1. Adherence to suggested time frames. 1 2 3 4 5 2. Coverage of the topical areas. 1 2 3 4 5 3. Overall lesson adherence 1 2 3 4 5 4. Overall quality of the lesson 1 2 3 4 5
435
This document is a research report submitted to the U.S. Department of Justice. This report has not been published by the Department. Opinions or points of view expressed are those of the author(s)
and do not necessarily reflect the official position or policies of the U.S. Department of Justice.
NATIONAL EVALUATION OF G.R.E.A.T.
SCHOOL PERSONNEL QUESTIONNAIRE
2007
University of Missouri-St. Louis Department of Criminology and Criminal Justice
One University Blvd. St. Louis, MO 63121
436
This document is a research report submitted to the U.S. Department of Justice. This report has not been published by the Department. Opinions or points of view expressed are those of the author(s)
and do not necessarily reflect the official position or policies of the U.S. Department of Justice.
This questionnaire is part of the National Evaluation of the Gang Resistance Education and Training (G.R.E.A.T.) program. Funding is provided by the U.S. Department of Justice. Students at your school are participating in this evaluation. We are interested in knowing how school personnel feel about school safety issues, school-based prevention programs in general, and the G.R.E.A.T. program in particular. Please take a few minutes to answer these questions. Thank you.
INSTRUCTIONS 1. Your participation is voluntary. 2. Circle the number or write in the response that represents your best answer to each
question. 3. There are no right or wrong answers. Your opinion is what is important. 4. Do NOT write your name on the questionnaire. 5. Your answers are confidential. 6. You have the right to skip any question that you do not want to answer.
437
This document is a research report submitted to the U.S. Department of Justice. This report has not been published by the Department. Opinions or points of view expressed are those of the author(s)
and do not necessarily reflect the official position or policies of the U.S. Department of Justice.
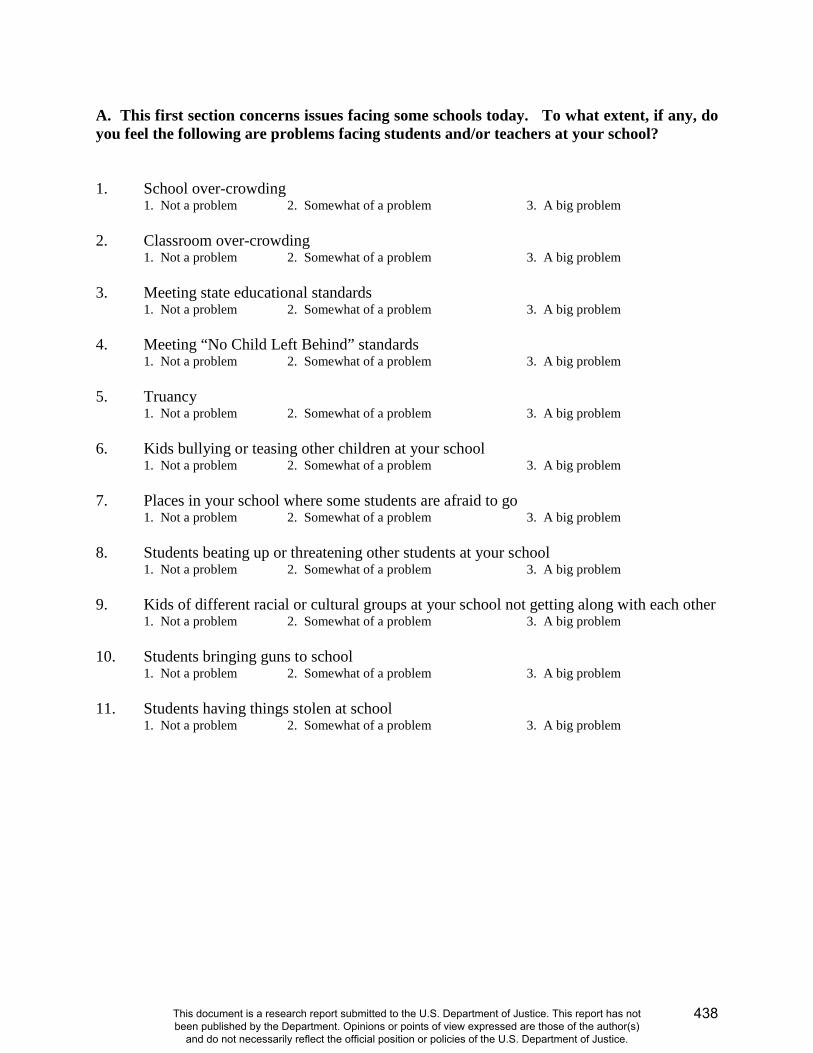
A. This first section concerns issues facing some schools today. To what extent, if any, do you feel the following are problems facing students and/or teachers at your school? 1. School over-crowding 1. Not a problem 2. Somewhat of a problem 3. A big problem 2. Classroom over-crowding 1. Not a problem 2. Somewhat of a problem 3. A big problem 3. Meeting state educational standards 1. Not a problem 2. Somewhat of a problem 3. A big problem 4. Meeting “No Child Left Behind” standards 1. Not a problem 2. Somewhat of a problem 3. A big problem 5. Truancy 1. Not a problem 2. Somewhat of a problem 3. A big problem 6. Kids bullying or teasing other children at your school 1. Not a problem 2. Somewhat of a problem 3. A big problem 7. Places in your school where some students are afraid to go 1. Not a problem 2. Somewhat of a problem 3. A big problem 8. Students beating up or threatening other students at your school 1. Not a problem 2. Somewhat of a problem 3. A big problem 9. Kids of different racial or cultural groups at your school not getting along with each other 1. Not a problem 2. Somewhat of a problem 3. A big problem 10. Students bringing guns to school 1. Not a problem 2. Somewhat of a problem 3. A big problem 11. Students having things stolen at school 1. Not a problem 2. Somewhat of a problem 3. A big problem
438
This document is a research report submitted to the U.S. Department of Justice. This report has not been published by the Department. Opinions or points of view expressed are those of the author(s)
and do not necessarily reflect the official position or policies of the U.S. Department of Justice.
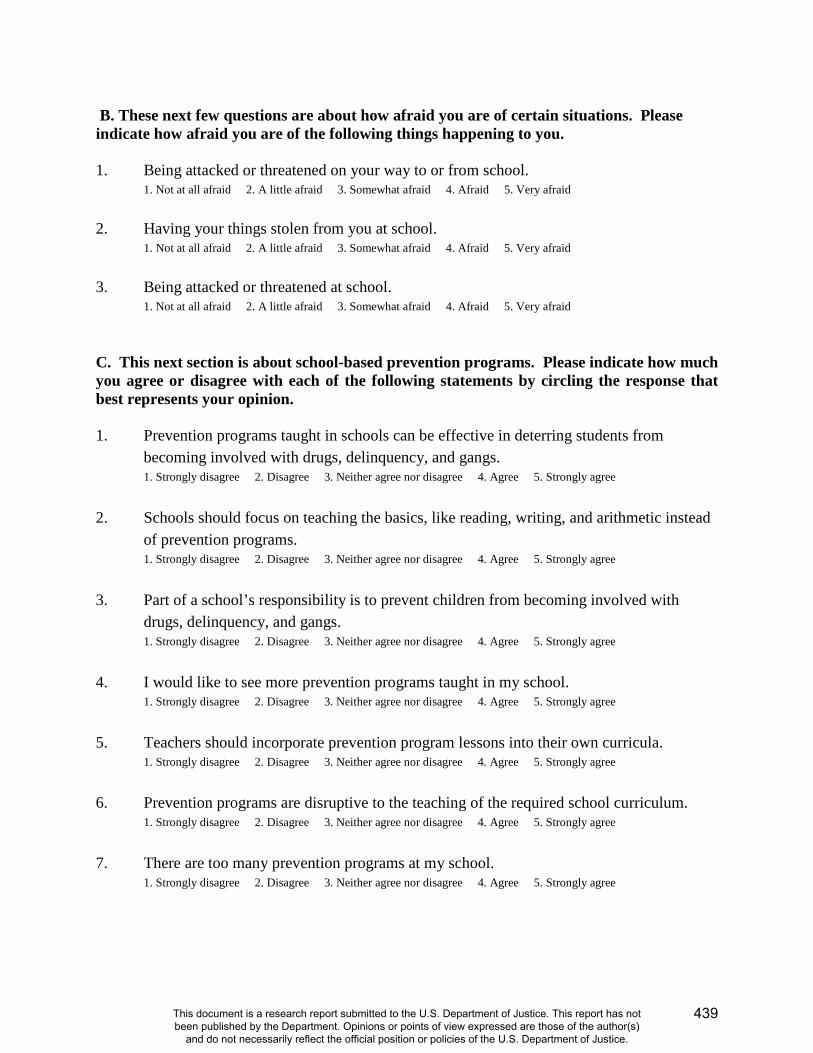
B. These next few questions are about how afraid you are of certain situations. Please indicate how afraid you are of the following things happening to you. 1. Being attacked or threatened on your way to or from school.
1. Not at all afraid 2. A little afraid 3. Somewhat afraid 4. Afraid 5. Very afraid 2. Having your things stolen from you at school.
1. Not at all afraid 2. A little afraid 3. Somewhat afraid 4. Afraid 5. Very afraid 3. Being attacked or threatened at school.
1. Not at all afraid 2. A little afraid 3. Somewhat afraid 4. Afraid 5. Very afraid
C. This next section is about school-based prevention programs. Please indicate how much you agree or disagree with each of the following statements by circling the response that best represents your opinion. 1. Prevention programs taught in schools can be effective in deterring students from
becoming involved with drugs, delinquency, and gangs. 1. Strongly disagree 2. Disagree 3. Neither agree nor disagree 4. Agree 5. Strongly agree
2. Schools should focus on teaching the basics, like reading, writing, and arithmetic instead
of prevention programs. 1. Strongly disagree 2. Disagree 3. Neither agree nor disagree 4. Agree 5. Strongly agree
3. Part of a school’s responsibility is to prevent children from becoming involved with
drugs, delinquency, and gangs. 1. Strongly disagree 2. Disagree 3. Neither agree nor disagree 4. Agree 5. Strongly agree
4. I would like to see more prevention programs taught in my school.
1. Strongly disagree 2. Disagree 3. Neither agree nor disagree 4. Agree 5. Strongly agree
5. Teachers should incorporate prevention program lessons into their own curricula.
1. Strongly disagree 2. Disagree 3. Neither agree nor disagree 4. Agree 5. Strongly agree 6. Prevention programs are disruptive to the teaching of the required school curriculum.
1. Strongly disagree 2. Disagree 3. Neither agree nor disagree 4. Agree 5. Strongly agree 7. There are too many prevention programs at my school.
1. Strongly disagree 2. Disagree 3. Neither agree nor disagree 4. Agree 5. Strongly agree
439
This document is a research report submitted to the U.S. Department of Justice. This report has not been published by the Department. Opinions or points of view expressed are those of the author(s)
and do not necessarily reflect the official position or policies of the U.S. Department of Justice.
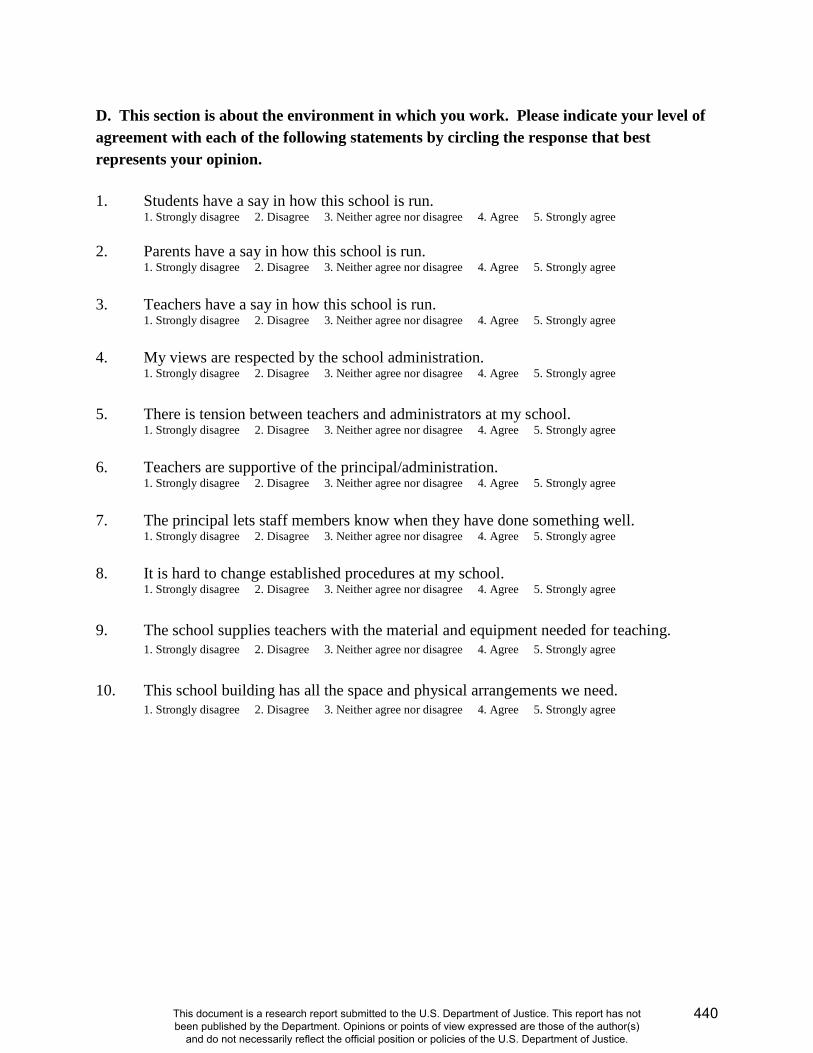
D. This section is about the environment in which you work. Please indicate your level of agreement with each of the following statements by circling the response that best represents your opinion. 1. Students have a say in how this school is run.
1. Strongly disagree 2. Disagree 3. Neither agree nor disagree 4. Agree 5. Strongly agree 2. Parents have a say in how this school is run.
1. Strongly disagree 2. Disagree 3. Neither agree nor disagree 4. Agree 5. Strongly agree
3. Teachers have a say in how this school is run.
1. Strongly disagree 2. Disagree 3. Neither agree nor disagree 4. Agree 5. Strongly agree
4. My views are respected by the school administration.
1. Strongly disagree 2. Disagree 3. Neither agree nor disagree 4. Agree 5. Strongly agree
5. There is tension between teachers and administrators at my school.
1. Strongly disagree 2. Disagree 3. Neither agree nor disagree 4. Agree 5. Strongly agree
6. Teachers are supportive of the principal/administration.
1. Strongly disagree 2. Disagree 3. Neither agree nor disagree 4. Agree 5. Strongly agree
7. The principal lets staff members know when they have done something well.
1. Strongly disagree 2. Disagree 3. Neither agree nor disagree 4. Agree 5. Strongly agree
8. It is hard to change established procedures at my school.
1. Strongly disagree 2. Disagree 3. Neither agree nor disagree 4. Agree 5. Strongly agree
9. The school supplies teachers with the material and equipment needed for teaching.
1. Strongly disagree 2. Disagree 3. Neither agree nor disagree 4. Agree 5. Strongly agree
10. This school building has all the space and physical arrangements we need.
1. Strongly disagree 2. Disagree 3. Neither agree nor disagree 4. Agree 5. Strongly agree
440
This document is a research report submitted to the U.S. Department of Justice. This report has not been published by the Department. Opinions or points of view expressed are those of the author(s)
and do not necessarily reflect the official position or policies of the U.S. Department of Justice.
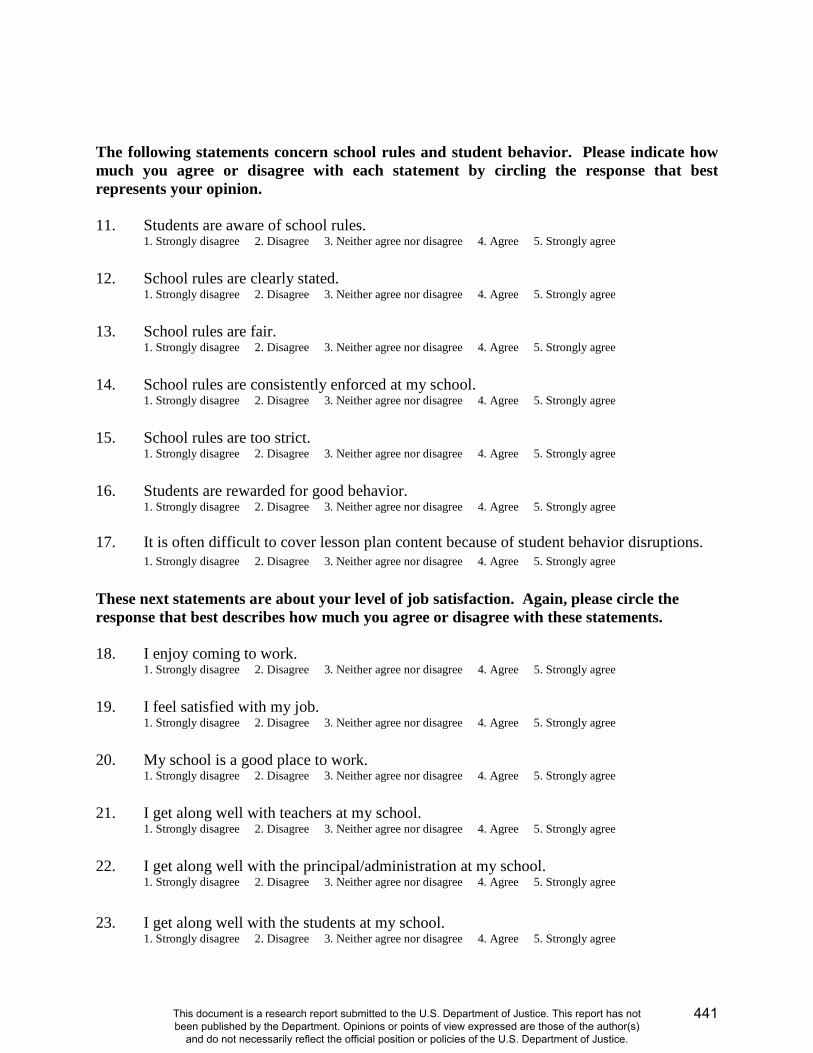
The following statements concern school rules and student behavior. Please indicate how much you agree or disagree with each statement by circling the response that best represents your opinion. 11. Students are aware of school rules.
1. Strongly disagree 2. Disagree 3. Neither agree nor disagree 4. Agree 5. Strongly agree
12. School rules are clearly stated.
1. Strongly disagree 2. Disagree 3. Neither agree nor disagree 4. Agree 5. Strongly agree
13. School rules are fair.
1. Strongly disagree 2. Disagree 3. Neither agree nor disagree 4. Agree 5. Strongly agree
14. School rules are consistently enforced at my school.
1. Strongly disagree 2. Disagree 3. Neither agree nor disagree 4. Agree 5. Strongly agree
15. School rules are too strict.
1. Strongly disagree 2. Disagree 3. Neither agree nor disagree 4. Agree 5. Strongly agree
16. Students are rewarded for good behavior.
1. Strongly disagree 2. Disagree 3. Neither agree nor disagree 4. Agree 5. Strongly agree
17. It is often difficult to cover lesson plan content because of student behavior disruptions. 1. Strongly disagree 2. Disagree 3. Neither agree nor disagree 4. Agree 5. Strongly agree
These next statements are about your level of job satisfaction. Again, please circle the response that best describes how much you agree or disagree with these statements. 18. I enjoy coming to work.
1. Strongly disagree 2. Disagree 3. Neither agree nor disagree 4. Agree 5. Strongly agree
19. I feel satisfied with my job.
1. Strongly disagree 2. Disagree 3. Neither agree nor disagree 4. Agree 5. Strongly agree
20. My school is a good place to work.
1. Strongly disagree 2. Disagree 3. Neither agree nor disagree 4. Agree 5. Strongly agree
21. I get along well with teachers at my school.
1. Strongly disagree 2. Disagree 3. Neither agree nor disagree 4. Agree 5. Strongly agree
22. I get along well with the principal/administration at my school.
1. Strongly disagree 2. Disagree 3. Neither agree nor disagree 4. Agree 5. Strongly agree
23. I get along well with the students at my school.
1. Strongly disagree 2. Disagree 3. Neither agree nor disagree 4. Agree 5. Strongly agree
441
This document is a research report submitted to the U.S. Department of Justice. This report has not been published by the Department. Opinions or points of view expressed are those of the author(s)
and do not necessarily reflect the official position or policies of the U.S. Department of Justice.
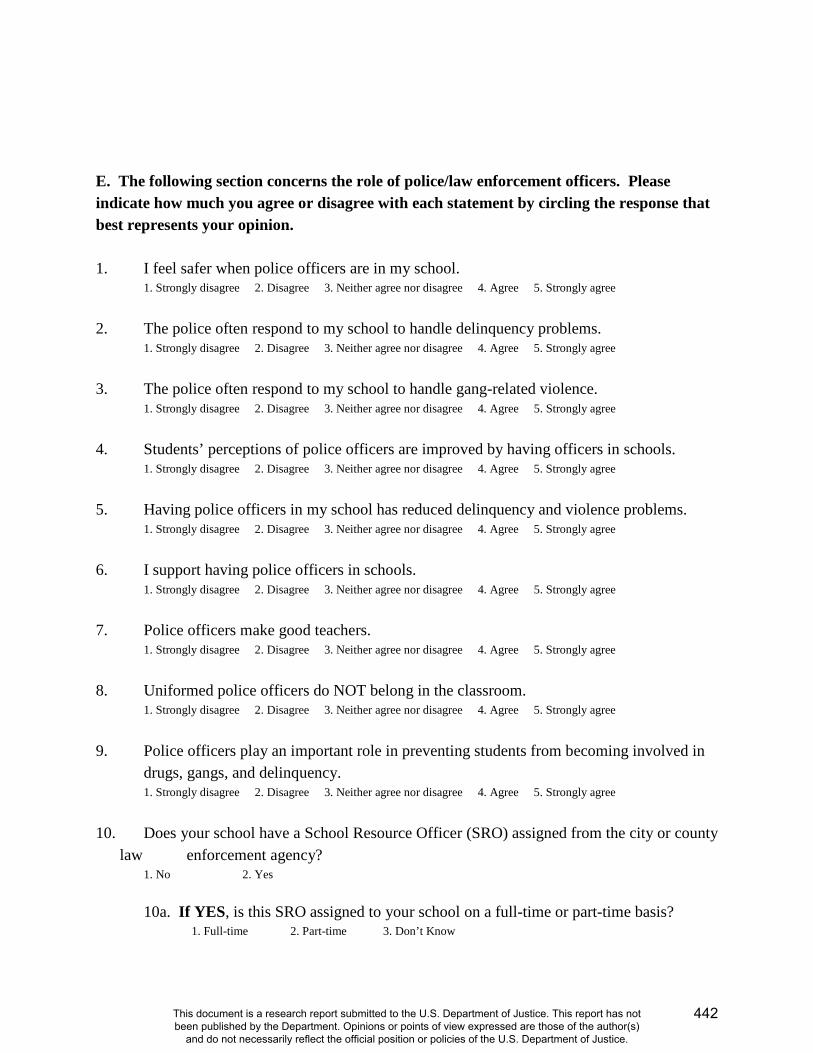
E. The following section concerns the role of police/law enforcement officers. Please indicate how much you agree or disagree with each statement by circling the response that best represents your opinion. 1. I feel safer when police officers are in my school.
1. Strongly disagree 2. Disagree 3. Neither agree nor disagree 4. Agree 5. Strongly agree
2. The police often respond to my school to handle delinquency problems.
1. Strongly disagree 2. Disagree 3. Neither agree nor disagree 4. Agree 5. Strongly agree
3. The police often respond to my school to handle gang-related violence.
1. Strongly disagree 2. Disagree 3. Neither agree nor disagree 4. Agree 5. Strongly agree 4. Students’ perceptions of police officers are improved by having officers in schools.
1. Strongly disagree 2. Disagree 3. Neither agree nor disagree 4. Agree 5. Strongly agree 5. Having police officers in my school has reduced delinquency and violence problems.
1. Strongly disagree 2. Disagree 3. Neither agree nor disagree 4. Agree 5. Strongly agree
6. I support having police officers in schools.
1. Strongly disagree 2. Disagree 3. Neither agree nor disagree 4. Agree 5. Strongly agree 7. Police officers make good teachers.
1. Strongly disagree 2. Disagree 3. Neither agree nor disagree 4. Agree 5. Strongly agree 8. Uniformed police officers do NOT belong in the classroom.
1. Strongly disagree 2. Disagree 3. Neither agree nor disagree 4. Agree 5. Strongly agree
9. Police officers play an important role in preventing students from becoming involved in
drugs, gangs, and delinquency. 1. Strongly disagree 2. Disagree 3. Neither agree nor disagree 4. Agree 5. Strongly agree
10. Does your school have a School Resource Officer (SRO) assigned from the city or county
law enforcement agency? 1. No 2. Yes
10a. If YES, is this SRO assigned to your school on a full-time or part-time basis?
1. Full-time 2. Part-time 3. Don’t Know
442
This document is a research report submitted to the U.S. Department of Justice. This report has not been published by the Department. Opinions or points of view expressed are those of the author(s)
and do not necessarily reflect the official position or policies of the U.S. Department of Justice.
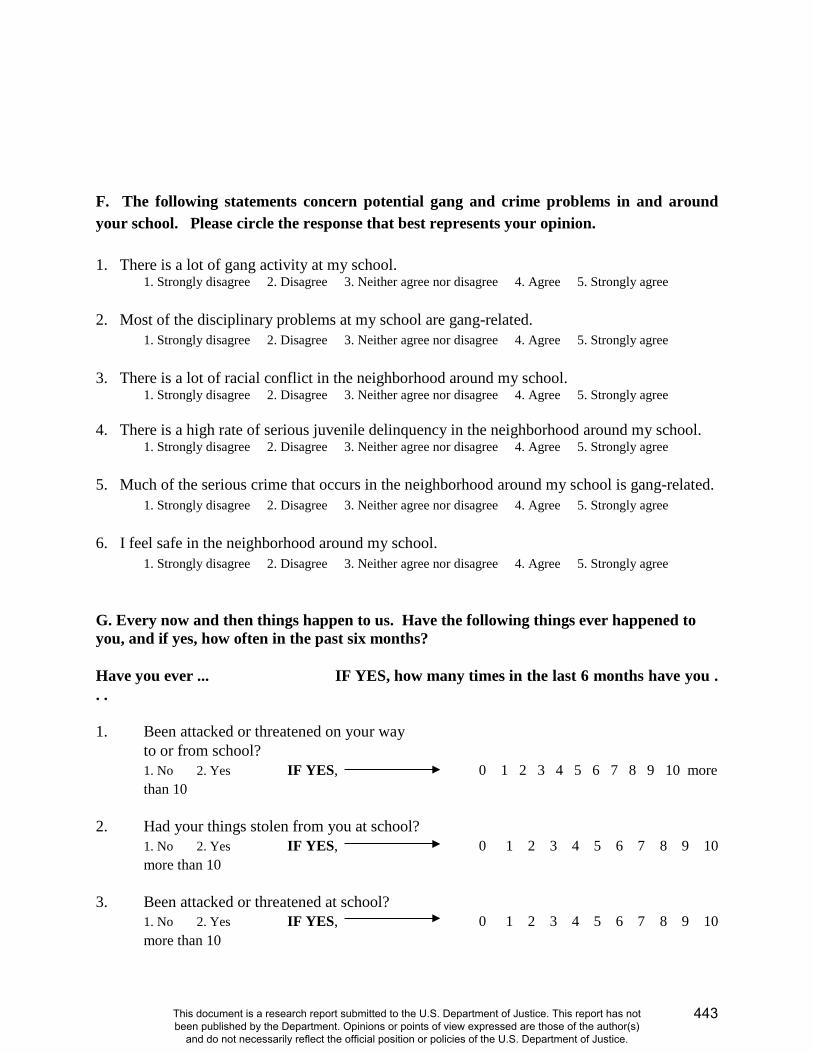
F. The following statements concern potential gang and crime problems in and around your school. Please circle the response that best represents your opinion. 1. There is a lot of gang activity at my school.
1. Strongly disagree 2. Disagree 3. Neither agree nor disagree 4. Agree 5. Strongly agree 2. Most of the disciplinary problems at my school are gang-related.
1. Strongly disagree 2. Disagree 3. Neither agree nor disagree 4. Agree 5. Strongly agree 3. There is a lot of racial conflict in the neighborhood around my school.
1. Strongly disagree 2. Disagree 3. Neither agree nor disagree 4. Agree 5. Strongly agree 4. There is a high rate of serious juvenile delinquency in the neighborhood around my school.
1. Strongly disagree 2. Disagree 3. Neither agree nor disagree 4. Agree 5. Strongly agree 5. Much of the serious crime that occurs in the neighborhood around my school is gang-related.
1. Strongly disagree 2. Disagree 3. Neither agree nor disagree 4. Agree 5. Strongly agree 6. I feel safe in the neighborhood around my school.
1. Strongly disagree 2. Disagree 3. Neither agree nor disagree 4. Agree 5. Strongly agree G. Every now and then things happen to us. Have the following things ever happened to you, and if yes, how often in the past six months? Have you ever ... IF YES, how many times in the last 6 months have you . . . 1. Been attacked or threatened on your way to or from school? 1. No 2. Yes IF YES, 0 1 2 3 4 5 6 7 8 9 10 more
than 10 2. Had your things stolen from you at school? 1. No 2. Yes IF YES, 0 1 2 3 4 5 6 7 8 9 10
more than 10 3. Been attacked or threatened at school? 1. No 2. Yes IF YES, 0 1 2 3 4 5 6 7 8 9 10
more than 10
443
This document is a research report submitted to the U.S. Department of Justice. This report has not been published by the Department. Opinions or points of view expressed are those of the author(s)
and do not necessarily reflect the official position or policies of the U.S. Department of Justice.

H. The following are common content or skills that prevention programs at your school attempt to provide to students. Please circle the response that best indicates your opinion of how important each aspect is in helping youths avoid drugs, delinquency, and gangs. 1. Goal setting 1. Not important 2. Somewhat important 3. Very important 2. Decision making 1. Not important 2. Somewhat important 3. Very important 3. Anger management 1. Not important 2. Somewhat important 3. Very important 4. Problem solving 1. Not important 2. Somewhat important 3. Very important 5. Refusal skills 1. Not important 2. Somewhat important 3. Very important 6. Recognition of peer pressure 1. Not important 2. Somewhat important 3. Very important 7. Anti-gang and violence norms 1. Not important 2. Somewhat important 3. Very important 8. Communication skills 1. Not important 2. Somewhat important 3. Very important 9. Conflict resolution 1. Not important 2. Somewhat important 3. Very important 10. Social responsibility 1. Not important 2. Somewhat important 3. Very important 11. Empathy and perspective taking 1. Not important 2. Somewhat important 3. Very important
I. The following are common methods of delivery for prevention programs at your school. Please circle the response that best indicates your opinion of their effectiveness in conveying the materials. 1. Lecture 1. Not effective 2. Somewhat effective 3. Very effective 2. Class discussion 1. Not effective 2. Somewhat effective 3. Very effective 3. Role playing 1. Not effective 2. Somewhat effective 3. Very effective 4. Question & answer sessions 1. Not effective 2. Somewhat effective 3. Very effective 5. Small group activities 1. Not effective 2. Somewhat effective 3. Very effective 6. Written homework 1. Not effective 2. Somewhat effective 3. Very effective J. The following questions and statements are about the G.R.E.A.T. program. Please circle the response that best represents your opinion about each question or statement.
444
This document is a research report submitted to the U.S. Department of Justice. This report has not been published by the Department. Opinions or points of view expressed are those of the author(s)
and do not necessarily reflect the official position or policies of the U.S. Department of Justice.
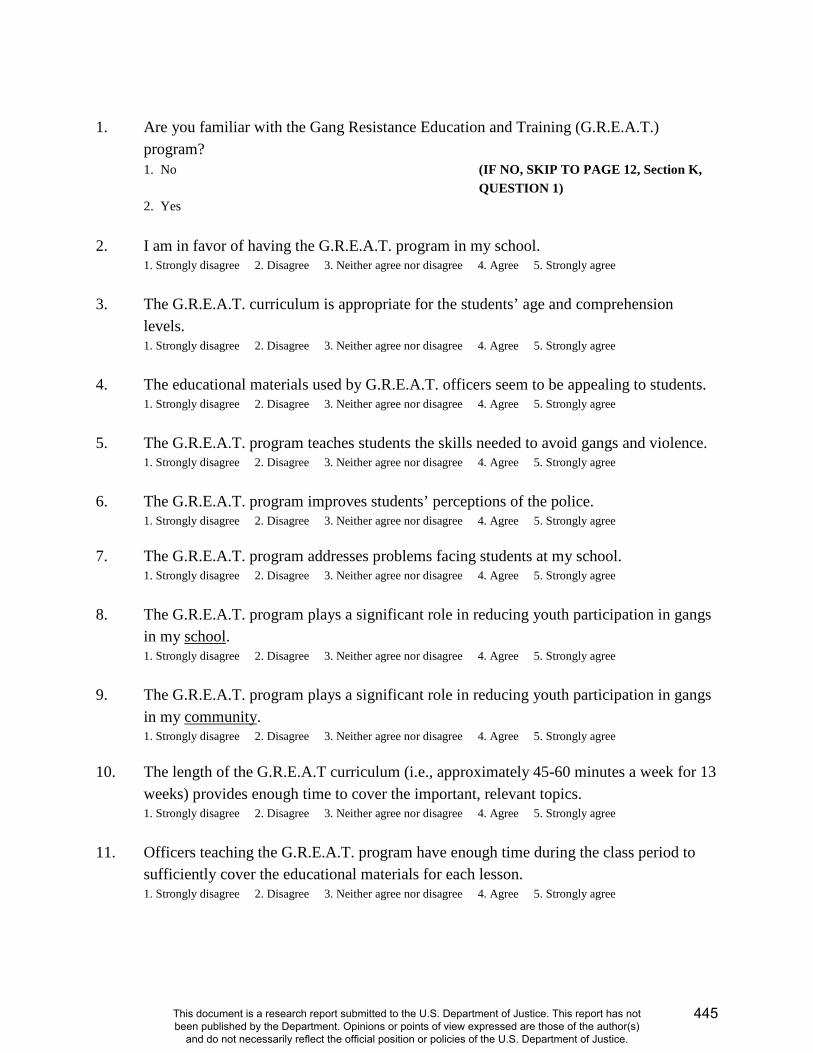
1. Are you familiar with the Gang Resistance Education and Training (G.R.E.A.T.)
program? 1. No (IF NO, SKIP TO PAGE 12, Section K,
QUESTION 1) 2. Yes
2. I am in favor of having the G.R.E.A.T. program in my school. 1. Strongly disagree 2. Disagree 3. Neither agree nor disagree 4. Agree 5. Strongly agree
3. The G.R.E.A.T. curriculum is appropriate for the students’ age and comprehension
levels. 1. Strongly disagree 2. Disagree 3. Neither agree nor disagree 4. Agree 5. Strongly agree
4. The educational materials used by G.R.E.A.T. officers seem to be appealing to students.
1. Strongly disagree 2. Disagree 3. Neither agree nor disagree 4. Agree 5. Strongly agree 5. The G.R.E.A.T. program teaches students the skills needed to avoid gangs and violence.
1. Strongly disagree 2. Disagree 3. Neither agree nor disagree 4. Agree 5. Strongly agree 6. The G.R.E.A.T. program improves students’ perceptions of the police.
1. Strongly disagree 2. Disagree 3. Neither agree nor disagree 4. Agree 5. Strongly agree
7. The G.R.E.A.T. program addresses problems facing students at my school. 1. Strongly disagree 2. Disagree 3. Neither agree nor disagree 4. Agree 5. Strongly agree
8. The G.R.E.A.T. program plays a significant role in reducing youth participation in gangs
in my school. 1. Strongly disagree 2. Disagree 3. Neither agree nor disagree 4. Agree 5. Strongly agree
9. The G.R.E.A.T. program plays a significant role in reducing youth participation in gangs
in my community. 1. Strongly disagree 2. Disagree 3. Neither agree nor disagree 4. Agree 5. Strongly agree
10. The length of the G.R.E.A.T curriculum (i.e., approximately 45-60 minutes a week for 13
weeks) provides enough time to cover the important, relevant topics. 1. Strongly disagree 2. Disagree 3. Neither agree nor disagree 4. Agree 5. Strongly agree
11. Officers teaching the G.R.E.A.T. program have enough time during the class period to
sufficiently cover the educational materials for each lesson. 1. Strongly disagree 2. Disagree 3. Neither agree nor disagree 4. Agree 5. Strongly agree
445
This document is a research report submitted to the U.S. Department of Justice. This report has not been published by the Department. Opinions or points of view expressed are those of the author(s)
and do not necessarily reflect the official position or policies of the U.S. Department of Justice.
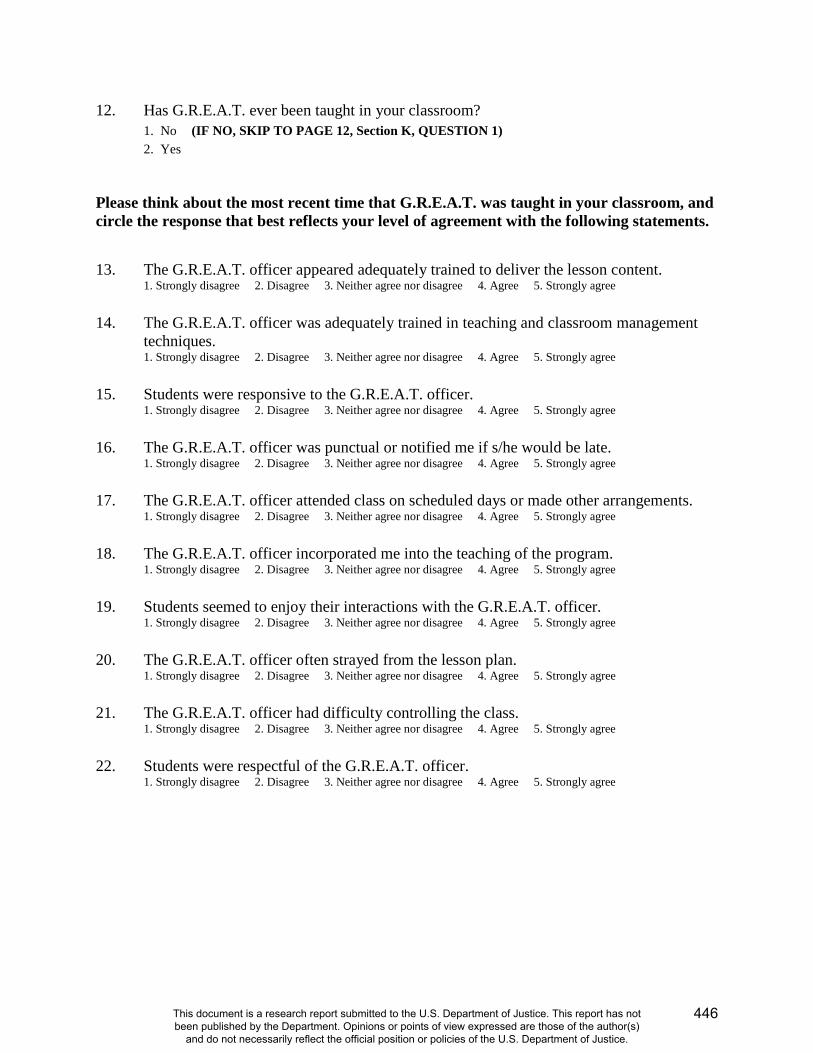
12. Has G.R.E.A.T. ever been taught in your classroom? 1. No (IF NO, SKIP TO PAGE 12, Section K, QUESTION 1) 2. Yes
Please think about the most recent time that G.R.E.A.T. was taught in your classroom, and circle the response that best reflects your level of agreement with the following statements. 13. The G.R.E.A.T. officer appeared adequately trained to deliver the lesson content.
1. Strongly disagree 2. Disagree 3. Neither agree nor disagree 4. Agree 5. Strongly agree
14. The G.R.E.A.T. officer was adequately trained in teaching and classroom management
techniques. 1. Strongly disagree 2. Disagree 3. Neither agree nor disagree 4. Agree 5. Strongly agree
15. Students were responsive to the G.R.E.A.T. officer.
1. Strongly disagree 2. Disagree 3. Neither agree nor disagree 4. Agree 5. Strongly agree
16. The G.R.E.A.T. officer was punctual or notified me if s/he would be late.
1. Strongly disagree 2. Disagree 3. Neither agree nor disagree 4. Agree 5. Strongly agree
17. The G.R.E.A.T. officer attended class on scheduled days or made other arrangements.
1. Strongly disagree 2. Disagree 3. Neither agree nor disagree 4. Agree 5. Strongly agree
18. The G.R.E.A.T. officer incorporated me into the teaching of the program.
1. Strongly disagree 2. Disagree 3. Neither agree nor disagree 4. Agree 5. Strongly agree
19. Students seemed to enjoy their interactions with the G.R.E.A.T. officer.
1. Strongly disagree 2. Disagree 3. Neither agree nor disagree 4. Agree 5. Strongly agree
20. The G.R.E.A.T. officer often strayed from the lesson plan.
1. Strongly disagree 2. Disagree 3. Neither agree nor disagree 4. Agree 5. Strongly agree
21. The G.R.E.A.T. officer had difficulty controlling the class.
1. Strongly disagree 2. Disagree 3. Neither agree nor disagree 4. Agree 5. Strongly agree
22. Students were respectful of the G.R.E.A.T. officer.
1. Strongly disagree 2. Disagree 3. Neither agree nor disagree 4. Agree 5. Strongly agree
446
This document is a research report submitted to the U.S. Department of Justice. This report has not been published by the Department. Opinions or points of view expressed are those of the author(s)
and do not necessarily reflect the official position or policies of the U.S. Department of Justice.
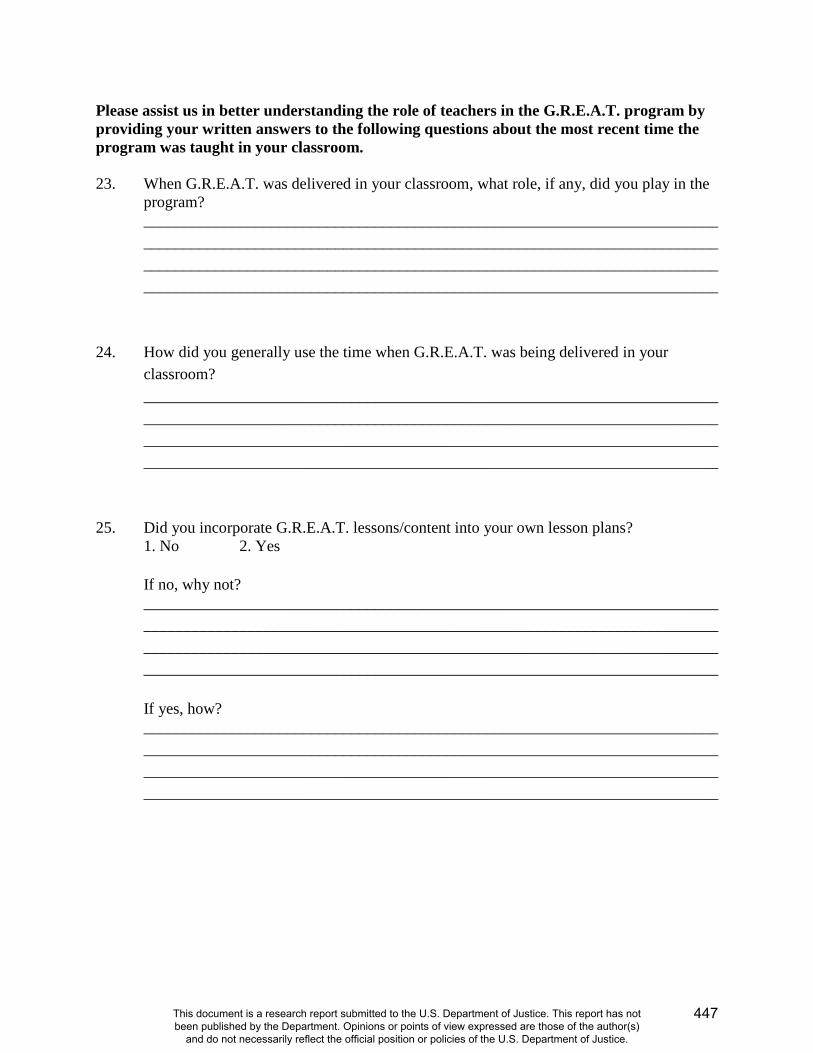
Please assist us in better understanding the role of teachers in the G.R.E.A.T. program by providing your written answers to the following questions about the most recent time the program was taught in your classroom. 23. When G.R.E.A.T. was delivered in your classroom, what role, if any, did you play in the
program? ________________________________________________________________________________________________________________________________________________________________________________________________________________________________________________________________________________________________
24. How did you generally use the time when G.R.E.A.T. was being delivered in your classroom? ________________________________________________________________________________________________________________________________________________________________________________________________________________________________________________________________________________________________
25. Did you incorporate G.R.E.A.T. lessons/content into your own lesson plans? 1. No 2. Yes
If no, why not?
________________________________________________________________________________________________________________________________________________________________________________________________________________________________________________________________________________________________
If yes, how?
________________________________________________________________________________________________________________________________________________________________________________________________________________________________________________________________________________________________
447
This document is a research report submitted to the U.S. Department of Justice. This report has not been published by the Department. Opinions or points of view expressed are those of the author(s)
and do not necessarily reflect the official position or policies of the U.S. Department of Justice.
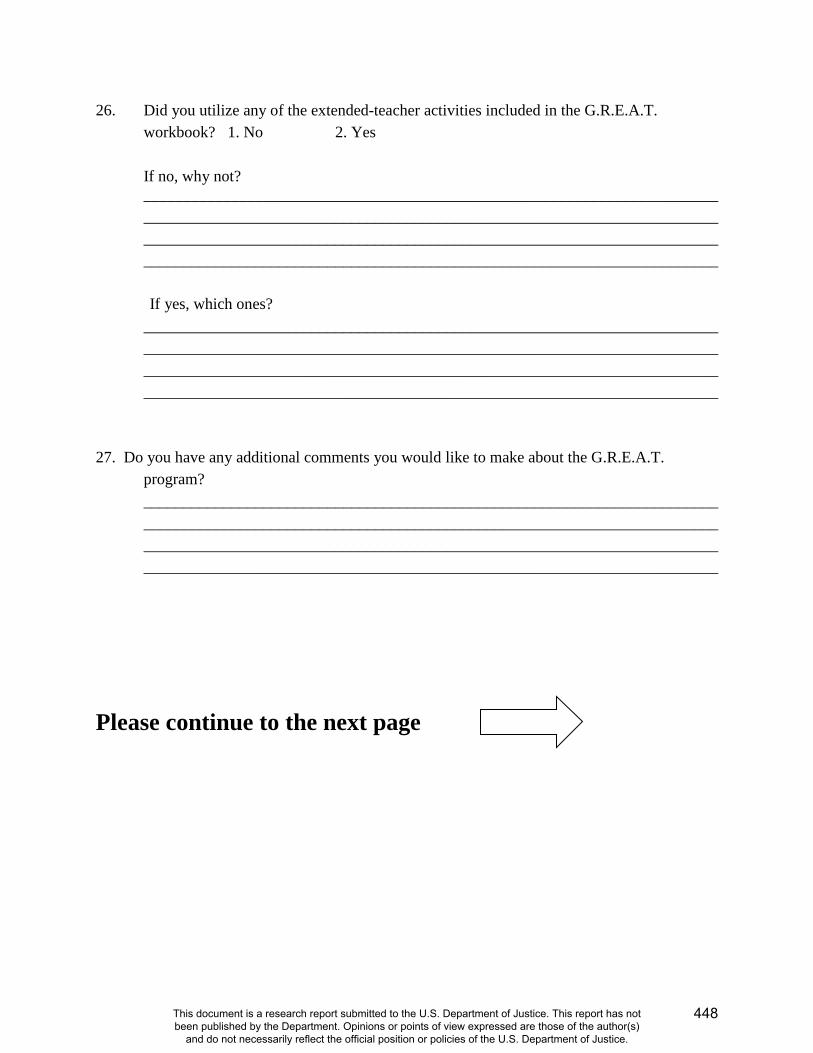
26. Did you utilize any of the extended-teacher activities included in the G.R.E.A.T. workbook? 1. No 2. Yes If no, why not?
________________________________________________________________________________________________________________________________________________________________________________________________________________________________________________________________________________________________ If yes, which ones?
________________________________________________________________________________________________________________________________________________________________________________________________________________________________________________________________________________________________
27. Do you have any additional comments you would like to make about the G.R.E.A.T.
program? ________________________________________________________________________________________________________________________________________________________________________________________________________________________________________________________________________________________________
Please continue to the next page
448
This document is a research report submitted to the U.S. Department of Justice. This report has not been published by the Department. Opinions or points of view expressed are those of the author(s)
and do not necessarily reflect the official position or policies of the U.S. Department of Justice.
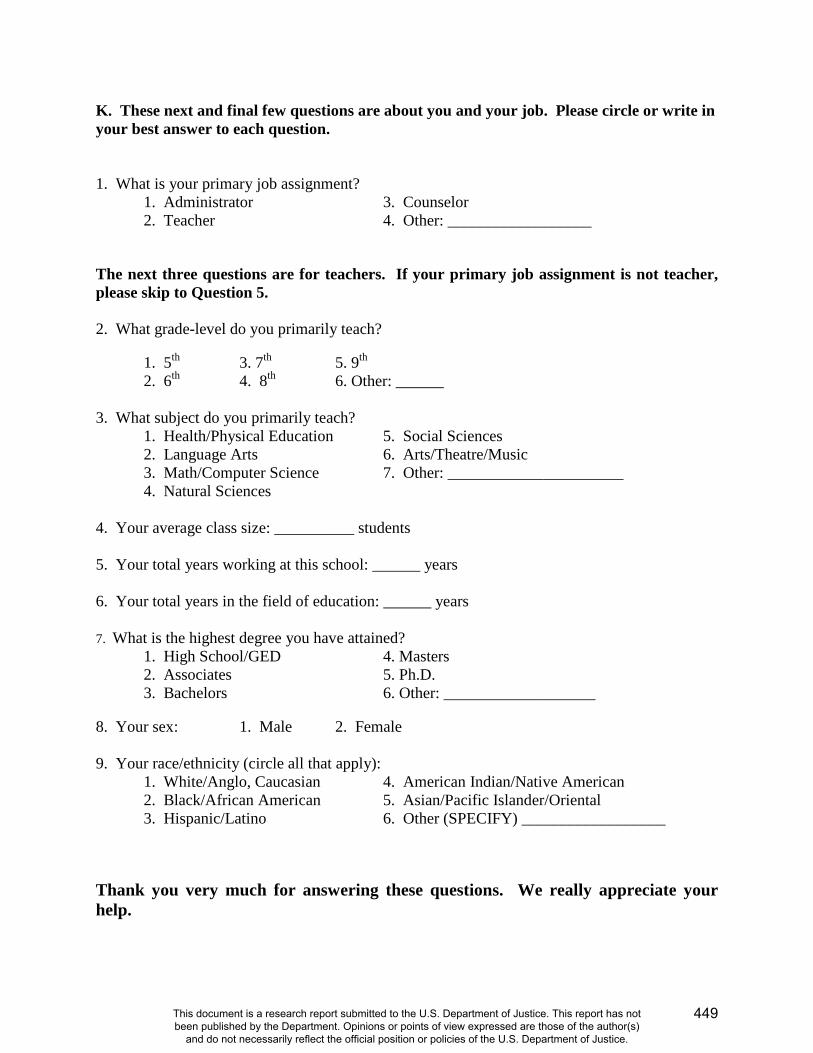
K. These next and final few questions are about you and your job. Please circle or write in your best answer to each question. 1. What is your primary job assignment? 1. Administrator 3. Counselor 2. Teacher 4. Other: __________________ The next three questions are for teachers. If your primary job assignment is not teacher, please skip to Question 5. 2. What grade-level do you primarily teach?
1. 5th 3. 7th 5. 9th 2. 6th 4. 8th 6. Other: ______
3. What subject do you primarily teach? 1. Health/Physical Education 5. Social Sciences
2. Language Arts 6. Arts/Theatre/Music 3. Math/Computer Science 7. Other: ______________________ 4. Natural Sciences
4. Your average class size: __________ students 5. Your total years working at this school: ______ years 6. Your total years in the field of education: ______ years 7. What is the highest degree you have attained?
1. High School/GED 4. Masters 2. Associates 5. Ph.D. 3. Bachelors 6. Other: ___________________
8. Your sex: 1. Male 2. Female 9. Your race/ethnicity (circle all that apply):
1. White/Anglo, Caucasian 4. American Indian/Native American 2. Black/African American 5. Asian/Pacific Islander/Oriental 3. Hispanic/Latino 6. Other (SPECIFY) __________________
Thank you very much for answering these questions. We really appreciate your help.
449
This document is a research report submitted to the U.S. Department of Justice. This report has not been published by the Department. Opinions or points of view expressed are those of the author(s)
and do not necessarily reflect the official position or policies of the U.S. Department of Justice.
NATIONAL EVALUATION OF G.R.E.A.T.
LAW ENFORCEMENT SURVEY
2007
University of Missouri-St. Louis Department of Criminology and Criminal Justice
450
This document is a research report submitted to the U.S. Department of Justice. This report has not been published by the Department. Opinions or points of view expressed are those of the author(s)
and do not necessarily reflect the official position or policies of the U.S. Department of Justice.
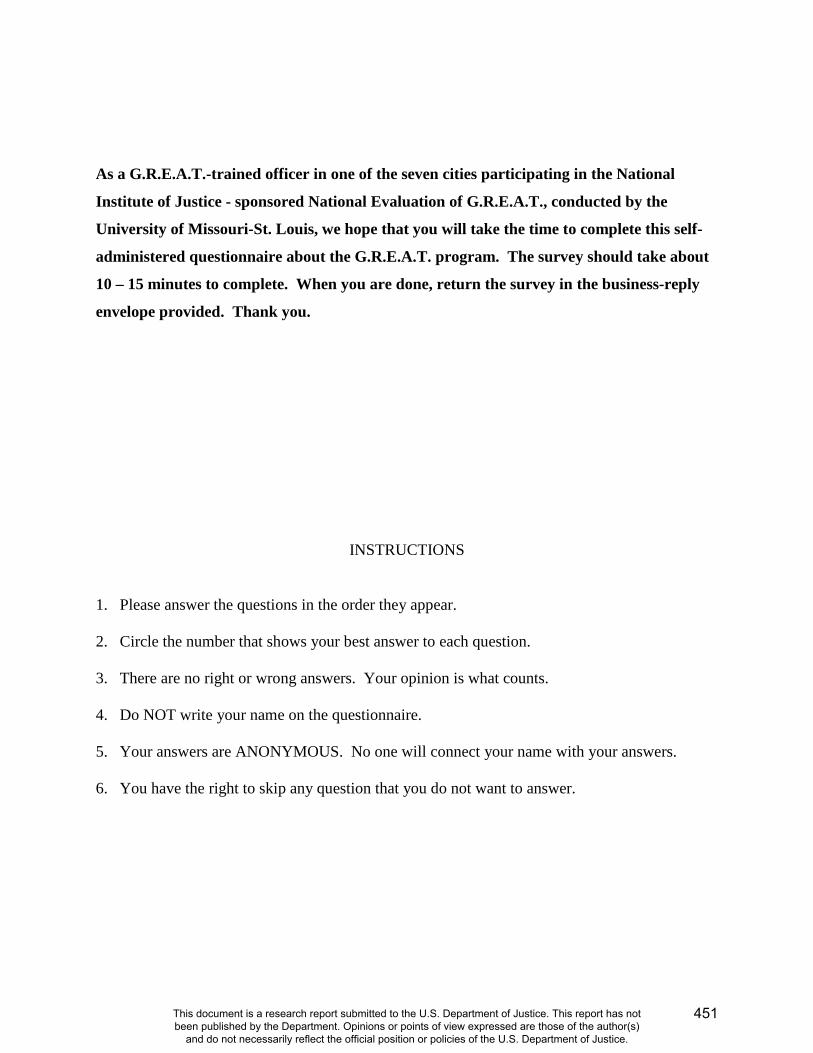
As a G.R.E.A.T.-trained officer in one of the seven cities participating in the National
Institute of Justice - sponsored National Evaluation of G.R.E.A.T., conducted by the
University of Missouri-St. Louis, we hope that you will take the time to complete this self-
administered questionnaire about the G.R.E.A.T. program. The survey should take about
10 – 15 minutes to complete. When you are done, return the survey in the business-reply
envelope provided. Thank you.
INSTRUCTIONS
1. Please answer the questions in the order they appear. 2. Circle the number that shows your best answer to each question.
3. There are no right or wrong answers. Your opinion is what counts.
4. Do NOT write your name on the questionnaire.
5. Your answers are ANONYMOUS. No one will connect your name with your answers.
6. You have the right to skip any question that you do not want to answer.
451
This document is a research report submitted to the U.S. Department of Justice. This report has not been published by the Department. Opinions or points of view expressed are those of the author(s)
and do not necessarily reflect the official position or policies of the U.S. Department of Justice.
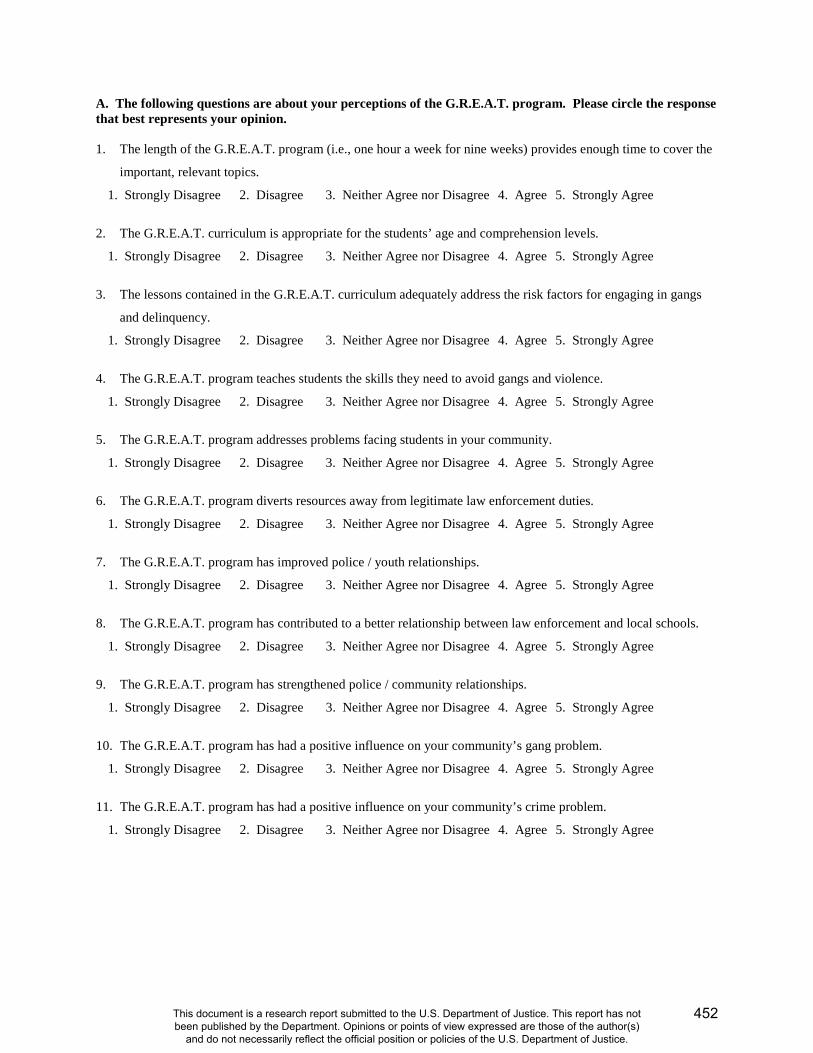
A. The following questions are about your perceptions of the G.R.E.A.T. program. Please circle the response that best represents your opinion. 1. The length of the G.R.E.A.T. program (i.e., one hour a week for nine weeks) provides enough time to cover the
important, relevant topics.
1. Strongly Disagree 2. Disagree 3. Neither Agree nor Disagree 4. Agree 5. Strongly Agree
2. The G.R.E.A.T. curriculum is appropriate for the students’ age and comprehension levels.
1. Strongly Disagree 2. Disagree 3. Neither Agree nor Disagree 4. Agree 5. Strongly Agree
3. The lessons contained in the G.R.E.A.T. curriculum adequately address the risk factors for engaging in gangs
and delinquency.
1. Strongly Disagree 2. Disagree 3. Neither Agree nor Disagree 4. Agree 5. Strongly Agree
4. The G.R.E.A.T. program teaches students the skills they need to avoid gangs and violence.
1. Strongly Disagree 2. Disagree 3. Neither Agree nor Disagree 4. Agree 5. Strongly Agree
5. The G.R.E.A.T. program addresses problems facing students in your community.
1. Strongly Disagree 2. Disagree 3. Neither Agree nor Disagree 4. Agree 5. Strongly Agree
6. The G.R.E.A.T. program diverts resources away from legitimate law enforcement duties.
1. Strongly Disagree 2. Disagree 3. Neither Agree nor Disagree 4. Agree 5. Strongly Agree
7. The G.R.E.A.T. program has improved police / youth relationships.
1. Strongly Disagree 2. Disagree 3. Neither Agree nor Disagree 4. Agree 5. Strongly Agree
8. The G.R.E.A.T. program has contributed to a better relationship between law enforcement and local schools.
1. Strongly Disagree 2. Disagree 3. Neither Agree nor Disagree 4. Agree 5. Strongly Agree
9. The G.R.E.A.T. program has strengthened police / community relationships.
1. Strongly Disagree 2. Disagree 3. Neither Agree nor Disagree 4. Agree 5. Strongly Agree
10. The G.R.E.A.T. program has had a positive influence on your community’s gang problem.
1. Strongly Disagree 2. Disagree 3. Neither Agree nor Disagree 4. Agree 5. Strongly Agree
11. The G.R.E.A.T. program has had a positive influence on your community’s crime problem.
1. Strongly Disagree 2. Disagree 3. Neither Agree nor Disagree 4. Agree 5. Strongly Agree
452
This document is a research report submitted to the U.S. Department of Justice. This report has not been published by the Department. Opinions or points of view expressed are those of the author(s)
and do not necessarily reflect the official position or policies of the U.S. Department of Justice.
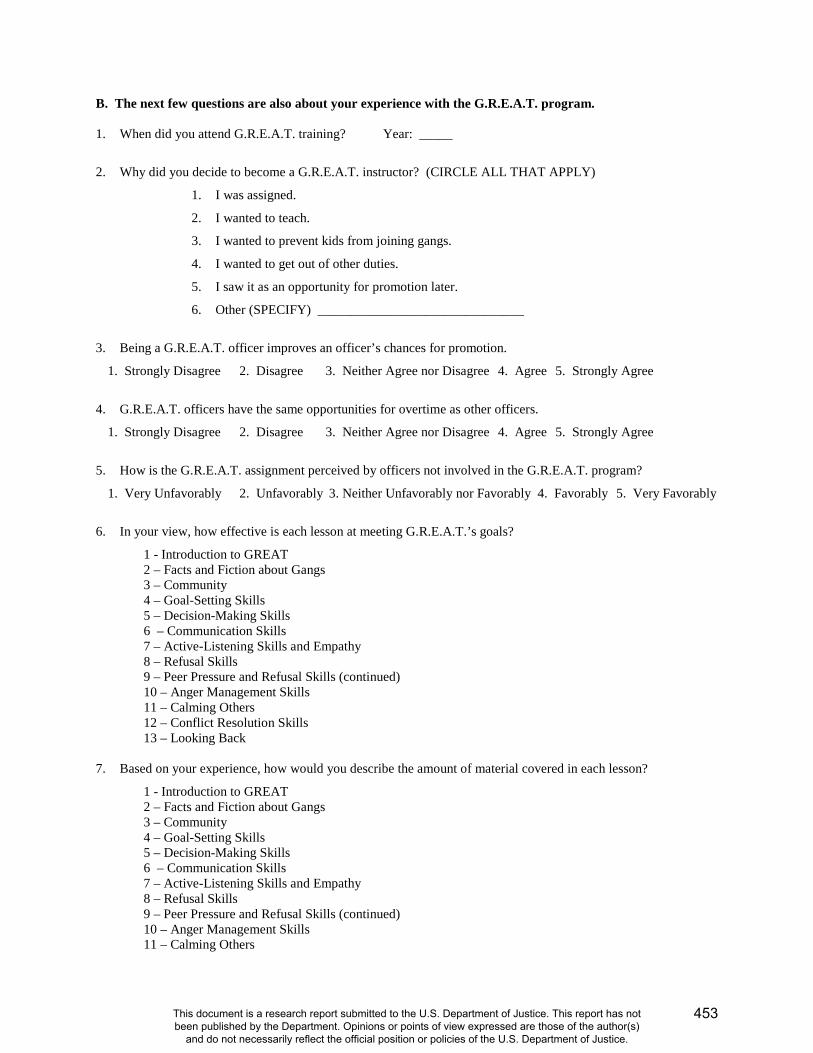
B. The next few questions are also about your experience with the G.R.E.A.T. program. 1. When did you attend G.R.E.A.T. training? Year: _____
2. Why did you decide to become a G.R.E.A.T. instructor? (CIRCLE ALL THAT APPLY)
1. I was assigned.
2. I wanted to teach.
3. I wanted to prevent kids from joining gangs.
4. I wanted to get out of other duties.
5. I saw it as an opportunity for promotion later.
6. Other (SPECIFY) _______________________________
3. Being a G.R.E.A.T. officer improves an officer’s chances for promotion.
1. Strongly Disagree 2. Disagree 3. Neither Agree nor Disagree 4. Agree 5. Strongly Agree
4. G.R.E.A.T. officers have the same opportunities for overtime as other officers.
1. Strongly Disagree 2. Disagree 3. Neither Agree nor Disagree 4. Agree 5. Strongly Agree
5. How is the G.R.E.A.T. assignment perceived by officers not involved in the G.R.E.A.T. program?
1. Very Unfavorably 2. Unfavorably 3. Neither Unfavorably nor Favorably 4. Favorably 5. Very Favorably
6. In your view, how effective is each lesson at meeting G.R.E.A.T.’s goals?
1 - Introduction to GREAT 2 – Facts and Fiction about Gangs 3 – Community 4 – Goal-Setting Skills 5 – Decision-Making Skills 6 – Communication Skills 7 – Active-Listening Skills and Empathy 8 – Refusal Skills 9 – Peer Pressure and Refusal Skills (continued) 10 – Anger Management Skills 11 – Calming Others 12 – Conflict Resolution Skills 13 – Looking Back
7. Based on your experience, how would you describe the amount of material covered in each lesson?
1 - Introduction to GREAT 2 – Facts and Fiction about Gangs 3 – Community 4 – Goal-Setting Skills 5 – Decision-Making Skills 6 – Communication Skills 7 – Active-Listening Skills and Empathy 8 – Refusal Skills 9 – Peer Pressure and Refusal Skills (continued) 10 – Anger Management Skills 11 – Calming Others
453
This document is a research report submitted to the U.S. Department of Justice. This report has not been published by the Department. Opinions or points of view expressed are those of the author(s)
and do not necessarily reflect the official position or policies of the U.S. Department of Justice.
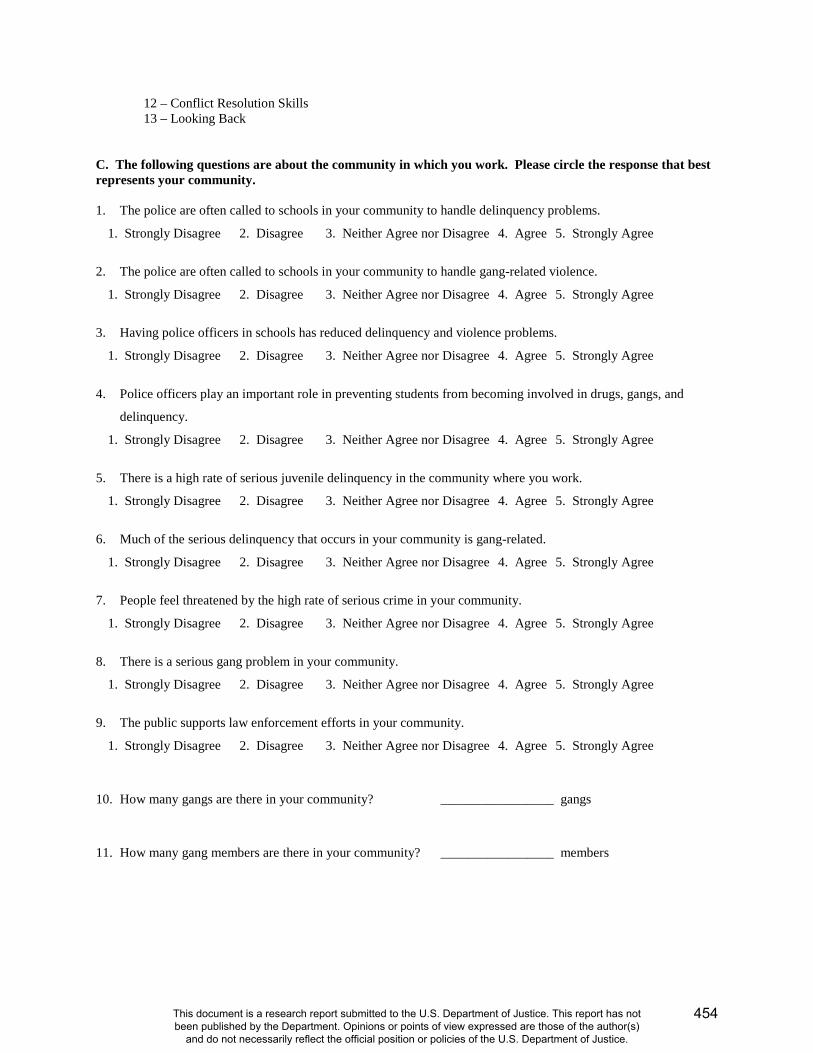
12 – Conflict Resolution Skills 13 – Looking Back
C. The following questions are about the community in which you work. Please circle the response that best represents your community. 1. The police are often called to schools in your community to handle delinquency problems.
1. Strongly Disagree 2. Disagree 3. Neither Agree nor Disagree 4. Agree 5. Strongly Agree
2. The police are often called to schools in your community to handle gang-related violence.
1. Strongly Disagree 2. Disagree 3. Neither Agree nor Disagree 4. Agree 5. Strongly Agree
3. Having police officers in schools has reduced delinquency and violence problems.
1. Strongly Disagree 2. Disagree 3. Neither Agree nor Disagree 4. Agree 5. Strongly Agree
4. Police officers play an important role in preventing students from becoming involved in drugs, gangs, and
delinquency.
1. Strongly Disagree 2. Disagree 3. Neither Agree nor Disagree 4. Agree 5. Strongly Agree
5. There is a high rate of serious juvenile delinquency in the community where you work.
1. Strongly Disagree 2. Disagree 3. Neither Agree nor Disagree 4. Agree 5. Strongly Agree
6. Much of the serious delinquency that occurs in your community is gang-related.
1. Strongly Disagree 2. Disagree 3. Neither Agree nor Disagree 4. Agree 5. Strongly Agree
7. People feel threatened by the high rate of serious crime in your community.
1. Strongly Disagree 2. Disagree 3. Neither Agree nor Disagree 4. Agree 5. Strongly Agree
8. There is a serious gang problem in your community.
1. Strongly Disagree 2. Disagree 3. Neither Agree nor Disagree 4. Agree 5. Strongly Agree
9. The public supports law enforcement efforts in your community.
1. Strongly Disagree 2. Disagree 3. Neither Agree nor Disagree 4. Agree 5. Strongly Agree
10. How many gangs are there in your community? _________________ gangs
11. How many gang members are there in your community? _________________ members
454
This document is a research report submitted to the U.S. Department of Justice. This report has not been published by the Department. Opinions or points of view expressed are those of the author(s)
and do not necessarily reflect the official position or policies of the U.S. Department of Justice.
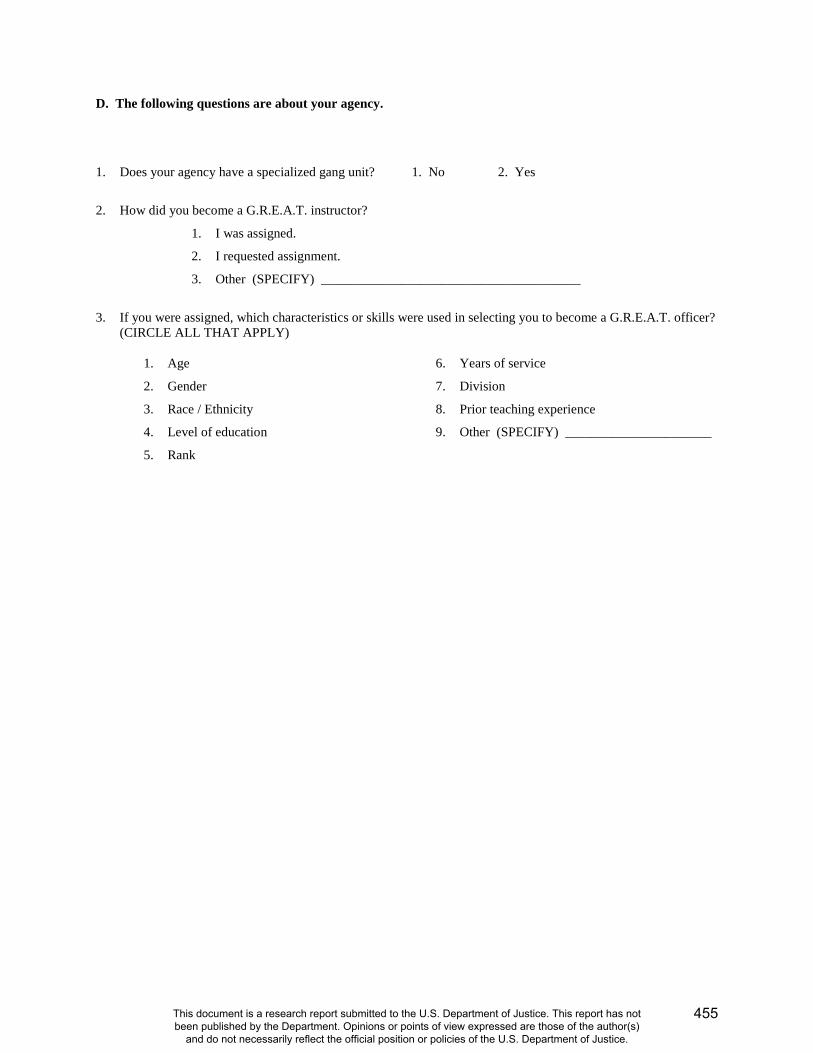
D. The following questions are about your agency.
1. Does your agency have a specialized gang unit? 1. No 2. Yes
2. How did you become a G.R.E.A.T. instructor?
1. I was assigned.
2. I requested assignment.
3. Other (SPECIFY) _______________________________________
3. If you were assigned, which characteristics or skills were used in selecting you to become a G.R.E.A.T. officer?
(CIRCLE ALL THAT APPLY)
1. Age
2. Gender
3. Race / Ethnicity
4. Level of education
5. Rank
6. Years of service
7. Division
8. Prior teaching experience
9. Other (SPECIFY) ______________________
455
This document is a research report submitted to the U.S. Department of Justice. This report has not been published by the Department. Opinions or points of view expressed are those of the author(s)
and do not necessarily reflect the official position or policies of the U.S. Department of Justice.
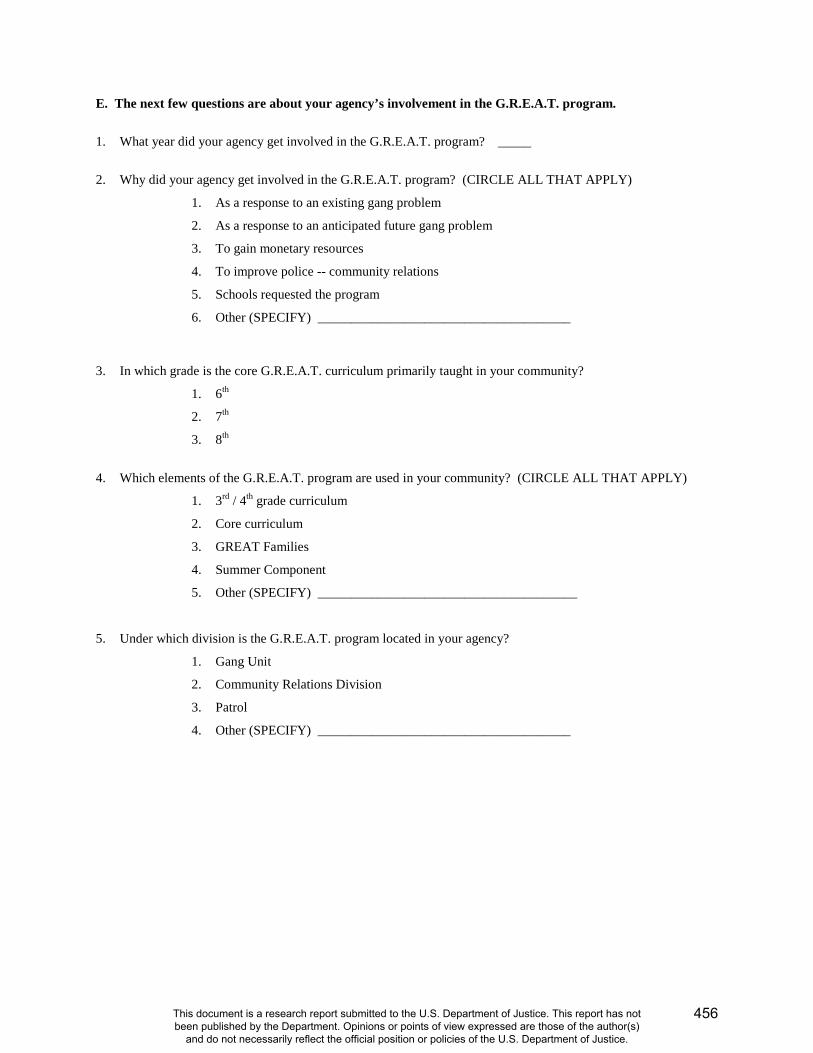
E. The next few questions are about your agency’s involvement in the G.R.E.A.T. program.
1. What year did your agency get involved in the G.R.E.A.T. program? _____
2. Why did your agency get involved in the G.R.E.A.T. program? (CIRCLE ALL THAT APPLY)
1. As a response to an existing gang problem
2. As a response to an anticipated future gang problem
3. To gain monetary resources
4. To improve police -- community relations
5. Schools requested the program
6. Other (SPECIFY) ______________________________________
3. In which grade is the core G.R.E.A.T. curriculum primarily taught in your community?
1. 6th
2. 7th
3. 8th
4. Which elements of the G.R.E.A.T. program are used in your community? (CIRCLE ALL THAT APPLY)
1. 3rd / 4th grade curriculum
2. Core curriculum
3. GREAT Families
4. Summer Component
5. Other (SPECIFY) _______________________________________
5. Under which division is the G.R.E.A.T. program located in your agency?
1. Gang Unit
2. Community Relations Division
3. Patrol
4. Other (SPECIFY) ______________________________________
456
This document is a research report submitted to the U.S. Department of Justice. This report has not been published by the Department. Opinions or points of view expressed are those of the author(s)
and do not necessarily reflect the official position or policies of the U.S. Department of Justice.
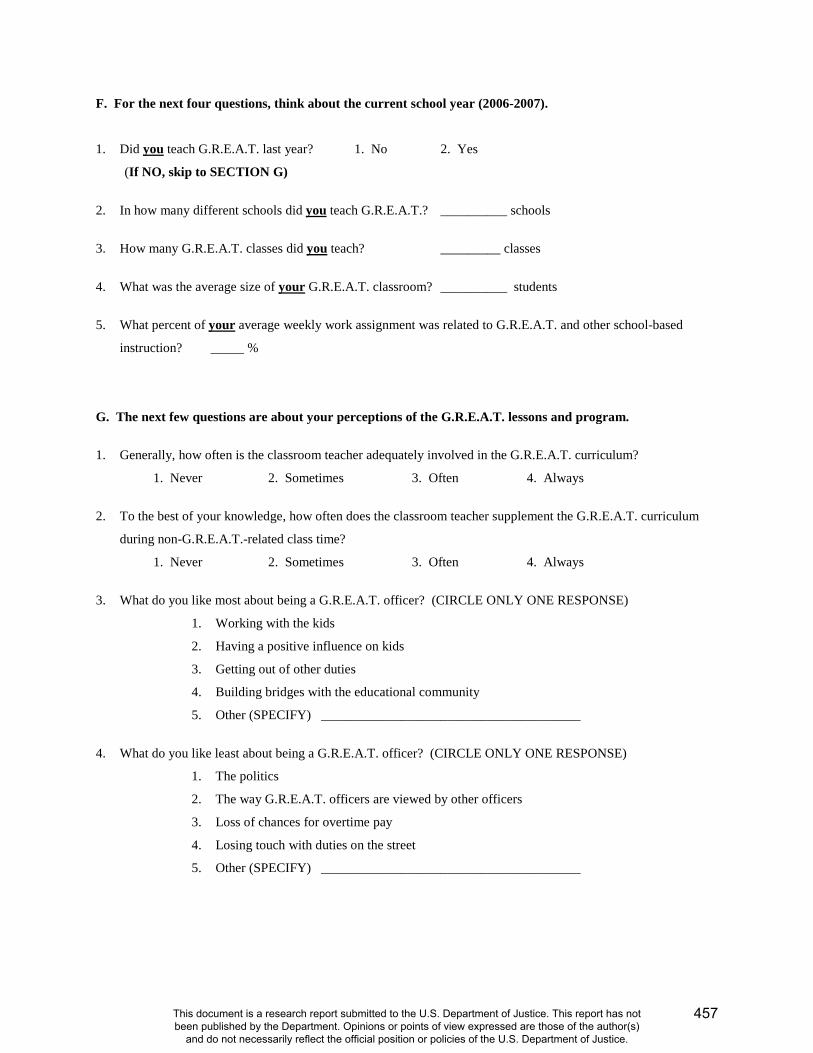
F. For the next four questions, think about the current school year (2006-2007).
1. Did you teach G.R.E.A.T. last year? 1. No 2. Yes
(If NO, skip to SECTION G)
2. In how many different schools did you teach G.R.E.A.T.? __________ schools
3. How many G.R.E.A.T. classes did you teach? _________ classes
4. What was the average size of your G.R.E.A.T. classroom? __________ students
5. What percent of your average weekly work assignment was related to G.R.E.A.T. and other school-based
instruction? _____ %
G. The next few questions are about your perceptions of the G.R.E.A.T. lessons and program.
1. Generally, how often is the classroom teacher adequately involved in the G.R.E.A.T. curriculum?
1. Never 2. Sometimes 3. Often 4. Always
2. To the best of your knowledge, how often does the classroom teacher supplement the G.R.E.A.T. curriculum
during non-G.R.E.A.T.-related class time?
1. Never 2. Sometimes 3. Often 4. Always
3. What do you like most about being a G.R.E.A.T. officer? (CIRCLE ONLY ONE RESPONSE)
1. Working with the kids
2. Having a positive influence on kids
3. Getting out of other duties
4. Building bridges with the educational community
5. Other (SPECIFY) _______________________________________
4. What do you like least about being a G.R.E.A.T. officer? (CIRCLE ONLY ONE RESPONSE)
1. The politics
2. The way G.R.E.A.T. officers are viewed by other officers
3. Loss of chances for overtime pay
4. Losing touch with duties on the street
5. Other (SPECIFY) _______________________________________
457
This document is a research report submitted to the U.S. Department of Justice. This report has not been published by the Department. Opinions or points of view expressed are those of the author(s)
and do not necessarily reflect the official position or policies of the U.S. Department of Justice.
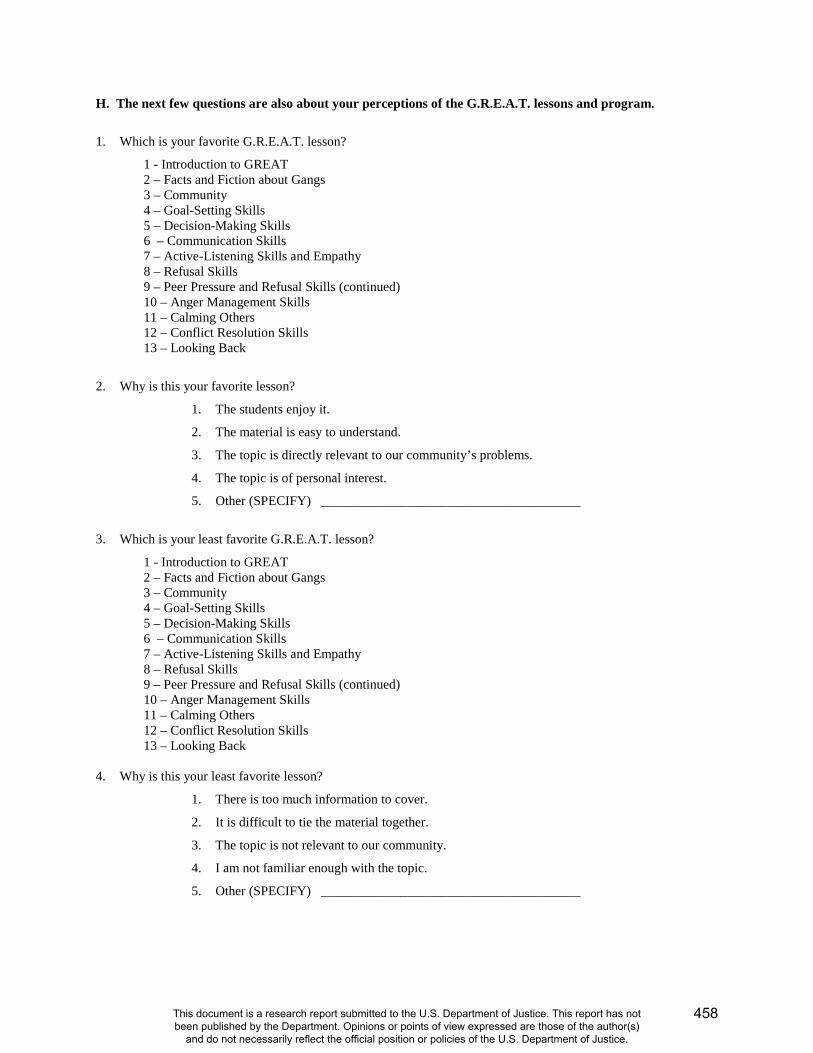
H. The next few questions are also about your perceptions of the G.R.E.A.T. lessons and program.
1. Which is your favorite G.R.E.A.T. lesson?
1 - Introduction to GREAT 2 – Facts and Fiction about Gangs 3 – Community 4 – Goal-Setting Skills 5 – Decision-Making Skills 6 – Communication Skills 7 – Active-Listening Skills and Empathy 8 – Refusal Skills 9 – Peer Pressure and Refusal Skills (continued) 10 – Anger Management Skills 11 – Calming Others 12 – Conflict Resolution Skills 13 – Looking Back
2. Why is this your favorite lesson?
1. The students enjoy it.
2. The material is easy to understand.
3. The topic is directly relevant to our community’s problems.
4. The topic is of personal interest.
5. Other (SPECIFY) _______________________________________
3. Which is your least favorite G.R.E.A.T. lesson?
1 - Introduction to GREAT 2 – Facts and Fiction about Gangs 3 – Community 4 – Goal-Setting Skills 5 – Decision-Making Skills 6 – Communication Skills 7 – Active-Listening Skills and Empathy 8 – Refusal Skills 9 – Peer Pressure and Refusal Skills (continued) 10 – Anger Management Skills 11 – Calming Others 12 – Conflict Resolution Skills 13 – Looking Back
4. Why is this your least favorite lesson?
1. There is too much information to cover.
2. It is difficult to tie the material together.
3. The topic is not relevant to our community.
4. I am not familiar enough with the topic.
5. Other (SPECIFY) _______________________________________
458
This document is a research report submitted to the U.S. Department of Justice. This report has not been published by the Department. Opinions or points of view expressed are those of the author(s)
and do not necessarily reflect the official position or policies of the U.S. Department of Justice.
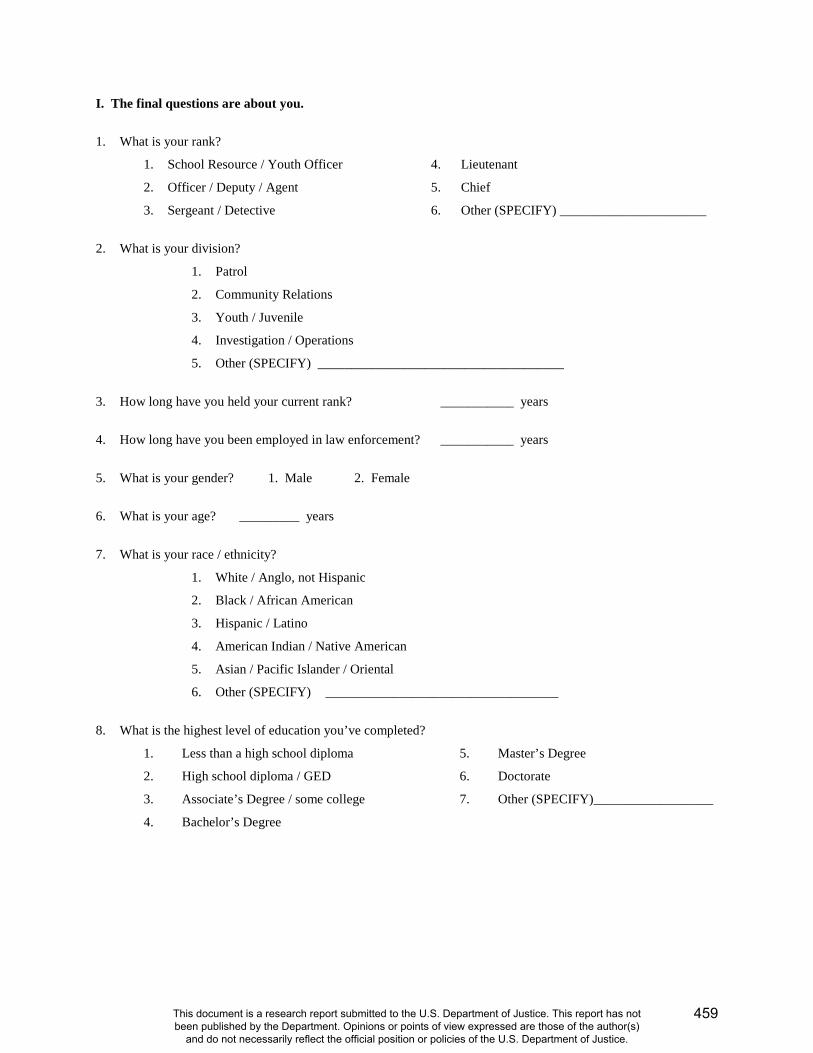
I. The final questions are about you.
1. What is your rank?
1. School Resource / Youth Officer
2. Officer / Deputy / Agent
3. Sergeant / Detective
4. Lieutenant
5. Chief
6. Other (SPECIFY) ______________________
2. What is your division?
1. Patrol
2. Community Relations
3. Youth / Juvenile
4. Investigation / Operations
5. Other (SPECIFY) _____________________________________
3. How long have you held your current rank? ___________ years
4. How long have you been employed in law enforcement? ___________ years
5. What is your gender? 1. Male 2. Female
6. What is your age? _________ years
7. What is your race / ethnicity?
1. White / Anglo, not Hispanic
2. Black / African American
3. Hispanic / Latino
4. American Indian / Native American
5. Asian / Pacific Islander / Oriental
6. Other (SPECIFY) ___________________________________
8. What is the highest level of education you’ve completed?
1. Less than a high school diploma
2. High school diploma / GED
3. Associate’s Degree / some college
4. Bachelor’s Degree
5. Master’s Degree
6. Doctorate
7. Other (SPECIFY)__________________
459
This document is a research report submitted to the U.S. Department of Justice. This report has not been published by the Department. Opinions or points of view expressed are those of the author(s)
and do not necessarily reflect the official position or policies of the U.S. Department of Justice.

NATIONAL EVALUATION OF G.R.E.A.T.
STUDENT QUESTIONNAIRE
Pre – Test
School Year 2006 - 2007
University of Missouri-St. Louis Department of Criminology and Criminal Justice
8001 Natural Bridge Road St. Louis, MO 63121
460
This document is a research report submitted to the U.S. Department of Justice. This report has not been published by the Department. Opinions or points of view expressed are those of the author(s)
and do not necessarily reflect the official position or policies of the U.S. Department of Justice.

INSTRUCTIONS 1. Please answer the questions in the order they appear. 2. Circle the number that shows your best answer to each question. 3. There are no right or wrong answers. Your opinion is what counts. 4. Do NOT write your name on the questionnaire. 5. Your answers are CONFIDENTIAL - - no one outside of our research office will ever
connect your name with the answers you give. 6. You have the right to skip any question that you do not want to answer. 7. You can stop filling out the questionnaire any time you wish. WE HOPE YOU ENJOY ANSWERING THESE QUESTIONS
461
This document is a research report submitted to the U.S. Department of Justice. This report has not been published by the Department. Opinions or points of view expressed are those of the author(s)
and do not necessarily reflect the official position or policies of the U.S. Department of Justice.
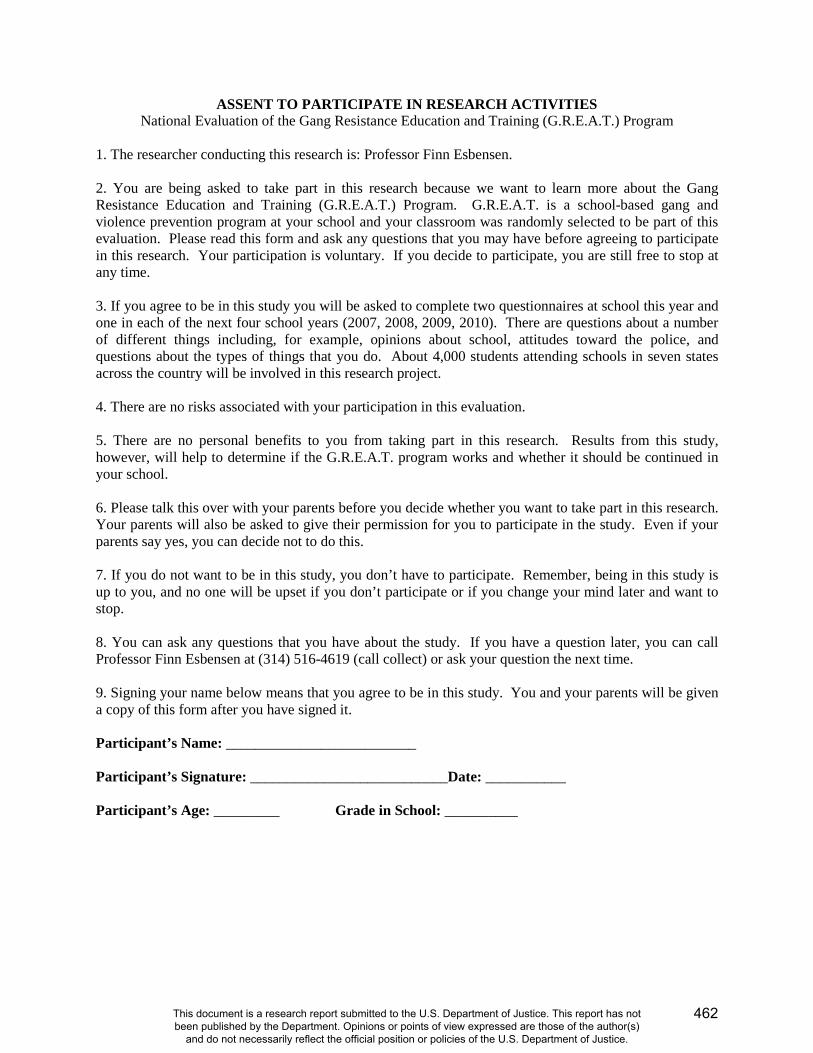
ASSENT TO PARTICIPATE IN RESEARCH ACTIVITIES National Evaluation of the Gang Resistance Education and Training (G.R.E.A.T.) Program
1. The researcher conducting this research is: Professor Finn Esbensen. 2. You are being asked to take part in this research because we want to learn more about the Gang Resistance Education and Training (G.R.E.A.T.) Program. G.R.E.A.T. is a school-based gang and violence prevention program at your school and your classroom was randomly selected to be part of this evaluation. Please read this form and ask any questions that you may have before agreeing to participate in this research. Your participation is voluntary. If you decide to participate, you are still free to stop at any time. 3. If you agree to be in this study you will be asked to complete two questionnaires at school this year and one in each of the next four school years (2007, 2008, 2009, 2010). There are questions about a number of different things including, for example, opinions about school, attitudes toward the police, and questions about the types of things that you do. About 4,000 students attending schools in seven states across the country will be involved in this research project. 4. There are no risks associated with your participation in this evaluation. 5. There are no personal benefits to you from taking part in this research. Results from this study, however, will help to determine if the G.R.E.A.T. program works and whether it should be continued in your school. 6. Please talk this over with your parents before you decide whether you want to take part in this research. Your parents will also be asked to give their permission for you to participate in the study. Even if your parents say yes, you can decide not to do this. 7. If you do not want to be in this study, you don’t have to participate. Remember, being in this study is up to you, and no one will be upset if you don’t participate or if you change your mind later and want to stop. 8. You can ask any questions that you have about the study. If you have a question later, you can call Professor Finn Esbensen at (314) 516-4619 (call collect) or ask your question the next time. 9. Signing your name below means that you agree to be in this study. You and your parents will be given a copy of this form after you have signed it. Participant’s Name: __________________________ Participant’s Signature: ___________________________Date: ___________ Participant’s Age: _________ Grade in School: __________
462
This document is a research report submitted to the U.S. Department of Justice. This report has not been published by the Department. Opinions or points of view expressed are those of the author(s)
and do not necessarily reflect the official position or policies of the U.S. Department of Justice.
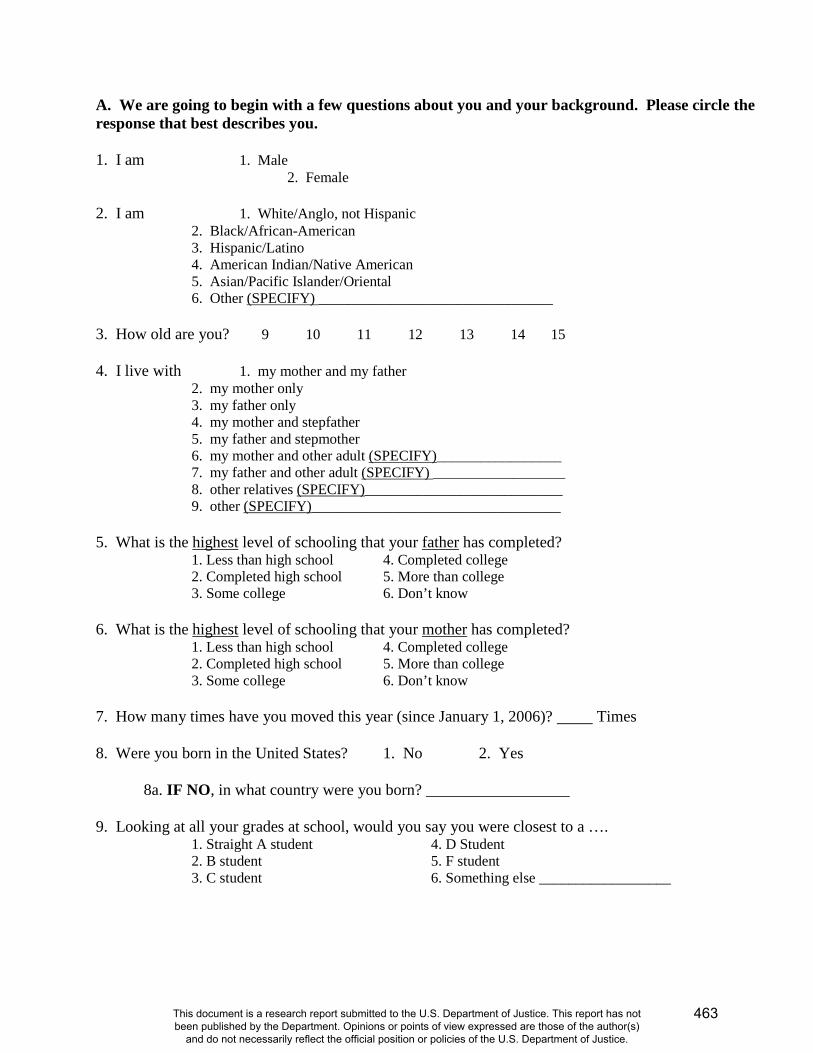
A. We are going to begin with a few questions about you and your background. Please circle the response that best describes you. 1. I am 1. Male 2. Female 2. I am 1. White/Anglo, not Hispanic
2. Black/African-American 3. Hispanic/Latino 4. American Indian/Native American 5. Asian/Pacific Islander/Oriental 6. Other (SPECIFY) ________________________________
3. How old are you? 9 10 11 12 13 14 15 4. I live with 1. my mother and my father
2. my mother only 3. my father only 4. my mother and stepfather 5. my father and stepmother 6. my mother and other adult (SPECIFY)_________________ 7. my father and other adult (SPECIFY) __________________ 8. other relatives (SPECIFY)___________________________ 9. other (SPECIFY)__________________________________
5. What is the highest level of schooling that your father has completed? 1. Less than high school 4. Completed college 2. Completed high school 5. More than college 3. Some college 6. Don’t know 6. What is the highest level of schooling that your mother has completed? 1. Less than high school 4. Completed college 2. Completed high school 5. More than college 3. Some college 6. Don’t know 7. How many times have you moved this year (since January 1, 2006)? Times 8. Were you born in the United States? 1. No 2. Yes
8a. IF NO, in what country were you born? __________________
9. Looking at all your grades at school, would you say you were closest to a …. 1. Straight A student 4. D Student 2. B student 5. F student 3. C student 6. Something else __________________
463
This document is a research report submitted to the U.S. Department of Justice. This report has not been published by the Department. Opinions or points of view expressed are those of the author(s)
and do not necessarily reflect the official position or policies of the U.S. Department of Justice.
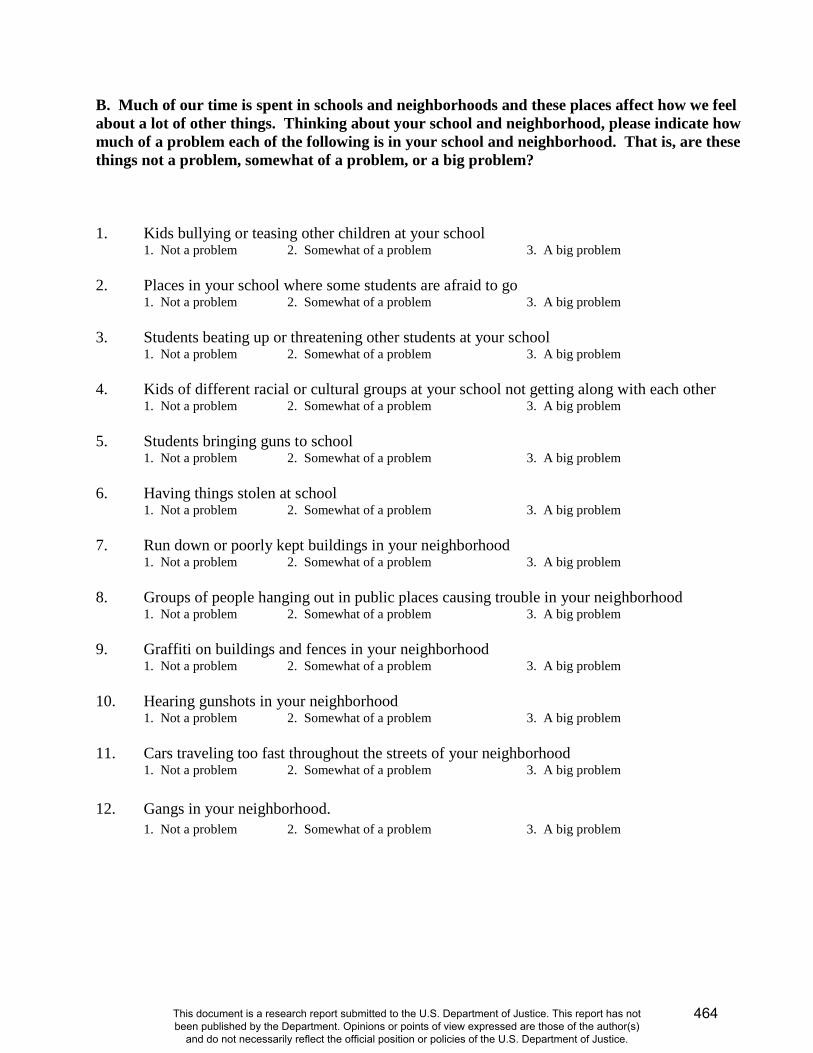
B. Much of our time is spent in schools and neighborhoods and these places affect how we feel about a lot of other things. Thinking about your school and neighborhood, please indicate how much of a problem each of the following is in your school and neighborhood. That is, are these things not a problem, somewhat of a problem, or a big problem? 1. Kids bullying or teasing other children at your school 1. Not a problem 2. Somewhat of a problem 3. A big problem 2. Places in your school where some students are afraid to go 1. Not a problem 2. Somewhat of a problem 3. A big problem 3. Students beating up or threatening other students at your school 1. Not a problem 2. Somewhat of a problem 3. A big problem 4. Kids of different racial or cultural groups at your school not getting along with each other 1. Not a problem 2. Somewhat of a problem 3. A big problem 5. Students bringing guns to school 1. Not a problem 2. Somewhat of a problem 3. A big problem 6. Having things stolen at school 1. Not a problem 2. Somewhat of a problem 3. A big problem 7. Run down or poorly kept buildings in your neighborhood 1. Not a problem 2. Somewhat of a problem 3. A big problem 8. Groups of people hanging out in public places causing trouble in your neighborhood 1. Not a problem 2. Somewhat of a problem 3. A big problem 9. Graffiti on buildings and fences in your neighborhood 1. Not a problem 2. Somewhat of a problem 3. A big problem 10. Hearing gunshots in your neighborhood 1. Not a problem 2. Somewhat of a problem 3. A big problem 11. Cars traveling too fast throughout the streets of your neighborhood 1. Not a problem 2. Somewhat of a problem 3. A big problem 12. Gangs in your neighborhood. 1. Not a problem 2. Somewhat of a problem 3. A big problem
464
This document is a research report submitted to the U.S. Department of Justice. This report has not been published by the Department. Opinions or points of view expressed are those of the author(s)
and do not necessarily reflect the official position or policies of the U.S. Department of Justice.

C. For the next set of statements, indicate how much you think these statements describe you. That is, how much do you agree or disagree with each statement? There are no right or wrong answers; it is your opinion that counts. 1. When I go someplace, I leave a note for my parents or call them to tell them where I am.
1. Strongly Disagree 2. Disagree 3. Neither Agree nor Disagree 4. Agree 5. Strongly Agree 2. My parents know where I am when I am not at home or at school.
1. Strongly Disagree 2. Disagree 3. Neither Agree nor Disagree 4. Agree 5. Strongly Agree 3. I know how to get in touch with my parents if they are not at home.
1. Strongly Disagree 2. Disagree 3. Neither Agree nor Disagree 4. Agree 5. Strongly Agree 4. My parents know who I am with if I am not at home.
1. Strongly Disagree 2. Disagree 3. Neither Agree nor Disagree 4. Agree 5. Strongly Agree 5. I often act without stopping to think.
1. Strongly Disagree 2. Disagree 3. Neither Agree nor Disagree 4. Agree 5. Strongly Agree 6. I don't devote much thought and effort to preparing for the future.
1. Strongly Disagree 2. Disagree 3. Neither Agree nor Disagree 4. Agree 5. Strongly Agree 7. I often do whatever brings me pleasure here and now, even at the cost of some distant goal.
1. Strongly Disagree 2. Disagree 3. Neither Agree nor Disagree 4. Agree 5. Strongly Agree 8. I'm more concerned with what happens to me in the short run than in the long run.
1. Strongly Disagree 2. Disagree 3. Neither Agree nor Disagree 4. Agree 5. Strongly Agree 9. I like to test myself every now and then by doing something a little risky.
1. Strongly Disagree 2. Disagree 3. Neither Agree nor Disagree 4. Agree 5. Strongly Agree 10. Sometimes I will take a risk just for the fun of it.
1. Strongly Disagree 2. Disagree 3. Neither Agree nor Disagree 4. Agree 5. Strongly Agree 11. I sometimes find it exciting to do things for which I might get in trouble.
1. Strongly Disagree 2. Disagree 3. Neither Agree nor Disagree 4. Agree 5. Strongly Agree 12. Excitement and adventure are more important to me than security.
1. Strongly Disagree 2. Disagree 3. Neither Agree nor Disagree 4. Agree 5. Strongly Agree 13. I lose my temper pretty easily.
1. Strongly Disagree 2. Disagree 3. Neither Agree nor Disagree 4. Agree 5. Strongly Agree
465
This document is a research report submitted to the U.S. Department of Justice. This report has not been published by the Department. Opinions or points of view expressed are those of the author(s)
and do not necessarily reflect the official position or policies of the U.S. Department of Justice.
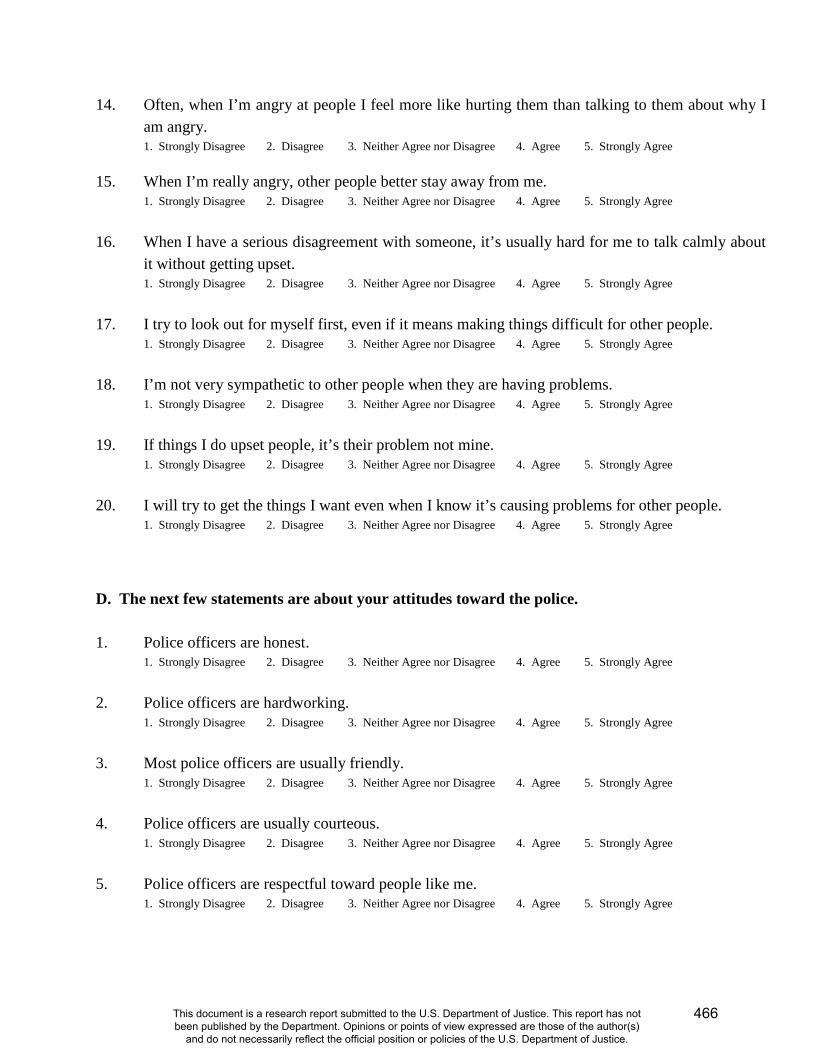
14. Often, when I’m angry at people I feel more like hurting them than talking to them about why I am angry. 1. Strongly Disagree 2. Disagree 3. Neither Agree nor Disagree 4. Agree 5. Strongly Agree
15. When I’m really angry, other people better stay away from me. 1. Strongly Disagree 2. Disagree 3. Neither Agree nor Disagree 4. Agree 5. Strongly Agree
16. When I have a serious disagreement with someone, it’s usually hard for me to talk calmly about
it without getting upset. 1. Strongly Disagree 2. Disagree 3. Neither Agree nor Disagree 4. Agree 5. Strongly Agree
17. I try to look out for myself first, even if it means making things difficult for other people.
1. Strongly Disagree 2. Disagree 3. Neither Agree nor Disagree 4. Agree 5. Strongly Agree 18. I’m not very sympathetic to other people when they are having problems.
1. Strongly Disagree 2. Disagree 3. Neither Agree nor Disagree 4. Agree 5. Strongly Agree 19. If things I do upset people, it’s their problem not mine.
1. Strongly Disagree 2. Disagree 3. Neither Agree nor Disagree 4. Agree 5. Strongly Agree 20. I will try to get the things I want even when I know it’s causing problems for other people.
1. Strongly Disagree 2. Disagree 3. Neither Agree nor Disagree 4. Agree 5. Strongly Agree D. The next few statements are about your attitudes toward the police. 1. Police officers are honest.
1. Strongly Disagree 2. Disagree 3. Neither Agree nor Disagree 4. Agree 5. Strongly Agree 2. Police officers are hardworking.
1. Strongly Disagree 2. Disagree 3. Neither Agree nor Disagree 4. Agree 5. Strongly Agree 3. Most police officers are usually friendly.
1. Strongly Disagree 2. Disagree 3. Neither Agree nor Disagree 4. Agree 5. Strongly Agree 4. Police officers are usually courteous.
1. Strongly Disagree 2. Disagree 3. Neither Agree nor Disagree 4. Agree 5. Strongly Agree 5. Police officers are respectful toward people like me.
1. Strongly Disagree 2. Disagree 3. Neither Agree nor Disagree 4. Agree 5. Strongly Agree
466
This document is a research report submitted to the U.S. Department of Justice. This report has not been published by the Department. Opinions or points of view expressed are those of the author(s)
and do not necessarily reflect the official position or policies of the U.S. Department of Justice.

6. I feel safer when police officers are in my school. 1. Strongly Disagree 2. Disagree 3. Neither Agree nor Disagree 4. Agree 5. Strongly Agree
7. Police officers make good teachers.
1. Strongly Disagree 2. Disagree 3. Neither Agree nor Disagree 4. Agree 5. Strongly Agree 8. Police officers don't know much about
gangs. 1. Strongly Disagree 2. Disagree 3. Neither Agree nor Disagree 4. Agree 5. Strongly Agree
E. For the next set of questions, think about your current group of friends. During the last year, how many of your current friends have done the following? 1. Gotten along well with teachers and adults at school?
1. None of them 2. Few of them 3. Half of them 4. Most of them 5. All of them 2. Have been thought of as good students?
1. None of them 2. Few of them 3. Half of them 4. Most of them 5. All of them 3. Have been generally honest and told the truth?
1. None of them 2. Few of them 3. Half of them 4. Most of them 5. All of them 4. Almost always obeyed school rules?
1. None of them 2. Few of them 3. Half of them 4. Most of them 5. All of them Still thinking about your current friends, how likely is it that you would go along with them if they wanted you to do the following things with them? 5. Bully another student at school?
1. Not at All Likely 2. A Little Likely 3. Somewhat Likely 4. Likely 5. Very Likely 6. Break into a home in your community?
1. Not at All Likely 2. A Little Likely 3. Somewhat Likely 4. Likely 5. Very Likely 7. Beat up a stranger on the street?
1. Not at All Likely 2. A Little Likely 3. Somewhat Likely 4. Likely 5. Very Likely 8. Cheat on a test at school?
1. Not at All Likely 2. A Little Likely 3. Somewhat Likely 4. Likely 5. Very Likely 9. Steal something from a store?
1. Not at All Likely 2. A Little Likely 3. Somewhat Likely 4. Likely 5. Very Likely
467
This document is a research report submitted to the U.S. Department of Justice. This report has not been published by the Department. Opinions or points of view expressed are those of the author(s)
and do not necessarily reflect the official position or policies of the U.S. Department of Justice.
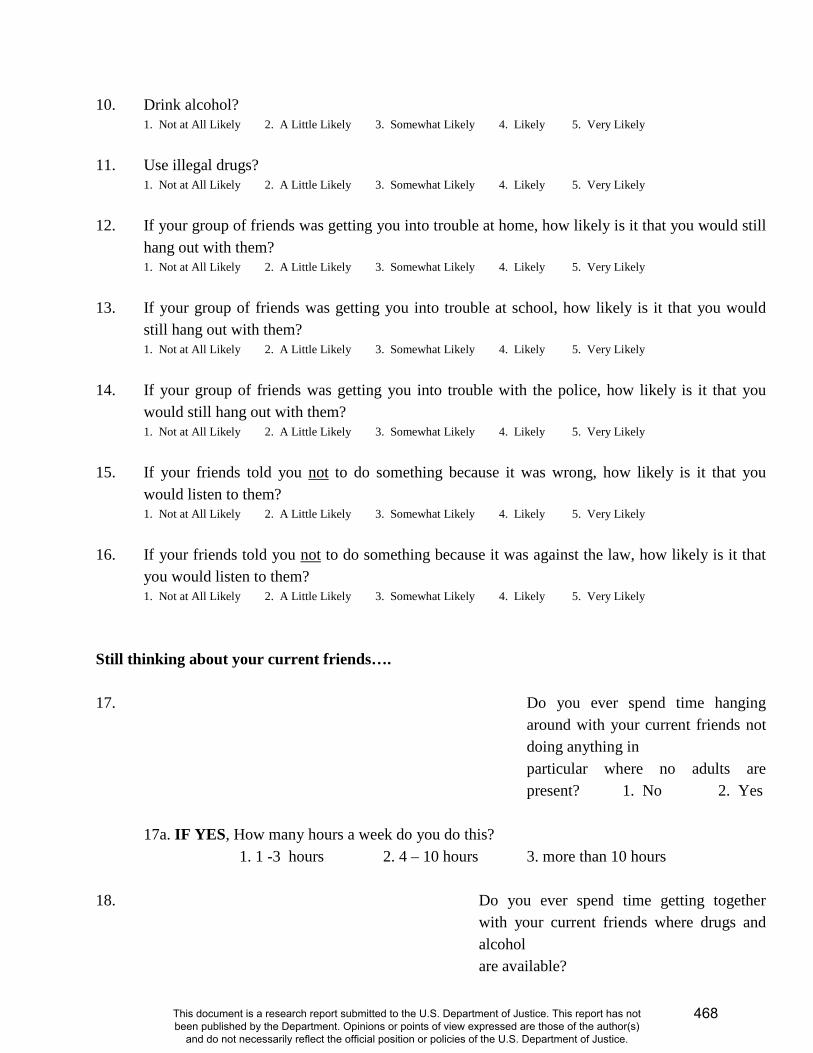
10. Drink alcohol? 1. Not at All Likely 2. A Little Likely 3. Somewhat Likely 4. Likely 5. Very Likely
11. Use illegal drugs?
1. Not at All Likely 2. A Little Likely 3. Somewhat Likely 4. Likely 5. Very Likely 12. If your group of friends was getting you into trouble at home, how likely is it that you would still
hang out with them? 1. Not at All Likely 2. A Little Likely 3. Somewhat Likely 4. Likely 5. Very Likely
13. If your group of friends was getting you into trouble at school, how likely is it that you would
still hang out with them? 1. Not at All Likely 2. A Little Likely 3. Somewhat Likely 4. Likely 5. Very Likely
14. If your group of friends was getting you into trouble with the police, how likely is it that you
would still hang out with them? 1. Not at All Likely 2. A Little Likely 3. Somewhat Likely 4. Likely 5. Very Likely
15. If your friends told you not to do something because it was wrong, how likely is it that you
would listen to them? 1. Not at All Likely 2. A Little Likely 3. Somewhat Likely 4. Likely 5. Very Likely
16. If your friends told you not to do something because it was against the law, how likely is it that
you would listen to them? 1. Not at All Likely 2. A Little Likely 3. Somewhat Likely 4. Likely 5. Very Likely
Still thinking about your current friends…. 17. Do you ever spend time hanging
around with your current friends not doing anything in
particular where no adults are present? 1. No 2. Yes
17a. IF YES, How many hours a week do you do this?
1. 1 -3 hours 2. 4 – 10 hours 3. more than 10 hours 18. Do you ever spend time getting together
with your current friends where drugs and alcohol
are available?
468
This document is a research report submitted to the U.S. Department of Justice. This report has not been published by the Department. Opinions or points of view expressed are those of the author(s)
and do not necessarily reflect the official position or policies of the U.S. Department of Justice.

1. No 2. Yes
469
This document is a research report submitted to the U.S. Department of Justice. This report has not been published by the Department. Opinions or points of view expressed are those of the author(s)
and do not necessarily reflect the official position or policies of the U.S. Department of Justice.

During the last year, how many of your current friends have done the following? 19. Skipped school without an excuse?
1. None of them 2. Few of them 3. Half of them 4. Most of them 5. All of them 20. Stolen something worth less than $50?
1. None of them 2. Few of them 3. Half of them 4. Most of them 5. All of them 21. Attacked someone with a weapon?
1. None of them 2. Few of them 3. Half of them 4. Most of them 5. All of them 22. Sold marijuana or other illegal drugs?
1. None of them 2. Few of them 3. Half of them 4. Most of them 5. All of them 23. Used tobacco or alcohol products?
1. None of them 2. Few of them 3. Half of them 4. Most of them 5. All of them 24. Used marijuana or other illegal drugs?
1. None of them 2. Few of them 3. Half of them 4. Most of them 5. All of them
25. Belonged to a gang?
1. None of them 2. Few of them 3. Half of them 4. Most of them 5. All of them
F. These next few questions are about your opinions about a number of different things. How much do you agree or disagree with these statements? 1. It's okay to tell a small lie if it doesn't hurt anyone.
1. Strongly Disagree 2. Disagree 3. Neither Agree nor Disagree 4. Agree 5. Strongly Agree 2. It's okay to lie if it will keep your friends from getting in trouble with parents, teachers, or police.
1. Strongly Disagree 2. Disagree 3. Neither Agree nor Disagree 4. Agree 5. Strongly Agree 3. It's okay to lie to someone if it will keep you out of trouble with them.
1. Strongly Disagree 2. Disagree 3. Neither Agree nor Disagree 4. Agree 5. Strongly Agree 4. It's okay to steal something from someone who is rich and can easily replace it.
1. Strongly Disagree 2. Disagree 3. Neither Agree nor Disagree 4. Agree 5. Strongly Agree
470
This document is a research report submitted to the U.S. Department of Justice. This report has not been published by the Department. Opinions or points of view expressed are those of the author(s)
and do not necessarily reflect the official position or policies of the U.S. Department of Justice.

5. It's okay to take little things from a store without paying for them since stores make so much money that it won't hurt them. 1. Strongly Disagree 2. Disagree 3. Neither Agree nor Disagree 4. Agree 5. Strongly Agree
6. It's okay to steal something if that's the only way you could ever get it.
1. Strongly Disagree 2. Disagree 3. Neither Agree nor Disagree 4. Agree 5. Strongly Agree 7. It's okay to beat up someone if they hit you first.
1. Strongly Disagree 2. Disagree 3. Neither Agree nor Disagree 4. Agree 5. Strongly Agree 8. It's okay to beat up someone if you have to stand up for or protect your rights.
1. Strongly Disagree 2. Disagree 3. Neither Agree nor Disagree 4. Agree 5. Strongly Agree
9. It's okay to beat up someone if they are threatening to hurt your friends or family.
1. Strongly Disagree 2. Disagree 3. Neither Agree nor Disagree 4. Agree 5. Strongly Agree
These next few questions are about school. 10. Homework is a waste of time.
1. Strongly Disagree 2. Disagree 3. Neither Agree nor Disagree 4. Agree 5. Strongly Agree 11. I try hard in school.
1. Strongly Disagree 2. Disagree 3. Neither Agree nor Disagree 4. Agree 5. Strongly Agree 12. Education is so important that it's worth it to put up with things about school that I don't like.
1. Strongly Disagree 2. Disagree 3. Neither Agree nor Disagree 4. Agree 5. Strongly Agree 13. In general, I like school.
1. Strongly Disagree 2. Disagree 3. Neither Agree nor Disagree 4. Agree 5. Strongly Agree 14. Grades are very important to me.
1. Strongly Disagree 2. Disagree 3. Neither Agree nor Disagree 4. Agree 5. Strongly Agree 15. I usually finish my homework.
1. Strongly Disagree 2. Disagree 3. Neither Agree nor Disagree 4. Agree 5. Strongly Agree 16. If you had to choose between studying to get a good grade on a test or going out with your
friends, which would you do? 1. Definitely Go with Friends 2. Probably Go with Friends 3. Uncertain 4. Probably Study 5. Definitely Study
For these next few questions, how guilty or how badly would you feel if you . . . .
471
This document is a research report submitted to the U.S. Department of Justice. This report has not been published by the Department. Opinions or points of view expressed are those of the author(s)
and do not necessarily reflect the official position or policies of the U.S. Department of Justice.
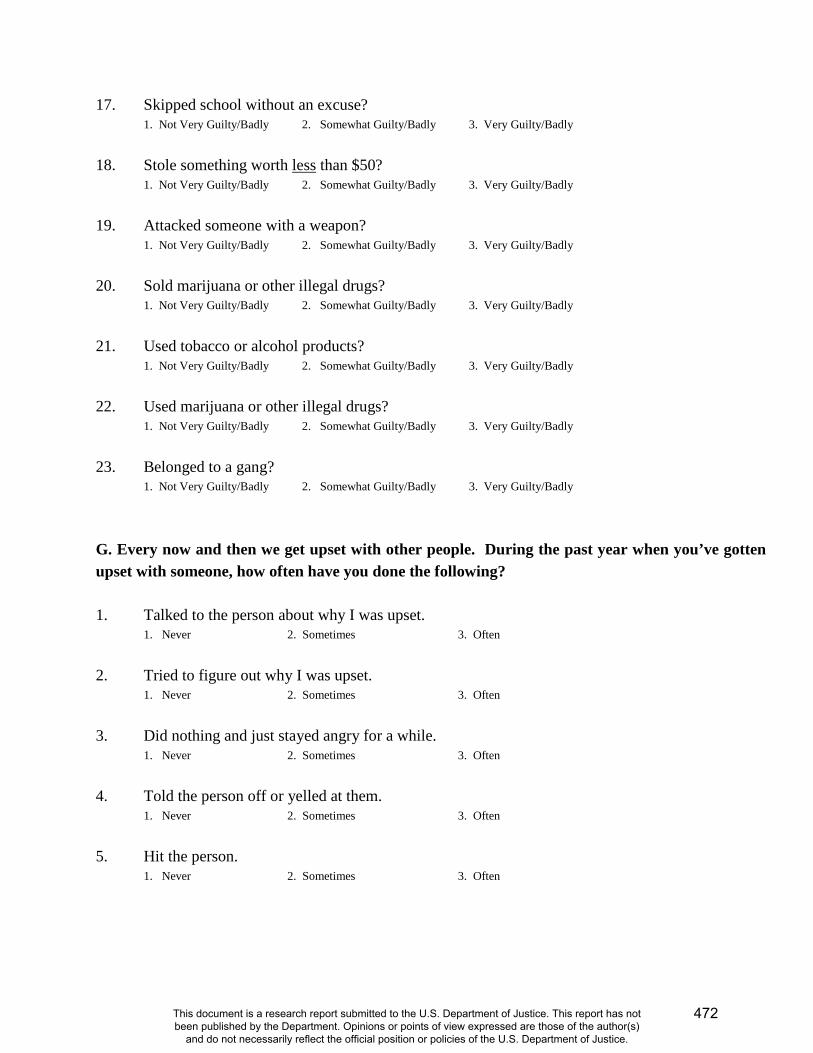
17. Skipped school without an excuse? 1. Not Very Guilty/Badly 2. Somewhat Guilty/Badly 3. Very Guilty/Badly
18. Stole something worth less than $50?
1. Not Very Guilty/Badly 2. Somewhat Guilty/Badly 3. Very Guilty/Badly 19. Attacked someone with a weapon?
1. Not Very Guilty/Badly 2. Somewhat Guilty/Badly 3. Very Guilty/Badly 20. Sold marijuana or other illegal drugs?
1. Not Very Guilty/Badly 2. Somewhat Guilty/Badly 3. Very Guilty/Badly 21. Used tobacco or alcohol products?
1. Not Very Guilty/Badly 2. Somewhat Guilty/Badly 3. Very Guilty/Badly
22. Used marijuana or other illegal drugs? 1. Not Very Guilty/Badly 2. Somewhat Guilty/Badly 3. Very Guilty/Badly
23. Belonged to a gang?
1. Not Very Guilty/Badly 2. Somewhat Guilty/Badly 3. Very Guilty/Badly G. Every now and then we get upset with other people. During the past year when you’ve gotten upset with someone, how often have you done the following? 1. Talked to the person about why I was upset.
1. Never 2. Sometimes 3. Often 2. Tried to figure out why I was upset.
1. Never 2. Sometimes 3. Often 3. Did nothing and just stayed angry for a while.
1. Never 2. Sometimes 3. Often 4. Told the person off or yelled at them.
1. Never 2. Sometimes 3. Often 5. Hit the person.
1. Never 2. Sometimes 3. Often
472
This document is a research report submitted to the U.S. Department of Justice. This report has not been published by the Department. Opinions or points of view expressed are those of the author(s)
and do not necessarily reflect the official position or policies of the U.S. Department of Justice.
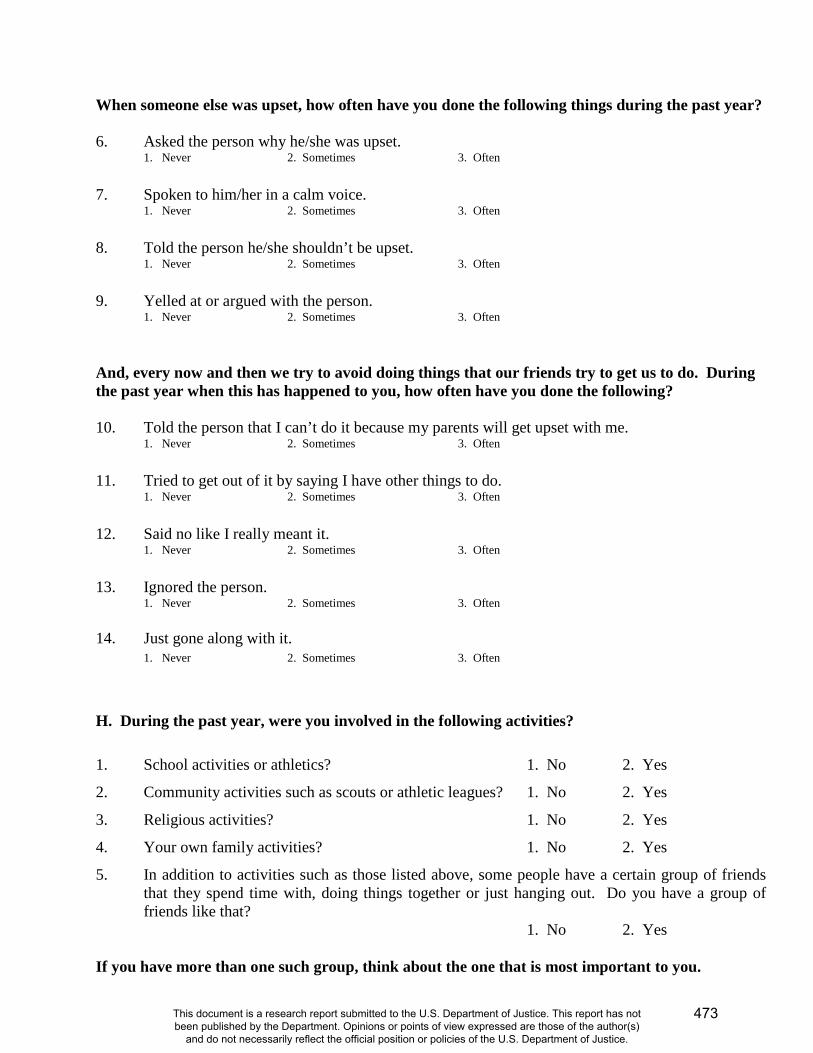
When someone else was upset, how often have you done the following things during the past year? 6. Asked the person why he/she was upset.
1. Never 2. Sometimes 3. Often 7. Spoken to him/her in a calm voice.
1. Never 2. Sometimes 3. Often 8. Told the person he/she shouldn’t be upset.
1. Never 2. Sometimes 3. Often 9. Yelled at or argued with the person.
1. Never 2. Sometimes 3. Often And, every now and then we try to avoid doing things that our friends try to get us to do. During the past year when this has happened to you, how often have you done the following? 10. Told the person that I can’t do it because my parents will get upset with me.
1. Never 2. Sometimes 3. Often 11. Tried to get out of it by saying I have other things to do.
1. Never 2. Sometimes 3. Often 12. Said no like I really meant it.
1. Never 2. Sometimes 3. Often 13. Ignored the person.
1. Never 2. Sometimes 3. Often
14. Just gone along with it. 1. Never 2. Sometimes 3. Often
H. During the past year, were you involved in the following activities? 1. School activities or athletics? 1. No 2. Yes
2. Community activities such as scouts or athletic leagues? 1. No 2. Yes
3. Religious activities? 1. No 2. Yes
4. Your own family activities? 1. No 2. Yes
5. In addition to activities such as those listed above, some people have a certain group of friends that they spend time with, doing things together or just hanging out. Do you have a group of friends like that? 1. No 2. Yes
If you have more than one such group, think about the one that is most important to you.
473
This document is a research report submitted to the U.S. Department of Justice. This report has not been published by the Department. Opinions or points of view expressed are those of the author(s)
and do not necessarily reflect the official position or policies of the U.S. Department of Justice.
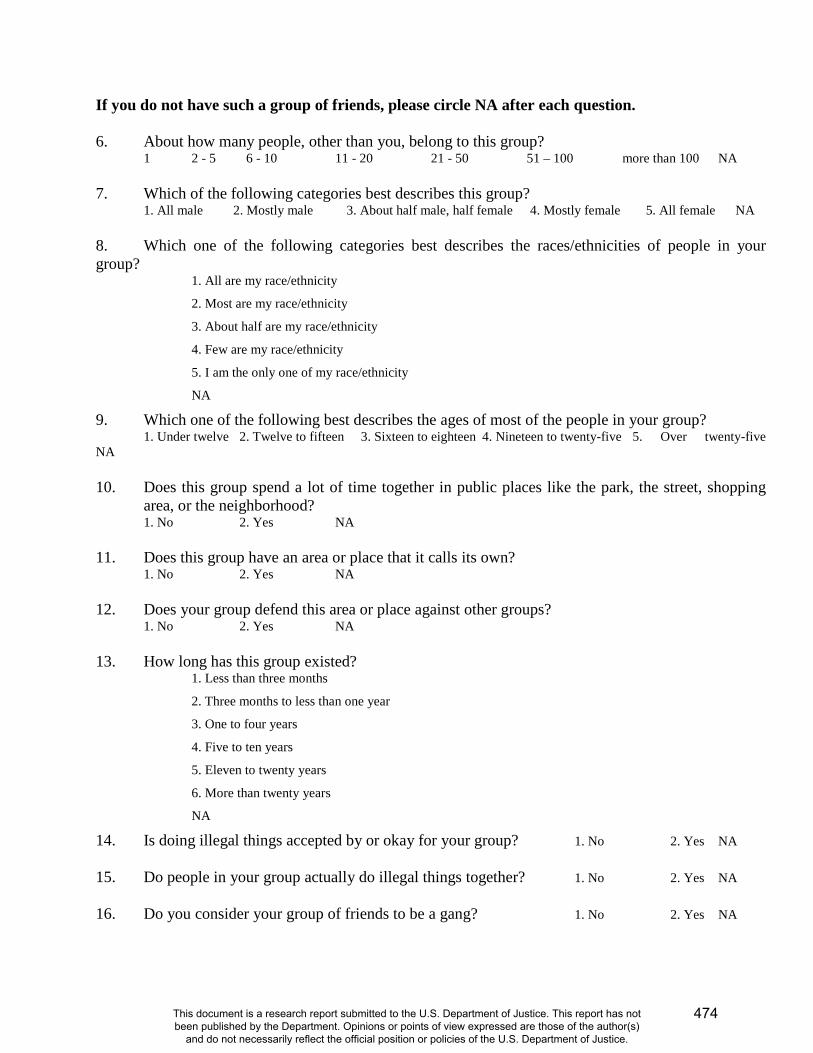
If you do not have such a group of friends, please circle NA after each question. 6. About how many people, other than you, belong to this group?
1 2 - 5 6 - 10 11 - 20 21 - 50 51 – 100 more than 100 NA
7. Which of the following categories best describes this group? 1. All male 2. Mostly male 3. About half male, half female 4. Mostly female 5. All female NA
8. Which one of the following categories best describes the races/ethnicities of people in your group? 1. All are my race/ethnicity
2. Most are my race/ethnicity
3. About half are my race/ethnicity
4. Few are my race/ethnicity
5. I am the only one of my race/ethnicity
NA
9. Which one of the following best describes the ages of most of the people in your group? 1. Under twelve 2. Twelve to fifteen 3. Sixteen to eighteen 4. Nineteen to twenty-five 5. Over twenty-five NA 10. Does this group spend a lot of time together in public places like the park, the street, shopping
area, or the neighborhood? 1. No 2. Yes NA
11. Does this group have an area or place that it calls its own? 1. No 2. Yes NA
12. Does your group defend this area or place against other groups? 1. No 2. Yes NA 13. How long has this group existed?
1. Less than three months
2. Three months to less than one year
3. One to four years
4. Five to ten years
5. Eleven to twenty years
6. More than twenty years
NA
14. Is doing illegal things accepted by or okay for your group? 1. No 2. Yes NA
15. Do people in your group actually do illegal things together? 1. No 2. Yes NA
16. Do you consider your group of friends to be a gang? 1. No 2. Yes NA
474
This document is a research report submitted to the U.S. Department of Justice. This report has not been published by the Department. Opinions or points of view expressed are those of the author(s)
and do not necessarily reflect the official position or policies of the U.S. Department of Justice.
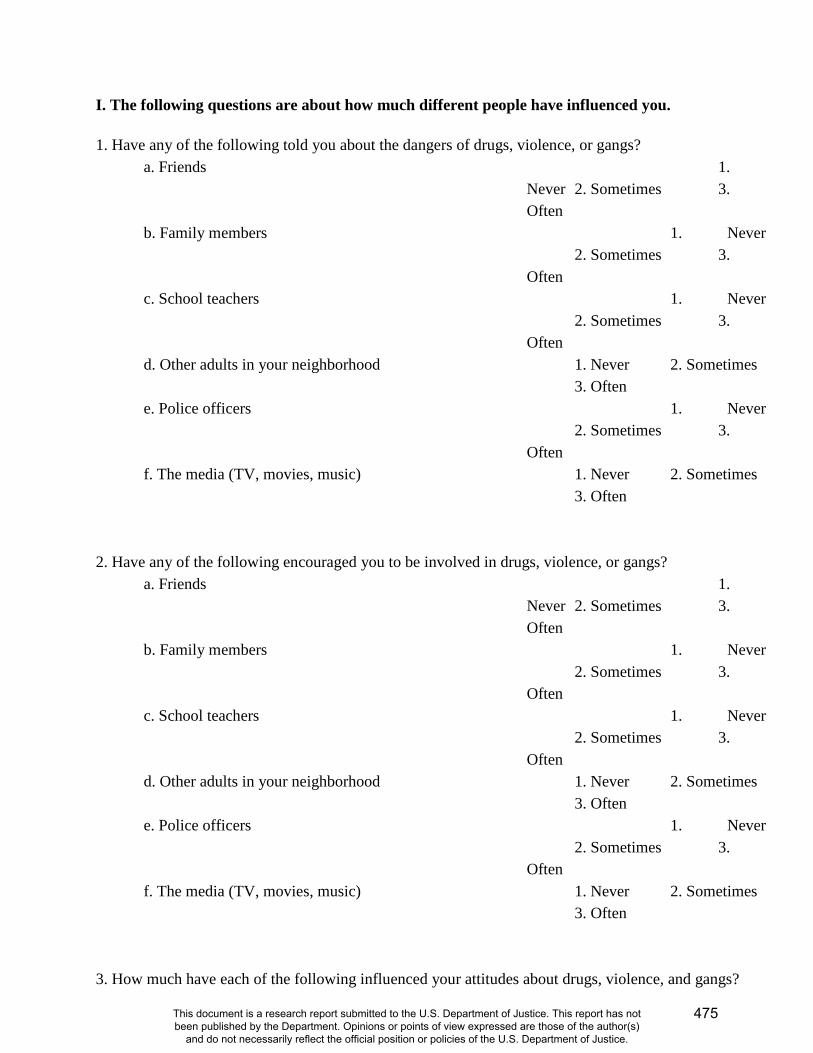
I. The following questions are about how much different people have influenced you. 1. Have any of the following told you about the dangers of drugs, violence, or gangs?
a. Friends 1. Never 2. Sometimes 3. Often
b. Family members 1. Never 2. Sometimes 3. Often
c. School teachers 1. Never 2. Sometimes 3. Often
d. Other adults in your neighborhood 1. Never 2. Sometimes 3. Often
e. Police officers 1. Never 2. Sometimes 3. Often
f. The media (TV, movies, music) 1. Never 2. Sometimes 3. Often
2. Have any of the following encouraged you to be involved in drugs, violence, or gangs?
a. Friends 1. Never 2. Sometimes 3. Often
b. Family members 1. Never 2. Sometimes 3. Often
c. School teachers 1. Never 2. Sometimes 3. Often
d. Other adults in your neighborhood 1. Never 2. Sometimes 3. Often
e. Police officers 1. Never 2. Sometimes 3. Often
f. The media (TV, movies, music) 1. Never 2. Sometimes 3. Often
3. How much have each of the following influenced your attitudes about drugs, violence, and gangs?
475
This document is a research report submitted to the U.S. Department of Justice. This report has not been published by the Department. Opinions or points of view expressed are those of the author(s)
and do not necessarily reflect the official position or policies of the U.S. Department of Justice.
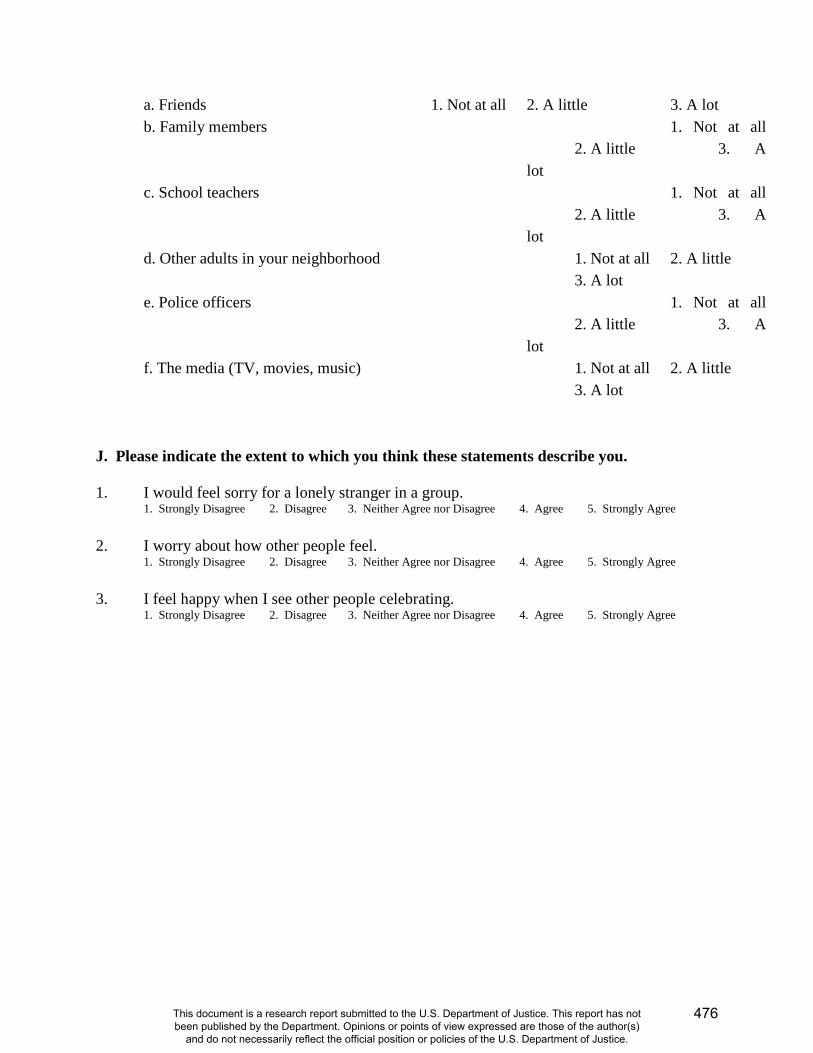
a. Friends 1. Not at all 2. A little 3. A lot b. Family members 1. Not at all
2. A little 3. A lot
c. School teachers 1. Not at all 2. A little 3. A lot
d. Other adults in your neighborhood 1. Not at all 2. A little 3. A lot
e. Police officers 1. Not at all 2. A little 3. A lot
f. The media (TV, movies, music) 1. Not at all 2. A little 3. A lot
J. Please indicate the extent to which you think these statements describe you. 1. I would feel sorry for a lonely stranger in a group.
1. Strongly Disagree 2. Disagree 3. Neither Agree nor Disagree 4. Agree 5. Strongly Agree 2. I worry about how other people feel.
1. Strongly Disagree 2. Disagree 3. Neither Agree nor Disagree 4. Agree 5. Strongly Agree 3. I feel happy when I see other people celebrating.
1. Strongly Disagree 2. Disagree 3. Neither Agree nor Disagree 4. Agree 5. Strongly Agree
476
This document is a research report submitted to the U.S. Department of Justice. This report has not been published by the Department. Opinions or points of view expressed are those of the author(s)
and do not necessarily reflect the official position or policies of the U.S. Department of Justice.

4. Seeing other people cry has no effect on me. 1. Strongly Disagree 2. Disagree 3. Neither Agree nor Disagree 4. Agree 5. Strongly Agree
5. I would find it very hard to break bad news to someone.
1. Strongly Disagree 2. Disagree 3. Neither Agree nor Disagree 4. Agree 5. Strongly Agree 6. I often interrupt someone talking to me.
1. Strongly Disagree 2. Disagree 3. Neither Agree nor Disagree 4. Agree 5. Strongly Agree 7. I look at the person talking to me.
1. Strongly Disagree 2. Disagree 3. Neither Agree nor Disagree 4. Agree 5. Strongly Agree 8. I pay attention to other people’s body language when they are talking to me.
1. Strongly Disagree 2. Disagree 3. Neither Agree nor Disagree 4. Agree 5. Strongly Agree 9. I ask questions of the person speaking to me.
1. Strongly Disagree 2. Disagree 3. Neither Agree nor Disagree 4. Agree 5. Strongly Agree 10. I talk to my friends about my problems.
1. Strongly Disagree 2. Disagree 3. Neither Agree nor Disagree 4. Agree 5. Strongly Agree 11. I talk to adults about my problems.
1. Strongly Disagree 2. Disagree 3. Neither Agree nor Disagree 4. Agree 5. Strongly Agree
12. When I make plans, I am certain I can make them work. 1. Strongly Disagree 2. Disagree 3. Neither Agree nor Disagree 4. Agree 5. Strongly Agree 13. If I can’t do something the first time, I keep trying until I can. 1. Strongly Disagree 2. Disagree 3. Neither Agree nor Disagree 4. Agree 5. Strongly Agree 14. When I have something unpleasant to do, I stick to it until I finish it.
1. Strongly Disagree 2. Disagree 3. Neither Agree nor Disagree 4. Agree 5. Strongly Agree 15. When I decide to do something, I go right to work on it.
1. Strongly Disagree 2. Disagree 3. Neither Agree nor Disagree 4. Agree 5. Strongly Agree 16. Failure just makes me try harder.
1. Strongly Disagree 2. Disagree 3. Neither Agree nor Disagree 4. Agree 5. Strongly Agree
477
This document is a research report submitted to the U.S. Department of Justice. This report has not been published by the Department. Opinions or points of view expressed are those of the author(s)
and do not necessarily reflect the official position or policies of the U.S. Department of Justice.
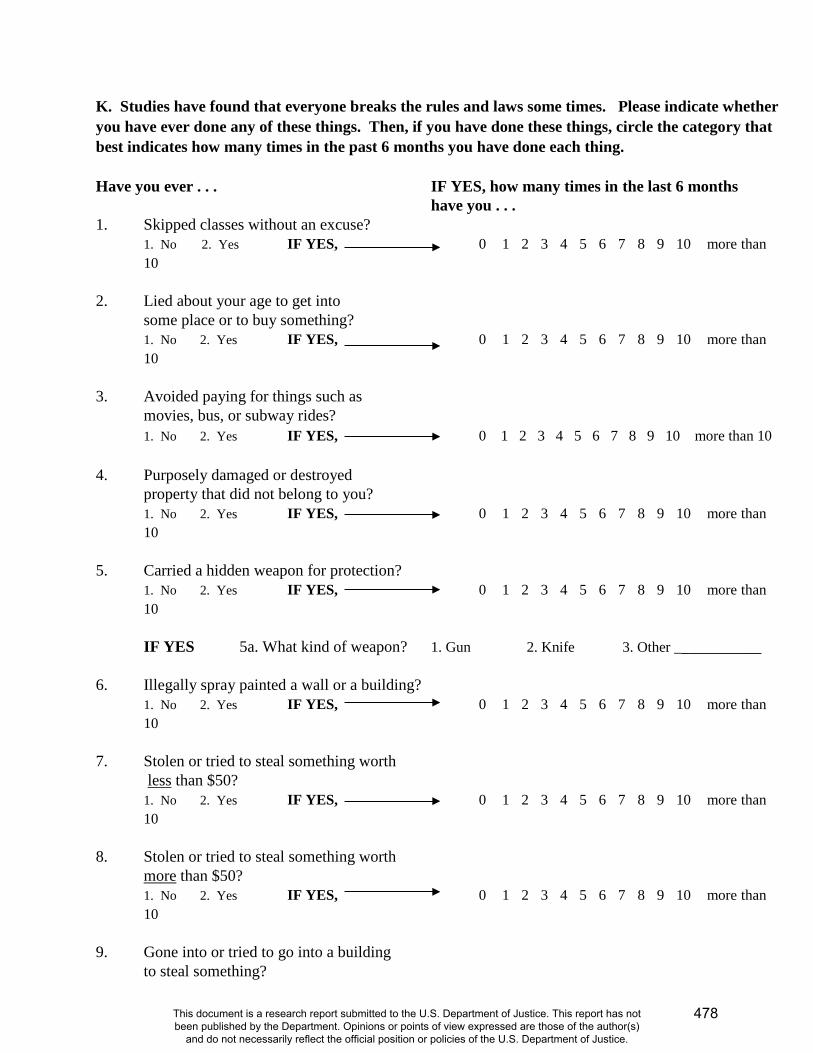
K. Studies have found that everyone breaks the rules and laws some times. Please indicate whether you have ever done any of these things. Then, if you have done these things, circle the category that best indicates how many times in the past 6 months you have done each thing. Have you ever . . . IF YES, how many times in the last 6 months
have you . . . 1. Skipped classes without an excuse? 1. No 2. Yes IF YES, 0 1 2 3 4 5 6 7 8 9 10 more than
10 2. Lied about your age to get into some place or to buy something? 1. No 2. Yes IF YES, 0 1 2 3 4 5 6 7 8 9 10 more than
10 3. Avoided paying for things such as movies, bus, or subway rides? 1. No 2. Yes IF YES, 0 1 2 3 4 5 6 7 8 9 10 more than 10 4. Purposely damaged or destroyed property that did not belong to you? 1. No 2. Yes IF YES, 0 1 2 3 4 5 6 7 8 9 10 more than
10 5. Carried a hidden weapon for protection? 1. No 2. Yes IF YES, 0 1 2 3 4 5 6 7 8 9 10 more than
10 IF YES 5a. What kind of weapon? 1. Gun 2. Knife 3. Other ___________ 6. Illegally spray painted a wall or a building? 1. No 2. Yes IF YES, 0 1 2 3 4 5 6 7 8 9 10 more than
10 7. Stolen or tried to steal something worth less than $50? 1. No 2. Yes IF YES, 0 1 2 3 4 5 6 7 8 9 10 more than
10 8. Stolen or tried to steal something worth more than $50? 1. No 2. Yes IF YES, 0 1 2 3 4 5 6 7 8 9 10 more than
10 9. Gone into or tried to go into a building to steal something?
478
This document is a research report submitted to the U.S. Department of Justice. This report has not been published by the Department. Opinions or points of view expressed are those of the author(s)
and do not necessarily reflect the official position or policies of the U.S. Department of Justice.
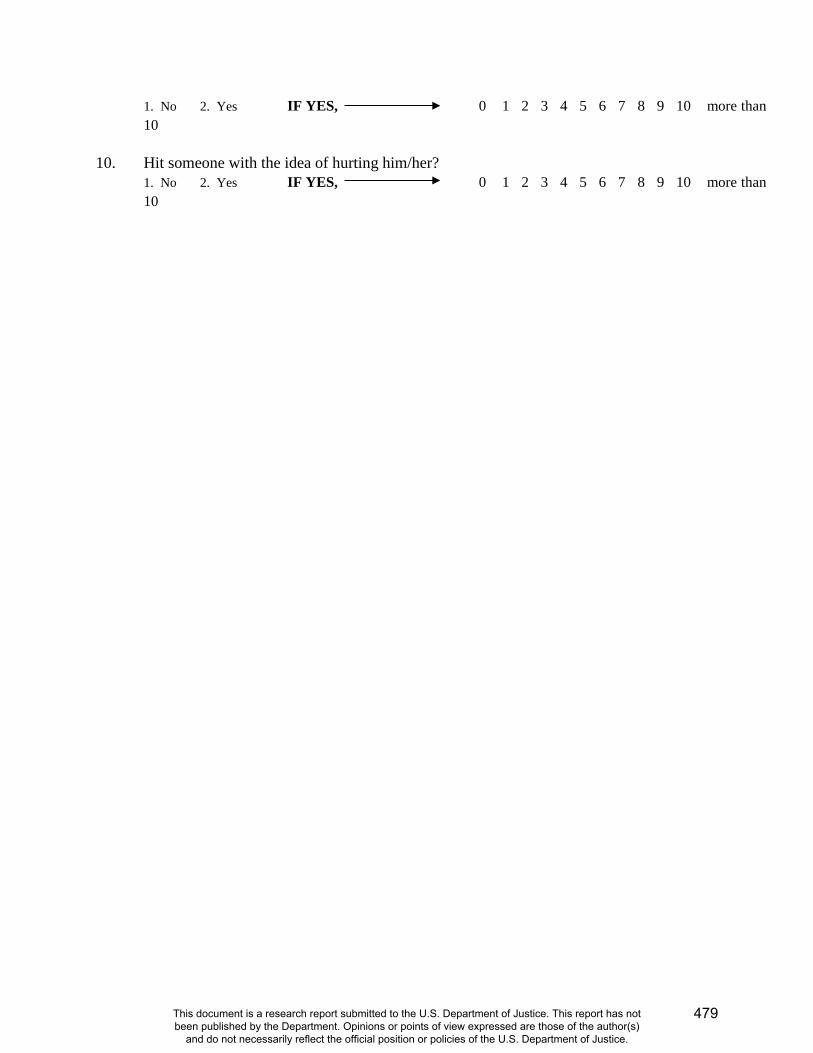
1. No 2. Yes IF YES, 0 1 2 3 4 5 6 7 8 9 10 more than 10
10. Hit someone with the idea of hurting him/her? 1. No 2. Yes IF YES, 0 1 2 3 4 5 6 7 8 9 10 more than
10
479
This document is a research report submitted to the U.S. Department of Justice. This report has not been published by the Department. Opinions or points of view expressed are those of the author(s)
and do not necessarily reflect the official position or policies of the U.S. Department of Justice.
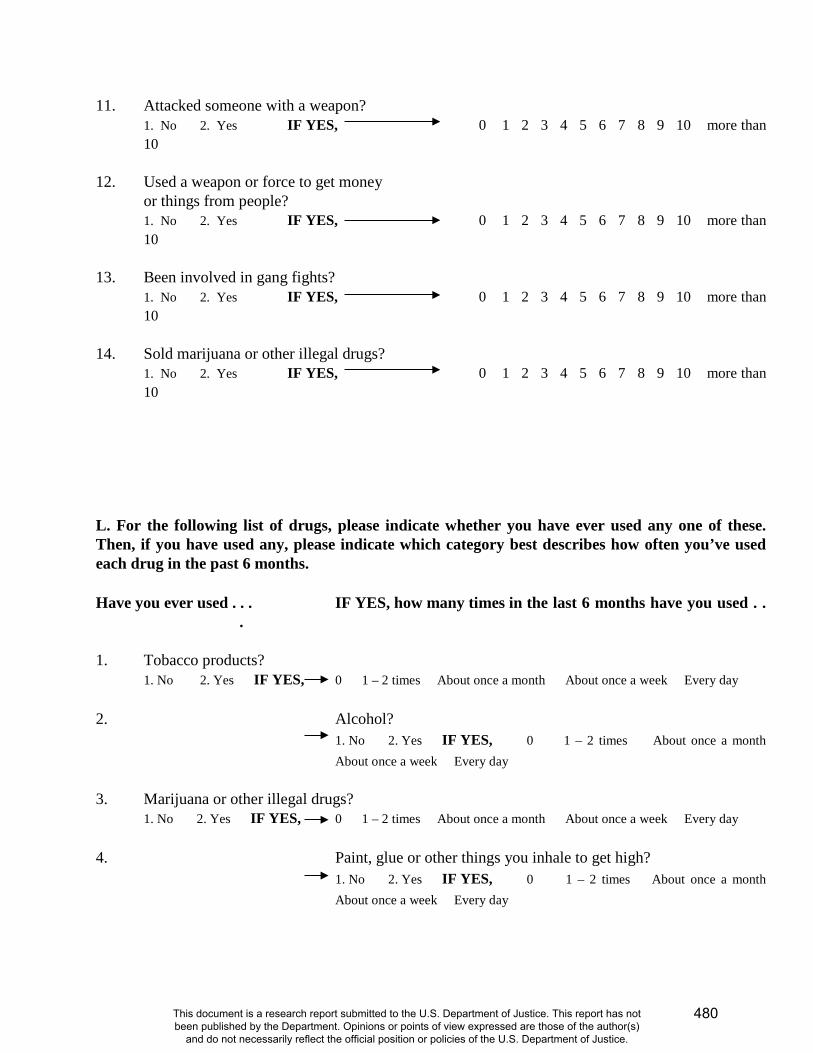
11. Attacked someone with a weapon? 1. No 2. Yes IF YES, 0 1 2 3 4 5 6 7 8 9 10 more than
10 12. Used a weapon or force to get money or things from people? 1. No 2. Yes IF YES, 0 1 2 3 4 5 6 7 8 9 10 more than
10 13. Been involved in gang fights? 1. No 2. Yes IF YES, 0 1 2 3 4 5 6 7 8 9 10 more than
10 14. Sold marijuana or other illegal drugs? 1. No 2. Yes IF YES, 0 1 2 3 4 5 6 7 8 9 10 more than
10 L. For the following list of drugs, please indicate whether you have ever used any one of these. Then, if you have used any, please indicate which category best describes how often you’ve used each drug in the past 6 months. Have you ever used . . . IF YES, how many times in the last 6 months have you used . .
. 1. Tobacco products? 1. No 2. Yes IF YES, 0 1 – 2 times About once a month About once a week Every day 2. Alcohol? 1. No 2. Yes IF YES, 0 1 – 2 times About once a month
About once a week Every day 3. Marijuana or other illegal drugs? 1. No 2. Yes IF YES, 0 1 – 2 times About once a month About once a week Every day 4. Paint, glue or other things you inhale to get high? 1. No 2. Yes IF YES, 0 1 – 2 times About once a month
About once a week Every day
480
This document is a research report submitted to the U.S. Department of Justice. This report has not been published by the Department. Opinions or points of view expressed are those of the author(s)
and do not necessarily reflect the official position or policies of the U.S. Department of Justice.
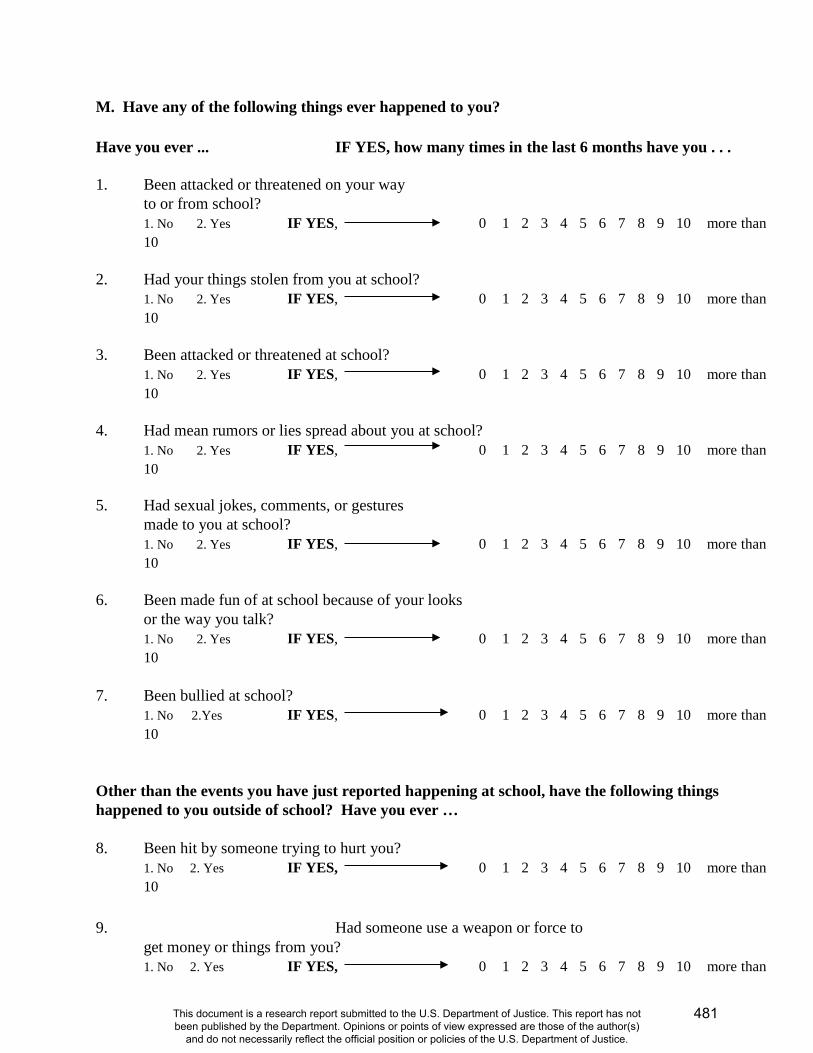
M. Have any of the following things ever happened to you? Have you ever ... IF YES, how many times in the last 6 months have you . . . 1. Been attacked or threatened on your way to or from school? 1. No 2. Yes IF YES, 0 1 2 3 4 5 6 7 8 9 10 more than
10 2. Had your things stolen from you at school? 1. No 2. Yes IF YES, 0 1 2 3 4 5 6 7 8 9 10 more than
10 3. Been attacked or threatened at school? 1. No 2. Yes IF YES, 0 1 2 3 4 5 6 7 8 9 10 more than
10 4. Had mean rumors or lies spread about you at school? 1. No 2. Yes IF YES, 0 1 2 3 4 5 6 7 8 9 10 more than
10 5. Had sexual jokes, comments, or gestures made to you at school? 1. No 2. Yes IF YES, 0 1 2 3 4 5 6 7 8 9 10 more than
10 6. Been made fun of at school because of your looks or the way you talk? 1. No 2. Yes IF YES, 0 1 2 3 4 5 6 7 8 9 10 more than
10 7. Been bullied at school? 1. No 2.Yes IF YES, 0 1 2 3 4 5 6 7 8 9 10 more than
10
Other than the events you have just reported happening at school, have the following things happened to you outside of school? Have you ever … 8. Been hit by someone trying to hurt you? 1. No 2. Yes IF YES, 0 1 2 3 4 5 6 7 8 9 10 more than
10 9. Had someone use a weapon or force to get money or things from you? 1. No 2. Yes IF YES, 0 1 2 3 4 5 6 7 8 9 10 more than
481
This document is a research report submitted to the U.S. Department of Justice. This report has not been published by the Department. Opinions or points of view expressed are those of the author(s)
and do not necessarily reflect the official position or policies of the U.S. Department of Justice.
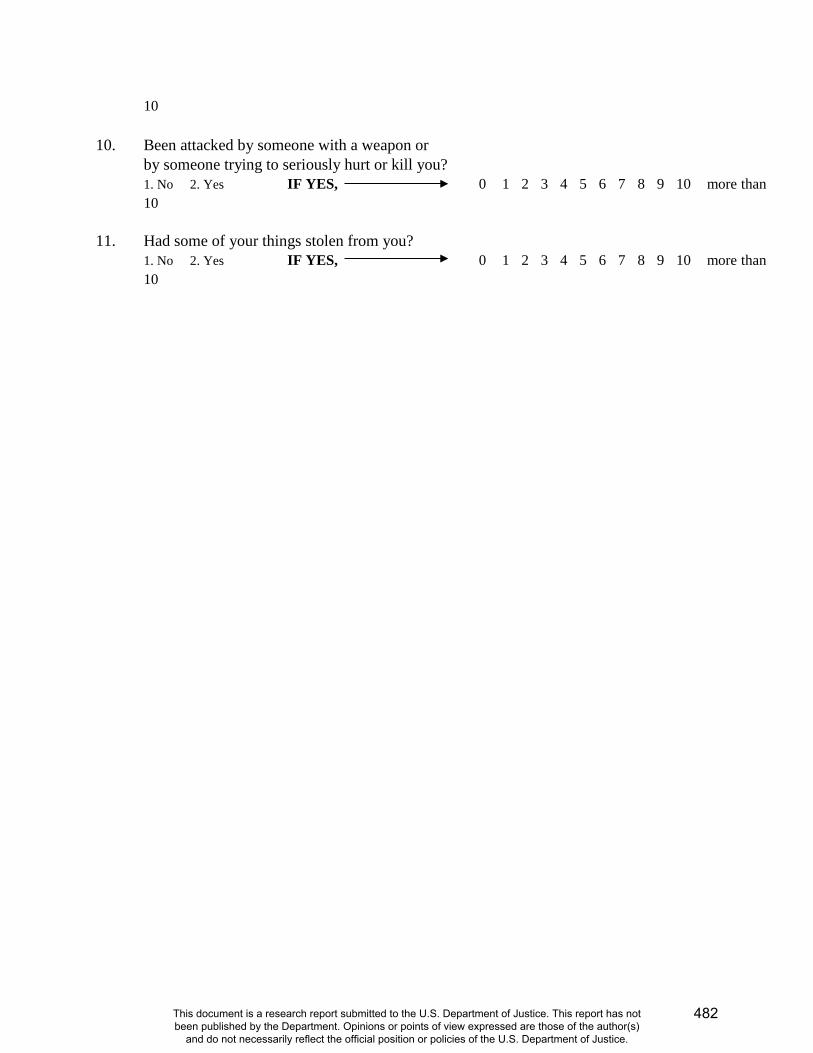
10 10. Been attacked by someone with a weapon or by someone trying to seriously hurt or kill you? 1. No 2. Yes IF YES, 0 1 2 3 4 5 6 7 8 9 10 more than
10 11. Had some of your things stolen from you? 1. No 2. Yes IF YES, 0 1 2 3 4 5 6 7 8 9 10 more than
10
482
This document is a research report submitted to the U.S. Department of Justice. This report has not been published by the Department. Opinions or points of view expressed are those of the author(s)
and do not necessarily reflect the official position or policies of the U.S. Department of Justice.
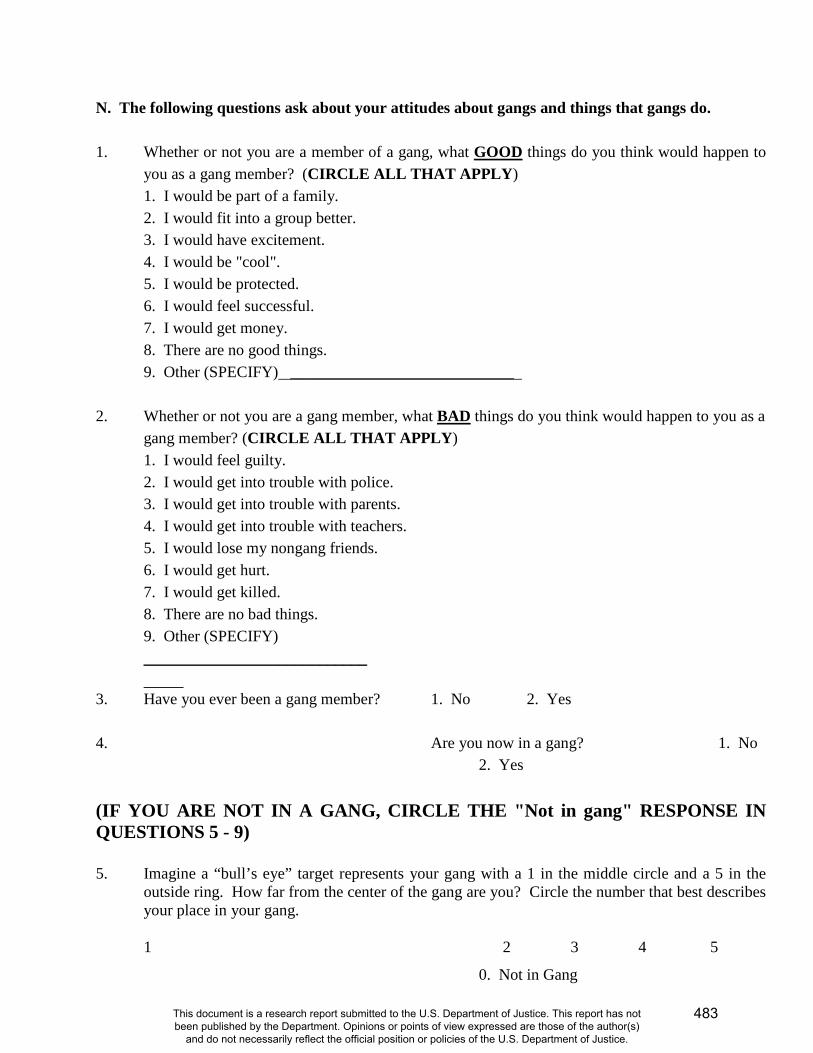
N. The following questions ask about your attitudes about gangs and things that gangs do. 1. Whether or not you are a member of a gang, what GOOD things do you think would happen to
you as a gang member? (CIRCLE ALL THAT APPLY) 1. I would be part of a family. 2. I would fit into a group better. 3. I would have excitement. 4. I would be "cool". 5. I would be protected. 6. I would feel successful. 7. I would get money. 8. There are no good things. 9. Other (SPECIFY) ____________________________
2. Whether or not you are a gang member, what BAD things do you think would happen to you as a
gang member? (CIRCLE ALL THAT APPLY) 1. I would feel guilty. 2. I would get into trouble with police. 3. I would get into trouble with parents. 4. I would get into trouble with teachers. 5. I would lose my nongang friends. 6. I would get hurt. 7. I would get killed. 8. There are no bad things. 9. Other (SPECIFY) ____________________________
3. Have you ever been a gang member? 1. No 2. Yes 4. Are you now in a gang? 1. No
2. Yes (IF YOU ARE NOT IN A GANG, CIRCLE THE "Not in gang" RESPONSE IN QUESTIONS 5 - 9) 5. Imagine a “bull’s eye” target represents your gang with a 1 in the middle circle and a 5 in the
outside ring. How far from the center of the gang are you? Circle the number that best describes your place in your gang.
1 2 3 4 5
0. Not in Gang
483
This document is a research report submitted to the U.S. Department of Justice. This report has not been published by the Department. Opinions or points of view expressed are those of the author(s)
and do not necessarily reflect the official position or policies of the U.S. Department of Justice.

484
This document is a research report submitted to the U.S. Department of Justice. This report has not been published by the Department. Opinions or points of view expressed are those of the author(s)
and do not necessarily reflect the official position or policies of the U.S. Department of Justice.

6. Do the following describe your gang? a. You can join before age 13. 1. No 2. Yes 0. Not in gang
b. There are initiation rites. 1. No 2. Yes 0. Not in gang
c. The gang has established leaders. 1. No 2. Yes 0. Not in gang
d. The gang has regular meetings. 1. No 2. Yes 0. Not in gang
e. The gang has specific rules or codes. 1. No 2. Yes 0. Not in gang
f. Gang members have specific roles. 1. No 2. Yes 0. Not in gang
g. There are roles for each age group. 1. No 2. Yes 0. Not in gang
h. The gang has symbols or colors. 1. No 2. Yes 0. Not in gang
i. There are specific roles for girls. 1. No 2. Yes 0. Not in gang
j. There are specific roles for boys. 1. No 2. Yes 0. Not in gang
7. How old were you when you joined this gang?
About years old. 0. Not in gang 8. Why did you join the gang? (CIRCLE ALL THAT APPLY)
0. Not in gang 5. I was forced to join 1. For fun 6. To get respect 2. For protection 7. For money 3. A friend was in the gang 8. To fit in better 4. A brother or sister was in the gang 9. Other (SPECIFY)_________________
9. Do members of your gang do these things together?
a. Help out in the community 1. No 2. Yes 0. Not in gang
b. Get in fights with other gangs 1. No 2. Yes 0. Not in gang
c. Provide protection for each other 1. No 2. Yes 0. Not in gang
d. Steal things 1. No 2. Yes 0. Not in gang
e. Rob other people 1. No 2. Yes 0. Not in gang
f. Steal cars 1. No 2. Yes 0. Not in gang
g. Sell marijuana 1. No 2. Yes 0. Not in gang
h. Sell other illegal drugs 1. No 2. Yes 0. Not in gang
i. Damage or destroy property 1. No 2. Yes 0. Not in gang
485
This document is a research report submitted to the U.S. Department of Justice. This report has not been published by the Department. Opinions or points of view expressed are those of the author(s)
and do not necessarily reflect the official position or policies of the U.S. Department of Justice.
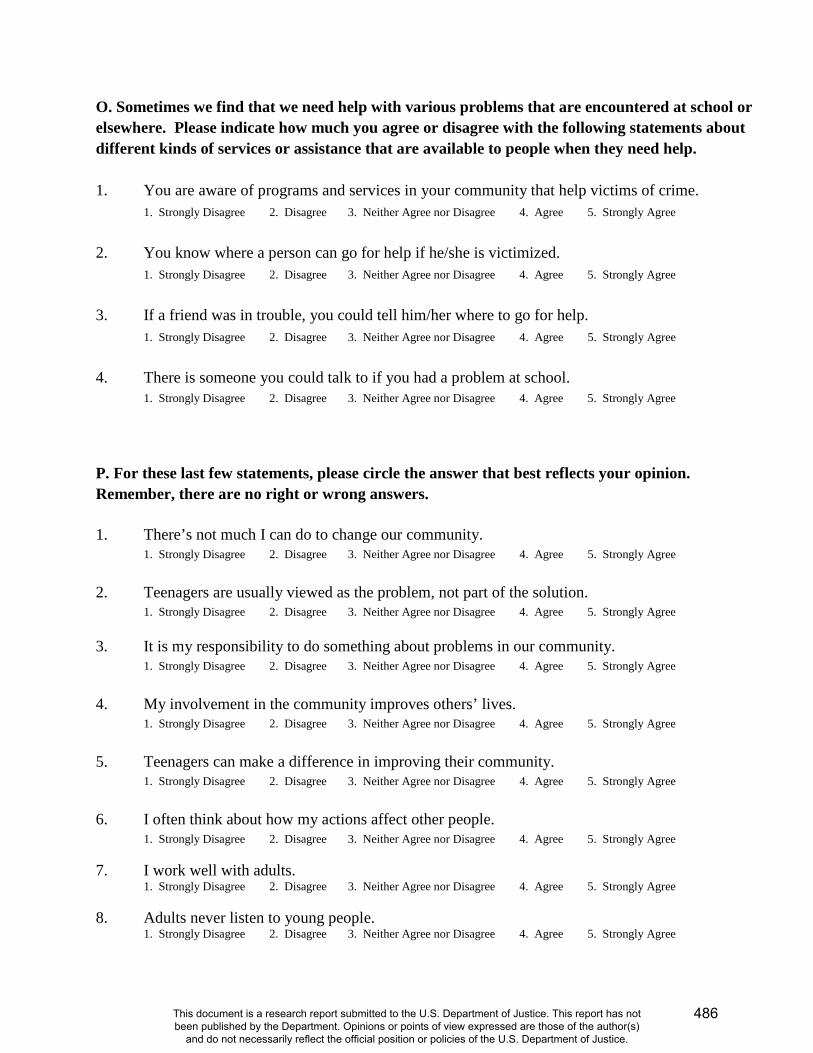
O. Sometimes we find that we need help with various problems that are encountered at school or elsewhere. Please indicate how much you agree or disagree with the following statements about different kinds of services or assistance that are available to people when they need help. 1. You are aware of programs and services in your community that help victims of crime. 1. Strongly Disagree 2. Disagree 3. Neither Agree nor Disagree 4. Agree 5. Strongly Agree
2. You know where a person can go for help if he/she is victimized. 1. Strongly Disagree 2. Disagree 3. Neither Agree nor Disagree 4. Agree 5. Strongly Agree
3. If a friend was in trouble, you could tell him/her where to go for help. 1. Strongly Disagree 2. Disagree 3. Neither Agree nor Disagree 4. Agree 5. Strongly Agree
4. There is someone you could talk to if you had a problem at school. 1. Strongly Disagree 2. Disagree 3. Neither Agree nor Disagree 4. Agree 5. Strongly Agree
P. For these last few statements, please circle the answer that best reflects your opinion. Remember, there are no right or wrong answers. 1. There’s not much I can do to change our community. 1. Strongly Disagree 2. Disagree 3. Neither Agree nor Disagree 4. Agree 5. Strongly Agree 2. Teenagers are usually viewed as the problem, not part of the solution. 1. Strongly Disagree 2. Disagree 3. Neither Agree nor Disagree 4. Agree 5. Strongly Agree 3. It is my responsibility to do something about problems in our community. 1. Strongly Disagree 2. Disagree 3. Neither Agree nor Disagree 4. Agree 5. Strongly Agree 4. My involvement in the community improves others’ lives. 1. Strongly Disagree 2. Disagree 3. Neither Agree nor Disagree 4. Agree 5. Strongly Agree 5. Teenagers can make a difference in improving their community. 1. Strongly Disagree 2. Disagree 3. Neither Agree nor Disagree 4. Agree 5. Strongly Agree 6. I often think about how my actions affect other people. 1. Strongly Disagree 2. Disagree 3. Neither Agree nor Disagree 4. Agree 5. Strongly Agree 7. I work well with adults. 1. Strongly Disagree 2. Disagree 3. Neither Agree nor Disagree 4. Agree 5. Strongly Agree 8. Adults never listen to young people. 1. Strongly Disagree 2. Disagree 3. Neither Agree nor Disagree 4. Agree 5. Strongly Agree
486
This document is a research report submitted to the U.S. Department of Justice. This report has not been published by the Department. Opinions or points of view expressed are those of the author(s)
and do not necessarily reflect the official position or policies of the U.S. Department of Justice.
9. Gangs interfere with the peace and safety of a neighborhood. 1. Strongly Disagree 2. Disagree 3. Neither Agree nor Disagree 4. Agree 5. Strongly Agree
10. Getting involved with gangs will interfere with reaching my goals.
1. Strongly Disagree 2. Disagree 3. Neither Agree nor Disagree 4. Agree 5. Strongly Agree 11. I have limited my activities as a result of gangs in my neighborhood.
1. Strongly Disagree 2. Disagree 3. Neither Agree nor Disagree 4. Agree 5. Strongly Agree 12. People only help others when they think they are going to get something out of it.
1. Strongly Disagree 2. Disagree 3. Neither Agree nor Disagree 4. Agree 5. Strongly Agree 13. I value being a team member. 1. Strongly Disagree 2. Disagree 3. Neither Agree nor Disagree 4. Agree 5. Strongly Agree 14. It feels good to do something without expecting anything in return.
1. Strongly Disagree 2. Disagree 3. Neither Agree nor Disagree 4. Agree 5. Strongly Agree 15. I always do my part.
1. Strongly Disagree 2. Disagree 3. Neither Agree nor Disagree 4. Agree 5. Strongly Agree 16. I don’t like to work unless I get paid for it.
1. Strongly Disagree 2. Disagree 3. Neither Agree nor Disagree 4. Agree 5. Strongly Agree 17. If you don’t look out for yourself, no one else will.
1. Strongly Disagree 2. Disagree 3. Neither Agree nor Disagree 4. Agree 5. Strongly Agree
Thank you very much for answering these questions. We really appreciate your help.
487
This document is a research report submitted to the U.S. Department of Justice. This report has not been published by the Department. Opinions or points of view expressed are those of the author(s)
and do not necessarily reflect the official position or policies of the U.S. Department of Justice.

NATIONAL EVALUATION OF G.R.E.A.T.
STUDENT QUESTIONNAIRE
Post – Test
School Year 2006 - 2007
University of Missouri-St. Louis Department of Criminology and Criminal Justice
8001 Natural Bridge Road St. Louis, MO 63121
488
This document is a research report submitted to the U.S. Department of Justice. This report has not been published by the Department. Opinions or points of view expressed are those of the author(s)
and do not necessarily reflect the official position or policies of the U.S. Department of Justice.

INSTRUCTIONS 1. Please answer the questions in the order they appear. 2. Circle the number that shows your best answer to each question. 3. There are no right or wrong answers. Your opinion is what counts. 4. Do NOT write your name on the questionnaire. 5. Your answers are CONFIDENTIAL - - no one outside of our research office will ever
connect your name with the answers you give. 6. You have the right to skip any question that you do not want to answer. 7. You can stop filling out the questionnaire any time you wish. WE HOPE YOU ENJOY ANSWERING THESE QUESTIONS
489
This document is a research report submitted to the U.S. Department of Justice. This report has not been published by the Department. Opinions or points of view expressed are those of the author(s)
and do not necessarily reflect the official position or policies of the U.S. Department of Justice.
Please provide the following information. Once you have completed this page, tear it out and hand it to one of the researchers. PLEASE PRINT Your Name:____________________________________________ (First) (Middle) (Last) Address: ______________________________________________ (Number) (Street) ______________________________________________________ (City) (State) (Zip Code) Today’s Date: ______________________________
490
This document is a research report submitted to the U.S. Department of Justice. This report has not been published by the Department. Opinions or points of view expressed are those of the author(s)
and do not necessarily reflect the official position or policies of the U.S. Department of Justice.
A. We are going to begin with a few questions about you and your background. Please circle the response that best describes you. 1. I am 1. Male 2. Female 2. I am 1. White/Anglo, not Hispanic (CIRCLE ALL THAT APPLY)
2. Black/African-American 3. Hispanic/Latino 4. American Indian/Native American 5. Asian/Pacific Islander/Oriental 6. Other (SPECIFY) ________________________________
3. How old are you? 9 10 11 12 13 14 15 4. I live with 1. my mother and my father
2. my mother only 3. my father only 4. my mother and stepfather 5. my father and stepmother 6. my mother and other adult (SPECIFY)_________________ 7. my father and other adult (SPECIFY) __________________ 8. other relatives (SPECIFY)___________________________ 9. other (SPECIFY)__________________________________
5. What is the highest level of schooling that your father has completed? 1. Less than high school 4. Completed college 2. Completed high school 5. More than college 3. Some college 6. Don’t know 6. What is the highest level of schooling that your mother has completed? 1. Less than high school 4. Completed college 2. Completed high school 5. More than college 3. Some college 6. Don’t know 7. How many times have you moved during the last 3 months? Times 8. Were you born in the United States? 1. No 2. Yes
8a. IF NO, in what country were you born? __________________
9. Looking at all your grades at school, would you say you were closest to a …. 1. Straight A student 4. D Student 2. B student 5. F student 3. C student 6. Something else __________________
10. Did you complete the G.R.E.A.T. program?
1. No 2. Yes
491
This document is a research report submitted to the U.S. Department of Justice. This report has not been published by the Department. Opinions or points of view expressed are those of the author(s)
and do not necessarily reflect the official position or policies of the U.S. Department of Justice.

B. Much of our time is spent in schools and neighborhoods and these places affect how we feel about a lot of other things. Thinking about your school and neighborhood, please indicate how much of a problem each of the following is in your school and neighborhood. That is, are these things not a problem, somewhat of a problem, or a big problem? 1. Kids bullying or teasing other children at your school 1. Not a problem 2. Somewhat of a problem 3. A big problem 2. Places in your school where some students are afraid to go 1. Not a problem 2. Somewhat of a problem 3. A big problem 3. Students beating up or threatening other students at your school 1. Not a problem 2. Somewhat of a problem 3. A big problem 4. Kids of different racial or cultural groups at your school not getting along with each other 1. Not a problem 2. Somewhat of a problem 3. A big problem 5. Students bringing guns to school 1. Not a problem 2. Somewhat of a problem 3. A big problem 6. Having things stolen at school 1. Not a problem 2. Somewhat of a problem 3. A big problem 7. Run-down or poorly kept buildings in your neighborhood 1. Not a problem 2. Somewhat of a problem 3. A big problem 8. Groups of people hanging out in public places causing trouble in your neighborhood 1. Not a problem 2. Somewhat of a problem 3. A big problem 9. Graffiti on buildings and fences in your neighborhood 1. Not a problem 2. Somewhat of a problem 3. A big problem 10. Hearing gunshots in your neighborhood 1. Not a problem 2. Somewhat of a problem 3. A big problem 11. Cars traveling too fast throughout the streets of your neighborhood 1. Not a problem 2. Somewhat of a problem 3. A big problem 12. Gangs in your neighborhood 1. Not a problem 2. Somewhat of a problem 3. A big problem
492
This document is a research report submitted to the U.S. Department of Justice. This report has not been published by the Department. Opinions or points of view expressed are those of the author(s)
and do not necessarily reflect the official position or policies of the U.S. Department of Justice.

C. For the next set of statements, indicate how much you think these statements describe you. That is, how much do you agree or disagree with each statement? There are no right or wrong answers; it is your opinion that counts. 1. When I go someplace, I leave a note for my parents or call them to tell them where I am.
1. Strongly Disagree 2. Disagree 3. Neither Agree nor Disagree 4. Agree 5. Strongly Agree 2. My parents know where I am when I am not at home or at school.
1. Strongly Disagree 2. Disagree 3. Neither Agree nor Disagree 4. Agree 5. Strongly Agree 3. I know how to get in touch with my parents if they are not at home.
1. Strongly Disagree 2. Disagree 3. Neither Agree nor Disagree 4. Agree 5. Strongly Agree 4. My parents know who I am with if I am not at home.
1. Strongly Disagree 2. Disagree 3. Neither Agree nor Disagree 4. Agree 5. Strongly Agree 5. I often act without stopping to think.
1. Strongly Disagree 2. Disagree 3. Neither Agree nor Disagree 4. Agree 5. Strongly Agree 6. I don't devote much thought and effort to preparing for the future.
1. Strongly Disagree 2. Disagree 3. Neither Agree nor Disagree 4. Agree 5. Strongly Agree 7. I often do whatever brings me pleasure here and now, even at the cost of some distant goal.
1. Strongly Disagree 2. Disagree 3. Neither Agree nor Disagree 4. Agree 5. Strongly Agree 8. I'm more concerned with what happens to me in the short run than in the long run.
1. Strongly Disagree 2. Disagree 3. Neither Agree nor Disagree 4. Agree 5. Strongly Agree 9. I like to test myself every now and then by doing something a little risky.
1. Strongly Disagree 2. Disagree 3. Neither Agree nor Disagree 4. Agree 5. Strongly Agree 10. Sometimes I will take a risk just for the fun of it.
1. Strongly Disagree 2. Disagree 3. Neither Agree nor Disagree 4. Agree 5. Strongly Agree 11. I sometimes find it exciting to do things for which I might get in trouble.
1. Strongly Disagree 2. Disagree 3. Neither Agree nor Disagree 4. Agree 5. Strongly Agree 12. Excitement and adventure are more important to me than security.
1. Strongly Disagree 2. Disagree 3. Neither Agree nor Disagree 4. Agree 5. Strongly Agree 13. I lose my temper pretty easily.
1. Strongly Disagree 2. Disagree 3. Neither Agree nor Disagree 4. Agree 5. Strongly Agree
493
This document is a research report submitted to the U.S. Department of Justice. This report has not been published by the Department. Opinions or points of view expressed are those of the author(s)
and do not necessarily reflect the official position or policies of the U.S. Department of Justice.
14. Often when I’m angry at people, I feel more like hurting them than talking to them about why I am angry. 1. Strongly Disagree 2. Disagree 3. Neither Agree nor Disagree 4. Agree 5. Strongly Agree
15. When I’m really angry, other people better stay away from me. 1. Strongly Disagree 2. Disagree 3. Neither Agree nor Disagree 4. Agree 5. Strongly Agree
16. When I have a serious disagreement with someone, it’s usually hard for me to talk calmly about it
without getting upset. 1. Strongly Disagree 2. Disagree 3. Neither Agree nor Disagree 4. Agree 5. Strongly Agree
17. I try to look out for myself first, even if it means making things difficult for other people.
1. Strongly Disagree 2. Disagree 3. Neither Agree nor Disagree 4. Agree 5. Strongly Agree 18. I’m not very sympathetic to other people when they are having problems.
1. Strongly Disagree 2. Disagree 3. Neither Agree nor Disagree 4. Agree 5. Strongly Agree 19. If things I do upset people, it’s their problem not mine.
1. Strongly Disagree 2. Disagree 3. Neither Agree nor Disagree 4. Agree 5. Strongly Agree 20. I will try to get the things I want even when I know it’s causing problems for other people.
1. Strongly Disagree 2. Disagree 3. Neither Agree nor Disagree 4. Agree 5. Strongly Agree D. The next few statements are about your attitudes toward the police. 1. Police officers are honest.
1. Strongly Disagree 2. Disagree 3. Neither Agree nor Disagree 4. Agree 5. Strongly Agree 2. Police officers are hardworking.
1. Strongly Disagree 2. Disagree 3. Neither Agree nor Disagree 4. Agree 5. Strongly Agree 3. Most police officers are usually friendly.
1. Strongly Disagree 2. Disagree 3. Neither Agree nor Disagree 4. Agree 5. Strongly Agree 4. Police officers are usually courteous.
1. Strongly Disagree 2. Disagree 3. Neither Agree nor Disagree 4. Agree 5. Strongly Agree 5. Police officers are respectful toward people like me.
1. Strongly Disagree 2. Disagree 3. Neither Agree nor Disagree 4. Agree 5. Strongly Agree 6. I feel safer when police officers are in my school.
494
This document is a research report submitted to the U.S. Department of Justice. This report has not been published by the Department. Opinions or points of view expressed are those of the author(s)
and do not necessarily reflect the official position or policies of the U.S. Department of Justice.
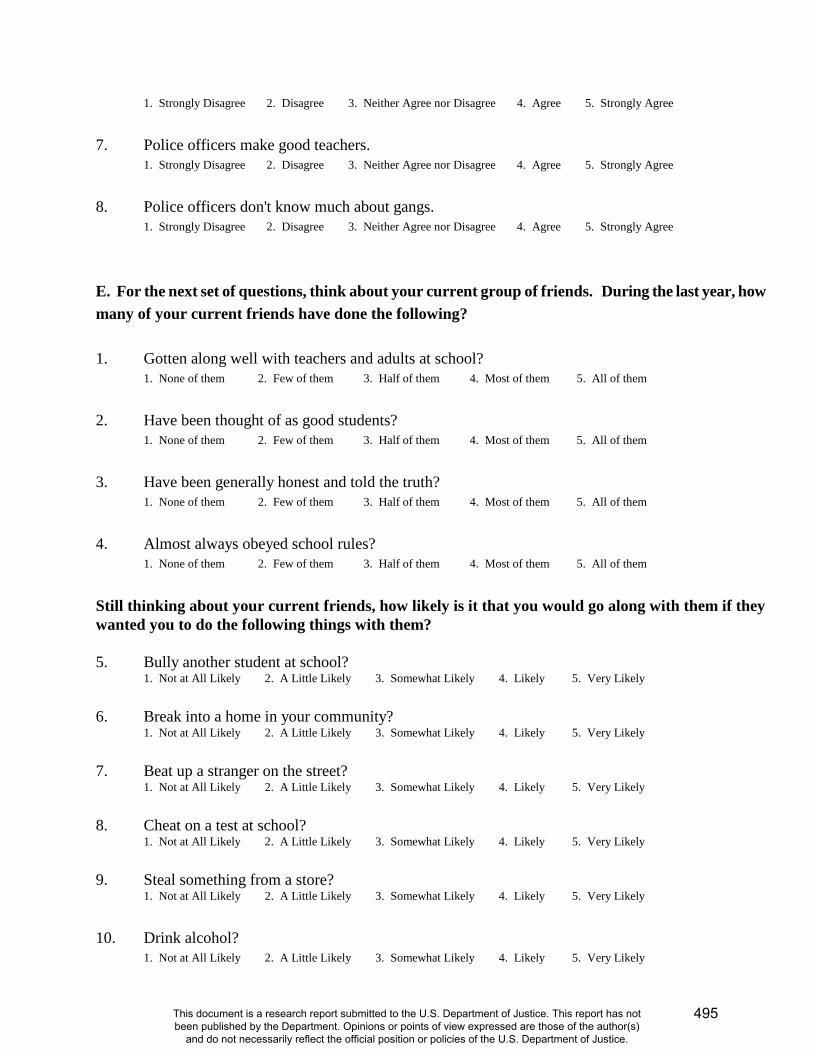
1. Strongly Disagree 2. Disagree 3. Neither Agree nor Disagree 4. Agree 5. Strongly Agree 7. Police officers make good teachers.
1. Strongly Disagree 2. Disagree 3. Neither Agree nor Disagree 4. Agree 5. Strongly Agree 8. Police officers don't know much about gangs.
1. Strongly Disagree 2. Disagree 3. Neither Agree nor Disagree 4. Agree 5. Strongly Agree E. For the next set of questions, think about your current group of friends. During the last year, how many of your current friends have done the following? 1. Gotten along well with teachers and adults at school?
1. None of them 2. Few of them 3. Half of them 4. Most of them 5. All of them 2. Have been thought of as good students?
1. None of them 2. Few of them 3. Half of them 4. Most of them 5. All of them 3. Have been generally honest and told the truth?
1. None of them 2. Few of them 3. Half of them 4. Most of them 5. All of them 4. Almost always obeyed school rules?
1. None of them 2. Few of them 3. Half of them 4. Most of them 5. All of them Still thinking about your current friends, how likely is it that you would go along with them if they wanted you to do the following things with them? 5. Bully another student at school?
1. Not at All Likely 2. A Little Likely 3. Somewhat Likely 4. Likely 5. Very Likely 6. Break into a home in your community?
1. Not at All Likely 2. A Little Likely 3. Somewhat Likely 4. Likely 5. Very Likely 7. Beat up a stranger on the street?
1. Not at All Likely 2. A Little Likely 3. Somewhat Likely 4. Likely 5. Very Likely 8. Cheat on a test at school?
1. Not at All Likely 2. A Little Likely 3. Somewhat Likely 4. Likely 5. Very Likely 9. Steal something from a store?
1. Not at All Likely 2. A Little Likely 3. Somewhat Likely 4. Likely 5. Very Likely 10. Drink alcohol?
1. Not at All Likely 2. A Little Likely 3. Somewhat Likely 4. Likely 5. Very Likely
495
This document is a research report submitted to the U.S. Department of Justice. This report has not been published by the Department. Opinions or points of view expressed are those of the author(s)
and do not necessarily reflect the official position or policies of the U.S. Department of Justice.
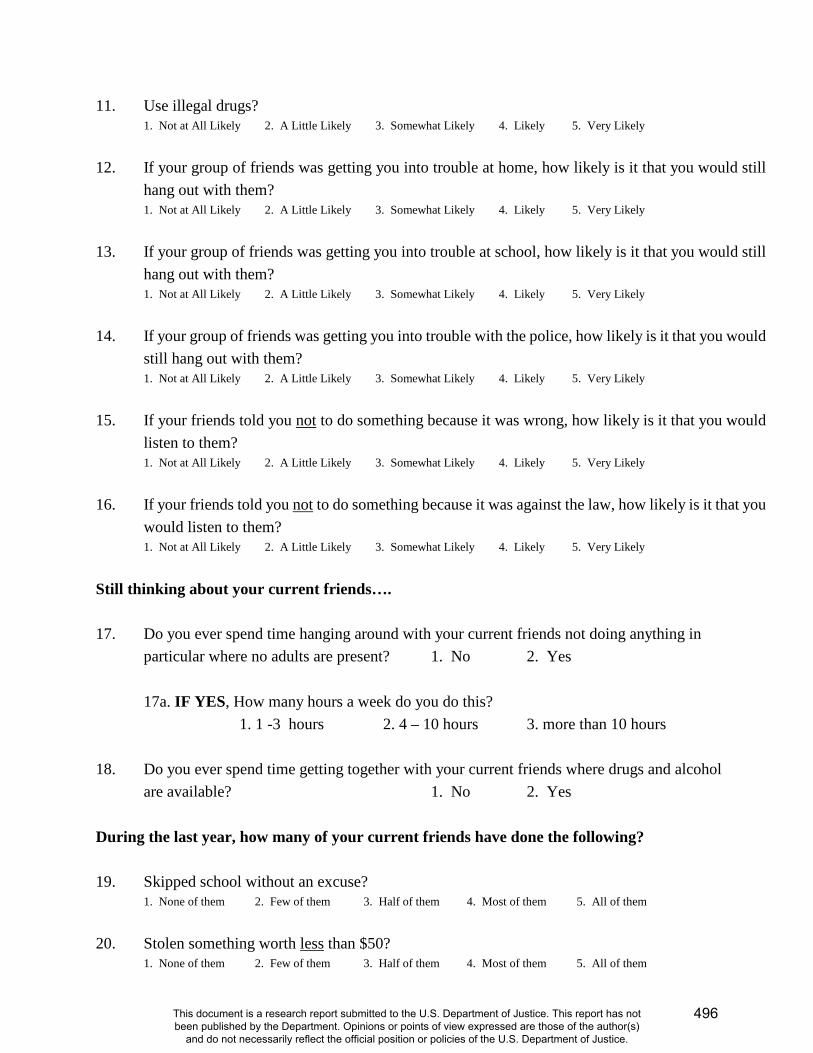
11. Use illegal drugs? 1. Not at All Likely 2. A Little Likely 3. Somewhat Likely 4. Likely 5. Very Likely
12. If your group of friends was getting you into trouble at home, how likely is it that you would still
hang out with them? 1. Not at All Likely 2. A Little Likely 3. Somewhat Likely 4. Likely 5. Very Likely
13. If your group of friends was getting you into trouble at school, how likely is it that you would still
hang out with them? 1. Not at All Likely 2. A Little Likely 3. Somewhat Likely 4. Likely 5. Very Likely
14. If your group of friends was getting you into trouble with the police, how likely is it that you would
still hang out with them? 1. Not at All Likely 2. A Little Likely 3. Somewhat Likely 4. Likely 5. Very Likely
15. If your friends told you not to do something because it was wrong, how likely is it that you would
listen to them? 1. Not at All Likely 2. A Little Likely 3. Somewhat Likely 4. Likely 5. Very Likely
16. If your friends told you not to do something because it was against the law, how likely is it that you
would listen to them? 1. Not at All Likely 2. A Little Likely 3. Somewhat Likely 4. Likely 5. Very Likely
Still thinking about your current friends…. 17. Do you ever spend time hanging around with your current friends not doing anything in particular where no adults are present? 1. No 2. Yes 17a. IF YES, How many hours a week do you do this?
1. 1 -3 hours 2. 4 – 10 hours 3. more than 10 hours 18. Do you ever spend time getting together with your current friends where drugs and alcohol are available? 1. No 2. Yes During the last year, how many of your current friends have done the following? 19. Skipped school without an excuse?
1. None of them 2. Few of them 3. Half of them 4. Most of them 5. All of them 20. Stolen something worth less than $50?
1. None of them 2. Few of them 3. Half of them 4. Most of them 5. All of them
496
This document is a research report submitted to the U.S. Department of Justice. This report has not been published by the Department. Opinions or points of view expressed are those of the author(s)
and do not necessarily reflect the official position or policies of the U.S. Department of Justice.
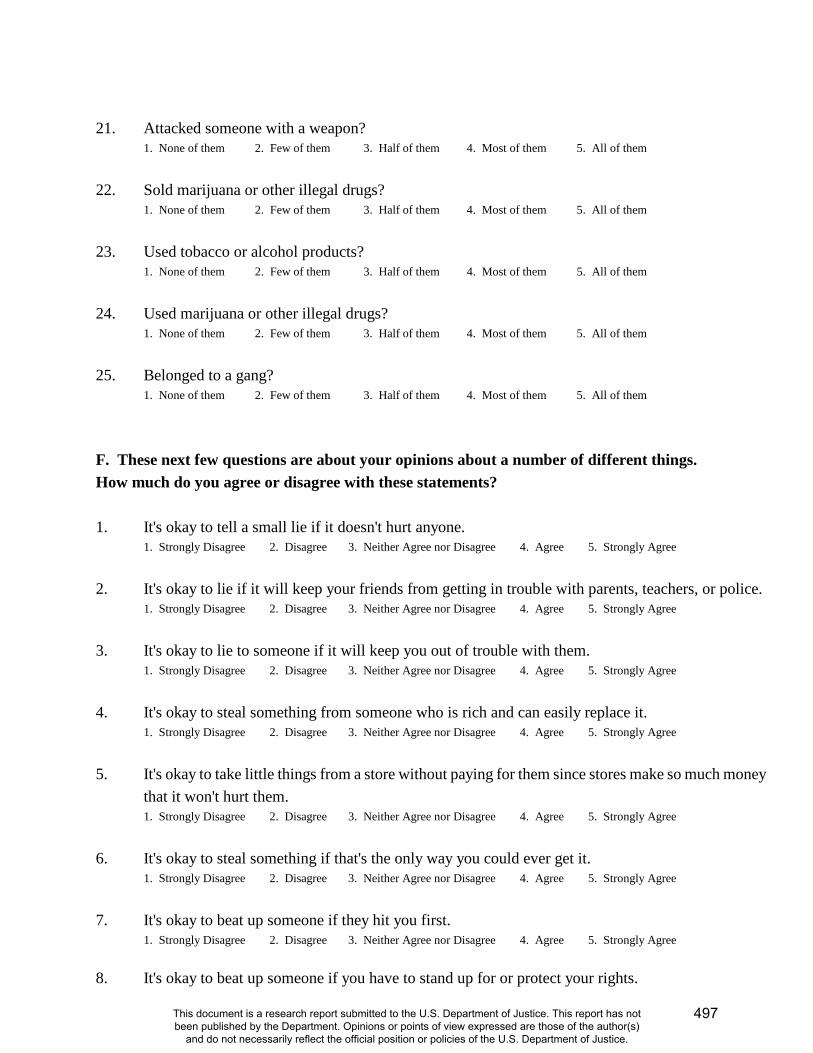
21. Attacked someone with a weapon?
1. None of them 2. Few of them 3. Half of them 4. Most of them 5. All of them 22. Sold marijuana or other illegal drugs?
1. None of them 2. Few of them 3. Half of them 4. Most of them 5. All of them 23. Used tobacco or alcohol products?
1. None of them 2. Few of them 3. Half of them 4. Most of them 5. All of them 24. Used marijuana or other illegal drugs?
1. None of them 2. Few of them 3. Half of them 4. Most of them 5. All of them
25. Belonged to a gang?
1. None of them 2. Few of them 3. Half of them 4. Most of them 5. All of them
F. These next few questions are about your opinions about a number of different things. How much do you agree or disagree with these statements? 1. It's okay to tell a small lie if it doesn't hurt anyone.
1. Strongly Disagree 2. Disagree 3. Neither Agree nor Disagree 4. Agree 5. Strongly Agree 2. It's okay to lie if it will keep your friends from getting in trouble with parents, teachers, or police.
1. Strongly Disagree 2. Disagree 3. Neither Agree nor Disagree 4. Agree 5. Strongly Agree 3. It's okay to lie to someone if it will keep you out of trouble with them.
1. Strongly Disagree 2. Disagree 3. Neither Agree nor Disagree 4. Agree 5. Strongly Agree 4. It's okay to steal something from someone who is rich and can easily replace it.
1. Strongly Disagree 2. Disagree 3. Neither Agree nor Disagree 4. Agree 5. Strongly Agree 5. It's okay to take little things from a store without paying for them since stores make so much money
that it won't hurt them. 1. Strongly Disagree 2. Disagree 3. Neither Agree nor Disagree 4. Agree 5. Strongly Agree
6. It's okay to steal something if that's the only way you could ever get it.
1. Strongly Disagree 2. Disagree 3. Neither Agree nor Disagree 4. Agree 5. Strongly Agree 7. It's okay to beat up someone if they hit you first.
1. Strongly Disagree 2. Disagree 3. Neither Agree nor Disagree 4. Agree 5. Strongly Agree 8. It's okay to beat up someone if you have to stand up for or protect your rights.
497
This document is a research report submitted to the U.S. Department of Justice. This report has not been published by the Department. Opinions or points of view expressed are those of the author(s)
and do not necessarily reflect the official position or policies of the U.S. Department of Justice.

1. Strongly Disagree 2. Disagree 3. Neither Agree nor Disagree 4. Agree 5. Strongly Agree
9. It's okay to beat up someone if they are threatening to hurt your friends or family.
1. Strongly Disagree 2. Disagree 3. Neither Agree nor Disagree 4. Agree 5. Strongly Agree
These next few questions are about school. 10. Homework is a waste of time.
1. Strongly Disagree 2. Disagree 3. Neither Agree nor Disagree 4. Agree 5. Strongly Agree 11. I try hard in school.
1. Strongly Disagree 2. Disagree 3. Neither Agree nor Disagree 4. Agree 5. Strongly Agree 12. Education is so important that it's worth it to put up with things about school that I don't like.
1. Strongly Disagree 2. Disagree 3. Neither Agree nor Disagree 4. Agree 5. Strongly Agree 13. In general, I like school.
1. Strongly Disagree 2. Disagree 3. Neither Agree nor Disagree 4. Agree 5. Strongly Agree 14. Grades are very important to me.
1. Strongly Disagree 2. Disagree 3. Neither Agree nor Disagree 4. Agree 5. Strongly Agree 15. I usually finish my homework.
1. Strongly Disagree 2. Disagree 3. Neither Agree nor Disagree 4. Agree 5. Strongly Agree 16. If you had to choose between studying to get a good grade on a test or going out with your friends,
which would you do? 1. Definitely Go with Friends 2. Probably Go with Friends 3. Uncertain 4. Probably Study 5. Definitely Study
For these next few questions, how guilty or how badly would you feel if you . . . 17. Skipped school without an excuse?
1. Not Very Guilty/Badly 2. Somewhat Guilty/Badly 3. Very Guilty/Badly 18. Stole something worth less than $50?
1. Not Very Guilty/Badly 2. Somewhat Guilty/Badly 3. Very Guilty/Badly 19. Attacked someone with a weapon?
1. Not Very Guilty/Badly 2. Somewhat Guilty/Badly 3. Very Guilty/Badly 20. Sold marijuana or other illegal drugs?
1. Not Very Guilty/Badly 2. Somewhat Guilty/Badly 3. Very Guilty/Badly
498
This document is a research report submitted to the U.S. Department of Justice. This report has not been published by the Department. Opinions or points of view expressed are those of the author(s)
and do not necessarily reflect the official position or policies of the U.S. Department of Justice.
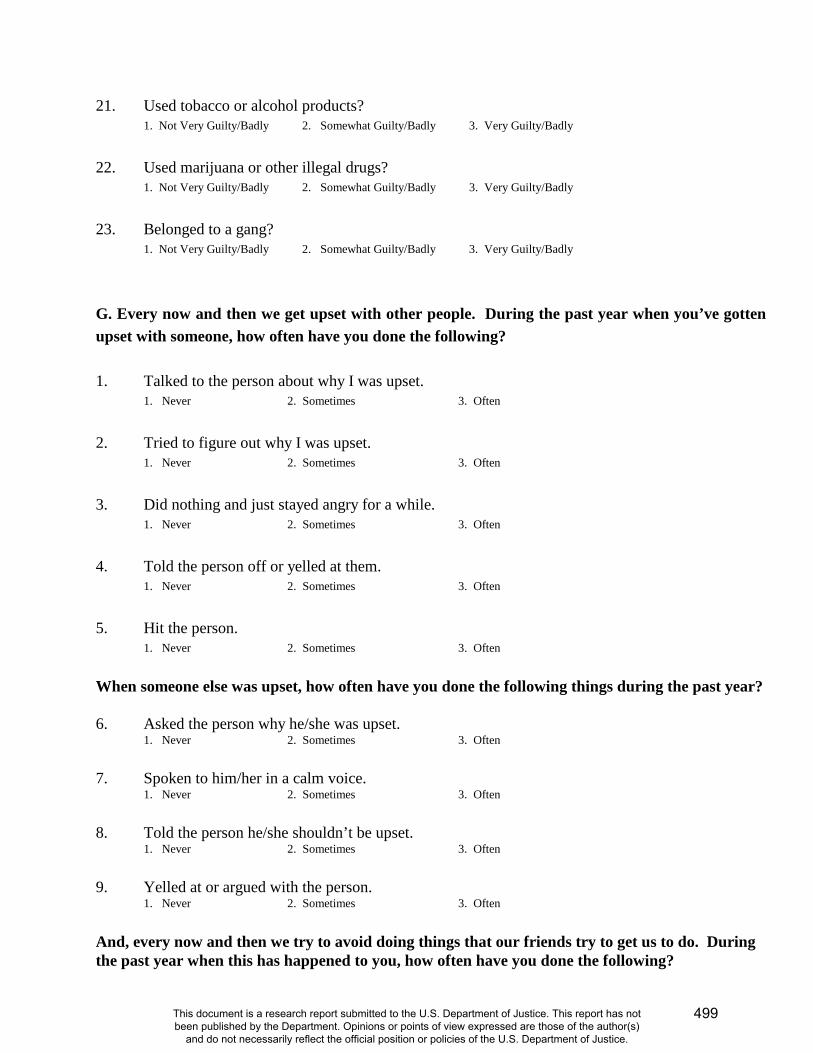
21. Used tobacco or alcohol products? 1. Not Very Guilty/Badly 2. Somewhat Guilty/Badly 3. Very Guilty/Badly
22. Used marijuana or other illegal drugs? 1. Not Very Guilty/Badly 2. Somewhat Guilty/Badly 3. Very Guilty/Badly
23. Belonged to a gang?
1. Not Very Guilty/Badly 2. Somewhat Guilty/Badly 3. Very Guilty/Badly G. Every now and then we get upset with other people. During the past year when you’ve gotten upset with someone, how often have you done the following? 1. Talked to the person about why I was upset.
1. Never 2. Sometimes 3. Often 2. Tried to figure out why I was upset.
1. Never 2. Sometimes 3. Often 3. Did nothing and just stayed angry for a while.
1. Never 2. Sometimes 3. Often 4. Told the person off or yelled at them.
1. Never 2. Sometimes 3. Often 5. Hit the person.
1. Never 2. Sometimes 3. Often When someone else was upset, how often have you done the following things during the past year? 6. Asked the person why he/she was upset.
1. Never 2. Sometimes 3. Often 7. Spoken to him/her in a calm voice.
1. Never 2. Sometimes 3. Often 8. Told the person he/she shouldn’t be upset.
1. Never 2. Sometimes 3. Often 9. Yelled at or argued with the person.
1. Never 2. Sometimes 3. Often And, every now and then we try to avoid doing things that our friends try to get us to do. During the past year when this has happened to you, how often have you done the following?
499
This document is a research report submitted to the U.S. Department of Justice. This report has not been published by the Department. Opinions or points of view expressed are those of the author(s)
and do not necessarily reflect the official position or policies of the U.S. Department of Justice.

10. Told the person that I can’t do it because my parents will get upset with me. 1. Never 2. Sometimes 3. Often
11. Tried to get out of it by saying I have other things to do.
1. Never 2. Sometimes 3. Often 12. Said no like I really meant it.
1. Never 2. Sometimes 3. Often 13. Ignored the person.
1. Never 2. Sometimes 3. Often
14. Just gone along with it. 1. Never 2. Sometimes 3. Often
H. During the past year, were you involved in the following activities? 1. School activities or athletics? 1. No 2. Yes
2. Community activities such as scouts or athletic leagues? 1. No 2. Yes
3. Religious activities? 1. No 2. Yes
4. Your own family activities? 1. No 2. Yes
5. In addition to activities such as those listed above, some people have a certain group of friends that they spend time with, doing things together or just hanging out. Do you have a group of friends like that? 1. No 2. Yes
If you have more than one such group, think about the one that is most important to you. If you do not have such a group of friends, please circle NA after each question. 6. About how many people, other than you, belong to this group?
1 2 - 5 6 - 10 11 - 20 21 - 50 51 – 100 more than 100 NA
7. Which of the following categories best describes this group? 1. All male 2. Mostly male 3. About half male, half female 4. Mostly female 5. All female NA
8. Which one of the following categories best describes the races/ethnicities of people in your group? 1. All are my race/ethnicity
2. Most are my race/ethnicity
3. About half are my race/ethnicity
4. Few are my race/ethnicity
5. I am the only one of my race/ethnicity
NA
9. Which one of the following best describes the ages of most of the people in your group?
500
This document is a research report submitted to the U.S. Department of Justice. This report has not been published by the Department. Opinions or points of view expressed are those of the author(s)
and do not necessarily reflect the official position or policies of the U.S. Department of Justice.
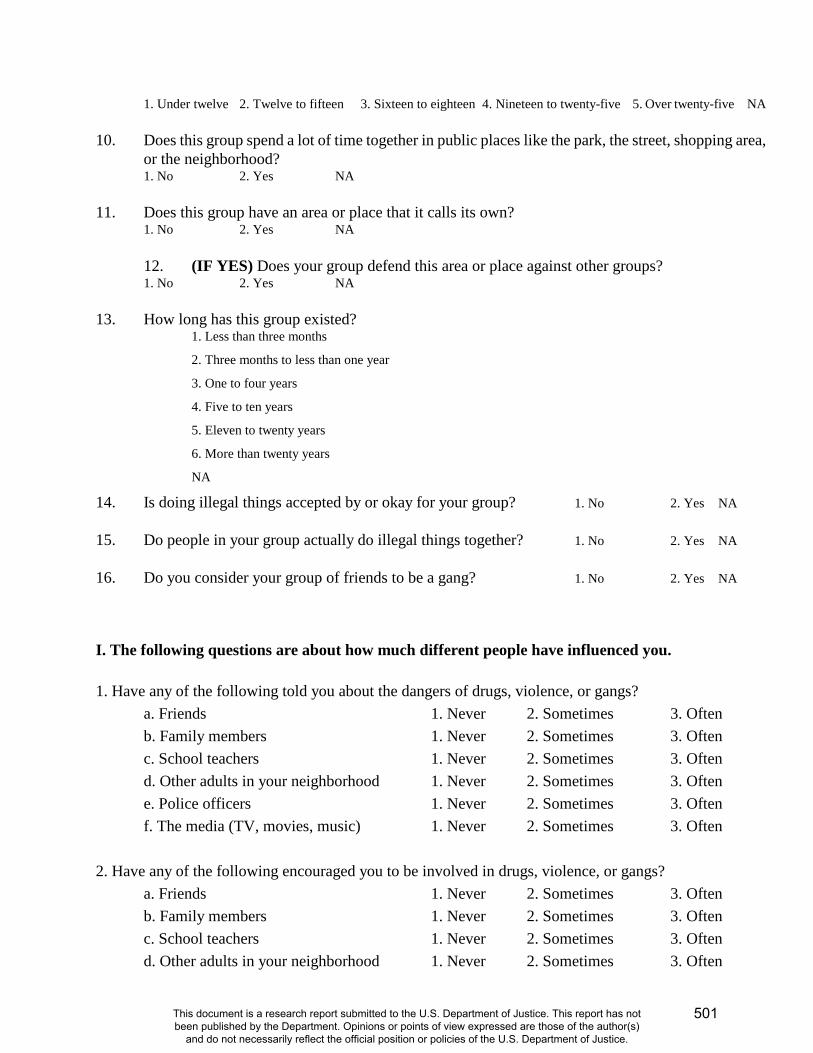
1. Under twelve 2. Twelve to fifteen 3. Sixteen to eighteen 4. Nineteen to twenty-five 5. Over twenty-five NA 10. Does this group spend a lot of time together in public places like the park, the street, shopping area,
or the neighborhood? 1. No 2. Yes NA
11. Does this group have an area or place that it calls its own? 1. No 2. Yes NA 12. (IF YES) Does your group defend this area or place against other groups?
1. No 2. Yes NA 13. How long has this group existed?
1. Less than three months
2. Three months to less than one year
3. One to four years
4. Five to ten years
5. Eleven to twenty years
6. More than twenty years
NA
14. Is doing illegal things accepted by or okay for your group? 1. No 2. Yes NA
15. Do people in your group actually do illegal things together? 1. No 2. Yes NA
16. Do you consider your group of friends to be a gang? 1. No 2. Yes NA I. The following questions are about how much different people have influenced you. 1. Have any of the following told you about the dangers of drugs, violence, or gangs?
a. Friends 1. Never 2. Sometimes 3. Often b. Family members 1. Never 2. Sometimes 3. Often c. School teachers 1. Never 2. Sometimes 3. Often d. Other adults in your neighborhood 1. Never 2. Sometimes 3. Often e. Police officers 1. Never 2. Sometimes 3. Often f. The media (TV, movies, music) 1. Never 2. Sometimes 3. Often
2. Have any of the following encouraged you to be involved in drugs, violence, or gangs?
a. Friends 1. Never 2. Sometimes 3. Often b. Family members 1. Never 2. Sometimes 3. Often c. School teachers 1. Never 2. Sometimes 3. Often d. Other adults in your neighborhood 1. Never 2. Sometimes 3. Often
501
This document is a research report submitted to the U.S. Department of Justice. This report has not been published by the Department. Opinions or points of view expressed are those of the author(s)
and do not necessarily reflect the official position or policies of the U.S. Department of Justice.
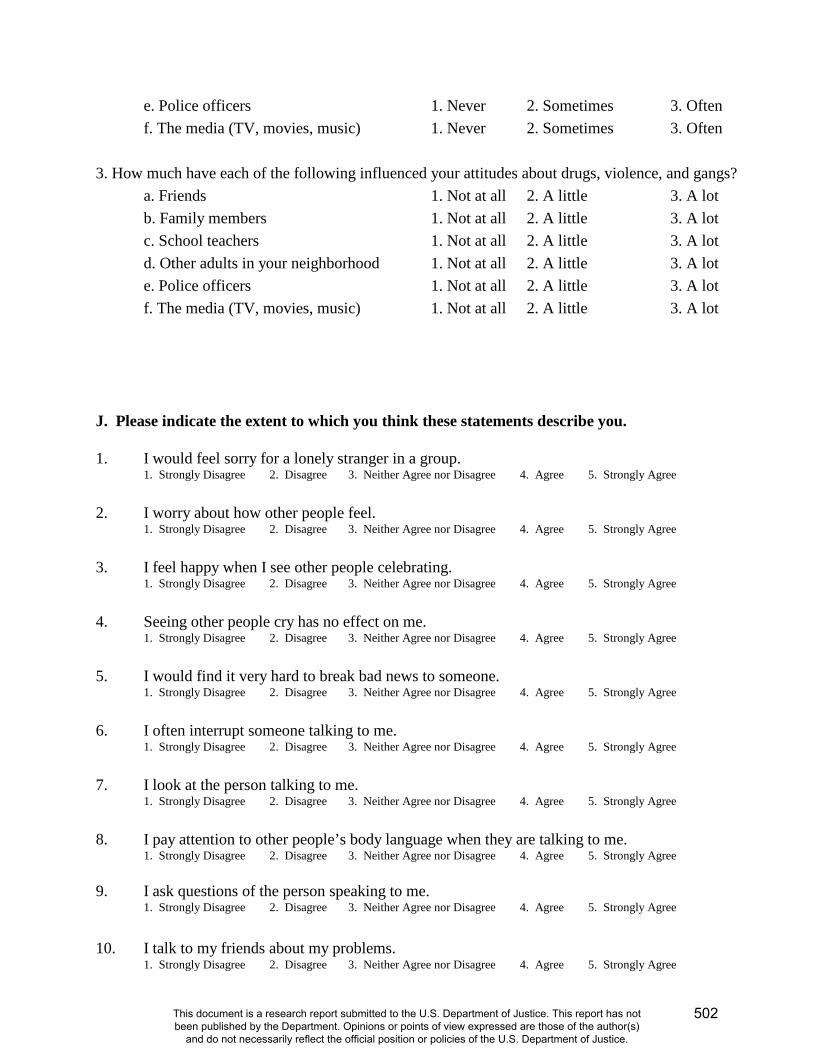
e. Police officers 1. Never 2. Sometimes 3. Often f. The media (TV, movies, music) 1. Never 2. Sometimes 3. Often
3. How much have each of the following influenced your attitudes about drugs, violence, and gangs?
a. Friends 1. Not at all 2. A little 3. A lot b. Family members 1. Not at all 2. A little 3. A lot c. School teachers 1. Not at all 2. A little 3. A lot d. Other adults in your neighborhood 1. Not at all 2. A little 3. A lot e. Police officers 1. Not at all 2. A little 3. A lot f. The media (TV, movies, music) 1. Not at all 2. A little 3. A lot
J. Please indicate the extent to which you think these statements describe you. 1. I would feel sorry for a lonely stranger in a group.
1. Strongly Disagree 2. Disagree 3. Neither Agree nor Disagree 4. Agree 5. Strongly Agree 2. I worry about how other people feel.
1. Strongly Disagree 2. Disagree 3. Neither Agree nor Disagree 4. Agree 5. Strongly Agree 3. I feel happy when I see other people celebrating.
1. Strongly Disagree 2. Disagree 3. Neither Agree nor Disagree 4. Agree 5. Strongly Agree 4. Seeing other people cry has no effect on me.
1. Strongly Disagree 2. Disagree 3. Neither Agree nor Disagree 4. Agree 5. Strongly Agree 5. I would find it very hard to break bad news to someone.
1. Strongly Disagree 2. Disagree 3. Neither Agree nor Disagree 4. Agree 5. Strongly Agree 6. I often interrupt someone talking to me.
1. Strongly Disagree 2. Disagree 3. Neither Agree nor Disagree 4. Agree 5. Strongly Agree 7. I look at the person talking to me.
1. Strongly Disagree 2. Disagree 3. Neither Agree nor Disagree 4. Agree 5. Strongly Agree 8. I pay attention to other people’s body language when they are talking to me.
1. Strongly Disagree 2. Disagree 3. Neither Agree nor Disagree 4. Agree 5. Strongly Agree 9. I ask questions of the person speaking to me.
1. Strongly Disagree 2. Disagree 3. Neither Agree nor Disagree 4. Agree 5. Strongly Agree 10. I talk to my friends about my problems.
1. Strongly Disagree 2. Disagree 3. Neither Agree nor Disagree 4. Agree 5. Strongly Agree
502
This document is a research report submitted to the U.S. Department of Justice. This report has not been published by the Department. Opinions or points of view expressed are those of the author(s)
and do not necessarily reflect the official position or policies of the U.S. Department of Justice.
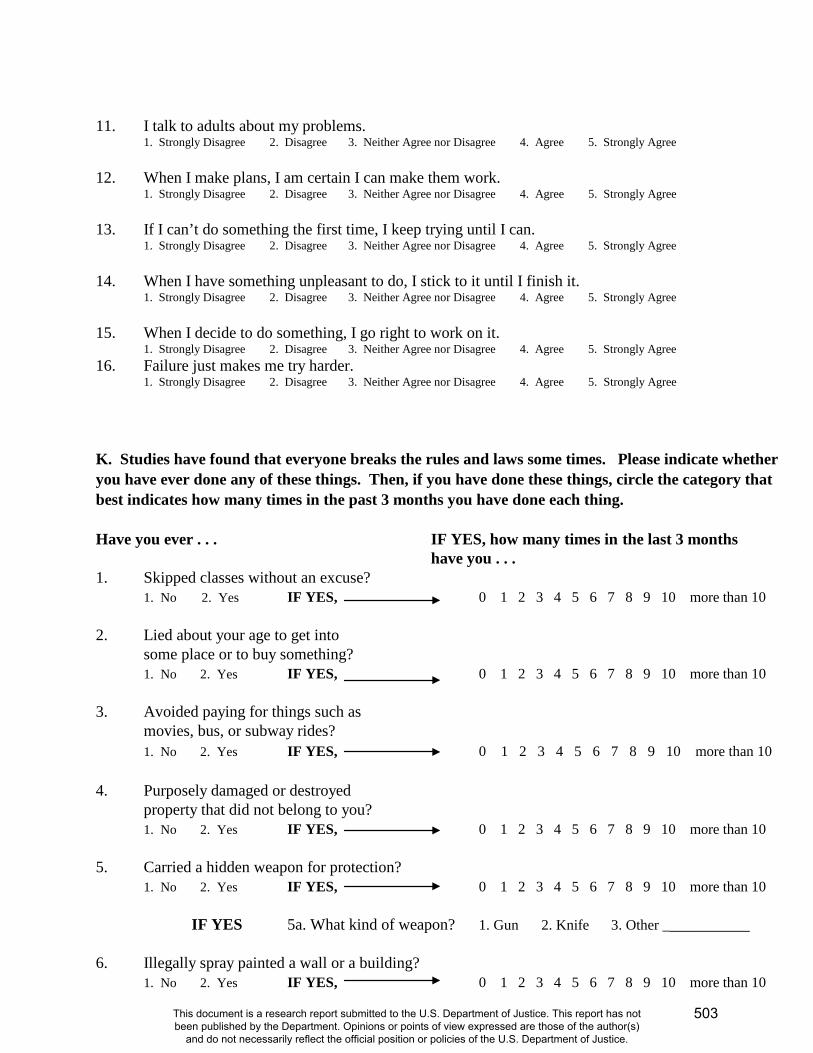
11. I talk to adults about my problems.
1. Strongly Disagree 2. Disagree 3. Neither Agree nor Disagree 4. Agree 5. Strongly Agree
12. When I make plans, I am certain I can make them work. 1. Strongly Disagree 2. Disagree 3. Neither Agree nor Disagree 4. Agree 5. Strongly Agree 13. If I can’t do something the first time, I keep trying until I can. 1. Strongly Disagree 2. Disagree 3. Neither Agree nor Disagree 4. Agree 5. Strongly Agree 14. When I have something unpleasant to do, I stick to it until I finish it.
1. Strongly Disagree 2. Disagree 3. Neither Agree nor Disagree 4. Agree 5. Strongly Agree 15. When I decide to do something, I go right to work on it.
1. Strongly Disagree 2. Disagree 3. Neither Agree nor Disagree 4. Agree 5. Strongly Agree 16. Failure just makes me try harder.
1. Strongly Disagree 2. Disagree 3. Neither Agree nor Disagree 4. Agree 5. Strongly Agree K. Studies have found that everyone breaks the rules and laws some times. Please indicate whether you have ever done any of these things. Then, if you have done these things, circle the category that best indicates how many times in the past 3 months you have done each thing. Have you ever . . . IF YES, how many times in the last 3 months
have you . . . 1. Skipped classes without an excuse? 1. No 2. Yes IF YES, 0 1 2 3 4 5 6 7 8 9 10 more than 10 2. Lied about your age to get into some place or to buy something? 1. No 2. Yes IF YES, 0 1 2 3 4 5 6 7 8 9 10 more than 10 3. Avoided paying for things such as movies, bus, or subway rides? 1. No 2. Yes IF YES, 0 1 2 3 4 5 6 7 8 9 10 more than 10 4. Purposely damaged or destroyed property that did not belong to you? 1. No 2. Yes IF YES, 0 1 2 3 4 5 6 7 8 9 10 more than 10 5. Carried a hidden weapon for protection? 1. No 2. Yes IF YES, 0 1 2 3 4 5 6 7 8 9 10 more than 10 IF YES 5a. What kind of weapon? 1. Gun 2. Knife 3. Other ___________ 6. Illegally spray painted a wall or a building? 1. No 2. Yes IF YES, 0 1 2 3 4 5 6 7 8 9 10 more than 10
503
This document is a research report submitted to the U.S. Department of Justice. This report has not been published by the Department. Opinions or points of view expressed are those of the author(s)
and do not necessarily reflect the official position or policies of the U.S. Department of Justice.
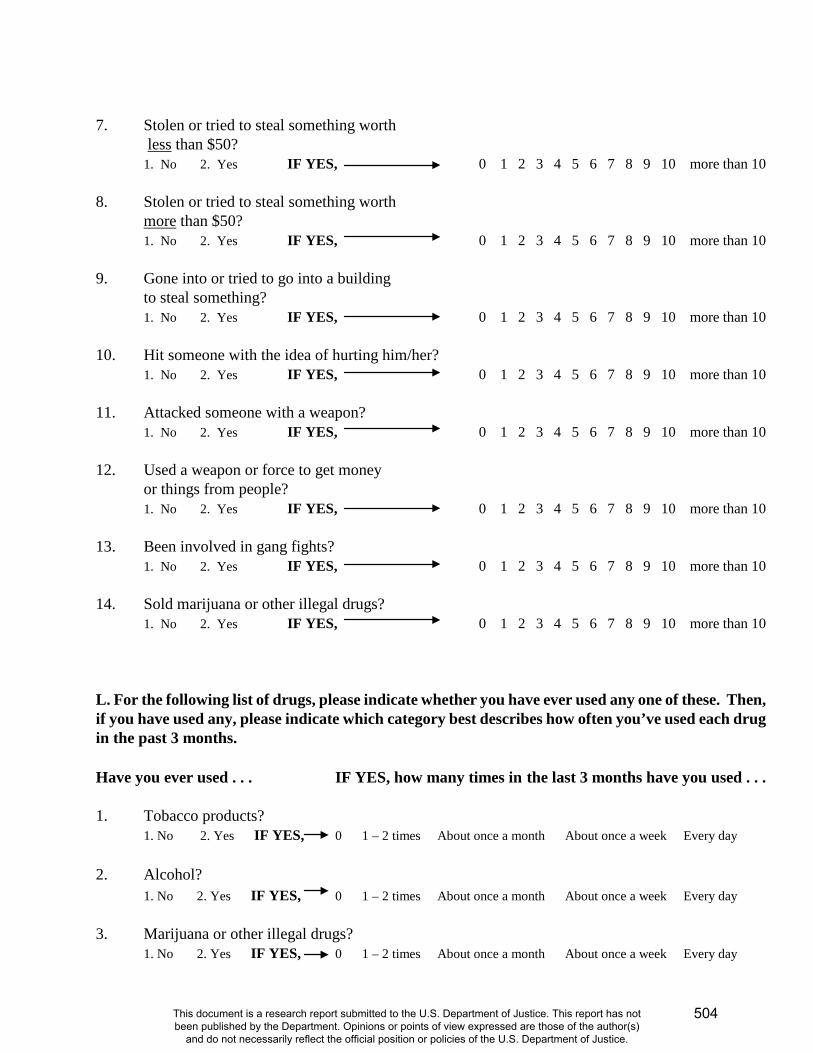
7. Stolen or tried to steal something worth less than $50? 1. No 2. Yes IF YES, 0 1 2 3 4 5 6 7 8 9 10 more than 10 8. Stolen or tried to steal something worth more than $50? 1. No 2. Yes IF YES, 0 1 2 3 4 5 6 7 8 9 10 more than 10 9. Gone into or tried to go into a building to steal something? 1. No 2. Yes IF YES, 0 1 2 3 4 5 6 7 8 9 10 more than 10 10. Hit someone with the idea of hurting him/her? 1. No 2. Yes IF YES, 0 1 2 3 4 5 6 7 8 9 10 more than 10 11. Attacked someone with a weapon? 1. No 2. Yes IF YES, 0 1 2 3 4 5 6 7 8 9 10 more than 10 12. Used a weapon or force to get money or things from people? 1. No 2. Yes IF YES, 0 1 2 3 4 5 6 7 8 9 10 more than 10 13. Been involved in gang fights? 1. No 2. Yes IF YES, 0 1 2 3 4 5 6 7 8 9 10 more than 10 14. Sold marijuana or other illegal drugs? 1. No 2. Yes IF YES, 0 1 2 3 4 5 6 7 8 9 10 more than 10 L. For the following list of drugs, please indicate whether you have ever used any one of these. Then, if you have used any, please indicate which category best describes how often you’ve used each drug in the past 3 months. Have you ever used . . . IF YES, how many times in the last 3 months have you used . . . 1. Tobacco products? 1. No 2. Yes IF YES, 0 1 – 2 times About once a month About once a week Every day 2. Alcohol? 1. No 2. Yes IF YES, 0 1 – 2 times About once a month About once a week Every day 3. Marijuana or other illegal drugs? 1. No 2. Yes IF YES, 0 1 – 2 times About once a month About once a week Every day
504
This document is a research report submitted to the U.S. Department of Justice. This report has not been published by the Department. Opinions or points of view expressed are those of the author(s)
and do not necessarily reflect the official position or policies of the U.S. Department of Justice.
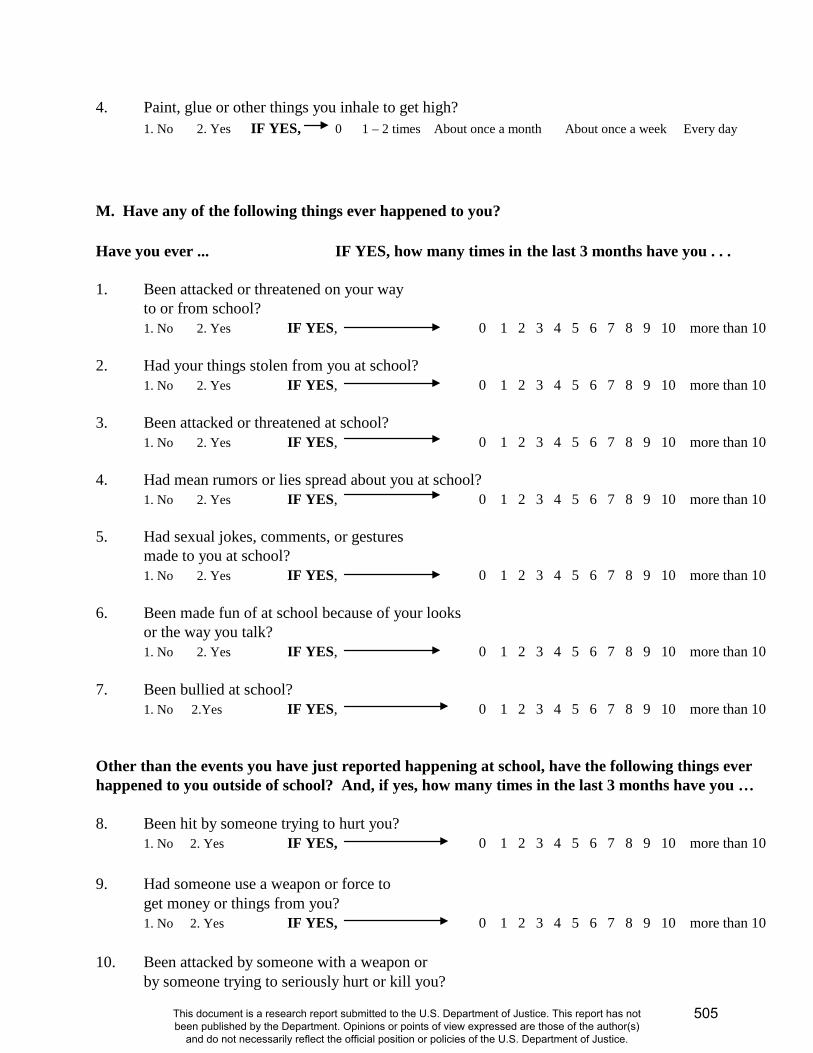
4. Paint, glue or other things you inhale to get high? 1. No 2. Yes IF YES, 0 1 – 2 times About once a month About once a week Every day M. Have any of the following things ever happened to you? Have you ever ... IF YES, how many times in the last 3 months have you . . . 1. Been attacked or threatened on your way to or from school? 1. No 2. Yes IF YES, 0 1 2 3 4 5 6 7 8 9 10 more than 10 2. Had your things stolen from you at school? 1. No 2. Yes IF YES, 0 1 2 3 4 5 6 7 8 9 10 more than 10 3. Been attacked or threatened at school? 1. No 2. Yes IF YES, 0 1 2 3 4 5 6 7 8 9 10 more than 10 4. Had mean rumors or lies spread about you at school? 1. No 2. Yes IF YES, 0 1 2 3 4 5 6 7 8 9 10 more than 10 5. Had sexual jokes, comments, or gestures made to you at school? 1. No 2. Yes IF YES, 0 1 2 3 4 5 6 7 8 9 10 more than 10 6. Been made fun of at school because of your looks or the way you talk? 1. No 2. Yes IF YES, 0 1 2 3 4 5 6 7 8 9 10 more than 10 7. Been bullied at school? 1. No 2.Yes IF YES, 0 1 2 3 4 5 6 7 8 9 10 more than 10 Other than the events you have just reported happening at school, have the following things ever happened to you outside of school? And, if yes, how many times in the last 3 months have you … 8. Been hit by someone trying to hurt you? 1. No 2. Yes IF YES, 0 1 2 3 4 5 6 7 8 9 10 more than 10 9. Had someone use a weapon or force to get money or things from you? 1. No 2. Yes IF YES, 0 1 2 3 4 5 6 7 8 9 10 more than 10 10. Been attacked by someone with a weapon or by someone trying to seriously hurt or kill you?
505
This document is a research report submitted to the U.S. Department of Justice. This report has not been published by the Department. Opinions or points of view expressed are those of the author(s)
and do not necessarily reflect the official position or policies of the U.S. Department of Justice.
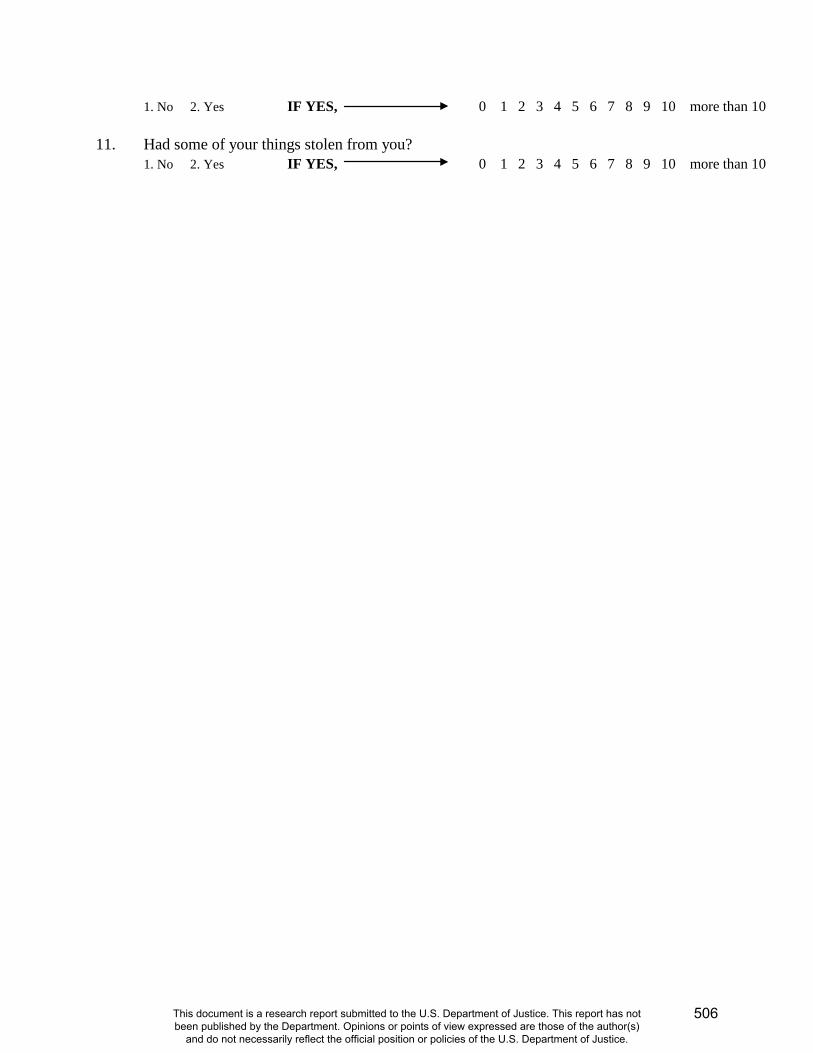
1. No 2. Yes IF YES, 0 1 2 3 4 5 6 7 8 9 10 more than 10 11. Had some of your things stolen from you? 1. No 2. Yes IF YES, 0 1 2 3 4 5 6 7 8 9 10 more than 10
506
This document is a research report submitted to the U.S. Department of Justice. This report has not been published by the Department. Opinions or points of view expressed are those of the author(s)
and do not necessarily reflect the official position or policies of the U.S. Department of Justice.
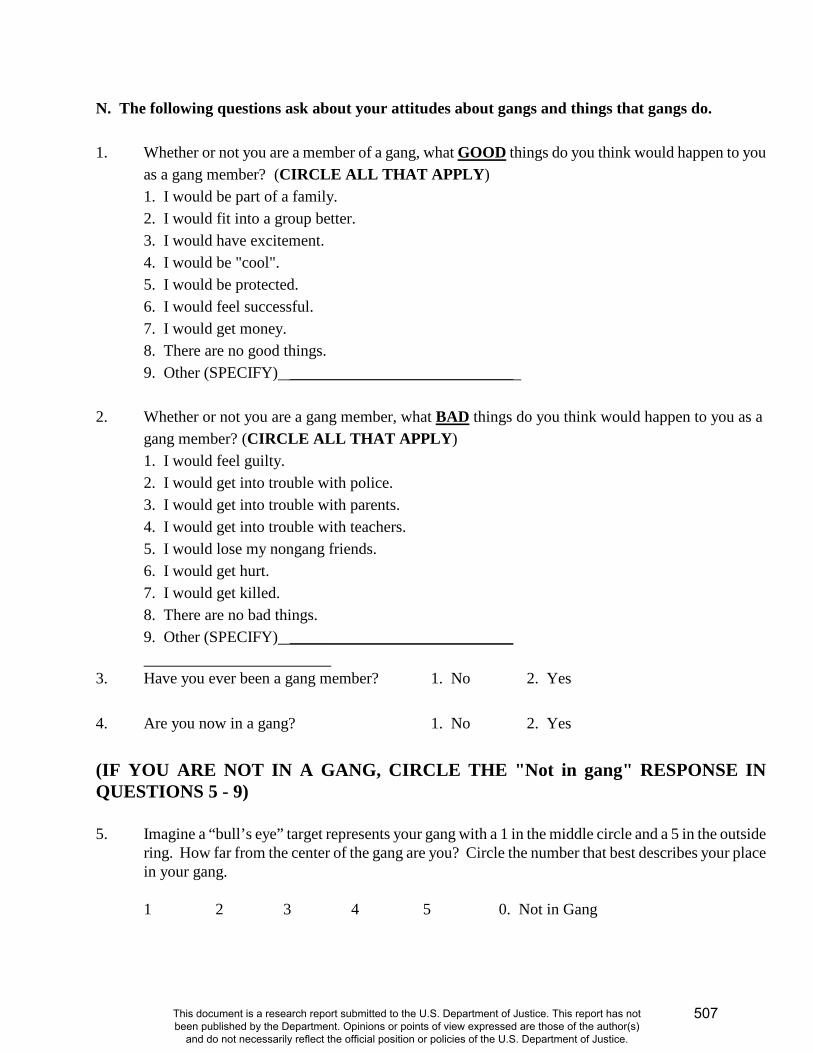
N. The following questions ask about your attitudes about gangs and things that gangs do. 1. Whether or not you are a member of a gang, what GOOD things do you think would happen to you
as a gang member? (CIRCLE ALL THAT APPLY) 1. I would be part of a family. 2. I would fit into a group better. 3. I would have excitement. 4. I would be "cool". 5. I would be protected. 6. I would feel successful. 7. I would get money. 8. There are no good things. 9. Other (SPECIFY) ____________________________
2. Whether or not you are a gang member, what BAD things do you think would happen to you as a
gang member? (CIRCLE ALL THAT APPLY) 1. I would feel guilty. 2. I would get into trouble with police. 3. I would get into trouble with parents. 4. I would get into trouble with teachers. 5. I would lose my nongang friends. 6. I would get hurt. 7. I would get killed. 8. There are no bad things. 9. Other (SPECIFY) ____________________________
3. Have you ever been a gang member? 1. No 2. Yes 4. Are you now in a gang? 1. No 2. Yes (IF YOU ARE NOT IN A GANG, CIRCLE THE "Not in gang" RESPONSE IN QUESTIONS 5 - 9) 5. Imagine a “bull’s eye” target represents your gang with a 1 in the middle circle and a 5 in the outside
ring. How far from the center of the gang are you? Circle the number that best describes your place in your gang.
1 2 3 4 5 0. Not in Gang
507
This document is a research report submitted to the U.S. Department of Justice. This report has not been published by the Department. Opinions or points of view expressed are those of the author(s)
and do not necessarily reflect the official position or policies of the U.S. Department of Justice.
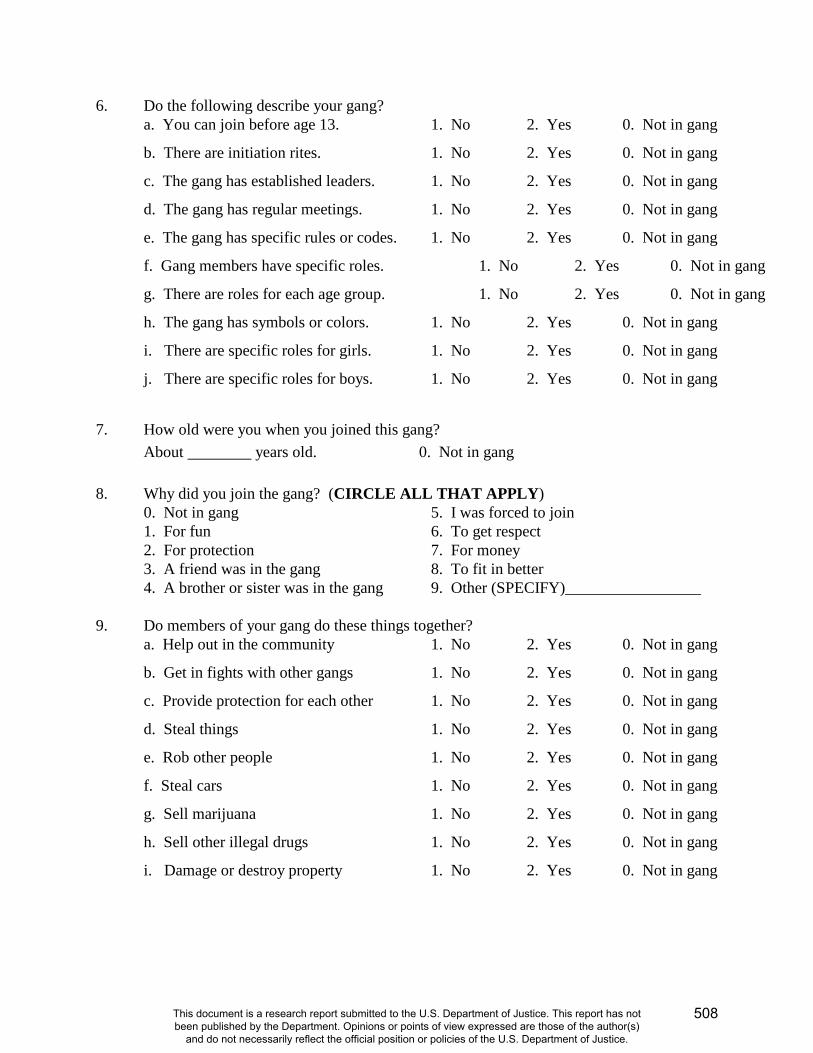
6. Do the following describe your gang? a. You can join before age 13. 1. No 2. Yes 0. Not in gang
b. There are initiation rites. 1. No 2. Yes 0. Not in gang
c. The gang has established leaders. 1. No 2. Yes 0. Not in gang
d. The gang has regular meetings. 1. No 2. Yes 0. Not in gang
e. The gang has specific rules or codes. 1. No 2. Yes 0. Not in gang
f. Gang members have specific roles. 1. No 2. Yes 0. Not in gang
g. There are roles for each age group. 1. No 2. Yes 0. Not in gang
h. The gang has symbols or colors. 1. No 2. Yes 0. Not in gang
i. There are specific roles for girls. 1. No 2. Yes 0. Not in gang
j. There are specific roles for boys. 1. No 2. Yes 0. Not in gang
7. How old were you when you joined this gang?
About years old. 0. Not in gang 8. Why did you join the gang? (CIRCLE ALL THAT APPLY)
0. Not in gang 5. I was forced to join 1. For fun 6. To get respect 2. For protection 7. For money 3. A friend was in the gang 8. To fit in better 4. A brother or sister was in the gang 9. Other (SPECIFY)_________________
9. Do members of your gang do these things together? a. Help out in the community 1. No 2. Yes 0. Not in gang
b. Get in fights with other gangs 1. No 2. Yes 0. Not in gang
c. Provide protection for each other 1. No 2. Yes 0. Not in gang
d. Steal things 1. No 2. Yes 0. Not in gang
e. Rob other people 1. No 2. Yes 0. Not in gang
f. Steal cars 1. No 2. Yes 0. Not in gang
g. Sell marijuana 1. No 2. Yes 0. Not in gang
h. Sell other illegal drugs 1. No 2. Yes 0. Not in gang
i. Damage or destroy property 1. No 2. Yes 0. Not in gang
508
This document is a research report submitted to the U.S. Department of Justice. This report has not been published by the Department. Opinions or points of view expressed are those of the author(s)
and do not necessarily reflect the official position or policies of the U.S. Department of Justice.
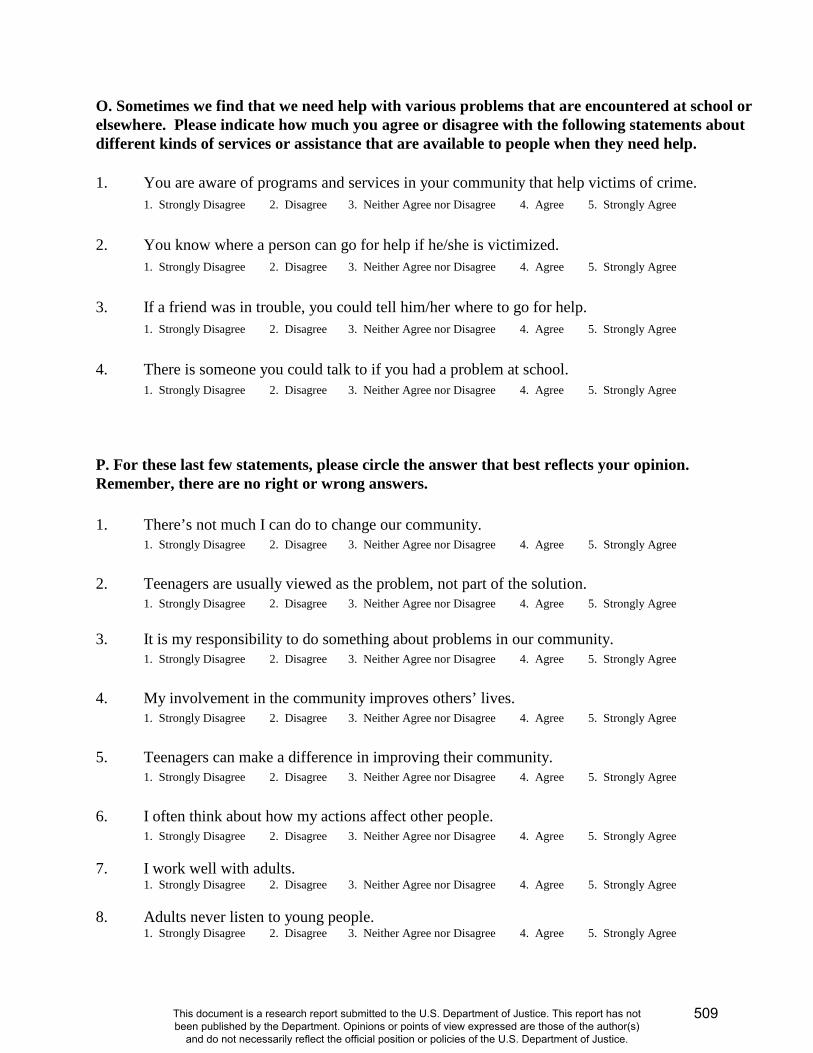
O. Sometimes we find that we need help with various problems that are encountered at school or elsewhere. Please indicate how much you agree or disagree with the following statements about different kinds of services or assistance that are available to people when they need help. 1. You are aware of programs and services in your community that help victims of crime. 1. Strongly Disagree 2. Disagree 3. Neither Agree nor Disagree 4. Agree 5. Strongly Agree
2. You know where a person can go for help if he/she is victimized. 1. Strongly Disagree 2. Disagree 3. Neither Agree nor Disagree 4. Agree 5. Strongly Agree
3. If a friend was in trouble, you could tell him/her where to go for help. 1. Strongly Disagree 2. Disagree 3. Neither Agree nor Disagree 4. Agree 5. Strongly Agree
4. There is someone you could talk to if you had a problem at school. 1. Strongly Disagree 2. Disagree 3. Neither Agree nor Disagree 4. Agree 5. Strongly Agree
P. For these last few statements, please circle the answer that best reflects your opinion. Remember, there are no right or wrong answers. 1. There’s not much I can do to change our community. 1. Strongly Disagree 2. Disagree 3. Neither Agree nor Disagree 4. Agree 5. Strongly Agree 2. Teenagers are usually viewed as the problem, not part of the solution. 1. Strongly Disagree 2. Disagree 3. Neither Agree nor Disagree 4. Agree 5. Strongly Agree 3. It is my responsibility to do something about problems in our community. 1. Strongly Disagree 2. Disagree 3. Neither Agree nor Disagree 4. Agree 5. Strongly Agree 4. My involvement in the community improves others’ lives. 1. Strongly Disagree 2. Disagree 3. Neither Agree nor Disagree 4. Agree 5. Strongly Agree 5. Teenagers can make a difference in improving their community. 1. Strongly Disagree 2. Disagree 3. Neither Agree nor Disagree 4. Agree 5. Strongly Agree 6. I often think about how my actions affect other people. 1. Strongly Disagree 2. Disagree 3. Neither Agree nor Disagree 4. Agree 5. Strongly Agree 7. I work well with adults. 1. Strongly Disagree 2. Disagree 3. Neither Agree nor Disagree 4. Agree 5. Strongly Agree 8. Adults never listen to young people. 1. Strongly Disagree 2. Disagree 3. Neither Agree nor Disagree 4. Agree 5. Strongly Agree
509
This document is a research report submitted to the U.S. Department of Justice. This report has not been published by the Department. Opinions or points of view expressed are those of the author(s)
and do not necessarily reflect the official position or policies of the U.S. Department of Justice.
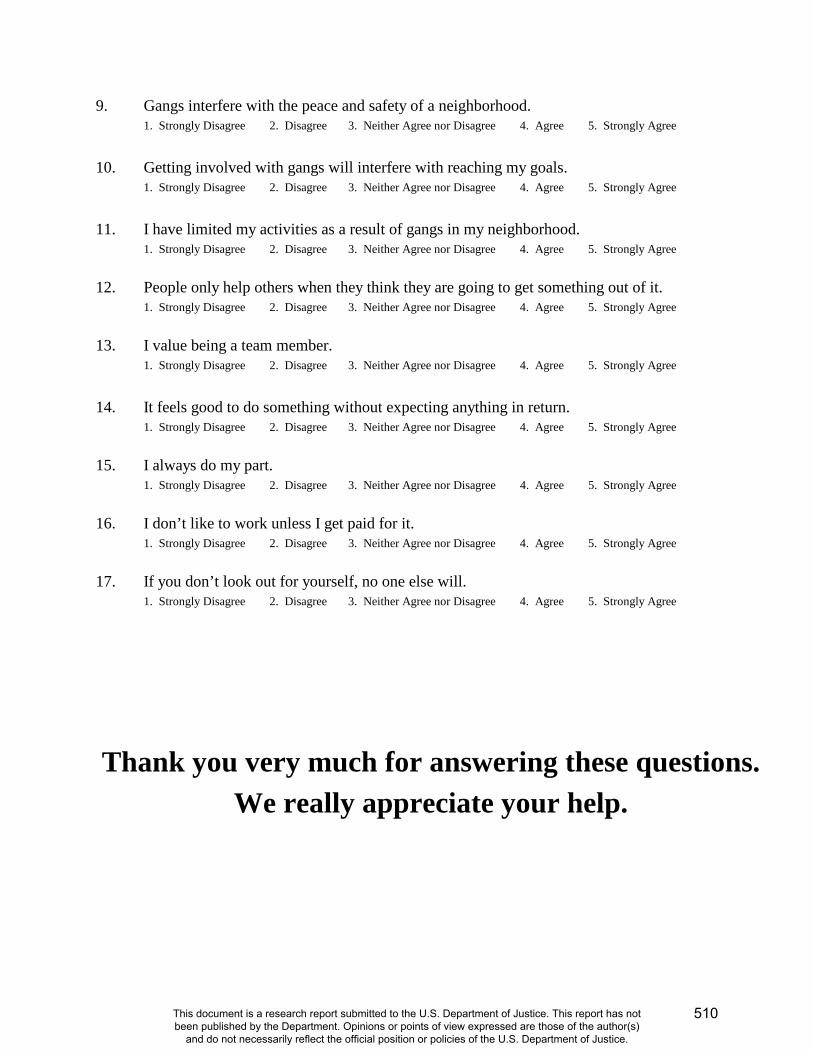
9. Gangs interfere with the peace and safety of a neighborhood. 1. Strongly Disagree 2. Disagree 3. Neither Agree nor Disagree 4. Agree 5. Strongly Agree
10. Getting involved with gangs will interfere with reaching my goals.
1. Strongly Disagree 2. Disagree 3. Neither Agree nor Disagree 4. Agree 5. Strongly Agree 11. I have limited my activities as a result of gangs in my neighborhood.
1. Strongly Disagree 2. Disagree 3. Neither Agree nor Disagree 4. Agree 5. Strongly Agree 12. People only help others when they think they are going to get something out of it.
1. Strongly Disagree 2. Disagree 3. Neither Agree nor Disagree 4. Agree 5. Strongly Agree 13. I value being a team member. 1. Strongly Disagree 2. Disagree 3. Neither Agree nor Disagree 4. Agree 5. Strongly Agree 14. It feels good to do something without expecting anything in return.
1. Strongly Disagree 2. Disagree 3. Neither Agree nor Disagree 4. Agree 5. Strongly Agree 15. I always do my part.
1. Strongly Disagree 2. Disagree 3. Neither Agree nor Disagree 4. Agree 5. Strongly Agree 16. I don’t like to work unless I get paid for it.
1. Strongly Disagree 2. Disagree 3. Neither Agree nor Disagree 4. Agree 5. Strongly Agree 17. If you don’t look out for yourself, no one else will.
1. Strongly Disagree 2. Disagree 3. Neither Agree nor Disagree 4. Agree 5. Strongly Agree
Thank you very much for answering these questions. We really appreciate your help.
510
This document is a research report submitted to the U.S. Department of Justice. This report has not been published by the Department. Opinions or points of view expressed are those of the author(s)
and do not necessarily reflect the official position or policies of the U.S. Department of Justice.
NATIONAL EVALUATION OF G.R.E.A.T.
STUDENT QUESTIONNAIRE
Wave 3
School Year 2007 - 2008
University of Missouri-St. Louis Department of Criminology and Criminal Justice
8001 Natural Bridge Road St. Louis, MO 63121
511
This document is a research report submitted to the U.S. Department of Justice. This report has not been published by the Department. Opinions or points of view expressed are those of the author(s)
and do not necessarily reflect the official position or policies of the U.S. Department of Justice.

INSTRUCTIONS 1. Please answer the questions in the order they appear. 2. Circle the number that shows your best answer to each question. 3. There are no right or wrong answers. Your opinion is what counts. 4. Do NOT write your name on the questionnaire. 5. Your answers are CONFIDENTIAL - - no one outside of our research office will ever
connect your name with the answers you give. 6. You have the right to skip any question that you do not want to answer. 7. You can stop filling out the questionnaire any time you wish. WE HOPE YOU ENJOY ANSWERING THESE QUESTIONS
512
This document is a research report submitted to the U.S. Department of Justice. This report has not been published by the Department. Opinions or points of view expressed are those of the author(s)
and do not necessarily reflect the official position or policies of the U.S. Department of Justice.

Please provide the following information. Once you have completed this page, tear it out and hand it to one of the researchers. PLEASE PRINT Your Name:____________________________________________ (First) (Middle) (Last) Address: ______________________________________________ (Number) (Street) ______________________________________________________ (City) (State) (Zip Code) Today’s Date: ______________________________
513
This document is a research report submitted to the U.S. Department of Justice. This report has not been published by the Department. Opinions or points of view expressed are those of the author(s)
and do not necessarily reflect the official position or policies of the U.S. Department of Justice.
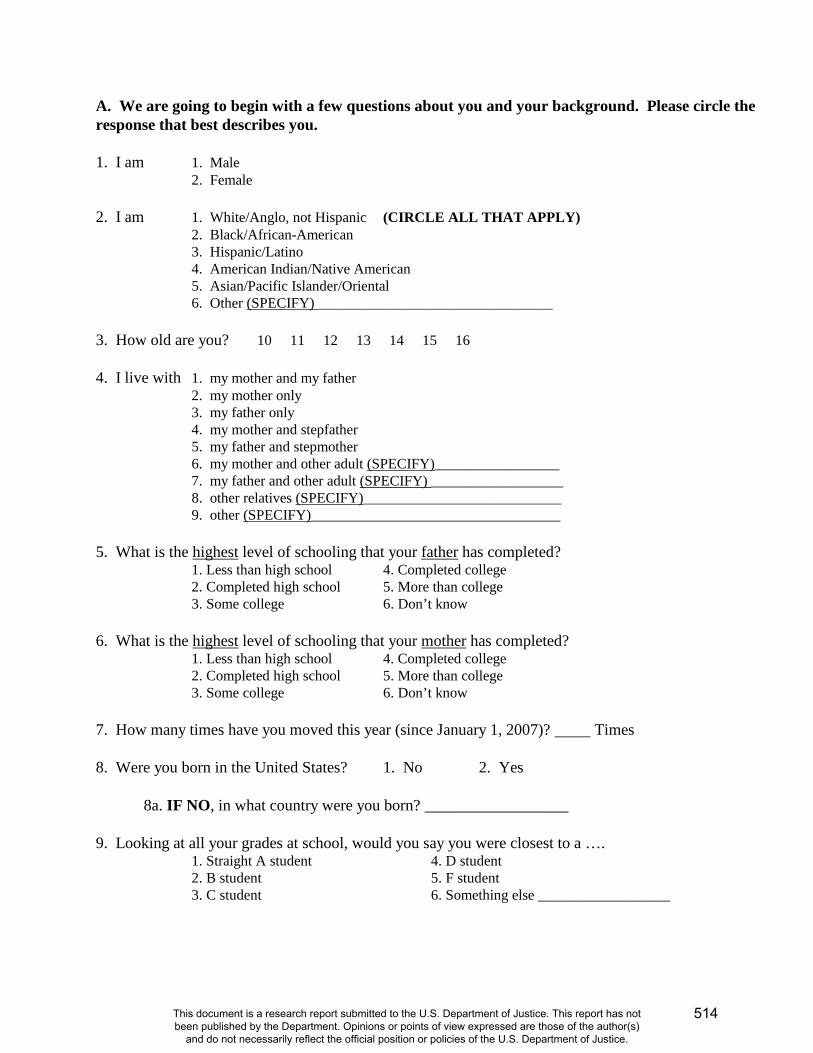
A. We are going to begin with a few questions about you and your background. Please circle the response that best describes you. 1. I am 1. Male 2. Female 2. I am 1. White/Anglo, not Hispanic (CIRCLE ALL THAT APPLY)
2. Black/African-American 3. Hispanic/Latino 4. American Indian/Native American 5. Asian/Pacific Islander/Oriental 6. Other (SPECIFY) ________________________________
3. How old are you? 10 11 12 13 14 15 16 4. I live with 1. my mother and my father
2. my mother only 3. my father only 4. my mother and stepfather 5. my father and stepmother 6. my mother and other adult (SPECIFY)_________________ 7. my father and other adult (SPECIFY) __________________ 8. other relatives (SPECIFY)___________________________ 9. other (SPECIFY)__________________________________
5. What is the highest level of schooling that your father has completed? 1. Less than high school 4. Completed college 2. Completed high school 5. More than college 3. Some college 6. Don’t know 6. What is the highest level of schooling that your mother has completed? 1. Less than high school 4. Completed college 2. Completed high school 5. More than college 3. Some college 6. Don’t know 7. How many times have you moved this year (since January 1, 2007)? Times 8. Were you born in the United States? 1. No 2. Yes
8a. IF NO, in what country were you born? __________________
9. Looking at all your grades at school, would you say you were closest to a …. 1. Straight A student 4. D student 2. B student 5. F student 3. C student 6. Something else __________________
514
This document is a research report submitted to the U.S. Department of Justice. This report has not been published by the Department. Opinions or points of view expressed are those of the author(s)
and do not necessarily reflect the official position or policies of the U.S. Department of Justice.

B. Much of our time is spent in schools and neighborhoods and these places affect how we feel about a lot of other things. Thinking about your school and neighborhood, please indicate how much of a problem each of the following is in your school and neighborhood. That is, are these things not a problem, somewhat of a problem, or a big problem? 1. Kids bullying or teasing other children at your school 1. Not a problem 2. Somewhat of a problem 3. A big problem 2. Places in your school where some students are afraid to go 1. Not a problem 2. Somewhat of a problem 3. A big problem 3. Students beating up or threatening other students at your school 1. Not a problem 2. Somewhat of a problem 3. A big problem 4. Kids of different racial or cultural groups at your school not getting along with each other 1. Not a problem 2. Somewhat of a problem 3. A big problem 5. Students bringing guns to school 1. Not a problem 2. Somewhat of a problem 3. A big problem 6. Having things stolen at school 1. Not a problem 2. Somewhat of a problem 3. A big problem 7. Run-down or poorly kept buildings in your neighborhood 1. Not a problem 2. Somewhat of a problem 3. A big problem 8. Groups of people hanging out in public places causing trouble in your neighborhood 1. Not a problem 2. Somewhat of a problem 3. A big problem 9. Graffiti on buildings and fences in your neighborhood 1. Not a problem 2. Somewhat of a problem 3. A big problem 10. Hearing gunshots in your neighborhood 1. Not a problem 2. Somewhat of a problem 3. A big problem 11. Cars traveling too fast throughout the streets of your neighborhood 1. Not a problem 2. Somewhat of a problem 3. A big problem 12. Gangs in your neighborhood 1. Not a problem 2. Somewhat of a problem 3. A big problem
515
This document is a research report submitted to the U.S. Department of Justice. This report has not been published by the Department. Opinions or points of view expressed are those of the author(s)
and do not necessarily reflect the official position or policies of the U.S. Department of Justice.

C. For the next set of statements, indicate how much you think these statements describe you. That is, how much do you agree or disagree with each statement? There are no right or wrong answers; it is your opinion that counts. 1. When I go someplace, I leave a note for my parents or call them to tell them where I am.
1. Strongly Disagree 2. Disagree 3. Neither Agree nor Disagree 4. Agree 5. Strongly Agree 2. My parents know where I am when I am not at home or at school.
1. Strongly Disagree 2. Disagree 3. Neither Agree nor Disagree 4. Agree 5. Strongly Agree 3. I know how to get in touch with my parents if they are not at home.
1. Strongly Disagree 2. Disagree 3. Neither Agree nor Disagree 4. Agree 5. Strongly Agree 4. My parents know who I am with if I am not at home.
1. Strongly Disagree 2. Disagree 3. Neither Agree nor Disagree 4. Agree 5. Strongly Agree 5. I often act without stopping to think.
1. Strongly Disagree 2. Disagree 3. Neither Agree nor Disagree 4. Agree 5. Strongly Agree 6. I don't devote much thought and effort to preparing for the future.
1. Strongly Disagree 2. Disagree 3. Neither Agree nor Disagree 4. Agree 5. Strongly Agree 7. I often do whatever brings me pleasure here and now, even at the cost of some distant goal.
1. Strongly Disagree 2. Disagree 3. Neither Agree nor Disagree 4. Agree 5. Strongly Agree 8. I'm more concerned with what happens to me in the short run than in the long run.
1. Strongly Disagree 2. Disagree 3. Neither Agree nor Disagree 4. Agree 5. Strongly Agree 9. I like to test myself every now and then by doing something a little risky.
1. Strongly Disagree 2. Disagree 3. Neither Agree nor Disagree 4. Agree 5. Strongly Agree 10. Sometimes I will take a risk just for the fun of it.
1. Strongly Disagree 2. Disagree 3. Neither Agree nor Disagree 4. Agree 5. Strongly Agree 11. I sometimes find it exciting to do things for which I might get in trouble.
1. Strongly Disagree 2. Disagree 3. Neither Agree nor Disagree 4. Agree 5. Strongly Agree 12. Excitement and adventure are more important to me than security.
1. Strongly Disagree 2. Disagree 3. Neither Agree nor Disagree 4. Agree 5. Strongly Agree 13. I lose my temper pretty easily.
1. Strongly Disagree 2. Disagree 3. Neither Agree nor Disagree 4. Agree 5. Strongly Agree
516
This document is a research report submitted to the U.S. Department of Justice. This report has not been published by the Department. Opinions or points of view expressed are those of the author(s)
and do not necessarily reflect the official position or policies of the U.S. Department of Justice.
14. Often when I’m angry at people, I feel more like hurting them than talking to them about why I am angry. 1. Strongly Disagree 2. Disagree 3. Neither Agree nor Disagree 4. Agree 5. Strongly Agree
15. When I’m really angry, other people better stay away from me. 1. Strongly Disagree 2. Disagree 3. Neither Agree nor Disagree 4. Agree 5. Strongly Agree
16. When I have a serious disagreement with someone, it’s usually hard for me to talk calmly about it
without getting upset. 1. Strongly Disagree 2. Disagree 3. Neither Agree nor Disagree 4. Agree 5. Strongly Agree
17. I try to look out for myself first, even if it means making things difficult for other people.
1. Strongly Disagree 2. Disagree 3. Neither Agree nor Disagree 4. Agree 5. Strongly Agree 18. I’m not very sympathetic to other people when they are having problems.
1. Strongly Disagree 2. Disagree 3. Neither Agree nor Disagree 4. Agree 5. Strongly Agree 19. If things I do upset people, it’s their problem not mine.
1. Strongly Disagree 2. Disagree 3. Neither Agree nor Disagree 4. Agree 5. Strongly Agree 20. I will try to get the things I want even when I know it’s causing problems for other people.
1. Strongly Disagree 2. Disagree 3. Neither Agree nor Disagree 4. Agree 5. Strongly Agree D. The next few statements are about your attitudes toward the police. 1. Police officers are honest.
1. Strongly Disagree 2. Disagree 3. Neither Agree nor Disagree 4. Agree 5. Strongly Agree 2. Police officers are hardworking.
1. Strongly Disagree 2. Disagree 3. Neither Agree nor Disagree 4. Agree 5. Strongly Agree 3. Most police officers are usually friendly.
1. Strongly Disagree 2. Disagree 3. Neither Agree nor Disagree 4. Agree 5. Strongly Agree 4. Police officers are usually courteous.
1. Strongly Disagree 2. Disagree 3. Neither Agree nor Disagree 4. Agree 5. Strongly Agree 5. Police officers are respectful toward people like me.
1. Strongly Disagree 2. Disagree 3. Neither Agree nor Disagree 4. Agree 5. Strongly Agree
517
This document is a research report submitted to the U.S. Department of Justice. This report has not been published by the Department. Opinions or points of view expressed are those of the author(s)
and do not necessarily reflect the official position or policies of the U.S. Department of Justice.

6. I feel safer when police officers are in my school. 1. Strongly Disagree 2. Disagree 3. Neither Agree nor Disagree 4. Agree 5. Strongly Agree
7. Police officers make good teachers.
1. Strongly Disagree 2. Disagree 3. Neither Agree nor Disagree 4. Agree 5. Strongly Agree 8. Police officers don't know much about gangs.
1. Strongly Disagree 2. Disagree 3. Neither Agree nor Disagree 4. Agree 5. Strongly Agree E. For the next set of questions, think about your current group of friends. During the last year, how many of your current friends have done the following? 1. Gotten along well with teachers and adults at school?
1. None of them 2. Few of them 3. Half of them 4. Most of them 5. All of them 2. Have been thought of as good students?
1. None of them 2. Few of them 3. Half of them 4. Most of them 5. All of them 3. Have been generally honest and told the truth?
1. None of them 2. Few of them 3. Half of them 4. Most of them 5. All of them 4. Almost always obeyed school rules?
1. None of them 2. Few of them 3. Half of them 4. Most of them 5. All of them Still thinking about your current friends, how likely is it that you would go along with them if they wanted you to do the following things with them? 5. Bully another student at school?
1. Not at All Likely 2. A Little Likely 3. Somewhat Likely 4. Likely 5. Very Likely 6. Break into a home in your community?
1. Not at All Likely 2. A Little Likely 3. Somewhat Likely 4. Likely 5. Very Likely 7. Beat up a stranger on the street?
1. Not at All Likely 2. A Little Likely 3. Somewhat Likely 4. Likely 5. Very Likely 8. Cheat on a test at school?
1. Not at All Likely 2. A Little Likely 3. Somewhat Likely 4. Likely 5. Very Likely 9. Steal something from a store?
1. Not at All Likely 2. A Little Likely 3. Somewhat Likely 4. Likely 5. Very Likely
518
This document is a research report submitted to the U.S. Department of Justice. This report has not been published by the Department. Opinions or points of view expressed are those of the author(s)
and do not necessarily reflect the official position or policies of the U.S. Department of Justice.
10. Drink alcohol? 1. Not at All Likely 2. A Little Likely 3. Somewhat Likely 4. Likely 5. Very Likely
11. Use illegal drugs?
1. Not at All Likely 2. A Little Likely 3. Somewhat Likely 4. Likely 5. Very Likely 12. If your group of friends was getting you into trouble at home, how likely is it that you would still hang
out with them? 1. Not at All Likely 2. A Little Likely 3. Somewhat Likely 4. Likely 5. Very Likely
13. If your group of friends was getting you into trouble at school, how likely is it that you would still
hang out with them? 1. Not at All Likely 2. A Little Likely 3. Somewhat Likely 4. Likely 5. Very Likely
14. If your group of friends was getting you into trouble with the police, how likely is it that you would
still hang out with them? 1. Not at All Likely 2. A Little Likely 3. Somewhat Likely 4. Likely 5. Very Likely
15. If your friends told you not to do something because it was wrong, how likely is it that you would
listen to them? 1. Not at All Likely 2. A Little Likely 3. Somewhat Likely 4. Likely 5. Very Likely
16. If your friends told you not to do something because it was against the law, how likely is it that you
would listen to them? 1. Not at All Likely 2. A Little Likely 3. Somewhat Likely 4. Likely 5. Very Likely
Still thinking about your current friends…. 17. Do you ever spend time hanging around with your current friends not doing anything in particular where no adults are present? 1. No 2. Yes 17a. IF YES, How many hours a week do you do this?
1. 1 -3 hours 2. 4 – 10 hours 3. more than 10 hours 18. Do you ever spend time getting together with your current friends where drugs and alcohol are available? 1. No 2. Yes
519
This document is a research report submitted to the U.S. Department of Justice. This report has not been published by the Department. Opinions or points of view expressed are those of the author(s)
and do not necessarily reflect the official position or policies of the U.S. Department of Justice.
During the last year, how many of your current friends have done the following? 19. Skipped school without an excuse?
1. None of them 2. Few of them 3. Half of them 4. Most of them 5. All of them 20. Stolen something worth less than $50?
1. None of them 2. Few of them 3. Half of them 4. Most of them 5. All of them 21. Attacked someone with a weapon?
1. None of them 2. Few of them 3. Half of them 4. Most of them 5. All of them 22. Sold marijuana or other illegal drugs?
1. None of them 2. Few of them 3. Half of them 4. Most of them 5. All of them 23. Used tobacco or alcohol products?
1. None of them 2. Few of them 3. Half of them 4. Most of them 5. All of them 24. Used marijuana or other illegal drugs?
1. None of them 2. Few of them 3. Half of them 4. Most of them 5. All of them
25. Belonged to a gang?
1. None of them 2. Few of them 3. Half of them 4. Most of them 5. All of them
F. These next few questions are about your opinions about a number of different things. How much do you agree or disagree with these statements? 1. It's okay to tell a small lie if it doesn't hurt anyone.
1. Strongly Disagree 2. Disagree 3. Neither Agree nor Disagree 4. Agree 5. Strongly Agree 2. It's okay to lie if it will keep your friends from getting in trouble with parents, teachers, or police.
1. Strongly Disagree 2. Disagree 3. Neither Agree nor Disagree 4. Agree 5. Strongly Agree 3. It's okay to lie to someone if it will keep you out of trouble with them.
1. Strongly Disagree 2. Disagree 3. Neither Agree nor Disagree 4. Agree 5. Strongly Agree 4. It's okay to steal something from someone who is rich and can easily replace it.
1. Strongly Disagree 2. Disagree 3. Neither Agree nor Disagree 4. Agree 5. Strongly Agree
520
This document is a research report submitted to the U.S. Department of Justice. This report has not been published by the Department. Opinions or points of view expressed are those of the author(s)
and do not necessarily reflect the official position or policies of the U.S. Department of Justice.

5. It's okay to take little things from a store without paying for them since stores make so much money that it won't hurt them. 1. Strongly Disagree 2. Disagree 3. Neither Agree nor Disagree 4. Agree 5. Strongly Agree
6. It's okay to steal something if that's the only way you could ever get it.
1. Strongly Disagree 2. Disagree 3. Neither Agree nor Disagree 4. Agree 5. Strongly Agree 7. It's okay to beat up someone if they hit you first.
1. Strongly Disagree 2. Disagree 3. Neither Agree nor Disagree 4. Agree 5. Strongly Agree 8. It's okay to beat up someone if you have to stand up for or protect your rights.
1. Strongly Disagree 2. Disagree 3. Neither Agree nor Disagree 4. Agree 5. Strongly Agree
9. It's okay to beat up someone if they are threatening to hurt your friends or family.
1. Strongly Disagree 2. Disagree 3. Neither Agree nor Disagree 4. Agree 5. Strongly Agree
These next few questions are about school. 10. Homework is a waste of time.
1. Strongly Disagree 2. Disagree 3. Neither Agree nor Disagree 4. Agree 5. Strongly Agree 11. I try hard in school.
1. Strongly Disagree 2. Disagree 3. Neither Agree nor Disagree 4. Agree 5. Strongly Agree 12. Education is so important that it's worth it to put up with things about school that I don't like.
1. Strongly Disagree 2. Disagree 3. Neither Agree nor Disagree 4. Agree 5. Strongly Agree 13. In general, I like school.
1. Strongly Disagree 2. Disagree 3. Neither Agree nor Disagree 4. Agree 5. Strongly Agree 14. Grades are very important to me.
1. Strongly Disagree 2. Disagree 3. Neither Agree nor Disagree 4. Agree 5. Strongly Agree 15. I usually finish my homework.
1. Strongly Disagree 2. Disagree 3. Neither Agree nor Disagree 4. Agree 5. Strongly Agree 16. If you had to choose between studying to get a good grade on a test or going out with your friends,
which would you do? 1. Definitely Go with Friends 2. Probably Go with Friends 3. Uncertain 4. Probably Study 5. Definitely Study
521
This document is a research report submitted to the U.S. Department of Justice. This report has not been published by the Department. Opinions or points of view expressed are those of the author(s)
and do not necessarily reflect the official position or policies of the U.S. Department of Justice.

For these next few questions, how guilty or how badly would you feel if you . . . 17. Skipped school without an excuse?
1. Not Very Guilty/Badly 2. Somewhat Guilty/Badly 3. Very Guilty/Badly 18. Stole something worth less than $50?
1. Not Very Guilty/Badly 2. Somewhat Guilty/Badly 3. Very Guilty/Badly 19. Attacked someone with a weapon?
1. Not Very Guilty/Badly 2. Somewhat Guilty/Badly 3. Very Guilty/Badly 20. Sold marijuana or other illegal drugs?
1. Not Very Guilty/Badly 2. Somewhat Guilty/Badly 3. Very Guilty/Badly 21. Used tobacco or alcohol products?
1. Not Very Guilty/Badly 2. Somewhat Guilty/Badly 3. Very Guilty/Badly
22. Used marijuana or other illegal drugs? 1. Not Very Guilty/Badly 2. Somewhat Guilty/Badly 3. Very Guilty/Badly
23. Belonged to a gang?
1. Not Very Guilty/Badly 2. Somewhat Guilty/Badly 3. Very Guilty/Badly G. Every now and then we get upset with other people. During the past year when you’ve gotten upset with someone, how often have you done the following? 1. Talked to the person about why I was upset.
1. Never 2. Sometimes 3. Often 2. Tried to figure out why I was upset.
1. Never 2. Sometimes 3. Often 3. Did nothing and just stayed angry for a while.
1. Never 2. Sometimes 3. Often 4. Told the person off or yelled at them.
1. Never 2. Sometimes 3. Often 5. Hit the person.
1. Never 2. Sometimes 3. Often
522
This document is a research report submitted to the U.S. Department of Justice. This report has not been published by the Department. Opinions or points of view expressed are those of the author(s)
and do not necessarily reflect the official position or policies of the U.S. Department of Justice.
When someone else was upset, how often have you done the following things during the past year? 6. Asked the person why he/she was upset.
1. Never 2. Sometimes 3. Often 7. Spoken to him/her in a calm voice.
1. Never 2. Sometimes 3. Often 8. Told the person he/she shouldn’t be upset.
1. Never 2. Sometimes 3. Often 9. Yelled at or argued with the person.
1. Never 2. Sometimes 3. Often And, every now and then we try to avoid doing things that our friends try to get us to do. During the past year when this has happened to you, how often have you done the following? 10. Told the person that I can’t do it because my parents will get upset with me.
1. Never 2. Sometimes 3. Often 11. Tried to get out of it by saying I have other things to do.
1. Never 2. Sometimes 3. Often 12. Said no like I really meant it.
1. Never 2. Sometimes 3. Often 13. Ignored the person.
1. Never 2. Sometimes 3. Often
14. Just gone along with it. 1. Never 2. Sometimes 3. Often
H. During the past year, were you involved in the following activities? 1. School activities or athletics? 1. No 2. Yes
2. Community activities such as scouts or athletic leagues? 1. No 2. Yes
3. Religious activities? 1. No 2. Yes
4. Your own family activities? 1. No 2. Yes
5. In addition to activities such as those listed above, some people have a certain group of friends that they spend time with, doing things together or just hanging out. Do you have a group of friends like that? 1. No 2. Yes
523
This document is a research report submitted to the U.S. Department of Justice. This report has not been published by the Department. Opinions or points of view expressed are those of the author(s)
and do not necessarily reflect the official position or policies of the U.S. Department of Justice.
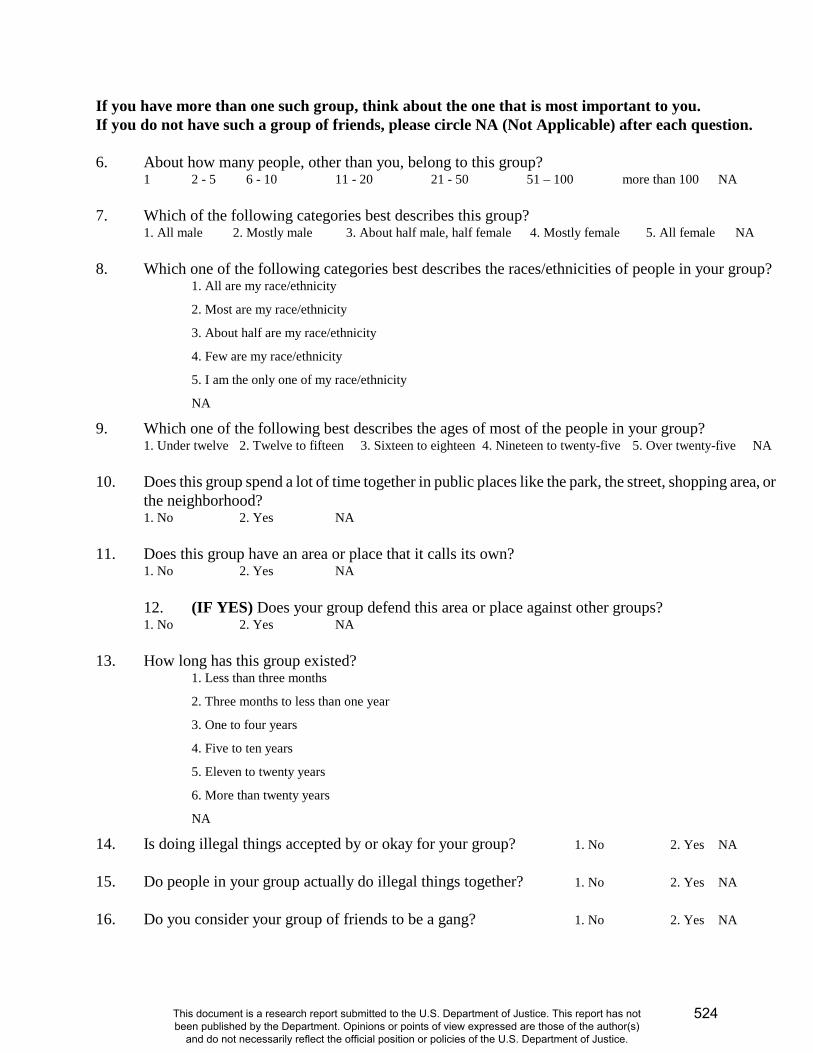
If you have more than one such group, think about the one that is most important to you. If you do not have such a group of friends, please circle NA (Not Applicable) after each question. 6. About how many people, other than you, belong to this group?
1 2 - 5 6 - 10 11 - 20 21 - 50 51 – 100 more than 100 NA
7. Which of the following categories best describes this group? 1. All male 2. Mostly male 3. About half male, half female 4. Mostly female 5. All female NA
8. Which one of the following categories best describes the races/ethnicities of people in your group? 1. All are my race/ethnicity
2. Most are my race/ethnicity
3. About half are my race/ethnicity
4. Few are my race/ethnicity
5. I am the only one of my race/ethnicity
NA
9. Which one of the following best describes the ages of most of the people in your group? 1. Under twelve 2. Twelve to fifteen 3. Sixteen to eighteen 4. Nineteen to twenty-five 5. Over twenty-five NA 10. Does this group spend a lot of time together in public places like the park, the street, shopping area, or
the neighborhood? 1. No 2. Yes NA
11. Does this group have an area or place that it calls its own? 1. No 2. Yes NA 12. (IF YES) Does your group defend this area or place against other groups?
1. No 2. Yes NA 13. How long has this group existed?
1. Less than three months
2. Three months to less than one year
3. One to four years
4. Five to ten years
5. Eleven to twenty years
6. More than twenty years
NA
14. Is doing illegal things accepted by or okay for your group? 1. No 2. Yes NA
15. Do people in your group actually do illegal things together? 1. No 2. Yes NA
16. Do you consider your group of friends to be a gang? 1. No 2. Yes NA
524
This document is a research report submitted to the U.S. Department of Justice. This report has not been published by the Department. Opinions or points of view expressed are those of the author(s)
and do not necessarily reflect the official position or policies of the U.S. Department of Justice.
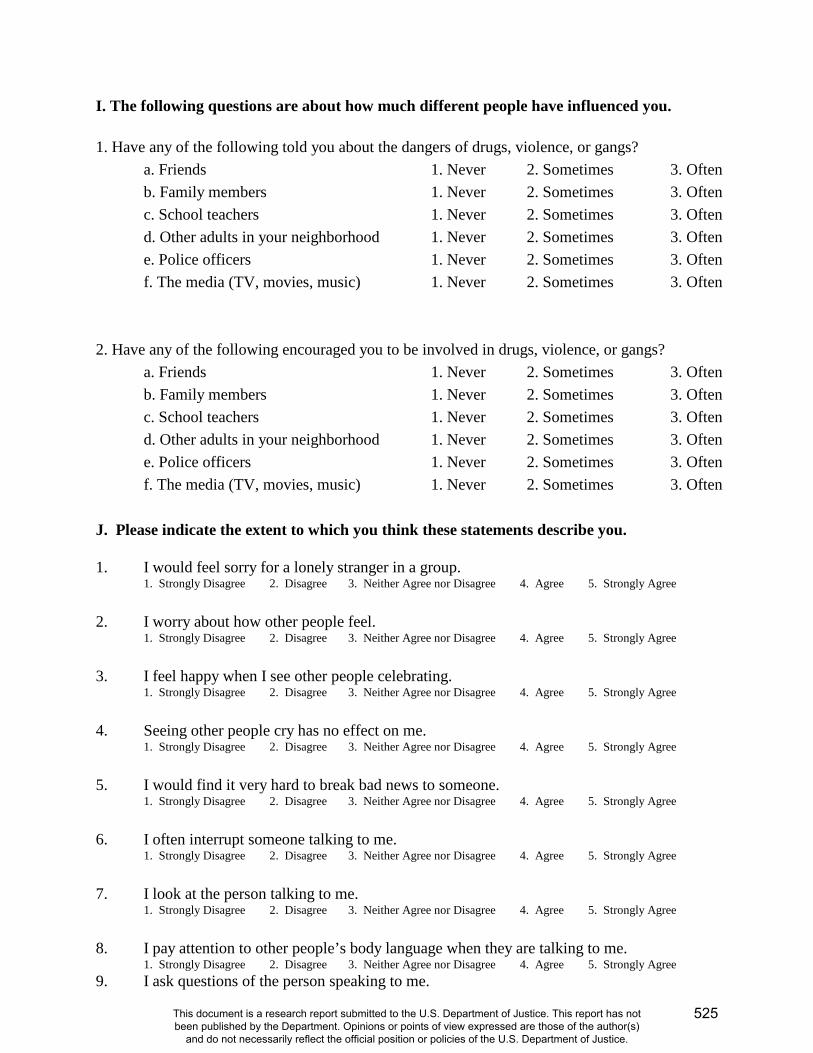
I. The following questions are about how much different people have influenced you. 1. Have any of the following told you about the dangers of drugs, violence, or gangs?
a. Friends 1. Never 2. Sometimes 3. Often b. Family members 1. Never 2. Sometimes 3. Often c. School teachers 1. Never 2. Sometimes 3. Often d. Other adults in your neighborhood 1. Never 2. Sometimes 3. Often e. Police officers 1. Never 2. Sometimes 3. Often f. The media (TV, movies, music) 1. Never 2. Sometimes 3. Often
2. Have any of the following encouraged you to be involved in drugs, violence, or gangs?
a. Friends 1. Never 2. Sometimes 3. Often b. Family members 1. Never 2. Sometimes 3. Often c. School teachers 1. Never 2. Sometimes 3. Often d. Other adults in your neighborhood 1. Never 2. Sometimes 3. Often e. Police officers 1. Never 2. Sometimes 3. Often f. The media (TV, movies, music) 1. Never 2. Sometimes 3. Often
J. Please indicate the extent to which you think these statements describe you. 1. I would feel sorry for a lonely stranger in a group.
1. Strongly Disagree 2. Disagree 3. Neither Agree nor Disagree 4. Agree 5. Strongly Agree 2. I worry about how other people feel.
1. Strongly Disagree 2. Disagree 3. Neither Agree nor Disagree 4. Agree 5. Strongly Agree 3. I feel happy when I see other people celebrating.
1. Strongly Disagree 2. Disagree 3. Neither Agree nor Disagree 4. Agree 5. Strongly Agree 4. Seeing other people cry has no effect on me.
1. Strongly Disagree 2. Disagree 3. Neither Agree nor Disagree 4. Agree 5. Strongly Agree 5. I would find it very hard to break bad news to someone.
1. Strongly Disagree 2. Disagree 3. Neither Agree nor Disagree 4. Agree 5. Strongly Agree 6. I often interrupt someone talking to me.
1. Strongly Disagree 2. Disagree 3. Neither Agree nor Disagree 4. Agree 5. Strongly Agree 7. I look at the person talking to me.
1. Strongly Disagree 2. Disagree 3. Neither Agree nor Disagree 4. Agree 5. Strongly Agree 8. I pay attention to other people’s body language when they are talking to me.
1. Strongly Disagree 2. Disagree 3. Neither Agree nor Disagree 4. Agree 5. Strongly Agree 9. I ask questions of the person speaking to me.
525
This document is a research report submitted to the U.S. Department of Justice. This report has not been published by the Department. Opinions or points of view expressed are those of the author(s)
and do not necessarily reflect the official position or policies of the U.S. Department of Justice.
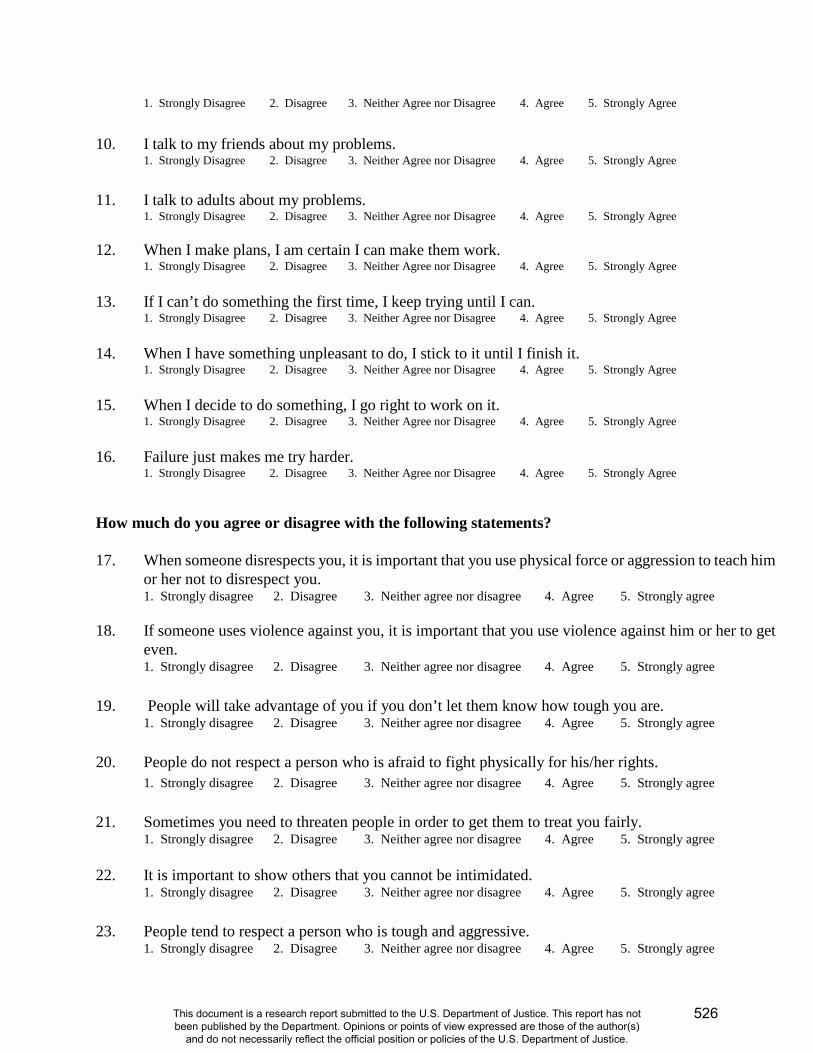
1. Strongly Disagree 2. Disagree 3. Neither Agree nor Disagree 4. Agree 5. Strongly Agree 10. I talk to my friends about my problems.
1. Strongly Disagree 2. Disagree 3. Neither Agree nor Disagree 4. Agree 5. Strongly Agree 11. I talk to adults about my problems.
1. Strongly Disagree 2. Disagree 3. Neither Agree nor Disagree 4. Agree 5. Strongly Agree
12. When I make plans, I am certain I can make them work. 1. Strongly Disagree 2. Disagree 3. Neither Agree nor Disagree 4. Agree 5. Strongly Agree 13. If I can’t do something the first time, I keep trying until I can. 1. Strongly Disagree 2. Disagree 3. Neither Agree nor Disagree 4. Agree 5. Strongly Agree 14. When I have something unpleasant to do, I stick to it until I finish it.
1. Strongly Disagree 2. Disagree 3. Neither Agree nor Disagree 4. Agree 5. Strongly Agree 15. When I decide to do something, I go right to work on it.
1. Strongly Disagree 2. Disagree 3. Neither Agree nor Disagree 4. Agree 5. Strongly Agree 16. Failure just makes me try harder.
1. Strongly Disagree 2. Disagree 3. Neither Agree nor Disagree 4. Agree 5. Strongly Agree How much do you agree or disagree with the following statements? 17. When someone disrespects you, it is important that you use physical force or aggression to teach him
or her not to disrespect you. 1. Strongly disagree 2. Disagree 3. Neither agree nor disagree 4. Agree 5. Strongly agree
18. If someone uses violence against you, it is important that you use violence against him or her to get
even. 1. Strongly disagree 2. Disagree 3. Neither agree nor disagree 4. Agree 5. Strongly agree
19. People will take advantage of you if you don’t let them know how tough you are.
1. Strongly disagree 2. Disagree 3. Neither agree nor disagree 4. Agree 5. Strongly agree 20. People do not respect a person who is afraid to fight physically for his/her rights.
1. Strongly disagree 2. Disagree 3. Neither agree nor disagree 4. Agree 5. Strongly agree 21. Sometimes you need to threaten people in order to get them to treat you fairly.
1. Strongly disagree 2. Disagree 3. Neither agree nor disagree 4. Agree 5. Strongly agree 22. It is important to show others that you cannot be intimidated.
1. Strongly disagree 2. Disagree 3. Neither agree nor disagree 4. Agree 5. Strongly agree 23. People tend to respect a person who is tough and aggressive.
1. Strongly disagree 2. Disagree 3. Neither agree nor disagree 4. Agree 5. Strongly agree
526
This document is a research report submitted to the U.S. Department of Justice. This report has not been published by the Department. Opinions or points of view expressed are those of the author(s)
and do not necessarily reflect the official position or policies of the U.S. Department of Justice.
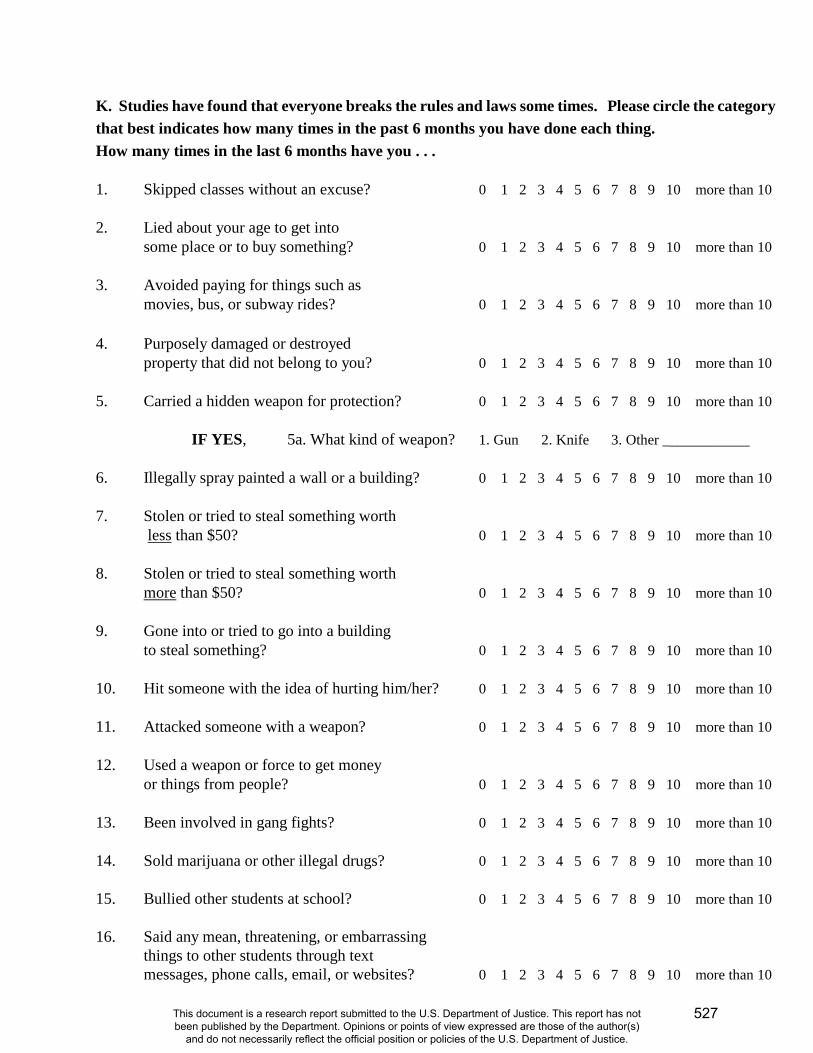
K. Studies have found that everyone breaks the rules and laws some times. Please circle the category that best indicates how many times in the past 6 months you have done each thing. How many times in the last 6 months have you . . . 1. Skipped classes without an excuse? 0 1 2 3 4 5 6 7 8 9 10 more than 10 2. Lied about your age to get into some place or to buy something? 0 1 2 3 4 5 6 7 8 9 10 more than 10 3. Avoided paying for things such as movies, bus, or subway rides? 0 1 2 3 4 5 6 7 8 9 10 more than 10 4. Purposely damaged or destroyed property that did not belong to you? 0 1 2 3 4 5 6 7 8 9 10 more than 10 5. Carried a hidden weapon for protection? 0 1 2 3 4 5 6 7 8 9 10 more than 10 IF YES, 5a. What kind of weapon? 1. Gun 2. Knife 3. Other ___________ 6. Illegally spray painted a wall or a building? 0 1 2 3 4 5 6 7 8 9 10 more than 10 7. Stolen or tried to steal something worth less than $50? 0 1 2 3 4 5 6 7 8 9 10 more than 10 8. Stolen or tried to steal something worth more than $50? 0 1 2 3 4 5 6 7 8 9 10 more than 10 9. Gone into or tried to go into a building to steal something? 0 1 2 3 4 5 6 7 8 9 10 more than 10 10. Hit someone with the idea of hurting him/her? 0 1 2 3 4 5 6 7 8 9 10 more than 10 11. Attacked someone with a weapon? 0 1 2 3 4 5 6 7 8 9 10 more than 10 12. Used a weapon or force to get money or things from people? 0 1 2 3 4 5 6 7 8 9 10 more than 10 13. Been involved in gang fights? 0 1 2 3 4 5 6 7 8 9 10 more than 10 14. Sold marijuana or other illegal drugs? 0 1 2 3 4 5 6 7 8 9 10 more than 10 15. Bullied other students at school? 0 1 2 3 4 5 6 7 8 9 10 more than 10 16. Said any mean, threatening, or embarrassing
things to other students through text messages, phone calls, email, or websites? 0 1 2 3 4 5 6 7 8 9 10 more than 10
527
This document is a research report submitted to the U.S. Department of Justice. This report has not been published by the Department. Opinions or points of view expressed are those of the author(s)
and do not necessarily reflect the official position or policies of the U.S. Department of Justice.
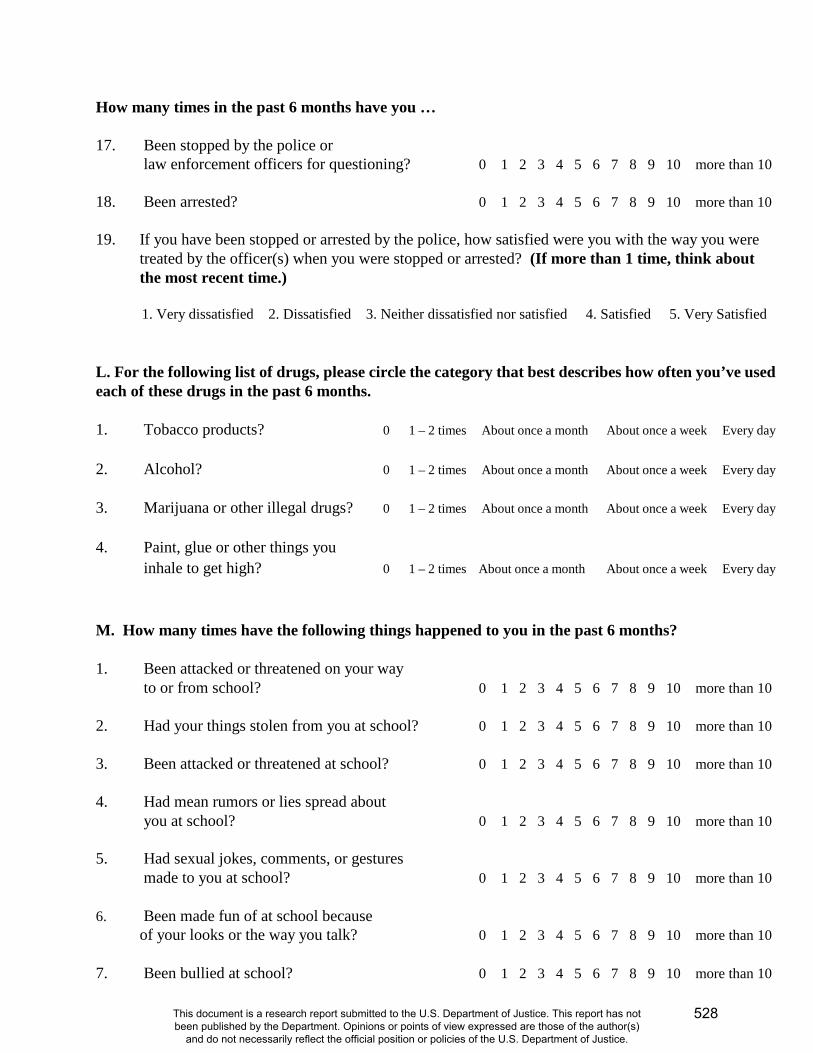
How many times in the past 6 months have you … 17. Been stopped by the police or law enforcement officers for questioning? 0 1 2 3 4 5 6 7 8 9 10 more than 10 18. Been arrested? 0 1 2 3 4 5 6 7 8 9 10 more than 10 19. If you have been stopped or arrested by the police, how satisfied were you with the way you were treated by the officer(s) when you were stopped or arrested? (If more than 1 time, think about the most recent time.) 1. Very dissatisfied 2. Dissatisfied 3. Neither dissatisfied nor satisfied 4. Satisfied 5. Very Satisfied L. For the following list of drugs, please circle the category that best describes how often you’ve used each of these drugs in the past 6 months. 1. Tobacco products? 0 1 – 2 times About once a month About once a week Every day 2. Alcohol? 0 1 – 2 times About once a month About once a week Every day 3. Marijuana or other illegal drugs? 0 1 – 2 times About once a month About once a week Every day 4. Paint, glue or other things you inhale to get high? 0 1 – 2 times About once a month About once a week Every day M. How many times have the following things happened to you in the past 6 months? 1. Been attacked or threatened on your way to or from school? 0 1 2 3 4 5 6 7 8 9 10 more than 10 2. Had your things stolen from you at school? 0 1 2 3 4 5 6 7 8 9 10 more than 10 3. Been attacked or threatened at school? 0 1 2 3 4 5 6 7 8 9 10 more than 10 4. Had mean rumors or lies spread about you at school? 0 1 2 3 4 5 6 7 8 9 10 more than 10 5. Had sexual jokes, comments, or gestures made to you at school? 0 1 2 3 4 5 6 7 8 9 10 more than 10 6. Been made fun of at school because
of your looks or the way you talk? 0 1 2 3 4 5 6 7 8 9 10 more than 10 7. Been bullied at school? 0 1 2 3 4 5 6 7 8 9 10 more than 10
528
This document is a research report submitted to the U.S. Department of Justice. This report has not been published by the Department. Opinions or points of view expressed are those of the author(s)
and do not necessarily reflect the official position or policies of the U.S. Department of Justice.
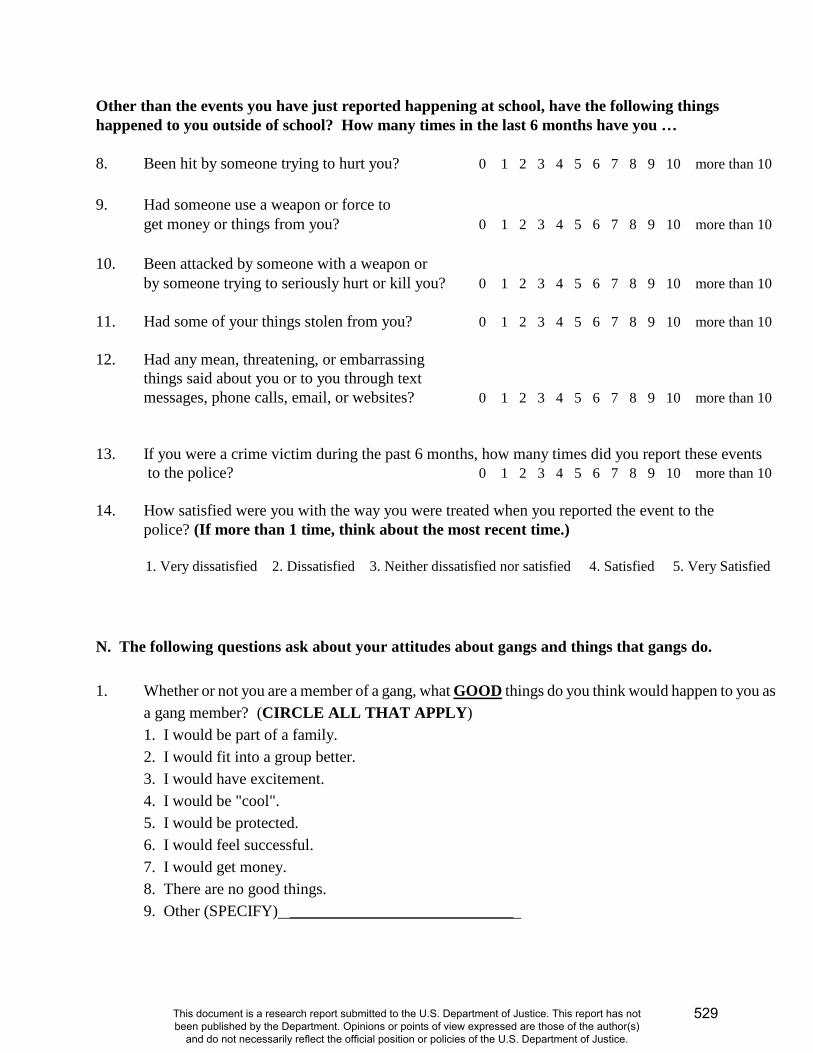
Other than the events you have just reported happening at school, have the following things happened to you outside of school? How many times in the last 6 months have you … 8. Been hit by someone trying to hurt you? 0 1 2 3 4 5 6 7 8 9 10 more than 10 9. Had someone use a weapon or force to get money or things from you? 0 1 2 3 4 5 6 7 8 9 10 more than 10 10. Been attacked by someone with a weapon or by someone trying to seriously hurt or kill you? 0 1 2 3 4 5 6 7 8 9 10 more than 10 11. Had some of your things stolen from you? 0 1 2 3 4 5 6 7 8 9 10 more than 10 12. Had any mean, threatening, or embarrassing
things said about you or to you through text messages, phone calls, email, or websites? 0 1 2 3 4 5 6 7 8 9 10 more than 10 13. If you were a crime victim during the past 6 months, how many times did you report these events
to the police? 0 1 2 3 4 5 6 7 8 9 10 more than 10 14. How satisfied were you with the way you were treated when you reported the event to the
police? (If more than 1 time, think about the most recent time.) 1. Very dissatisfied 2. Dissatisfied 3. Neither dissatisfied nor satisfied 4. Satisfied 5. Very Satisfied N. The following questions ask about your attitudes about gangs and things that gangs do. 1. Whether or not you are a member of a gang, what GOOD things do you think would happen to you as
a gang member? (CIRCLE ALL THAT APPLY) 1. I would be part of a family. 2. I would fit into a group better. 3. I would have excitement. 4. I would be "cool". 5. I would be protected. 6. I would feel successful. 7. I would get money. 8. There are no good things. 9. Other (SPECIFY) ____________________________
529
This document is a research report submitted to the U.S. Department of Justice. This report has not been published by the Department. Opinions or points of view expressed are those of the author(s)
and do not necessarily reflect the official position or policies of the U.S. Department of Justice.
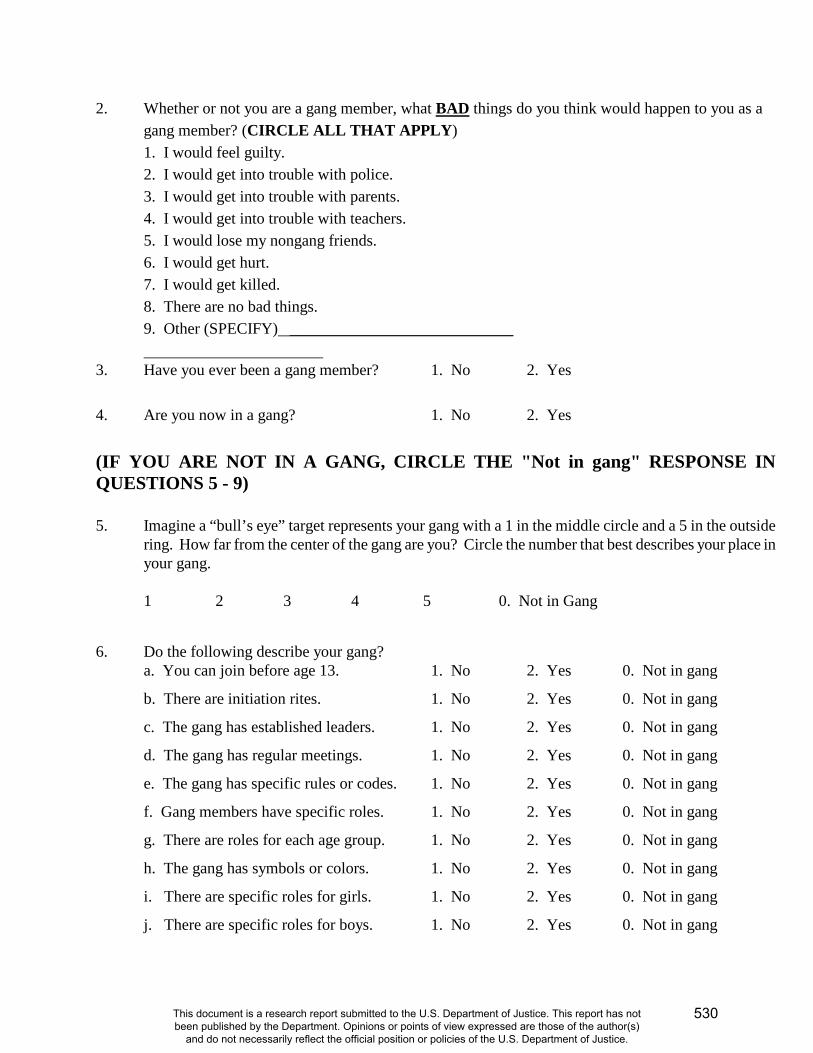
2. Whether or not you are a gang member, what BAD things do you think would happen to you as a gang member? (CIRCLE ALL THAT APPLY) 1. I would feel guilty. 2. I would get into trouble with police. 3. I would get into trouble with parents. 4. I would get into trouble with teachers. 5. I would lose my nongang friends. 6. I would get hurt. 7. I would get killed. 8. There are no bad things. 9. Other (SPECIFY) ____________________________
3. Have you ever been a gang member? 1. No 2. Yes 4. Are you now in a gang? 1. No 2. Yes (IF YOU ARE NOT IN A GANG, CIRCLE THE "Not in gang" RESPONSE IN QUESTIONS 5 - 9) 5. Imagine a “bull’s eye” target represents your gang with a 1 in the middle circle and a 5 in the outside
ring. How far from the center of the gang are you? Circle the number that best describes your place in your gang.
1 2 3 4 5 0. Not in Gang
6. Do the following describe your gang?
a. You can join before age 13. 1. No 2. Yes 0. Not in gang
b. There are initiation rites. 1. No 2. Yes 0. Not in gang
c. The gang has established leaders. 1. No 2. Yes 0. Not in gang
d. The gang has regular meetings. 1. No 2. Yes 0. Not in gang
e. The gang has specific rules or codes. 1. No 2. Yes 0. Not in gang
f. Gang members have specific roles. 1. No 2. Yes 0. Not in gang
g. There are roles for each age group. 1. No 2. Yes 0. Not in gang
h. The gang has symbols or colors. 1. No 2. Yes 0. Not in gang
i. There are specific roles for girls. 1. No 2. Yes 0. Not in gang
j. There are specific roles for boys. 1. No 2. Yes 0. Not in gang
530
This document is a research report submitted to the U.S. Department of Justice. This report has not been published by the Department. Opinions or points of view expressed are those of the author(s)
and do not necessarily reflect the official position or policies of the U.S. Department of Justice.
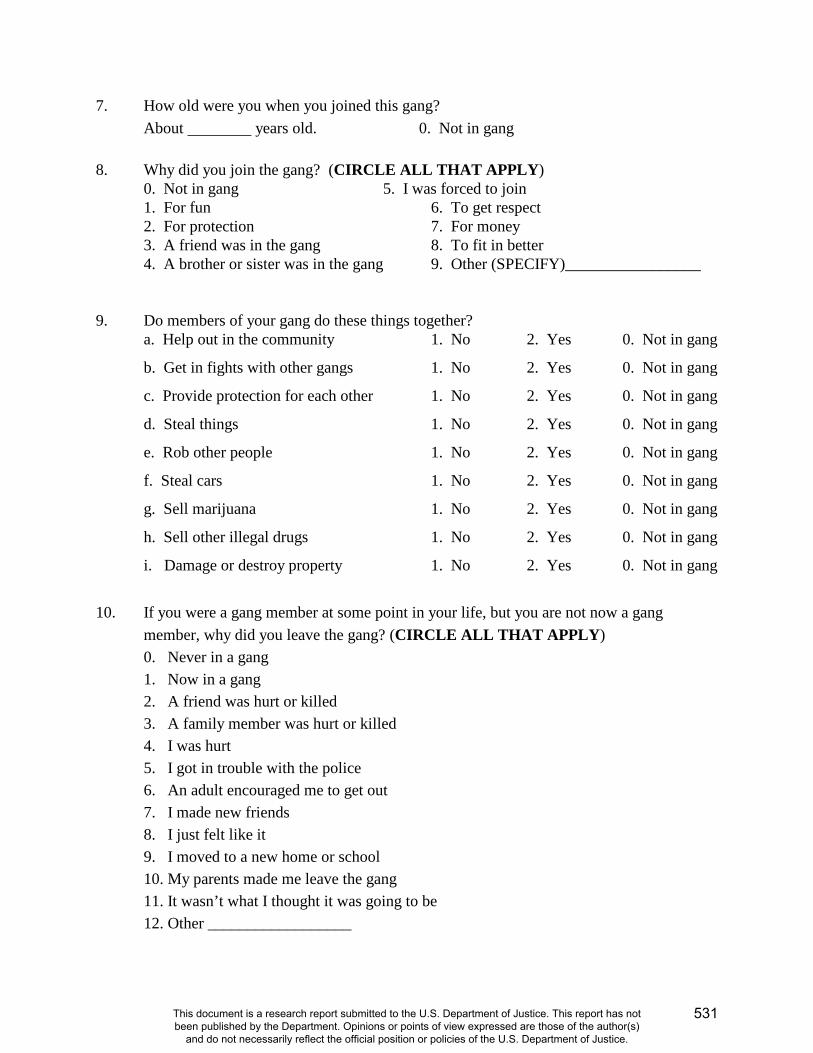
7. How old were you when you joined this gang? About years old. 0. Not in gang
8. Why did you join the gang? (CIRCLE ALL THAT APPLY)
0. Not in gang 5. I was forced to join 1. For fun 6. To get respect 2. For protection 7. For money 3. A friend was in the gang 8. To fit in better 4. A brother or sister was in the gang 9. Other (SPECIFY)_________________
9. Do members of your gang do these things together?
a. Help out in the community 1. No 2. Yes 0. Not in gang
b. Get in fights with other gangs 1. No 2. Yes 0. Not in gang
c. Provide protection for each other 1. No 2. Yes 0. Not in gang
d. Steal things 1. No 2. Yes 0. Not in gang
e. Rob other people 1. No 2. Yes 0. Not in gang
f. Steal cars 1. No 2. Yes 0. Not in gang
g. Sell marijuana 1. No 2. Yes 0. Not in gang
h. Sell other illegal drugs 1. No 2. Yes 0. Not in gang
i. Damage or destroy property 1. No 2. Yes 0. Not in gang
10. If you were a gang member at some point in your life, but you are not now a gang
member, why did you leave the gang? (CIRCLE ALL THAT APPLY) 0. Never in a gang 1. Now in a gang 2. A friend was hurt or killed 3. A family member was hurt or killed 4. I was hurt 5. I got in trouble with the police 6. An adult encouraged me to get out 7. I made new friends 8. I just felt like it 9. I moved to a new home or school 10. My parents made me leave the gang 11. It wasn’t what I thought it was going to be 12. Other __________________
531
This document is a research report submitted to the U.S. Department of Justice. This report has not been published by the Department. Opinions or points of view expressed are those of the author(s)
and do not necessarily reflect the official position or policies of the U.S. Department of Justice.
11. If you were a gang member at some point in your life, but you are not now a gang member, how did you leave the gang. (CIRCLE ALL THAT APPLY) 0. Never in a gang 1. Now in a gang 2. I just left 3. I moved away 4. I had to fight other members of the gang (“jumped out or beaten out”) 5. I had to commit a crime 6. I was allowed out by gang leaders 7. Other ______________
12. If you were a gang member at some point in your life, but you are not now a gang member, were there
any consequences that resulted from you leaving the gang? 0. Never in a gang 1. Now in a gang 2. No 3. Yes
12a. IF YES, what were those consequences: (CIRCLE ALL THAT APPLY)
1. I was beaten up by members of my former gang 2. I was beaten up by members of another gang 3. A family member was hurt or killed 4. A friend was hurt or killed 5. I was threatened 6. My friends or family were threatened 7. I lost my gang friends 8. Other _____________________
O. Sometimes we find that we need help with various problems that are encountered at school or elsewhere. Please indicate how much you agree or disagree with the following statements about different kinds of services or assistance that are available to people when they need help. 1. You are aware of programs and services in your community that help victims of crime. 1. Strongly Disagree 2. Disagree 3. Neither Agree nor Disagree 4. Agree 5. Strongly Agree
2. You know where a person can go for help if he/she is victimized. 1. Strongly Disagree 2. Disagree 3. Neither Agree nor Disagree 4. Agree 5. Strongly Agree
3. If a friend was in trouble, you could tell him/her where to go for help. 1. Strongly Disagree 2. Disagree 3. Neither Agree nor Disagree 4. Agree 5. Strongly Agree
532
This document is a research report submitted to the U.S. Department of Justice. This report has not been published by the Department. Opinions or points of view expressed are those of the author(s)
and do not necessarily reflect the official position or policies of the U.S. Department of Justice.
4. There is someone you could talk to if you had a problem at school. 1. Strongly Disagree 2. Disagree 3. Neither Agree nor Disagree 4. Agree 5. Strongly Agree
P. For these next few statements, please circle the answer that best reflects your opinion. Remember, there are no right or wrong answers. 1. There’s not much I can do to change our community. 1. Strongly Disagree 2. Disagree 3. Neither Agree nor Disagree 4. Agree 5. Strongly Agree 2. Teenagers are usually viewed as the problem, not part of the solution. 1. Strongly Disagree 2. Disagree 3. Neither Agree nor Disagree 4. Agree 5. Strongly Agree 3. It is my responsibility to do something about problems in our community. 1. Strongly Disagree 2. Disagree 3. Neither Agree nor Disagree 4. Agree 5. Strongly Agree 4. My involvement in the community improves others’ lives. 1. Strongly Disagree 2. Disagree 3. Neither Agree nor Disagree 4. Agree 5. Strongly Agree 5. Teenagers can make a difference in improving their community. 1. Strongly Disagree 2. Disagree 3. Neither Agree nor Disagree 4. Agree 5. Strongly Agree 6. I often think about how my actions affect other people. 1. Strongly Disagree 2. Disagree 3. Neither Agree nor Disagree 4. Agree 5. Strongly Agree 7. I work well with adults. 1. Strongly Disagree 2. Disagree 3. Neither Agree nor Disagree 4. Agree 5. Strongly Agree 8. Adults never listen to young people. 1. Strongly Disagree 2. Disagree 3. Neither Agree nor Disagree 4. Agree 5. Strongly Agree 9. Gangs interfere with the peace and safety of a neighborhood.
1. Strongly Disagree 2. Disagree 3. Neither Agree nor Disagree 4. Agree 5. Strongly Agree 10. Getting involved with gangs will interfere with reaching my goals.
1. Strongly Disagree 2. Disagree 3. Neither Agree nor Disagree 4. Agree 5. Strongly Agree 11. I have limited my activities as a result of gangs in my neighborhood.
1. Strongly Disagree 2. Disagree 3. Neither Agree nor Disagree 4. Agree 5. Strongly Agree 12. People only help others when they think they are going to get something out of it.
1. Strongly Disagree 2. Disagree 3. Neither Agree nor Disagree 4. Agree 5. Strongly Agree 13. I value being a team member. 1. Strongly Disagree 2. Disagree 3. Neither Agree nor Disagree 4. Agree 5. Strongly Agree
533
This document is a research report submitted to the U.S. Department of Justice. This report has not been published by the Department. Opinions or points of view expressed are those of the author(s)
and do not necessarily reflect the official position or policies of the U.S. Department of Justice.
14. It feels good to do something without expecting anything in return.
1. Strongly Disagree 2. Disagree 3. Neither Agree nor Disagree 4. Agree 5. Strongly Agree 15. I always do my part.
1. Strongly Disagree 2. Disagree 3. Neither Agree nor Disagree 4. Agree 5. Strongly Agree 16. I don’t like to work unless I get paid for it.
1. Strongly Disagree 2. Disagree 3. Neither Agree nor Disagree 4. Agree 5. Strongly Agree 17. If you don’t look out for yourself, no one else will.
1. Strongly Disagree 2. Disagree 3. Neither Agree nor Disagree 4. Agree 5. Strongly Agree Q. Sometimes our behavior brings responses from other people. These next few questions are about responses to behaviors. Please circle the number of times each of the following has happened to you. How many times in the past 6 months have you… 1. Been punished by your parent(s) or caregiver(s) because of your behavior in school or in the
community? 0 1 2 3 4 5 6 7 8 9 10 more than 10 2. Been excluded from activities by your group of friends because of your behavior in school or in the
community? 0 1 2 3 4 5 6 7 8 9 10 more than 10 3. Been sent to the principal’s office or given a detention because of your behavior in school? 0 1 2 3 4 5 6 7 8 9 10 more than 10 4. Been given either an in school or out of school suspension because of your behavior in school? 0 1 2 3 4 5 6 7 8 9 10 more than 10 5. Been yelled at or asked to leave an area by adults in your community? 0 1 2 3 4 5 6 7 8 9 10 more than 10 R. How likely is it that you would report the following events if you saw someone doing the following things? 1. Breaking into a locker at school?
1. Not at all likely 2 A little likely 3 Somewhat likely 4 Likely 5 Very likely 2. Bullying another student at school?
1. Not at all likely 2 A little likely 3 Somewhat likely 4 Likely 5 Very likely
534
This document is a research report submitted to the U.S. Department of Justice. This report has not been published by the Department. Opinions or points of view expressed are those of the author(s)
and do not necessarily reflect the official position or policies of the U.S. Department of Justice.
3. Breaking into a home in your community?
1. Not at all likely 2 A little likely 3 Somewhat likely 4 Likely 5 Very likely 4. Beating up a stranger on the street?
1. Not at all likely 2 A little likely 3 Somewhat likely 4 Likely 5 Very likely 5. Cheating on a test at school?
1. Not at all likely 2 A little likely 3 Somewhat likely 4 Likely 5 Very likely 6. Stealing something from a store?
1. Not at all likely 2 A little likely 3 Somewhat likely 4 Likely 5 Very likely
Thank you very much for answering these questions. We really appreciate your help.
535
This document is a research report submitted to the U.S. Department of Justice. This report has not been published by the Department. Opinions or points of view expressed are those of the author(s)
and do not necessarily reflect the official position or policies of the U.S. Department of Justice.

NATIONAL EVALUATION OF G.R.E.A.T.
STUDENT QUESTIONNAIRE
Wave 4
School Year 2008 - 2009
University of Missouri-St. Louis Department of Criminology and Criminal Justice
8001 Natural Bridge Road St. Louis, MO 63121
536
This document is a research report submitted to the U.S. Department of Justice. This report has not been published by the Department. Opinions or points of view expressed are those of the author(s)
and do not necessarily reflect the official position or policies of the U.S. Department of Justice.

INSTRUCTIONS 1. Please answer the questions in the order they appear. 2. Circle the number that shows your best answer to each question. 3. There are no right or wrong answers. Your opinion is what counts. 4. Do NOT write your name on the questionnaire. 5. Your answers are CONFIDENTIAL - - no one outside of our research office will ever
connect your name with the answers you give. 6. You have the right to skip any question that you do not want to answer. 7. You can stop filling out the questionnaire any time you wish. WE HOPE YOU ENJOY ANSWERING THESE QUESTIONS
537
This document is a research report submitted to the U.S. Department of Justice. This report has not been published by the Department. Opinions or points of view expressed are those of the author(s)
and do not necessarily reflect the official position or policies of the U.S. Department of Justice.

Please provide the following information. Once you have completed this page, tear it out and hand it to one of the researchers. PLEASE PRINT Your Name:____________________________________________ (First) (Middle) (Last) Address: ______________________________________________ (Number) (Street) ______________________________________________________ (City) (State) (Zip Code) Today’s Date: ______________________________
538
This document is a research report submitted to the U.S. Department of Justice. This report has not been published by the Department. Opinions or points of view expressed are those of the author(s)
and do not necessarily reflect the official position or policies of the U.S. Department of Justice.
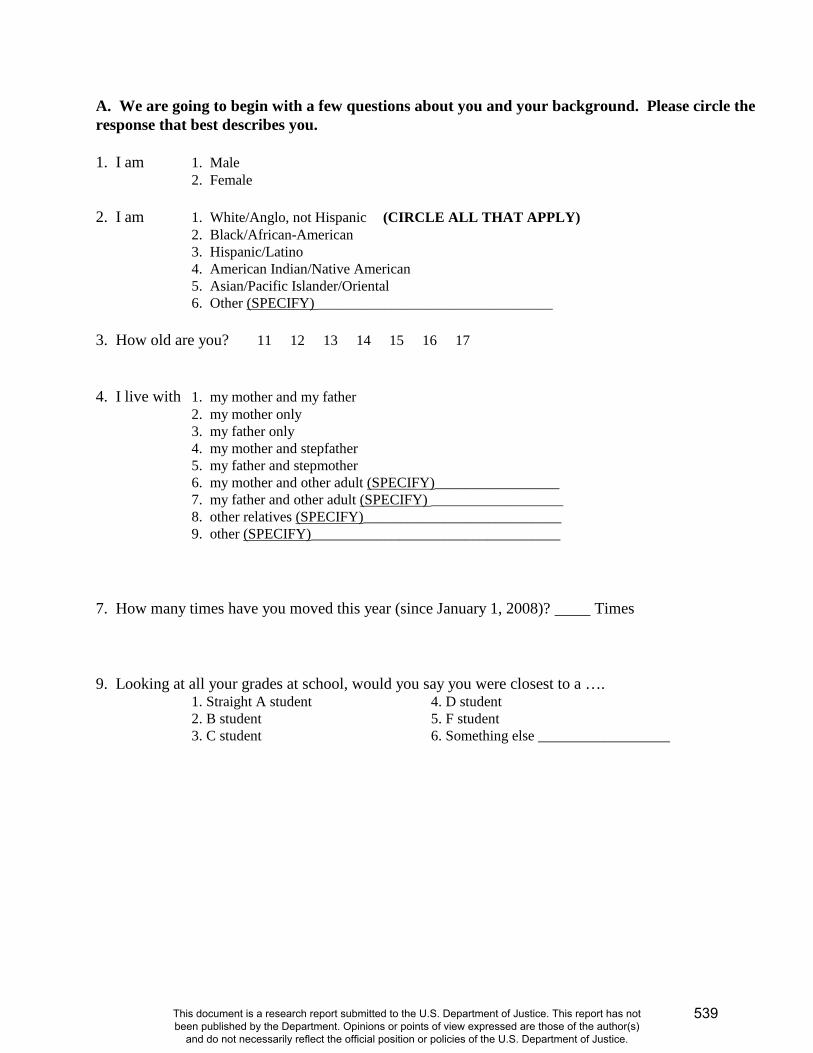
A. We are going to begin with a few questions about you and your background. Please circle the response that best describes you. 1. I am 1. Male 2. Female 2. I am 1. White/Anglo, not Hispanic (CIRCLE ALL THAT APPLY)
2. Black/African-American 3. Hispanic/Latino 4. American Indian/Native American 5. Asian/Pacific Islander/Oriental 6. Other (SPECIFY) ________________________________
3. How old are you? 11 12 13 14 15 16 17 4. I live with 1. my mother and my father
2. my mother only 3. my father only 4. my mother and stepfather 5. my father and stepmother 6. my mother and other adult (SPECIFY)_________________ 7. my father and other adult (SPECIFY) __________________ 8. other relatives (SPECIFY)___________________________ 9. other (SPECIFY)__________________________________
7. How many times have you moved this year (since January 1, 2008)? Times
9. Looking at all your grades at school, would you say you were closest to a ….
1. Straight A student 4. D student 2. B student 5. F student 3. C student 6. Something else __________________
539
This document is a research report submitted to the U.S. Department of Justice. This report has not been published by the Department. Opinions or points of view expressed are those of the author(s)
and do not necessarily reflect the official position or policies of the U.S. Department of Justice.
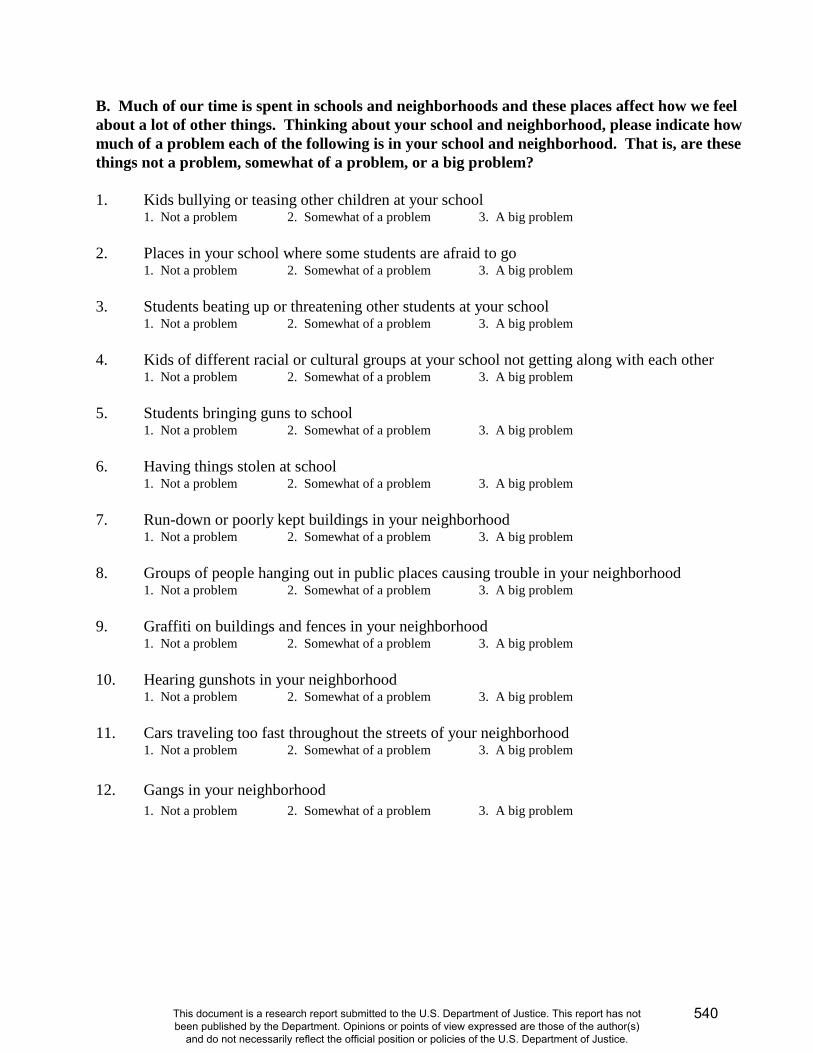
B. Much of our time is spent in schools and neighborhoods and these places affect how we feel about a lot of other things. Thinking about your school and neighborhood, please indicate how much of a problem each of the following is in your school and neighborhood. That is, are these things not a problem, somewhat of a problem, or a big problem? 1. Kids bullying or teasing other children at your school 1. Not a problem 2. Somewhat of a problem 3. A big problem 2. Places in your school where some students are afraid to go 1. Not a problem 2. Somewhat of a problem 3. A big problem 3. Students beating up or threatening other students at your school 1. Not a problem 2. Somewhat of a problem 3. A big problem 4. Kids of different racial or cultural groups at your school not getting along with each other 1. Not a problem 2. Somewhat of a problem 3. A big problem 5. Students bringing guns to school 1. Not a problem 2. Somewhat of a problem 3. A big problem 6. Having things stolen at school 1. Not a problem 2. Somewhat of a problem 3. A big problem 7. Run-down or poorly kept buildings in your neighborhood 1. Not a problem 2. Somewhat of a problem 3. A big problem 8. Groups of people hanging out in public places causing trouble in your neighborhood 1. Not a problem 2. Somewhat of a problem 3. A big problem 9. Graffiti on buildings and fences in your neighborhood 1. Not a problem 2. Somewhat of a problem 3. A big problem 10. Hearing gunshots in your neighborhood 1. Not a problem 2. Somewhat of a problem 3. A big problem 11. Cars traveling too fast throughout the streets of your neighborhood 1. Not a problem 2. Somewhat of a problem 3. A big problem 12. Gangs in your neighborhood 1. Not a problem 2. Somewhat of a problem 3. A big problem
540
This document is a research report submitted to the U.S. Department of Justice. This report has not been published by the Department. Opinions or points of view expressed are those of the author(s)
and do not necessarily reflect the official position or policies of the U.S. Department of Justice.
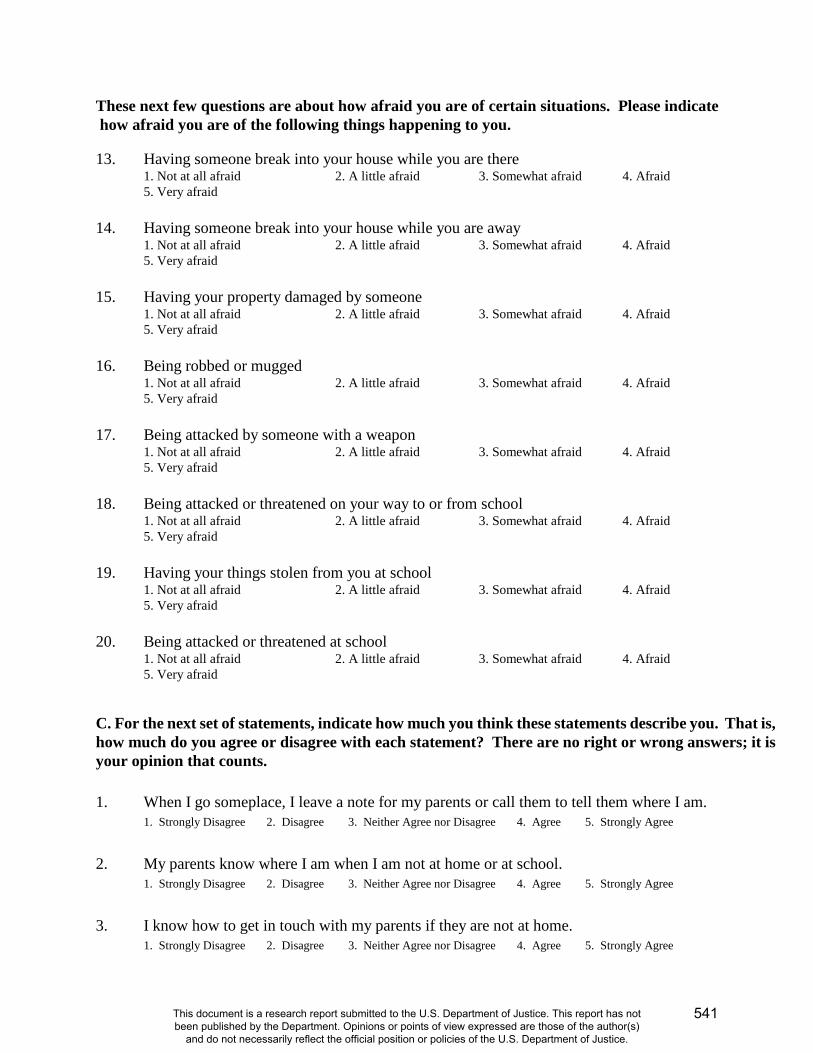
These next few questions are about how afraid you are of certain situations. Please indicate how afraid you are of the following things happening to you. 13. Having someone break into your house while you are there 1. Not at all afraid 2. A little afraid 3. Somewhat afraid 4. Afraid 5. Very afraid 14. Having someone break into your house while you are away 1. Not at all afraid 2. A little afraid 3. Somewhat afraid 4. Afraid 5. Very afraid 15. Having your property damaged by someone 1. Not at all afraid 2. A little afraid 3. Somewhat afraid 4. Afraid 5. Very afraid 16. Being robbed or mugged 1. Not at all afraid 2. A little afraid 3. Somewhat afraid 4. Afraid 5. Very afraid 17. Being attacked by someone with a weapon 1. Not at all afraid 2. A little afraid 3. Somewhat afraid 4. Afraid 5. Very afraid 18. Being attacked or threatened on your way to or from school 1. Not at all afraid 2. A little afraid 3. Somewhat afraid 4. Afraid 5. Very afraid 19. Having your things stolen from you at school 1. Not at all afraid 2. A little afraid 3. Somewhat afraid 4. Afraid 5. Very afraid 20. Being attacked or threatened at school 1. Not at all afraid 2. A little afraid 3. Somewhat afraid 4. Afraid 5. Very afraid C. For the next set of statements, indicate how much you think these statements describe you. That is, how much do you agree or disagree with each statement? There are no right or wrong answers; it is your opinion that counts. 1. When I go someplace, I leave a note for my parents or call them to tell them where I am.
1. Strongly Disagree 2. Disagree 3. Neither Agree nor Disagree 4. Agree 5. Strongly Agree 2. My parents know where I am when I am not at home or at school.
1. Strongly Disagree 2. Disagree 3. Neither Agree nor Disagree 4. Agree 5. Strongly Agree 3. I know how to get in touch with my parents if they are not at home.
1. Strongly Disagree 2. Disagree 3. Neither Agree nor Disagree 4. Agree 5. Strongly Agree
541
This document is a research report submitted to the U.S. Department of Justice. This report has not been published by the Department. Opinions or points of view expressed are those of the author(s)
and do not necessarily reflect the official position or policies of the U.S. Department of Justice.
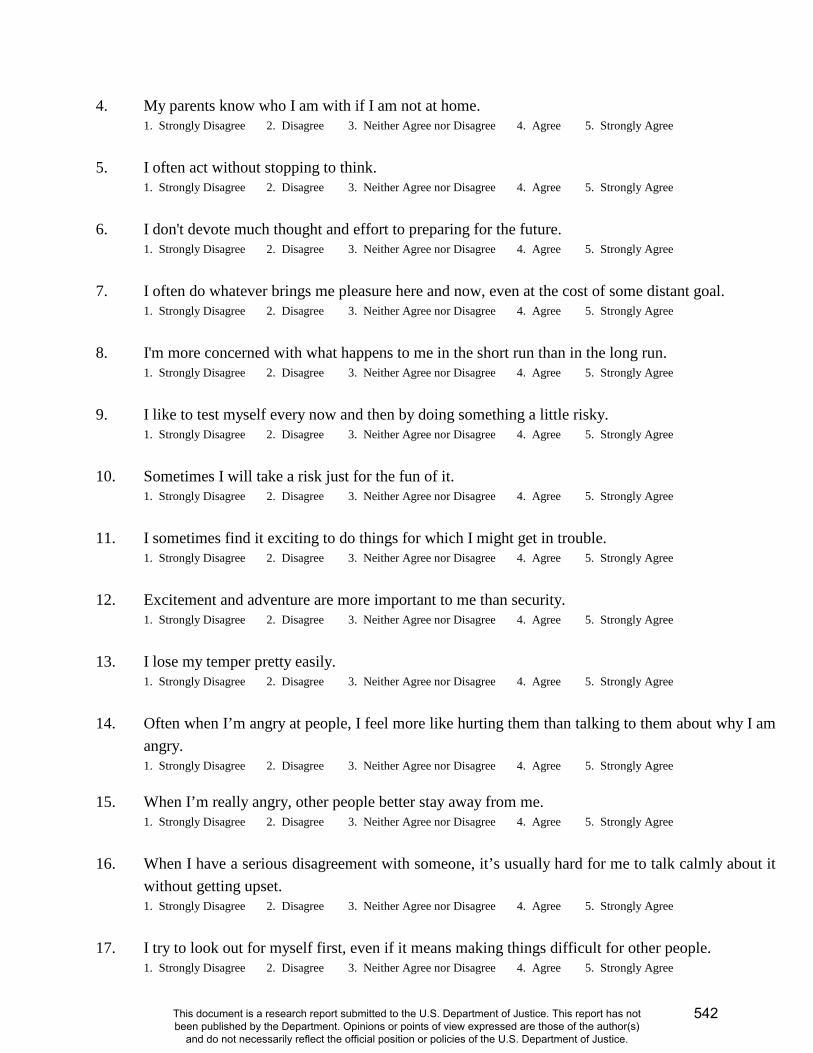
4. My parents know who I am with if I am not at home. 1. Strongly Disagree 2. Disagree 3. Neither Agree nor Disagree 4. Agree 5. Strongly Agree
5. I often act without stopping to think.
1. Strongly Disagree 2. Disagree 3. Neither Agree nor Disagree 4. Agree 5. Strongly Agree 6. I don't devote much thought and effort to preparing for the future.
1. Strongly Disagree 2. Disagree 3. Neither Agree nor Disagree 4. Agree 5. Strongly Agree 7. I often do whatever brings me pleasure here and now, even at the cost of some distant goal.
1. Strongly Disagree 2. Disagree 3. Neither Agree nor Disagree 4. Agree 5. Strongly Agree 8. I'm more concerned with what happens to me in the short run than in the long run.
1. Strongly Disagree 2. Disagree 3. Neither Agree nor Disagree 4. Agree 5. Strongly Agree 9. I like to test myself every now and then by doing something a little risky.
1. Strongly Disagree 2. Disagree 3. Neither Agree nor Disagree 4. Agree 5. Strongly Agree 10. Sometimes I will take a risk just for the fun of it.
1. Strongly Disagree 2. Disagree 3. Neither Agree nor Disagree 4. Agree 5. Strongly Agree 11. I sometimes find it exciting to do things for which I might get in trouble.
1. Strongly Disagree 2. Disagree 3. Neither Agree nor Disagree 4. Agree 5. Strongly Agree 12. Excitement and adventure are more important to me than security.
1. Strongly Disagree 2. Disagree 3. Neither Agree nor Disagree 4. Agree 5. Strongly Agree 13. I lose my temper pretty easily.
1. Strongly Disagree 2. Disagree 3. Neither Agree nor Disagree 4. Agree 5. Strongly Agree 14. Often when I’m angry at people, I feel more like hurting them than talking to them about why I am
angry. 1. Strongly Disagree 2. Disagree 3. Neither Agree nor Disagree 4. Agree 5. Strongly Agree
15. When I’m really angry, other people better stay away from me. 1. Strongly Disagree 2. Disagree 3. Neither Agree nor Disagree 4. Agree 5. Strongly Agree
16. When I have a serious disagreement with someone, it’s usually hard for me to talk calmly about it
without getting upset. 1. Strongly Disagree 2. Disagree 3. Neither Agree nor Disagree 4. Agree 5. Strongly Agree
17. I try to look out for myself first, even if it means making things difficult for other people.
1. Strongly Disagree 2. Disagree 3. Neither Agree nor Disagree 4. Agree 5. Strongly Agree
542
This document is a research report submitted to the U.S. Department of Justice. This report has not been published by the Department. Opinions or points of view expressed are those of the author(s)
and do not necessarily reflect the official position or policies of the U.S. Department of Justice.
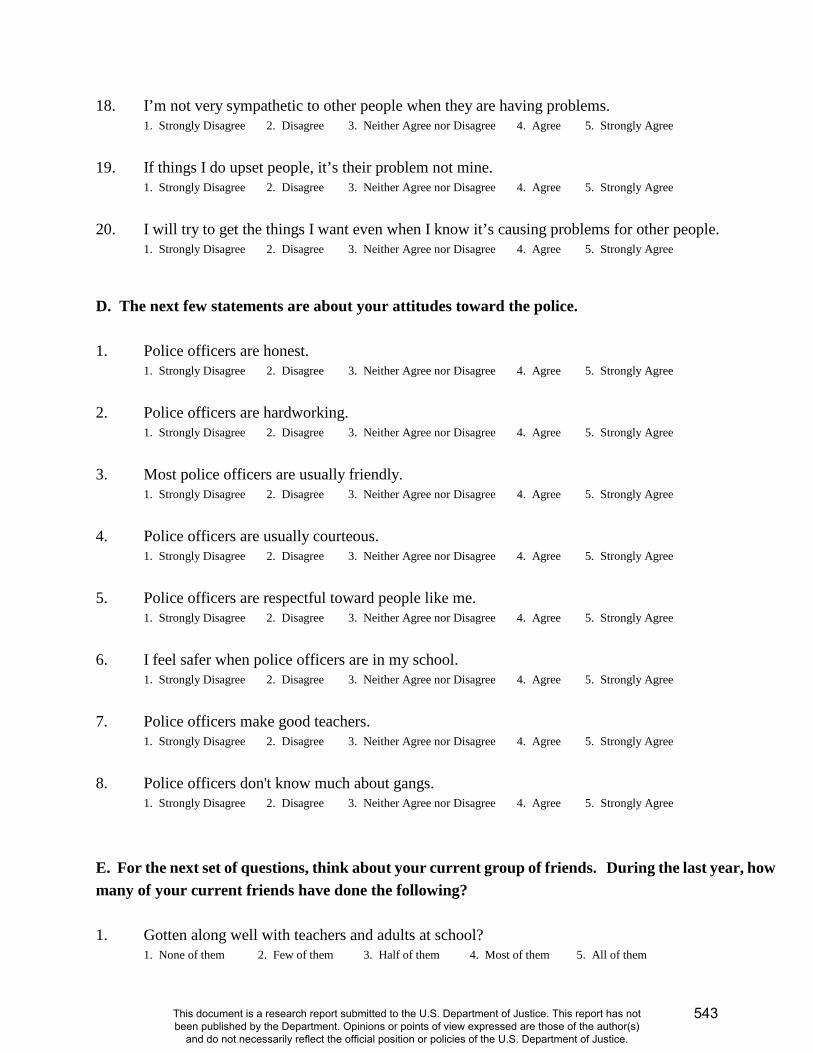
18. I’m not very sympathetic to other people when they are having problems. 1. Strongly Disagree 2. Disagree 3. Neither Agree nor Disagree 4. Agree 5. Strongly Agree
19. If things I do upset people, it’s their problem not mine.
1. Strongly Disagree 2. Disagree 3. Neither Agree nor Disagree 4. Agree 5. Strongly Agree 20. I will try to get the things I want even when I know it’s causing problems for other people.
1. Strongly Disagree 2. Disagree 3. Neither Agree nor Disagree 4. Agree 5. Strongly Agree D. The next few statements are about your attitudes toward the police. 1. Police officers are honest.
1. Strongly Disagree 2. Disagree 3. Neither Agree nor Disagree 4. Agree 5. Strongly Agree 2. Police officers are hardworking.
1. Strongly Disagree 2. Disagree 3. Neither Agree nor Disagree 4. Agree 5. Strongly Agree 3. Most police officers are usually friendly.
1. Strongly Disagree 2. Disagree 3. Neither Agree nor Disagree 4. Agree 5. Strongly Agree 4. Police officers are usually courteous.
1. Strongly Disagree 2. Disagree 3. Neither Agree nor Disagree 4. Agree 5. Strongly Agree 5. Police officers are respectful toward people like me.
1. Strongly Disagree 2. Disagree 3. Neither Agree nor Disagree 4. Agree 5. Strongly Agree 6. I feel safer when police officers are in my school.
1. Strongly Disagree 2. Disagree 3. Neither Agree nor Disagree 4. Agree 5. Strongly Agree 7. Police officers make good teachers.
1. Strongly Disagree 2. Disagree 3. Neither Agree nor Disagree 4. Agree 5. Strongly Agree 8. Police officers don't know much about gangs.
1. Strongly Disagree 2. Disagree 3. Neither Agree nor Disagree 4. Agree 5. Strongly Agree E. For the next set of questions, think about your current group of friends. During the last year, how many of your current friends have done the following? 1. Gotten along well with teachers and adults at school?
1. None of them 2. Few of them 3. Half of them 4. Most of them 5. All of them
543
This document is a research report submitted to the U.S. Department of Justice. This report has not been published by the Department. Opinions or points of view expressed are those of the author(s)
and do not necessarily reflect the official position or policies of the U.S. Department of Justice.
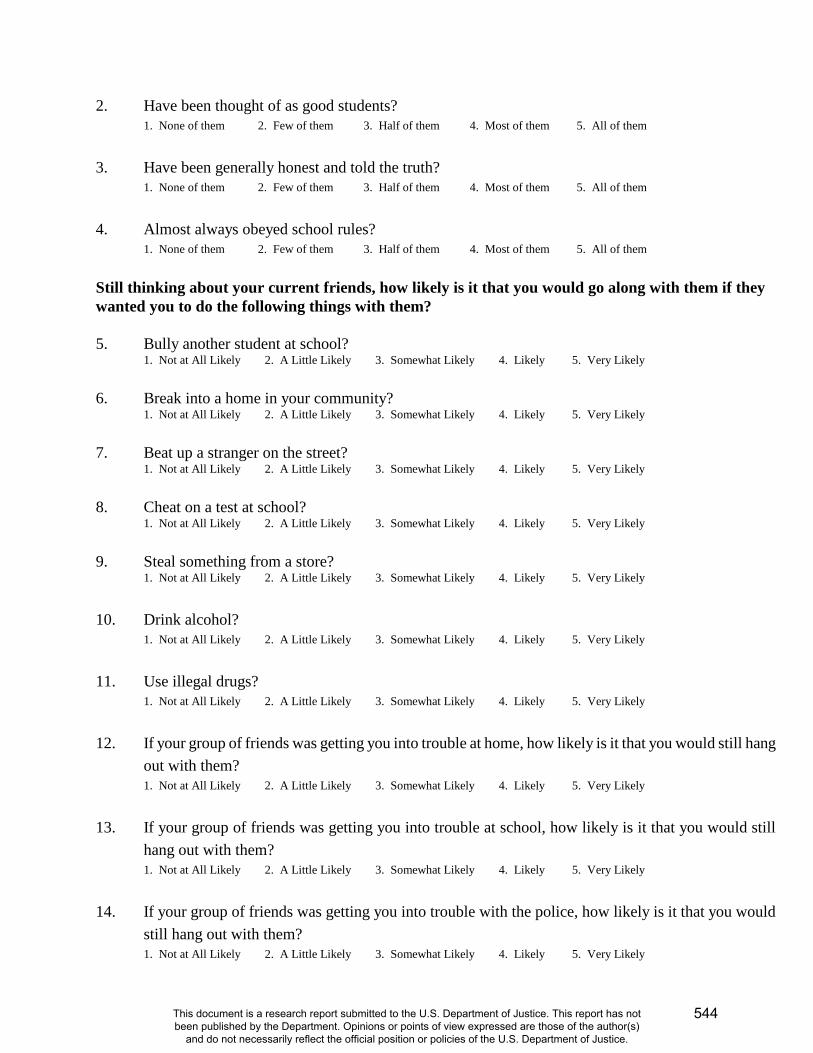
2. Have been thought of as good students? 1. None of them 2. Few of them 3. Half of them 4. Most of them 5. All of them
3. Have been generally honest and told the truth?
1. None of them 2. Few of them 3. Half of them 4. Most of them 5. All of them 4. Almost always obeyed school rules?
1. None of them 2. Few of them 3. Half of them 4. Most of them 5. All of them Still thinking about your current friends, how likely is it that you would go along with them if they wanted you to do the following things with them? 5. Bully another student at school?
1. Not at All Likely 2. A Little Likely 3. Somewhat Likely 4. Likely 5. Very Likely 6. Break into a home in your community?
1. Not at All Likely 2. A Little Likely 3. Somewhat Likely 4. Likely 5. Very Likely 7. Beat up a stranger on the street?
1. Not at All Likely 2. A Little Likely 3. Somewhat Likely 4. Likely 5. Very Likely 8. Cheat on a test at school?
1. Not at All Likely 2. A Little Likely 3. Somewhat Likely 4. Likely 5. Very Likely 9. Steal something from a store?
1. Not at All Likely 2. A Little Likely 3. Somewhat Likely 4. Likely 5. Very Likely 10. Drink alcohol?
1. Not at All Likely 2. A Little Likely 3. Somewhat Likely 4. Likely 5. Very Likely 11. Use illegal drugs?
1. Not at All Likely 2. A Little Likely 3. Somewhat Likely 4. Likely 5. Very Likely 12. If your group of friends was getting you into trouble at home, how likely is it that you would still hang
out with them? 1. Not at All Likely 2. A Little Likely 3. Somewhat Likely 4. Likely 5. Very Likely
13. If your group of friends was getting you into trouble at school, how likely is it that you would still
hang out with them? 1. Not at All Likely 2. A Little Likely 3. Somewhat Likely 4. Likely 5. Very Likely
14. If your group of friends was getting you into trouble with the police, how likely is it that you would
still hang out with them? 1. Not at All Likely 2. A Little Likely 3. Somewhat Likely 4. Likely 5. Very Likely
544
This document is a research report submitted to the U.S. Department of Justice. This report has not been published by the Department. Opinions or points of view expressed are those of the author(s)
and do not necessarily reflect the official position or policies of the U.S. Department of Justice.

15. If your friends told you not to do something because it was wrong, how likely is it that you would listen to them? 1. Not at All Likely 2. A Little Likely 3. Somewhat Likely 4. Likely 5. Very Likely
16. If your friends told you not to do something because it was against the law, how likely is it that you
would listen to them? 1. Not at All Likely 2. A Little Likely 3. Somewhat Likely 4. Likely 5. Very Likely
Still thinking about your current friends…. 17. Do you ever spend time hanging around with your current friends not doing anything in particular where no adults are present? 1. No 2. Yes 17a. IF YES, How many hours a week do you do this?
1. 1 -3 hours 2. 4 – 10 hours 3. more than 10 hours 18. Do you ever spend time getting together with your current friends where drugs and alcohol are available? 1. No 2. Yes During the last year, how many of your current friends have done the following? 19. Skipped school without an excuse?
1. None of them 2. Few of them 3. Half of them 4. Most of them 5. All of them 20. Stolen something worth less than $50?
1. None of them 2. Few of them 3. Half of them 4. Most of them 5. All of them 21. Attacked someone with a weapon?
1. None of them 2. Few of them 3. Half of them 4. Most of them 5. All of them 22. Sold marijuana or other illegal drugs?
1. None of them 2. Few of them 3. Half of them 4. Most of them 5. All of them 23. Used tobacco or alcohol products?
1. None of them 2. Few of them 3. Half of them 4. Most of them 5. All of them 24. Used marijuana or other illegal drugs?
1. None of them 2. Few of them 3. Half of them 4. Most of them 5. All of them
25. Belonged to a gang?
1. None of them 2. Few of them 3. Half of them 4. Most of them 5. All of them
545
This document is a research report submitted to the U.S. Department of Justice. This report has not been published by the Department. Opinions or points of view expressed are those of the author(s)
and do not necessarily reflect the official position or policies of the U.S. Department of Justice.
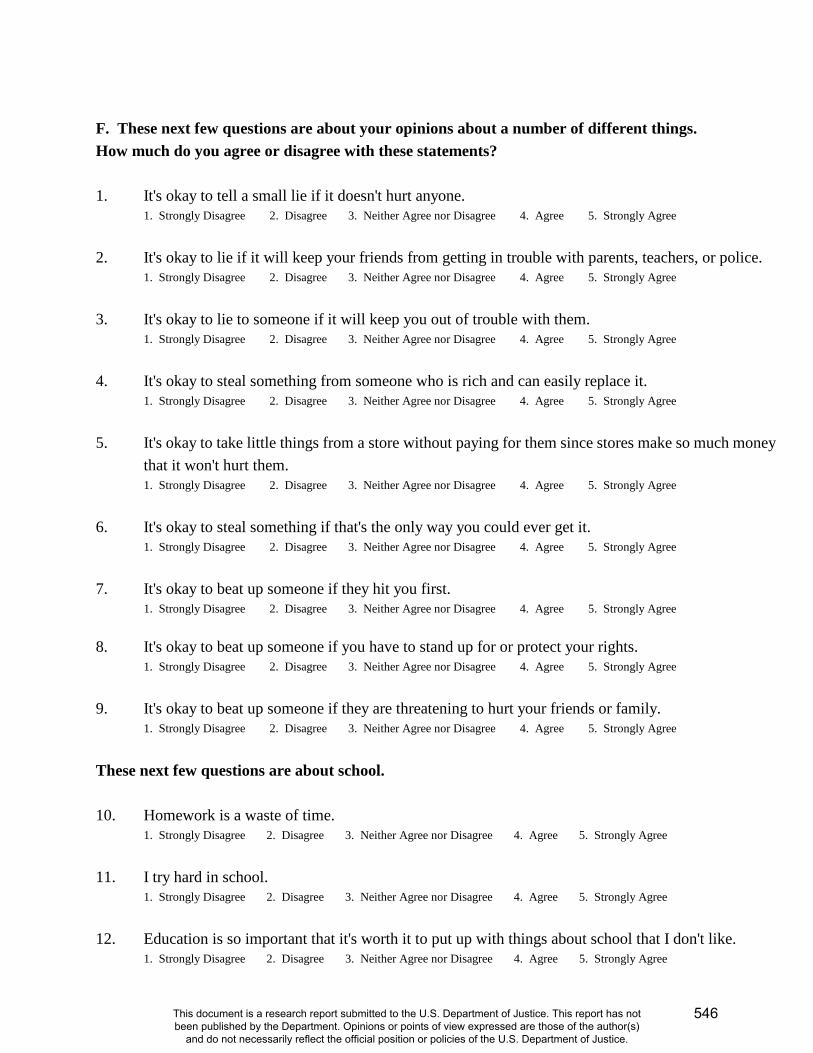
F. These next few questions are about your opinions about a number of different things. How much do you agree or disagree with these statements? 1. It's okay to tell a small lie if it doesn't hurt anyone.
1. Strongly Disagree 2. Disagree 3. Neither Agree nor Disagree 4. Agree 5. Strongly Agree 2. It's okay to lie if it will keep your friends from getting in trouble with parents, teachers, or police.
1. Strongly Disagree 2. Disagree 3. Neither Agree nor Disagree 4. Agree 5. Strongly Agree 3. It's okay to lie to someone if it will keep you out of trouble with them.
1. Strongly Disagree 2. Disagree 3. Neither Agree nor Disagree 4. Agree 5. Strongly Agree 4. It's okay to steal something from someone who is rich and can easily replace it.
1. Strongly Disagree 2. Disagree 3. Neither Agree nor Disagree 4. Agree 5. Strongly Agree 5. It's okay to take little things from a store without paying for them since stores make so much money
that it won't hurt them. 1. Strongly Disagree 2. Disagree 3. Neither Agree nor Disagree 4. Agree 5. Strongly Agree
6. It's okay to steal something if that's the only way you could ever get it.
1. Strongly Disagree 2. Disagree 3. Neither Agree nor Disagree 4. Agree 5. Strongly Agree 7. It's okay to beat up someone if they hit you first.
1. Strongly Disagree 2. Disagree 3. Neither Agree nor Disagree 4. Agree 5. Strongly Agree 8. It's okay to beat up someone if you have to stand up for or protect your rights.
1. Strongly Disagree 2. Disagree 3. Neither Agree nor Disagree 4. Agree 5. Strongly Agree
9. It's okay to beat up someone if they are threatening to hurt your friends or family.
1. Strongly Disagree 2. Disagree 3. Neither Agree nor Disagree 4. Agree 5. Strongly Agree
These next few questions are about school. 10. Homework is a waste of time.
1. Strongly Disagree 2. Disagree 3. Neither Agree nor Disagree 4. Agree 5. Strongly Agree 11. I try hard in school.
1. Strongly Disagree 2. Disagree 3. Neither Agree nor Disagree 4. Agree 5. Strongly Agree 12. Education is so important that it's worth it to put up with things about school that I don't like.
1. Strongly Disagree 2. Disagree 3. Neither Agree nor Disagree 4. Agree 5. Strongly Agree
546
This document is a research report submitted to the U.S. Department of Justice. This report has not been published by the Department. Opinions or points of view expressed are those of the author(s)
and do not necessarily reflect the official position or policies of the U.S. Department of Justice.
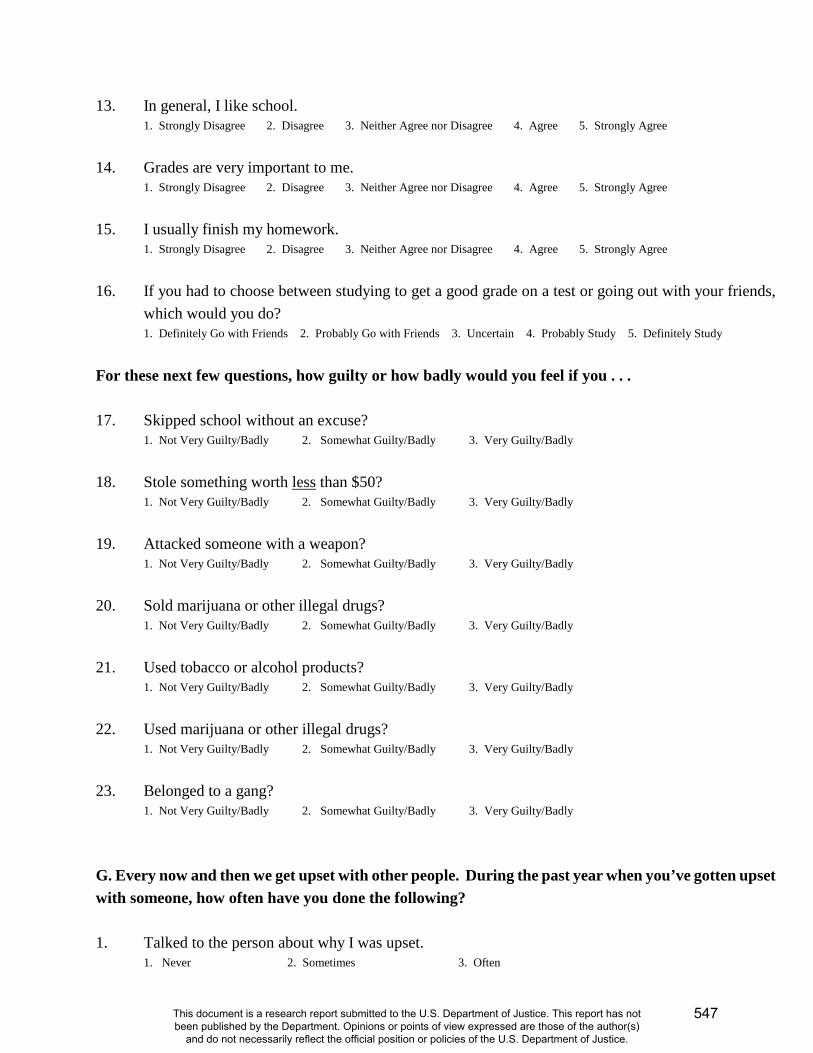
13. In general, I like school. 1. Strongly Disagree 2. Disagree 3. Neither Agree nor Disagree 4. Agree 5. Strongly Agree
14. Grades are very important to me.
1. Strongly Disagree 2. Disagree 3. Neither Agree nor Disagree 4. Agree 5. Strongly Agree 15. I usually finish my homework.
1. Strongly Disagree 2. Disagree 3. Neither Agree nor Disagree 4. Agree 5. Strongly Agree 16. If you had to choose between studying to get a good grade on a test or going out with your friends,
which would you do? 1. Definitely Go with Friends 2. Probably Go with Friends 3. Uncertain 4. Probably Study 5. Definitely Study
For these next few questions, how guilty or how badly would you feel if you . . . 17. Skipped school without an excuse?
1. Not Very Guilty/Badly 2. Somewhat Guilty/Badly 3. Very Guilty/Badly 18. Stole something worth less than $50?
1. Not Very Guilty/Badly 2. Somewhat Guilty/Badly 3. Very Guilty/Badly 19. Attacked someone with a weapon?
1. Not Very Guilty/Badly 2. Somewhat Guilty/Badly 3. Very Guilty/Badly 20. Sold marijuana or other illegal drugs?
1. Not Very Guilty/Badly 2. Somewhat Guilty/Badly 3. Very Guilty/Badly 21. Used tobacco or alcohol products?
1. Not Very Guilty/Badly 2. Somewhat Guilty/Badly 3. Very Guilty/Badly
22. Used marijuana or other illegal drugs? 1. Not Very Guilty/Badly 2. Somewhat Guilty/Badly 3. Very Guilty/Badly
23. Belonged to a gang?
1. Not Very Guilty/Badly 2. Somewhat Guilty/Badly 3. Very Guilty/Badly G. Every now and then we get upset with other people. During the past year when you’ve gotten upset with someone, how often have you done the following? 1. Talked to the person about why I was upset.
1. Never 2. Sometimes 3. Often
547
This document is a research report submitted to the U.S. Department of Justice. This report has not been published by the Department. Opinions or points of view expressed are those of the author(s)
and do not necessarily reflect the official position or policies of the U.S. Department of Justice.
2. Tried to figure out why I was upset. 1. Never 2. Sometimes 3. Often
3. Did nothing and just stayed angry for a while.
1. Never 2. Sometimes 3. Often 4. Told the person off or yelled at them.
1. Never 2. Sometimes 3. Often 5. Hit the person.
1. Never 2. Sometimes 3. Often When someone else was upset, how often have you done the following things during the past year? 6. Asked the person why he/she was upset.
1. Never 2. Sometimes 3. Often 7. Spoken to him/her in a calm voice.
1. Never 2. Sometimes 3. Often 8. Told the person he/she shouldn’t be upset.
1. Never 2. Sometimes 3. Often 9. Yelled at or argued with the person.
1. Never 2. Sometimes 3. Often And, every now and then we try to avoid doing things that our friends try to get us to do. During the past year when this has happened to you, how often have you done the following? 10. Told the person that I can’t do it because my parents will get upset with me.
1. Never 2. Sometimes 3. Often 11. Tried to get out of it by saying I have other things to do.
1. Never 2. Sometimes 3. Often 12. Said no like I really meant it.
1. Never 2. Sometimes 3. Often 13. Ignored the person.
1. Never 2. Sometimes 3. Often
14. Just gone along with it. 1. Never 2. Sometimes 3. Often
Every now and then things happen to us. How likely do you think it is that the following things will happen to you?
548
This document is a research report submitted to the U.S. Department of Justice. This report has not been published by the Department. Opinions or points of view expressed are those of the author(s)
and do not necessarily reflect the official position or policies of the U.S. Department of Justice.

15. Having someone break into your house while you are there 1. Not at all likely 2. A little likely 3. Somewhat likely 4. Likely 5. Very likely
16. Having someone break into your house while you are away
1. Not at all likely 2. A little likely 3. Somewhat likely 4. Likely 5. Very likely 17. Having your property damaged by someone
1. Not at all likely 2. A little likely 3. Somewhat likely 4. Likely 5. Very likely 18. Being robbed or mugged
1. Not at all likely 2. A little likely 3. Somewhat likely 4. Likely 5. Very likely 19. Being attacked by someone with a weapon
1. Not at all likely 2. A little likely 3. Somewhat likely 4. Likely 5. Very likely 20. Being attacked or threatened on your way to or from school
1. Not at all likely 2. A little likely 3. Somewhat likely 4. Likely 5. Very likely 21. Having your things stolen from you at school
1. Not at all likely 2. A little likely 3. Somewhat likely 4. Likely 5. Very likely 22. Being attacked or threatened at school
1. Not at all likely 2. A little likely 3. Somewhat likely 4. Likely 5. Very likely
H. During the past year, were you involved in the following activities? 1. School activities or athletics? 1. No 2. Yes
2. Community activities such as scouts or athletic leagues? 1. No 2. Yes
3. Religious activities? 1. No 2. Yes
4. Your own family activities? 1. No 2. Yes
5. In addition to activities such as those listed above, some people have a certain group of friends that they spend time with, doing things together or just hanging out. Do you have a group of friends like that? 1. No 2. Yes
If you have more than one such group, think about the one that is most important to you. If you do not have such a group of friends, please circle NA (Not Applicable) after each question. 6. About how many people, other than you, belong to this group?
1 2 - 5 6 - 10 11 - 20 21 - 50 51 – 100 more than 100 NA
7. Which of the following categories best describes this group? 1. All male 2. Mostly male 3. About half male, half female 4. Mostly female 5. All female NA
549
This document is a research report submitted to the U.S. Department of Justice. This report has not been published by the Department. Opinions or points of view expressed are those of the author(s)
and do not necessarily reflect the official position or policies of the U.S. Department of Justice.
8. Which one of the following categories best describes the races/ethnicities of people in your group? 1. All are my race/ethnicity
2. Most are my race/ethnicity
3. About half are my race/ethnicity
4. Few are my race/ethnicity
5. I am the only one of my race/ethnicity NA 9. Which one of the following best describes the ages of most of the people in your group? 1. Under twelve 2. Twelve to fifteen 3. Sixteen to eighteen 4. Nineteen to twenty-five 5. Over twenty-five NA 10. Does this group spend a lot of time together in public places like the park, the street, shopping area, or
the neighborhood? 1. No 2. Yes NA
11. Does this group have an area or place that it calls its own? 1. No 2. Yes NA
12. (IF YES) Does your group defend this area or place against other groups? 1. No 2. Yes NA 13. How long has this group existed?
1. Less than three months
2. Three months to less than one year
3. One to four years
4. Five to ten years
5. Eleven to twenty years
6. More than twenty years
NA
14. Is doing illegal things accepted by or okay for your group? 1. No 2. Yes NA
15. Do people in your group actually do illegal things together? 1. No 2. Yes NA 16. Do you consider your group of friends to be a gang? 1. No 2. Yes NA 17. If you do not consider your group of friends to be a gang, is there some other word you use to describe
your group? 1. No 2. Yes
18. (IF YES) What is that word? ___________________
550
This document is a research report submitted to the U.S. Department of Justice. This report has not been published by the Department. Opinions or points of view expressed are those of the author(s)
and do not necessarily reflect the official position or policies of the U.S. Department of Justice.
I. The following questions are about how much different people have influenced you. 1. Have any of the following told you about the dangers of drugs, violence, or gangs?
a. Friends 1. Never 2. Sometimes 3. Often b. Family members 1. Never 2. Sometimes 3. Often c. School teachers 1. Never 2. Sometimes 3. Often d. Other adults in your neighborhood 1. Never 2. Sometimes 3. Often e. Police officers 1. Never 2. Sometimes 3. Often f. The media (TV, movies, music) 1. Never 2. Sometimes 3. Often
2. Have any of the following encouraged you to be involved in drugs, violence, or gangs?
a. Friends 1. Never 2. Sometimes 3. Often b. Family members 1. Never 2. Sometimes 3. Often c. School teachers 1. Never 2. Sometimes 3. Often d. Other adults in your neighborhood 1. Never 2. Sometimes 3. Often e. Police officers 1. Never 2. Sometimes 3. Often f. The media (TV, movies, music) 1. Never 2. Sometimes 3. Often
J. Please indicate the extent to which you think these statements describe you. 1. I would feel sorry for a lonely stranger in a group.
1. Strongly Disagree 2. Disagree 3. Neither Agree nor Disagree 4. Agree 5. Strongly Agree 2. I worry about how other people feel.
1. Strongly Disagree 2. Disagree 3. Neither Agree nor Disagree 4. Agree 5. Strongly Agree 3. I feel happy when I see other people celebrating.
1. Strongly Disagree 2. Disagree 3. Neither Agree nor Disagree 4. Agree 5. Strongly Agree 4. Seeing other people cry has no effect on me.
1. Strongly Disagree 2. Disagree 3. Neither Agree nor Disagree 4. Agree 5. Strongly Agree 5. I would find it very hard to break bad news to someone.
1. Strongly Disagree 2. Disagree 3. Neither Agree nor Disagree 4. Agree 5. Strongly Agree 6. I often interrupt someone talking to me.
1. Strongly Disagree 2. Disagree 3. Neither Agree nor Disagree 4. Agree 5. Strongly Agree 7. I look at the person talking to me.
1. Strongly Disagree 2. Disagree 3. Neither Agree nor Disagree 4. Agree 5. Strongly Agree 8. I pay attention to other people’s body language when they are talking to me.
551
This document is a research report submitted to the U.S. Department of Justice. This report has not been published by the Department. Opinions or points of view expressed are those of the author(s)
and do not necessarily reflect the official position or policies of the U.S. Department of Justice.
1. Strongly Disagree 2. Disagree 3. Neither Agree nor Disagree 4. Agree 5. Strongly Agree 9. I ask questions of the person speaking to me.
1. Strongly Disagree 2. Disagree 3. Neither Agree nor Disagree 4. Agree 5. Strongly Agree 10. I talk to my friends about my problems.
1. Strongly Disagree 2. Disagree 3. Neither Agree nor Disagree 4. Agree 5. Strongly Agree 11. I talk to adults about my problems.
1. Strongly Disagree 2. Disagree 3. Neither Agree nor Disagree 4. Agree 5. Strongly Agree
12. When I make plans, I am certain I can make them work. 1. Strongly Disagree 2. Disagree 3. Neither Agree nor Disagree 4. Agree 5. Strongly Agree 13. If I can’t do something the first time, I keep trying until I can. 1. Strongly Disagree 2. Disagree 3. Neither Agree nor Disagree 4. Agree 5. Strongly Agree 14. When I have something unpleasant to do, I stick to it until I finish it.
1. Strongly Disagree 2. Disagree 3. Neither Agree nor Disagree 4. Agree 5. Strongly Agree 15. When I decide to do something, I go right to work on it.
1. Strongly Disagree 2. Disagree 3. Neither Agree nor Disagree 4. Agree 5. Strongly Agree 16. Failure just makes me try harder.
1. Strongly Disagree 2. Disagree 3. Neither Agree nor Disagree 4. Agree 5. Strongly Agree How much do you agree or disagree with the following statements? 17. When someone disrespects you, it is important that you use physical force or aggression to teach him
or her not to disrespect you. 1. Strongly disagree 2. Disagree 3. Neither agree nor disagree 4. Agree 5. Strongly agree
18. If someone uses violence against you, it is important that you use violence against him or her to get
even. 1. Strongly disagree 2. Disagree 3. Neither agree nor disagree 4. Agree 5. Strongly agree
19. People will take advantage of you if you don’t let them know how tough you are.
1. Strongly disagree 2. Disagree 3. Neither agree nor disagree 4. Agree 5. Strongly agree 20. People do not respect a person who is afraid to fight physically for his/her rights.
1. Strongly disagree 2. Disagree 3. Neither agree nor disagree 4. Agree 5. Strongly agree 21. Sometimes you need to threaten people in order to get them to treat you fairly.
1. Strongly disagree 2. Disagree 3. Neither agree nor disagree 4. Agree 5. Strongly agree 22. It is important to show others that you cannot be intimidated.
1. Strongly disagree 2. Disagree 3. Neither agree nor disagree 4. Agree 5. Strongly agree 23. People tend to respect a person who is tough and aggressive.
552
This document is a research report submitted to the U.S. Department of Justice. This report has not been published by the Department. Opinions or points of view expressed are those of the author(s)
and do not necessarily reflect the official position or policies of the U.S. Department of Justice.
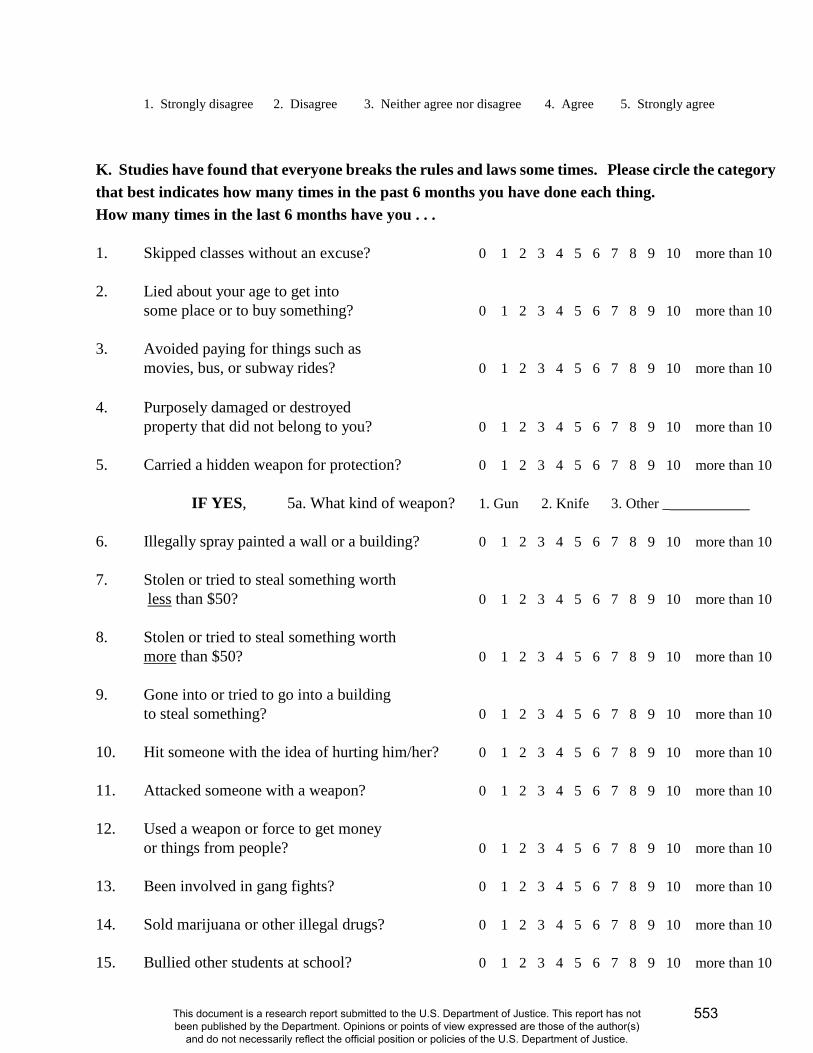
1. Strongly disagree 2. Disagree 3. Neither agree nor disagree 4. Agree 5. Strongly agree K. Studies have found that everyone breaks the rules and laws some times. Please circle the category that best indicates how many times in the past 6 months you have done each thing. How many times in the last 6 months have you . . . 1. Skipped classes without an excuse? 0 1 2 3 4 5 6 7 8 9 10 more than 10 2. Lied about your age to get into some place or to buy something? 0 1 2 3 4 5 6 7 8 9 10 more than 10 3. Avoided paying for things such as movies, bus, or subway rides? 0 1 2 3 4 5 6 7 8 9 10 more than 10 4. Purposely damaged or destroyed property that did not belong to you? 0 1 2 3 4 5 6 7 8 9 10 more than 10 5. Carried a hidden weapon for protection? 0 1 2 3 4 5 6 7 8 9 10 more than 10 IF YES, 5a. What kind of weapon? 1. Gun 2. Knife 3. Other ___________ 6. Illegally spray painted a wall or a building? 0 1 2 3 4 5 6 7 8 9 10 more than 10 7. Stolen or tried to steal something worth less than $50? 0 1 2 3 4 5 6 7 8 9 10 more than 10 8. Stolen or tried to steal something worth more than $50? 0 1 2 3 4 5 6 7 8 9 10 more than 10 9. Gone into or tried to go into a building to steal something? 0 1 2 3 4 5 6 7 8 9 10 more than 10 10. Hit someone with the idea of hurting him/her? 0 1 2 3 4 5 6 7 8 9 10 more than 10 11. Attacked someone with a weapon? 0 1 2 3 4 5 6 7 8 9 10 more than 10 12. Used a weapon or force to get money or things from people? 0 1 2 3 4 5 6 7 8 9 10 more than 10 13. Been involved in gang fights? 0 1 2 3 4 5 6 7 8 9 10 more than 10 14. Sold marijuana or other illegal drugs? 0 1 2 3 4 5 6 7 8 9 10 more than 10 15. Bullied other students at school? 0 1 2 3 4 5 6 7 8 9 10 more than 10
553
This document is a research report submitted to the U.S. Department of Justice. This report has not been published by the Department. Opinions or points of view expressed are those of the author(s)
and do not necessarily reflect the official position or policies of the U.S. Department of Justice.
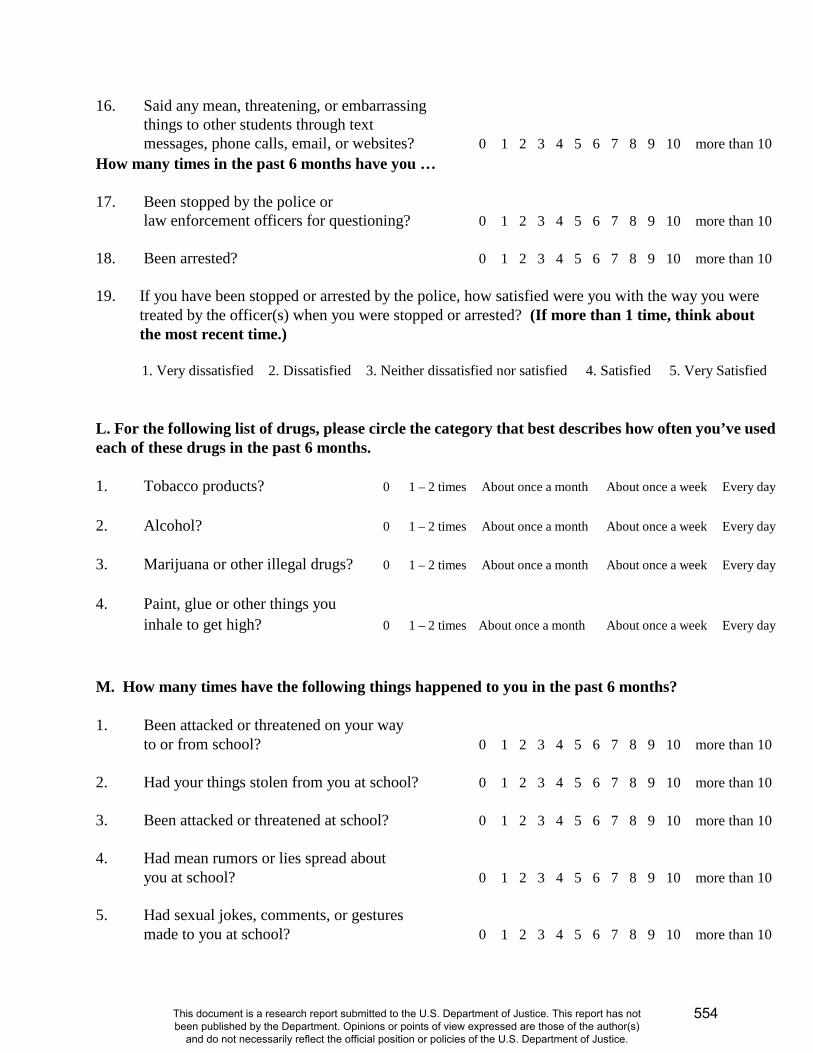
16. Said any mean, threatening, or embarrassing things to other students through text messages, phone calls, email, or websites? 0 1 2 3 4 5 6 7 8 9 10 more than 10
How many times in the past 6 months have you … 17. Been stopped by the police or law enforcement officers for questioning? 0 1 2 3 4 5 6 7 8 9 10 more than 10 18. Been arrested? 0 1 2 3 4 5 6 7 8 9 10 more than 10 19. If you have been stopped or arrested by the police, how satisfied were you with the way you were treated by the officer(s) when you were stopped or arrested? (If more than 1 time, think about the most recent time.) 1. Very dissatisfied 2. Dissatisfied 3. Neither dissatisfied nor satisfied 4. Satisfied 5. Very Satisfied L. For the following list of drugs, please circle the category that best describes how often you’ve used each of these drugs in the past 6 months. 1. Tobacco products? 0 1 – 2 times About once a month About once a week Every day 2. Alcohol? 0 1 – 2 times About once a month About once a week Every day 3. Marijuana or other illegal drugs? 0 1 – 2 times About once a month About once a week Every day 4. Paint, glue or other things you inhale to get high? 0 1 – 2 times About once a month About once a week Every day M. How many times have the following things happened to you in the past 6 months? 1. Been attacked or threatened on your way to or from school? 0 1 2 3 4 5 6 7 8 9 10 more than 10 2. Had your things stolen from you at school? 0 1 2 3 4 5 6 7 8 9 10 more than 10 3. Been attacked or threatened at school? 0 1 2 3 4 5 6 7 8 9 10 more than 10 4. Had mean rumors or lies spread about you at school? 0 1 2 3 4 5 6 7 8 9 10 more than 10 5. Had sexual jokes, comments, or gestures made to you at school? 0 1 2 3 4 5 6 7 8 9 10 more than 10
554
This document is a research report submitted to the U.S. Department of Justice. This report has not been published by the Department. Opinions or points of view expressed are those of the author(s)
and do not necessarily reflect the official position or policies of the U.S. Department of Justice.
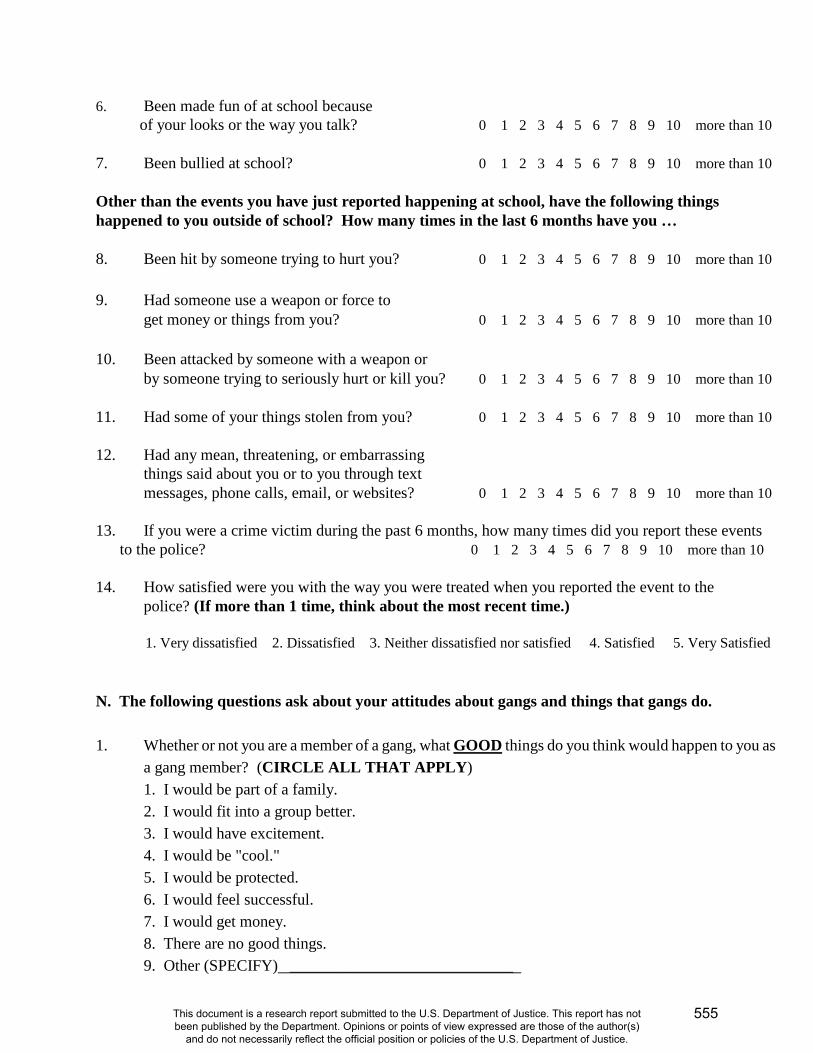
6. Been made fun of at school because of your looks or the way you talk? 0 1 2 3 4 5 6 7 8 9 10 more than 10
7. Been bullied at school? 0 1 2 3 4 5 6 7 8 9 10 more than 10 Other than the events you have just reported happening at school, have the following things happened to you outside of school? How many times in the last 6 months have you … 8. Been hit by someone trying to hurt you? 0 1 2 3 4 5 6 7 8 9 10 more than 10 9. Had someone use a weapon or force to get money or things from you? 0 1 2 3 4 5 6 7 8 9 10 more than 10 10. Been attacked by someone with a weapon or by someone trying to seriously hurt or kill you? 0 1 2 3 4 5 6 7 8 9 10 more than 10 11. Had some of your things stolen from you? 0 1 2 3 4 5 6 7 8 9 10 more than 10 12. Had any mean, threatening, or embarrassing
things said about you or to you through text messages, phone calls, email, or websites? 0 1 2 3 4 5 6 7 8 9 10 more than 10 13. If you were a crime victim during the past 6 months, how many times did you report these events
to the police? 0 1 2 3 4 5 6 7 8 9 10 more than 10 14. How satisfied were you with the way you were treated when you reported the event to the
police? (If more than 1 time, think about the most recent time.) 1. Very dissatisfied 2. Dissatisfied 3. Neither dissatisfied nor satisfied 4. Satisfied 5. Very Satisfied N. The following questions ask about your attitudes about gangs and things that gangs do. 1. Whether or not you are a member of a gang, what GOOD things do you think would happen to you as
a gang member? (CIRCLE ALL THAT APPLY) 1. I would be part of a family. 2. I would fit into a group better. 3. I would have excitement. 4. I would be "cool." 5. I would be protected. 6. I would feel successful. 7. I would get money. 8. There are no good things. 9. Other (SPECIFY) ____________________________
555
This document is a research report submitted to the U.S. Department of Justice. This report has not been published by the Department. Opinions or points of view expressed are those of the author(s)
and do not necessarily reflect the official position or policies of the U.S. Department of Justice.
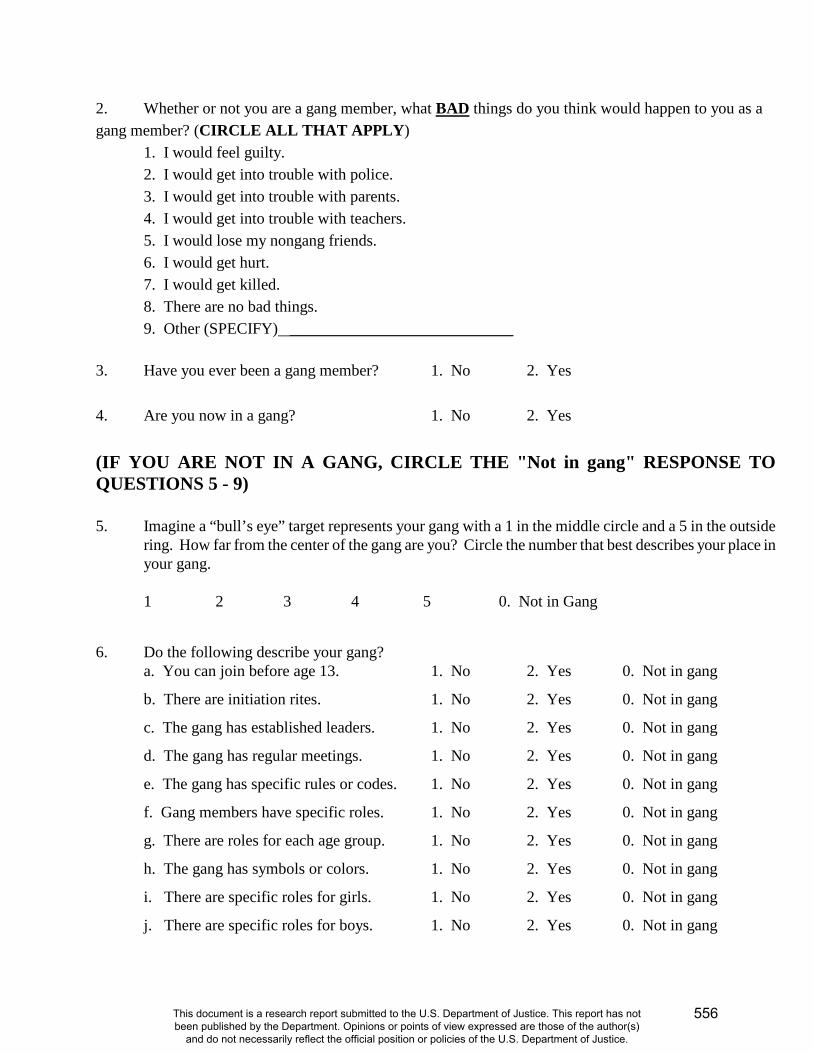
2. Whether or not you are a gang member, what BAD things do you think would happen to you as a gang member? (CIRCLE ALL THAT APPLY)
1. I would feel guilty. 2. I would get into trouble with police. 3. I would get into trouble with parents. 4. I would get into trouble with teachers. 5. I would lose my nongang friends. 6. I would get hurt. 7. I would get killed. 8. There are no bad things. 9. Other (SPECIFY) ____________________________
3. Have you ever been a gang member? 1. No 2. Yes 4. Are you now in a gang? 1. No 2. Yes (IF YOU ARE NOT IN A GANG, CIRCLE THE "Not in gang" RESPONSE TO QUESTIONS 5 - 9) 5. Imagine a “bull’s eye” target represents your gang with a 1 in the middle circle and a 5 in the outside
ring. How far from the center of the gang are you? Circle the number that best describes your place in your gang.
1 2 3 4 5 0. Not in Gang
6. Do the following describe your gang?
a. You can join before age 13. 1. No 2. Yes 0. Not in gang
b. There are initiation rites. 1. No 2. Yes 0. Not in gang
c. The gang has established leaders. 1. No 2. Yes 0. Not in gang
d. The gang has regular meetings. 1. No 2. Yes 0. Not in gang
e. The gang has specific rules or codes. 1. No 2. Yes 0. Not in gang
f. Gang members have specific roles. 1. No 2. Yes 0. Not in gang
g. There are roles for each age group. 1. No 2. Yes 0. Not in gang
h. The gang has symbols or colors. 1. No 2. Yes 0. Not in gang
i. There are specific roles for girls. 1. No 2. Yes 0. Not in gang
j. There are specific roles for boys. 1. No 2. Yes 0. Not in gang
556
This document is a research report submitted to the U.S. Department of Justice. This report has not been published by the Department. Opinions or points of view expressed are those of the author(s)
and do not necessarily reflect the official position or policies of the U.S. Department of Justice.
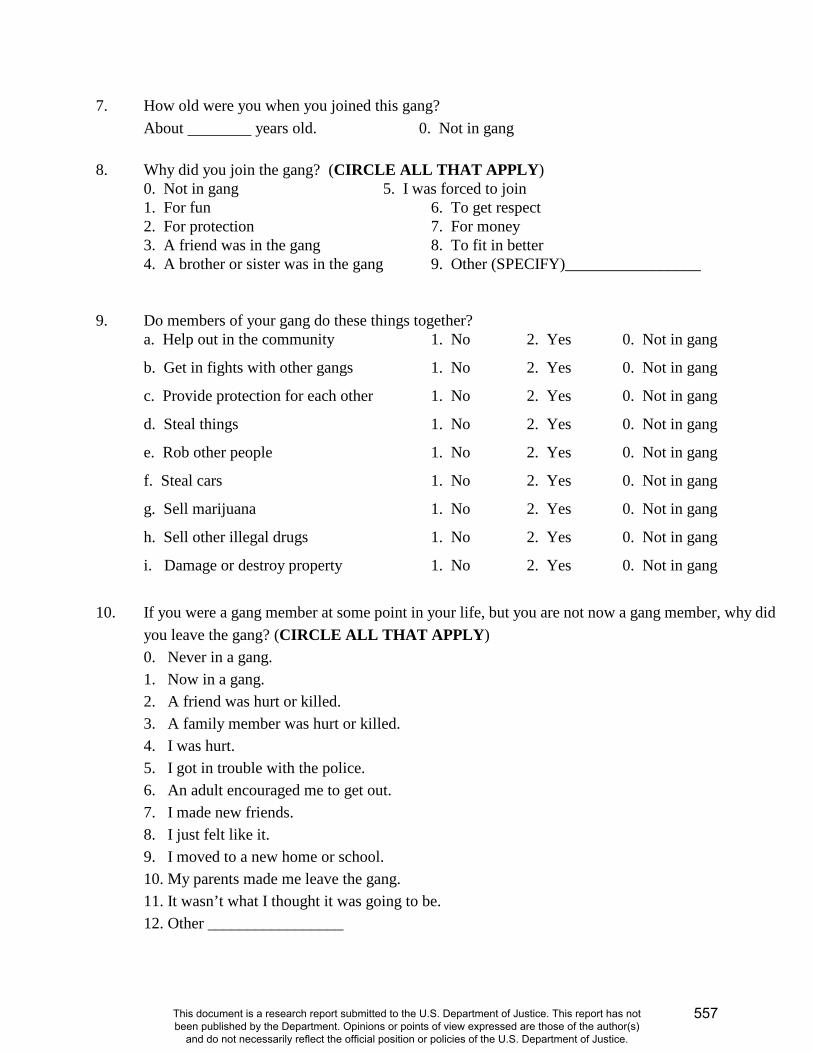
7. How old were you when you joined this gang? About years old. 0. Not in gang
8. Why did you join the gang? (CIRCLE ALL THAT APPLY)
0. Not in gang 5. I was forced to join 1. For fun 6. To get respect 2. For protection 7. For money 3. A friend was in the gang 8. To fit in better 4. A brother or sister was in the gang 9. Other (SPECIFY)_________________
9. Do members of your gang do these things together?
a. Help out in the community 1. No 2. Yes 0. Not in gang
b. Get in fights with other gangs 1. No 2. Yes 0. Not in gang
c. Provide protection for each other 1. No 2. Yes 0. Not in gang
d. Steal things 1. No 2. Yes 0. Not in gang
e. Rob other people 1. No 2. Yes 0. Not in gang
f. Steal cars 1. No 2. Yes 0. Not in gang
g. Sell marijuana 1. No 2. Yes 0. Not in gang
h. Sell other illegal drugs 1. No 2. Yes 0. Not in gang
i. Damage or destroy property 1. No 2. Yes 0. Not in gang
10. If you were a gang member at some point in your life, but you are not now a gang member, why did
you leave the gang? (CIRCLE ALL THAT APPLY) 0. Never in a gang. 1. Now in a gang. 2. A friend was hurt or killed. 3. A family member was hurt or killed. 4. I was hurt. 5. I got in trouble with the police. 6. An adult encouraged me to get out. 7. I made new friends. 8. I just felt like it. 9. I moved to a new home or school. 10. My parents made me leave the gang. 11. It wasn’t what I thought it was going to be. 12. Other _________________
557
This document is a research report submitted to the U.S. Department of Justice. This report has not been published by the Department. Opinions or points of view expressed are those of the author(s)
and do not necessarily reflect the official position or policies of the U.S. Department of Justice.

11. If you were a gang member at some point in your life, but you are not now a gang member, how did you leave the gang? (CIRCLE ALL THAT APPLY) 0. Never in a gang. 1. Now in a gang. 2. I just left. 3. I moved away. 4. I had to fight other members of the gang (“jumped out or beaten out”). 5. I had to commit a crime. 6. I was allowed out by gang leaders. 7. Other ______________
12. If you were a gang member at some point in your life, but you are not now a gang member, were there
any consequences that resulted from you leaving the gang? 0. Never in a gang 1. Now in a gang 2. No 3. Yes
12a. IF YES, what were those consequences? (CIRCLE ALL THAT APPLY) 1. I was beaten up by members of my former gang. 2. I was beaten up by members of another gang. 3. A family member was hurt or killed. 4. A friend was hurt or killed. 5. I was threatened. 6. My friends or family were threatened. 7. I lost my gang friends. 8. Other _____________________
O. Sometimes we find that we need help with various problems that are encountered at school or elsewhere. Please indicate how much you agree or disagree with the following statements about different kinds of services or assistance that are available to people when they need help. 1. You are aware of programs and services in your community that help victims of crime. 1. Strongly Disagree 2. Disagree 3. Neither Agree nor Disagree 4. Agree 5. Strongly Agree
2. You know where a person can go for help if he/she is victimized. 1. Strongly Disagree 2. Disagree 3. Neither Agree nor Disagree 4. Agree 5. Strongly Agree
558
This document is a research report submitted to the U.S. Department of Justice. This report has not been published by the Department. Opinions or points of view expressed are those of the author(s)
and do not necessarily reflect the official position or policies of the U.S. Department of Justice.
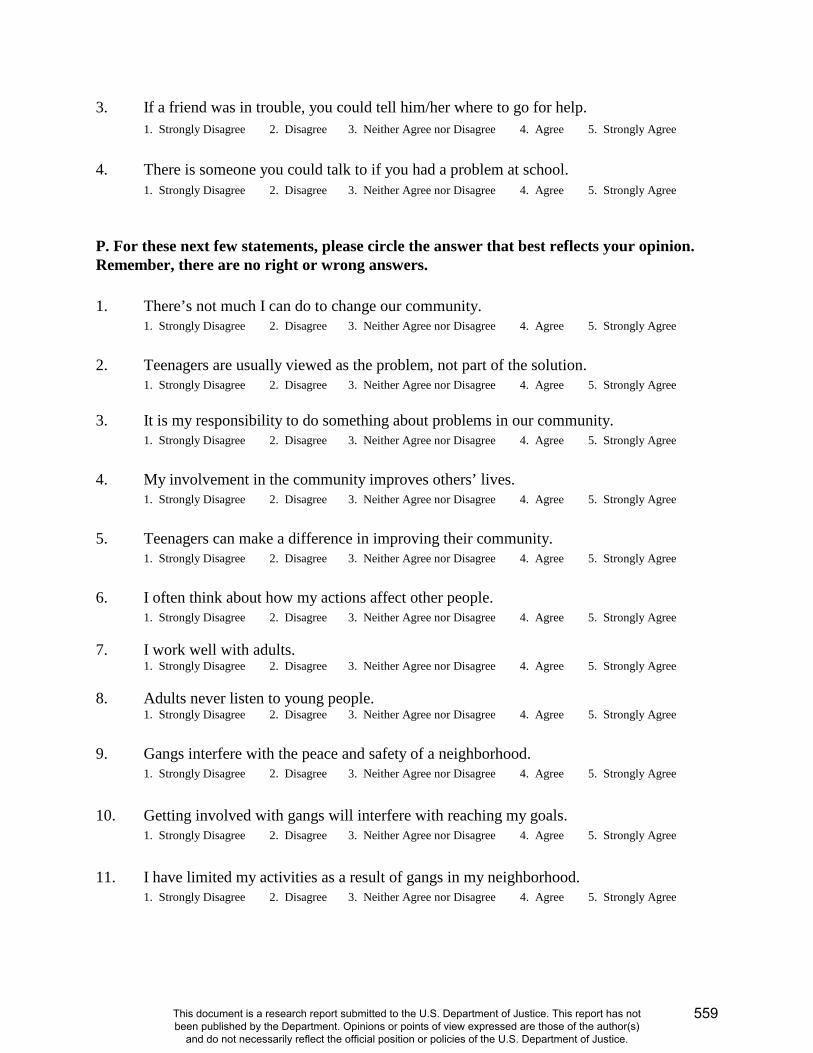
3. If a friend was in trouble, you could tell him/her where to go for help. 1. Strongly Disagree 2. Disagree 3. Neither Agree nor Disagree 4. Agree 5. Strongly Agree
4. There is someone you could talk to if you had a problem at school. 1. Strongly Disagree 2. Disagree 3. Neither Agree nor Disagree 4. Agree 5. Strongly Agree
P. For these next few statements, please circle the answer that best reflects your opinion. Remember, there are no right or wrong answers. 1. There’s not much I can do to change our community. 1. Strongly Disagree 2. Disagree 3. Neither Agree nor Disagree 4. Agree 5. Strongly Agree 2. Teenagers are usually viewed as the problem, not part of the solution. 1. Strongly Disagree 2. Disagree 3. Neither Agree nor Disagree 4. Agree 5. Strongly Agree 3. It is my responsibility to do something about problems in our community. 1. Strongly Disagree 2. Disagree 3. Neither Agree nor Disagree 4. Agree 5. Strongly Agree 4. My involvement in the community improves others’ lives. 1. Strongly Disagree 2. Disagree 3. Neither Agree nor Disagree 4. Agree 5. Strongly Agree 5. Teenagers can make a difference in improving their community. 1. Strongly Disagree 2. Disagree 3. Neither Agree nor Disagree 4. Agree 5. Strongly Agree 6. I often think about how my actions affect other people. 1. Strongly Disagree 2. Disagree 3. Neither Agree nor Disagree 4. Agree 5. Strongly Agree 7. I work well with adults. 1. Strongly Disagree 2. Disagree 3. Neither Agree nor Disagree 4. Agree 5. Strongly Agree 8. Adults never listen to young people. 1. Strongly Disagree 2. Disagree 3. Neither Agree nor Disagree 4. Agree 5. Strongly Agree 9. Gangs interfere with the peace and safety of a neighborhood.
1. Strongly Disagree 2. Disagree 3. Neither Agree nor Disagree 4. Agree 5. Strongly Agree 10. Getting involved with gangs will interfere with reaching my goals.
1. Strongly Disagree 2. Disagree 3. Neither Agree nor Disagree 4. Agree 5. Strongly Agree 11. I have limited my activities as a result of gangs in my neighborhood.
1. Strongly Disagree 2. Disagree 3. Neither Agree nor Disagree 4. Agree 5. Strongly Agree
559
This document is a research report submitted to the U.S. Department of Justice. This report has not been published by the Department. Opinions or points of view expressed are those of the author(s)
and do not necessarily reflect the official position or policies of the U.S. Department of Justice.
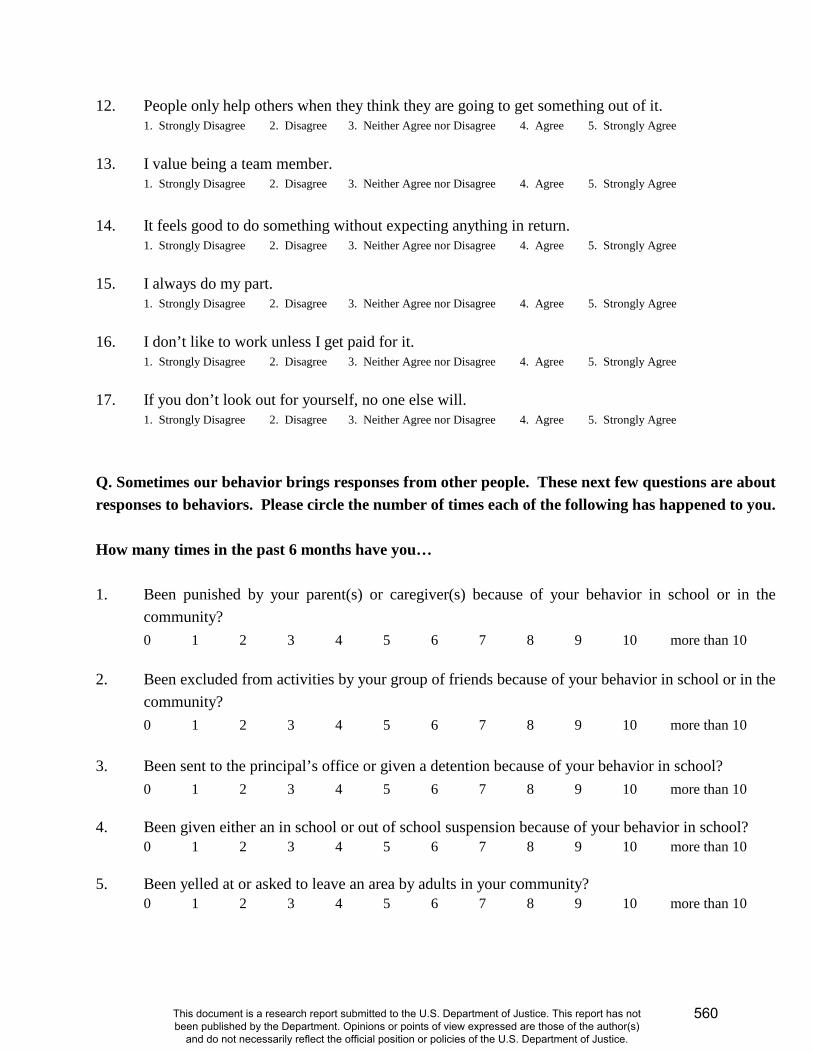
12. People only help others when they think they are going to get something out of it. 1. Strongly Disagree 2. Disagree 3. Neither Agree nor Disagree 4. Agree 5. Strongly Agree
13. I value being a team member. 1. Strongly Disagree 2. Disagree 3. Neither Agree nor Disagree 4. Agree 5. Strongly Agree 14. It feels good to do something without expecting anything in return.
1. Strongly Disagree 2. Disagree 3. Neither Agree nor Disagree 4. Agree 5. Strongly Agree 15. I always do my part.
1. Strongly Disagree 2. Disagree 3. Neither Agree nor Disagree 4. Agree 5. Strongly Agree 16. I don’t like to work unless I get paid for it.
1. Strongly Disagree 2. Disagree 3. Neither Agree nor Disagree 4. Agree 5. Strongly Agree 17. If you don’t look out for yourself, no one else will.
1. Strongly Disagree 2. Disagree 3. Neither Agree nor Disagree 4. Agree 5. Strongly Agree Q. Sometimes our behavior brings responses from other people. These next few questions are about responses to behaviors. Please circle the number of times each of the following has happened to you. How many times in the past 6 months have you… 1. Been punished by your parent(s) or caregiver(s) because of your behavior in school or in the
community? 0 1 2 3 4 5 6 7 8 9 10 more than 10 2. Been excluded from activities by your group of friends because of your behavior in school or in the
community? 0 1 2 3 4 5 6 7 8 9 10 more than 10 3. Been sent to the principal’s office or given a detention because of your behavior in school? 0 1 2 3 4 5 6 7 8 9 10 more than 10 4. Been given either an in school or out of school suspension because of your behavior in school? 0 1 2 3 4 5 6 7 8 9 10 more than 10 5. Been yelled at or asked to leave an area by adults in your community? 0 1 2 3 4 5 6 7 8 9 10 more than 10
560
This document is a research report submitted to the U.S. Department of Justice. This report has not been published by the Department. Opinions or points of view expressed are those of the author(s)
and do not necessarily reflect the official position or policies of the U.S. Department of Justice.
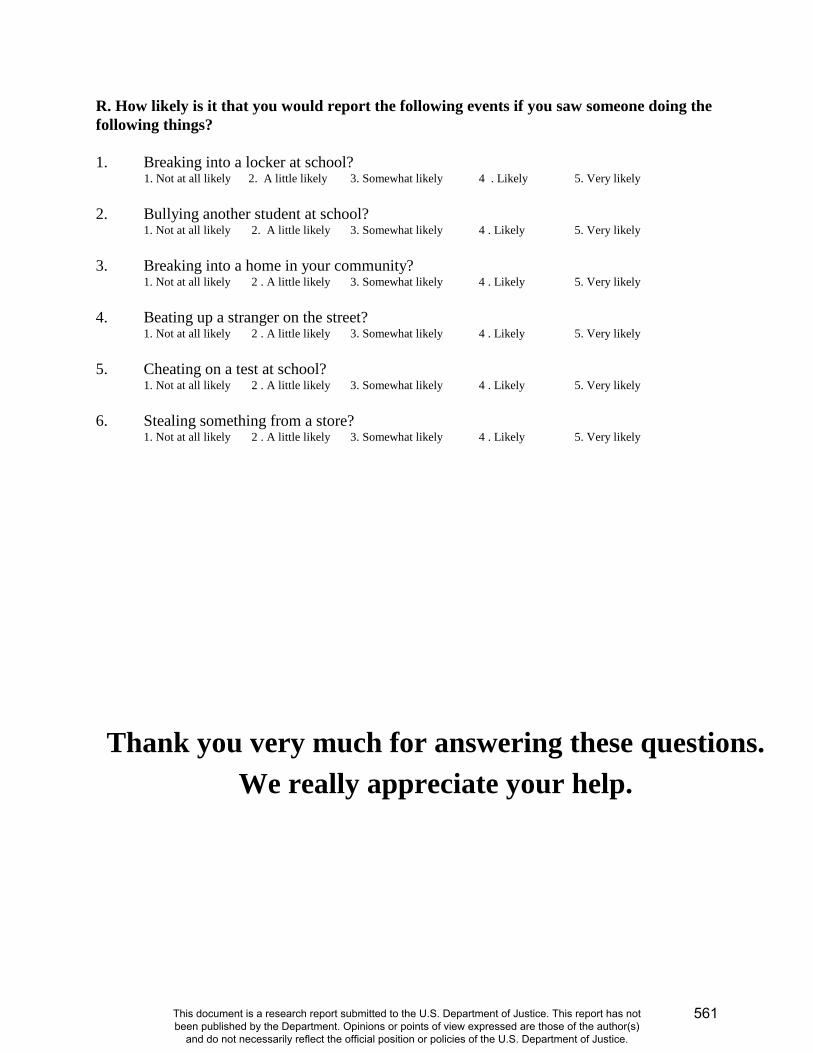
R. How likely is it that you would report the following events if you saw someone doing the following things? 1. Breaking into a locker at school?
1. Not at all likely 2. A little likely 3. Somewhat likely 4 . Likely 5. Very likely 2. Bullying another student at school?
1. Not at all likely 2. A little likely 3. Somewhat likely 4 . Likely 5. Very likely 3. Breaking into a home in your community?
1. Not at all likely 2 . A little likely 3. Somewhat likely 4 . Likely 5. Very likely 4. Beating up a stranger on the street?
1. Not at all likely 2 . A little likely 3. Somewhat likely 4 . Likely 5. Very likely 5. Cheating on a test at school?
1. Not at all likely 2 . A little likely 3. Somewhat likely 4 . Likely 5. Very likely 6. Stealing something from a store?
1. Not at all likely 2 . A little likely 3. Somewhat likely 4 . Likely 5. Very likely
Thank you very much for answering these questions. We really appreciate your help.
561
This document is a research report submitted to the U.S. Department of Justice. This report has not been published by the Department. Opinions or points of view expressed are those of the author(s)
and do not necessarily reflect the official position or policies of the U.S. Department of Justice.

NATIONAL EVALUATION OF G.R.E.A.T.
STUDENT QUESTIONNAIRE
Wave 5
School Year 2009 - 2010
University of Missouri-St. Louis Department of Criminology and Criminal Justice
8001 Natural Bridge Road St. Louis, MO 63121
562
This document is a research report submitted to the U.S. Department of Justice. This report has not been published by the Department. Opinions or points of view expressed are those of the author(s)
and do not necessarily reflect the official position or policies of the U.S. Department of Justice.
INSTRUCTIONS 1. Please answer the questions in the order they appear. 2. Circle the number that shows your best answer to each question. 3. There are no right or wrong answers. Your opinion is what counts. 4. Do NOT write your name on the questionnaire. 5. Your answers are CONFIDENTIAL - - no one outside of our research office will ever
connect your name with the answers you give. 6. You have the right to skip any question that you do not want to answer. 7. You can stop filling out the questionnaire any time you wish. WE HOPE YOU ENJOY ANSWERING THESE QUESTIONS
563
This document is a research report submitted to the U.S. Department of Justice. This report has not been published by the Department. Opinions or points of view expressed are those of the author(s)
and do not necessarily reflect the official position or policies of the U.S. Department of Justice.
Please provide the following information. Once you have completed this page, tear it out and give it to one of the researchers. You will receive $5.00 for completing the 2009 student questionnaire for the Evaluation of the Gang Resistance Education and Training (G.R.E.A.T.) program. PLEASE PRINT Your Name:____________________________________________ (First) (Middle) (Last) Address: ______________________________________________ ______________________________________________________ (City) (State) (Zip Code) Signature:___________________________________ Date: ____________________________________
564
This document is a research report submitted to the U.S. Department of Justice. This report has not been published by the Department. Opinions or points of view expressed are those of the author(s)
and do not necessarily reflect the official position or policies of the U.S. Department of Justice.

A. We are going to begin with a few questions about you and your background. Please circle the response that best describes you. 1. I am 1. Male 2. Female 2. I am 1. White/Anglo, not Hispanic (CIRCLE ALL THAT APPLY)
2. Black/African-American 3. Hispanic/Latino 4. American Indian/Native American 5. Asian/Pacific Islander/Oriental 6. Other (SPECIFY) ________________________________
3. How old are you? 12 13 14 15 16 17 18 4. I live with 1. my mother and my father
2. my mother only 3. my father only 4. my mother and stepfather 5. my father and stepmother 6. my mother and other adult (SPECIFY)_________________ 7. my father and other adult (SPECIFY) __________________ 8. other relatives (SPECIFY)___________________________ 9. other (SPECIFY)__________________________________
7. How many times have you moved this year (since January 1, 2009)? Times
9. Looking at all your grades at school, would you say you were closest to a ….
1. Straight A student 4. D student 2. B student 5. F student 3. C student 6. Something else __________________
10. Other than English, is there another language spoken in your home?
1. No 2. Yes 10a. IF YES, what language? ____________________
565
This document is a research report submitted to the U.S. Department of Justice. This report has not been published by the Department. Opinions or points of view expressed are those of the author(s)
and do not necessarily reflect the official position or policies of the U.S. Department of Justice.

B. Much of our time is spent in schools and neighborhoods and these places affect how we feel about a lot of other things. Thinking about your school and neighborhood, please indicate how much of a problem each of the following is in your school and neighborhood. That is, are these things not a problem, somewhat of a problem, or a big problem? 1. Kids bullying or teasing other children at your school 1. Not a problem 2. Somewhat of a problem 3. A big problem 2. Places in your school where some students are afraid to go 1. Not a problem 2. Somewhat of a problem 3. A big problem 3. Students beating up or threatening other students at your school 1. Not a problem 2. Somewhat of a problem 3. A big problem 4. Kids of different racial or cultural groups at your school not getting along with each other 1. Not a problem 2. Somewhat of a problem 3. A big problem 5. Students bringing guns to school 1. Not a problem 2. Somewhat of a problem 3. A big problem 6. Having things stolen at school 1. Not a problem 2. Somewhat of a problem 3. A big problem 7. Run-down or poorly kept buildings in your neighborhood 1. Not a problem 2. Somewhat of a problem 3. A big problem 8. Groups of people hanging out in public places causing trouble in your neighborhood 1. Not a problem 2. Somewhat of a problem 3. A big problem 9. Graffiti on buildings and fences in your neighborhood 1. Not a problem 2. Somewhat of a problem 3. A big problem 10. Hearing gunshots in your neighborhood 1. Not a problem 2. Somewhat of a problem 3. A big problem 11. Cars traveling too fast throughout the streets of your neighborhood 1. Not a problem 2. Somewhat of a problem 3. A big problem 12. Gangs in your neighborhood 1. Not a problem 2. Somewhat of a problem 3. A big problem
566
This document is a research report submitted to the U.S. Department of Justice. This report has not been published by the Department. Opinions or points of view expressed are those of the author(s)
and do not necessarily reflect the official position or policies of the U.S. Department of Justice.

These next few questions are about how afraid you are of certain situations. Please indicate how afraid you are of the following things happening to you. 13. Having someone break into your house while you are there 1. Not at all afraid 2. A little afraid 3. Somewhat afraid 4. Afraid 5. Very afraid 14. Having someone break into your house while you are away 1. Not at all afraid 2. A little afraid 3. Somewhat afraid 4. Afraid 5. Very afraid 15. Having your property damaged by someone 1. Not at all afraid 2. A little afraid 3. Somewhat afraid 4. Afraid 5. Very afraid 16. Being robbed or mugged 1. Not at all afraid 2. A little afraid 3. Somewhat afraid 4. Afraid 5. Very afraid 17. Being attacked by someone with a weapon 1. Not at all afraid 2. A little afraid 3. Somewhat afraid 4. Afraid 5. Very afraid 18. Being attacked or threatened on your way to or from school 1. Not at all afraid 2. A little afraid 3. Somewhat afraid 4. Afraid 5. Very afraid 19. Having your things stolen from you at school 1. Not at all afraid 2. A little afraid 3. Somewhat afraid 4. Afraid 5. Very afraid 20. Being attacked or threatened at school 1. Not at all afraid 2. A little afraid 3. Somewhat afraid 4. Afraid 5. Very afraid C. For the next set of statements, indicate how much you think these statements describe you. That is, how much do you agree or disagree with each statement? There are no right or wrong answers; it is your opinion that counts. 1. When I go someplace, I leave a note for my parents or call them to tell them where I am.
1. Strongly Disagree 2. Disagree 3. Neither Agree nor Disagree 4. Agree 5. Strongly Agree 2. My parents know where I am when I am not at home or at school.
1. Strongly Disagree 2. Disagree 3. Neither Agree nor Disagree 4. Agree 5. Strongly Agree 3. I know how to get in touch with my parents if they are not at home.
1. Strongly Disagree 2. Disagree 3. Neither Agree nor Disagree 4. Agree 5. Strongly Agree 4. My parents know who I am with if I am not at home.
1. Strongly Disagree 2. Disagree 3. Neither Agree nor Disagree 4. Agree 5. Strongly Agree
567
This document is a research report submitted to the U.S. Department of Justice. This report has not been published by the Department. Opinions or points of view expressed are those of the author(s)
and do not necessarily reflect the official position or policies of the U.S. Department of Justice.

5. I often act without stopping to think. 1. Strongly Disagree 2. Disagree 3. Neither Agree nor Disagree 4. Agree 5. Strongly Agree
6. I don't devote much thought and effort to preparing for the future.
1. Strongly Disagree 2. Disagree 3. Neither Agree nor Disagree 4. Agree 5. Strongly Agree 7. I often do whatever brings me pleasure here and now, even at the cost of some distant goal.
1. Strongly Disagree 2. Disagree 3. Neither Agree nor Disagree 4. Agree 5. Strongly Agree 8. I'm more concerned with what happens to me in the short run than in the long run.
1. Strongly Disagree 2. Disagree 3. Neither Agree nor Disagree 4. Agree 5. Strongly Agree 9. I like to test myself every now and then by doing something a little risky.
1. Strongly Disagree 2. Disagree 3. Neither Agree nor Disagree 4. Agree 5. Strongly Agree 10. Sometimes I will take a risk just for the fun of it.
1. Strongly Disagree 2. Disagree 3. Neither Agree nor Disagree 4. Agree 5. Strongly Agree 11. I sometimes find it exciting to do things for which I might get in trouble.
1. Strongly Disagree 2. Disagree 3. Neither Agree nor Disagree 4. Agree 5. Strongly Agree 12. Excitement and adventure are more important to me than security.
1. Strongly Disagree 2. Disagree 3. Neither Agree nor Disagree 4. Agree 5. Strongly Agree 13. I lose my temper pretty easily.
1. Strongly Disagree 2. Disagree 3. Neither Agree nor Disagree 4. Agree 5. Strongly Agree 14. Often when I’m angry at people, I feel more like hurting them than talking to them about why I am
angry. 1. Strongly Disagree 2. Disagree 3. Neither Agree nor Disagree 4. Agree 5. Strongly Agree
15. When I’m really angry, other people better stay away from me. 1. Strongly Disagree 2. Disagree 3. Neither Agree nor Disagree 4. Agree 5. Strongly Agree
16. When I have a serious disagreement with someone, it’s usually hard for me to talk calmly about it
without getting upset. 1. Strongly Disagree 2. Disagree 3. Neither Agree nor Disagree 4. Agree 5. Strongly Agree
17. I try to look out for myself first, even if it means making things difficult for other people.
1. Strongly Disagree 2. Disagree 3. Neither Agree nor Disagree 4. Agree 5. Strongly Agree
568
This document is a research report submitted to the U.S. Department of Justice. This report has not been published by the Department. Opinions or points of view expressed are those of the author(s)
and do not necessarily reflect the official position or policies of the U.S. Department of Justice.
18. I’m not very sympathetic to other people when they are having problems. 1. Strongly Disagree 2. Disagree 3. Neither Agree nor Disagree 4. Agree 5. Strongly Agree
19. If things I do upset people, it’s their problem not mine.
1. Strongly Disagree 2. Disagree 3. Neither Agree nor Disagree 4. Agree 5. Strongly Agree 20. I will try to get the things I want even when I know it’s causing problems for other people.
1. Strongly Disagree 2. Disagree 3. Neither Agree nor Disagree 4. Agree 5. Strongly Agree D. The next few statements are about your attitudes toward the police. 1. Police officers are honest.
1. Strongly Disagree 2. Disagree 3. Neither Agree nor Disagree 4. Agree 5. Strongly Agree 2. Police officers are hardworking.
1. Strongly Disagree 2. Disagree 3. Neither Agree nor Disagree 4. Agree 5. Strongly Agree 3. Most police officers are usually friendly.
1. Strongly Disagree 2. Disagree 3. Neither Agree nor Disagree 4. Agree 5. Strongly Agree 4. Police officers are usually courteous.
1. Strongly Disagree 2. Disagree 3. Neither Agree nor Disagree 4. Agree 5. Strongly Agree 5. Police officers are respectful toward people like me.
1. Strongly Disagree 2. Disagree 3. Neither Agree nor Disagree 4. Agree 5. Strongly Agree 6. I feel safer when police officers are in my school.
1. Strongly Disagree 2. Disagree 3. Neither Agree nor Disagree 4. Agree 5. Strongly Agree 7. Police officers make good teachers.
1. Strongly Disagree 2. Disagree 3. Neither Agree nor Disagree 4. Agree 5. Strongly Agree 8. Police officers don't know much about gangs.
1. Strongly Disagree 2. Disagree 3. Neither Agree nor Disagree 4. Agree 5. Strongly Agree
569
This document is a research report submitted to the U.S. Department of Justice. This report has not been published by the Department. Opinions or points of view expressed are those of the author(s)
and do not necessarily reflect the official position or policies of the U.S. Department of Justice.
E. For the next set of questions, think about your current group of friends. During the last year, how many of your current friends have done the following? 1. Gotten along well with teachers and adults at school?
1. None of them 2. Few of them 3. Half of them 4. Most of them 5. All of them 2. Have been thought of as good students?
1. None of them 2. Few of them 3. Half of them 4. Most of them 5. All of them 3. Have been generally honest and told the truth?
1. None of them 2. Few of them 3. Half of them 4. Most of them 5. All of them 4. Almost always obeyed school rules?
1. None of them 2. Few of them 3. Half of them 4. Most of them 5. All of them Still thinking about your current friends, how likely is it that you would go along with them if they wanted you to do the following things with them? 5. Bully another student at school?
1. Not at All Likely 2. A Little Likely 3. Somewhat Likely 4. Likely 5. Very Likely 6. Break into a home in your community?
1. Not at All Likely 2. A Little Likely 3. Somewhat Likely 4. Likely 5. Very Likely 7. Beat up a stranger on the street?
1. Not at All Likely 2. A Little Likely 3. Somewhat Likely 4. Likely 5. Very Likely 8. Cheat on a test at school?
1. Not at All Likely 2. A Little Likely 3. Somewhat Likely 4. Likely 5. Very Likely 9. Steal something from a store?
1. Not at All Likely 2. A Little Likely 3. Somewhat Likely 4. Likely 5. Very Likely 10. Drink alcohol?
1. Not at All Likely 2. A Little Likely 3. Somewhat Likely 4. Likely 5. Very Likely 11. Use illegal drugs?
1. Not at All Likely 2. A Little Likely 3. Somewhat Likely 4. Likely 5. Very Likely 12. If your group of friends was getting you into trouble at home, how likely is it that you would still hang
out with them? 1. Not at All Likely 2. A Little Likely 3. Somewhat Likely 4. Likely 5. Very Likely
13. If your group of friends was getting you into trouble at school, how likely is it that you would still
570
This document is a research report submitted to the U.S. Department of Justice. This report has not been published by the Department. Opinions or points of view expressed are those of the author(s)
and do not necessarily reflect the official position or policies of the U.S. Department of Justice.
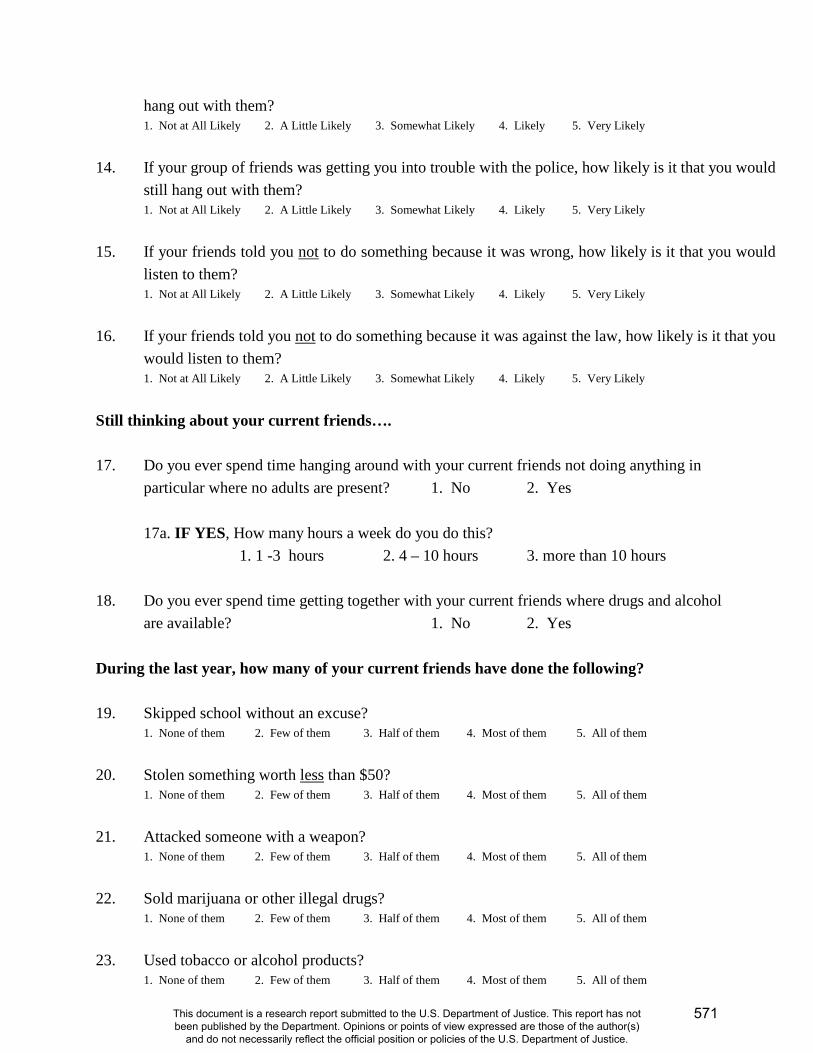
hang out with them? 1. Not at All Likely 2. A Little Likely 3. Somewhat Likely 4. Likely 5. Very Likely
14. If your group of friends was getting you into trouble with the police, how likely is it that you would
still hang out with them? 1. Not at All Likely 2. A Little Likely 3. Somewhat Likely 4. Likely 5. Very Likely
15. If your friends told you not to do something because it was wrong, how likely is it that you would
listen to them? 1. Not at All Likely 2. A Little Likely 3. Somewhat Likely 4. Likely 5. Very Likely
16. If your friends told you not to do something because it was against the law, how likely is it that you
would listen to them? 1. Not at All Likely 2. A Little Likely 3. Somewhat Likely 4. Likely 5. Very Likely
Still thinking about your current friends…. 17. Do you ever spend time hanging around with your current friends not doing anything in particular where no adults are present? 1. No 2. Yes 17a. IF YES, How many hours a week do you do this?
1. 1 -3 hours 2. 4 – 10 hours 3. more than 10 hours 18. Do you ever spend time getting together with your current friends where drugs and alcohol are available? 1. No 2. Yes During the last year, how many of your current friends have done the following? 19. Skipped school without an excuse?
1. None of them 2. Few of them 3. Half of them 4. Most of them 5. All of them 20. Stolen something worth less than $50?
1. None of them 2. Few of them 3. Half of them 4. Most of them 5. All of them 21. Attacked someone with a weapon?
1. None of them 2. Few of them 3. Half of them 4. Most of them 5. All of them 22. Sold marijuana or other illegal drugs?
1. None of them 2. Few of them 3. Half of them 4. Most of them 5. All of them 23. Used tobacco or alcohol products?
1. None of them 2. Few of them 3. Half of them 4. Most of them 5. All of them
571
This document is a research report submitted to the U.S. Department of Justice. This report has not been published by the Department. Opinions or points of view expressed are those of the author(s)
and do not necessarily reflect the official position or policies of the U.S. Department of Justice.

24. Used marijuana or other illegal drugs?
1. None of them 2. Few of them 3. Half of them 4. Most of them 5. All of them
25. Belonged to a gang?
1. None of them 2. Few of them 3. Half of them 4. Most of them 5. All of them
F. These next few questions are about your opinions about a number of different things. How much do you agree or disagree with these statements? 1. It's okay to tell a small lie if it doesn't hurt anyone.
1. Strongly Disagree 2. Disagree 3. Neither Agree nor Disagree 4. Agree 5. Strongly Agree 2. It's okay to lie if it will keep your friends from getting in trouble with parents, teachers, or police.
1. Strongly Disagree 2. Disagree 3. Neither Agree nor Disagree 4. Agree 5. Strongly Agree 3. It's okay to lie to someone if it will keep you out of trouble with them.
1. Strongly Disagree 2. Disagree 3. Neither Agree nor Disagree 4. Agree 5. Strongly Agree 4. It's okay to steal something from someone who is rich and can easily replace it.
1. Strongly Disagree 2. Disagree 3. Neither Agree nor Disagree 4. Agree 5. Strongly Agree 5. It's okay to take little things from a store without paying for them since stores make so much money
that it won't hurt them. 1. Strongly Disagree 2. Disagree 3. Neither Agree nor Disagree 4. Agree 5. Strongly Agree
6. It's okay to steal something if that's the only way you could ever get it.
1. Strongly Disagree 2. Disagree 3. Neither Agree nor Disagree 4. Agree 5. Strongly Agree 7. It's okay to beat up someone if they hit you first.
1. Strongly Disagree 2. Disagree 3. Neither Agree nor Disagree 4. Agree 5. Strongly Agree 8. It's okay to beat up someone if you have to stand up for or protect your rights.
1. Strongly Disagree 2. Disagree 3. Neither Agree nor Disagree 4. Agree 5. Strongly Agree
9. It's okay to beat up someone if they are threatening to hurt your friends or family.
1. Strongly Disagree 2. Disagree 3. Neither Agree nor Disagree 4. Agree 5. Strongly Agree
These next few questions are about school. 10. Homework is a waste of time.
1. Strongly Disagree 2. Disagree 3. Neither Agree nor Disagree 4. Agree 5. Strongly Agree
572
This document is a research report submitted to the U.S. Department of Justice. This report has not been published by the Department. Opinions or points of view expressed are those of the author(s)
and do not necessarily reflect the official position or policies of the U.S. Department of Justice.
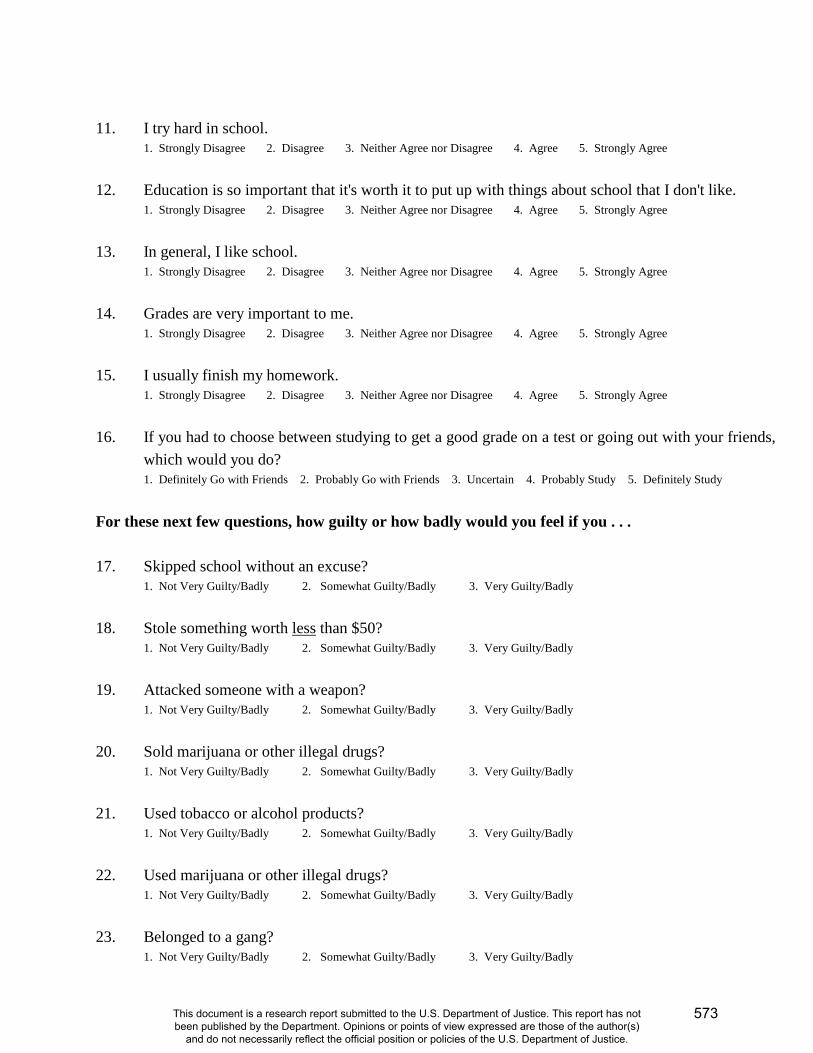
11. I try hard in school.
1. Strongly Disagree 2. Disagree 3. Neither Agree nor Disagree 4. Agree 5. Strongly Agree 12. Education is so important that it's worth it to put up with things about school that I don't like.
1. Strongly Disagree 2. Disagree 3. Neither Agree nor Disagree 4. Agree 5. Strongly Agree 13. In general, I like school.
1. Strongly Disagree 2. Disagree 3. Neither Agree nor Disagree 4. Agree 5. Strongly Agree 14. Grades are very important to me.
1. Strongly Disagree 2. Disagree 3. Neither Agree nor Disagree 4. Agree 5. Strongly Agree 15. I usually finish my homework.
1. Strongly Disagree 2. Disagree 3. Neither Agree nor Disagree 4. Agree 5. Strongly Agree 16. If you had to choose between studying to get a good grade on a test or going out with your friends,
which would you do? 1. Definitely Go with Friends 2. Probably Go with Friends 3. Uncertain 4. Probably Study 5. Definitely Study
For these next few questions, how guilty or how badly would you feel if you . . . 17. Skipped school without an excuse?
1. Not Very Guilty/Badly 2. Somewhat Guilty/Badly 3. Very Guilty/Badly 18. Stole something worth less than $50?
1. Not Very Guilty/Badly 2. Somewhat Guilty/Badly 3. Very Guilty/Badly 19. Attacked someone with a weapon?
1. Not Very Guilty/Badly 2. Somewhat Guilty/Badly 3. Very Guilty/Badly 20. Sold marijuana or other illegal drugs?
1. Not Very Guilty/Badly 2. Somewhat Guilty/Badly 3. Very Guilty/Badly 21. Used tobacco or alcohol products?
1. Not Very Guilty/Badly 2. Somewhat Guilty/Badly 3. Very Guilty/Badly
22. Used marijuana or other illegal drugs? 1. Not Very Guilty/Badly 2. Somewhat Guilty/Badly 3. Very Guilty/Badly
23. Belonged to a gang?
1. Not Very Guilty/Badly 2. Somewhat Guilty/Badly 3. Very Guilty/Badly
573
This document is a research report submitted to the U.S. Department of Justice. This report has not been published by the Department. Opinions or points of view expressed are those of the author(s)
and do not necessarily reflect the official position or policies of the U.S. Department of Justice.

G. Every now and then we get upset with other people. During the past year when you’ve gotten upset with someone, how often have you done the following? 1. Talked to the person about why I was upset.
1. Never 2. Sometimes 3. Often 2. Tried to figure out why I was upset.
1. Never 2. Sometimes 3. Often 3. Did nothing and just stayed angry for a while.
1. Never 2. Sometimes 3. Often 4. Told the person off or yelled at them.
1. Never 2. Sometimes 3. Often 5. Hit the person.
1. Never 2. Sometimes 3. Often When someone else was upset, how often have you done the following things during the past year? 6. Asked the person why he/she was upset.
1. Never 2. Sometimes 3. Often 7. Spoken to him/her in a calm voice.
1. Never 2. Sometimes 3. Often 8. Told the person he/she shouldn’t be upset.
1. Never 2. Sometimes 3. Often 9. Yelled at or argued with the person.
1. Never 2. Sometimes 3. Often And, every now and then we try to avoid doing things that our friends try to get us to do. During the past year when this has happened to you, how often have you done the following? 10. Told the person that I can’t do it because my parents will get upset with me.
1. Never 2. Sometimes 3. Often 11. Tried to get out of it by saying I have other things to do.
1. Never 2. Sometimes 3. Often 12. Said no like I really meant it.
1. Never 2. Sometimes 3. Often 13. Ignored the person.
1. Never 2. Sometimes 3. Often
574
This document is a research report submitted to the U.S. Department of Justice. This report has not been published by the Department. Opinions or points of view expressed are those of the author(s)
and do not necessarily reflect the official position or policies of the U.S. Department of Justice.
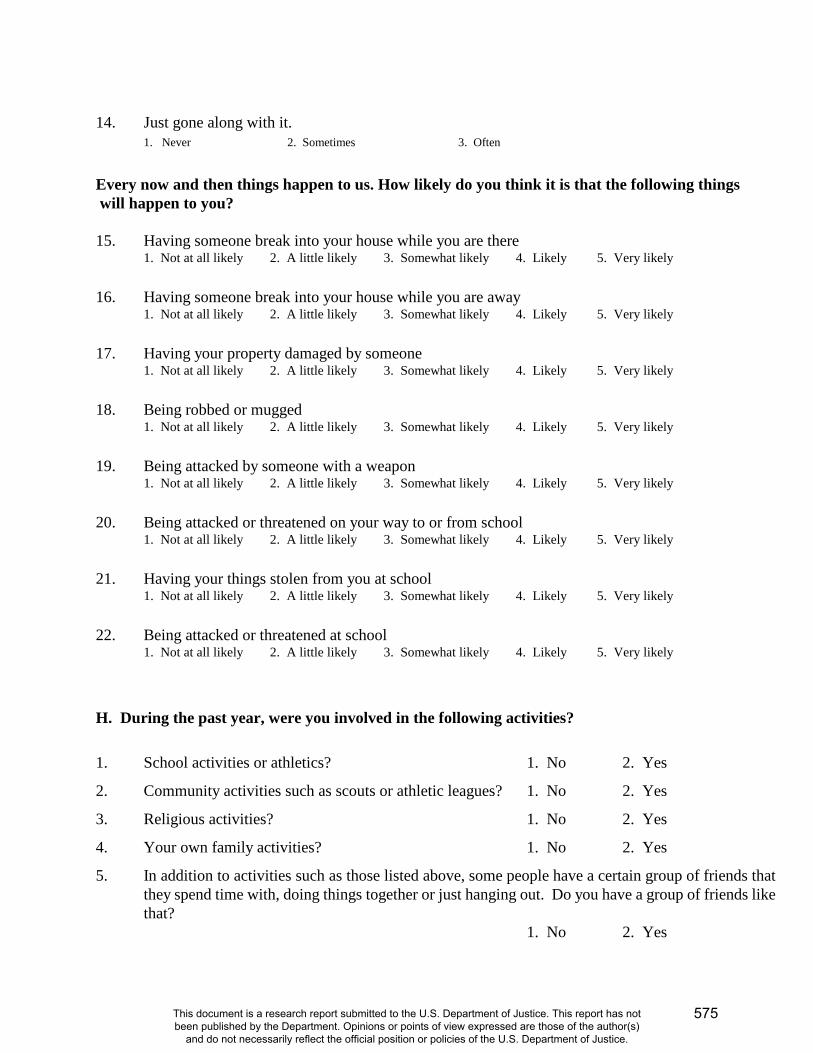
14. Just gone along with it. 1. Never 2. Sometimes 3. Often
Every now and then things happen to us. How likely do you think it is that the following things will happen to you? 15. Having someone break into your house while you are there
1. Not at all likely 2. A little likely 3. Somewhat likely 4. Likely 5. Very likely 16. Having someone break into your house while you are away
1. Not at all likely 2. A little likely 3. Somewhat likely 4. Likely 5. Very likely 17. Having your property damaged by someone
1. Not at all likely 2. A little likely 3. Somewhat likely 4. Likely 5. Very likely 18. Being robbed or mugged
1. Not at all likely 2. A little likely 3. Somewhat likely 4. Likely 5. Very likely 19. Being attacked by someone with a weapon
1. Not at all likely 2. A little likely 3. Somewhat likely 4. Likely 5. Very likely 20. Being attacked or threatened on your way to or from school
1. Not at all likely 2. A little likely 3. Somewhat likely 4. Likely 5. Very likely 21. Having your things stolen from you at school
1. Not at all likely 2. A little likely 3. Somewhat likely 4. Likely 5. Very likely 22. Being attacked or threatened at school
1. Not at all likely 2. A little likely 3. Somewhat likely 4. Likely 5. Very likely
H. During the past year, were you involved in the following activities? 1. School activities or athletics? 1. No 2. Yes
2. Community activities such as scouts or athletic leagues? 1. No 2. Yes
3. Religious activities? 1. No 2. Yes
4. Your own family activities? 1. No 2. Yes
5. In addition to activities such as those listed above, some people have a certain group of friends that they spend time with, doing things together or just hanging out. Do you have a group of friends like that? 1. No 2. Yes
575
This document is a research report submitted to the U.S. Department of Justice. This report has not been published by the Department. Opinions or points of view expressed are those of the author(s)
and do not necessarily reflect the official position or policies of the U.S. Department of Justice.
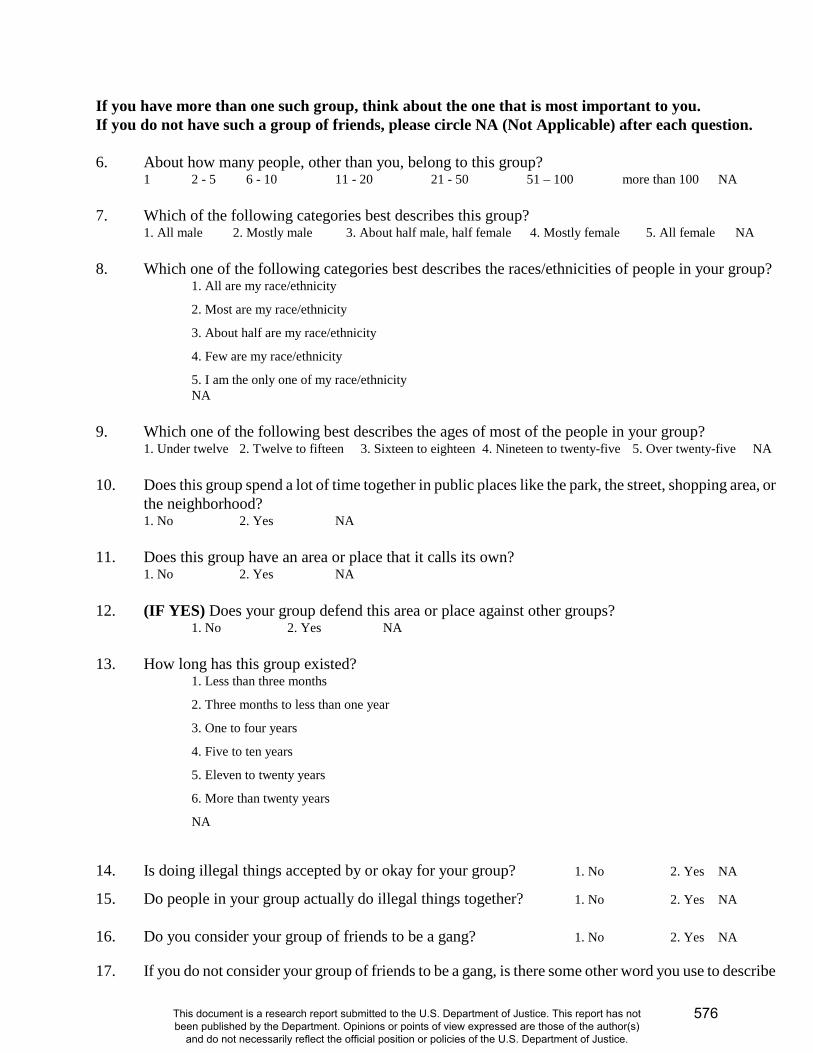
If you have more than one such group, think about the one that is most important to you. If you do not have such a group of friends, please circle NA (Not Applicable) after each question. 6. About how many people, other than you, belong to this group?
1 2 - 5 6 - 10 11 - 20 21 - 50 51 – 100 more than 100 NA
7. Which of the following categories best describes this group? 1. All male 2. Mostly male 3. About half male, half female 4. Mostly female 5. All female NA
8. Which one of the following categories best describes the races/ethnicities of people in your group?
1. All are my race/ethnicity
2. Most are my race/ethnicity
3. About half are my race/ethnicity
4. Few are my race/ethnicity
5. I am the only one of my race/ethnicity NA
9. Which one of the following best describes the ages of most of the people in your group? 1. Under twelve 2. Twelve to fifteen 3. Sixteen to eighteen 4. Nineteen to twenty-five 5. Over twenty-five NA 10. Does this group spend a lot of time together in public places like the park, the street, shopping area, or
the neighborhood? 1. No 2. Yes NA
11. Does this group have an area or place that it calls its own? 1. No 2. Yes NA
12. (IF YES) Does your group defend this area or place against other groups? 1. No 2. Yes NA 13. How long has this group existed?
1. Less than three months
2. Three months to less than one year
3. One to four years
4. Five to ten years
5. Eleven to twenty years
6. More than twenty years
NA
14. Is doing illegal things accepted by or okay for your group? 1. No 2. Yes NA
15. Do people in your group actually do illegal things together? 1. No 2. Yes NA 16. Do you consider your group of friends to be a gang? 1. No 2. Yes NA 17. If you do not consider your group of friends to be a gang, is there some other word you use to describe
576
This document is a research report submitted to the U.S. Department of Justice. This report has not been published by the Department. Opinions or points of view expressed are those of the author(s)
and do not necessarily reflect the official position or policies of the U.S. Department of Justice.
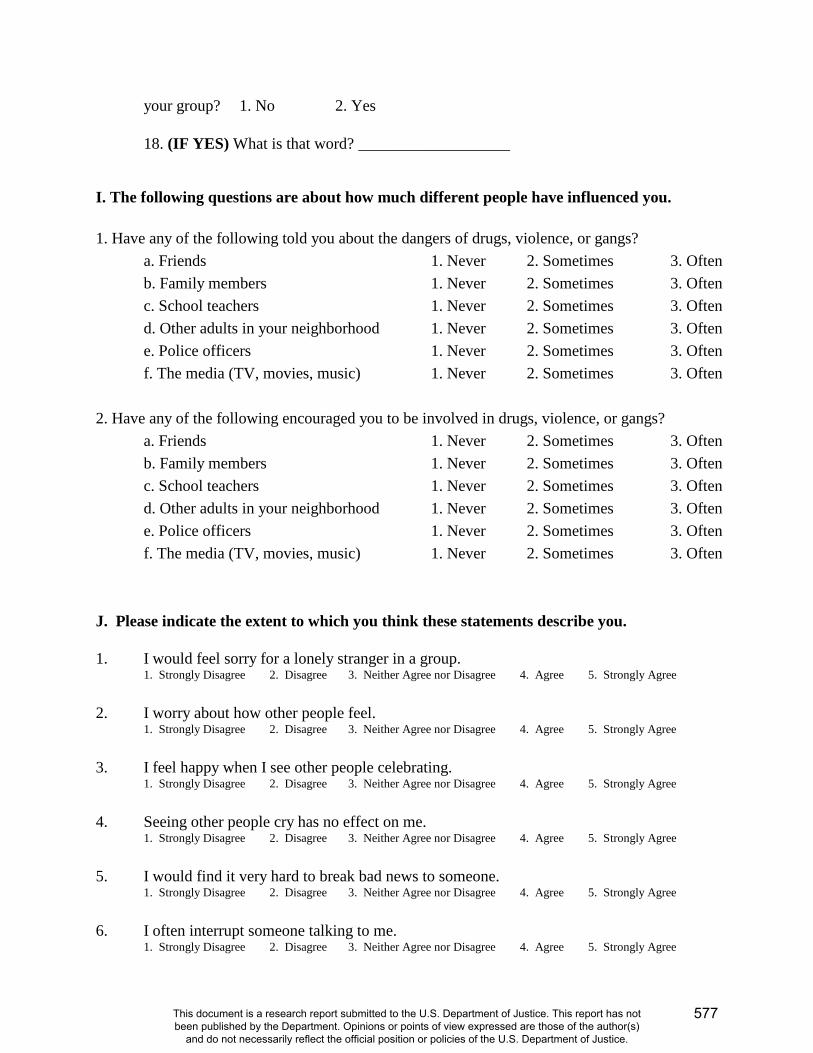
your group? 1. No 2. Yes
18. (IF YES) What is that word? ___________________ I. The following questions are about how much different people have influenced you. 1. Have any of the following told you about the dangers of drugs, violence, or gangs?
a. Friends 1. Never 2. Sometimes 3. Often b. Family members 1. Never 2. Sometimes 3. Often c. School teachers 1. Never 2. Sometimes 3. Often d. Other adults in your neighborhood 1. Never 2. Sometimes 3. Often e. Police officers 1. Never 2. Sometimes 3. Often f. The media (TV, movies, music) 1. Never 2. Sometimes 3. Often
2. Have any of the following encouraged you to be involved in drugs, violence, or gangs?
a. Friends 1. Never 2. Sometimes 3. Often b. Family members 1. Never 2. Sometimes 3. Often c. School teachers 1. Never 2. Sometimes 3. Often d. Other adults in your neighborhood 1. Never 2. Sometimes 3. Often e. Police officers 1. Never 2. Sometimes 3. Often f. The media (TV, movies, music) 1. Never 2. Sometimes 3. Often
J. Please indicate the extent to which you think these statements describe you. 1. I would feel sorry for a lonely stranger in a group.
1. Strongly Disagree 2. Disagree 3. Neither Agree nor Disagree 4. Agree 5. Strongly Agree 2. I worry about how other people feel.
1. Strongly Disagree 2. Disagree 3. Neither Agree nor Disagree 4. Agree 5. Strongly Agree 3. I feel happy when I see other people celebrating.
1. Strongly Disagree 2. Disagree 3. Neither Agree nor Disagree 4. Agree 5. Strongly Agree 4. Seeing other people cry has no effect on me.
1. Strongly Disagree 2. Disagree 3. Neither Agree nor Disagree 4. Agree 5. Strongly Agree 5. I would find it very hard to break bad news to someone.
1. Strongly Disagree 2. Disagree 3. Neither Agree nor Disagree 4. Agree 5. Strongly Agree 6. I often interrupt someone talking to me.
1. Strongly Disagree 2. Disagree 3. Neither Agree nor Disagree 4. Agree 5. Strongly Agree
577
This document is a research report submitted to the U.S. Department of Justice. This report has not been published by the Department. Opinions or points of view expressed are those of the author(s)
and do not necessarily reflect the official position or policies of the U.S. Department of Justice.

7. I look at the person talking to me. 1. Strongly Disagree 2. Disagree 3. Neither Agree nor Disagree 4. Agree 5. Strongly Agree
8. I pay attention to other people’s body language when they are talking to me.
1. Strongly Disagree 2. Disagree 3. Neither Agree nor Disagree 4. Agree 5. Strongly Agree 9. I ask questions of the person speaking to me.
1. Strongly Disagree 2. Disagree 3. Neither Agree nor Disagree 4. Agree 5. Strongly Agree 10. I talk to my friends about my problems.
1. Strongly Disagree 2. Disagree 3. Neither Agree nor Disagree 4. Agree 5. Strongly Agree 11. I talk to adults about my problems.
1. Strongly Disagree 2. Disagree 3. Neither Agree nor Disagree 4. Agree 5. Strongly Agree
12. When I make plans, I am certain I can make them work. 1. Strongly Disagree 2. Disagree 3. Neither Agree nor Disagree 4. Agree 5. Strongly Agree 13. If I can’t do something the first time, I keep trying until I can. 1. Strongly Disagree 2. Disagree 3. Neither Agree nor Disagree 4. Agree 5. Strongly Agree 14. When I have something unpleasant to do, I stick to it until I finish it.
1. Strongly Disagree 2. Disagree 3. Neither Agree nor Disagree 4. Agree 5. Strongly Agree 15. When I decide to do something, I go right to work on it.
1. Strongly Disagree 2. Disagree 3. Neither Agree nor Disagree 4. Agree 5. Strongly Agree 16. Failure just makes me try harder.
1. Strongly Disagree 2. Disagree 3. Neither Agree nor Disagree 4. Agree 5. Strongly Agree How much do you agree or disagree with the following statements? 17. When someone disrespects you, it is important that you use physical force or aggression to teach him
or her not to disrespect you. 1. Strongly disagree 2. Disagree 3. Neither agree nor disagree 4. Agree 5. Strongly agree
18. If someone uses violence against you, it is important that you use violence against him or her to get
even. 1. Strongly disagree 2. Disagree 3. Neither agree nor disagree 4. Agree 5. Strongly agree
19. People will take advantage of you if you don’t let them know how tough you are.
1. Strongly disagree 2. Disagree 3. Neither agree nor disagree 4. Agree 5. Strongly agree 20. People do not respect a person who is afraid to fight physically for his/her rights.
1. Strongly disagree 2. Disagree 3. Neither agree nor disagree 4. Agree 5. Strongly agree 21. Sometimes you need to threaten people in order to get them to treat you fairly.
1. Strongly disagree 2. Disagree 3. Neither agree nor disagree 4. Agree 5. Strongly agree
578
This document is a research report submitted to the U.S. Department of Justice. This report has not been published by the Department. Opinions or points of view expressed are those of the author(s)
and do not necessarily reflect the official position or policies of the U.S. Department of Justice.
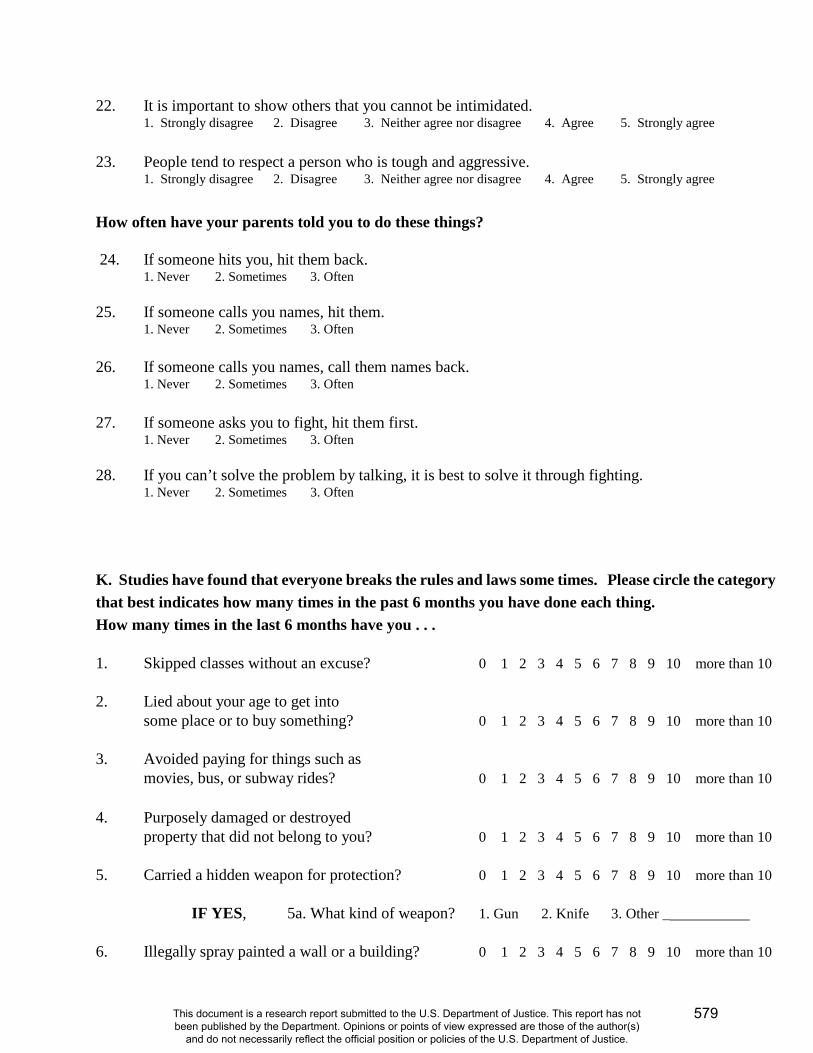
22. It is important to show others that you cannot be intimidated. 1. Strongly disagree 2. Disagree 3. Neither agree nor disagree 4. Agree 5. Strongly agree
23. People tend to respect a person who is tough and aggressive.
1. Strongly disagree 2. Disagree 3. Neither agree nor disagree 4. Agree 5. Strongly agree How often have your parents told you to do these things? 24. If someone hits you, hit them back.
1. Never 2. Sometimes 3. Often 25. If someone calls you names, hit them.
1. Never 2. Sometimes 3. Often
26. If someone calls you names, call them names back. 1. Never 2. Sometimes 3. Often
27. If someone asks you to fight, hit them first.
1. Never 2. Sometimes 3. Often
28. If you can’t solve the problem by talking, it is best to solve it through fighting. 1. Never 2. Sometimes 3. Often
K. Studies have found that everyone breaks the rules and laws some times. Please circle the category that best indicates how many times in the past 6 months you have done each thing. How many times in the last 6 months have you . . . 1. Skipped classes without an excuse? 0 1 2 3 4 5 6 7 8 9 10 more than 10 2. Lied about your age to get into some place or to buy something? 0 1 2 3 4 5 6 7 8 9 10 more than 10 3. Avoided paying for things such as movies, bus, or subway rides? 0 1 2 3 4 5 6 7 8 9 10 more than 10 4. Purposely damaged or destroyed property that did not belong to you? 0 1 2 3 4 5 6 7 8 9 10 more than 10 5. Carried a hidden weapon for protection? 0 1 2 3 4 5 6 7 8 9 10 more than 10 IF YES, 5a. What kind of weapon? 1. Gun 2. Knife 3. Other ___________ 6. Illegally spray painted a wall or a building? 0 1 2 3 4 5 6 7 8 9 10 more than 10
579
This document is a research report submitted to the U.S. Department of Justice. This report has not been published by the Department. Opinions or points of view expressed are those of the author(s)
and do not necessarily reflect the official position or policies of the U.S. Department of Justice.
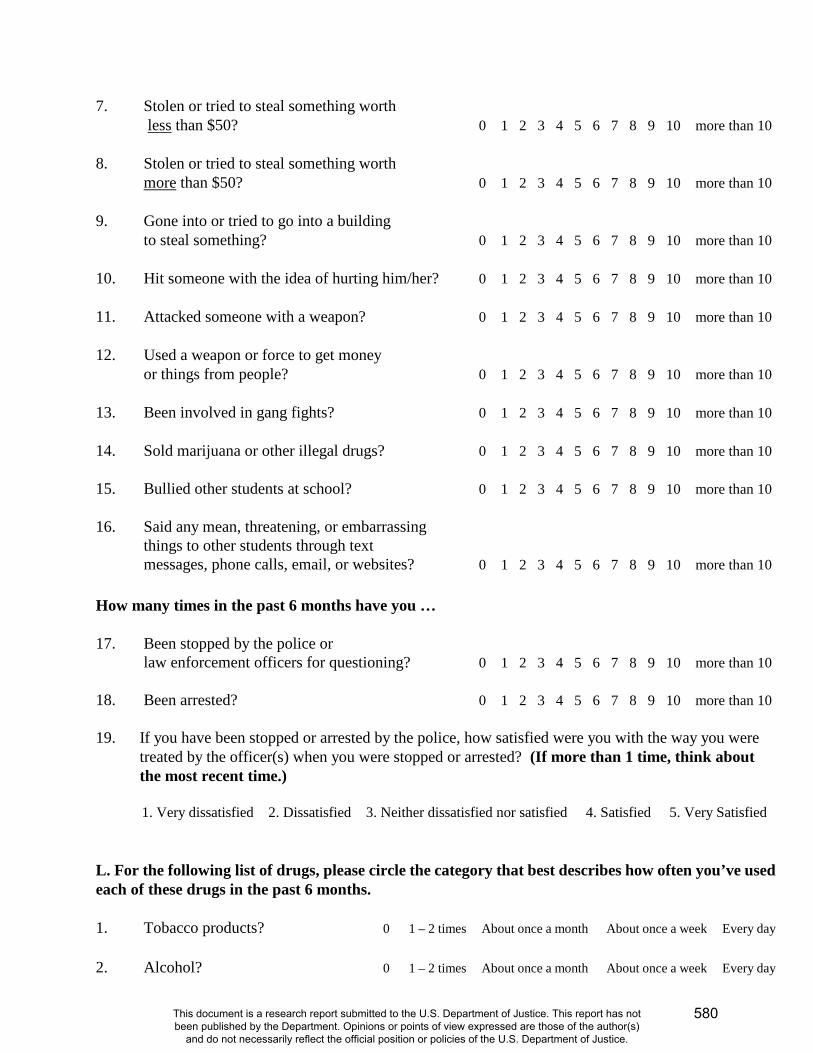
7. Stolen or tried to steal something worth less than $50? 0 1 2 3 4 5 6 7 8 9 10 more than 10 8. Stolen or tried to steal something worth more than $50? 0 1 2 3 4 5 6 7 8 9 10 more than 10 9. Gone into or tried to go into a building to steal something? 0 1 2 3 4 5 6 7 8 9 10 more than 10 10. Hit someone with the idea of hurting him/her? 0 1 2 3 4 5 6 7 8 9 10 more than 10 11. Attacked someone with a weapon? 0 1 2 3 4 5 6 7 8 9 10 more than 10 12. Used a weapon or force to get money or things from people? 0 1 2 3 4 5 6 7 8 9 10 more than 10 13. Been involved in gang fights? 0 1 2 3 4 5 6 7 8 9 10 more than 10 14. Sold marijuana or other illegal drugs? 0 1 2 3 4 5 6 7 8 9 10 more than 10 15. Bullied other students at school? 0 1 2 3 4 5 6 7 8 9 10 more than 10 16. Said any mean, threatening, or embarrassing
things to other students through text messages, phone calls, email, or websites? 0 1 2 3 4 5 6 7 8 9 10 more than 10
How many times in the past 6 months have you … 17. Been stopped by the police or law enforcement officers for questioning? 0 1 2 3 4 5 6 7 8 9 10 more than 10 18. Been arrested? 0 1 2 3 4 5 6 7 8 9 10 more than 10 19. If you have been stopped or arrested by the police, how satisfied were you with the way you were treated by the officer(s) when you were stopped or arrested? (If more than 1 time, think about the most recent time.) 1. Very dissatisfied 2. Dissatisfied 3. Neither dissatisfied nor satisfied 4. Satisfied 5. Very Satisfied L. For the following list of drugs, please circle the category that best describes how often you’ve used each of these drugs in the past 6 months. 1. Tobacco products? 0 1 – 2 times About once a month About once a week Every day 2. Alcohol? 0 1 – 2 times About once a month About once a week Every day
580
This document is a research report submitted to the U.S. Department of Justice. This report has not been published by the Department. Opinions or points of view expressed are those of the author(s)
and do not necessarily reflect the official position or policies of the U.S. Department of Justice.
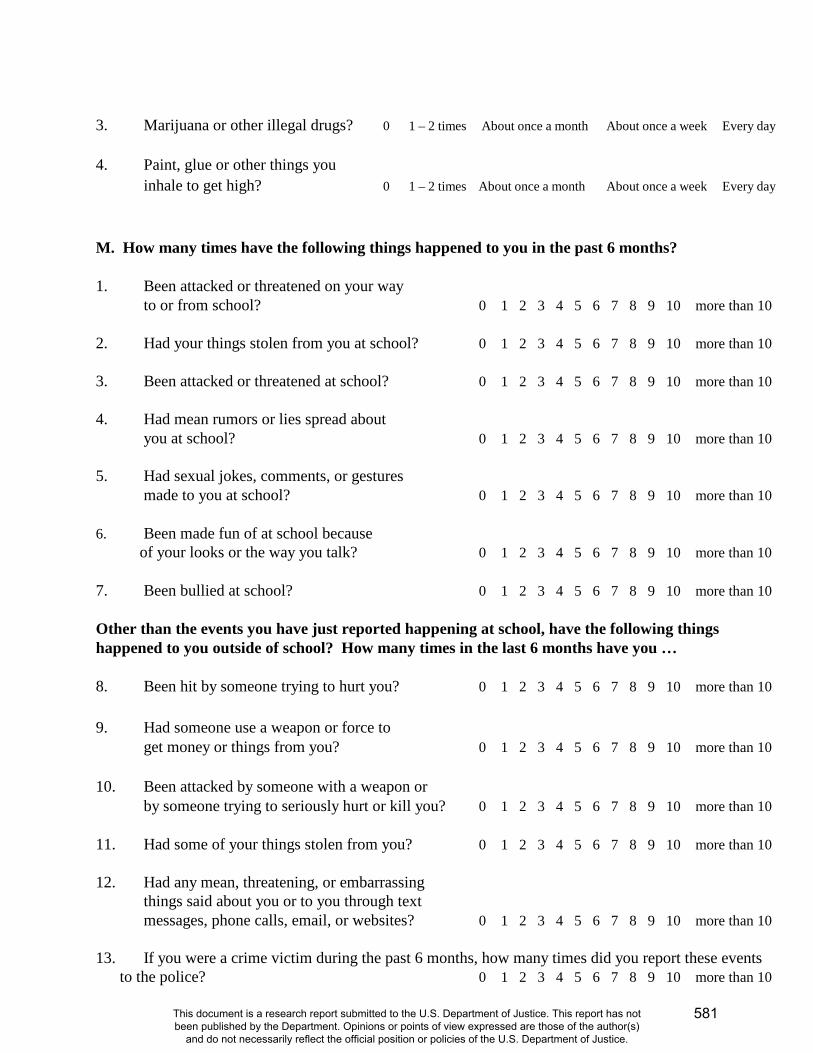
3. Marijuana or other illegal drugs? 0 1 – 2 times About once a month About once a week Every day 4. Paint, glue or other things you inhale to get high? 0 1 – 2 times About once a month About once a week Every day M. How many times have the following things happened to you in the past 6 months? 1. Been attacked or threatened on your way to or from school? 0 1 2 3 4 5 6 7 8 9 10 more than 10 2. Had your things stolen from you at school? 0 1 2 3 4 5 6 7 8 9 10 more than 10 3. Been attacked or threatened at school? 0 1 2 3 4 5 6 7 8 9 10 more than 10 4. Had mean rumors or lies spread about you at school? 0 1 2 3 4 5 6 7 8 9 10 more than 10 5. Had sexual jokes, comments, or gestures made to you at school? 0 1 2 3 4 5 6 7 8 9 10 more than 10 6. Been made fun of at school because
of your looks or the way you talk? 0 1 2 3 4 5 6 7 8 9 10 more than 10 7. Been bullied at school? 0 1 2 3 4 5 6 7 8 9 10 more than 10 Other than the events you have just reported happening at school, have the following things happened to you outside of school? How many times in the last 6 months have you … 8. Been hit by someone trying to hurt you? 0 1 2 3 4 5 6 7 8 9 10 more than 10 9. Had someone use a weapon or force to get money or things from you? 0 1 2 3 4 5 6 7 8 9 10 more than 10 10. Been attacked by someone with a weapon or by someone trying to seriously hurt or kill you? 0 1 2 3 4 5 6 7 8 9 10 more than 10 11. Had some of your things stolen from you? 0 1 2 3 4 5 6 7 8 9 10 more than 10 12. Had any mean, threatening, or embarrassing
things said about you or to you through text messages, phone calls, email, or websites? 0 1 2 3 4 5 6 7 8 9 10 more than 10 13. If you were a crime victim during the past 6 months, how many times did you report these events
to the police? 0 1 2 3 4 5 6 7 8 9 10 more than 10
581
This document is a research report submitted to the U.S. Department of Justice. This report has not been published by the Department. Opinions or points of view expressed are those of the author(s)
and do not necessarily reflect the official position or policies of the U.S. Department of Justice.
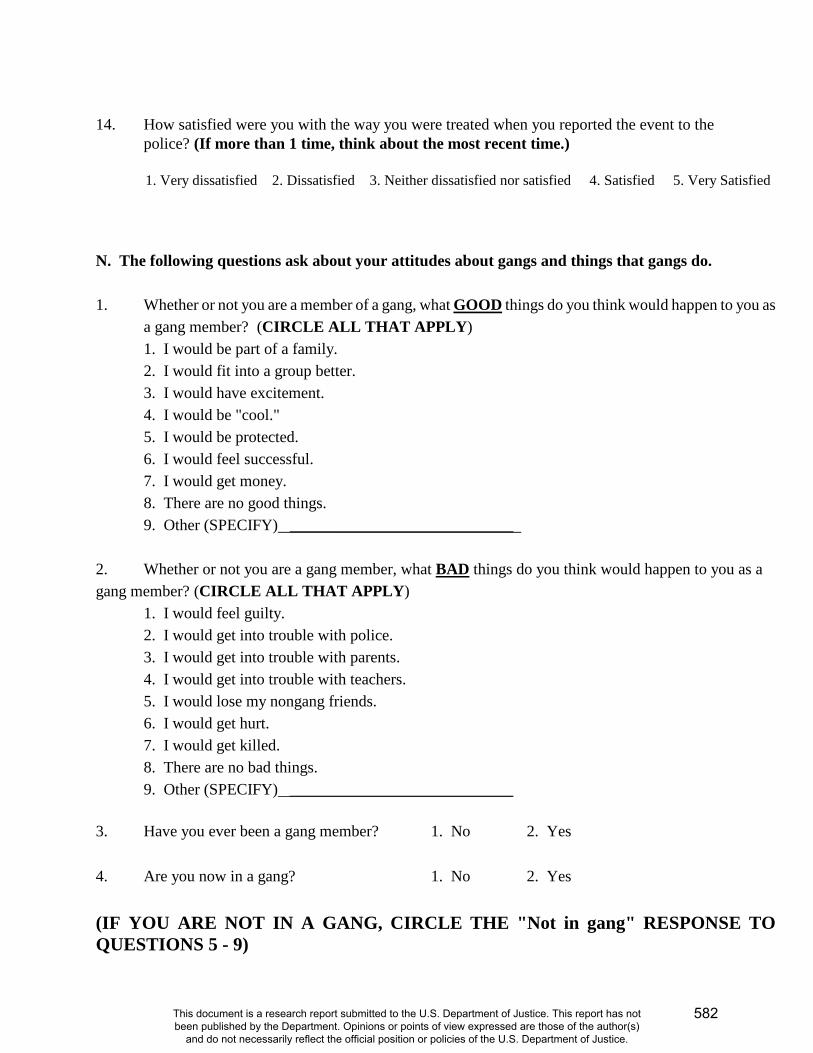
14. How satisfied were you with the way you were treated when you reported the event to the
police? (If more than 1 time, think about the most recent time.) 1. Very dissatisfied 2. Dissatisfied 3. Neither dissatisfied nor satisfied 4. Satisfied 5. Very Satisfied N. The following questions ask about your attitudes about gangs and things that gangs do. 1. Whether or not you are a member of a gang, what GOOD things do you think would happen to you as
a gang member? (CIRCLE ALL THAT APPLY) 1. I would be part of a family. 2. I would fit into a group better. 3. I would have excitement. 4. I would be "cool." 5. I would be protected. 6. I would feel successful. 7. I would get money. 8. There are no good things. 9. Other (SPECIFY) ____________________________
2. Whether or not you are a gang member, what BAD things do you think would happen to you as a gang member? (CIRCLE ALL THAT APPLY)
1. I would feel guilty. 2. I would get into trouble with police. 3. I would get into trouble with parents. 4. I would get into trouble with teachers. 5. I would lose my nongang friends. 6. I would get hurt. 7. I would get killed. 8. There are no bad things. 9. Other (SPECIFY) ____________________________
3. Have you ever been a gang member? 1. No 2. Yes 4. Are you now in a gang? 1. No 2. Yes (IF YOU ARE NOT IN A GANG, CIRCLE THE "Not in gang" RESPONSE TO QUESTIONS 5 - 9)
582
This document is a research report submitted to the U.S. Department of Justice. This report has not been published by the Department. Opinions or points of view expressed are those of the author(s)
and do not necessarily reflect the official position or policies of the U.S. Department of Justice.

5. Imagine a “bull’s eye” target represents your gang with a 1 in the middle circle and a 5 in the outside ring. How far from the center of the gang are you? Circle the number that best describes your place in your gang.
1 2 3 4 5 0. Not in Gang
6. Do the following describe your gang?
a. You can join before age 13. 1. No 2. Yes 0. Not in gang
b. There are initiation rites. 1. No 2. Yes 0. Not in gang
c. The gang has established leaders. 1. No 2. Yes 0. Not in gang
d. The gang has regular meetings. 1. No 2. Yes 0. Not in gang
e. The gang has specific rules or codes. 1. No 2. Yes 0. Not in gang
f. Gang members have specific roles. 1. No 2. Yes 0. Not in gang
g. There are roles for each age group. 1. No 2. Yes 0. Not in gang
h. The gang has symbols or colors. 1. No 2. Yes 0. Not in gang
i. There are specific roles for girls. 1. No 2. Yes 0. Not in gang
j. There are specific roles for boys. 1. No 2. Yes 0. Not in gang
7. How old were you when you joined this gang?
About years old. 0. Not in gang 8. Why did you join the gang? (CIRCLE ALL THAT APPLY)
0. Not in gang 5. I was forced to join 1. For fun 6. To get respect 2. For protection 7. For money 3. A friend was in the gang 8. To fit in better 4. A brother or sister was in the gang 9. Other (SPECIFY)_________________
9. Do members of your gang do these things together?
a. Help out in the community 1. No 2. Yes 0. Not in gang
b. Get in fights with other gangs 1. No 2. Yes 0. Not in gang
c. Provide protection for each other 1. No 2. Yes 0. Not in gang
d. Steal things 1. No 2. Yes 0. Not in gang
e. Rob other people 1. No 2. Yes 0. Not in gang
f. Steal cars 1. No 2. Yes 0. Not in gang
g. Sell marijuana 1. No 2. Yes 0. Not in gang
583
This document is a research report submitted to the U.S. Department of Justice. This report has not been published by the Department. Opinions or points of view expressed are those of the author(s)
and do not necessarily reflect the official position or policies of the U.S. Department of Justice.
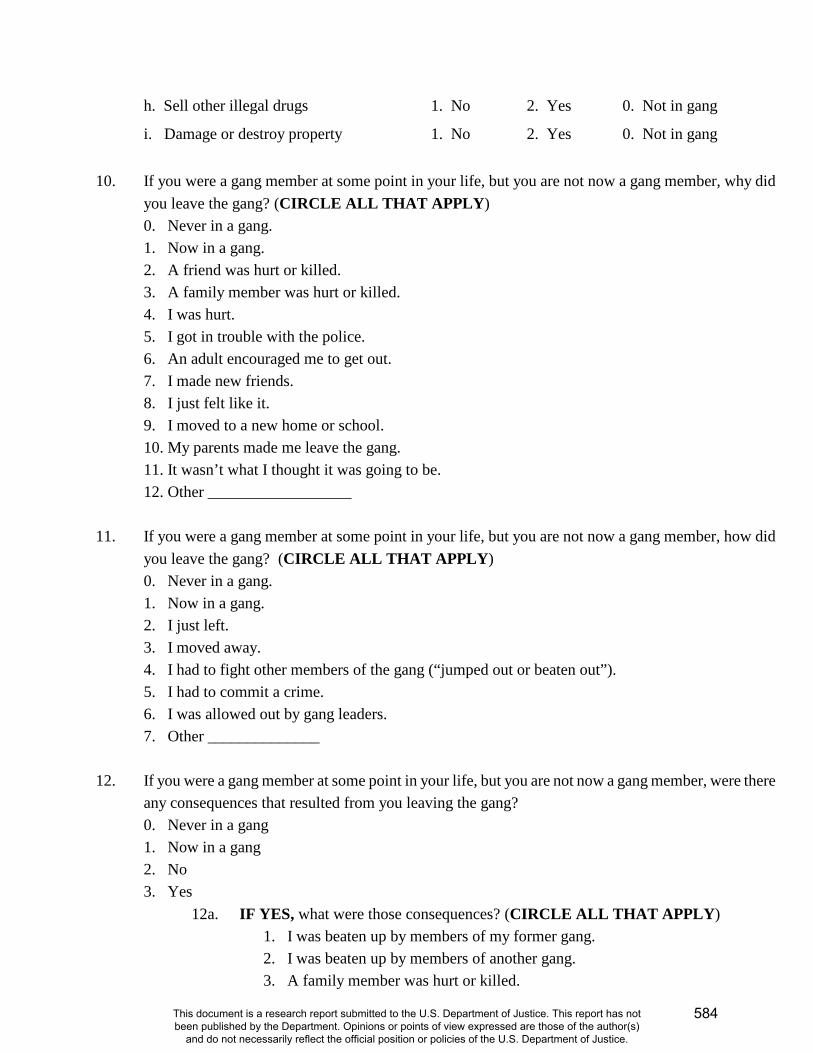
h. Sell other illegal drugs 1. No 2. Yes 0. Not in gang
i. Damage or destroy property 1. No 2. Yes 0. Not in gang
10. If you were a gang member at some point in your life, but you are not now a gang member, why did
you leave the gang? (CIRCLE ALL THAT APPLY) 0. Never in a gang. 1. Now in a gang. 2. A friend was hurt or killed. 3. A family member was hurt or killed. 4. I was hurt. 5. I got in trouble with the police. 6. An adult encouraged me to get out. 7. I made new friends. 8. I just felt like it. 9. I moved to a new home or school. 10. My parents made me leave the gang. 11. It wasn’t what I thought it was going to be. 12. Other __________________
11. If you were a gang member at some point in your life, but you are not now a gang member, how did
you leave the gang? (CIRCLE ALL THAT APPLY) 0. Never in a gang. 1. Now in a gang. 2. I just left. 3. I moved away. 4. I had to fight other members of the gang (“jumped out or beaten out”). 5. I had to commit a crime. 6. I was allowed out by gang leaders. 7. Other ______________
12. If you were a gang member at some point in your life, but you are not now a gang member, were there
any consequences that resulted from you leaving the gang? 0. Never in a gang 1. Now in a gang 2. No 3. Yes
12a. IF YES, what were those consequences? (CIRCLE ALL THAT APPLY) 1. I was beaten up by members of my former gang. 2. I was beaten up by members of another gang. 3. A family member was hurt or killed.
584
This document is a research report submitted to the U.S. Department of Justice. This report has not been published by the Department. Opinions or points of view expressed are those of the author(s)
and do not necessarily reflect the official position or policies of the U.S. Department of Justice.
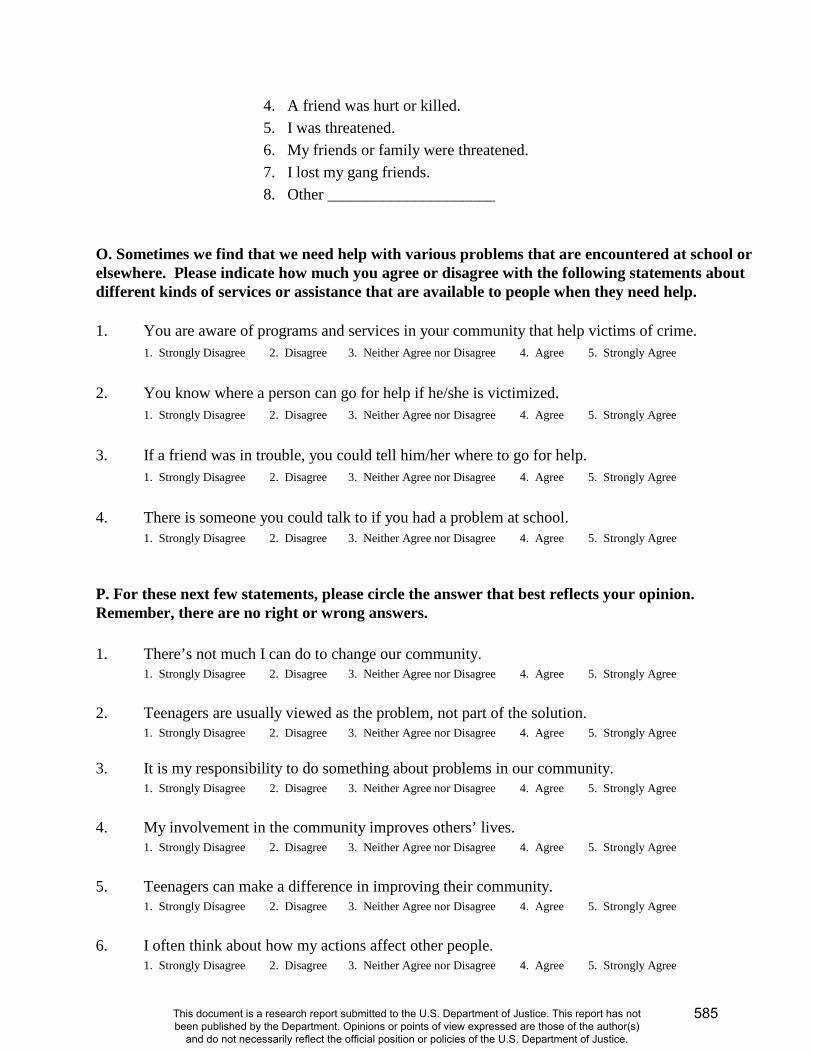
4. A friend was hurt or killed. 5. I was threatened. 6. My friends or family were threatened. 7. I lost my gang friends. 8. Other _____________________
O. Sometimes we find that we need help with various problems that are encountered at school or elsewhere. Please indicate how much you agree or disagree with the following statements about different kinds of services or assistance that are available to people when they need help. 1. You are aware of programs and services in your community that help victims of crime. 1. Strongly Disagree 2. Disagree 3. Neither Agree nor Disagree 4. Agree 5. Strongly Agree
2. You know where a person can go for help if he/she is victimized. 1. Strongly Disagree 2. Disagree 3. Neither Agree nor Disagree 4. Agree 5. Strongly Agree
3. If a friend was in trouble, you could tell him/her where to go for help. 1. Strongly Disagree 2. Disagree 3. Neither Agree nor Disagree 4. Agree 5. Strongly Agree
4. There is someone you could talk to if you had a problem at school. 1. Strongly Disagree 2. Disagree 3. Neither Agree nor Disagree 4. Agree 5. Strongly Agree
P. For these next few statements, please circle the answer that best reflects your opinion. Remember, there are no right or wrong answers. 1. There’s not much I can do to change our community. 1. Strongly Disagree 2. Disagree 3. Neither Agree nor Disagree 4. Agree 5. Strongly Agree 2. Teenagers are usually viewed as the problem, not part of the solution. 1. Strongly Disagree 2. Disagree 3. Neither Agree nor Disagree 4. Agree 5. Strongly Agree 3. It is my responsibility to do something about problems in our community. 1. Strongly Disagree 2. Disagree 3. Neither Agree nor Disagree 4. Agree 5. Strongly Agree 4. My involvement in the community improves others’ lives. 1. Strongly Disagree 2. Disagree 3. Neither Agree nor Disagree 4. Agree 5. Strongly Agree 5. Teenagers can make a difference in improving their community. 1. Strongly Disagree 2. Disagree 3. Neither Agree nor Disagree 4. Agree 5. Strongly Agree 6. I often think about how my actions affect other people. 1. Strongly Disagree 2. Disagree 3. Neither Agree nor Disagree 4. Agree 5. Strongly Agree
585
This document is a research report submitted to the U.S. Department of Justice. This report has not been published by the Department. Opinions or points of view expressed are those of the author(s)
and do not necessarily reflect the official position or policies of the U.S. Department of Justice.
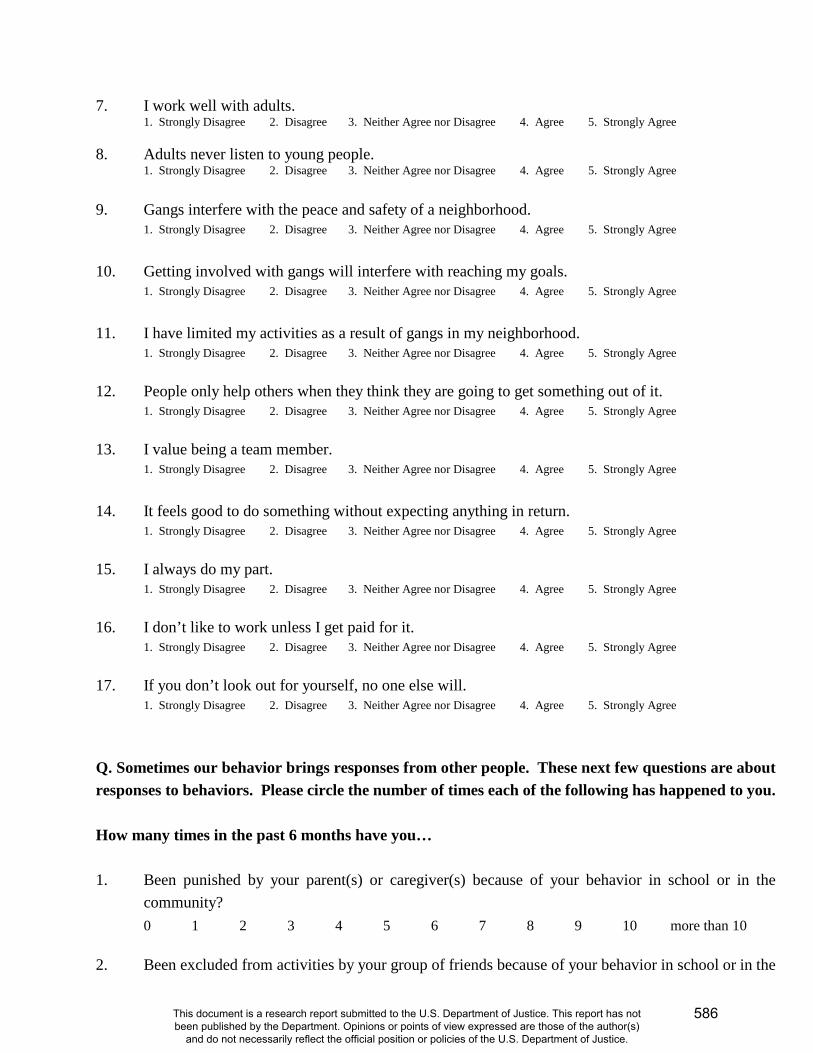
7. I work well with adults. 1. Strongly Disagree 2. Disagree 3. Neither Agree nor Disagree 4. Agree 5. Strongly Agree 8. Adults never listen to young people. 1. Strongly Disagree 2. Disagree 3. Neither Agree nor Disagree 4. Agree 5. Strongly Agree 9. Gangs interfere with the peace and safety of a neighborhood.
1. Strongly Disagree 2. Disagree 3. Neither Agree nor Disagree 4. Agree 5. Strongly Agree 10. Getting involved with gangs will interfere with reaching my goals.
1. Strongly Disagree 2. Disagree 3. Neither Agree nor Disagree 4. Agree 5. Strongly Agree 11. I have limited my activities as a result of gangs in my neighborhood.
1. Strongly Disagree 2. Disagree 3. Neither Agree nor Disagree 4. Agree 5. Strongly Agree 12. People only help others when they think they are going to get something out of it.
1. Strongly Disagree 2. Disagree 3. Neither Agree nor Disagree 4. Agree 5. Strongly Agree 13. I value being a team member. 1. Strongly Disagree 2. Disagree 3. Neither Agree nor Disagree 4. Agree 5. Strongly Agree 14. It feels good to do something without expecting anything in return.
1. Strongly Disagree 2. Disagree 3. Neither Agree nor Disagree 4. Agree 5. Strongly Agree 15. I always do my part.
1. Strongly Disagree 2. Disagree 3. Neither Agree nor Disagree 4. Agree 5. Strongly Agree 16. I don’t like to work unless I get paid for it.
1. Strongly Disagree 2. Disagree 3. Neither Agree nor Disagree 4. Agree 5. Strongly Agree 17. If you don’t look out for yourself, no one else will.
1. Strongly Disagree 2. Disagree 3. Neither Agree nor Disagree 4. Agree 5. Strongly Agree Q. Sometimes our behavior brings responses from other people. These next few questions are about responses to behaviors. Please circle the number of times each of the following has happened to you. How many times in the past 6 months have you… 1. Been punished by your parent(s) or caregiver(s) because of your behavior in school or in the
community? 0 1 2 3 4 5 6 7 8 9 10 more than 10 2. Been excluded from activities by your group of friends because of your behavior in school or in the
586
This document is a research report submitted to the U.S. Department of Justice. This report has not been published by the Department. Opinions or points of view expressed are those of the author(s)
and do not necessarily reflect the official position or policies of the U.S. Department of Justice.
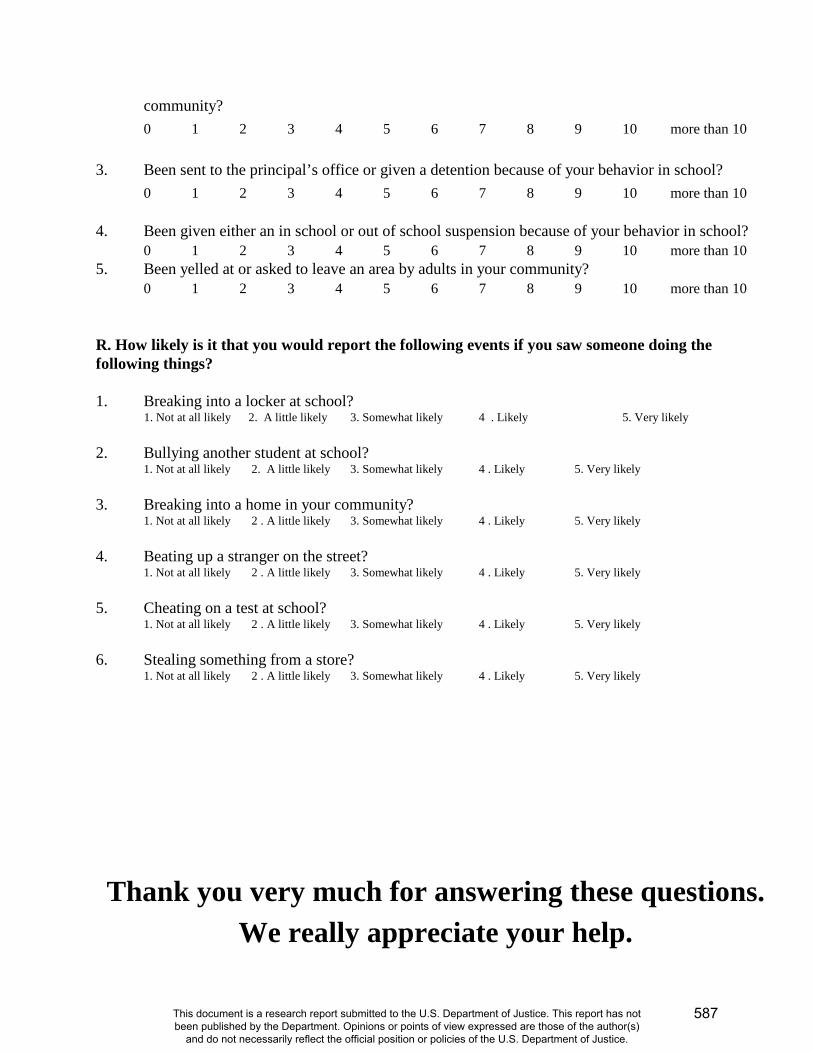
community? 0 1 2 3 4 5 6 7 8 9 10 more than 10 3. Been sent to the principal’s office or given a detention because of your behavior in school? 0 1 2 3 4 5 6 7 8 9 10 more than 10 4. Been given either an in school or out of school suspension because of your behavior in school? 0 1 2 3 4 5 6 7 8 9 10 more than 10 5. Been yelled at or asked to leave an area by adults in your community? 0 1 2 3 4 5 6 7 8 9 10 more than 10 R. How likely is it that you would report the following events if you saw someone doing the following things? 1. Breaking into a locker at school?
1. Not at all likely 2. A little likely 3. Somewhat likely 4 . Likely 5. Very likely 2. Bullying another student at school?
1. Not at all likely 2. A little likely 3. Somewhat likely 4 . Likely 5. Very likely 3. Breaking into a home in your community?
1. Not at all likely 2 . A little likely 3. Somewhat likely 4 . Likely 5. Very likely 4. Beating up a stranger on the street?
1. Not at all likely 2 . A little likely 3. Somewhat likely 4 . Likely 5. Very likely 5. Cheating on a test at school?
1. Not at all likely 2 . A little likely 3. Somewhat likely 4 . Likely 5. Very likely 6. Stealing something from a store?
1. Not at all likely 2 . A little likely 3. Somewhat likely 4 . Likely 5. Very likely
Thank you very much for answering these questions. We really appreciate your help.
587
This document is a research report submitted to the U.S. Department of Justice. This report has not been published by the Department. Opinions or points of view expressed are those of the author(s)
and do not necessarily reflect the official position or policies of the U.S. Department of Justice.
NATIONAL EVALUATION OF G.R.E.A.T.
STUDENT QUESTIONNAIRE
Wave 6
School Year 2010 - 2011
University of Missouri-St. Louis Department of Criminology and Criminal Justice
8001 Natural Bridge Road St. Louis, MO 63121
588
This document is a research report submitted to the U.S. Department of Justice. This report has not been published by the Department. Opinions or points of view expressed are those of the author(s)
and do not necessarily reflect the official position or policies of the U.S. Department of Justice.

INSTRUCTIONS 1. Please answer the questions in the order they appear. 2. Circle the number that shows your best answer to each question. 3. There are no right or wrong answers. Your opinion is what counts. 4. Do NOT write your name on the questionnaire. 5. Your answers are CONFIDENTIAL - - no one outside of our research office will ever
connect your name with the answers you give. 6. You have the right to skip any question that you do not want to answer. 7. You can stop filling out the questionnaire any time you wish. WE HOPE YOU ENJOY ANSWERING THESE QUESTIONS
589
This document is a research report submitted to the U.S. Department of Justice. This report has not been published by the Department. Opinions or points of view expressed are those of the author(s)
and do not necessarily reflect the official position or policies of the U.S. Department of Justice.

Please provide the following information. Once you have completed this page, tear it out and give it to one of the researchers. You will receive $5.00 for completing the 2010 student questionnaire for the Evaluation of the Gang Resistance Education and Training (G.R.E.A.T.) program. PLEASE PRINT Your Name:____________________________________________ (First) (Middle) (Last) Address: ______________________________________________ ______________________________________________________ (City) (State) (Zip Code) Signature:___________________________________ Date: ____________________________________
590
This document is a research report submitted to the U.S. Department of Justice. This report has not been published by the Department. Opinions or points of view expressed are those of the author(s)
and do not necessarily reflect the official position or policies of the U.S. Department of Justice.

A. We are going to begin with a few questions about you and your background. Please circle the response that best describes you. 1. I am 1. Male 2. Female 2. I am 1. White/Anglo, not Hispanic (CIRCLE ALL THAT APPLY)
2. Black/African-American 3. Hispanic/Latino 4. American Indian/Native American 5. Asian/Pacific Islander/Oriental 6. Other (SPECIFY) ________________________________
3. How old are you? 13 14 15 16 17 18 19 4. I live with 1. my mother and my father
2. my mother only 3. my father only 4. my mother and stepfather 5. my father and stepmother 6. my mother and other adult (SPECIFY)_________________ 7. my father and other adult (SPECIFY) __________________ 8. other relatives (SPECIFY)___________________________ 9. other (SPECIFY)__________________________________
7. How many times have you moved this year (since January 1, 2010)? Times
9. Looking at all your grades at school, would you say you were closest to a ….
1. Straight A student 4. D student 2. B student 5. F student 3. C student 6. Something else __________________
10. Other than English, is there another language spoken in your home?
1. No 2. Yes 10a. IF YES, what language? ____________________
591
This document is a research report submitted to the U.S. Department of Justice. This report has not been published by the Department. Opinions or points of view expressed are those of the author(s)
and do not necessarily reflect the official position or policies of the U.S. Department of Justice.
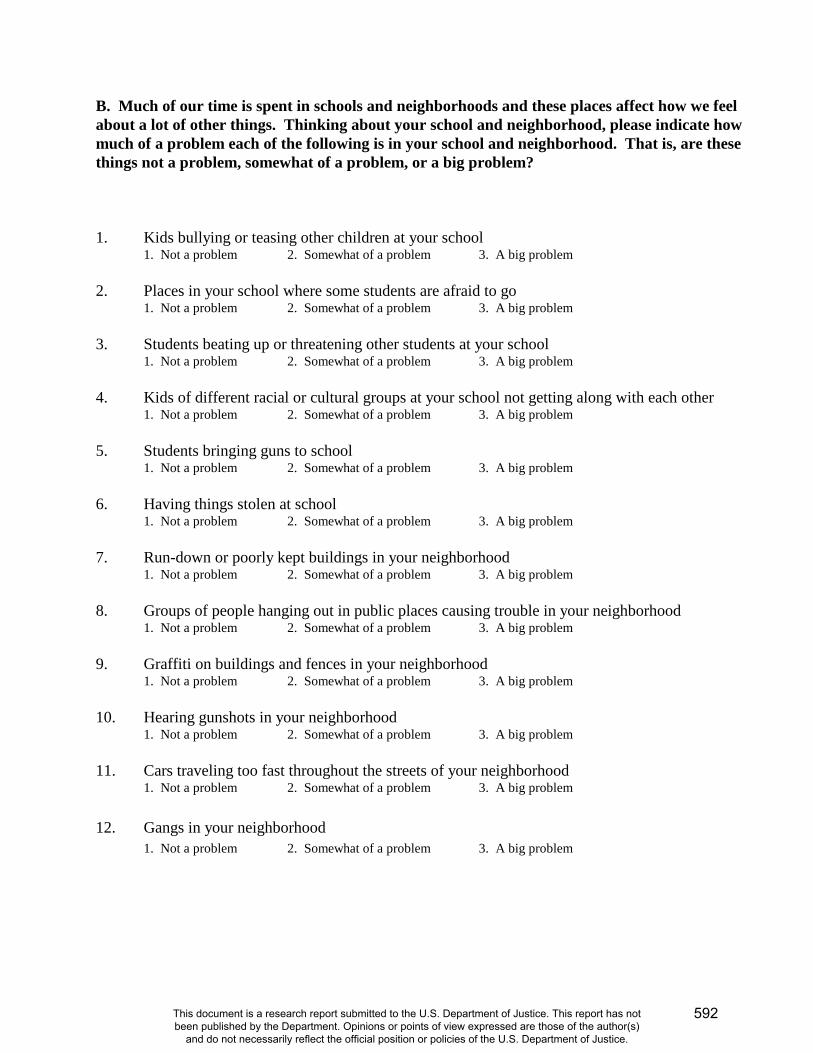
B. Much of our time is spent in schools and neighborhoods and these places affect how we feel about a lot of other things. Thinking about your school and neighborhood, please indicate how much of a problem each of the following is in your school and neighborhood. That is, are these things not a problem, somewhat of a problem, or a big problem? 1. Kids bullying or teasing other children at your school 1. Not a problem 2. Somewhat of a problem 3. A big problem 2. Places in your school where some students are afraid to go 1. Not a problem 2. Somewhat of a problem 3. A big problem 3. Students beating up or threatening other students at your school 1. Not a problem 2. Somewhat of a problem 3. A big problem 4. Kids of different racial or cultural groups at your school not getting along with each other 1. Not a problem 2. Somewhat of a problem 3. A big problem 5. Students bringing guns to school 1. Not a problem 2. Somewhat of a problem 3. A big problem 6. Having things stolen at school 1. Not a problem 2. Somewhat of a problem 3. A big problem 7. Run-down or poorly kept buildings in your neighborhood 1. Not a problem 2. Somewhat of a problem 3. A big problem 8. Groups of people hanging out in public places causing trouble in your neighborhood 1. Not a problem 2. Somewhat of a problem 3. A big problem 9. Graffiti on buildings and fences in your neighborhood 1. Not a problem 2. Somewhat of a problem 3. A big problem 10. Hearing gunshots in your neighborhood 1. Not a problem 2. Somewhat of a problem 3. A big problem 11. Cars traveling too fast throughout the streets of your neighborhood 1. Not a problem 2. Somewhat of a problem 3. A big problem 12. Gangs in your neighborhood 1. Not a problem 2. Somewhat of a problem 3. A big problem
592
This document is a research report submitted to the U.S. Department of Justice. This report has not been published by the Department. Opinions or points of view expressed are those of the author(s)
and do not necessarily reflect the official position or policies of the U.S. Department of Justice.
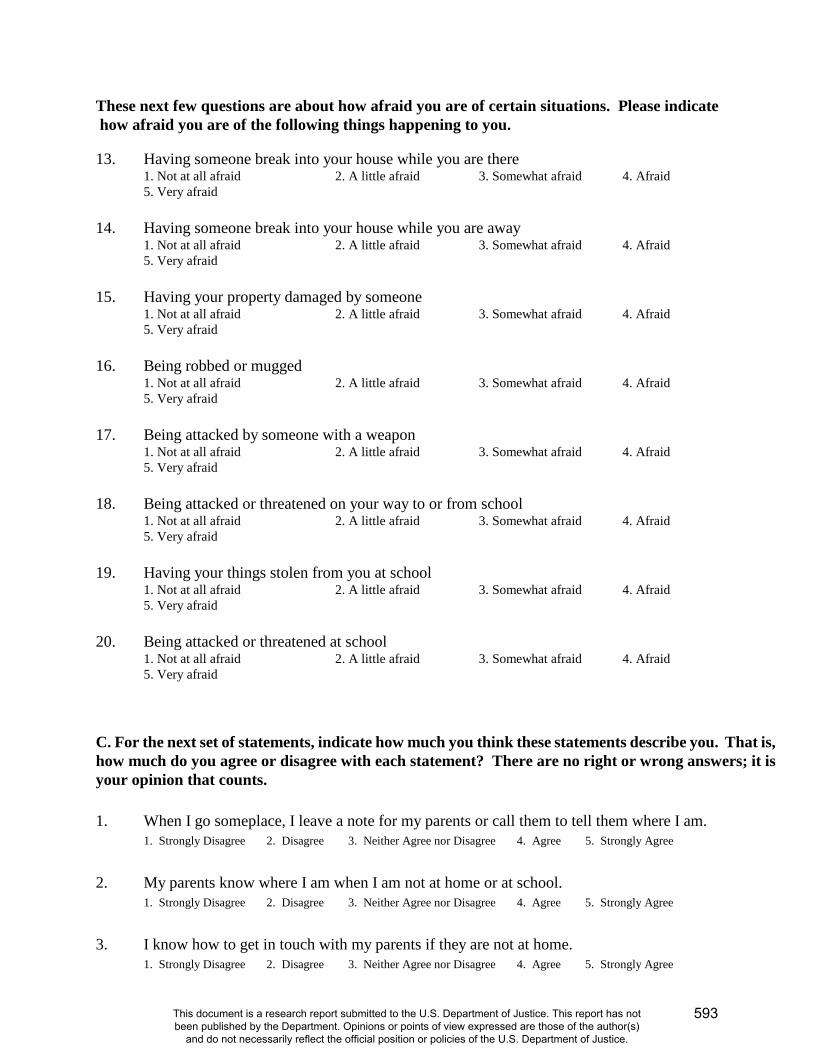
These next few questions are about how afraid you are of certain situations. Please indicate how afraid you are of the following things happening to you. 13. Having someone break into your house while you are there 1. Not at all afraid 2. A little afraid 3. Somewhat afraid 4. Afraid 5. Very afraid 14. Having someone break into your house while you are away 1. Not at all afraid 2. A little afraid 3. Somewhat afraid 4. Afraid 5. Very afraid 15. Having your property damaged by someone 1. Not at all afraid 2. A little afraid 3. Somewhat afraid 4. Afraid 5. Very afraid 16. Being robbed or mugged 1. Not at all afraid 2. A little afraid 3. Somewhat afraid 4. Afraid 5. Very afraid 17. Being attacked by someone with a weapon 1. Not at all afraid 2. A little afraid 3. Somewhat afraid 4. Afraid 5. Very afraid 18. Being attacked or threatened on your way to or from school 1. Not at all afraid 2. A little afraid 3. Somewhat afraid 4. Afraid 5. Very afraid 19. Having your things stolen from you at school 1. Not at all afraid 2. A little afraid 3. Somewhat afraid 4. Afraid 5. Very afraid 20. Being attacked or threatened at school 1. Not at all afraid 2. A little afraid 3. Somewhat afraid 4. Afraid 5. Very afraid C. For the next set of statements, indicate how much you think these statements describe you. That is, how much do you agree or disagree with each statement? There are no right or wrong answers; it is your opinion that counts. 1. When I go someplace, I leave a note for my parents or call them to tell them where I am.
1. Strongly Disagree 2. Disagree 3. Neither Agree nor Disagree 4. Agree 5. Strongly Agree 2. My parents know where I am when I am not at home or at school.
1. Strongly Disagree 2. Disagree 3. Neither Agree nor Disagree 4. Agree 5. Strongly Agree 3. I know how to get in touch with my parents if they are not at home.
1. Strongly Disagree 2. Disagree 3. Neither Agree nor Disagree 4. Agree 5. Strongly Agree
593
This document is a research report submitted to the U.S. Department of Justice. This report has not been published by the Department. Opinions or points of view expressed are those of the author(s)
and do not necessarily reflect the official position or policies of the U.S. Department of Justice.

4. My parents know who I am with if I am not at home.
1. Strongly Disagree 2. Disagree 3. Neither Agree nor Disagree 4. Agree 5. Strongly Agree 5. I often act without stopping to think.
1. Strongly Disagree 2. Disagree 3. Neither Agree nor Disagree 4. Agree 5. Strongly Agree 6. I don't devote much thought and effort to preparing for the future.
1. Strongly Disagree 2. Disagree 3. Neither Agree nor Disagree 4. Agree 5. Strongly Agree 7. I often do whatever brings me pleasure here and now, even at the cost of some distant goal.
1. Strongly Disagree 2. Disagree 3. Neither Agree nor Disagree 4. Agree 5. Strongly Agree 8. I'm more concerned with what happens to me in the short run than in the long run.
1. Strongly Disagree 2. Disagree 3. Neither Agree nor Disagree 4. Agree 5. Strongly Agree 9. I like to test myself every now and then by doing something a little risky.
1. Strongly Disagree 2. Disagree 3. Neither Agree nor Disagree 4. Agree 5. Strongly Agree 10. Sometimes I will take a risk just for the fun of it.
1. Strongly Disagree 2. Disagree 3. Neither Agree nor Disagree 4. Agree 5. Strongly Agree 11. I sometimes find it exciting to do things for which I might get in trouble.
1. Strongly Disagree 2. Disagree 3. Neither Agree nor Disagree 4. Agree 5. Strongly Agree 12. Excitement and adventure are more important to me than security.
1. Strongly Disagree 2. Disagree 3. Neither Agree nor Disagree 4. Agree 5. Strongly Agree 13. I lose my temper pretty easily.
1. Strongly Disagree 2. Disagree 3. Neither Agree nor Disagree 4. Agree 5. Strongly Agree 14. Often when I’m angry at people, I feel more like hurting them than talking to them about why I am
angry. 1. Strongly Disagree 2. Disagree 3. Neither Agree nor Disagree 4. Agree 5. Strongly Agree
15. When I’m really angry, other people better stay away from me. 1. Strongly Disagree 2. Disagree 3. Neither Agree nor Disagree 4. Agree 5. Strongly Agree
16. When I have a serious disagreement with someone, it’s usually hard for me to talk calmly about it
without getting upset. 1. Strongly Disagree 2. Disagree 3. Neither Agree nor Disagree 4. Agree 5. Strongly Agree
17. I try to look out for myself first, even if it means making things difficult for other people.
594
This document is a research report submitted to the U.S. Department of Justice. This report has not been published by the Department. Opinions or points of view expressed are those of the author(s)
and do not necessarily reflect the official position or policies of the U.S. Department of Justice.
1. Strongly Disagree 2. Disagree 3. Neither Agree nor Disagree 4. Agree 5. Strongly Agree 18. I’m not very sympathetic to other people when they are having problems.
1. Strongly Disagree 2. Disagree 3. Neither Agree nor Disagree 4. Agree 5. Strongly Agree 19. If things I do upset people, it’s their problem not mine.
1. Strongly Disagree 2. Disagree 3. Neither Agree nor Disagree 4. Agree 5. Strongly Agree 20. I will try to get the things I want even when I know it’s causing problems for other people.
1. Strongly Disagree 2. Disagree 3. Neither Agree nor Disagree 4. Agree 5. Strongly Agree D. The next few statements are about your attitudes toward the police. 1. Police officers are honest.
1. Strongly Disagree 2. Disagree 3. Neither Agree nor Disagree 4. Agree 5. Strongly Agree 2. Police officers are hardworking.
1. Strongly Disagree 2. Disagree 3. Neither Agree nor Disagree 4. Agree 5. Strongly Agree 3. Most police officers are usually friendly.
1. Strongly Disagree 2. Disagree 3. Neither Agree nor Disagree 4. Agree 5. Strongly Agree 4. Police officers are usually courteous.
1. Strongly Disagree 2. Disagree 3. Neither Agree nor Disagree 4. Agree 5. Strongly Agree 5. Police officers are respectful toward people like me.
1. Strongly Disagree 2. Disagree 3. Neither Agree nor Disagree 4. Agree 5. Strongly Agree 6. I feel safer when police officers are in my school.
1. Strongly Disagree 2. Disagree 3. Neither Agree nor Disagree 4. Agree 5. Strongly Agree 7. Police officers make good teachers.
1. Strongly Disagree 2. Disagree 3. Neither Agree nor Disagree 4. Agree 5. Strongly Agree 8. Police officers don't know much about gangs.
1. Strongly Disagree 2. Disagree 3. Neither Agree nor Disagree 4. Agree 5. Strongly Agree
595
This document is a research report submitted to the U.S. Department of Justice. This report has not been published by the Department. Opinions or points of view expressed are those of the author(s)
and do not necessarily reflect the official position or policies of the U.S. Department of Justice.
E. For the next set of questions, think about your current group of friends. During the last year, how many of your current friends have done the following? 1. Gotten along well with teachers and adults at school?
1. None of them 2. Few of them 3. Half of them 4. Most of them 5. All of them 2. Have been thought of as good students?
1. None of them 2. Few of them 3. Half of them 4. Most of them 5. All of them 3. Have been generally honest and told the truth?
1. None of them 2. Few of them 3. Half of them 4. Most of them 5. All of them 4. Almost always obeyed school rules?
1. None of them 2. Few of them 3. Half of them 4. Most of them 5. All of them Still thinking about your current friends, how likely is it that you would go along with them if they wanted you to do the following things with them? 5. Bully another student at school?
1. Not at All Likely 2. A Little Likely 3. Somewhat Likely 4. Likely 5. Very Likely 6. Break into a home in your community?
1. Not at All Likely 2. A Little Likely 3. Somewhat Likely 4. Likely 5. Very Likely 7. Beat up a stranger on the street?
1. Not at All Likely 2. A Little Likely 3. Somewhat Likely 4. Likely 5. Very Likely 8. Cheat on a test at school?
1. Not at All Likely 2. A Little Likely 3. Somewhat Likely 4. Likely 5. Very Likely 9. Steal something from a store?
1. Not at All Likely 2. A Little Likely 3. Somewhat Likely 4. Likely 5. Very Likely 10. Drink alcohol?
1. Not at All Likely 2. A Little Likely 3. Somewhat Likely 4. Likely 5. Very Likely 11. Use illegal drugs?
1. Not at All Likely 2. A Little Likely 3. Somewhat Likely 4. Likely 5. Very Likely 12. If your group of friends was getting you into trouble at home, how likely is it that you would still hang
out with them? 1. Not at All Likely 2. A Little Likely 3. Somewhat Likely 4. Likely 5. Very Likely
13. If your group of friends was getting you into trouble at school, how likely is it that you would still hang out with them? 1. Not at All Likely 2. A Little Likely 3. Somewhat Likely 4. Likely 5. Very Likely
596
This document is a research report submitted to the U.S. Department of Justice. This report has not been published by the Department. Opinions or points of view expressed are those of the author(s)
and do not necessarily reflect the official position or policies of the U.S. Department of Justice.
14. If your group of friends was getting you into trouble with the police, how likely is it that you would
still hang out with them? 1. Not at All Likely 2. A Little Likely 3. Somewhat Likely 4. Likely 5. Very Likely
15. If your friends told you not to do something because it was wrong, how likely is it that you would
listen to them? 1. Not at All Likely 2. A Little Likely 3. Somewhat Likely 4. Likely 5. Very Likely
16. If your friends told you not to do something because it was against the law, how likely is it that you
would listen to them? 1. Not at All Likely 2. A Little Likely 3. Somewhat Likely 4. Likely 5. Very Likely
Still thinking about your current friends…. 17. Do you ever spend time hanging around with your current friends not doing anything in particular where no adults are present? 1. No 2. Yes 17a. IF YES, How many hours a week do you do this?
1. 1 -3 hours 2. 4 – 10 hours 3. more than 10 hours 18. Do you ever spend time getting together with your current friends where drugs and alcohol are available? 1. No 2. Yes During the last year, how many of your current friends have done the following? 19. Skipped school without an excuse?
1. None of them 2. Few of them 3. Half of them 4. Most of them 5. All of them 20. Stolen something worth less than $50?
1. None of them 2. Few of them 3. Half of them 4. Most of them 5. All of them 21. Attacked someone with a weapon?
1. None of them 2. Few of them 3. Half of them 4. Most of them 5. All of them 22. Sold marijuana or other illegal drugs?
1. None of them 2. Few of them 3. Half of them 4. Most of them 5. All of them 23. Used tobacco or alcohol products?
1. None of them 2. Few of them 3. Half of them 4. Most of them 5. All of them
597
This document is a research report submitted to the U.S. Department of Justice. This report has not been published by the Department. Opinions or points of view expressed are those of the author(s)
and do not necessarily reflect the official position or policies of the U.S. Department of Justice.
24. Used marijuana or other illegal drugs? 1. None of them 2. Few of them 3. Half of them 4. Most of them 5. All of them
25. Belonged to a gang?
1. None of them 2. Few of them 3. Half of them 4. Most of them 5. All of them
F. These next few questions are about your opinions about a number of different things. How much do you agree or disagree with these statements? 1. It's okay to tell a small lie if it doesn't hurt anyone.
1. Strongly Disagree 2. Disagree 3. Neither Agree nor Disagree 4. Agree 5. Strongly Agree 2. It's okay to lie if it will keep your friends from getting in trouble with parents, teachers, or police.
1. Strongly Disagree 2. Disagree 3. Neither Agree nor Disagree 4. Agree 5. Strongly Agree 3. It's okay to lie to someone if it will keep you out of trouble with them.
1. Strongly Disagree 2. Disagree 3. Neither Agree nor Disagree 4. Agree 5. Strongly Agree 4. It's okay to steal something from someone who is rich and can easily replace it.
1. Strongly Disagree 2. Disagree 3. Neither Agree nor Disagree 4. Agree 5. Strongly Agree 5. It's okay to take little things from a store without paying for them since stores make so much money
that it won't hurt them. 1. Strongly Disagree 2. Disagree 3. Neither Agree nor Disagree 4. Agree 5. Strongly Agree
6. It's okay to steal something if that's the only way you could ever get it.
1. Strongly Disagree 2. Disagree 3. Neither Agree nor Disagree 4. Agree 5. Strongly Agree 7. It's okay to beat up someone if they hit you first.
1. Strongly Disagree 2. Disagree 3. Neither Agree nor Disagree 4. Agree 5. Strongly Agree 8. It's okay to beat up someone if you have to stand up for or protect your rights.
1. Strongly Disagree 2. Disagree 3. Neither Agree nor Disagree 4. Agree 5. Strongly Agree
9. It's okay to beat up someone if they are threatening to hurt your friends or family.
1. Strongly Disagree 2. Disagree 3. Neither Agree nor Disagree 4. Agree 5. Strongly Agree
These next few questions are about school. 10. Homework is a waste of time.
1. Strongly Disagree 2. Disagree 3. Neither Agree nor Disagree 4. Agree 5. Strongly Agree
598
This document is a research report submitted to the U.S. Department of Justice. This report has not been published by the Department. Opinions or points of view expressed are those of the author(s)
and do not necessarily reflect the official position or policies of the U.S. Department of Justice.
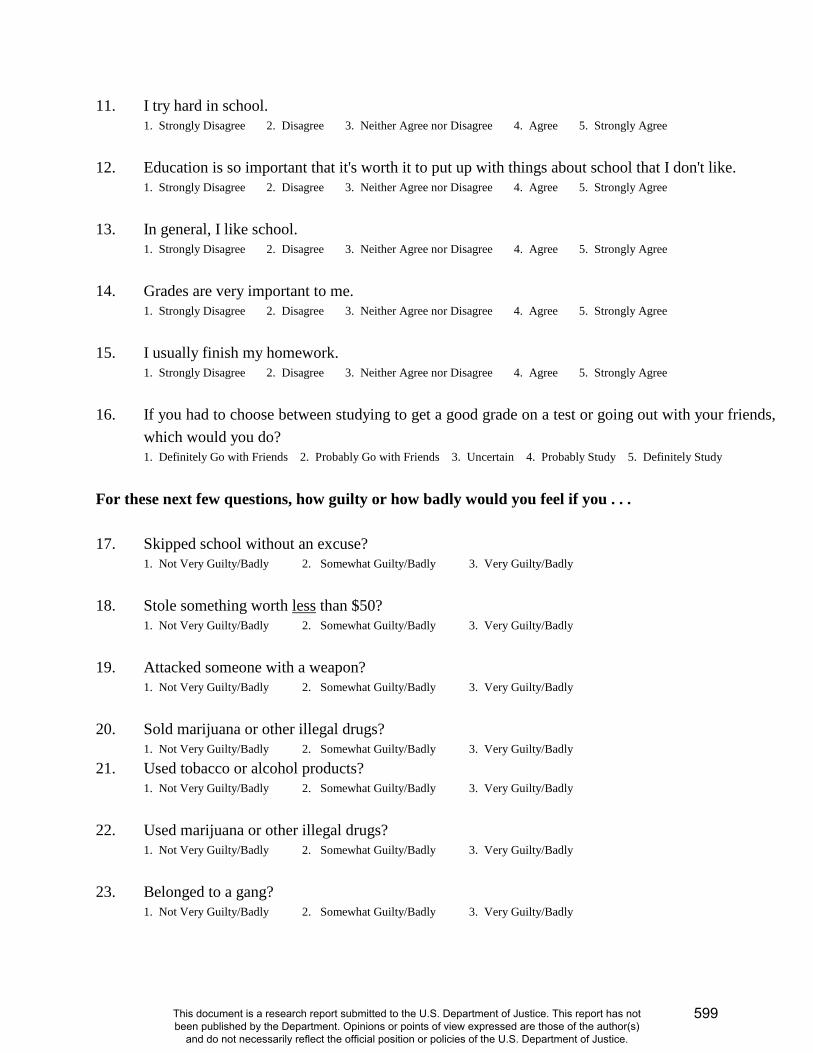
11. I try hard in school. 1. Strongly Disagree 2. Disagree 3. Neither Agree nor Disagree 4. Agree 5. Strongly Agree
12. Education is so important that it's worth it to put up with things about school that I don't like.
1. Strongly Disagree 2. Disagree 3. Neither Agree nor Disagree 4. Agree 5. Strongly Agree 13. In general, I like school.
1. Strongly Disagree 2. Disagree 3. Neither Agree nor Disagree 4. Agree 5. Strongly Agree 14. Grades are very important to me.
1. Strongly Disagree 2. Disagree 3. Neither Agree nor Disagree 4. Agree 5. Strongly Agree 15. I usually finish my homework.
1. Strongly Disagree 2. Disagree 3. Neither Agree nor Disagree 4. Agree 5. Strongly Agree 16. If you had to choose between studying to get a good grade on a test or going out with your friends,
which would you do? 1. Definitely Go with Friends 2. Probably Go with Friends 3. Uncertain 4. Probably Study 5. Definitely Study
For these next few questions, how guilty or how badly would you feel if you . . . 17. Skipped school without an excuse?
1. Not Very Guilty/Badly 2. Somewhat Guilty/Badly 3. Very Guilty/Badly 18. Stole something worth less than $50?
1. Not Very Guilty/Badly 2. Somewhat Guilty/Badly 3. Very Guilty/Badly 19. Attacked someone with a weapon?
1. Not Very Guilty/Badly 2. Somewhat Guilty/Badly 3. Very Guilty/Badly 20. Sold marijuana or other illegal drugs?
1. Not Very Guilty/Badly 2. Somewhat Guilty/Badly 3. Very Guilty/Badly 21. Used tobacco or alcohol products?
1. Not Very Guilty/Badly 2. Somewhat Guilty/Badly 3. Very Guilty/Badly
22. Used marijuana or other illegal drugs? 1. Not Very Guilty/Badly 2. Somewhat Guilty/Badly 3. Very Guilty/Badly
23. Belonged to a gang?
1. Not Very Guilty/Badly 2. Somewhat Guilty/Badly 3. Very Guilty/Badly
599
This document is a research report submitted to the U.S. Department of Justice. This report has not been published by the Department. Opinions or points of view expressed are those of the author(s)
and do not necessarily reflect the official position or policies of the U.S. Department of Justice.

G. Every now and then we get upset with other people. During the past year when you’ve gotten upset with someone, how often have you done the following? 1. Talked to the person about why I was upset.
1. Never 2. Sometimes 3. Often 2. Tried to figure out why I was upset.
1. Never 2. Sometimes 3. Often 3. Did nothing and just stayed angry for a while.
1. Never 2. Sometimes 3. Often 4. Told the person off or yelled at them.
1. Never 2. Sometimes 3. Often 5. Hit the person.
1. Never 2. Sometimes 3. Often When someone else was upset, how often have you done the following things during the past year? 6. Asked the person why he/she was upset.
1. Never 2. Sometimes 3. Often 7. Spoken to him/her in a calm voice.
1. Never 2. Sometimes 3. Often 8. Told the person he/she shouldn’t be upset.
1. Never 2. Sometimes 3. Often 9. Yelled at or argued with the person.
1. Never 2. Sometimes 3. Often And, every now and then we try to avoid doing things that our friends try to get us to do. During the past year when this has happened to you, how often have you done the following? 10. Told the person that I can’t do it because my parents will get upset with me.
1. Never 2. Sometimes 3. Often 11. Tried to get out of it by saying I have other things to do.
1. Never 2. Sometimes 3. Often 12. Said no like I really meant it.
1. Never 2. Sometimes 3. Often 13. Ignored the person.
1. Never 2. Sometimes 3. Often
600
This document is a research report submitted to the U.S. Department of Justice. This report has not been published by the Department. Opinions or points of view expressed are those of the author(s)
and do not necessarily reflect the official position or policies of the U.S. Department of Justice.
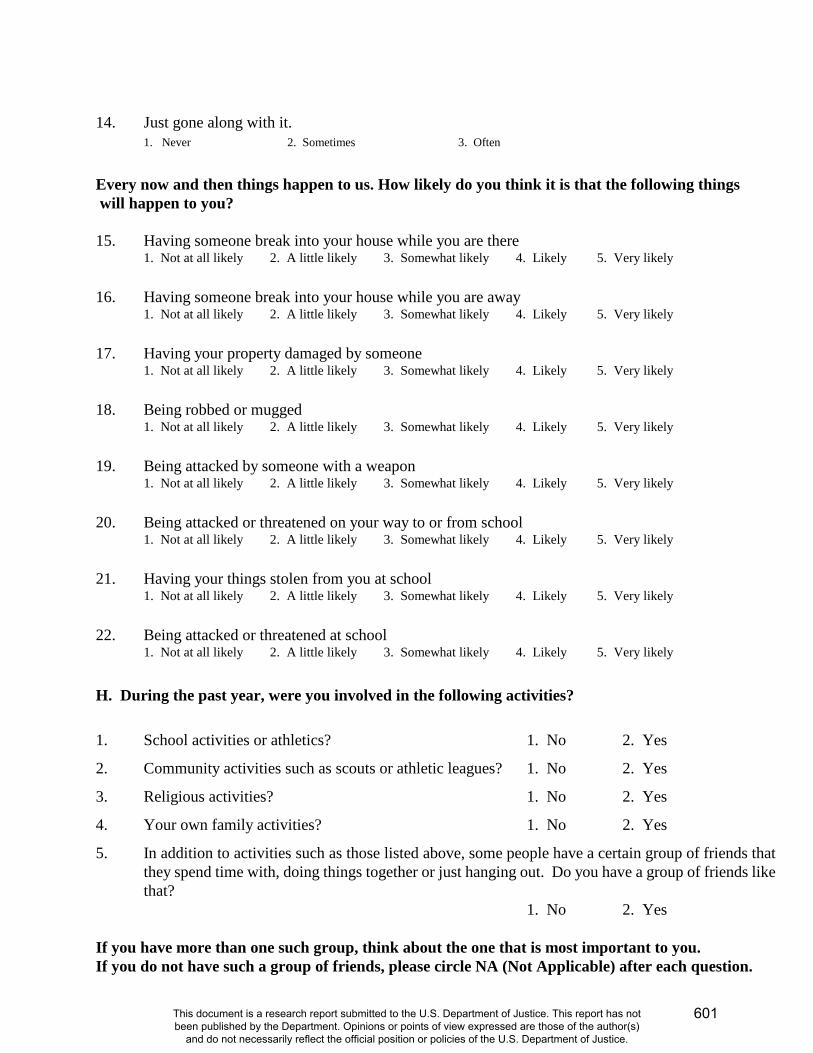
14. Just gone along with it. 1. Never 2. Sometimes 3. Often
Every now and then things happen to us. How likely do you think it is that the following things will happen to you? 15. Having someone break into your house while you are there
1. Not at all likely 2. A little likely 3. Somewhat likely 4. Likely 5. Very likely 16. Having someone break into your house while you are away
1. Not at all likely 2. A little likely 3. Somewhat likely 4. Likely 5. Very likely 17. Having your property damaged by someone
1. Not at all likely 2. A little likely 3. Somewhat likely 4. Likely 5. Very likely 18. Being robbed or mugged
1. Not at all likely 2. A little likely 3. Somewhat likely 4. Likely 5. Very likely 19. Being attacked by someone with a weapon
1. Not at all likely 2. A little likely 3. Somewhat likely 4. Likely 5. Very likely 20. Being attacked or threatened on your way to or from school
1. Not at all likely 2. A little likely 3. Somewhat likely 4. Likely 5. Very likely 21. Having your things stolen from you at school
1. Not at all likely 2. A little likely 3. Somewhat likely 4. Likely 5. Very likely 22. Being attacked or threatened at school
1. Not at all likely 2. A little likely 3. Somewhat likely 4. Likely 5. Very likely
H. During the past year, were you involved in the following activities? 1. School activities or athletics? 1. No 2. Yes
2. Community activities such as scouts or athletic leagues? 1. No 2. Yes
3. Religious activities? 1. No 2. Yes
4. Your own family activities? 1. No 2. Yes
5. In addition to activities such as those listed above, some people have a certain group of friends that they spend time with, doing things together or just hanging out. Do you have a group of friends like that? 1. No 2. Yes
If you have more than one such group, think about the one that is most important to you. If you do not have such a group of friends, please circle NA (Not Applicable) after each question.
601
This document is a research report submitted to the U.S. Department of Justice. This report has not been published by the Department. Opinions or points of view expressed are those of the author(s)
and do not necessarily reflect the official position or policies of the U.S. Department of Justice.

6. About how many people, other than you, belong to this group?
1 2 - 5 6 - 10 11 - 20 21 - 50 51 – 100 more than 100 NA
7. Which of the following categories best describes this group? 1. All male 2. Mostly male 3. About half male, half female 4. Mostly female 5. All female NA
8. Which one of the following categories best describes the races/ethnicities of people in your group?
1. All are my race/ethnicity
2. Most are my race/ethnicity
3. About half are my race/ethnicity
4. Few are my race/ethnicity
5. I am the only one of my race/ethnicity NA 9. Which one of the following best describes the ages of most of the people in your group? 1. Under twelve 2. Twelve to fifteen 3. Sixteen to eighteen 4. Nineteen to twenty-five 5. Over twenty-five NA 10. Does this group spend a lot of time together in public places like the park, the street, shopping area, or
the neighborhood? 1. No 2. Yes NA
11. Does this group have an area or place that it calls its own? 1. No 2. Yes NA 12. (IF YES) Does your group defend this area or place against other groups?
1. No 2. Yes NA 13. How long has this group existed?
1. Less than three months
2. Three months to less than one year
3. One to four years
4. Five to ten years
5. Eleven to twenty years
6. More than twenty years
NA
14. Is doing illegal things accepted by or okay for your group? 1. No 2. Yes NA
15. Do people in your group actually do illegal things together? 1. No 2. Yes NA 16. Do you consider your group of friends to be a gang? 1. No 2. Yes NA 17. If you do not consider your group of friends to be a gang, is there some other word you use to describe
your group? 1. No 2. Yes
602
This document is a research report submitted to the U.S. Department of Justice. This report has not been published by the Department. Opinions or points of view expressed are those of the author(s)
and do not necessarily reflect the official position or policies of the U.S. Department of Justice.
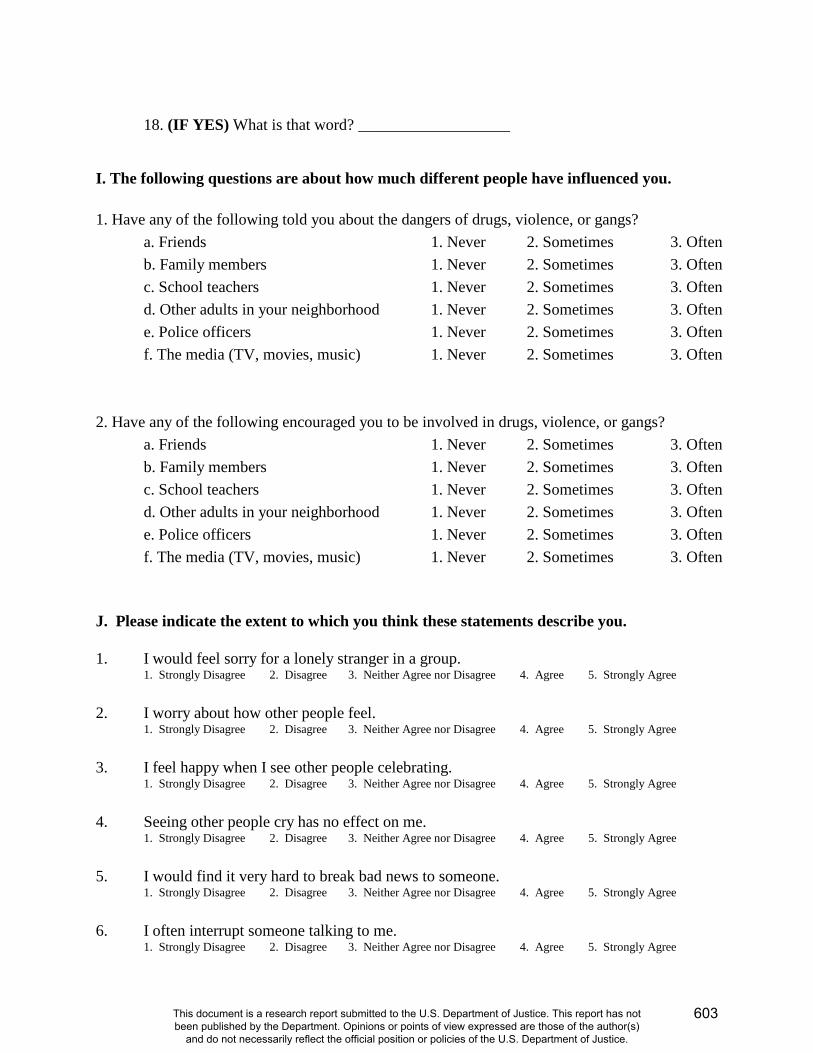
18. (IF YES) What is that word? ___________________
I. The following questions are about how much different people have influenced you. 1. Have any of the following told you about the dangers of drugs, violence, or gangs?
a. Friends 1. Never 2. Sometimes 3. Often b. Family members 1. Never 2. Sometimes 3. Often c. School teachers 1. Never 2. Sometimes 3. Often d. Other adults in your neighborhood 1. Never 2. Sometimes 3. Often e. Police officers 1. Never 2. Sometimes 3. Often f. The media (TV, movies, music) 1. Never 2. Sometimes 3. Often
2. Have any of the following encouraged you to be involved in drugs, violence, or gangs?
a. Friends 1. Never 2. Sometimes 3. Often b. Family members 1. Never 2. Sometimes 3. Often c. School teachers 1. Never 2. Sometimes 3. Often d. Other adults in your neighborhood 1. Never 2. Sometimes 3. Often e. Police officers 1. Never 2. Sometimes 3. Often f. The media (TV, movies, music) 1. Never 2. Sometimes 3. Often
J. Please indicate the extent to which you think these statements describe you. 1. I would feel sorry for a lonely stranger in a group.
1. Strongly Disagree 2. Disagree 3. Neither Agree nor Disagree 4. Agree 5. Strongly Agree 2. I worry about how other people feel.
1. Strongly Disagree 2. Disagree 3. Neither Agree nor Disagree 4. Agree 5. Strongly Agree 3. I feel happy when I see other people celebrating.
1. Strongly Disagree 2. Disagree 3. Neither Agree nor Disagree 4. Agree 5. Strongly Agree 4. Seeing other people cry has no effect on me.
1. Strongly Disagree 2. Disagree 3. Neither Agree nor Disagree 4. Agree 5. Strongly Agree 5. I would find it very hard to break bad news to someone.
1. Strongly Disagree 2. Disagree 3. Neither Agree nor Disagree 4. Agree 5. Strongly Agree 6. I often interrupt someone talking to me.
1. Strongly Disagree 2. Disagree 3. Neither Agree nor Disagree 4. Agree 5. Strongly Agree
603
This document is a research report submitted to the U.S. Department of Justice. This report has not been published by the Department. Opinions or points of view expressed are those of the author(s)
and do not necessarily reflect the official position or policies of the U.S. Department of Justice.

7. I look at the person talking to me. 1. Strongly Disagree 2. Disagree 3. Neither Agree nor Disagree 4. Agree 5. Strongly Agree
8. I pay attention to other people’s body language when they are talking to me.
1. Strongly Disagree 2. Disagree 3. Neither Agree nor Disagree 4. Agree 5. Strongly Agree 9. I ask questions of the person speaking to me.
1. Strongly Disagree 2. Disagree 3. Neither Agree nor Disagree 4. Agree 5. Strongly Agree 10. I talk to my friends about my problems.
1. Strongly Disagree 2. Disagree 3. Neither Agree nor Disagree 4. Agree 5. Strongly Agree 11. I talk to adults about my problems.
1. Strongly Disagree 2. Disagree 3. Neither Agree nor Disagree 4. Agree 5. Strongly Agree
12. When I make plans, I am certain I can make them work. 1. Strongly Disagree 2. Disagree 3. Neither Agree nor Disagree 4. Agree 5. Strongly Agree 13. If I can’t do something the first time, I keep trying until I can. 1. Strongly Disagree 2. Disagree 3. Neither Agree nor Disagree 4. Agree 5. Strongly Agree 14. When I have something unpleasant to do, I stick to it until I finish it.
1. Strongly Disagree 2. Disagree 3. Neither Agree nor Disagree 4. Agree 5. Strongly Agree 15. When I decide to do something, I go right to work on it.
1. Strongly Disagree 2. Disagree 3. Neither Agree nor Disagree 4. Agree 5. Strongly Agree 16. Failure just makes me try harder.
1. Strongly Disagree 2. Disagree 3. Neither Agree nor Disagree 4. Agree 5. Strongly Agree How much do you agree or disagree with the following statements? 17. When someone disrespects you, it is important that you use physical force or aggression to teach him
or her not to disrespect you. 1. Strongly disagree 2. Disagree 3. Neither agree nor disagree 4. Agree 5. Strongly agree
18. If someone uses violence against you, it is important that you use violence against him or her to get
even. 1. Strongly disagree 2. Disagree 3. Neither agree nor disagree 4. Agree 5. Strongly agree
19. People will take advantage of you if you don’t let them know how tough you are.
1. Strongly disagree 2. Disagree 3. Neither agree nor disagree 4. Agree 5. Strongly agree 20. People do not respect a person who is afraid to fight physically for his/her rights.
1. Strongly disagree 2. Disagree 3. Neither agree nor disagree 4. Agree 5. Strongly agree 21. Sometimes you need to threaten people in order to get them to treat you fairly.
1. Strongly disagree 2. Disagree 3. Neither agree nor disagree 4. Agree 5. Strongly agree
604
This document is a research report submitted to the U.S. Department of Justice. This report has not been published by the Department. Opinions or points of view expressed are those of the author(s)
and do not necessarily reflect the official position or policies of the U.S. Department of Justice.
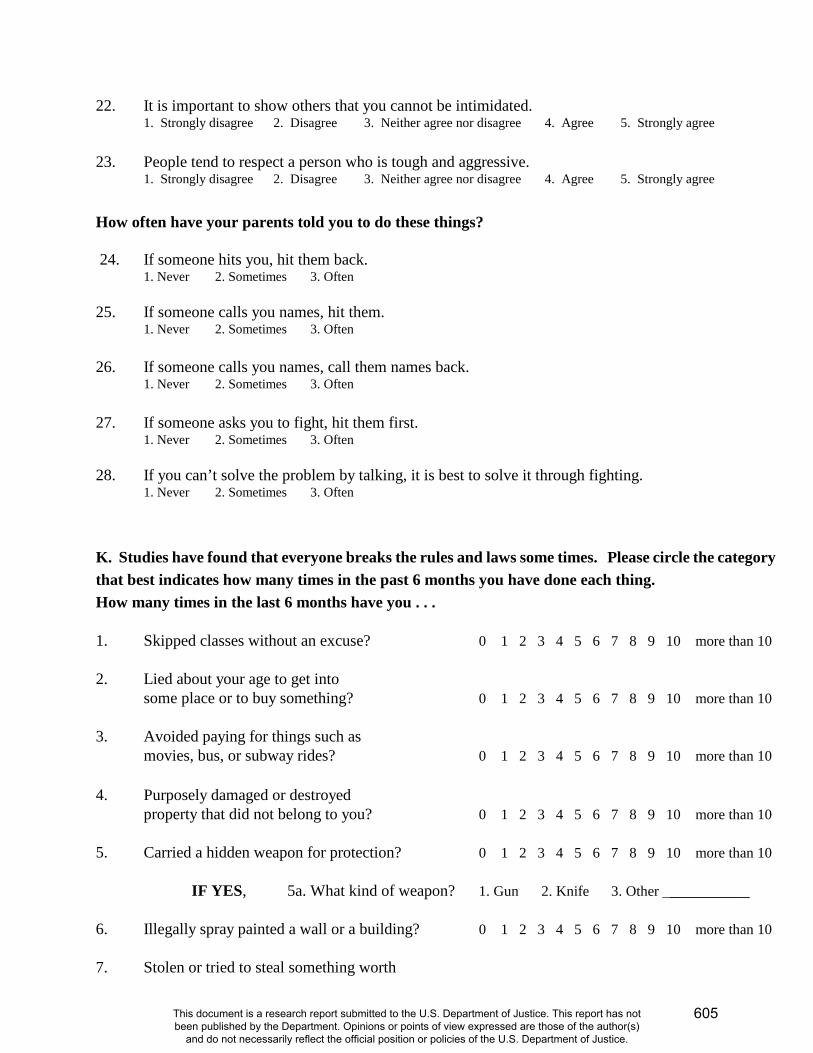
22. It is important to show others that you cannot be intimidated. 1. Strongly disagree 2. Disagree 3. Neither agree nor disagree 4. Agree 5. Strongly agree
23. People tend to respect a person who is tough and aggressive.
1. Strongly disagree 2. Disagree 3. Neither agree nor disagree 4. Agree 5. Strongly agree How often have your parents told you to do these things? 24. If someone hits you, hit them back.
1. Never 2. Sometimes 3. Often 25. If someone calls you names, hit them.
1. Never 2. Sometimes 3. Often
26. If someone calls you names, call them names back. 1. Never 2. Sometimes 3. Often
27. If someone asks you to fight, hit them first.
1. Never 2. Sometimes 3. Often
28. If you can’t solve the problem by talking, it is best to solve it through fighting. 1. Never 2. Sometimes 3. Often
K. Studies have found that everyone breaks the rules and laws some times. Please circle the category that best indicates how many times in the past 6 months you have done each thing. How many times in the last 6 months have you . . . 1. Skipped classes without an excuse? 0 1 2 3 4 5 6 7 8 9 10 more than 10 2. Lied about your age to get into some place or to buy something? 0 1 2 3 4 5 6 7 8 9 10 more than 10 3. Avoided paying for things such as movies, bus, or subway rides? 0 1 2 3 4 5 6 7 8 9 10 more than 10 4. Purposely damaged or destroyed property that did not belong to you? 0 1 2 3 4 5 6 7 8 9 10 more than 10 5. Carried a hidden weapon for protection? 0 1 2 3 4 5 6 7 8 9 10 more than 10 IF YES, 5a. What kind of weapon? 1. Gun 2. Knife 3. Other ___________ 6. Illegally spray painted a wall or a building? 0 1 2 3 4 5 6 7 8 9 10 more than 10 7. Stolen or tried to steal something worth
605
This document is a research report submitted to the U.S. Department of Justice. This report has not been published by the Department. Opinions or points of view expressed are those of the author(s)
and do not necessarily reflect the official position or policies of the U.S. Department of Justice.
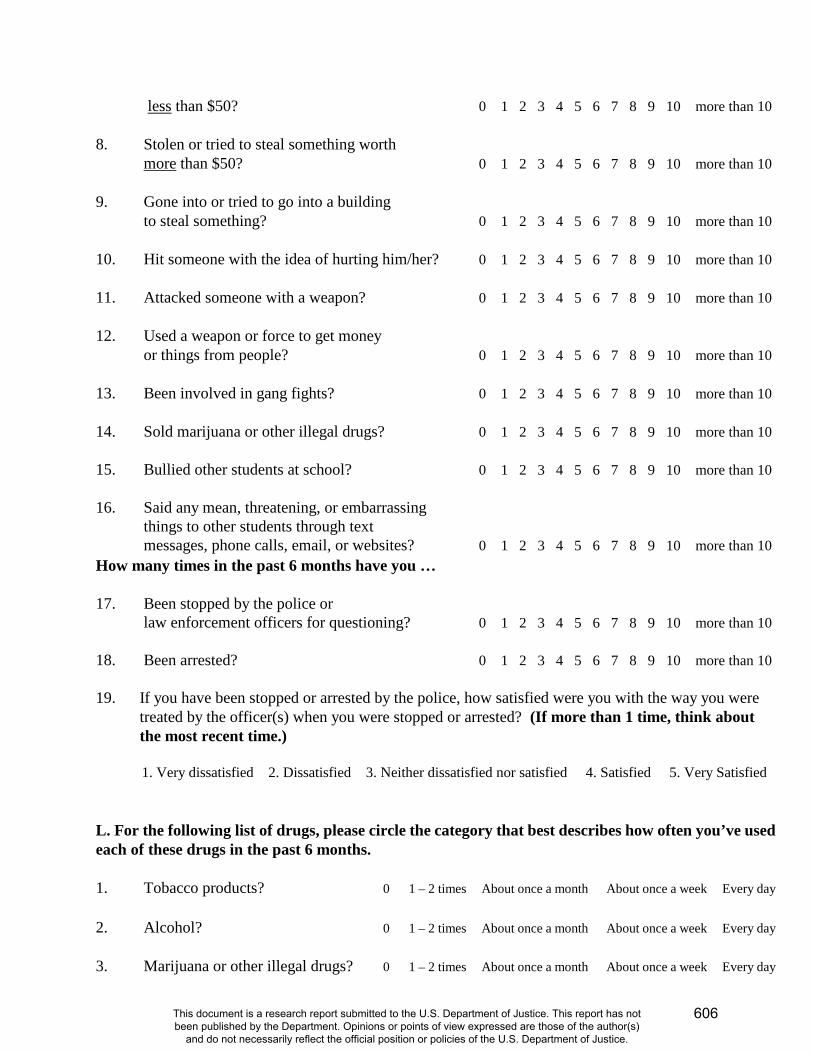
less than $50? 0 1 2 3 4 5 6 7 8 9 10 more than 10 8. Stolen or tried to steal something worth more than $50? 0 1 2 3 4 5 6 7 8 9 10 more than 10 9. Gone into or tried to go into a building to steal something? 0 1 2 3 4 5 6 7 8 9 10 more than 10 10. Hit someone with the idea of hurting him/her? 0 1 2 3 4 5 6 7 8 9 10 more than 10 11. Attacked someone with a weapon? 0 1 2 3 4 5 6 7 8 9 10 more than 10 12. Used a weapon or force to get money or things from people? 0 1 2 3 4 5 6 7 8 9 10 more than 10 13. Been involved in gang fights? 0 1 2 3 4 5 6 7 8 9 10 more than 10 14. Sold marijuana or other illegal drugs? 0 1 2 3 4 5 6 7 8 9 10 more than 10 15. Bullied other students at school? 0 1 2 3 4 5 6 7 8 9 10 more than 10 16. Said any mean, threatening, or embarrassing
things to other students through text messages, phone calls, email, or websites? 0 1 2 3 4 5 6 7 8 9 10 more than 10
How many times in the past 6 months have you … 17. Been stopped by the police or law enforcement officers for questioning? 0 1 2 3 4 5 6 7 8 9 10 more than 10 18. Been arrested? 0 1 2 3 4 5 6 7 8 9 10 more than 10 19. If you have been stopped or arrested by the police, how satisfied were you with the way you were treated by the officer(s) when you were stopped or arrested? (If more than 1 time, think about the most recent time.) 1. Very dissatisfied 2. Dissatisfied 3. Neither dissatisfied nor satisfied 4. Satisfied 5. Very Satisfied L. For the following list of drugs, please circle the category that best describes how often you’ve used each of these drugs in the past 6 months. 1. Tobacco products? 0 1 – 2 times About once a month About once a week Every day 2. Alcohol? 0 1 – 2 times About once a month About once a week Every day 3. Marijuana or other illegal drugs? 0 1 – 2 times About once a month About once a week Every day
606
This document is a research report submitted to the U.S. Department of Justice. This report has not been published by the Department. Opinions or points of view expressed are those of the author(s)
and do not necessarily reflect the official position or policies of the U.S. Department of Justice.
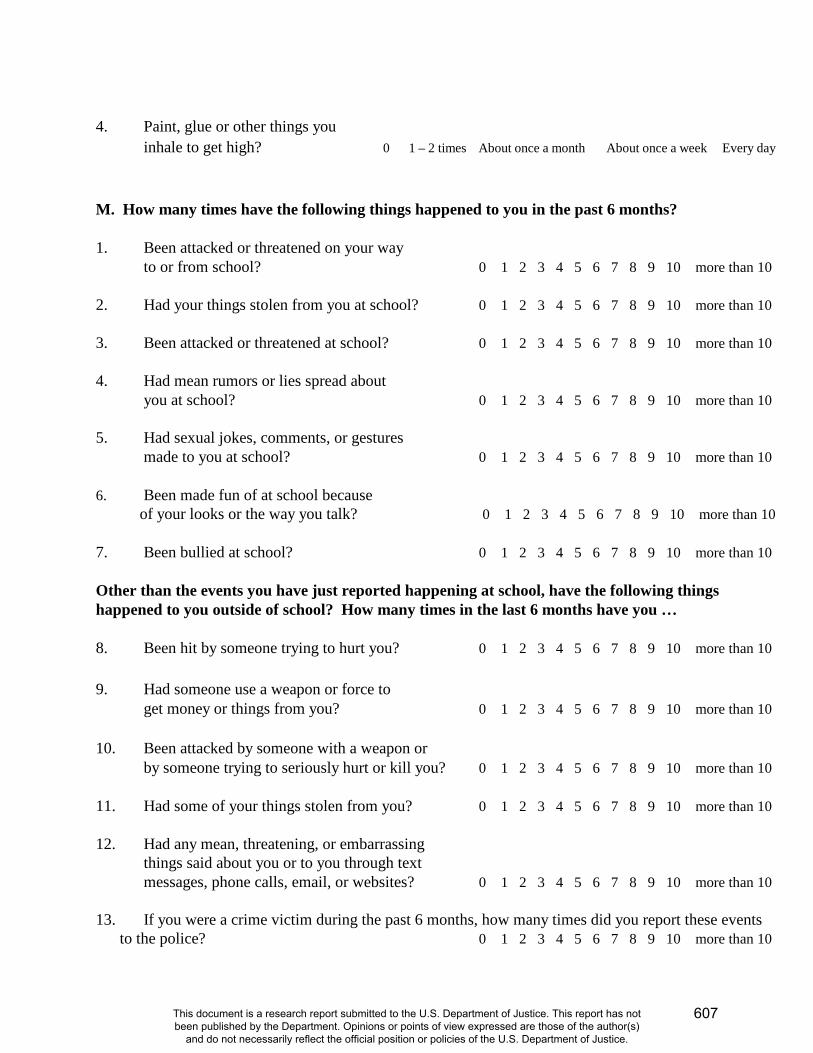
4. Paint, glue or other things you inhale to get high? 0 1 – 2 times About once a month About once a week Every day M. How many times have the following things happened to you in the past 6 months? 1. Been attacked or threatened on your way to or from school? 0 1 2 3 4 5 6 7 8 9 10 more than 10 2. Had your things stolen from you at school? 0 1 2 3 4 5 6 7 8 9 10 more than 10 3. Been attacked or threatened at school? 0 1 2 3 4 5 6 7 8 9 10 more than 10 4. Had mean rumors or lies spread about you at school? 0 1 2 3 4 5 6 7 8 9 10 more than 10 5. Had sexual jokes, comments, or gestures made to you at school? 0 1 2 3 4 5 6 7 8 9 10 more than 10 6. Been made fun of at school because
of your looks or the way you talk? 0 1 2 3 4 5 6 7 8 9 10 more than 10 7. Been bullied at school? 0 1 2 3 4 5 6 7 8 9 10 more than 10 Other than the events you have just reported happening at school, have the following things happened to you outside of school? How many times in the last 6 months have you … 8. Been hit by someone trying to hurt you? 0 1 2 3 4 5 6 7 8 9 10 more than 10 9. Had someone use a weapon or force to get money or things from you? 0 1 2 3 4 5 6 7 8 9 10 more than 10 10. Been attacked by someone with a weapon or by someone trying to seriously hurt or kill you? 0 1 2 3 4 5 6 7 8 9 10 more than 10 11. Had some of your things stolen from you? 0 1 2 3 4 5 6 7 8 9 10 more than 10 12. Had any mean, threatening, or embarrassing
things said about you or to you through text messages, phone calls, email, or websites? 0 1 2 3 4 5 6 7 8 9 10 more than 10 13. If you were a crime victim during the past 6 months, how many times did you report these events
to the police? 0 1 2 3 4 5 6 7 8 9 10 more than 10
607
This document is a research report submitted to the U.S. Department of Justice. This report has not been published by the Department. Opinions or points of view expressed are those of the author(s)
and do not necessarily reflect the official position or policies of the U.S. Department of Justice.
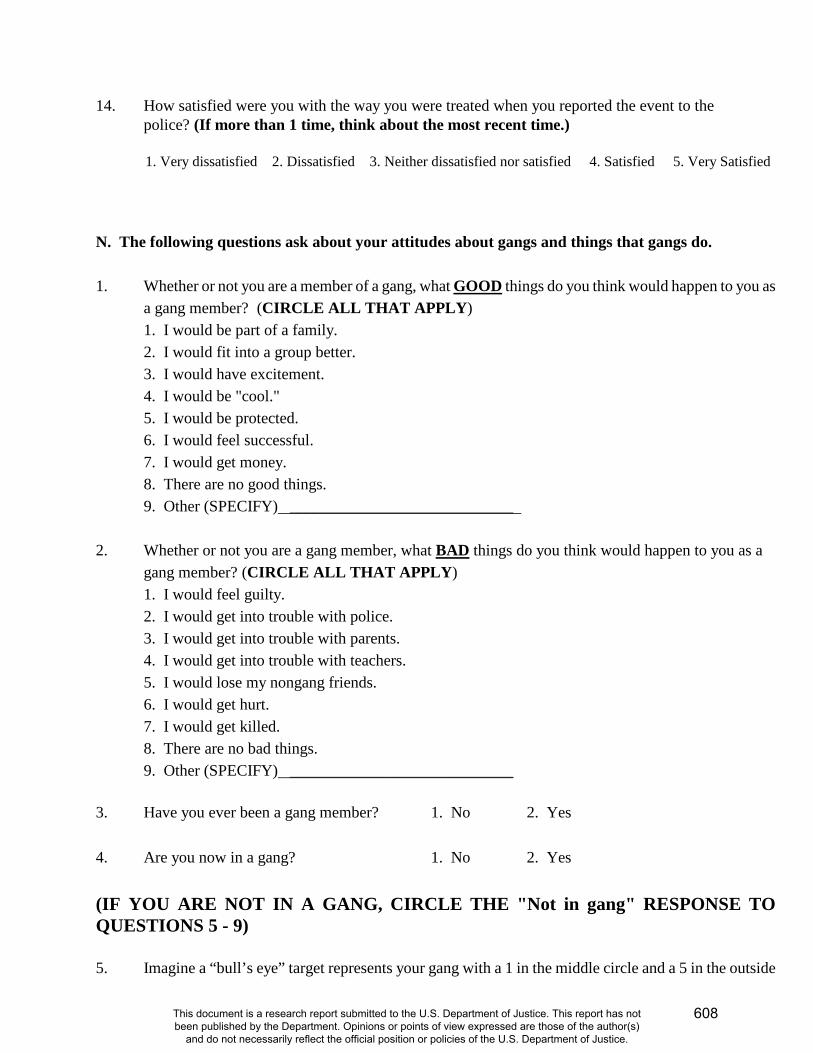
14. How satisfied were you with the way you were treated when you reported the event to the police? (If more than 1 time, think about the most recent time.)
1. Very dissatisfied 2. Dissatisfied 3. Neither dissatisfied nor satisfied 4. Satisfied 5. Very Satisfied N. The following questions ask about your attitudes about gangs and things that gangs do. 1. Whether or not you are a member of a gang, what GOOD things do you think would happen to you as
a gang member? (CIRCLE ALL THAT APPLY) 1. I would be part of a family. 2. I would fit into a group better. 3. I would have excitement. 4. I would be "cool." 5. I would be protected. 6. I would feel successful. 7. I would get money. 8. There are no good things. 9. Other (SPECIFY) ____________________________
2. Whether or not you are a gang member, what BAD things do you think would happen to you as a
gang member? (CIRCLE ALL THAT APPLY) 1. I would feel guilty. 2. I would get into trouble with police. 3. I would get into trouble with parents. 4. I would get into trouble with teachers. 5. I would lose my nongang friends. 6. I would get hurt. 7. I would get killed. 8. There are no bad things. 9. Other (SPECIFY) ____________________________
3. Have you ever been a gang member? 1. No 2. Yes 4. Are you now in a gang? 1. No 2. Yes (IF YOU ARE NOT IN A GANG, CIRCLE THE "Not in gang" RESPONSE TO QUESTIONS 5 - 9) 5. Imagine a “bull’s eye” target represents your gang with a 1 in the middle circle and a 5 in the outside
608
This document is a research report submitted to the U.S. Department of Justice. This report has not been published by the Department. Opinions or points of view expressed are those of the author(s)
and do not necessarily reflect the official position or policies of the U.S. Department of Justice.
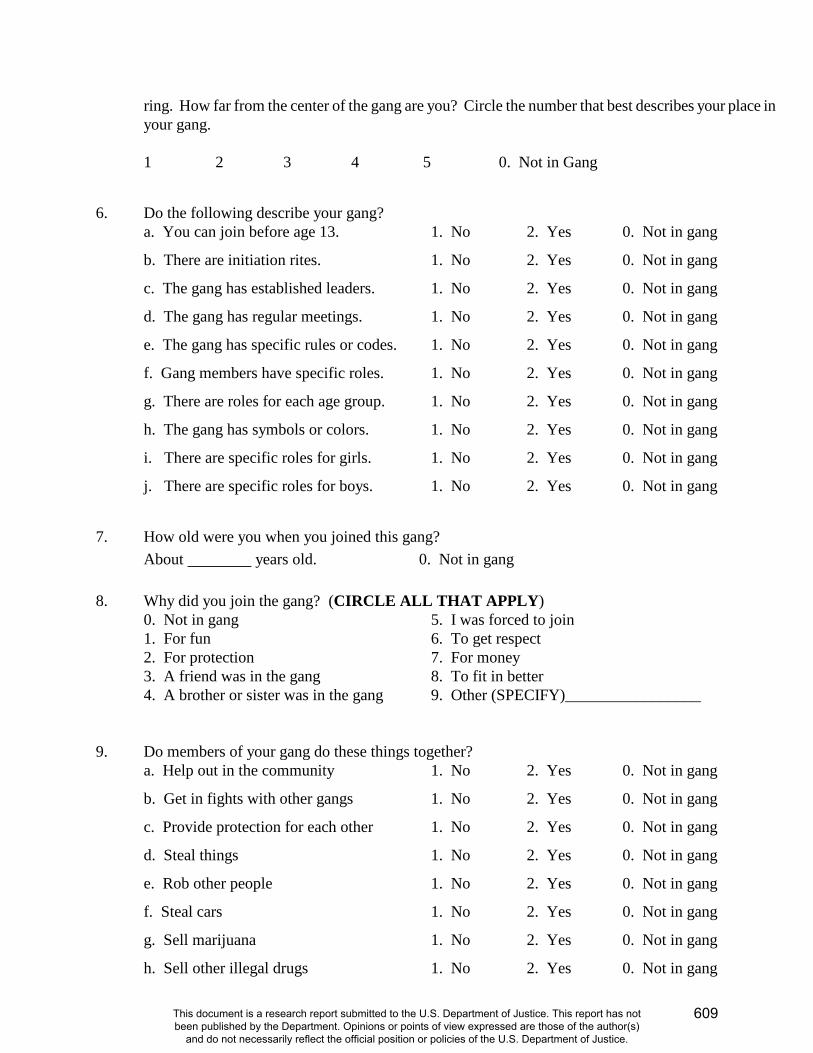
ring. How far from the center of the gang are you? Circle the number that best describes your place in your gang.
1 2 3 4 5 0. Not in Gang
6. Do the following describe your gang?
a. You can join before age 13. 1. No 2. Yes 0. Not in gang
b. There are initiation rites. 1. No 2. Yes 0. Not in gang
c. The gang has established leaders. 1. No 2. Yes 0. Not in gang
d. The gang has regular meetings. 1. No 2. Yes 0. Not in gang
e. The gang has specific rules or codes. 1. No 2. Yes 0. Not in gang
f. Gang members have specific roles. 1. No 2. Yes 0. Not in gang
g. There are roles for each age group. 1. No 2. Yes 0. Not in gang
h. The gang has symbols or colors. 1. No 2. Yes 0. Not in gang
i. There are specific roles for girls. 1. No 2. Yes 0. Not in gang
j. There are specific roles for boys. 1. No 2. Yes 0. Not in gang
7. How old were you when you joined this gang?
About years old. 0. Not in gang 8. Why did you join the gang? (CIRCLE ALL THAT APPLY)
0. Not in gang 5. I was forced to join 1. For fun 6. To get respect 2. For protection 7. For money 3. A friend was in the gang 8. To fit in better 4. A brother or sister was in the gang 9. Other (SPECIFY)_________________
9. Do members of your gang do these things together?
a. Help out in the community 1. No 2. Yes 0. Not in gang
b. Get in fights with other gangs 1. No 2. Yes 0. Not in gang
c. Provide protection for each other 1. No 2. Yes 0. Not in gang
d. Steal things 1. No 2. Yes 0. Not in gang
e. Rob other people 1. No 2. Yes 0. Not in gang
f. Steal cars 1. No 2. Yes 0. Not in gang
g. Sell marijuana 1. No 2. Yes 0. Not in gang
h. Sell other illegal drugs 1. No 2. Yes 0. Not in gang
609
This document is a research report submitted to the U.S. Department of Justice. This report has not been published by the Department. Opinions or points of view expressed are those of the author(s)
and do not necessarily reflect the official position or policies of the U.S. Department of Justice.
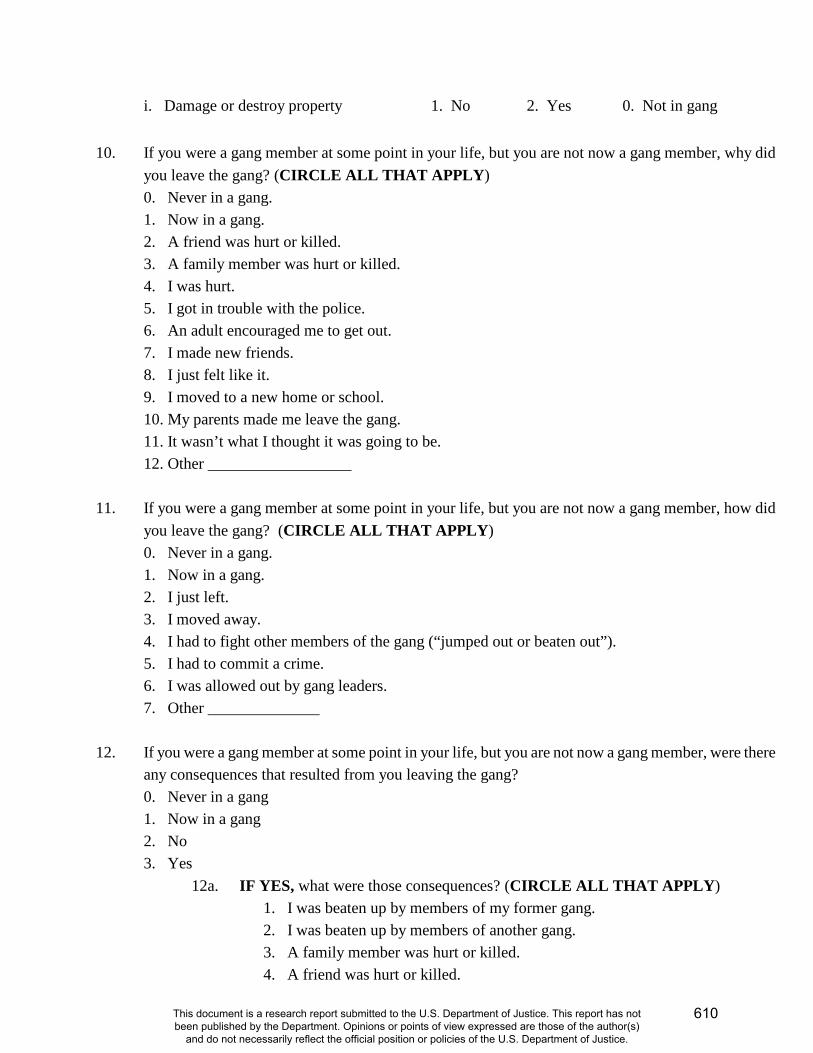
i. Damage or destroy property 1. No 2. Yes 0. Not in gang
10. If you were a gang member at some point in your life, but you are not now a gang member, why did
you leave the gang? (CIRCLE ALL THAT APPLY) 0. Never in a gang. 1. Now in a gang. 2. A friend was hurt or killed. 3. A family member was hurt or killed. 4. I was hurt. 5. I got in trouble with the police. 6. An adult encouraged me to get out. 7. I made new friends. 8. I just felt like it. 9. I moved to a new home or school. 10. My parents made me leave the gang. 11. It wasn’t what I thought it was going to be. 12. Other __________________
11. If you were a gang member at some point in your life, but you are not now a gang member, how did
you leave the gang? (CIRCLE ALL THAT APPLY) 0. Never in a gang. 1. Now in a gang. 2. I just left. 3. I moved away. 4. I had to fight other members of the gang (“jumped out or beaten out”). 5. I had to commit a crime. 6. I was allowed out by gang leaders. 7. Other ______________
12. If you were a gang member at some point in your life, but you are not now a gang member, were there
any consequences that resulted from you leaving the gang? 0. Never in a gang 1. Now in a gang 2. No 3. Yes
12a. IF YES, what were those consequences? (CIRCLE ALL THAT APPLY) 1. I was beaten up by members of my former gang. 2. I was beaten up by members of another gang. 3. A family member was hurt or killed. 4. A friend was hurt or killed.
610
This document is a research report submitted to the U.S. Department of Justice. This report has not been published by the Department. Opinions or points of view expressed are those of the author(s)
and do not necessarily reflect the official position or policies of the U.S. Department of Justice.
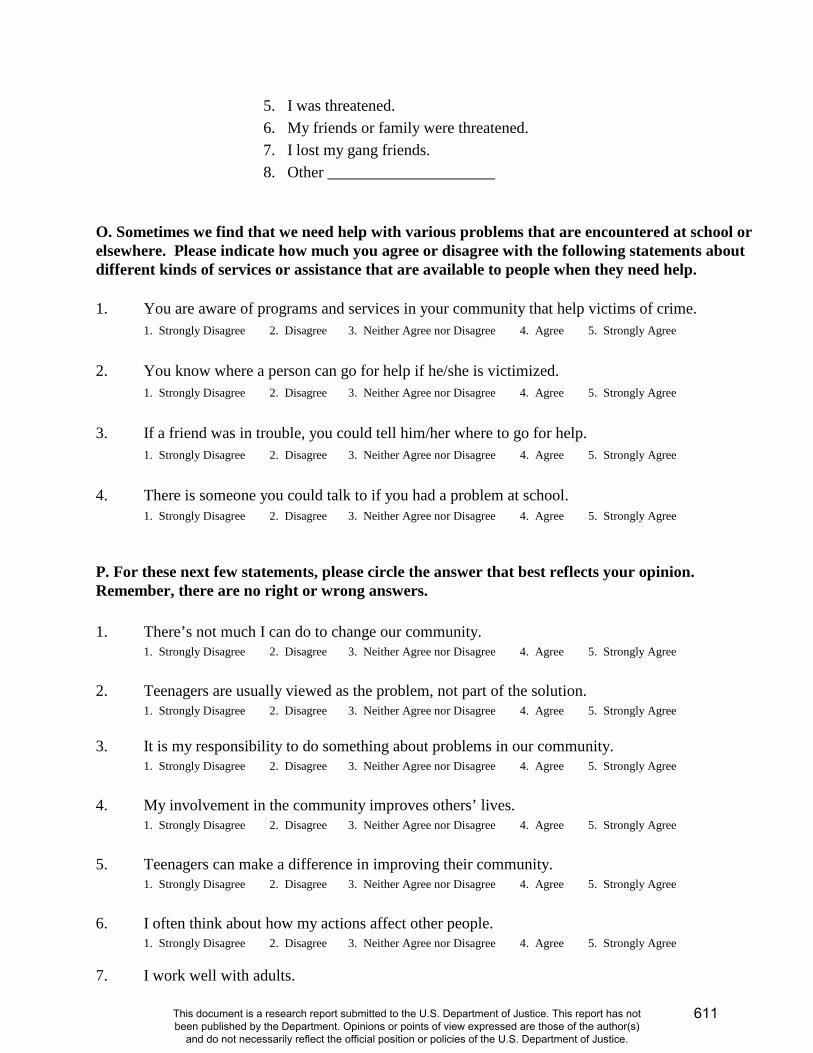
5. I was threatened.6. My friends or family were threatened.7. I lost my gang friends.8. Other _____________________
O. Sometimes we find that we need help with various problems that are encountered at school or elsewhere. Please indicate how much you agree or disagree with the following statements about different kinds of services or assistance that are available to people when they need help.
1. You are aware of programs and services in your community that help victims of crime.1. Strongly Disagree 2. Disagree 3. Neither Agree nor Disagree 4. Agree 5. Strongly Agree
2. You know where a person can go for help if he/she is victimized.1. Strongly Disagree 2. Disagree 3. Neither Agree nor Disagree 4. Agree 5. Strongly Agree
3. If a friend was in trouble, you could tell him/her where to go for help.1. Strongly Disagree 2. Disagree 3. Neither Agree nor Disagree 4. Agree 5. Strongly Agree
4. There is someone you could talk to if you had a problem at school.1. Strongly Disagree 2. Disagree 3. Neither Agree nor Disagree 4. Agree 5. Strongly Agree
P. For these next few statements, please circle the answer that best reflects your opinion. Remember, there are no right or wrong answers.
1. There’s not much I can do to change our community.1. Strongly Disagree 2. Disagree 3. Neither Agree nor Disagree 4. Agree 5. Strongly Agree
2. Teenagers are usually viewed as the problem, not part of the solution.1. Strongly Disagree 2. Disagree 3. Neither Agree nor Disagree 4. Agree 5. Strongly Agree
3. It is my responsibility to do something about problems in our community.1. Strongly Disagree 2. Disagree 3. Neither Agree nor Disagree 4. Agree 5. Strongly Agree
4. My involvement in the community improves others’ lives.1. Strongly Disagree 2. Disagree 3. Neither Agree nor Disagree 4. Agree 5. Strongly Agree
5. Teenagers can make a difference in improving their community.1. Strongly Disagree 2. Disagree 3. Neither Agree nor Disagree 4. Agree 5. Strongly Agree
6. I often think about how my actions affect other people.1. Strongly Disagree 2. Disagree 3. Neither Agree nor Disagree 4. Agree 5. Strongly Agree
7. I work well with adults.
611
This document is a research report submitted to the U.S. Department of Justice. This report has not been published by the Department. Opinions or points of view expressed are those of the author(s)
and do not necessarily reflect the official position or policies of the U.S. Department of Justice.
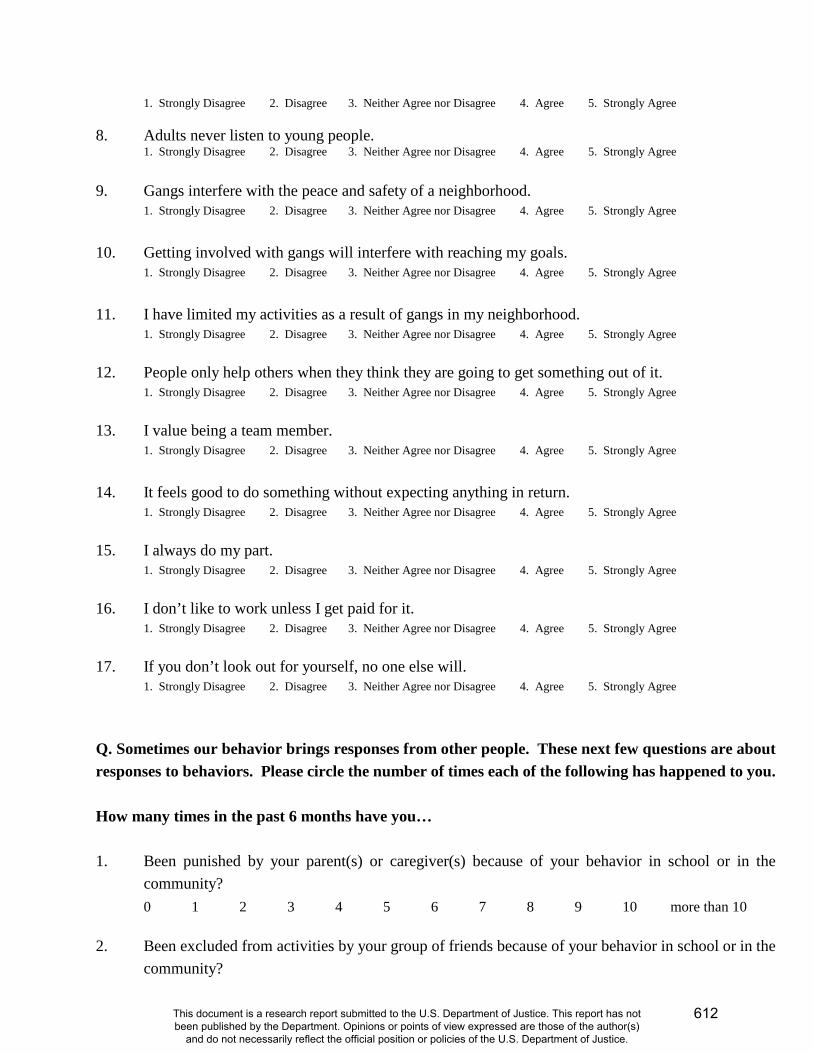
1. Strongly Disagree 2. Disagree 3. Neither Agree nor Disagree 4. Agree 5. Strongly Agree 8. Adults never listen to young people. 1. Strongly Disagree 2. Disagree 3. Neither Agree nor Disagree 4. Agree 5. Strongly Agree 9. Gangs interfere with the peace and safety of a neighborhood.
1. Strongly Disagree 2. Disagree 3. Neither Agree nor Disagree 4. Agree 5. Strongly Agree 10. Getting involved with gangs will interfere with reaching my goals.
1. Strongly Disagree 2. Disagree 3. Neither Agree nor Disagree 4. Agree 5. Strongly Agree 11. I have limited my activities as a result of gangs in my neighborhood.
1. Strongly Disagree 2. Disagree 3. Neither Agree nor Disagree 4. Agree 5. Strongly Agree 12. People only help others when they think they are going to get something out of it.
1. Strongly Disagree 2. Disagree 3. Neither Agree nor Disagree 4. Agree 5. Strongly Agree 13. I value being a team member. 1. Strongly Disagree 2. Disagree 3. Neither Agree nor Disagree 4. Agree 5. Strongly Agree 14. It feels good to do something without expecting anything in return.
1. Strongly Disagree 2. Disagree 3. Neither Agree nor Disagree 4. Agree 5. Strongly Agree 15. I always do my part.
1. Strongly Disagree 2. Disagree 3. Neither Agree nor Disagree 4. Agree 5. Strongly Agree 16. I don’t like to work unless I get paid for it.
1. Strongly Disagree 2. Disagree 3. Neither Agree nor Disagree 4. Agree 5. Strongly Agree 17. If you don’t look out for yourself, no one else will.
1. Strongly Disagree 2. Disagree 3. Neither Agree nor Disagree 4. Agree 5. Strongly Agree Q. Sometimes our behavior brings responses from other people. These next few questions are about responses to behaviors. Please circle the number of times each of the following has happened to you. How many times in the past 6 months have you… 1. Been punished by your parent(s) or caregiver(s) because of your behavior in school or in the
community? 0 1 2 3 4 5 6 7 8 9 10 more than 10 2. Been excluded from activities by your group of friends because of your behavior in school or in the
community?
612
This document is a research report submitted to the U.S. Department of Justice. This report has not been published by the Department. Opinions or points of view expressed are those of the author(s)
and do not necessarily reflect the official position or policies of the U.S. Department of Justice.
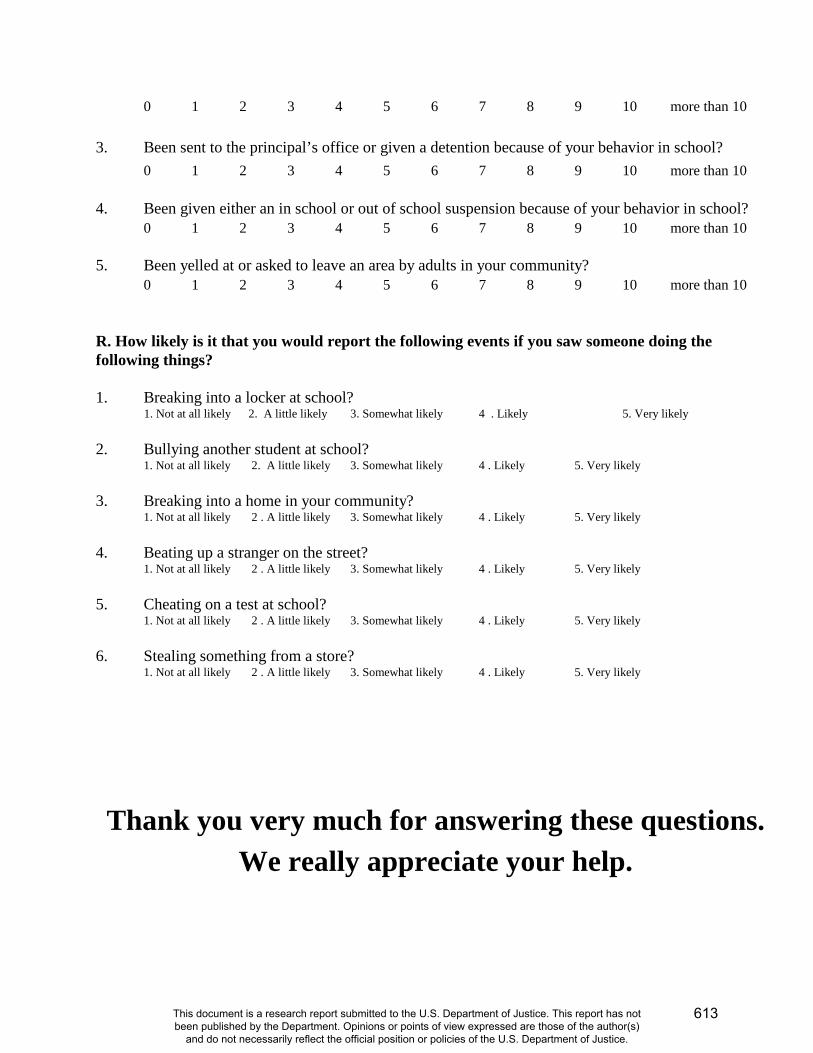
0 1 2 3 4 5 6 7 8 9 10 more than 10
3. Been sent to the principal’s office or given a detention because of your behavior in school?0 1 2 3 4 5 6 7 8 9 10 more than 10
4. Been given either an in school or out of school suspension because of your behavior in school?0 1 2 3 4 5 6 7 8 9 10 more than 10
5. Been yelled at or asked to leave an area by adults in your community?0 1 2 3 4 5 6 7 8 9 10 more than 10
R. How likely is it that you would report the following events if you saw someone doing the following things?
1. Breaking into a locker at school?1. Not at all likely 2. A little likely 3. Somewhat likely 4 . Likely 5. Very likely
2. Bullying another student at school?1. Not at all likely 2. A little likely 3. Somewhat likely 4 . Likely 5. Very likely
3. Breaking into a home in your community?1. Not at all likely 2 . A little likely 3. Somewhat likely 4 . Likely 5. Very likely
4. Beating up a stranger on the street?1. Not at all likely 2 . A little likely 3. Somewhat likely 4 . Likely 5. Very likely
5. Cheating on a test at school?1. Not at all likely 2 . A little likely 3. Somewhat likely 4 . Likely 5. Very likely
6. Stealing something from a store?1. Not at all likely 2 . A little likely 3. Somewhat likely 4 . Likely 5. Very likely
Thank you very much for answering these questions. We really appreciate your help.
613
This document is a research report submitted to the U.S. Department of Justice. This report has not been published by the Department. Opinions or points of view expressed are those of the author(s)
and do not necessarily reflect the official position or policies of the U.S. Department of Justice.