Embed Size (px)
Citation preview

Alternat ive and Renewable Fue l and Vehic le Technology Program
FINAL PROJECT REPORT
Process and Outcome Evaluation of the Alternative and Renewable Fuel and Vehicle Technology Program
SEPTEMBER 2017
CEC-‐600-‐11 -‐004
Prepared for: California Energy Commission
Prepared by: RAND Corporation

ii
DISCLAIMER
This report was prepared as the result of work sponsored by the California Energy Commission. It
does not necessarily represent the views of the Energy Commission, its employees or the State of
California. The Energy Commission, the State of California, its employees, contractors and
subcontractors make no warrant, express or implied, and assume no legal liability for the information
in this report; nor does any party represent that the uses of this information will not infringe upon
privately owned rights. This report has not been approved or disapproved by the California Energy
Commission nor has the California Energy Commission passed upon the accuracy or adequacy of
the information in this report.
For more information on this publication, visit www.rand.org/t/rr1948 Prepared by: Authors From RAND Corporation Lloyd Dixon Tom LaTourrette David Galvan Charles Goldman Nidhi Kalra Christopher Nelson Flavia Tsang Paul Steinberg Agreement Number: 600-11-004 Prepared for: California Energy Commission Jim McKinney, Pierre duVair, Aida Escala Agreement Managers John Butler Office Manager Zero Emission Vehicle and Infrastructure Office John Kato Deputy Director Fuels and Transportation Division Robert P. Oglesby Executive Director
From Sierra Research James Lyons From Advent Consulting Jerry Bowers From Katin Engineering Consulting Bob Katin
iii
ACKNOWLEDGMENTS
We acknowledge the Commission Agreement Managers (CAMs) for this project—Jim McKinney,
Pierre duVair, and Aida Escala—for facilitating the evaluation by providing administrative data,
project documents, and introductions to numerous California Energy Commission (CEC) staff.
We also thank the CAMs for numerous other projects who met with us to discuss their projects
and who responded to our requests for data. We are especially grateful to Elizabeth John, who
led the effort to compile and send us administrative databases and project documentation for
more than 300 projects. We are also indebted to senior Alternative and Renewable Fuel and
Vehicle Technology Program (ARFVTP) staff for meeting with us to discuss program strategy,
implementation, and lessons learned. And we would like to thank Jean Baronas, Pierre duVair,
Bill Kinney, David Nichols, and Matthew Ong at CEC for comments on the draft report.
We also gratefully acknowledge the members of the project’s Evaluation Advisory Committee:
David Greene from Oak Ridge National Laboratory and the Howard H. Baker, Jr. Center for
Public Policy at the University of Tennessee; Harry Hatry from the Urban Institute; Ivor John
from Lloyd's Register Quality Assurance; Dan Kammen from the Energy and Resources Group
and the Goldman School of Public Policy at the University of California, Berkeley; and Sonia Yeh
from the Institute of Transportation Studies at the University of California, Davis. The
committee provided valuable guidance and recommendations at several points during the
evaluation, including reviewing the draft final report.
We thank the experts at Stillwater Associates for their technical support of the in-depth project
reviews and for compiling indicator data for the alternative fuels and fueling infrastructure
markets in California.
At RAND, Karin Liu of RAND’s Survey Research Group provided valuable advice on designing
the instrument for the study survey and did an outstanding job pretesting and fielding it. Katie
Loa analyzed the program investment plans and program opportunity notices. Jim Powers
wrote a constructive peer review of the draft report, Keith Crane provided helpful advice during
the course of the project, and Marjory Blumenthal, director of RAND’s Science, Technology, and
Policy Program, provided much-appreciated comments on the draft report. Paul Sorensen,
previously at RAND, played a lead role in putting the project together, designing the evaluation
approach, and writing background documents on barriers to market viability. Martin Wachs,
also previously at RAND, was instrumental in assembling the Evaluation Advisory Committee.
Linda Theung skillfully edited the document. We thank them for their contributions.
Finally, we would like to thank the 475 ARFVTP awardees, unsuccessful applicants, and
potential applicants who completed a detailed survey about the program and the 38 awardees
who participated in in-depth project reviews. Their input was essential to a comprehensive
evaluation of the program.

iv
PREFACE
Assembly Bill (AB) 118 (Núñez, Chapter 750, Statutes of 2007), created the Alternative and
Renewable Fuel and Vehicle Technology Program (ARFVTP). The statute, subsequently amended
by AB 109 (Núñez, Chapter 313, Statutes of 2008), authorizes the California Energy Commission
(CEC) to develop and deploy alternative and renewable fuels and advanced transportation
technologies to help attain the state’s climate change policies. The CEC has an annual program
budget of about $100 million and provides financial support for projects that
• develop and improve alternative and renewable low-carbon fuels
• enhance alternative and renewable fuels for existing and developing engine technologies
• produce alternative and renewable low-carbon fuels in California
• decrease, on a full-fuel-cycle basis, the overall impact and carbon footprint of alternative
and renewable fuels and increase sustainability
• expand fuel infrastructure, fueling stations, and equipment
• improve light-, medium-, and heavy-duty vehicle technologies
• retrofit medium- and heavy-duty on-road and nonroad vehicle fleets
• expand infrastructure connected with existing fleets, public transit, and transportation
corridors
• establish workforce training programs, conduct public education and promotion, and
create technology centers.
The Energy Commission issued solicitation RFP-600-10-612 to provide technical support to the
Energy Commission with evaluation, measurement, and verification of the ARFVTP. To be
eligible for funding under RFP-600-10-612, the projects must also be consistent with the Energy
Commission’s ARFVT Investment Plan, updated annually. In response to RFP-600-10-612, the
RAND Corporation submitted application 1, which was proposed for funding in the Energy
Commission’s Notice of Proposed Awards March 6, 2012, and the agreement was executed as
600-11-004 on August 21, 2012.
The research was conducted in the Science, Technology, and Policy Program of RAND’s Justice,
Infrastructure, and Environment unit. The findings should be of interest to the California State
Legislature, the CEC, and other state and federal agencies that are involved in efforts to
promote the development of new technologies and products.

v

vi
ABSTRACT
This report presents the results of a process and outcome evaluation of the California Energy
Commission’s (CEC’s) Alternative and Renewable Fuel and Vehicle Technology Program
(ARFVTP), relying on quantitative and qualitative methods. For the process evaluation, we
conclude the following: The process for developing the ARFVTP’s investment plan has been
reasonable; CEC has targeted major barriers to market viability across the main fuel-sector
types funded by the ARFVTP (hydrogen, electricity, diesel substitutes, gasoline substitutes, and
natural gas and biomethane); the ARFVTP has been successful in soliciting proposals; the
criteria and weights that the CEC used to evaluate award applications are appropriate, but there
are some concerns about the amount of time required to review applications and execute
agreements; there are both strengths and weaknesses in how CEC oversees grants once they
begin; completing projects on time has been a challenge for many awardees; and awardees are
largely achieving their projects’ most-central technical objectives. For the outcomes so far, we
conclude that the ARFVTP has made considerable progress reducing many barriers to the
market viability of alternative fuels and vehicles. We also find that the ARFVTP seems to have
allowed awardees to proceed with projects they would not have undertaken otherwise; after
completing their ARFVTP projects, awardees overwhelmingly indicated they had taken steps to
continue to develop, market, install, or produce the funded product or technology; and on the
workforce side, ARFVTP project grants supported some employment both in California and
elsewhere and did result in some hiring for the projects. Stakeholder suggestions on ARFVTP
investment priorities going forward vary by fuel type but generally call for continued program
support. We also note that insufficient consumer awareness of, and knowledge about,
alternative fuels and vehicles was one of the most frequently identified barriers to market
viability across all fuel types and that the ARFVTP should not shy away from research,
development, and demonstration projects simply because their outcomes can be difficult to
quantify.
Keywords: Alternative fuels and vehicles, program evaluation
Please use the following citation for this report:
Dixon, Lloyd, Tom LaTourette, David Galvan, Charles Goldman, Nidhi Kalra, Christopher Nelson,
Flavia Tsang, Paul Steinberg, James Lyons, Jerry Bowers, Bob Katin. 2017. Process and
Outcome Evaluation of the Alternative and Renewable Fuel and Vehicle Technology
Program. California Energy Commission. Publication Number: CEC-600-11-004. RAND
Corporation Publication Number: RR-1948-CEC.

vii
Acknowledgments ........................................................................................................................................ iii
PREFACE .......................................................................................................................................................... iv
ABSTRACT ...................................................................................................................................................... vi
EXECUTIVE SUMMARY .............................................................................................................................. xvii
S.1 Introduction ....................................................................................................................................... xvii
S.2 Key Conclusions ................................................................................................................................... xx
S.2.1 Conclusions from the Process Evaluation ............................................................................... xx
S.2.2 Conclusions from the Outcome Evaluation ......................................................................... xxv
S.3 Observations on ARFVTP Investment Priorities ...................................................................... xxviii
S.3.1 Observations for Hydrogen .................................................................................................... xxix
S.3.2 Observations for Electricity .................................................................................................... xxix
S.3.3 Observations for Diesel Substitutes ...................................................................................... xxx
S.3.4 Observations for Gasoline Substitutes ................................................................................. xxx
S.3.5 Observations for Natural Gas and Biomethane ................................................................... xxx
S.3.6 Observations on Workforce Development .......................................................................... xxxi
S.3.7 Observations on Consumer Awareness ............................................................................... xxxi
S.3.8 Observations on Research, Development, and Demonstration ...................................... xxxi
CHAPTER 1: Introduction ............................................................................................................................ 1
1.1 Background ............................................................................................................................................ 1
1.2 Objectives of Evaluation ..................................................................................................................... 3
1.2.1 Conceptual Framework for Evaluation ..................................................................................... 3
1.2.2 Evaluation Questions .................................................................................................................... 5
1.2.3 Evaluation Categories ................................................................................................................... 5
1.3 Evaluation Approach ............................................................................................................................ 6
1.3.1 Review Project Documentation to Arrive at an Independent Assessment of
the Extent to Which Project Technical Objectives Were Achieved ............................................... 6
1.3.2 Survey Awardees, Unsuccessful Applicants, and Potential Applicants ............................. 7
1.3.3 Conduct In-Depth Reviews of Selected ARFVTP Projects ..................................................... 8
1.3.4 Interview CEC Staff About Processes for Administering the Program .............................. 9
1.3.5 Verify Installation of EVSE for Selected Set of Awards ....................................................... 10
viii
1.3.6 Assemble and Analyze CEC Administrative Data on Program Processes and
Interview CEC Staff on Program Processes ...................................................................................... 10
1.3.7 Collect Additional Information to Inform the Outcome Evaluation ................................ 10
1.3.8 Evaluation Scope ......................................................................................................................... 11
1.4 Organization of This Document ...................................................................................................... 12
CHAPTER 2: The Process for Developing and Executing ARFVTP Investment Plans ............... 14
2.1 Purpose and Key Questions .............................................................................................................. 14
2.2 Overview of the Investment Planning Process ............................................................................. 15
2.3 Stakeholder Involvement in Investment Planning ....................................................................... 16
2.4 Adapting the Strategy Based on Experience ................................................................................. 21
2.5 Types of Funding Mechanisms ........................................................................................................ 22
2.6 Attracting Applicants ........................................................................................................................ 23
2.6.1 How People Learn About the Program .................................................................................... 24
2.6.2 Perceptions About Applicant Requirements ......................................................................... 25
2.6.3 PON Subscription Rates ............................................................................................................. 26
2.6.4 Repeat Applicants ....................................................................................................................... 27
2.7 Evaluating and Selecting Among Applications ............................................................................. 27
2.7.1 Evaluators ..................................................................................................................................... 28
2.7.2 Evaluation Process ...................................................................................................................... 28
2.7.3 Evaluation Criteria ...................................................................................................................... 29
2.7.4 Proposal Success Rate ................................................................................................................ 30
2.8 Match Funding ..................................................................................................................................... 30
2.9 Time to Review Applications and Execute Agreements ............................................................. 32
2.10 Overseeing Agreements .................................................................................................................. 35
2.10.1 Invoicing ..................................................................................................................................... 35
2.10.2 Project Managers ....................................................................................................................... 37
2.10.3 Progress Monitoring and Data Collection ............................................................................ 40
2.11 Conclusions ....................................................................................................................................... 41
CHAPTER 3: Impact of Program on Barriers to Market Viability of
Hydrogen-Fueled Vehicles ......................................................................................................................... 44

ix
3.1 Summary of Data Sources ................................................................................................................ 44
3.2 Technical Overview of Hydrogen as a Fuel and of FCEVs .......................................................... 45
3.2.1 Hydrogen as a Vehicle Fuel ....................................................................................................... 45
3.2.2 FCEV Technologies ...................................................................................................................... 45
3.3 Barriers to Use of Hydrogen as a Transportation Fuel ............................................................... 47
3.3.1 Feedstock Barriers ...................................................................................................................... 48
3.3.2 Production Barriers ..................................................................................................................... 49
3.3.3 Distribution Barriers ................................................................................................................... 50
3.3.4 Vehicle Barriers ........................................................................................................................... 51
3.3.5 Barriers Identified in the Survey .............................................................................................. 53
3.4 Review of CEC’s Solicitations and Awards in Hydrogen ............................................................ 54
3.4.1 Hydrogen Funding and Solicitations ....................................................................................... 54
3.4.2 Hydrogen Applications and Awards ....................................................................................... 56
3.4.3 Barriers Targeted ......................................................................................................................... 57
3.5 Awardee Performance ....................................................................................................................... 59
3.5.1 Project Status ............................................................................................................................... 59
3.5.2 Technical Performance .............................................................................................................. 60
3.5.3 Financial Performance ................................................................................................................ 63
3.5.4 Schedule Performance ................................................................................................................ 63
3.6 Impacts on Awardees ........................................................................................................................ 66
3.6.1 Impact on Undertaking Project ................................................................................................ 66
3.6.2 Impact on Knowledge and Capabilities .................................................................................. 68
3.6.3 Inventions or Products Developed During the Project and Market Prospects ............... 70
3.7 Impacts on Barriers ............................................................................................................................ 70
3.7.1 Impacts on Fueling Infrastructure Barriers ........................................................................... 72
3.7.2 Impacts on Feedstock and Fuel-Production Barriers ........................................................... 75
3.7.3 Impacts on Vehicle Barriers ...................................................................................................... 75
3.7.4 Impacts on Other Barriers ......................................................................................................... 76
3.8 State of the Industry .......................................................................................................................... 76

x
3.9 Views of Hydrogen Stakeholders on ARFVTP Investment Priorities ....................................... 79
3.10 Conclusions ....................................................................................................................................... 80
CHAPTER 4: Impact of Program on Barriers to Market Viability of
Plug-In Electric Vehicles ............................................................................................................................. 82
4.1 Summary of Data Sources ................................................................................................................ 82
4.2 Technical Overview of Electricity as a Fuel and of Electric and Hybrid Vehicles ................. 83
4.2.1 Electricity as a Transportation Fuel ........................................................................................ 83
4.2.2 Electric Vehicle Technologies ................................................................................................... 86
4.3 Barriers to Use of Electricity as a Transportation Fuel ............................................................... 88
4.4 Review of CEC’s Solicitations and Electricity Awards ................................................................. 92
4.4.1 Barriers Targeted by Electricity Projects ................................................................................ 93
4.5 Awardee Performance ....................................................................................................................... 96
4.5.1 Project Status ............................................................................................................................... 96
4.5.2 Technical Performance .............................................................................................................. 98
4.5.3 Financial Performance .............................................................................................................. 109
4.5.4 Schedule Performance .............................................................................................................. 110
4.6 Impacts on Awardees ...................................................................................................................... 111
4.6.1 Effect of Award on Ability to Undertake the Project ......................................................... 111
4.6.2 Impact on Organizational Capabilities ................................................................................. 113
4.6.3 Market Prospects for the Product or Technology Funded by the Award ...................... 114
4.7 Impacts on Barriers .......................................................................................................................... 115
4.7.1 Fueling Infrastructure Barriers Reduced by ARFVTP Projects ......................................... 115
4.7.2 Vehicle Barriers Reduced by ARFVTP Projects ................................................................... 118
4.7.3 Consumer Awareness Barriers Reduced by ARFVTP Projects ......................................... 121
4.8 State of the EV Industry .................................................................................................................. 121
4.9 Views of Electric Vehicle Stakeholders on ARFVTP Investment Priorities ........................... 124
4.10 Conclusions ..................................................................................................................................... 125
CHAPTER 5: Impact of Program on Barriers to Market Viability of Diesel Substitutes .......... 128
5.1 Summary of Data Sources .............................................................................................................. 128
5.2 Technical Overview of Diesel Substitutes as a Transportation Fuel ...................................... 129

xi
5.2.1 Biodiesel ...................................................................................................................................... 129
5.2.2 Renewable Diesel ....................................................................................................................... 130
5.2.3 Fischer-Tropsch Diesel ............................................................................................................. 130
5.3 Barriers to Using Diesel Substitutes as a Transportation Fuel ............................................... 130
5.3.1 Feedstock Barriers .................................................................................................................... 131
5.3.2 Fuel-Production Barriers .......................................................................................................... 131
5.3.3 Fueling Infrastructure Barriers ............................................................................................... 135
5.3.4 Vehicles Barriers ........................................................................................................................ 139
5.3.5 Consumer Barriers .................................................................................................................... 139
5.3.6 Barriers Identified in the Survey ............................................................................................ 139
5.4 Review of CEC’s Solicitations and Awards in Alternative Diesel Vehicles ........................... 140
5.4.1 Barriers Targeted by Diesel-Substitute Projects ................................................................. 144
5.5 Awardee Performance ..................................................................................................................... 145
5.5.1 Project Status ............................................................................................................................. 145
5.5.2 Technical Performance ............................................................................................................ 146
5.5.3 Financial Performance .............................................................................................................. 149
5.5.4 Schedule Performance .............................................................................................................. 149
5.6 Impacts on Awardee ........................................................................................................................ 151
5.6.1 Effect of Award on Ability to Undertake the Project ......................................................... 151
5.6.2 Impact on Knowledge and Capabilities ................................................................................ 152
5.6.3 Market Prospects for the Product or Technology Funded by the Award ...................... 153
5.7 Impacts on Barriers .......................................................................................................................... 154
5.7.1 Impact on Fuel-Production Capacity ..................................................................................... 155
5.7.2 Impact on Production Cost ..................................................................................................... 159
5.7.3 Impact on Ability to Generate and Process Low-Cost, Low-CI Feedstocks ................... 159
5.7.4 Impact on Bulk and Retail Fueling Infrastructure .............................................................. 160
5.8 State of the Industry ........................................................................................................................ 161
5.9 Views of Diesel-Substitutes Stakeholders on ARFVTP Investment Priorities ...................... 163
5.10 Conclusions ..................................................................................................................................... 164

xii
CHAPTER 6: Impact of Program on Barriers to Market Viability of Gasoline Substitutes ..... 167
6.1 Summary of Data Sources .............................................................................................................. 167
6.2 Technical Overview of Gasoline Substitutes as a Transportation Fuel ................................. 168
6.3 Barriers to the Use of Gasoline Substitutes as a Transportation Fuel .................................. 170
6.3.1 Feedstock Barriers .................................................................................................................... 170
6.3.2 Fuel-Production Barriers .......................................................................................................... 171
6.3.3 Fueling Infrastructure Barriers ............................................................................................... 172
6.3.4 Vehicle Barriers ......................................................................................................................... 172
6.3.5 Barriers Identified in the Survey ............................................................................................ 173
6.4 Review of CEC’s Solicitations and Awards in Gasoline Substitutes ....................................... 174
6.4.1 Barriers Targeted by Gasoline Substitutes Projects ........................................................... 177
6.5 Awardee Performance ..................................................................................................................... 180
6.5.1 Project Status ............................................................................................................................. 180
6.5.2 Technical Performance ............................................................................................................ 181
6.5.3 Financial Performance .............................................................................................................. 183
6.5.4 Schedule Performance .............................................................................................................. 184
6.6 Impacts on Awardee ........................................................................................................................ 186
6.7 Impacts on Barriers .......................................................................................................................... 190
6.7.1 Fueling Infrastructure Barriers Reduced by ARFVTP Projects ......................................... 191
6.7.2 Feedstock and Fuel-Production Barriers Reduced by ARFVTP Projects ........................ 193
6.7.3 Vehicle Barriers Reduced by ARFVTP Projects ................................................................... 195
6.8 State of the Industry ........................................................................................................................ 196
6.9 Views of Gasoline Substitutes Stakeholders on ARFVTP Investment Priorities .................. 198
6.10 Conclusions ..................................................................................................................................... 199
CHAPTER 7: Impact of Program on Barriers to Market Viability of
Natural Gas and Biomethane ................................................................................................................... 201
7.1 Summary of Data Sources .............................................................................................................. 201
7.2 Technical Overview of Natural Gas and Biomethane as Transportation Fuels ................... 202
7.2.1 Methane (Natural Gas and Biomethane) as a Transportation Fuel ................................. 202
7.2.2 Natural Gas ................................................................................................................................. 203

xiii
7.2.3 Biomethane ................................................................................................................................. 203
7.2.4 Natural Gas Vehicles ................................................................................................................ 204
7.3 Barriers to the Use of Natural Gas and Biomethane as a Transportation Fuel .................... 205
7.3.1 Feedstock and Fuel-Production Barriers .............................................................................. 205
7.3.2 Fueling Infrastructure Barriers ............................................................................................... 206
7.3.3 Vehicles Barriers ........................................................................................................................ 208
7.3.4 Barriers Identified in the Survey ............................................................................................ 209
7.4 Review of CEC’s Solicitations and Awards in Natural Gas and Biomethane ........................ 210
7.4.1 Barriers Targeted by Natural Gas and Biomethane Projects ............................................ 213
7.5 Awardee Performance ..................................................................................................................... 217
7.5.1 Project Status ............................................................................................................................. 217
7.5.2 Technical Performance ............................................................................................................ 218
7.5.3 Financial Performance .............................................................................................................. 220
7.5.4 Schedule Performance .............................................................................................................. 220
7.6 Impacts on Awardee ........................................................................................................................ 222
7.7 Impacts on Barriers .......................................................................................................................... 225
7.7.1 Feedstock and Fuel-Production Barriers Reduced by ARFVTP Projects ........................ 227
7.7.2 Fueling Infrastructure Barriers Reduced by ARFVTP Projects ......................................... 228
7.7.3 Vehicle Barriers Reduced by ARFVTP Projects ................................................................... 231
7.8 State of the Industry ........................................................................................................................ 233
7.9 Views of Natural Gas and Biomethane Stakeholders on ARFVTP Investment Priorities ... 236
7.10 Conclusions ..................................................................................................................................... 236
CHAPTER 8: Synthesis of Fuel-Type Findings ................................................................................... 239
8.1 Barriers Targeted .............................................................................................................................. 239
8.2 Awardee Performance ..................................................................................................................... 242
8.2.1 Project Status ............................................................................................................................. 242
8.2.2 Technical Performance ............................................................................................................ 243
8.2.3 Financial Performance .............................................................................................................. 246
8.2.4 Schedule Performance .............................................................................................................. 247

xiv
8.3 Impact of Awards on Awardee ...................................................................................................... 249
8.3.1 Effect of Award on Decision to Proceed with the Project ................................................. 250
8.3.2 Impact on Organizational Capabilities ................................................................................. 252
8.3.3 Market Prospects for the Product or Technology Funded by the Award ...................... 253
8.4 Impacts on Barriers .......................................................................................................................... 253
8.5 Views on ARFVTP Investment Priorities ...................................................................................... 256
8.5.1 State of the ARFVT Industry ................................................................................................... 256
8.5.2 View of Need for Continued Government Involvement .................................................... 257
8.5.3 Stakeholder Views on Investment Priorities ........................................................................ 258
8.6 Conclusions ....................................................................................................................................... 259
CHAPTER 9: Impact of Program on Employment and Workforce Capabilities ......................... 261
9.1 Rationales for Public Intervention in Workforce Development .............................................. 261
9.2 Potential Barriers to Workforce Development ............................................................................ 264
9.2.1 Limited Understanding of the Industry’s Education and Training Needs .................... 264
9.2.2 Limited Capacity to Train Workers ....................................................................................... 264
9.2.3 Limited Interest in New Careers ............................................................................................ 265
9.2.4 Limited Coordination Within Sectors to Plan Education and Training .......................... 265
9.3 ARFVTP Awards for Workforce Development ............................................................................ 265
9.3.1 Employment Development Department ............................................................................... 267
9.3.2 California Community College Chancellor’s Office ........................................................... 269
9.3.3 Employment Training Panel .................................................................................................... 272
9.4 Employment Effects of Project Awards ....................................................................................... 277
9.5 Awardee Perceptions of Labor Market ......................................................................................... 281
9.6 Measuring the Size of and Change in the ARFVT Workforce .................................................. 283
9.6.1 EDD’s Green Jobs and Green Transportation Jobs Reports ............................................. 283
9.6.2 Collaborative Economics’ Core ARFVT Employment
(RICO Regions and Industries) ......................................................................................................... 284
9.6.3 Discussion .................................................................................................................................. 287
9.7 Conclusions ....................................................................................................................................... 287

xv
CHAPTER 10: Overall Conclusions and Observations for Future
ARFVTP Investment Priorities ................................................................................................................ 290
10.1 Conclusions from the Process Evaluation ................................................................................. 290
10.1.1 Has the Process for Developing the ARFVTP Investment Plan Been Reasonable? .... 290
10.1.2 Has the Program Targeted Major Barriers? ....................................................................... 291
10.1.3 Has the ARFVTP Been Successful in Soliciting Proposals? ............................................. 292
10.1.4 Has the ARFVTP Been Successful in Evaluating Proposals and
Awarding Contracts in a Timely Manner? ...................................................................................... 292
10.1.5 Has the ARFVTP Done an Effective Job in Administering the Awards? ...................... 292
10.1.6 Have Awardees Secured the Proposed Matching Funds? ............................................... 293
10.1.7 Have Awardees Completed Their Projects on Time? ...................................................... 294
10.1.8 To What Extent Have Awardees Achieved the Main Technical
Objectives of Their Projects? ............................................................................................................ 294
10.2 Conclusions from the Outcome Evaluation .............................................................................. 295
10.2.1 What Has Been the Impact of the Awards on the Products and
Technologies Offered by the Awardee? .......................................................................................... 295
10.2.2 What Are the Market Prospects of the Products or Technologies
Funded by the Award? ....................................................................................................................... 295
10.2.3 To What Extent Have Funded Projects Reduced Barriers to the
Market Viability of Alternative Fuels and Vehicles? .................................................................... 296
10.2.4 What Has Been the Impact of the Program on Employment
and Workforce Capabilities? ............................................................................................................. 297
10.3 Observations on ARFVTP Investment Priorities ...................................................................... 297
10.3.1 Observations for Hydrogen .................................................................................................. 298
10.3.2 Observations for Electricity .................................................................................................. 298
10.3.3 Observations for Diesel Substitutes ................................................................................... 299
10.3.4 Observations for Gasoline Substitutes ............................................................................... 299
10.3.5 Observations for Natural Gas and Biomethane ................................................................ 299
10.3.6 Observations on Workforce Development ......................................................................... 300
10.3.7 Observations on Consumer Awareness ............................................................................. 300
10.3.8 Observations on Research, Development, and Demonstration .................................... 300
Acronyms ..................................................................................................................................................... 302

xvi
APPENDIX A: Web-Based Survey of Awardees, Unsuccessful Applicants,
and Potential Applicants .......................................................................................................................... 307
A.1 Questionnaire Design ...................................................................................................................... 307
A.1.1 Process Evaluation .................................................................................................................... 308
A.1.2 Outcome Evaluation ................................................................................................................. 310
A.1.3 Respondent Views .................................................................................................................... 311
A.2 Sample Selection .............................................................................................................................. 312
A.3 Survey Implementation ................................................................................................................... 314
A.3.1 Survey Development and Pretesting ..................................................................................... 314
A.3.2 Survey Fielding .......................................................................................................................... 314
A.4 Response Rates ................................................................................................................................. 315
Appendix B: Procedures for In-Depth Project Reviews and Protocol .......................................... 317
B.1 Procedures ......................................................................................................................................... 317
B.2 Protocol for Interviews with Awardee .......................................................................................... 317
References .................................................................................................................................................... 323
xvii
EXECUTIVE SUMMARY
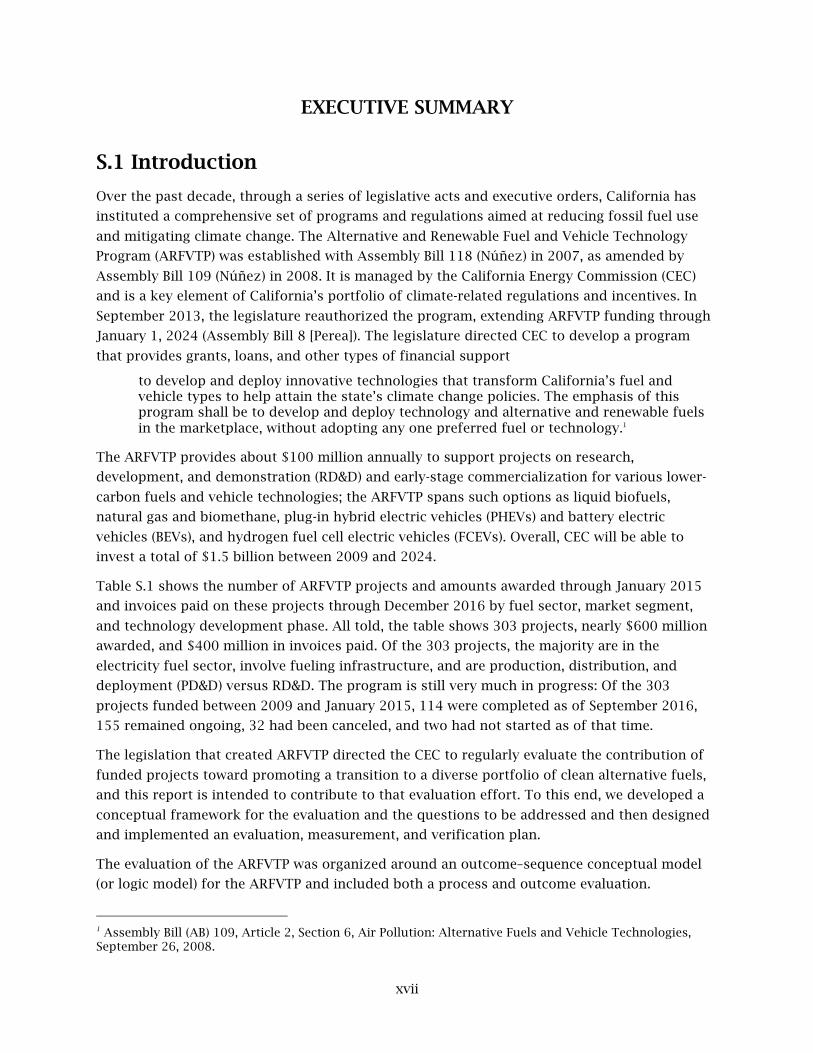
S.1 Introduction
Over the past decade, through a series of legislative acts and executive orders, California has
instituted a comprehensive set of programs and regulations aimed at reducing fossil fuel use
and mitigating climate change. The Alternative and Renewable Fuel and Vehicle Technology
Program (ARFVTP) was established with Assembly Bill 118 (Núñez) in 2007, as amended by
Assembly Bill 109 (Núñez) in 2008. It is managed by the California Energy Commission (CEC)
and is a key element of California’s portfolio of climate-related regulations and incentives. In
September 2013, the legislature reauthorized the program, extending ARFVTP funding through
January 1, 2024 (Assembly Bill 8 [Perea]). The legislature directed CEC to develop a program
that provides grants, loans, and other types of financial support
to develop and deploy innovative technologies that transform California’s fuel and vehicle types to help attain the state’s climate change policies. The emphasis of this program shall be to develop and deploy technology and alternative and renewable fuels in the marketplace, without adopting any one preferred fuel or technology.1
The ARFVTP provides about $100 million annually to support projects on research,
development, and demonstration (RD&D) and early-stage commercialization for various lower-
carbon fuels and vehicle technologies; the ARFVTP spans such options as liquid biofuels,
natural gas and biomethane, plug-in hybrid electric vehicles (PHEVs) and battery electric
vehicles (BEVs), and hydrogen fuel cell electric vehicles (FCEVs). Overall, CEC will be able to
invest a total of $1.5 billion between 2009 and 2024.
Table S.1 shows the number of ARFVTP projects and amounts awarded through January 2015
and invoices paid on these projects through December 2016 by fuel sector, market segment,
and technology development phase. All told, the table shows 303 projects, nearly $600 million
awarded, and $400 million in invoices paid. Of the 303 projects, the majority are in the
electricity fuel sector, involve fueling infrastructure, and are production, distribution, and
deployment (PD&D) versus RD&D. The program is still very much in progress: Of the 303
projects funded between 2009 and January 2015, 114 were completed as of September 2016,
155 remained ongoing, 32 had been canceled, and two had not started as of that time.
The legislation that created ARFVTP directed the CEC to regularly evaluate the contribution of
funded projects toward promoting a transition to a diverse portfolio of clean alternative fuels,
and this report is intended to contribute to that evaluation effort. To this end, we developed a
conceptual framework for the evaluation and the questions to be addressed and then designed
and implemented an evaluation, measurement, and verification plan.
The evaluation of the ARFVTP was organized around an outcome–sequence conceptual model
(or logic model) for the ARFVTP and included both a process and outcome evaluation.
1 Assembly Bill (AB) 109, Article 2, Section 6, Air Pollution: Alternative Fuels and Vehicle Technologies, September 26, 2008.

xviii
Table S.1 ARFVTP Awards, Amount Awarded, and Invoices Paid, by Fuel Sector, Market Segment, and Technology Development Stage
Number of
Awards Through January 2015
Amount Awarded
($ M)
Invoices Paid Though December
2016 ($ M)
Fuel or Project Type Hydrogen 35 $93 $65 Electricity 133 $179 $132 Diesel substitutes 24 $55 $38 Gasoline substitutes 21 $62 $23 Natural gas and biomethane 77 $160 $113 Workforce 3 $25 $20 Multifuel and other 10 $12 $9
Market Segment Fuel development or production 52 $160 $84 Fueling infrastructure 158 $174 $115 Vehicle development or production 56 $216 $176 Regional readiness 27 $7 $5 Workforce 3 $25 $20 Other 7 $4 $1
Technology Development Phase RD&D 70 $146 $88 PD&D 200 $405 $287 Regional readiness 27 $7 $5 Workforce 3 $25 $20 Other 3 $4 $0.9
Total 303a $586 $400
SOURCE: CEC data provided to the authors. NOTE: M = millions. a Excludes projects providing technical assistance to CEC, event sponsorships, and some low-cost memberships.
Within the context of the conceptual model, the following questions are addressed in the
process evaluation:
• Has the process for developing the ARFVTP investment plan been reasonable?
• Has the program targeted major barriers?
• Has the ARFVTP been successful in soliciting proposals?
• Has the ARFVTP been successful in evaluating proposals and awarding contracts in a
timely manner?
• Has the ARFVTP done an effective job administering the awards?
• Have awardees secured the proposed matching funds?
• Have awardees completed their projects on time?
• To what extent have awardees achieved the main technical objectives of their projects?

xix
Within the context of the conceptual model, the following questions are addressed in the
outcome evaluation:
• What has been the impact of the awards on the products and technologies offered by
the awardee? (A key aspect of this question is the extent to which the award allowed the
awardee to pursue projects that would not have been pursued without the award.)
• What are the market prospects for the products or technologies funded by the award?
• To what extent have funded projects reduced barriers to the market viability of
alternative fuels and vehicles? (By market viability, we mean the ability of the private
sector to produce and sell alternative fuels and vehicles without government subsidy.)2
• What has been the impact of the program on employment and workforce capabilities?
This evaluation focuses on the processes and outcomes of the program. It evaluates the
processes for developing the investment plan and whether the program is addressing key
barriers. However, it does not assess the total funding level for the program or the allocation of
resources across fuel types.
To answer the process and outcome evaluation questions, we used both quantitative and
qualitative methods:
• Review project documentation to arrive at an independent assessment of the extent to
which project technical objectives were achieved.
• Survey ARFVTP awardees, unsuccessful applicants, and potential applicants.
• Conduct in-depth reviews of selected ARFVTP projects.
• Verify installation of electric vehicles supply equipment (EVSE) for a selected set of
awards.
• Assemble and analyze CEC administrative data on program processes and interview
CEC staff on program processes.
• Collect additional information on trends in alternative fuel and vehicle technology
markets to inform the outcome evaluation.
A key data source across both evaluations is the web-based survey. The numbers of surveyed
organizations and respondents are shown in Table S.2. In addition, 38 in-depth project reviews
were completed, and 11 CEC staff were interviewed about CEC processes for developing the
investment plans, soliciting applications and making awards, and administering awards.
2 Market viability, as we define it, does not imply the repeal of regulatory programs, such as the zero-emission vehicle (ZEV), the Low Carbon Fuel Standard (LCFS), or Renewable Fuel Standard (RFS) programs.

xx
Table S.2 Survey Sample, Number Completed, and Response Rates
Categories Number Asked to Complete Survey
Surveys Completed
Response Rate (Percentage)
ARFVTP awardees 291a 240 82 Unsuccessful applicants 244 119 49 Potential applicants 204 116 57 Total 739 475 64
SOURCE: RAND survey. a Twelve of the 303 awarded projects were not included in the survey sample, leaving 291 projects sampled. These 12 dropped projects included those used to test the survey instrument and a few projects in litigation between CEC and the grantee.
S.2 Key Conclusions
In this section, we discuss our key conclusions relative to the process and outcome evaluation
questions above for the five fuel sectors and the workforce sector.
S.2.1 Conclusions from the Process Evaluation
S.2.1.1 Has the Process for Developing the ARFVTP Investment Plan Been Reasonable?
We find the process for developing the plan has been reasonable. Key challenges in the ARFVTP
investment planning process include keeping sufficiently abreast of technologies and market
trends in a wide variety of markets/sectors and managing the inevitable uncertainty that comes
from investing in approaches that have not yet reached market viability. To address these
challenges, CEC has heavily relied on engaging with industry and other stakeholders to
understand changing conditions in the economic and technological environments.3
Opportunities for input come in several forms, including a 25-member advisory board and
regular public workshops during which stakeholders and members of the general public can
learn about, and provide input into, investment plans either in person or remotely. Recently,
CEC has sought to deepen its stakeholder engagement by using “merit review” workshops that
drill down into specific investment areas (e.g., biofuels), glean lessons learned from past
projects, and hear from panels of experts who provide critical feedback on past investments
and insights into future trends.
Our analysis also suggests that stakeholders believe that CEC takes their input seriously;
specifically, based on data from our survey, more than 70 percent of those surveyed who
participated in ARFVTP workshops and public hearings somewhat or strongly agreed that CEC
seriously considers their input.
S.2.1.2 Has the Program Targeted Major Barriers?
CEC has targeted major barriers to market viability across the five main fuel types funded by the
program: hydrogen, electricity, diesel substitutes, gasoline substitutes, and natural gas and
biomethane. During the project, we identified major barriers to market viability in each of the
different market segments: feedstocks for fuel production, fuel production, fueling
3 Broadly defined, stakeholders are people who affect or can be affected by the ARFVTP.

xxi
infrastructure, vehicles, and consumers. We also identified barriers to the development of the
workforce needed to staff growing alternative and renewable fuel and vehicle technology
(ARFVT) industries. ARFVTP-funded projects have aimed to reduce many, but not all, of these
barriers.
Hydrogen projects focused on fueling infrastructure and, with few exceptions, have left barriers
related to vehicles and fuel production to other parties. Readiness grants addressed the
difficulty of obtaining permits for siting hydrogen-fueling stations.4 Both the readiness grants
and grants to the California Fuel Cell Partnership (CFCP) directly targeted limited consumer
awareness of hydrogen fuels and vehicles; other projects, by increasing the visibility of
hydrogen-fueling stations, indirectly targeted consumer awareness. The program also
supported the California Environmental Protection Agency’s Air Resources Board Clean Vehicle
Rebate Program (CVRP), which includes rebates for fuel cell electric vehicles (EVs) through a
series of interagency rebates.
The electricity projects targeted all the major barriers to market viability that existed when the
ARFVTP began. These include both fueling infrastructure and vehicle-related barriers. As with
hydrogen, a substantial number of regional readiness grants addressed the difficulty of
obtaining permits and included components to promote consumer awareness about EVs and
the charging infrastructure.
Feedstock, fuel production, and fueling infrastructure barriers were targeted for both the diesel
substitutes and gasoline substitutes fuel types. Vehicle barriers were less important for both fuel
types, and the ARFVTP has funded few vehicle projects for these two fuel types.
The natural gas and biomethane projects targeted the widest range of barriers, addressing
feedstock, fuel production, fueling infrastructure, vehicle, and consumer barriers.
The workforce development projects generally targeted barriers that a new industry faces in
developing its workforce, especially the barriers of limited understanding of industry needs and
lack of coordination among stakeholders.
S.2.1.3 Has the ARFVTP Been Successful in Soliciting Proposals?
The first step to attracting high-quality applicants is achieving broad-based awareness about a
program; in the case of the ARFVTP, there does appear to be a general awareness about the
program. A majority of potential applicants participating in this study were aware of the
program, and nearly all current and past grantees interviewed said that the program is well
known in their industries.
Most project opportunity notices (PONs) have attracted more requests for funds than the total
amount of funds available and appear to attract a healthy diversity of applicants, with only a
4 Regional readiness awards help a region prepare for the rollout of alternative fuels and vehicles. For example, the awards can help local government agencies develop strategic plans for siting EVSE, establish best practices for plug-in vehicle–ready building and public works guidelines, and help streamline plug-in electric vehicle (PEV) EVSE permitting, installation, and inspection processes.

xxii
third of applicants applying more than once. Competition for grants is intense, with only 26
percent of applications successful overall. The success rate is modest across all fuel types,
varying from 16 percent for hydrogen to 42 percent for natural gas and biomethane.
S.2.1.4 Has the ARFVTP Been Successful in Evaluating Proposals and Awarding Contracts in
a Timely Manner?
We found that survey respondents believe the criteria and weights used by CEC to evaluate
award applications are appropriate, but there were some concerns. A small number of
interviewees (both CEC staff and grantees) expressed concerns about whether the agency has
the skill and bandwidth to fully assess the financial and operational capacities of applicants.
A bigger concern was the amount of time required to review applications and execute
agreements. Indeed, the mean amount of time between application due date and notice of
whether the project was chosen for funding (known as the Notice of Proposed Award [NOPA]) is
four months. It takes even longer for CEC to enter into a contract with the awardee: The average
time elapsed between the NOPA and an approved contract is nearly eight and a half months. We
heard concerns from CEC and grantees alike that the time required to review and award grants
is too long given the speed at which market conditions change. CEC must take adequate time to
ensure that proposed projects represent worthy uses of public funds and to enter into
contracts that protect the public interest, but the long period between proposal submission and
project funding for many projects can limit awardees’ abilities to capitalize on technology and
market opportunities. However, there is evidence that these time lines have improved as CEC
gained more experience running the program.
S.2.1.5 Has the ARFVTP Done an Effective Job Administering the Awards?
We found that there were both strengths and weaknesses in how CEC oversees grants once the
grants begin. On the strengths side, the Commission Agreement Managers (CAMs)—the CEC
staff who directly oversee individual projects—were generally well regarded by awardees. On
the weaknesses side, a small number of awardees expressed concern about CAM turnover.
Some awardees cited the burdens associated with performance reporting but recognized the
need for public accountability and noted that the process had become easier as they became
more accustomed to ARFVTP’s format and requirements.
Awardees were more critical of financial-reporting requirements, which many regarded as
unreasonably detailed. Many found CEC’s process for approving changes in project scope or
budget allocation burdensome. More than 60 percent of awardees who answered a survey
question on the CEC process for approving project modifications either somewhat agreed or
strongly agreed that the process was burdensome, and more than one-quarter of those believed
that the delays had a substantial impact on administrative cost and project schedule.
CEC often withholds 10 percent of the invoiced amount until all award requirements have been
completed. Although this practice helps ensure that awardees provide the work products they
promised, just less than 30 percent of awardees responding to the survey said the practice
caused their organizations some or substantial financial difficulty.
xxiii
Despite these concerns, survey respondents and interviewees were generally positive about their
experiences with the program. Indeed, a clear majority indicated that they appreciated the
program and would apply again if the opportunity or need arose. However, firms involved with
developing and producing gasoline substitutes were much more ambivalent about the ARFVTP.
Our evaluation also revealed a need for better document-management practices and a more
systematic approach to data collection on the part of CEC. Project documents are difficult to
locate, often poorly labeled, and sometimes exist in multiple versions. Such chaotic document
management creates impediments for new CAMs inheriting existing projects and independent
program evaluators in understanding the history and status of projects. In addition, final
reports have no required structure or elements; as a result, it is often difficult to ascertain what
the project accomplishments were and how those might compare, or add to, those of other
similar projects.
S.2.1.6 Have Awardees Secured the Proposed Matching Funds?
Most, but not all, projects require matching funds (a portion of project funding that comes
from a source other than the ARFVTP), and some applicants propose match amounts that
exceed the minimum requirement. We found that awardees by and large secure the proposed
matching funds. Only 10 percent of completed projects did not achieve the required matching
funds. Failure to secure the required matching funds could either mean that the awardee did
not complete all the proposed work or that the project ended up costing less than expected.
S.2.1.7 Have Awardees Completed Their Projects on Time?
Completing projects on time has been a challenge for many awardees. Approximately 50 percent
of completed projects were completed on or ahead of schedule. Most of the remaining projects
were completed seven to 24 months behind schedule, while a small percentage of projects were
completed more than two years behind schedule. Delays are greater for ongoing projects, and,
if anything, one should expect delays for these projects to lengthen over time because some of
the projects have not been active long enough to fall far behind schedule. Delays also tend to be
greater for RD&D projects than for PD&D projects.
Delays are most severe for the hydrogen projects. Two of the three projects for which
information is available were completed more than two years behind schedule. However, there
is some indication that improvements are being made. Hydrogen awardees report that they
have been able to reduce the time needed to place a hydrogen-fueling station from 18–24
months to 12–18 months.
Delays in obtaining required permits, the need to change project location, and unexpected
problems with the technology were the most common reasons for delay.

xxiv
S.2.1.8 To What Extent Have Awardees Achieved the Main Technical Objectives of Their
Projects?
Awardees are by and large achieving the technical objectives most central to their projects. The
RAND team reviewed the project documents to identify the main technical objectives of each
funded project.5 We then independently evaluated the extent to which project technical
objectives were achieved. Survey respondents were allowed to update these assessments. There
was little difference between the RAND and the awardee assessments, except that awardees
were able to report the extent achieved in cases for which RAND had insufficient information to
make a determination. Using the RAND assessment as updated by survey respondent, we found
that only 12 percent of the 364 technical objectives for 106 completed projects (not including
workforce development projects and a few multifuel projects) had not been fully achieved, and
the percentage does not vary a great deal by fuel type. Eighty-one percent of the technical
objectives were fully achieved, and the remaining 7 percent either were in progress or the
extent achieved could not be determined. In some cases, a shortfall in one project (e.g., a
technical objective to install a specific number of EV charging stations) was offset by surfeits in
other projects with a similar technical objective.
As expected, most of the main technical objectives for the ongoing projects remain in progress,
but awardees are confident that a high percentage of their technical objectives will be fully
achieved. We also found that the success in achieving technical objectives was similar for RD&D
projects and for PD&D ones.
For the EV charging station projects, we visited and verified the operability of 326 (about 4
percent) of the more than 8,000 stations funded by the program (more than 6,700 of which
have already been installed). The stations tested were spread across 94 different sites. We
found that more than 95 percent of these stations were operating properly. We also highlighted
a number of installation and operation issues that may help guide future awardees in getting
the most benefit from ARFVTP funding.
The technical objectives for three large ARFVTP-funded workforce development projects were
in many cases achieved; however, there are important cases in which objectives were not
achieved, and lack of data limited our ability to evaluate some efforts. One workforce
development project largely completed its technical objectives. In a second case, only about half
of the anticipated number of workers were trained. In the third, almost no records of any kind
were available, so we could not evaluate whether the technical objectives of the award were
accomplished.
5 Technical objectives are distinguished in CEC awards from administrative objectives. Technical objectives include objectives such as installing a proposed number of fueling or charging stations, building a specified amount of production capacity, or achieving a target throughput from a bulk distribution terminal.

xxv
S.2.2 Conclusions from the Outcome Evaluation
S.2.2.1 What Has Been the Impact of the Awards on the Products and Technologies Offered
by the Awardee?
Critical to the assessment of the ARFVTP’s impact is the extent to which awards have allowed
awardees to pursue projects that would not have been otherwise pursued. One way to
determine this is to see what those who applied for awards but were turned down—
unsuccessful applicants—have done. The advantage of this indicator is that it is based on actual
behavior. The disadvantage is that the projects proposed by the unsuccessful applicants may
have been more poorly conceived or planned than those funded by the ARFVTP. Based on
survey responses, slightly more than one-half of unsuccessful applicants participating in this
evaluation had not yet proceeded with the project after their applications were denied. A
second approach is to ask awardees what they would have done had they not received the
award. Estimates of the percentage of awardees that would not have proceeded without the
award are imprecise, but they are consistent with those for the unsuccessful applications.
Findings were similar for RD&D and PD&D projects, and there was no strong evidence of
differences across fuel types.
These findings tentatively suggest that roughly one-half of the projects funded by the ARFVTP
would not have proceeded otherwise. However, the ability to proceed absent ARFVTP funding
rests on the availability of other government and private funding sources. If one funding source
disappears, other funding sources may be able to fill in the gap. However, if the ARFVTP ends
and other funding sources follow suit, then the project may not be able to proceed.
S.2.2.2 What Are the Market Prospects of the Products or Technologies Funded by the
Award?
After completing their ARFVTP projects, awardees overwhelmingly indicated they had taken
steps to continue to develop, market, install, or produce the product or technology funded by the
award. Substantial percentages reported that they had worked on ways to reduce cost and to
improve product performance and had attempted to identify potential customers for the
product. These findings suggest that awardees believe that the products of their ARFVTP-
funded projects have market potential. The growing number of competitors that awardees are
facing in their industries (discussed in Section S.3) provides additional evidence of market
potential. These findings keep open the possibility that the project outputs will have ongoing
impact on barriers to market viability.
S.2.2.3 To What Extent Have Funded Projects Reduced Barriers to the Market Viability of
Alternative Fuels and Vehicles?
The ARFVTP has made considerable progress reducing many barriers to the market viability of
alternative fuels and vehicles. This is shown in Table S.3, which captures our assessment of the
impact of the program on barriers for each of the fuel types; our assessment of impact falls
into the following four categories:

xxvi
• Yes: There is solid evidence the projects funded by the program helped reduce this
barrier. The extent to which the barrier has been reduced is not differentiated. Major
reductions and reductions that are arguably minor are both marked “Yes.”
• Probable: It is likely the project funded by the program helped reduce this barrier, but
there is little empirical evidence to support the case.
• Could not be determined: Because there was either insufficient data on project
outcomes or the project team was unable to assess and interpret those outcomes, it
could not be determined whether the projects reduced this barrier.
• No: There is no indication the projects funded by the program helped reduce the barrier.
The gray shading in the table identifies barriers that were not major when the ARFVTP began,
and “not targeted” identifies major barriers that were not targeted by the ARFVTP. Those
marked “yes” and those marked “probable” are bolded to make it easier to see them in the
table.
Table S.3. Barriers Reduced by the ARFVTP
Market Segment Barrier Hydrogen Electricity
Diesel Substitutes
Gasoline Substitutes
Natural Gas and
Biomethane
Feedstock and fuel production
Limited ability to procure and use alternative feedstocksa
No Yes Yes
Limited fuel-production capacity Yes Not targeted Yes
High fuel-production cost Not targeted Could not be determined Not targeted Not targeted
Fueling infrastructure
Insufficient bulk fueling infrastructure No Yes
Insufficient retail fueling infrastructure Yes Yes Not targeted Yes Yes
Difficulty in obtaining permits for fueling/charging infrastructure
Yes Yes Not targeted Not targeted
Lack of fueling/charging standards Yes
Vehicles
Limited vehicle production capacity Not targeted Yes
High vehicle production cost or vehicle price
Could not be determined
Could not be determined Yes
Inadequate vehicle performance Could not be
determined Could not be determined
Could not be determined
Limited vehicle models Yes Yes No
Consumer Insufficient consumer awareness Probable Probable Not targeted Probable Probable
SOURCE: Author analysis. NOTE: Shading signifies that this was not a major barrier for this fuel type when the ARFVTP program began. a Alternative feedstocks vary by fuel type and include sorghum, woody biomass, and cellulosic feedstocks such as woody biomass and corn stover (ethanol); mixed organic waste and animal rendering waste (biomethane); algal oil, dairy waste, municipal solid waste, and fats, oil, and grease (FOG) from municipal wastewater (diesel substitutes).

xxvii
For hydrogen, 48 out of the 60 hydrogen-refueling stations in California have been built with
ARFVTP funding, and 48 more ARFVTP-funded stations are under development. Although few
projects specifically targeted reducing permitting barriers, others may have reduced them
through the experience of building stations. The program also had significant impact on the
lack of standards for fueling infrastructure. Consumer rebates through the CVRP for the
purchase of FCEVs may have reduced the price of such vehicles, but few vehicles were
purchased during the period covered by this evaluation, and the magnitude of any such decline
is difficult to determine. A few new hydrogen vehicle models were demonstrated with ARFVTP
funding, so, as noted in Table S.3, the program helped reduce this barrier; but the impact is
probably minor. Hydrogen readiness projects and funding for the CVRP, as well as the retail
fueling stations funded by the ARFVTP, probably contributed to improving consumer
awareness, but there is no clear quantifiable evidence that a reduction has occurred.
For electricity, the large number of EV charging stations funded by the program is clear
evidence that the program has reduced fuel infrastructure barriers, and the EV readiness grants
have helped reduced the difficulty of obtaining permits. About 35 percent of the publicly
available charging stations in the state appear to have been partly financed by the program.
Vehicle barriers have been reduced by awards to build or expand EV production lines and to
develop and demonstrate different types of electrically powered vehicles. It is likely that
projects to expand production lines and to design and demonstrate advanced EV components
will contribute to reducing vehicle cost, but little data by which to confirm such effects are
available. The program may have also helped reduce vehicle prices by funding the CVRP.
However, the extent of this reduction is hard to determine, because absent the CVRP,
automakers may have had to reduce prices by a similar amount to sell the number of vehicles
required by the zero-emission vehicle (ZEV) program. Projects have been funded to improve
battery performance, but the study team was not able to determine whether these efforts have
paid off in terms of improved vehicle performance.
As with the hydrogen projects, EV readiness grants and the increased visibility of charging
stations probably contributed to improving consumer awareness, but there is no clear,
quantifiable evidence that a reduction has occurred.
Turning to diesel substitutes, the ARFVTP has made demonstrable progress in reducing barriers
related to production capacity and bulk fueling infrastructure. Fifty-four million of the 184-
million-gallon-per-year (mgy) biodiesel production capacity in California has been partly
financed by the ARFVTP, as has 17.5 million of the 63-mgy renewable diesel capacity. The
modest number of bulk fueling infrastructure projects funded by the program has helped
reduce barriers in this area to some extent. RD&D projects have sought to demonstrate the
feasibility of generating low-cost, low–carbon intensity (CI) feedstocks (algal oil) or producing
alternative diesel from different types of feedstocks (e.g., dairy waste and FOG in municipal
wastewater); however, there is no indication that the projects have taken significant steps
toward commercial viability. Projects to expand production capacity and install the latest
technology may well have helped reduce the production costs of alternative diesel, but we were
not able to collect any systematic data on production costs.

xxviii
For gasoline substitutes, demonstrable progress has been made in expanding the number of E85
(a blend of 85 percent ethanol and 15 percent gasoline) fueling stations. The number of stations
in California increased from 29 to 96 between 2009 and 2016, 40 of which were funded by the
ARFVTP. The program has also expanded the production capacity available in California to
produce ethanol from sorghum. Progress in reducing the other barriers targeted is less clear. A
demonstration project appears to have improved the ability to process cellulosic feedstocks,
but the progress was incremental, and it is unclear whether it will become commercial. While
there is some evidence that California ethanol producers have replaced at least some of their
corn feedstock with sorghum, we have been unable to determine how much. It does not appear
that the projects have made progress in reducing the production costs of advanced ethanol,
and it could not be determined whether a project to optimize a medium-duty truck engine to
run on E85 made progress in improving vehicle performance.
In the case of natural gas and biomethane, ARFVTP-funded projects have approximately
doubled the biomethane production capacity in California. Similarly, 42 percent of new liquid
natural gas (LNG) stations and 22 percent of new compressed natural gas (CNG) stations in
California added since 2008 were funded by ARFVTP projects. The program also provided
substantial funding for subsidies to purchase natural gas vehicles (NGVs), which address the
vehicle price barrier.
There was also progress in introducing and/or more efficiently using feedstocks for
biomethane production and increased public awareness, although the magnitude of these
contributions is unclear. Some vehicle technology development projects helped develop and
demonstrate new methane-powered engines, although again the impact is unclear. Finally, there
is no evidence the program reduced vehicle production cost, except perhaps indirectly through
larger sales that can increase production volumes and result in economies of scale.
S.2.2.4 What Has Been the Impact of the Program on Employment and Workforce
Capabilities?
CEC’s ARFVTP project grants did support some employment both in California and elsewhere
and did result in some hiring for the projects. Many of the hired workers were retained after
grant expirations; however, the magnitude of employment and hiring appeared to be modest.
It is likely that the ARFVTP-funded projects have addressed some of the ARFVT industry’s
needs. However, without more evaluative information, we cannot determine the extent. We do
note that most awardees did not report that skilled labor presented a barrier, and most said
that it is getting easier over time to find skilled labor for their projects.
S.3 Observations on ARFVTP Investment Priorities
Our findings of health and vibrancy of the ARFVT industry are mixed. On the one hand, there
appears to be a substantial and growing number of firms competing in the various fuel sectors.
On the other hand, private-investor interest does not appear strong. Relatively few of the
awardees, unsuccessful applicants, and potential applicants responding to our survey believed
that there are currently many private-sector investors interested in their industries or that there

xxix
is any upward momentum. Investor interest in the diesel-substitutes and gasoline-substitutes
industries appears particularly weak.
Tepid private-investor interest in ARFVT industry suggests an ongoing need for government
involvement, and a substantial majority of ARFVTP awardees, unsuccessful applicants, and
potential applicants in our survey believe that some type of government involvement continues
to be necessary for the market viability of alternative fuels and vehicles. For example, more
than 80 percent believed that grants for demonstration and deployment continue to be
necessary for the market viability of the alternative fuels and vehicles with which their
organizations are involved.
We conclude by providing suggestions by those we surveyed or interviewed during the project
for funding priorities moving forward and observations from the study team on factors to
consider in making investment decisions. Suggestions for changes in the overall funding level
for the ARFVTP or the allocation of resources across fuel types are beyond the scope of this
study.
S.3.1 Observations for Hydrogen
There is no evidence now to suggest that CEC should prioritize the reduction of vehicle-related
and fuel-production barriers over the continued expansion of retail fueling stations. Indeed,
hydrogen stakeholders saw little need to change the current emphasis on retail infrastructure.
The amount of hydrogen dispensed through hydrogen-fueling stations remains low, so it is too
soon to assess the returns on these investments. The expectation is that as more FCEVs are
adopted, hydrogen sales will increase, but to date, very little gasoline has been displaced. It will
be useful in the future to empirically reevaluate whether the number and location of stations is
appropriate, given how the adoption of FCEVs progresses and how the locations have shaped
adoption.
S.3.2 Observations for Electricity
The most common advice of EV stakeholders on allocating funds for electricity projects was
that charging-station deployment should be continued or increased and that more should be
spent on RD&D.
What locations and types of charging stations to focus on moving forward warrants careful
consideration. When the ARFVTP began, it made sense to fund the deployment of charging
stations in all types of locations, including residential, workplace, and publicly accessible sites,
and to fund all types of stations, including Level 1, Level 2, and DC fast charging (DCFC)
stations. After nearly eight years and the continued widespread deployment of this broad
variety of charging stations, it may make sense to reevaluate the deployment strategy by
concentrating funding on those station types and circumstances best suited for demonstrated
use patterns and by considering the evolution of plug-in electric vehicle (PEV) model
capabilities. For example, studies have indicated that the majority of PEV charging is done at
home or at the workplace; thus, it may make sense to concentrate more funding on workplace
charging stations and less funding on Level 2 stations in those public places with less vehicle
dwell time.

xxx
S.3.3 Observations for Diesel Substitutes
The ARFVTP has played a key role in expanding biodiesel production capacity in the state.
However, that capacity is currently being underutilized, which raises the troubling possibility
that California will not fully benefit from its investment in biodiesel production capacity.
Importing biodiesel and renewable diesel from outside the state may be the most efficient way
to lower carbon emissions and comply with the LCFS. However, if in-state production and
employment are top political goals, the ARFVTP should consider providing production
incentives for in-state facilities rather than continuing to invest in biodiesel production
capacity. The existence of such a subsidy could allow in-state producers to obtain the financing
to construct production capacity on their own. It would also relieve CEC of the responsibility of
picking which firms should receive state funding to build production capacity—the firms that
succeed in producing the fuel would receive the subsidy, while those that do not produce the
fuel would not.
Along with in-state production incentives, increased funding for bulk fueling distribution
infrastructure was a priority identified by a number of diesel-substitutes stakeholders.
S.3.4 Observations for Gasoline Substitutes
The main message delivered by gasoline-substitutes ARFVTP awardees, unsuccessful applicants,
and potential applicants was that the ARFVTP should focus more on RD&D and leave
production to the private sector. Indeed, production of cellulosic ethanol, a key element in the
strategy to pursue advanced ethanol, remains a technical challenge. This suggestion comes
despite the fact that RD&D projects already make up 59 percent of the gasoline-substitutes
project portfolio, which is substantially higher than the 27 percent for the program as a whole.
Achieving an appreciable reduction in carbon intensity (CI) using ethanol requires both low-CI
feedstocks and a greatly expanded E85 vehicle and fueling infrastructure. The ARFVTP has
invested in both. However, given the ongoing challenges with low-CI ethanol production
technology, it makes sense to suspend building out the E85 infrastructure and concentrate on
low-CI ethanol production. If that investment comes to fruition, investment can return to
expanding the E85 infrastructure. The ARFVTP adopted this approach in 2013, and there is no
evidence to suggest that CEC should change course at this time.
S.3.5 Observations for Natural Gas and Biomethane
There are no widely held views among the natural gas and biomethane stakeholders, but a
number suggested that the program focus its attention on promoting biomethane as opposed
to natural gas more generally. Presumably, this means focusing on biomethane production and
distribution. Somewhat inconsistent with this, others supported spending more on NGVs, which
would promote natural gas and biomethane use.
The Renewable Fuel Standard (RFS) and the LCFS, along with state and local regulations, are
increasing incentives to produce biomethane for transportation. However, in-state production
remains small and is impeded by high costs relative to the current low prices for natural gas
and barriers to pipeline injection that deter many potential producers from entering the market
for lack of access to customers. It appears that all the biomethane that is used to comply with

xxxi
the LCFS is produced and used in other states. Continued grant funding for research to help
drive costs down appears warranted, and the ARFVTP should consider tackling head-on barriers
to injecting the biomethane produced in the state into California’s natural gas pipelines.
S.3.6 Observations on Workforce Development
As noted, most awardees surveyed during the evaluation did not report that the lack of skilled
labor was a barrier, and most said that it was getting easier over time to find skilled labor for
their projects. As a result, the need for the ARFVTP to continue to invest directly in workforce
development may be diminishing. We do suggest that CEC continue to work with California’s
Employment Training Panel (ETP) to identify whether industry appears to demand additional
increments of funding for this program, and, if so, to continue to provide some funding for this
program. We offer the following suggestions to help CEC target workforce development in this
industry:
• Require records to be kept for future evaluations. The evaluation of past projects is hampered by a lack of records. CEC should require that records of spending, activities, and outcomes be retained for a considerable period (such as ten years) following the completion of each award activity to support future evaluations.
• Consider funding data infrastructure to measure the ARFVT workforce. Better data can enable many participants in the industry to align their workforce development activities and measure progress.
• Connect workforce development projects to a clear objective. Some of the efforts
funded to date have not demonstrated alignment to a clear objective in workforce
development. We suggest that any future workforce development activities have a clear
objective, by linking either to specific employers or to other clearly defined workforce
development goals.
S.3.7 Observations on Consumer Awareness
Insufficient consumer awareness of, and knowledge about, alternative fuels and vehicles was
one of the most frequently identified barriers to market viability across all fuel types. This
finding does not necessarily mean that insufficient consumer awareness is one of the most
important barriers, but it is clearly of general concern to the firms that make up the industry. In
some cases, the ARFVTP has funded projects that directly attempt to improve consumer
awareness and knowledge. However, a case can be made that the most effective way to increase
consumer awareness and confidence is to demonstrate different types of vehicles and expand
the fueling infrastructure. But the fact remains that the lack of consumer awareness and
understanding is a significant concern, and the ARFVTP should consider how to address it.
S.3.8 Observations on Research, Development, and Demonstration
There has been a considerable decline in the proportion of program resources spent on RD&D
in recent years. There may be good justifications for this decline, but the program should not
shy away from RD&D projects simply because their outcomes can be difficult to quantify.
Indeed, in this evaluation, we have often been unable to determine the effects of RD&D projects
on barriers. It would be a mistake for the program to only fund projects with more easily

xxxii
measured outcomes, such as the number of charging stations placed or the amount of
production capacity installed. RD&D projects may create the processes or develop the
knowledge that helps reduce production costs or broaden the range of feedstocks that can be
used in the future. For example, despite the ARFVTP supporting many E85 and CNG/LNG
fueling stations, these stations are still dispensing primarily corn grain ethanol and natural gas,
respectively. The investment in fueling stations will be largely unrealized until advanced and
cellulosic ethanol and biomethane production increase substantially, both of which require
more RD&D.

1
CHAPTER 1: Introduction
1.1 Background
Over the past decade, through a series of legislative acts and executive orders, California has
instituted a comprehensive set of programs and regulations aimed at reducing fossil fuel use
and mitigating climate change. The Alternative and Renewable Fuel and Vehicle Technology
Program (ARFVTP) was established with Assembly Bill (AB) 118 (Núñez) in 2007, as amended by
AB 109 (Núñez) in 2008. It is managed by the California Energy Commission (CEC) and is a key
element of California’s portfolio of climate-related regulations and incentives. In September
2013, the legislature reauthorized the program, extending ARFVTP funding through January 1,
2024 (AB 8 [Perea]). The legislature directed CEC to develop a program that provides grants,
loans, and other types of financial support
to develop and deploy innovative technologies that transform California’s fuel and vehicle types to help attain the state’s climate change policies. The emphasis of this program shall be to develop and deploy technology and alternative and renewable fuels in the marketplace, without adopting any one preferred fuel or technology.6
In standing up the ARFVTP, CEC specified the following program goals:
• Reduce California’s use of petroleum transportation fuels.
• Increase the use of alternative and renewable fuel and vehicle technologies (ARFVTs).
• Produce alternative and renewable fuels in California.
• Expand alternative fueling infrastructure.
• Improve the performance and market viability of alternative vehicle technologies.
• Build workforce for the ARFVT industries.
• Communicate the benefits of ARFVTs to the public.7
To accomplish these goals, ARFVTP provides approximately $100 million each year to support
projects aimed at research, development, demonstration (RD&D) and early-stage
commercialization for various lower-carbon fuel and vehicle technologies; the ARFVTP spans
such options as liquid biofuels, natural gas and biomethane, plug-in hybrid electric vehicles
(PHEVs) and battery electric vehicles (BEVs), and hydrogen fuel cell electric vehicles (FCEVs).
Overall, CEC will be able to invest a total of $1.5 billion between 2009 and 2024.
6AB 109, Article 2, Section 6, Air Pollution: Alternative Fuels and Vehicle Technologies, September 26, 2008. 7 CEC, 2010–2011 Investment Plan for the Alternative and Renewable Fuel and Vehicle Technology Program, CEC-600-2010-001-SD-REV2, April 2010, pp. 3–4.

2
The legislation that created ARFVTP directed the CEC to regularly evaluate the contribution of
funded projects toward promoting a transition to a diverse portfolio of clean, alternative fuels,8
and this report is intended to contribute to that effort.
The first awards were made in 2009, and Table 1.1 shows the number of awards and total
amount awarded between 2009 and January 31, 2015—the cutoff date for the projects included
in this evaluation.9 All told, more than a half a billion dollars had been awarded through
January 2015 for 303 projects.10 Funding is spread across the fuel-type categories and market
segments. Roughly one-quarter of funds has been spent on RD&D of alternative fuels and
vehicles ($146 million of $586 million) as opposed to production, distribution, and deployment
(PD&D) and other projects that cannot be classified in either category.
Table 1.1. ARFVTP Awards, Amount Awarded, and Invoices Paid for Projects Funded Through January 2015, by Fuel Type
Number of Projects Amount Awarded
($ M)
Invoices Paid Though Dec 2016
($ M) Fuel or Project Type
Hydrogen 35 $93 $65 Electricity 133 $179 $132 Diesel substitutes 24 $55 $38 Gasoline substitutes 21 $62 $23 Natural gas and biomethane 77 $160 $113 Workforce 3 $25 $20 Multifuel and other 10 $12 $9
Market Segment Fuel development or production 52 $160 $84 Fueling infrastructure 158 $174 $115 Vehicle development or production 56 $216 $176 Regional readiness 27 $7 $5 Workforce 3 $25 $20 Other 7 $4 $1
Technology Development Phase RD&D 70 $146 $88 PD&D 200 $405 $287 Regional readiness 27 $7 $5 Workforce 3 $25 $20 Other 3 $4 $0.9 Total 303 $586 $400 SOURCE: CEC data provided to authors. NOTE: Excludes projects providing technical assistance to CEC, event sponsorships, and some low-cost memberships. M = millions.
8 AB 109, Article 2, Section 7, 2008. 9 ARFVTP awards totaled $635 million through December 16, 2016 (CEC, 2017–2018 Investment Plan for the Alternative and Renewable Fuel and Vehicle Technology Program, CEC-600-2016-007-SD, October 2016, Table 3). 10 The 303 total excludes technical assistance projects, event sponsorship, and low-cost memberships—19 projects that amount to $18.6 million. The technical assistance projects are outside the scope of this evaluation. In addition to projects addressing multiple fuel types, the projects in the “multifuel” and “other” categories include two propane awards. CEC discontinued investing in propane vehicles and fuels early in the program.

3
The program is still very much ongoing, as shown in Table 1.2, which shows the status of these
projects as of September 2016. Of the 303 projects funded between 2009 and January 2015,
114 have been completed, and 155 are still ongoing. Records show that, through December
2016, CEC had paid out $400 million toward these projects.11
Table 1.2. Status of ARFVTP-Funded Projects Funded Through January 2015, as of September 2016
Project Status in September 2016 Number of Projects
Amount Awarded ($ M)
Invoices Paid Though Dec 2016
($ M) Completed 114 $192 $184 Ongoing 155 $313 $211 Canceled or terminated 32 $70 $6 Not yet started 2 $12 $0 Total 303 $586 $400
SOURCE: CEC data provided to authors.
1.2 Objectives of Evaluation
The project team developed a conceptual framework to evaluate the program and came up with
questions to be addressed in the evaluation. We then designed and implemented an evaluation,
measurement, and verification plan.
1.2.1 Conceptual Framework for Evaluation
The evaluation of the ARFVTP plan was organized around an outcome–sequence model (or logic
model) for ARFVTP. Figure 1.1 shows the outcome–sequence model that underlies the
evaluation effort. As shown in Figure 1.1, the model consists of seven steps.12 The evaluation
here consists of both a process and outcome evaluation.
The first three steps in the figure describe the activities and outputs of the program and, as
shown in the blue box, correspond to the components addressed in the process evaluation.
Based on input from stakeholders and internal reviews, CEC staff first develop investment
plans for the program (step 1). These investment plans are released annually and detail the
amount of funds that will be allocated to various fuel and vehicle technologies. CEC then issues
project opportunity notices (PONs) that solicit grant applications for projects in areas
consistent with the investment plan (step 2). Applications are evaluated by CEC staff, and
awards are made by CEC. The awardees then implement the funded projects consistent with the
scope of work agreed to by CEC and the awardees (step 3). CEC oversees and administers the
award during implementation.
11 The $400 million total includes $13.3 million in retentions. When the awardee successfully completes the project, the retention will be paid to the awardee. 12 For background on outcome-sequence models and examples in other settings, see Harry P. Hatry, Performance Measurement: Getting Results, 2nd ed., Washington, D.C.: The Urban Institute Press, 2006.

4
Figure 1.1. Outcome-Sequence Model for CEC’s ARFVTP
SOURCE: Authors.
The bottom half of Figure 1.1 shows the intermediate and end outcomes that are the goals of
the ARFVTP and that correspond with the components addressed in the outcome evaluation. It
is hoped that the projects funded by CEC will help reduce the barriers to market viability of
alternative fuels and vehicles (step 4). By market viability, we mean the ability of the private
sector to produce and sell alternative fuels and vehicles without government subsidy.13
Reductions in barriers are then expected to lead to increased market penetration of alternative
fuels and vehicles (step 6) and reductions in greenhouse gas (GHG) and criteria pollutant
emissions and petroleum use (step 7). The process is enabled and facilitated by changes in the
structure and production capabilities of the various industries involved in developing and
deploying alternative fuels and vehicles (step 5).
Some CEC awards seek to improve the environmental performance of a particular fuel or
vehicle technology. For example, a funded project might seek to reduce the carbon intensity (CI)
of a fuel resulting from a biodiesel production process. Such an outcome is included in step 4
and can have an impact on the reduction in GHG emissions and possibly the emissions of
criteria pollutants.
The ARFVTP is one of a substantial number of factors that can influence the development and
deployment of alternative and renewable fuels and vehicles. The narrow box at the bottom of
Figure 1.1 acknowledges some of the other factors that can influence the activities, outputs,
and outcomes of the program. These factors include other public investment, regulations, and
13 Market viability, as defined here, does not imply the repeal of regulatory programs, such as the zero-emission vehicle (ZEV), the low-carbon fuel standard (LCFS), or renewable fuel standard (RFS) programs.
5
incentive programs. These factors influence the entire program, from the choices of investment
areas to what types of intermediate and end outcomes can be attributed to the program.
1.2.2 Evaluation Questions
Within the context of the conceptual model, the following questions are addressed in the
process evaluation:
• Has the process for developing the ARFVTP investment plan been reasonable?
• Has the program targeted major barriers?
• Has the ARFVTP been successful in soliciting proposals?
• Has the ARFVTP been successful in evaluating proposals and awarding contracts in a
timely manner?
• Has the ARFVTP done an effective job in administering the awards?
• Have awardees secured the proposed matching funds?
• Have awardees completed their projects on time?
• To what extent have awardees achieved the technical objectives of their projects?
Within the context of the conceptual model, the following questions are addressed in the
outcome evaluation:
• What has been the impact of the awards on the products and technologies offered by
the awardee? (A key aspect of this question is how much the award allowed the awardee
to pursue projects that would not have been pursued absent the award.)
• What are the market prospects of the products or technologies funded by the award?
• To what extent have funded projects reduced barriers to the market viability of
alternative fuels and vehicles?
• What has been the impact of the program on employment and workforce capabilities?
This evaluation focuses on the processes and outcomes of the program. It evaluates the
processes for developing the investment plan and whether the program is addressing key
barriers. However, it does not assess the allocation of resources across fuel types and makes
only limited observations on allocation of resources within fuel type.
1.2.3 Evaluation Categories
The barriers that exist to the market viability of alternative fuels and vehicles vary considerably
by fuel type, as do the type and magnitude of awards. We break down the evaluation into the
fuel categories shown in Table 1.3. Within each fuel-type category, attention is paid to barriers
and program awards in the key market segment categories. The workforce analysis is done
across the ARFVT industry sectors as a whole.

6
Table 1.3. Evaluation Categories
Fuel Type
Market Segment Hydrogen Electricity Diesel
Substitutes Gasoline
Substitutes
Natural Gas and
Biomethane Fuel production and development X X X X X Fueling or charging infrastructure X X X X X Vehicle or component development, demonstration, deployment, or production
X X X X X
Workforce development X SOURCE: Authors.
1.3 Evaluation Approach
Based on the outcome-sequence model shown in Figure 1.1, the process and outcomes
evaluation of the ARFVTP used both quantitative and qualitative methods:
• Review project documentation to arrive at an independent assessment of the extent to
which project technical objectives were achieved.
• Survey ARFVTP awardees, unsuccessful applicants, and potential applicants.
• Conduct in-depth reviews of selected ARFVTP projects.
• Verify installation of electric vehicle supply equipment (EVSE) for selected set of awards.
• Assemble and analyze CEC administrative data on program processes and interview CEC
staff on program processes. Collect additional information to inform outcome
evaluation.
1.3.1 Review Project Documentation to Arrive at an Independent Assessment of the Extent to Which Project Technical Objectives Were Achieved
Among the most important questions of the evaluation is the extent to which awardees
achieved the central technical objectives of their projects.14 To answer this question, the RAND
team first reviewed project documents to identify the initial technical objectives for each
project—those that were in place at the beginning of the project. In most cases, these technical
objectives corresponded with the technical tasks identified in the statement of work, although
in some cases, tasks were combined or split to maintain consistency among the types of
activities designated as technical objectives among the different projects. Our goal in
characterizing the technical objectives was to focus only on the major objectives of a project
such that all technical objectives were of approximately equivalent importance within and
across projects. Many projects had only one or two technical objectives.
14 CEC distinguishes technical objectives from administrative objectives. The latter include objectives related to project management, progress reports, the preparation of the final project report, and meetings with CEC. Administrative objectives are typically stated as task 1 of the scope of work for the award. The technical objectives are detailed in the subsequent tasks of the scope of work.

7
For each technical objective, the RAND team reviewed the proposal, statement of work, critical
project review presentations, if present, and, for completed projects, the final project report.
This review was used to identify the main technical objectives of the project (up to eight) and to
make an assessment of the extent to which each technical objective has been achieved.
The extent to which the technical objectives were achieved for completed projects was assessed
as fully, partially, minimally, or unknown. Partial achievement means that the technical
objective was at least 25 percent but not fully completed, while minimal achievement means
that the technical objective was less than 25 percent completed. While in some cases a numeric
estimate for the percentage achieved is relatively straightforward (e.g., number of fueling
stations completed), in other cases, the assessment was a qualitative judgment based on the
information in the project documentation. However, the majority of technical objectives rated
as minimally achieved were never undertaken, in which case an assignment of minimally
achieved is clear.
The extent to which the technical objectives were achieved for ongoing projects was assessed as
fully, in-progress, partially, minimally, or unknown, where partially and minimally achieved are
defined the same way as they are for completed projects. Technical objectives for ongoing
projects were assessed as partially or minimally achieved only when it was clear from the
documentation that work on the technical objective was finished and that the objective would
not be fully completed.
1.3.2 Survey Awardees, Unsuccessful Applicants, and Potential Applicants
We conducted a web-based survey of project awardees and a sample of unsuccessful applicants
and potential applicants. The sample of potential applicants included firms that are active in
the industries relevant to the fuel types and market segments examined in the evaluation. The
survey contained 14 sections that covered the evaluation topics, with multiple questions in each
section. The 60-plus page hardcopy of survey instrument is available by request from the
authors. The survey contained many skip patterns, and respondents were asked only to
complete the questions relevant to them.
RAND’s assessment of the extent to which the main technical objectives were achieved was
programmed into the survey instrument such that a survey respondent received a custom-
tailored survey that presented RAND's assessment. The respondent was then asked whether
this assessment was correct and, if not, to provide a corrected assessment. This approach was
taken both to reduce the burden on the survey respondents and to reduce the occurrence of
respondents overstating their projects’ success. We present results both for the initial RAND
assessment based on the review of project documents and for the assessment as corrected by
the survey respondents.
The survey used an analogous approach to assessing the schedule performance of projects. The
RAND team asked the Commission Agreement Manager (CAM) to assess each project’s schedule
performance. This assessment was incorporated into the customized survey instrument, and
the respondents were asked to adjust it as appropriate. Interestingly, respondents typically
rated the projects as being further behind than did the CAMs.
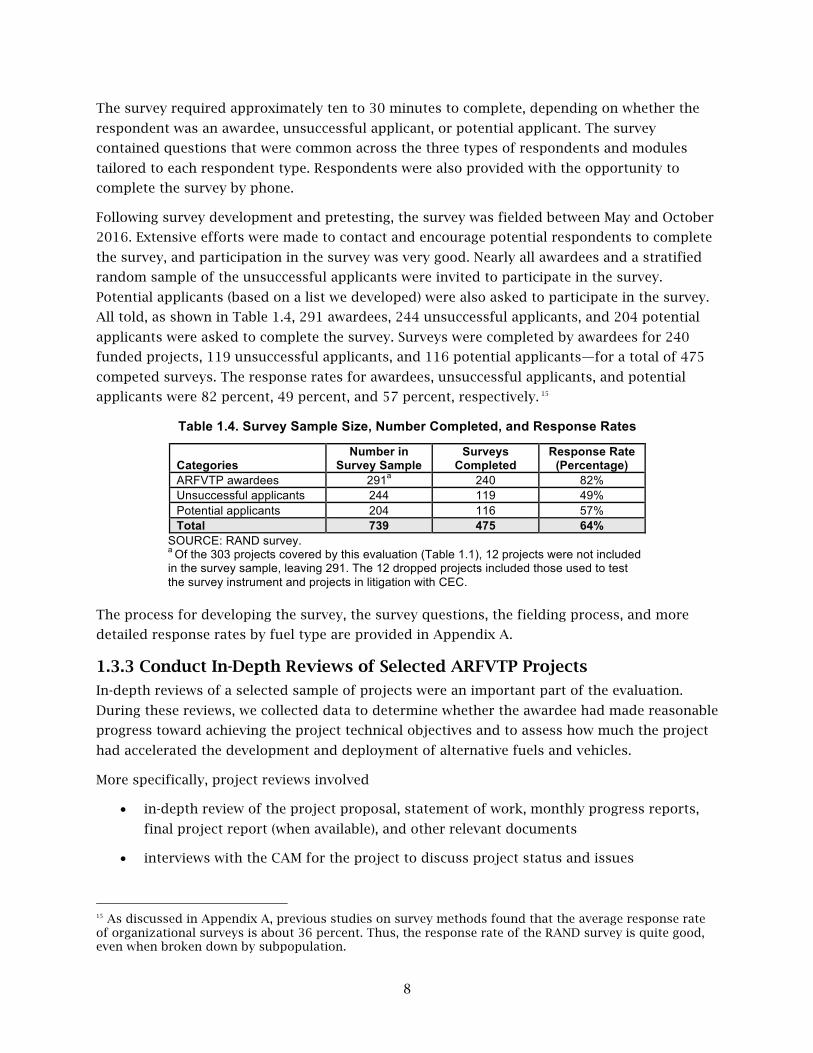
8
The survey required approximately ten to 30 minutes to complete, depending on whether the
respondent was an awardee, unsuccessful applicant, or potential applicant. The survey
contained questions that were common across the three types of respondents and modules
tailored to each respondent type. Respondents were also provided with the opportunity to
complete the survey by phone.
Following survey development and pretesting, the survey was fielded between May and October
2016. Extensive efforts were made to contact and encourage potential respondents to complete
the survey, and participation in the survey was very good. Nearly all awardees and a stratified
random sample of the unsuccessful applicants were invited to participate in the survey.
Potential applicants (based on a list we developed) were also asked to participate in the survey.
All told, as shown in Table 1.4, 291 awardees, 244 unsuccessful applicants, and 204 potential
applicants were asked to complete the survey. Surveys were completed by awardees for 240
funded projects, 119 unsuccessful applicants, and 116 potential applicants—for a total of 475
competed surveys. The response rates for awardees, unsuccessful applicants, and potential
applicants were 82 percent, 49 percent, and 57 percent, respectively. 15
Table 1.4. Survey Sample Size, Number Completed, and Response Rates
Categories Number in
Survey Sample Surveys
Completed Response Rate
(Percentage) ARFVTP awardees 291a 240 82% Unsuccessful applicants 244 119 49% Potential applicants 204 116 57% Total 739 475 64%
SOURCE: RAND survey. a Of the 303 projects covered by this evaluation (Table 1.1), 12 projects were not included in the survey sample, leaving 291. The 12 dropped projects included those used to test the survey instrument and projects in litigation with CEC.
The process for developing the survey, the survey questions, the fielding process, and more
detailed response rates by fuel type are provided in Appendix A.
1.3.3 Conduct In-Depth Reviews of Selected ARFVTP Projects
In-depth reviews of a selected sample of projects were an important part of the evaluation.
During these reviews, we collected data to determine whether the awardee had made reasonable
progress toward achieving the project technical objectives and to assess how much the project
had accelerated the development and deployment of alternative fuels and vehicles.
More specifically, project reviews involved
• in-depth review of the project proposal, statement of work, monthly progress reports,
final project report (when available), and other relevant documents
• interviews with the CAM for the project to discuss project status and issues
15 As discussed in Appendix A, previous studies on survey methods found that the average response rate of organizational surveys is about 36 percent. Thus, the response rate of the RAND survey is quite good, even when broken down by subpopulation.
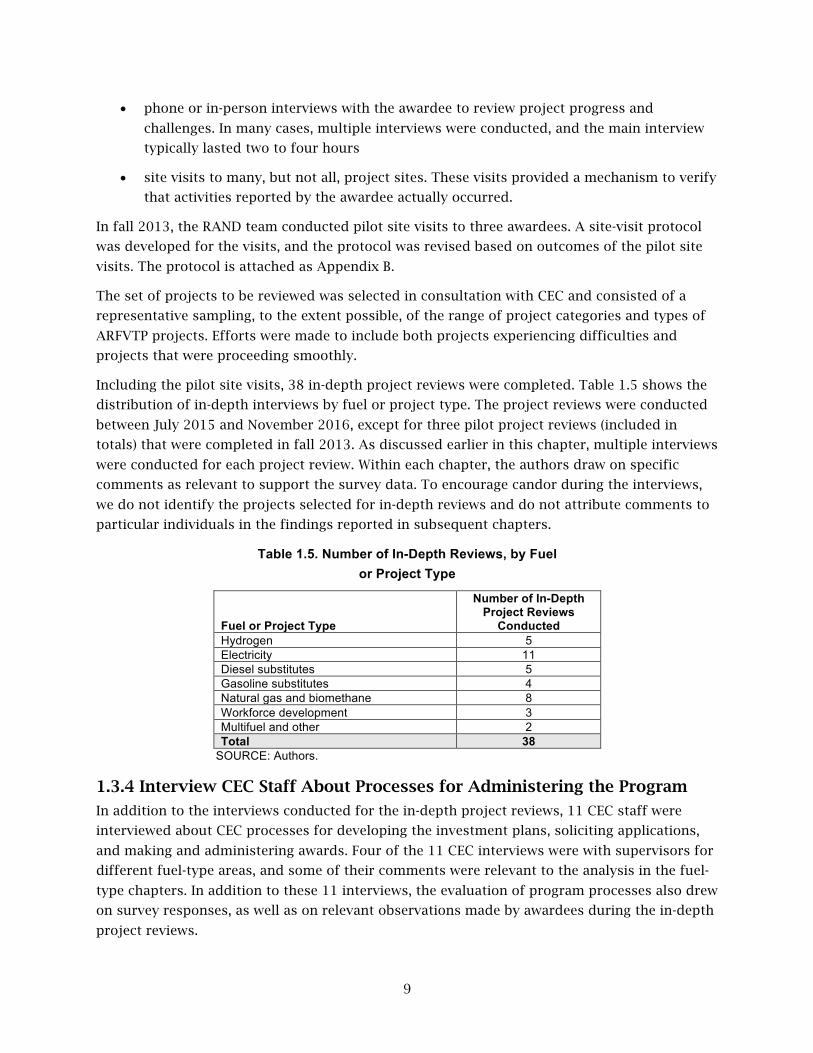
9
• phone or in-person interviews with the awardee to review project progress and
challenges. In many cases, multiple interviews were conducted, and the main interview
typically lasted two to four hours
• site visits to many, but not all, project sites. These visits provided a mechanism to verify
that activities reported by the awardee actually occurred.
In fall 2013, the RAND team conducted pilot site visits to three awardees. A site-visit protocol
was developed for the visits, and the protocol was revised based on outcomes of the pilot site
visits. The protocol is attached as Appendix B.
The set of projects to be reviewed was selected in consultation with CEC and consisted of a
representative sampling, to the extent possible, of the range of project categories and types of
ARFVTP projects. Efforts were made to include both projects experiencing difficulties and
projects that were proceeding smoothly.
Including the pilot site visits, 38 in-depth project reviews were completed. Table 1.5 shows the
distribution of in-depth interviews by fuel or project type. The project reviews were conducted
between July 2015 and November 2016, except for three pilot project reviews (included in
totals) that were completed in fall 2013. As discussed earlier in this chapter, multiple interviews
were conducted for each project review. Within each chapter, the authors draw on specific
comments as relevant to support the survey data. To encourage candor during the interviews,
we do not identify the projects selected for in-depth reviews and do not attribute comments to
particular individuals in the findings reported in subsequent chapters.
Table 1.5. Number of In-Depth Reviews, by Fuel or Project Type
Fuel or Project Type
Number of In-Depth Project Reviews
Conducted Hydrogen 5 Electricity 11 Diesel substitutes 5 Gasoline substitutes 4 Natural gas and biomethane 8 Workforce development 3 Multifuel and other 2 Total 38
SOURCE: Authors.
1.3.4 Interview CEC Staff About Processes for Administering the Program
In addition to the interviews conducted for the in-depth project reviews, 11 CEC staff were
interviewed about CEC processes for developing the investment plans, soliciting applications,
and making and administering awards. Four of the 11 CEC interviews were with supervisors for
different fuel-type areas, and some of their comments were relevant to the analysis in the fuel-
type chapters. In addition to these 11 interviews, the evaluation of program processes also drew
on survey responses, as well as on relevant observations made by awardees during the in-depth
project reviews.

10
1.3.5 Verify Installation of EVSE for Selected Set of Awards
To verify whether the electric vehicle (EV) charging stations funded by the program were
actually installed and operational, a sample of stations was inspected and tested. We selected a
sample of EVSE awards and then visited and tested a sample of stations that were reported to
have been installed by the awardee. Overall, 292 EV charge points at 83 locations were tested.
1.3.6 Assemble and Analyze CEC Administrative Data on Program Processes and Interview CEC Staff on Program Processes
The information collected from the in-depth project reviews and survey was used in the process
evaluation, but the evaluation also considered administrative data supplied by CEC and in-
person and phone interviews with 11 CEC staff. In addition, we reviewed the effective practices
used by other grant-making organizations, with an emphasis on organizations that make grants
for technology development and deployment, and compared those practices with CEC practices.
1.3.7 Collect Additional Information to Inform the Outcome Evaluation
The information collected from the site visits and the survey was used in the outcome
evaluation, but we collected additional information to inform that evaluation. For each fuel-type
category, data available from government and industry sources were assembled to evaluate
trends in alternative fuel and vehicle technology markets. Examples include trends in fuel
consumption, fueling and charging stations, and vehicles on the road. We also interviewed
parties knowledgeable about the state of the technology, market conditions, and barriers to
market viability. In addition, we synthesized relevant industry and academic literature. Using
these sources, we evaluated the extent to which the ARFVTP impacted barriers to market
viability.
Our general approach was to identify relevant market status indicators, collect data on how
indicator values have changed since the ARFVTP began, and determine the extent to which
changes can be attributed to the ARFVTP. Cases in which ARFVTP-funded projects constitute a
substantial fraction of a large change in a market indicator are likely examples of the impact of
the ARFVTP on market barriers. However, attributing changes to the ARFVTP is complicated by
the fact that there are a number of other factors, such as the Low Carbon Fuel Standard (LCFS),
Renewable Fuel Standard (RFS), zero-emission vehicle (ZEV) program, Corporate Average Fuel
Economy credits, producer tax credits, consumer rebates, federal grants, etc., that influence
alternative transportation fuels and technology markets. The existence of these additional
incentives makes it difficult to unequivocally attribute market changes to the ARFVTP.
To help with attribution, our survey asked unsuccessful applicants whether they had proceeded
with the project without ARFVTP funding and asked awardees whether they would have
proceeded with the project without ARFVTP funding. Neither question provides an ideal
counterfactual to what would have happened without the ARFVTP—unsuccessful applicants
may have weaker ideas to begin with, and hence their projects have a lower likelihood of ever
being implemented, and the credibility of responses to hypothetical questions is difficult to
know. Nonetheless, they contribute to our understanding of the role the program played
relative to other market forces. Another challenge with attribution is that industry

11
transformation takes time. Although the ARFVTP has been operating for a number of years, the
program is ongoing, and many projects are yet to be completed. Further, many of the ARFVTP
projects have focused on research and development and never had any intention of
immediately affecting market indicators. While such groundwork research is often an essential
prerequisite to subsequent commercialization that will influence market indicators, it is very
difficult to demonstrate the impact of such work. In addition, many aspects of the alternative
fuel and vehicle markets are national or international, and the ability for California-based
projects to influence them is limited. For these reasons, it is often challenging to characterize
the impact of the ARFVTP on the market.
Although data limitations made it difficult to compare what happened with the program in
place to what would have happened absent the program (and thus to make strong conclusions
about program causality), we believe that the thoughtful combination of quantitative and
qualitative modes of causal inference yielded useful and compelling conclusions.
1.3.8 Evaluation Scope
The ARFVTP is a key element of California’s overall strategy to increase the use of alternative
transportation fuels. Doing so involves broad changes in a complex environment of private
markets and policy, regulation, and funding at multiple levels of government. The ARFVTP
contributes to the goal by providing grant funding to help reduce barriers to the market
viability of ARFVTs. As broad as the scope of the program is, there are aspects of it that are
informed or constrained by other factors that extend beyond the scope of our evaluation.
In particular, by design, the program supports the development of multiple alternative fuel
types. We take this position as a starting point, and our evaluation does not address the
allocation of resources across different fuel types.
In addition, the different technologies being supported are at different stages of market
evolution, which influences what types of investments are needed. However, our analysis
identifies current barriers and whether the program is appropriately targeting and successfully
reducing them. In this framing, differences in the evolutionary stages of different technologies
are implicitly accounted for in the differences in what the barriers are and how they are being
addressed. Further, our evaluation focuses on changes in the status of specific technologies
over time rather than on comparing the state of different technologies to one another at any
one time, thus making the evaluation largely independent of differences in evolutionary stages.
That said, we do not explicitly assess how investments have been or should be influenced by
expected technological evolution pathways.
Further, while a central aspect of our evaluation is assessing whether the program is succeeding
in targeting and reducing barriers to market viability, we do not go so far as to assess how
much any barrier has been reduced. Given the complex and interrelated nature of the barriers,
assessing their magnitude, much less how much they have changed, is beyond what is feasible
with available information.
Finally, our evaluation does not extend to assess reductions in greenhouse gas (GHG) and
criteria pollutant emissions and petroleum use (step 7 in Figure 1.1). We do not have adequate

12
data on actual fuel production and vehicle use to conduct such an evaluation. The National
Renewable Energy Laboratory (NREL) has conducted such an analysis based on estimates of fuel
and vehicle production and usage inferred from project objectives.16
1.4 Organization of This Document
The remainder of this document follows the structure of the outcome-sequence model in Figure
1.1, with its focus on reporting the results of the process and outcome evaluations.
Chapter Two presents the results for the evaluation of steps 1 and 2 and parts of step 3 in the
outcome-sequence model. It focuses on evaluation results about CEC’s processes for developing
the investment plans and soliciting and awarding awards. It also examines CEC performance in
administering awards.
Chapters Three through Nine present results for the remaining parts of step 3 and for steps 4
and 5 in the outcome-sequence model. Chapters Three through Seven examine the success of
awardees in carrying out their projects and the impacts of ARFVTP on the barriers to market
viability in the five fuel types—hydrogen, electricity, diesel substitutes, gasoline substitutes,
and natural gas and biomethane, respectively—drawing both on the survey results and on other
information.
Within each fuel-type chapter (Chapters Three through Seven), we do the following:
• Provide a summary of the data sources used in the analysis.
• Provide a technical review of the fuel type and, if relevant, of the associated vehicles.
• Review program solicitations and awards and the barriers targeted by those awards.
• Examine awardee performance in carrying out the project (project status and technical,
financial, and schedule performance).
• Examine the impact of the ARFVTP on awardees.
• Examine the impact of the portfolio of ARFVTP projects on the barriers for that fuel
type.
• Discuss the state of the industry for that fuel type.
• Discuss the views of fuel type stakeholders on ARFVTP investment priorities and offer
some conclusions for the fuel type.
Chapter Eight collects and compares the results from Chapters Three through Seven and
presents results for the program as a whole. A reader most interested in the performance of the
program as a whole might skip to this chapter after completing Chapter Two.
16 Marc Melaina, Ethan Warner, Yongling Sun, Emily Newes, and Adam Ragatz (National Renewable Energy Laboratory), Program Benefits Guidance: Analysis of Benefits Associated With Projects and Technologies Supported by the Alternative and Renewable Fuel and Vehicle Technology Program, Publication Number CEC‐600‐2014‐005‐D, Sacramento, Calif.: California Energy Commission, June 2014.
13
Chapter Nine presents the results of the impact of ARFVTP on workforce capabilities; as shown
earlier in this chapter, the analysis responds to one of ARFVTP goals—build workforce for the
ARFVT industries.
Chapter Ten summarizes answers to the process and outcome-evaluation questions posed
earlier in this chapter and provides observations from stakeholders and the evaluation team on
ARFVTP investment priorities.
The document contains two appendices. Appendix A describes processes for developing and
fielding the survey and provides more-detailed response rates. Appendix B provides the
protocol for the in-depth project review interviews.

14
CHAPTER 2: The Process for Developing and Executing ARFVTP Investment Plans
2.1 Purpose and Key Questions
This chapter presents the results of steps 1 and 2 and the first part of step 3 in the outcome-
sequence model shown in Figure 1.1 in the previous chapter; specifically, it describes and
analyzes how the California Energy Commission (CEC) develops the annual investment plan for
the Alternative and Renewable Fuel and Vehicle Technology Program (ARFVTP) and solicits
applications and makes awards. It also examines CEC performance in administering awards.
Understanding the process can both help shed light on the results of the outcome evaluation
and help identify recommendations for improving the program’s ability to make investments
that help pursue the state’s air quality goals.
For the investment planning process, we seek to address the following questions: What are the
challenges CEC faces in developing an investment plan for the ARFVTP, and is the investment
planning process reasonable—that is, well-suited to address those challenges? Given the
inevitable uncertainties involved in investing in new products and services, we focus much of
our analysis on whether CEC has processes in place that allow it to learn from experience and
(iteratively) improve strategies over time. Moreover, we assess the process for engaging
awardees and other key stakeholders, which is important both for program buy-in and as a
source of insight about the on-the-ground realities of markets for alternative fuels and vehicles.
In assessing the process of soliciting applicants and making awards, we address the following
questions:
• Is CEC effective in attracting applicants?
• What are strengths and weaknesses in the process used to evaluate and select among
applicants?
• What are the strengths and weaknesses in CEC’s execution and oversight of grants?
Our analysis is based on reviewing key documents (e.g., investment plans, Project Opportunity
Notices [PONs],17 transcripts from public meetings); analyzing administrative data on applicants
and grant-making decisions provided by CEC; interviews with CEC staff and awardees; and a
survey of awardees, unsuccessful applicants, and potential applicants. Additional detail on
these methods is provided in Chapter One. Also, Chapters Three, Four, Five, Six, and Seven
provide more information on investment priorities for specific fuel types. The focus of this
chapter is solely on process.
17 PONs have recently been renamed Grant Funding Opportunities. However, we use the term PON in this report to reflect the name that was in use during the time period covered by this evaluation.

15
In the remaining sections, we provide an overview of the investment planning process,
stakeholder involvement in investment planning, adapting the strategy based on experience,
types of funding mechanisms, attracting applicants, evaluating and selecting among applicants,
cost-sharing, and executing and overseeing agreements. We conclude with a summary of
findings.
2.2 Overview of the Investment Planning Process
The legislation that created the ARFVTP requires CEC to create an annual investment plan that
helps achieve the state’s air quality goals as mandated in executive orders and other directives.
For instance, Executive Order S-3-0518 sets a long-term goal of reducing GHG emissions to 80
percent below 1990 levels by 2050, and Executive Order B-30-1519 sets an interim goal of
reducing statewide GHG emissions to 40 percent below 1990 levels by 2030 to ensure that
California is on track to meet the 2050 goal. As noted in the 2016–2017 Investment Plan,
investment plans are also designed to complement a number of other, more specific goals and
programmatic efforts, including the following:
• Low-Carbon Fuel Standard (LCFS): provides a carbon intensity (CI) standard for fuel
production, which creates near-term market incentives that allow ARFVTP to focus on
the longer term20
• Federal RFS: provides a direct incentive for introducing biofuels, which creates near-
term market incentives that allow ARFVTP to focus on the longer term
• Governor’s Zero-Emission Vehicle (ZEV) Action Plan: specifies goals for use of ZEVs and
for infrastructure networks and community readiness plans for plug-in electric and fuel-
cell electric vehicles (EVs)
• California Sustainable Freight Action Plan (CSFAP): establishes targets and actions to
foster the transition to zero-emission technologies in the freight sector
• Greenhouse Gas Reduction Funds (GGRF): allocate proceeds from the state’s cap-and-
trade program to support GHG-reducing programs in disadvantaged communities in
California.
Entities other than ARFVTP invest in alternative fuels and vehicles. Thus, Assembly Bill (AB) 118
requires investment plans to complement “existing public and private investments, including
existing state programs.”21 Indeed, investment plans typically devote a considerable amount of
space to describing how proposed investments might support or accentuate other investments;
in some cases, the plans cite the existence of other investments as a justification for not
investing in a particular technology or market. For instance, the 2008–2010 Investment Plan
established the expectation that ARFVTP funds would not be used to provide subsidies for
18 Office of the Governor of California, Executive Order S-3-05, June 2005. 19 Office of the Governor of California, Executive Order B-30-15, April 29, 2015. 20 Air Resources Board (ARB), “Low Carbon Fuel Standard,” arb.ca.gov, May 17, 2017. 21 AB No. 118, Alternative Fuels and Vehicles Technology Program, October 14, 2007, sec. 4, 44272.5a.
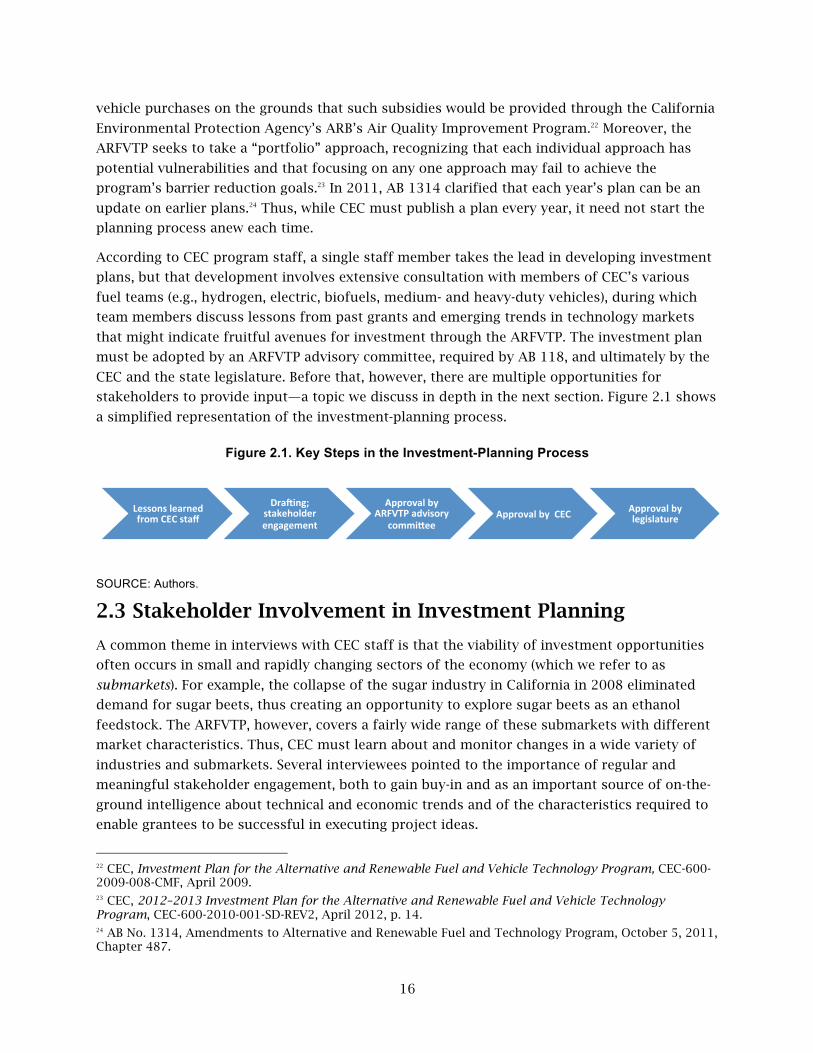
16
vehicle purchases on the grounds that such subsidies would be provided through the California
Environmental Protection Agency’s ARB’s Air Quality Improvement Program.22 Moreover, the
ARFVTP seeks to take a “portfolio” approach, recognizing that each individual approach has
potential vulnerabilities and that focusing on any one approach may fail to achieve the
program’s barrier reduction goals.23 In 2011, AB 1314 clarified that each year’s plan can be an
update on earlier plans.24 Thus, while CEC must publish a plan every year, it need not start the
planning process anew each time.
According to CEC program staff, a single staff member takes the lead in developing investment
plans, but that development involves extensive consultation with members of CEC’s various
fuel teams (e.g., hydrogen, electric, biofuels, medium- and heavy-duty vehicles), during which
team members discuss lessons from past grants and emerging trends in technology markets
that might indicate fruitful avenues for investment through the ARFVTP. The investment plan
must be adopted by an ARFVTP advisory committee, required by AB 118, and ultimately by the
CEC and the state legislature. Before that, however, there are multiple opportunities for
stakeholders to provide input—a topic we discuss in depth in the next section. Figure 2.1 shows
a simplified representation of the investment-planning process.
Figure 2.1. Key Steps in the Investment-Planning Process
SOURCE: Authors.
2.3 Stakeholder Involvement in Investment Planning
A common theme in interviews with CEC staff is that the viability of investment opportunities
often occurs in small and rapidly changing sectors of the economy (which we refer to as
submarkets). For example, the collapse of the sugar industry in California in 2008 eliminated
demand for sugar beets, thus creating an opportunity to explore sugar beets as an ethanol
feedstock. The ARFVTP, however, covers a fairly wide range of these submarkets with different
market characteristics. Thus, CEC must learn about and monitor changes in a wide variety of
industries and submarkets. Several interviewees pointed to the importance of regular and
meaningful stakeholder engagement, both to gain buy-in and as an important source of on-the-
ground intelligence about technical and economic trends and of the characteristics required to
enable grantees to be successful in executing project ideas.
22 CEC, Investment Plan for the Alternative and Renewable Fuel and Vehicle Technology Program, CEC-600-2009-008-CMF, April 2009. 23 CEC, 2012–2013 Investment Plan for the Alternative and Renewable Fuel and Vehicle Technology Program, CEC-600-2010-001-SD-REV2, April 2012, p. 14. 24 AB No. 1314, Amendments to Alternative and Renewable Fuel and Technology Program, October 5, 2011, Chapter 487.
Lessons learned from CEC staff
Dra2ing; stakeholder engagement
Approval by ARFVTP advisory
commiCee Approval by CEC Approval by
legislature

17
Opportunities for stakeholder input come in several forms (see Figure 2.1). First, AB 118
requires that the commission shall create and consult with an advisory body as it develops the
investment plan and that the commission shall approve the plans.25 Typically, there are 25
advisory board members who represent the viewpoints of consumer, industry, and stakeholder
groups, as well as other relevant state agencies (e.g., California Air Resources Board [CARB]).26
These meetings typically include a presentation by CEC staff and time for input from members
of the public attending in person or through WebEx. In addition, CEC holds other public
workshops during which stakeholders and members of the general public can learn about and
provide input into investment plans. All such meetings are open to the public, and participants
can join in person or remotely through the web. Agendas, transcripts, and other documents are
available on a web portal.27 Table 2.1 shows a list of such public meetings since 2011.
25 AB No. 118, 2007, Alternative Fuels and Vehicles Technology Program, sec. 4, 44272.5c. 26 CEC, “Advisory Committee Members for the Alternative and Fuel and Vehicle Technology Program,” undated. 27 CEC, “Alternative and Renewable Fuel and Vehicle Technology Program Proceedings,” undated.

18
Table 2.1. Public Meetings on Investment Plans, 2011–2016, as of November 26, 2016
Investment Plan Year Public Meetings
2011–2012
March 7, 2011: 2011–2012 advisory committee meeting
May 23, 2011: 2011–2012 advisory committee meeting and public workshop May 26, 2011: Staff workshop in Long Beach for the 2011–2012 Investment Plan for the ARFVTP June 1, 2011: Staff workshop in San Francisco for the 2011–2012 Investment Plan for the ARFVTP September 22, 2011: Joint California Agriculture Biofuel Forum October 19, 2010: Energy Commission Staff and Statewide Plug-In Electric Vehicle (PEV) Collaborative PEV Infrastructure Joint Workshop November 30, 2010: 2011–2012 advisory committee meeting
2012–2013
February 10, 2012: 2012–2013 advisory committee meeting and public workshop for the ARFVTP. Dated and posted January 27, 2012. April 19, 2012: Notice of advisory committee meeting and public workshop. Posted April 5, 2012. May 9, 2012: Energy Commission business meeting for possible adoption of the 2012–2013 Investment Plan Update August 1, 2012: Lead commissioner workshop on advanced ethanol production in California
2013–2014
February 28, 2013: Advisory committee meeting and public workshop May 8, 2013: Commission business meeting September 19, 2012: Advisory committee meeting and public workshop December 4, 2012: Advisory committee meeting and public workshop
2014–2015 November 4, 2013: Advisory committee meeting and public workshop February 10, 2014: Advisory committee meeting and public workshop
2015–2016
February 12, 2015: Advisory committee meeting and public workshop April 8, 2015: Energy commission business meeting November 12, 2014: Advisory committee meeting and public workshop
2016–2017
November 6, 2015: Advisory committee meeting and public workshop January 21, 2016: Advisory committee meeting and public workshop January 21, 2016: Advisory committee meeting and public workshop
2017–2018 October 27, 2016: Advisory committee meeting and public workshop SOURCE: RAND analysis of meeting minutes accessed at CEC, “Alternative and Renewable Fuel and Vehicle Technology Program Proceedings,” undated. To get more information about the extent of public participation in the investment planning
process, we compiled data from meeting transcripts on the number of participants at each
meeting. We also reviewed the total number of pages in written input provided. As shown in
Figure 2.2, there was a decline in both the number of participants and docket lengths between
the proceedings from the 2013–2014 and the 2014–2015 and 2015–2016 plans. However, the
number of participants and docket length went up again in the proceedings for the 2016–2017
investment plan. We were unable to find a clear explanation for the decline. One conjecture is
that the decline is related to the dissatisfaction that several CEC interviewees expressed with
the quality of the stakeholder elicitation process in past years. Specifically, several interviewees
pointed to the fact that in the past, public meetings tended to have a very general scope,
focusing on the entire investment plan. As some interviewees noted, this makes it difficult to

19
Figure 2.2. Number of Participants and Docket Length for Those Providing Input on Investment Plans, 2011–2016
SOURCE: RAND analysis of CEC dockets.
get meaningful input on the conditions and opportunities in the submarkets previously
mentioned.
Largely in response to these concerns, in 2015, CEC began running more focused meetings
modeled after the U.S. Department of Energy’s (DoE’s) “merit review” workshop model. Like that
process, CEC’s merit reviews involve in-depth examinations of a fairly focused set of grants
rather than, as in the past, the entire investment plan. To date, CEC merit reviews have focused
on EV charging infrastructure, medium- and heavy-duty vehicles (MDVs and HDVs, respectively),
and biofuel and biomethane projects.28 Whereas the DOE workshops are often several days long,
the CEC workshops typically last a day. Morning sessions feature presentations from grantees,
and afternoon sessions include critiques from outside reviewers. This narrower focus is
designed to promote a more in-depth examination of grants, while the presence of outside
reviewers is designed to ensure a degree of objectivity in the process of drawing lessons from
the projects. While a systematic evaluation of the merit review process was beyond the scope of
this report, interviews suggest that the workshops have produced lessons CEC staff and others
find valuable.
The metrics we use—number of participants and number of pages in the docket—are poor
indicators of the quality of stakeholder involvement. Thus, we used the survey to assess
28 CEC, “Documents, Notices and Reports: Fuels and Transportation Technology Merit Review,” docket #15-MISC-04, undated.
0
200
400
600
800
1000
1200
1400
0
20
40
60
80
100
120
140
Num
ber o
f pages in docket
Num
ber o
f parFcipants
Investment plan years
# Par5cipants
# Pages in Docket
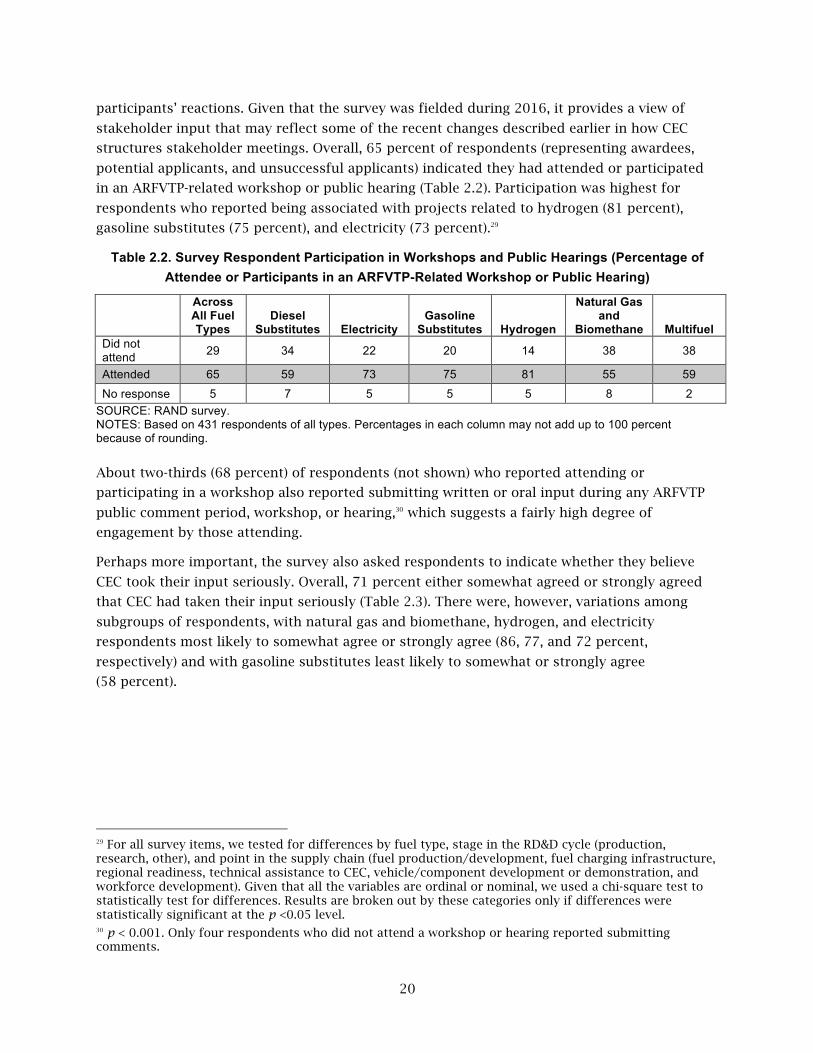
20
participants’ reactions. Given that the survey was fielded during 2016, it provides a view of
stakeholder input that may reflect some of the recent changes described earlier in how CEC
structures stakeholder meetings. Overall, 65 percent of respondents (representing awardees,
potential applicants, and unsuccessful applicants) indicated they had attended or participated
in an ARFVTP-related workshop or public hearing (Table 2.2). Participation was highest for
respondents who reported being associated with projects related to hydrogen (81 percent),
gasoline substitutes (75 percent), and electricity (73 percent).29
Table 2.2. Survey Respondent Participation in Workshops and Public Hearings (Percentage of Attendee or Participants in an ARFVTP-Related Workshop or Public Hearing)
Across All Fuel Types
Diesel Substitutes Electricity
Gasoline Substitutes Hydrogen
Natural Gas and
Biomethane Multifuel Did not attend 29 34 22 20 14 38 38
Attended 65 59 73 75 81 55 59 No response 5 7 5 5 5 8 2
SOURCE: RAND survey. NOTES: Based on 431 respondents of all types. Percentages in each column may not add up to 100 percent because of rounding.
About two-thirds (68 percent) of respondents (not shown) who reported attending or
participating in a workshop also reported submitting written or oral input during any ARFVTP
public comment period, workshop, or hearing,30 which suggests a fairly high degree of
engagement by those attending.
Perhaps more important, the survey also asked respondents to indicate whether they believe
CEC took their input seriously. Overall, 71 percent either somewhat agreed or strongly agreed
that CEC had taken their input seriously (Table 2.3). There were, however, variations among
subgroups of respondents, with natural gas and biomethane, hydrogen, and electricity
respondents most likely to somewhat agree or strongly agree (86, 77, and 72 percent,
respectively) and with gasoline substitutes least likely to somewhat or strongly agree
(58 percent).
29 For all survey items, we tested for differences by fuel type, stage in the RD&D cycle (production, research, other), and point in the supply chain (fuel production/development, fuel charging infrastructure, regional readiness, technical assistance to CEC, vehicle/component development or demonstration, and workforce development). Given that all the variables are ordinal or nominal, we used a chi-square test to statistically test for differences. Results are broken out by these categories only if differences were statistically significant at the p <0.05 level. 30 p < 0.001. Only four respondents who did not attend a workshop or hearing reported submitting comments.

21
Table 2.3. Whether Input Was Seriously Considered (Percentage Agreeing with the Question: Did CEC Seriously Consider Your Input?)
All Fuel Types
Diesel Substitutes Electricity
Gasoline Substitutes Hydrogen
Natural Gas and
Biomethane Multifuel Strongly disagree 3 0 0 8 3 0 8 Somewhat disagree 6 17 3 0 10 0 11 Neither agree nor disagree 19 17 25 33 10 15 17
Somewhat agree 30 44 27 50 30 30 22 Strongly agree 41 17 45 8 47 56 42 No response 1 6 0 0 0 0 0
SOURCE: RAND survey. NOTES: Based on 199 respondents who reported providing input during the strategy development process. Percentages in columns may not add up to 100 percent because of rounding.
2.4 Adapting the Strategy Based on Experience
Another way of addressing the challenges of determining how to target state funds to the most
promising submarkets, technologies, and grantees is to maintain a process of continuous
learning that allows the agency to learn from experience. The market potential of biofuels, for
instance, may partly depend on prices of both the feedstock materials used to produce them
and petroleum-based fuels, both of which change over time. In addition, innovations in fuel
cells, batteries, and so on may change the range of what is technologically possible. Thus,
ARFVTP’s investment strategy may need to evolve somewhat over time.
Thus, it is perhaps not surprising that the 2016–2017 investment plan underscores the
importance of learning from past and existing projects. Specifically, the document notes that
“existing projects provide direct feedback” on whether the strategy and specific investments are
helping to reach ARFVTP’s goals of “reducing near-term greenhouse gas emissions while
supporting the transformation of the California transportation sector toward fuels and
technologies that can meet the more drastic emission reductions required by 2050.”31 Thus, we
sought to identify CEC processes and activities to promote ongoing learning. Specifically, we
asked a broader range of CEC staff to identify specific changes in strategy and to discuss the
factors that brought them about.
According to interviewees, one of the most important adaptations over time is that the
investment strategy has become increasingly focused and ambitious as the state gets closer to
the year 2020, when the first set of air quality goals should be accomplished. One respondent
noted that for vehicle demonstration projects, for instance, “we are now more focused on demo
projects for the ‘cleanest of the cleans.’ The bar is set higher and getting pushed higher all the
time with every new governor.” Another respondent noted that while “CEC doesn’t pick
winners,” it is getting more “targeted” in how it distributes money. Echoing this point, another
respondent noted that, in the early days, before CEC had much experience running the
31 CEC, 2016–2017 Investment Plan for the Alternative and Renewable Fuel and Vehicle Technology Program, CEC-600-2015-014-CMF, May 2016, p. 1.

22
program, it was open to a wide range of proposals “as long as there was some type of benefit,”
but that “we’ve moved beyond that.”
For example, one interviewee pointed to the 2015–2016 Investment Plan in which the agency
articulated its intent to stop funding projects intended to start new vehicle and fuel-production
projects in favor of focusing on projects that seek to scale-up existing facilities. Similarly, one
respondent pointed to the fact that CEC stopped funding new advanced ethanol fuel-production
infrastructure in 2012 to focus more on supporting existing facilities to increase fuel
production. However, we also heard at least one example of a broadening in the range of
activities targeted by the investment plan. One respondent noted that the 2016–2017
Investment Plan is opening up investment in the “medium/heavy vehicles” category to
infrastructure and propulsive technologies to support the California Sustainable Freight Action
Plan (CSFAP).
Finally, respondents identified lessons learned about the process through which organizations
apply for grants. For instance, one respondent noted that, in the past, many applicants would
come in for manufacturing funding and demonstration funding, which required applying for
two separate funding announcements, each of which was often on a different time line. To
reduce the burden both for applicants and evaluators, applicants can now include both types of
requests in a single application. (We provide additional information on the grant-making
process later in this chapter.)
Respondents also mentioned the importance of monitoring metrics of market and other
characteristics as an important source of learning. Some discussed metrics of production
volume and CI as ways to estimate or track the impact of grantees on air quality. Those focused
on fueling infrastructure, by contrast, described how they use data on population concentration
and the use of mass transit to track the need for additional investment in particular
communities. Others mentioned monitoring price differentials between alternative and
conventional fuels and vehicles as an indication of successful commercialization. Respondents
also mentioned getting useful feedback from stakeholders through formal comments and
workshops (see preceding) and through meetings with potential applicants.
2.5 Types of Funding Mechanisms
Investment plans identify funding allocations among different approaches for reducing
barriers, but they do not specify which organizations or projects are best suited to put those
priorities into practice. This task comes in the process of issuing funding-opportunity notices
and selecting among applications. AB 118 authorizes CEC to provide “grants, revolving loans,
loan guarantees, loans, or other appropriate measures . . . that transform California’s fuel and
vehicle types to help attain the state’s climate change goals.”32 In the past, CEC has used the
following mechanisms:
• PONs: funding opportunities that result in grants
32 AB No. 118, Alternative Fuels and Vehicles Technology Program, 2007, Sec 4., 44272. a.

23
• interagency agreements (IAs): typically contracts with federal or local government
agencies, University of California campuses, and National Labs
• request for proposals/request for qualifications/invitations for bids (RFP/RFQ/IFB):
competitively sourced opportunities, typically for work that supports CEC operations
• other: includes sponsorships, memberships, reporting, and student assistantships.
CEC project officers are encouraged to use a combination of these tools. However, from April
2009 to January 2015 (the period covered by this study), PONs accounted for 83 percent of
ARFVTP funds allocated (Table 2.4). Thus, the remainder of this analysis focuses on PONs.
Table 2.4. Types of Funding Mechanisms Employed by the ARFVTP, April 2009–January 2015
Funding Mechanism Number of
Awards Percentage of
Awards Percentage of
Funds Awarded PONs 272 90 83
IAs 26 9 17
RFP/RFQ/IFB 1 <0.5 <0.5
Other 4 1 <0.5
Total 303 100 100 SOURCE: RAND analysis of CEC administrative data. NOTE: Percentages in columns may not add up to 100 percent due to rounding.
2.6 Attracting Applicants
Attracting high-quality applicants is key to translating investment plans into projects and,
ultimately, to reducing barriers to commercialization and improving air quality. Awardees must
possess the technical and managerial acumen to execute projects and, ideally, either be able to
take the idea to scale themselves or act as a catalyst for others to do so. Program documents
also state that CEC seeks to ensure that applicants from a diverse set of perspectives have the
opportunity to participate in the program, including small businesses, women, minorities, and
disabled veterans, as well as disadvantaged and underrepresented communities from a diverse
range of geographical regions.33
Review of program documents and staff interviews suggest that CEC uses a number of
approaches to reach potential applicants and encourage applications. For instance, it uses its
website and listserv to advertise funding opportunities. But it also engages in more proactive
outreach, including the workshops described earlier and visits to meetings of relevant
professional and industry associations. Finally, CEC documents and staff indicate that the
agency makes special efforts to reach out to underrepresented groups, including, for example,
33 For example, see CEC, 2016–2017 Investment Plan for the Alternative and Renewable Fuel and Vehicle Technology Program, 2016, p. 15. Another example of the intent to seek regional balance is found in PON-13-605, which notes that “[t]he Energy Commission expects to make at least three awards of up to $1,566,667 each to be distributed among Northern California, Central California, and Southern California” (p. 2).

24
African Americans, Hispanics, Asian chambers of commerce, and the Association of Women in
Water, Energy, Environment.34
2.6.1 How People Learn About the Program
Assessing CEC’s outreach ideally would involve knowing who should be aware of the ARFVTP
and comparing that with the number who actually are. While identifying all such individuals
and organizations is difficult and probably impossible, as discussed, our survey sample
attempts to approximate this by developing a list of “potential applicants” (see Chapter One for
details). Seventy-three (61 percent) of the 11635 potential applicants responding to the survey
said they had heard of the ARFVTP program prior to taking the survey, which provides a useful
if highly imperfect measure of outreach. It is difficult to judge whether this percentage is
sufficiently high, given uncertainties in whether potential applicant survey respondents are
truly among those who “should” know about the program and in the absence of data that would
allow clear comparisons with similar programs. However, the majority of awardees interviewed
for this project indicated that the ARFVTP is well known in their industries. For instance, one
hydrogen awardee said the program is “absolutely well-known” and that outreach does not
need to be improved. However, this respondent believed that federal programs and programs in
other states should do more to reach potential applicants in California. Similarly, an electricity-
related awardee said the ARFVTP is well known both by the EV industry and “local
governmental organizations” but is not as well known as other CEC programs. Still, this
awardee believed that “outreach is quite good.” However, another awardee in the electricity area
believes there are many local agencies and small private companies that are not yet aware of
the program and that could benefit from it. In short, it appears the program is reasonably well
known, perhaps with some exceptions.
The survey also asked all respondents (applicants and potential applicants alike) how they
heard about ARFVTP to understand which of the outreach mechanisms described earlier appear
most effective. As shown in Table 2.5, by far the most common mechanism was the CEC
website or mailing list (34 percent), followed by industry groups (20 percent) and professional
organizations and colleagues (19 percent). But there were variations among fuel type.
Respondents at organizations involved with hydrogen fuels were more likely than others to
report hearing about ARFVTP through professional organizations or colleagues. Respondents at
organizations connected with gasoline substitutes, for instance, were more likely (43 percent)
than others to hear about the program through the CEC’s website and mailing list and through
professional organizations or colleagues (though there were relatively few gasoline-substitutes
responses overall). Similarly, respondents at organizations connected with hydrogen fuels were
the most likely to hear about the program through industry groups (31 percent) or other public
agencies (22 percent).
34See, for example, CEC, 2016,California Energy Commission, 2016–2017 Investment Plan for the Alternative and Renewable Fuel and Vehicle Technology Program, 2016, pp. 15–16. 35Another seven potential applicants responded to the survey but did not provide an answer to this particular question.

25
Table 2.5. How People Heard About the Program (Percentage Responding to the Question: How Did You Hear About the ARFVTP?)
How Heard About ARFVTP
Across All Fuel Types
Diesel Substitutes Electricity
Gasoline Substitutes Hydrogen
Natural Gas and
Biomethane Multifuel CEC website or mailing list 34 31 36 43 26 41 29
Industry group 20 20 15 17 31 16 25 Professional organization or colleague
19 19 20 35 17 20 17
Internet search 7 14 7 0 0 9 7 Another public agency 14 12 14 4 22 10 18
Other 5 4 6 0 4 4 5 Local technology incubator
1 0 1 0 0 0 0
SOURCE: RAND survey. NOTE: Data are percentage of mentions out of a total of 793 responses provided by awardees, unsuccessful applicants, and potential applicants. Respondents could select all that apply.
2.6.2 Perceptions About Applicant Requirements
Potential applicants’ willingness to apply might be affected by their perceptions about the
clarity of proposal requirements. One challenge here is striking an appropriate balance between
making the application process user-friendly while eliciting enough information to determine
whether applicants’ ideas can succeed and whether applicant organizations would be
responsible stewards of state funds.
Based on our survey results, most respondents believed that application requirements were
clearly specified ahead of time (Table 2.6). Some 79 percent of survey respondents either
somewhat agreed or strongly agreed that that CEC had provided adequate information about
proposal requirements; however, gasoline-substitutes respondents were less likely to agree than
others, with 60 percent either somewhat or strongly agreeing. One interviewee concerned about
the burden of applications said that his organization needed to set aside a considerable amount
of resources to cover the costs of completing the application. And another interviewee worried
that application requirements favor larger, more grant-savvy organizations and might be
daunting to smaller ones. However, another applicant with many years of experience interacting
with CEC said that the introduction of an electronic application process had created “huge
improvements” for applicants.

26
Table 2.6. Clarity with Which CEC Communicated Proposal Requirements (Percentage Responding to the Question: Did CEC Provide Adequate Information About the Applications and
Proposal Evaluation Criteria for the Program?)
All Fuel Types
Diesel Substitutes Electricity
Gasoline Substitutes Hydrogen
Natural Gas and
Biomethane Multifuel Strongly disagree 1 3 1 0 3 0 3
Somewhat disagree 2 5 1 0 3 1 3
Neither agree nor disagree 12 5 12 35 3 10 21
Somewhat agree 36 44 34 40 29 36 41
Strongly agree 43 33 49 20 57 45 31 No response 5 10 4 5 6 8 3
SOURCE: RAND survey. NOTE: Based on sample of 358 applicants (including unsuccessful applicants). Percentages in columns may not add up to 100 because of rounding.
2.6.3 PON Subscription Rates
Perceptions of the application process notwithstanding, perhaps the most important indicator
of outreach is whether the PONs do, in fact, attract a healthy number of applicants. To assess
this, we constructed a metric called subscription rate, which is the total dollar value of all
proposals (amount requested) divided by the total amount of money available for a given PON.
Subscription rates for all PONs issued between April 2009 and January 2015 are shown in
chronological order (from left to right) along the x-axis in Figure 2.3. The dotted line indicates a
subscription rate of 1, which means the amount requested equaled the amount available. As
evident in the figure, the majority of PONs attracted requests for more funds than were
available (i.e., were “oversubscribed”)—often by a wide margin. The most oversubscribed PON
was PON-09-004 (Medium and Heavy Duty Advanced Vehicle Technology), for which applicants
requested almost 15 times the amount authorized.
The PONs with the lowest subscription rates were PON-09-608 (0.95) and PON-12-606 (0.88),
which were for hydrogen fuel infrastructure. Several interviewees said these PONs served as an
opportunity to learn, resulting in improved design of subsequent PONs for the hydrogen fuel
path. Specifically, there was a “chicken-and-egg” problem with hydrogen filling stations—
without fueling stations, consumers were unlikely to buy hydrogen vehicles, but without
enough of the vehicles on the road, there is not enough demand to make operating the stations
profitable. Thus, in the later PONs, CEC allowed grantees to recover operating and maintenance
costs to help create a short-turn business case for station operation in the hopes that this
would induce more consumers to purchase the vehicles. Indeed, the subscription rate for PON-
13-607 was 5.18, more than five times the rate for the earlier hydrogen infrastructure PONs. On
the whole, then, CEC appears to have had little trouble attracting applications.

27
Figure 2.3. PON Subscription Rates
SOURCE: RAND analysis of administrative data provided by CEC.
2.6.4 Repeat Applicants
High subscription rates might not be a sign of effective outreach if a small cluster of
organizations is responsible for the lion’s share of applications. To assess the breadth of the
applicant pool, we examined the number of repeat applicants. Table 2.7 shows the percentage
of applicants (out of a total of 490) who submitted one, two, three, four, and five or more
applications. As shown in Table 2.7, 30 percent submitted two or more applications. We are not
aware of any normative benchmarks against which to judge whether this number of
applications is acceptable. However, it does appear to reflect a balance between having a core
group of repeat applicants (which might reflect satisfaction with the program or possibly a lack
of viable alternatives) and reaching a fairly broad range of applicants.
Table 2.7. Repeat Applicants
Number of Applications Submitted Number of Applicants Percentage of Applicants
1 343 70% 2 69 14% 3 28 6% 4 22 4%
5 or more 28 6% All applicants 490 100%
SOURCE: RAND analysis.
2.7 Evaluating and Selecting Among Applications
After CEC receives applications, it must evaluate them. In this section, we describe how
evaluators are selected and trained and the criteria used to evaluate proposals. The remainder
14.70
5.18
0
2
4
6
8
10
12
14
16
Amount requested/amount available
0.95 0.88

28
of this chapter analyzes key steps in the process of reviewing applications and executing
awards. The major steps in that process are illustrated in Figure 2.4.
Figure 2.4. Major Steps in the Process for Reviewing Proposals and Executing Awards
SOURCE: Authors.
2.7.1 Evaluators
Applications are evaluated by teams of evaluators comprising CEC staff. Evaluation teams often
solicit reviews from staff in other agencies and from contractors retained to provide specific
types of expertise. However, only CEC staff members are permitted to formally rate
applications. Given the challenge of finding awardees with both sufficient technical and
business acumen, CEC seeks reviews from individuals with those backgrounds. However, one
respondent noted that relatively few CEC staff members have a strong business background,
and several noted that evaluating applicants’ viability as businesses is one of the more
challenging aspects of evaluating applications. Individuals new to the evaluation process
shadow more-experienced staff to observe and learn about the evaluation process before being
invited to submit evaluation scores that count toward final decisions on applications.
2.7.2 Evaluation Process
Evaluation teams assess applications against an explicit set of criteria publicized ahead of time
in the PONs. Applicants assess performance on each criterion using a ten-point scale. Each
criterion is given a weight (publicized in PONs), and each of the criterion scores is multiplied by
the weight to generate an overall score. Typically, applications must get at least 70 percent of

29
the points for each category to be considered for funding. If no applicants exceed the minimum
threshold score, no funds are allocated.
Evaluation teams meet initially to go over the scoring criteria. Next, they score each application
individually and then meet again to compare scores and discuss any discrepancies to ensure
that evaluators understood and applied the criteria consistently and that they understood the
application itself completely and correctly. One respondent noted that because, in many
instances, at least some of the evaluators were involved in writing the original PON, those
evaluators have a clear understanding of the intent behind the PON as well as the criteria
announced in the PON.
Typically, there is no back and forth between the evaluation team and applicants during the
scoring process; thus, evaluators do not have the opportunity to ask questions about portions
of the applications they find unclear. But applicants can request feedback on why applications
were rejected. One respondent estimated that this occurred with about half of applications, but
we did not attempt to verify this through program records. Recently, the process was changed
to allow for a two-stage application process, in which applicants receive feedback on a short
abstract before submitting a full proposal.
2.7.3 Evaluation Criteria
Given the wide variety of activities the ARFVTP funds, it is perhaps not surprising that the
criteria vary considerably from PON to PON. However, most PONs include criteria related to
project team qualifications, project readiness, cost-effectiveness, appropriate cost share, the
plausibility of the project implementation plan, and whether the project is likely to lead to a
market transformation. In addition, for projects related to fuel production, there are often
criteria related to output or other measures of production volume. According to CEC staff,
criteria are drawn from the language in AB 118, generic criteria applied to most state contracts
(e.g., on team qualifications), and lessons learned from past projects.
We asked survey respondents to assess the appropriateness of the criteria used to evaluate
applications (Table 2.8). Overall, 66 percent either somewhat agreed or strongly agreed and only
6 percent somewhat disagreed or strongly disagreed (20 percent neither agreed nor disagreed).
However, only 45 percent of gasoline-substitutes respondents somewhat or strongly agreed,
indicating considerably lower levels of satisfaction. Interviews with awardees provided some
additional perspectives. One interviewee, for instance, expressed concerns about whether CEC
staff members possess the business and operational expertise to adequately evaluate the
implementability of project proposals. Specifically, this person noted that the program “attracts
people with no experience building anything” and that “CEC needs to put more (or even some)
weight on whether [the] person can carry out the grant.” Another respondent was concerned
that too much weight in the evaluation process is given to projections of project performance
that are (by necessity) highly uncertain. For the most part, however, interviewees expressed few
concerns about the process for evaluating applications.

30
Table 2.8. Satisfaction with Proposal Evaluation Criteria (Percentage Agreeing/Disagreeing with the Statement: The Criteria and Weights Used by CEC to Evaluate the Grant Applications Were
Appropriate)
All Fuel Types
Diesel Substitutes Electricity
Gasoline Substitutes Hydrogen
Natural Gas and
Biomethane Multifuel Strongly disagree 1 5 0 0 3 1 3
Somewhat disagree 5 10 2 20 8 1 10
Neither agree nor disagree 21 10 22 30 17 20 28
Somewhat agree 33 44 31 35 25 29 35
Strongly agree 33 20 40 10 39 34 20 No response 6 10 5 5 8 15 5
SOURCE: RAND survey. NOTE: Based on sample of 358 applicants (including unsuccessful applicants). Percentages may not add up to 100 percent because of rounding.
2.7.4 Proposal Success Rate
During the period covered by this evaluation, the ARFVTP received 1,076 proposals. A small
number (30) were not competitively bid. Excluding these from the analysis, the overall success
rate for proposals was 26 percent (Table 2.9). The highest success rate was for natural gas and
biomethane (42 percent), and the lowest were multifuel and other (13 percent) and hydrogen
(16 percent).
Table 2.9. Proposal Success Rates
Fuel Type
Number of Successful Proposals
Total Number of Proposals
Percentage Successful
Hydrogen 27 169 16
Electricity 119 458 26
Diesel substitutes 24 99 24
Gasoline substitutes 18 62 29
Natural gas and biomethane 75 179 42
Multifuel and other 10 79 13 All competitively bid proposals 273 1,046a 26
SOURCE: RAND analysis of CEC administrative data. a Excludes 30 proposals that were not competitively bid.
2.8 Match Funding
ARFVTP grants typically require that awardees bear a considerable portion of the total cost of a
funded project. Applicants can put up cash, real estate, or other assets with a tangible dollar
value. The target match share is announced in the PON and is usually included in the criteria
used to evaluate applications. The match helps ensure a sufficiently high level of commitment

31
and encourages awardees to propose projects they believe can continue to survive after grant
funds have been exhausted.
During interviews, CEC staff noted that the typical match requirement is 50 percent but that it
varies depending on the nature of the project. For instance, projects seeking to develop
technologies or markets with lower levels of current profitability—and, hence, higher levels of
risk to awardees—typically have lower cost-share requirements. An example is hydrogen-fueling
stations, where demand is typically still too low to recoup operating costs. For instance, a 2013
PON on hydrogen infrastructure (PON-13-607) required that awardees provide 30 percent of
total funds. Similarly, projects that directly relate to policy priorities might be subject to lower
match requirements to provide extra encouragement to awardees in a position to help pursue
the goal. For instance, the CEC has a goal of building out the electrical charging infrastructure
to the point where EVs can travel California’s north–south corridor. Thus, PON 13-606 required
a 50-percent match share for workplace and occupant-owned charging stations without public
access but only a 25-percent match share for corridor charging stations. Then again, the match
(as a percentage) may be lower for projects with high overall dollar values. For instance, one
respondent noted that CEC providing a 50-percent match share for a very large project—for
instance, a $100 million production facility—would not be feasible, because it would consume
half the annual ARFVTP investment budget. In such cases, the applicant cost-share requirement
would need to be higher. A less-dramatic example is a 2010 PON on hydrogen infrastructure
(PON-09-608), which required a 30-percent match share for projects whose total value was $1
million or less, but a 40-percent match share for $2 million projects, a 50-percent match share
for $3 million projects, and a 60-percent match share for projects that cost more than $3
million.
Table 2.10 shows actual match shares (i.e., match contributed by awardee divided by total
project cost) committed to by awardees for the funded projects (the proposed match). In some
cases, awardees propose a higher match than required by the PON to increase the chances they
will receive ARFVPT funding. The first column reports the percentage of projects for which
there is no match proposed. The remaining columns report the mean, median, and standard
deviation of the match in those cases where the awardee has proposed a match. Subsequent
chapters will examine the extent to which awardees have actually obtained the proposed match.
The top row of the table shows that, across all projects, 19 percent did not have a proposed
match. The typical match share for projects with a match closely approximates the 50 percent
targeted in many PONS (mean = 52 percent, median = 51 percent). However, there was variation
that reflects the sorts of differences in requirements noted earlier. For instance, hydrogen
projects had considerably lower average matches (mean = 37 percent) than those in other fuel
types. Similarly, actual match shares for regional readiness products were considerably lower
(mean = 26 percent) than match shares for other parts of the supply chain. Among fuel types,
the highest actual match shares were for diesel substitutes (62 percent) and gasoline
substitutes (mean = 64 percent). Among positions in the supply chain, the highest actual match
share was for fuel development/production (mean = 61 percent).

32
Table 2.10. Proposed Match Share for Projects, 2010–2015 (Percentage)
Proposed Match Share for Projects with Match
Project Type
Percentage of Projects with
No Match Mean Median Standard Deviation
Number of Projects
All projects 19% 52 51 21 265 By Fuel Type
Diesel substitutes 5% 62 62 7 22 Electricity 16% 47 50 21 116 Gasoline substitutes 28% 64 57 16 18 Hydrogen 41% 37 35 15 27 Natural gas and biomethane 14% 63 66 16 69 Workforce 100% — — — 3 Multifuel and other 10% 28 17 17 10
By Phase RD&D 25% 58 56 14 60 PD&D 18% 54 54 21 181 Regional readiness 0% 26 20 16 18 Workforce 100% — — — 3 Other 0% 51 50 1 3
By Position in Supply Chain Fuel development or production 14% 61 61 11 44
Fueling or charging infrastructure 17% 51 50 22 145
Regional readiness 0% 26 20 15 18 Vehicle or component development, demonstration, deployment, or production
28% 59 55 16 50
Technical assistance to CEC 100% — — — 1 Workforce development 100% — — — 3 Other 40% 51 50 1 5 SOURCE: RAND analysis. NOTE: Analysis includes 265 projects for which information on proposed match share was available.
2.9 Time to Review Applications and Execute Agreements
Selecting applicants marks the beginning of project execution. Here, the challenge for CEC is to
review applications with enough care to ensure that proposed projects represent worthy uses of
public funds, but without moving so slowly as to hinder grantees in actualizing opportunities to
pursue commercialization and other opportunities. We heard concerns from CEC and grantees
alike that the time required to review and award grants is too long given the speed at which
market conditions change. As one interviewee put it, “From the time we see an opportunity out
there we’ll try to align it with our product plan/strategy. But we often need to go faster than the
PON-to-contract time line.” To assess how generalizable such claims are, we first examined how
long it takes to review applications, specifically the amount of time between the application
deadline and the notice of proposed award (NOPA).
Overall, the average time is a little over four months (see first row of Table 2.11), and about 85
percent of the projects are reviewed (but have not yet received a final agreement) by the first
six months (not shown). But there is considerable variation, with a range of one to eight
months. Statistical analysis suggests that differences among fuel types and portions of market

33
segment are statistically significant but that differences among different phases in the
technology development phase continuum are not. Among fuel pathways, hydrogen and
gasoline-substitutes projects have the longest review times, while multifuel projects have the
shortest. However, it is not clear why this is the case. As for market segment, fueling
infrastructure projects have lower average review times than fuel development or production
projects (mean of 116 versus 148 days, respectively). This might be expected given that
deploying electricity, hydrogen, or other dispensing stations is not particularly complex from a
technical point of view. However, patterns such as these are difficult to interpret with any
certainty. Thus, these findings should be taken as suggestive but not conclusive.
Table 2.11. Time to Review Applications (in Days)
Project Category Mean Median Standard Deviation
All Applications 122 126 62 Fuel Typea
Diesel substitutes 152 144 52 Electricity 102 71 50 Gasoline substitutes 156 147 53 Hydrogen 181 245 86 Natural gas and biomethane 115 126 55 Multifuel/other 83 84 31
Market Segmentb Fuel development or production 148 144 60 Fueling or charging infrastructure 116 126 63 Vehicle or component development, demonstration 121 126 55 Other 72 84 24
Technology Development Phase RD&D 126 126 58 PD&D 122 126 63 Other 72 84 24
SOURCE: RAND analysis of CEC administrative data. a Kruskal-Wallis test, p < 0.001. b Kruskal-Wallis test, p = 0.02 We now turn to the time to award a contract (i.e., NOPA to agreement start date); overall, the
average time elapsed is approximately 8.5 months (255 days; see first row of Table 2.12), with
about 80 percent of the projects having a contract by the first year (not shown). But the range is
even higher than for time to review applications—one month to four years. Differences by
market segment and phase in the technology-development phase are statistically significant,
but differences among fuel pathways are not. Once again, fuel development and production
projects had longer times. These differences notwithstanding, interviews with CEC staff suggest
long delays in time to award contracts are often because awardees are slow in providing needed
documents. However, we did not seek to verify this with awardees.

34
Table 2.12. Time to Award Contracts (in days)
Project Type Mean Median Standard Deviation
All Applications 255 188 190 Fuel Type
Diesel substitutes 240 293 156 Electricity 227 165 166 Gasoline substitutes 339 307 219 Hydrogen 207 160 126 Natural gas and biomethane 317 262 245 Multifuel/other 223 188 103
Market Segmenta Fuel development or production 326 251 303 Fueling or charging infrastructure 225 160 152 Vehicle or component development, demonstration 286 250 175 Other 180 188 41
Technology Development Phaseb RD&D 306 262 183 PD&D 241 160 193 Other 180 188 41
SOURCE: RAND analysis. a Kruskal-Wallis test, p = 0.08. b Kruskal-Wallis test, p = 0.02. Taking these two analyses together, the average time elapsed between a PON’s application
deadline and the project start date is approximately one year, with a median of approximately
ten months. However, as shown in Figure 2.5, there is evidence that the amount of time
required has been decreasing over time, which may have resulted from CEC staff gaining more
experience in running the program.
Figure 2.5. Changes Over Time in Review Time
SOURCE: RAND analysis.
0
100
200
300
400
500
600
2010 2011 2012 2013 2014
Num
ber o
f days
Year of NOPA
Time to review (median)
Time to contract (median)
Sum of review + contract (median)

35
2.10 Overseeing Agreements
In this section, we discuss invoicing and project managers.
2.10.1 Invoicing
Once projects are awarded, CEC staff must process invoices and provide technical assistance as
issues arise on projects. Beginning with invoicing, many awardee organizations are small
businesses that are perhaps not familiar with or well-equipped to manage invoicing and
reporting processes that go with receiving public funds and the attendant need for public
accountability. Thus, we asked survey respondents to assess invoicing burdens. Perhaps not
surprisingly, 56 percent of respondents either somewhat or strongly agreed with the statement
“CEC’s reporting and invoicing requirements for this grant were burdensome” (Figure 2.6).
However, given the number of questions on the survey, we were unable to add additional items
to probe more deeply to understand how CEC’s requirements compare with those of other
funders, particularly public-sector ones.
We also asked survey respondents to indicate whether CEC tended to pay invoices on time.
Overall, 65 percent of respondents either agreed or strongly agreed that invoices were paid on
time (Table 2.13). Fifteen percent neither agreed nor disagreed, and 14 percent either disagreed
or strongly disagreed. The remaining 5 percent chose not to respond. We also found differences
among fuel types, with gasoline-substitutes respondents least likely to agree. Respondents
associated with hydrogen, methane, and multifuel projects were the most likely to agree; in
each category, approximately three-quarters somewhat or strongly agreed.
Figure 2.6. Burdensomeness of Invoicing Requirements (Percentage Agreeing with the Statement: “CEC’s Reporting and Invoicing Requirements for This Grant Were Burdensome”)
SOURCE: RAND survey. NOTE: Based on 240 respondents representing completed, ongoing, and canceled projects.
4%
13%
22%
34%
22%
6%
0%
5%
10%
15%
20%
25%
30%
35%
40%
45%
Strongly disagree Somewhat disagree
Neither agree or disagree
Somewhat agree Strongly agree No response

36
Table 2.13. Timely Payment of Invoices (Percentage Responding to Question: Did CEC Pay Project Invoices in a Timely Manner?)
All Fuel Types
Diesel Substitutes Electricity
Gasoline Substitutes Hydrogen
Natural Gas and
Biomethane Multifuel Strongly disagree 6 6 8 30 3 2 0 Somewhat disagree 8 13 12 10 10 0 0 Neither agree nor disagree 15 6 17 20 6 15 23
Somewhat agree 29 38 31 20 32 24 31 Strongly agree 36 31 30 10 42 49 46 No response 5 6 2 10 6 10 0
SOURCE: RAND survey. NOTES: Based on 223 respondents representing completed, ongoing, and canceled projects. Percentages may not add up to 100 percent because of rounding.
Of those who either disagreed or strongly disagreed, we asked about the consequences of late
payments for their companies (not shown). Forty-eight percent said it caused “some burden,”
and 23 percent said it caused “a major burden.” The remainder chose not to answer. While it is
impossible to say for sure, this may suggest that the remaining respondents had few concerns
about the impact of payment delays. When asked about the consequences of invoicing delays,
some interviewees reflected on the consequences for subcontractors (to whom payments may
be delayed) and on the need for awardees to have access to some sort of cash reserve to cover
temporary shortfalls resulting from the delays.
Finally, we also asked respondents to provide feedback on the practice of withholding
10 percent of payments until all grant requirements have been satisfied, regardless of how long
it takes. This helps ensure that awardees provide the work products they promised. Overall,
30 percent said withholding payment had some or a substantial impact on their organizations
(Table 2.14). As one interviewee noted, “this is very hard on a small company to need to front
[an] investment with suppliers.” Another noted that “for a larger project that 10 percent really
accumulates and creates cash flow issues.” The largest reported effects were in diesel
substitutes and hydrogen, where the percentage of those reporting “some” or “substantial”
impacts was 63 and 42 percent, respectively.
37
Table 2.14. Effects of Payment Withholds (Percentage Responding to the Question: What Were the Effects of 10 Percent Invoice Payment Retention on the Finances of Your Organization?)
All Fuel Types
Diesel Substitutes Electricity
Gasoline Substitutes Hydrogen
Natural Gas and
Biomethane Multifuel No real impact 56 31 62 60 42 56 62 Caused some financial difficulties
26 50 24 20 29 20 23
Caused substantial financial difficulties
4 13 3 0 13 0 0
Do not know 10 0 8 10 10 16 8 No response 5 6 2 10 6 7 8 SOURCE: RAND survey. NOTES: Based on 223 respondents representing completed, ongoing, and canceled projects. Percentages may not add up to 100 percent because of rounding.
2.10.2 Project Managers
Project managers (i.e., CAMs) play a critical role in helping awardees understand and comply
with funding requirements, identify and help solve problems, and provide oversight on awardee
performance. In this sense, they serve as intermediaries between the program and awardees.
Thus, we asked respondents whether they were satisfied with their project managers. Overall,
83 percent of respondents somewhat or strongly agreed that their CAMs were helpful and
informed (Figure 2.7). We found no significant differences in satisfaction across fuel types. In
addition, many interviewees spoke warmly of their CAMs. Some said their CAMs were
“excellent” or “great” and more generally complimented the quality of people involved in
running the program. But a small number offered a more mixed picture. One interviewee, for
instance, believed that his/her CAM lacked some of the specialist knowledge needed to fully
understand the project. And another interviewee reported liking some of his or her project’s
CAMs but not others, which brings us to the topic of CAM turnover.
A certain amount of turnover in project managers is necessary and perhaps even desirable as
CEC staff advance to new positions or leave the agency. But too much turnover can clearly
cause problems. A small number of interviewees raised concerns about turnover. One called
turnover “a big problem,” and another recounted spending a considerable amount of time
getting a new CAM up to speed on a project, suggesting that the new CAM had not been fully
briefed by the outgoing one. Yet the survey data suggest that CAM turnover is not a serious
problem for most grantees. As shown in Figure 2.8, half of respondents (50 percent) reported
having two or more CAMs during their projects. Another 40 percent reporting having only one
CAM, and 10 percent did not provide an answer to this question. The majority (62 percent) of
those who did report CAM turnover also indicated that it had “no real impact” (Figure 2.9).
Another 17 percent said it had “some impact,” while only 5 percent said it had a “major
impact.” Sixteen percent, however, did not answer the question.
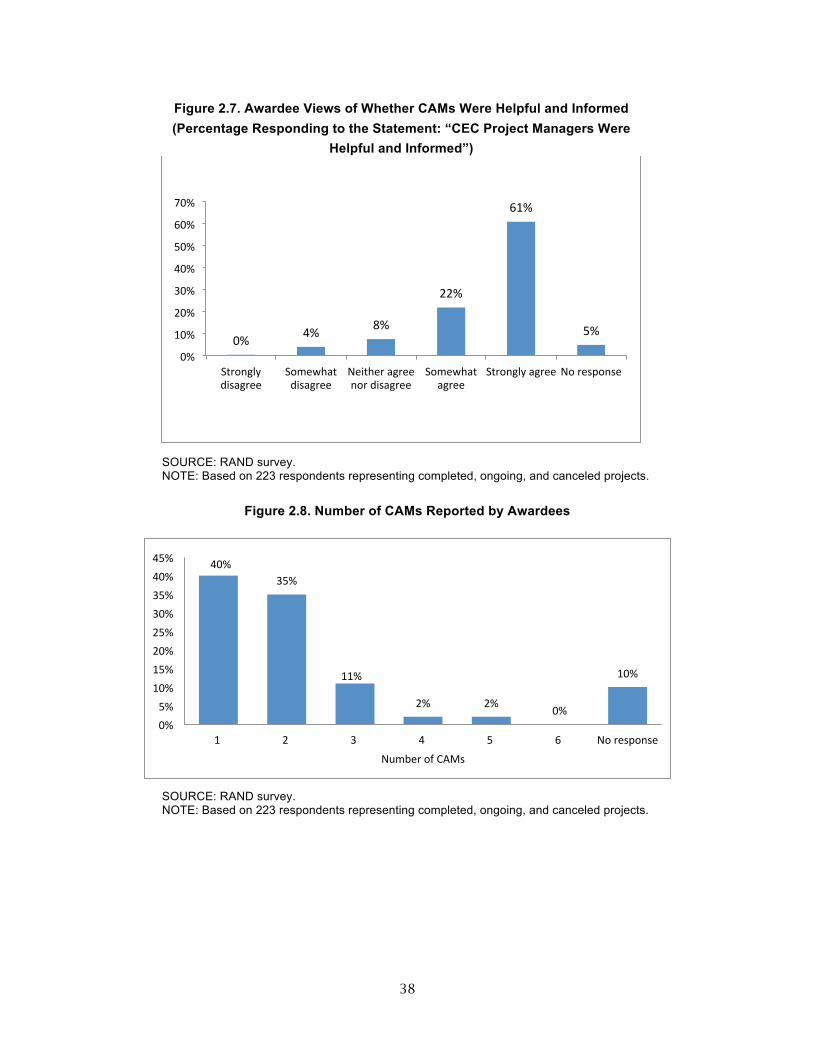
38
Figure 2.7. Awardee Views of Whether CAMs Were Helpful and Informed (Percentage Responding to the Statement: “CEC Project Managers Were
Helpful and Informed”)
SOURCE: RAND survey. NOTE: Based on 223 respondents representing completed, ongoing, and canceled projects.
Figure 2.8. Number of CAMs Reported by Awardees
SOURCE: RAND survey. NOTE: Based on 223 respondents representing completed, ongoing, and canceled projects.
0% 4% 8%
22%
61%
5%
0%
10%
20%
30%
40%
50%
60%
70%
Strongly disagree
Somewhat disagree
Neither agree nor disagree
Somewhat agree
Strongly agree No response
40% 35%
11%
2% 2% 0%
10%
0% 5% 10% 15% 20% 25% 30% 35% 40% 45%
1 2 3 4 5 6 No response
Number of CAMs

39
Figure 2.9. Impact of CAM Turnover (Percentage Responding to the Question: “What Was the Effect of CEC Project Manager Turnover on
Administrative Cost and Project Schedule?”)
SOURCE: RAND survey. NOTE: Based on 133 respondents representing completed, ongoing, and canceled projects who reported more than one CAM.
While attitudes toward CAMs were fairly positive, attitudes toward some of the specific
reporting requirements involved in the grants were more mixed (not shown). Generally,
respondents indicated that reporting requirements for project performance were reasonable. A
handful of respondents noted that the reports are detailed, but that once the grantee fills the
first one out, it is relatively straightforward to continue doing so in the future. For instance, one
respondent characterized them as “very prescriptive, but once you’re up and running it’s
easier.” Another noted that ARFVTP reporting templates are easier than those associated with
federal grants. However, respondents were more critical of financial reporting templates, which
many regarded as excessively detailed.
A few recounted difficulties getting approval for what they regarded as minor changes in the
details of projects. One appreciated the money provided through the program but characterized
it as “golden handcuffs,” adding that once the grant agreement is in place “you’re locked into
your plan.” One interviewee, for instance, recounted difficulties getting approval for changes in
staffing (after people went on to other jobs and needed to be replaced) and salary increases (i.e.,
through normal career advancement). Another interviewee associated with a fueling station
project noted that during the project he learned that some regions were more receptive to
dispensing sites than others but that adjusting the terms of the agreement to reflect this
proved difficult.
Responses to the survey suggest that concerns about CEC’s process for agreement
modifications might be widespread. Specifically, as shown in Table 2.15, 34 percent of
1%
62%
17% 5%
16%
0% 10% 20% 30% 40% 50% 60% 70%
Reduced admin costs/delays
No real impact Some increase in admin. costs/
delays
Substan5al increase in admin costs/
delay
No response

40
respondents somewhat or strongly agreed with the statement, “CEC’s process for approving
project modifications has been burdensome”; and as also shown in Table 2.15, 93 percent said
that this had “some impact” or a “substantial impact.” A substantial percentage of respondents
did not respond to the first question, perhaps because many had not requested a project
modification.
Table 2.15. How Burdensome Was the Process for Approving Project Modifications, and What Was the Impact?
Percentage Agreeing That CEC’s Process for Approving Project Modifications Has Been
Burdensomea
Percentage Describing the Impact of Approval Process on Administrative Cost and Project
Scheduleb Strongly disagree 2 No impact 6 Somewhat disagree 4 Some impact 66 Neither agree nor disagree 15 Substantial impact 27 Somewhat agree 20 No response 0 Strongly agree 14 No response 45 SOURCE: RAND survey. NOTE: Percentages in columns may not add up because of rounding. a Based on 223 respondents representing completed, ongoing, and canceled projects. b Based on 77 respondents who responded “somewhat agree” or “strongly agree” to question in left column. Finally, we asked respondents to indicate whether, given their experiences, they would apply
again. Approximately three-fourths (78 percent) said yes, while 14 percent said maybe (Table
2.16). Overall, only 3 percent said no, while the remaining 4 percent did not answer. However,
gasoline-substitutes respondents were more ambivalent about the program, with only 30
percent answering yes to this question. But 70 percent said maybe, and none said no, which
does not suggest a clear rejection of the program. One respondent allowed that some of the
administrative requirements were burdensome but that “overall the program is good.” Another
noted that “overall I’m pleased with the program and the help we’ve been able to get.”
Table 2.16. Would Respondents Apply Again? (Percentage Responding to the Question: Given Your Experience with the ARFVTP Program, Would You Apply for Funding from CEC Again?)
All Fuel Types
Diesel Substitutes Electricity
Gasoline Substitutes Hydrogen
Natural Gas and
Biomethane Multifuel No 3 0 5 0 3 0 8 Yes 78 81 78 30 87 81 77 Maybe 14 12 15 70 3 13 8 No response 4 6 2 0 6 6 8
SOURCE: RAND survey. NOTE: Based on 222 respondents who have applied for or received nonterminated awards. Percentages may not add up to 100 percent because of rounding.
2.10.3 Progress Monitoring and Data Collection
Award agreements include several elements designed to allow CEC to monitor project progress
and to obtain relevant project data. These include a kick-off meeting, monthly progress reports,
critical project review meetings, a final project meeting, and a final project report. In addition
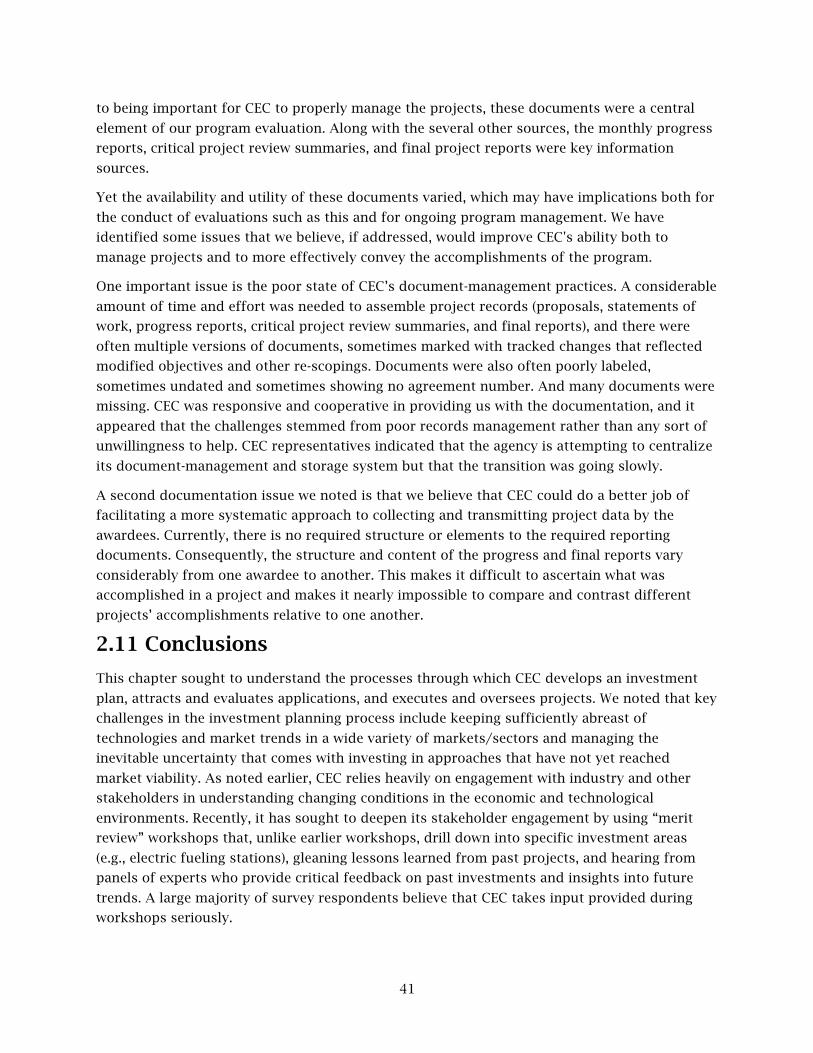
41
to being important for CEC to properly manage the projects, these documents were a central
element of our program evaluation. Along with the several other sources, the monthly progress
reports, critical project review summaries, and final project reports were key information
sources.
Yet the availability and utility of these documents varied, which may have implications both for
the conduct of evaluations such as this and for ongoing program management. We have
identified some issues that we believe, if addressed, would improve CEC's ability both to
manage projects and to more effectively convey the accomplishments of the program.
One important issue is the poor state of CEC’s document-management practices. A considerable
amount of time and effort was needed to assemble project records (proposals, statements of
work, progress reports, critical project review summaries, and final reports), and there were
often multiple versions of documents, sometimes marked with tracked changes that reflected
modified objectives and other re-scopings. Documents were also often poorly labeled,
sometimes undated and sometimes showing no agreement number. And many documents were
missing. CEC was responsive and cooperative in providing us with the documentation, and it
appeared that the challenges stemmed from poor records management rather than any sort of
unwillingness to help. CEC representatives indicated that the agency is attempting to centralize
its document-management and storage system but that the transition was going slowly.
A second documentation issue we noted is that we believe that CEC could do a better job of
facilitating a more systematic approach to collecting and transmitting project data by the
awardees. Currently, there is no required structure or elements to the required reporting
documents. Consequently, the structure and content of the progress and final reports vary
considerably from one awardee to another. This makes it difficult to ascertain what was
accomplished in a project and makes it nearly impossible to compare and contrast different
projects’ accomplishments relative to one another.
2.11 Conclusions
This chapter sought to understand the processes through which CEC develops an investment
plan, attracts and evaluates applications, and executes and oversees projects. We noted that key
challenges in the investment planning process include keeping sufficiently abreast of
technologies and market trends in a wide variety of markets/sectors and managing the
inevitable uncertainty that comes with investing in approaches that have not yet reached
market viability. As noted earlier, CEC relies heavily on engagement with industry and other
stakeholders in understanding changing conditions in the economic and technological
environments. Recently, it has sought to deepen its stakeholder engagement by using “merit
review” workshops that, unlike earlier workshops, drill down into specific investment areas
(e.g., electric fueling stations), gleaning lessons learned from past projects, and hearing from
panels of experts who provide critical feedback on past investments and insights into future
trends. A large majority of survey respondents believe that CEC takes input provided during
workshops seriously.

42
Once the investment plan is developed, the key task is to attract high-quality applicants.
Determining what population of potential applicants “should” see calls for proposals is
difficult, but our survey of potential applicants suggested that a majority are aware of the
program. Moreover, nearly all current and past grantees interviewed said that, for the most
part, the program is well known in their industries. For the most part, those who do submit
applications believe that application requirements are specified ahead of time. Most important,
most PONs attract more requests for funds than the total amount of funds available and appear
to attract a healthy diversity of applicants, with only one-third of applicants applying more than
once.
Turning to the process for evaluating, selecting, and awarding projects, we found that survey
respondents believe the criteria and weights used by CEC to evaluate grant applications are
appropriate. However, a small number of interviewees (both CEC staff and grantees) expressed
concerns about whether the agency has the skill and bandwidth to fully assess the financial and
operational capacities of applications. A bigger concern for stakeholders was the amount of
time required to review applications and execute agreements relative to their perceptions about
the speed at which opportunities and market conditions change. Indeed, the mean time elapsed
between application due date and project start date was 12 months, with a median of ten
months, which may limit the awardees’ ability to capitalize on technology and market
opportunities. However, there is evidence that these time lines have improved as CEC has
gained more experience running the program.
We found both strengths and weaknesses in how CEC oversees grants once they begin. On the
plus side, CAMs (the CEC staff who directly oversee individual projects) were generally well
regarded by awardees. A small number of awardees expressed concern about CAM turnover,
but for the most part, this problem appears to be limited. Some cited the burdens associated
with performance reporting but recognized the need for public accountability and noted that
the process had become easier as they became more accustomed to the format and
requirements. However, awardees were more critical of financial reporting requirements, which
many regarded as unreasonably detailed, and about the amount of time required to get changes
to agreements approved, which they regarded as inevitable, especially in projects with longer
time lines. That said, it is not clear how much burden is reasonable given the need for
accountability in the use of public funds.
Despite these concerns, survey respondents and interviewees were generally positive about
their experiences with this program. Indeed, a clear majority indicated that they appreciated the
program and would apply again if the opportunity or need arose.
We found substantial shortcomings in CEC’s document management practices. We believe that
the program would benefit from instituting a systematic data collection and reporting template.
The completed template could be a required element of all final reports, so that a reader could
quickly access the outputs of the project and interpret those outputs in the broader context of
the entire program. Such a template would provide multiple benefits. First, it would force the
awardee to articulate what the quantitative objectives of the project are and to stay focused on
those throughout the project. We observed numerous examples of proposals citing technical
43
objectives in terms of particular amounts in particular units, only to see no clear statement of
these amounts and units in the final report. Second, it would allow CEC to more easily
understand project accomplishments in internally consistent units and to report them to
decisionmakers and other stakeholders. CEC would be more easily able to compare projects and
to sum outputs of similar types of projects to report portfoliowide outputs. While CEC does
these things now, it is challenging to extract the necessary information from the existing
documents and probably requires additional communication with awardees to obtain the
necessary data. Finally, a template would facilitate outside evaluation of the program by
ensuring that the accomplishments and challenges of the program are faithfully presented. This
would minimize misunderstandings and misinterpretations and help ensure that findings and
recommendations are correct and focused appropriately.

44
CHAPTER 3: Impact of Program on Barriers to Market Viability of Hydrogen-Fueled Vehicles
In this chapter, we analyze the impact of the Alternative and Renewable Fuel and Vehicle
Technology Program (ARFVTP) on the barriers to the market viability of hydrogen as a
transportation fuel. The chapter begins with a summary of data sources that inform the
chapter’s findings. Then it provides a technical and historical overview of hydrogen as a fuel
and of fuel cell electric vehicles (FCEVs) and a discussion of the barriers identified to the use of
hydrogen as a transportation fuel. We then review the California Energy Commission’s (CEC’s)
solicitations and awards in hydrogen and place them in the context of other programs seeking
to accelerate hydrogen as a transportation fuel. We next discuss awardee performance in the
hydrogen industry, before discussing the results of our impact analysis of the ARFVTP on the
awardees, on the hydrogen industry, and on the barriers to market viability in the industry.
Then, we discuss hydrogen stakeholder views about ARFVTP investment priorities and end with
some conclusions.
3.1 Summary of Data Sources
This chapter draws on several data sources. First, the chapter relies on survey results from
awardees, unsuccessful applicants, and potential applicants, as described in Table 3.1. Each
awardee was surveyed once per award. (Four awards for funding CEC’s participation in the
California Fuel Cell Partnership [CFCP] were surveyed as a single survey item.) This resulted in a
total awardee survey population of 32, for which there was a 100 percent response rate. The
survey queried seven hydrogen applicants who had been unsuccessful, to which three
responded, for a response rate of 43 percent. It also received eight responses from respondents
who, during the survey, identified themselves as potential hydrogen applicants. All told, we had
43 completed hydrogen survey responses.
Table 3.1. Survey Respondents and Nonrespondents by Category
Respondent Category Number in Survey
Sample Respondents
Response Rate
(Percentage) Awardees 32 32 100%
Project complete 3 3 100% Project ongoing 28 28 100% Project not yet started 1 1 100% Project canceled/terminated 0 0 —
Unsuccessful applicants 7 3 43% Potential applicants n/a 8 — Total — 43 —
SOURCE: RAND survey.

45
Second, this chapter relies on documentation from awardees on their projects, available from
CEC as of spring 2015. These include project proposals, statements of work, progress reports,
contract amendments, final reports (where available), and other documents. Third, it relies on
the findings from five in-depth interviews with hydrogen awardees. Finally, the chapter draws
on the scholarly literature and public data sources on trends in hydrogen, as cited.
3.2 Technical Overview of Hydrogen as a Fuel and of FCEVs
In this section, we provide a historical and technical overview of hydrogen as a fuel and of
FCEVs.
3.2.1 Hydrogen as a Vehicle Fuel
Hydrogen is considered an alternative fuel under the Energy Policy Act of 1992. The interest in
hydrogen as an alternative transportation fuel stems from its potential for domestic
production, the diversity of its production feedstocks and methods, its potential for very low
life-cycle greenhouse gas (GHG) emissions through certain production pathways, and the high-
energy efficiency of fuel-cell vehicles.
Currently, steam methane reformation (SMR) using natural gas as a feedstock accounts for
about 95 percent of the hydrogen produced in the United States. Nearly all the hydrogen
produced each year—approximately nine million tons—is used for refining petroleum, treating
metals, producing fertilizer, and processing foods.36
Hydrogen using SMR with natural gas produces carbon emissions, although typically fewer
emissions than are produced by burning the natural gas in natural gas vehicles (NGVs). Further
reductions to near-zero levels are possible with the use of waste-based methane/biogas and
with the use of solar or nuclear energy to produce hydrogen by electrolysis of water—splitting
the water into hydrogen and oxygen molecules.
Hydrogen has been used for space flight since the 1950s. Over the past several decades,
hydrogen has been used in civilian fuel-cell applications, both stationary and mobile. The
California Environmental Protection Agency’s Air Resources Board (ARB) reports that, as of
April 2016, there were 331 hydrogen fuel-cell vehicles registered with the California
Department of Motor Vehicles (DMV).37 Most of these vehicles are FCEVs (i.e., buses and
automobiles powered by electric motors, storing hydrogen as a gas or liquid, and then
converting the hydrogen into electricity for the motor).
3.2.2 FCEV Technologies
As a fuel for propelling vehicles, hydrogen can either be burned in an internal combustion
engine (ICE) or electrochemically converted in a fuel cell to produce electricity. FCEVs produce
no tailpipe emissions except water, and hydrogen ICE vehicles produce only water and modest
amounts of nitrogen oxides.
36 U.S. Department of Energy (DoE), “Alternative Fuels Data Center: Hydrogen Basics,” undated. 37 ARB, 2016 Annual Evaluation of Hydrogen Fuel Cell Electric Vehicle Deployment and Hydrogen Fuel Station Network Development, July 2016.

46
FCEVs are viewed as an attractive replacement for petroleum-fueled vehicles over the medium
to longer term, offering the prospects of affordable travel and no tailpipe emissions of local air
pollutants or GHG emissions. Depending on how the hydrogen is produced and transported,
FCEVs may provide for very low or negligible carbon emission in grams of carbon dioxide
equivalency (CO2e) per mile on a well-to-wheels basis.
Hydrogen fuel cells, which can serve either stationary or mobile power applications, were first
invented in the mid-1800s and then developed more rigorously with the National Aeronautics
and Space Administration beginning in the late 1950s. Interest in fuel cells for automotive uses
was stimulated in the mid-1990s, as automakers considered alternatives to battery electric
vehicles (BEVs) for achieving zero tailpipe emissions in response to California’s zero-emission
vehicle (ZEV) regulations. Development continues to be motivated by government policy, but
there is also a race for technology supremacy and patent rights in the research and
development (R&D) arena. California has put forth a target in its climate policy of having 87
percent of its on-road, light-duty vehicle fleet composed of ZEVs by 2050, with more than 60
percent of those expected to be FCEVs in some scenarios examined.38 Recently, a group of
automakers and oil and gas companies announced joint plans to invest a total of $14.1 billion
in FCEVs and related hydrogen products.39
FCEVs and BEVs have some similarities. Fuel cells and batteries are similar in that they both rely
on an electrochemical reaction to generate electricity. Both BEVs and FCEVs are defined as ZEVs,
but FCEVs offer several potential advantages over BEVs. For example, current FCEV designs
offer greater range between the need to refuel or recharge (250 to 450 miles compared with
typically 60 to 120 miles for nonluxury BEVs, with the exception of the Chevy Bolt, which offers
almost 240 miles per charge). FCEVs can also be refueled much faster than BEVs can be
recharged—five minutes versus perhaps four to eight hours using level 2 charging or 30 to 60
minutes using DC fast charging (DCFC). Additionally, FCEVs have few or no limitations with
respect to vehicle size or interior volume. However, hydrogen-fueling infrastructure requires
more development than electric-fuel infrastructure.
A lot of progress has been made in better using and optimizing onboard hydrogen storage
through increased storage pressures and new standards for the vehicle-fueling system and
vehicle-fueling interface. Specifically, the transition since 2003 to 70-megapascal (MPa)
hydrogen storage pressures from the previously dominant 35-MPa systems allows more
compressed hydrogen to be stored onboard and has been a significant transition for several
automakers.40 Also, there is renewed interest and support for developing and expanding
hydrogen-refueling infrastructure, backed up by pressure from government policy in California.
38 ARB, Staff Report: Initial Statement of Reasons, Advanced Clear Cars, 2012 Proposed Amendments to the California Zero Emission Vehicle Program Regulations, December 7, 2011. 39 Andrew Krok, “Automakers, Oil Companies Team Up to Push Hydrogen Investments,” CNET.com, January 18, 2017. 40 70 MPa corresponds to approximately 10,000 pounds per square inch (psi), while 35 MPa corresponds to 5,000 psi.

47
Current FCEVs typically use polymer-electrolyte-membrane (PEM) fuel-cell technology (also
known as proton-exchange-membrane fuel cells) to electrochemically oxidize compressed
hydrogen, converting the hydrogen’s embodied energy to electricity in the process. A PEM fuel-
cell stack consists of multiple PEM fuel cells combined in series (the stack). The PEM fuel cell
offers the advantage of a wide range of power ratings from 1 kilowatt (kW) to 250kW, which is
useful in scaling size for various transportation specifications. PEM fuel cells also operate at
relatively low temperatures and have quick start-up times. However, the low-temperature waste
heat produced by the vehicle requires large air vents and radiators. Further, while
developmental goals related to cold-weather operation and other technical hurdles have been
met, there are remaining challenges relating to the cost of the precious metal catalyst coating
on the membrane and sensitivities to fuel impurities.
Safe design and acceptable performance of the onboard storage system is critical for the long-
term viability of the vehicle during refueling events, daily operation, and in a crash. Ample
storage is also necessary to allow for a driving range comparable to traditional ICE-powered
vehicles. Current FCEV development efforts have focused on storing hydrogen in highly
pressurized tanks, but there are other possibilities over the longer term.
Stationary fueling systems and their interfaces with vehicles have been standardized
internationally for high pressure. Designers of compressed hydrogen tanks and onboard fuel
control systems must balance driving range targeted for the specific FCEVs with the expense of
the tank and its packaging within the vehicle. Key development issues are volumetric capacity,
acceptable time for refueling, tank pressure and temperature management, and cost. The cost
of these tanks is a function of the cost of carbon fiber, and design optimization to lower costs
without increasing weight or compromising storage capacity is ongoing.
DoE has funded R&D focused on material-based storage, including metal hydrides, chemical
hydrogen storage materials, and hydrogen sorbents. A broad range of universities, industry
participants, and national labs have worked on storage materials, materials-based system
engineering, advanced high-pressure tank R&D, and system performance and costs analyses.41
These efforts target a series of quantifiable goals for the cost and performance of hydrogen
storage technology. For example, one of the goals is to reduce the cost of onboard storage
components to $10 per kilowatt hour (kWh) by 2020 and ultimately to $8/kWh.42 Similarly
aggressive research collaborations on hydrogen storage involving government, industry, and
academia are ongoing in Germany, Japan, and elsewhere.
3.3 Barriers to Use of Hydrogen as a Transportation Fuel
In terms of the barriers to using hydrogen as a transportation fuel, we focus on four areas
where barriers exist: feedstock, production, distribution, and vehicles. Table 3.2 identifies the
41 Sunita Satyapal, Larry Blair, Grace Ordaz, Carole Read, Ned Stetson, and George Thomas, “The U.S. National Hydrogen Storage Project Overview,” presented at the Combinatorial/High Throughput Techniques for Hydrogen Storage Meeting, Bethesda, Md., June 26, 2007.
42 DoE, Office of Energy Efficiency and Renewable Energy, “Cost Reduction and Performance Improvements of Composite Overwrapped Pressure Vessel Systems for Compressed Hydrogen for Onboard Vehicle Applications,” June 7, 2016.

48
barriers in the four areas, which are discussed in more detail in this chapter. The barriers were
derived from the literature and reflect barriers that existed at the time that the ARFVTP began
in 2008. Some barriers have since been reduced or resolved, sometimes because of the ARFVTP
itself.
Table 3.2. Barriers Identified for Using Hydrogen as a Transportation Fuel
Market Segment Barrier Description
Feedstock • Cost and availability for bio-based feedstock for lower carbon-intensity hydrogen via SMR
Fuel production
• High cost of electrolysis to produce hydrogen • High cost for onsite generation • High price of fuel
Fueling infrastructure
• No hydrogen pipeline • High cost for transport of hydrogen via trucks • High cost of stations relative to capacity • Current lack of refueling sites • Lack of standards for dispensing hydrogen • Regulatory and permitting challenges
Vehicles
• Limited hydrogen vehicles available • Cost and durability of fuel-cell stack • Cost of onboard hydrogen storage • Vehicle purchase and maintenance cost • Potential consumer concerns about the safety of onboard hydrogen storage • Potential changes to the ZEV mandate that might reduce automaker incentive to
develop FCEVs SOURCE: Academic literature.
3.3.1 Feedstock Barriers
As noted, most hydrogen production currently relies on SMR using fossil natural gas as the
feedstock. This technology is well developed and widely applied. However, SMR can be based on
other feedstocks. California’s Low Carbon Fuel Standard (LCFS) includes five pathways for
hydrogen, all using SMR.43 The first step in SMR is producing syngas, a mix of hydrogen, carbon
monoxide, carbon dioxide, water, and methane. Because syngas can be produced from carbon-
containing feedstocks other than natural gas (such as waste and biomass) through the proper
gasification technology, these feedstocks can also be used to produce hydrogen. These
alternatives offer pathways to hydrogen fuel that have less carbon intensity (CI), from a life-
cycle perspective, than SMR with fossil natural gas, with the main barriers relating to the
availability of feedstocks and the cost of producing syngas using the alternative feedstocks.
The other commercially developed production process for hydrogen is electrolysis, which
requires only water and electricity as inputs. With electrolysis, the life-cycle CI of the hydrogen
depends on the CI of the electricity.44 Hydrogen generated with electricity from a coal-fired
plant, for instance, would be carbon-intensive, whereas hydrogen produced using electricity
from nuclear or solar power could emit very little carbon per unit hydrogen produced. There is
43 California Environmental Protection Agency, Detailed California Modified GREET Pathway for Compressed Gaseous Hydrogen from North American Natural Gas, February 27, 2009. 44 DoE, Office of Energy Efficiency and Renewable Energy, “Hydrogen Production: Electrolysis,” undated.

49
ample excess power generation capacity in the United States to allow for hydrogen through
electrolysis, but the amount of low-carbon hydrogen that could be produced is currently limited
by the higher cost and limited share of low-carbon power on the grid.
3.3.2 Production Barriers
3.3.2.1 High Cost of Electrolysis
SMR is a well-established technology that does not pose major cost barriers. While electrolysis
is also used, it currently costs much more than SMR. Because of this, the National Renewable
Energy Laboratory (NREL) projects that SMR will remain the primary hydrogen production
method for the near term. There are several more potentially promising technologies for
producing hydrogen over the longer term, such as fermentation, biological water splitting,
photoelectrochemical water splitting, and solar-thermal water splitting, but these are not
projected by NREL to be commercially viable options in the near term.45
3.3.2.2 High Cost of Onsite Generation
As an alternative to the costly transport of hydrogen fuel (described below), some envision the
possibility of onsite hydrogen generation—likely through SMR but potentially through
electrolysis as well—colocated with refueling infrastructure. Onsite generation, however, does
not benefit from the scale efficiencies of centrally produced hydrogen and thus increases per-
unit production costs as a trade-off to be balanced with reduced transmission/distribution
costs. Taking this concept to extremely small scales, devices have been tested to produce
hydrogen from natural gas onsite for transportation fuel while simultaneously producing
electricity and hot water for local use in buildings, a so-called trigeneration approach.
3.3.2.3 High Fuel Price
The price of fuel is a barrier to using hydrogen. According to a joint agency staff report for the
CEC, “early market retail hydrogen prices ranged from $12.85 per kg [kilogram] to $16.49 per
kg for 700 bar fueling. A common price is $13.99 per kg. Fills at 350 bar tend to be priced
about $2 less per kg compared with 700 bar fills.”46 The gasoline-gallon equivalent (GGE) for
$13.99 per kg is approximately $4.30 per gallon, assuming fuel economies of 81 miles per kg of
hydrogen and 25 miles per gallon of gasoline. In an August 2016 report, NREL put the average
price of hydrogen at $13.68 per kg.47
45 National Renewable Energy Laboratory, “Hydrogen & Fuel Cell Research,” undated. 46 Jim McKinney, Élan Bond, Miki Crowell, and Esther Odufuwa, Joint Agency Staff Report on Assembly Bill 8: Assessment of Time and Cost Needed to Attain 100 Hydrogen Refueling Stations in California, CEC-600-2015-016 Sacramento, Calif.: California Energy Commission, December 2015. 47 DoE, Energy Efficient and Renewable Entergy, “Clean Cities Alternative Fuel Price Report,” July 2016.

50
3.3.3 Distribution Barriers
3.3.3.1 Lack of Pipeline
Just as with natural gas, pipelines would offer the most efficient transport mode for hydrogen
in significant quantity. While there are hydrogen pipelines in the United States serving specific
end uses, a national network of hydrogen pipelines does not exist, and developing such
infrastructure would require a massive investment. There are also technical challenges: Because
hydrogen has smaller molecules than natural gas, it leaks more easily, thus requiring more
sophisticated seals; also, hydrogen causes embrittlement of some metals. Some studies have
explored enriching natural gas with hydrogen for transport in conventional pipelines and for
use in NGVs to further reduce emissions.
3.3.3.2 Transportation by Truck
Absent pipelines, hydrogen can be stored and transported by truck in two forms: as
compressed gaseous hydrogen in high-pressure tanks and as liquid hydrogen stored
cryogenically in insulated tanks. Both options require specialized transportation equipment for
delivery. Also, because hydrogen has a low volumetric energy density, transport cost per unit of
energy for delivery to the fueling site may be high. Local production of hydrogen would reduce
transportation costs and obviate the need for a national pipeline system.
3.3.3.3 Station Development Cost and Other Concerns
Hydrogen-refueling infrastructure is not yet economically viable, which creates a “chicken-and-
egg” issue. The auto industry has long recognized the need for refueling infrastructure to
support its development and planned market launch of hydrogen FCEVs. Yet, without the
vehicles to use hydrogen, it is not economically viable to build stations. Initial efforts to
develop refueling infrastructure in the late 1990s and again in the mid-2000s yielded few
results, reflecting the lack of hydrogen-powered vehicles to create demand for refueling. Efforts
to stimulate infrastructure build-up have been renewed, in parallel with the auto industry’s
work on market readiness for the FCEVs. On September 28, 2013, the governor of California
approved AB 8, which requires CEC to allocate $20 million annually through 2024 until there
are at least 100 publicly available hydrogen-fueling stations in California.48 In parallel, the CFCP,
which includes governmental participation but is supported primarily by the auto industry and
the hydrogen supply industry, has sought to stimulate the addition of more stations, aiming for
a goal of 68 stations being installed and operational in California by 2016. Currently, there are
only 31 public hydrogen-fueling stations in the United States, most in a cluster in Southern
48 AB 8 also suspends the California Air Resources Board’s (CARB’s) authority to enforce any element of its Clean Fuels Outlet program for the publicly available hydrogen-fueling stations through 2024.

51
California and in the San Francisco Bay Area.49 By comparison, in 2015, there were more than
7,000 retail gasoline stations in California.50
Station development costs are also high, per unit of fuel delivered. A 2013 NREL report
estimated that the costs of building a station able to dispense 450 kg of hydrogen per day in
the 2014 to 2016 time frame are about $2.8 million. By comparison, a conventional gasoline
station costs a little less to build and can dispense about ten times the amount of fuel per day.
Next-generation hydrogen stations able to dispense about 1,500 kg per day could cost $3.4
million.51
Finally, many municipalities are unfamiliar with the safety issues surrounding hydrogen-
refueling stations and lack clear permitting procedures. This can be a challenge in obtaining the
permits necessary to proceed with stations.
3.3.3.4 Standards
A final distribution barrier issue is that to ensure the compatibility of hydrogen fuel and
vehicles, standards or specifications are needed to ensure that the technologies deployed in the
production, distribution, and vending of hydrogen match the requirements for vehicle
receiving, storage, and use. As of 2009, there were no established processes for measuring the
volume of hydrogen dispensed at fueling stations. As a result, fueling station operators had
difficulty charging customers for their fuel purchases. Manufacturers of leased fuel-cell cars,
for instance, provided refueling as part of their lease agreements. The lack of such standards
has created uncertainty in the market, discouraged the private sector from investing, and
hindered a robust market for hydrogen-fueled vehicles. As we will describe, CEC investment has
helped overcome this challenge.
3.3.4 Vehicle Barriers
Use of hydrogen as a vehicle fuel is limited by the number of hydrogen vehicles on the road,
which currently number in the hundreds in California. Cost, safety perceptions, and refueling
stations are the main barriers in terms of consumers’ experience. In terms of technology, FCEV
components that pose some barriers include the fuel-cell stack and onboard storage.
3.3.4.1 Vehicle Price
The present cost of FCEVs greatly exceeds that of conventional vehicles, based on the expense
of fuel-cell technology and onboard hydrogen storage. However, prices have been falling. The
Toyota Mirai has a base manufacturer’s suggested retail price of $57,500 or $350 per month
49 DoE, Energy Efficiency and Renewable Energy, Alternative Fuels Data Center; “Hydrogen Fueling Station Locations,” undated. 50 CEC, “California Retail Fuel Outlet Annual Reporting (CEC-A15) Results: Number of Retail Fuel Stations by Fuel–Survey Responses: 2009–2015,” undated. 51 M. W. Melaina and M. Penev, Hydrogen Refueling Infrastructure Cost Analysis, Arlington, Va., May 15, 2012.
52
lease for 36 months, and the Hyundai Tucson leases for $500 per month for 36 months.52 If the
price of FCEVs can be further reduced, and if a sufficient network of refueling sites can be built
out, then prospects for acceptance would be strong. The marginal energy costs of driving an
FCEV are projected to be reasonably low and ultimately competitive, given the high vehicle
efficiency, and FCEVs already provide range and performance comparable to ICE vehicles.
3.3.4.2 Safety Perceptions
Another barrier is the perceived safety of onboard storage of hydrogen. Efforts to address these
concerns have been under way. As one example, the Society of Automotive Engineers has
standards for all facets of fuel system and storage tank testing and design to ensure
operational and post-crash safety in the interest of avoiding hazards during refueling and if a
fuel system breach occurs during a vehicle crash.53 Another example is the National Highway
Traffic Safety Administration’s work with the automotive and energy industry to develop static
and dynamic test and conformance standards for hydrogen storage tanks and fuel systems.54
Local fire marshals and fire-safety standards organizations have sought to understand and
resolve concerns associated with vehicle maintenance and sales facilities and municipal and
residential parking garages to protect against hazards if there is an inadvertent hydrogen fuel
system breach or leak.55
3.3.4.3 Refueling Infrastructure
For consumers to be willing to purchase FCEVs, the number of refueling stations will need to be
significantly expanded in targeted locations. This is one part of the mutually dependent
barriers of needing more hydrogen vehicles to make the fueling network feasible and of
needing the hydrogen network to make hydrogen vehicles feasible.
3.3.4.4 Fuel-Cell Stack
Not unlike batteries for BEVs, the cost of fuel-cell technology is still a major hurdle to be
addressed before the mass-market success of FCEVs can be realized. Greater production
volume should reduce cost over time, as should further engineering development and
improvements of overall design, packaging, and technology. Specific areas for cost reduction
include the reduction of precious metal loading in the PEM and optimization of the overall fuel-
cell system, encompassing water- and heat-management systems, hydrogen-pumping apparatus,
and equipment to manage air compression and expansion.
Another potential barrier and issue for FCEVs is long-term durability. Considerable unknowns
remain for the majority of original equipment manufacturer vehicle producers in this area
52 Hyundai, “2017 Tucson Fuel Cell,” print advertisement, undated, and Toyota, “Mirai Fuel Cell Vehicle,” online promotion, undated. 53SAE International, “Recommended Practice for General Fuel Cell Vehicle Safety,” August 26, 2014. 54 U.S. Department of Transportation, National Highway Traffic Safety Administration, Compressed Hydrogen Cylinder Research and Testing in Accordance with FMVSS 304, June 2009. 55 Office of the State Fire Marshal, The Emergency Response Guide to Alternative Fuel Vehicles, June 2009.

53
because of lack of expansive in-use customer experience in varying climates and driving
conditions. At present, there is a trade-off between durability and platinum loadings and thus
between cost and durability. Vehicle residual value, cost of operation and ownership, and
manufacturer exposure to recalls and high warranty costs are all issues associated with this
durability question.
3.3.4.5 Onboard Storage
High-pressure storage remains a high-cost component on an FCEV.
3.3.4.6 Regulatory Context
One additional potential threat to the growth of the market for FCEVs in the United States could
be a relaxation of the California requirement for ZEV production or a failure to produce funding
for refueling infrastructure. This would impact market growth in California and certainly
compromise expansion of the FCEV market outside of California.
3.3.5 Barriers Identified in the Survey
We surveyed awardees, unsuccessful applicants, and potential applicants about the barriers to
using hydrogen as a transportation fuel. These survey barriers are not identical to those we
describe from the literature. The former are more general questions about barriers and are
presented to survey respondents across fuel types. The latter are more specific to hydrogen.
Nevertheless, findings from our survey are generally consistent with the barriers discussed
from the literature. Barriers identified by awardees, unsuccessful applicants, and potential
applicants for hydrogen projects are shown in Figure 3.1. The barriers are organized by whether
they apply to fueling infrastructure (red bars), fuel production (green bars), vehicles (blue bars),
or other (gray bars). Each respondent was able to select any number of barriers.
These results show that the most commonly cited barriers relate to the lack of infrastructure
(“insufficient fueling or recharging infrastructure”) and the lack of vehicles (“limited number of
vehicle models available”), which are mutually dependent barriers. As noted, station developers
will not build hydrogen-fueling stations unless there are a sufficient number of vehicles to
create adequate demand for the fuel. Simultaneously, customers will not purchase hydrogen
vehicles until there is a sufficient network of hydrogen-fueling stations. This chicken-and-egg
problem is evident in the literature, our survey, and the site visits. It is one reason that CEC is
primarily investing in hydrogen-fueling infrastructure.
Other commonly cited reasons are related to several overarching issues such as
• developing stations (“difficulty, cost, and delay in obtaining permits for siting fueling/charging stations” and “insufficient bulk fuel distribution infrastructure”), fuel production (“high fuel-production cost”)
• consumer awareness (“insufficient customer awareness of and knowledge about alternative fuels and vehicles”)

54
• vehicle production (“limited vehicle production capacity” and “high vehicle production cost”).
Vehicle or fuel performance issues were less often cited as barriers. Most of the respondents
who noted some “other” barrier did not provide an explanation of what that other barrier was.
Two of the four respondents who did indicated a shortcoming in the lack of hydrogen vehicles.
Another noted a lack of funding for hydrogen production, market data, and demonstration
projects. A final respondent described the lack of onsite generation as a barrier, particularly for
applications that are spread over a large geographic area.
Figure 3.1. Barriers to Hydrogen Vehicles Identified in the Survey
SOURCE: RAND survey. NOTES: Label for the second red bar should read, “Difficulty, cost, and delay in obtaining permits for siting fueling/charging stations.” Label for the first gray bar should read, “Insufficient customer awareness of and knowledge about alternative fuels and vehicles.” The percentages in this figure do not sum to 100 percent because respondents were able to choose multiple barriers. Rather, each bar represents the fraction of respondents that cited the particular barrier. Based on 41 hydrogen survey respondents who cited at least one barrier.
3.4 Review of CEC’s Solicitations and Awards in Hydrogen
3.4.1 Hydrogen Funding and Solicitations
Table 3.3 shows the amount that CEC allocated to hydrogen and solicitations (project
opportunity notices [PONs]) and interagency agreements (IAs) in each year from 2009 to 2015.
78% 56%
49% 22%
51% 37%
15% 5%
61% 46% 46%
20% 17%
5% 2%
51% 32%
29%
0% 20% 40% 60% 80% 100%
Insufficient retail fueling or charging infrastructure
Difficulty, cost, and delay in obtaining permits for si5ng fueling/charging
Insufficient bulk fuel distribu5on infrastructure
Lack of industry standards for fueling/charging interface
High fuel produc5on cost
Limited fuel produc5on capacity
Limited availability of feedstock for fuel produc5on
Poor emission profile of fuel
Limited number of vehicle models available
High vehicle produc5on cost
Limited vehicle produc5on capacity
High vehicle life5me opera5ng and maintenance cost
Inadequate vehicle performance
Insufficient vehicle in-‐use performance of fuel
Poor emission profile of vehicle
Insufficient customer awareness of and knowledge about alterna5ve
Insufficient pool of labor familiar with alterna5ve fuels and vehicles
Other
Percentage of respondents ciFng barrier
What are the current barriers to the market viability of the alternaFve fuels and vehicles most closely connected to your grant (applicaFon, organizaFon)? (Select all that apply.)

55
Table 3.3. CEC Hydrogen Funding Allocations, Solicitations, and Award Amounts, 2009–2015
Date Plans and Amounts
Allocated Solicitations and IAs Additional Notes
2009
2008–2010 Investment Plan originally allocated $40 million for hydrogen-fueling infrastructure
PON-09-608: $19M available and $15.7M awarded for 8 new and 3 upgraded hydrogen-fueling stations; IA of $4M for standards development
One project canceled, resulting in $15.1 million for 8 new and 2 upgraded stations under PON-09-608
2010
2010–2011 Investment Plan update initially allocated $13 million for hydrogen-fueling infrastructure but was later reduced to $10.3 million
IA of $3 million for 1 station; IA of $2 million for the CARB-administered Clean Vehicle Rebate Program (CVRP)
2011
2011–2012 Investment Plan update allocated $8.5 million for hydrogen-fueling infrastructure
2012
2012–2013 Investment Plan update initially allocated $11 million for hydrogen, but this was later reduced to $9.9 million
PON-12-606: $28.6 million available and $12 million awarded for 7 new hydrogen-fueling stations; IA of $6.7M for 3 upgrades; IA of $17.5M for the CARB-administered CVRP
2013
2013–2014 Investment Plan update allocated $20 million for hydrogen-fueling infrastructure
PON-13-603 for $300,000 for hydrogen readiness, PON-13-604 for $2M for fuel cell vehicle development, PON-13-607 for $46.6M for 28 new stations
In September 2013, the California legislature passed AB 8, which requires CEC to allocate $20 million to hydrogen-fueling infrastructure until 100 public stations are available or funding is not needed
2014
2014–2015 Investment Plan update allocated $20 million for hydrogen-fueling infrastructure
PON-14-603 for $800,000 for 4 hydrogen readiness projects IA of $5 million for the CARB-administered CVRP
2015
2015–2016 Investment Plan update allocated $20 million for hydrogen-fueling infrastructure
SOURCE: CEC investment plans and plan updates from 2008–2010 to 2015–2016. NOTE: Years of IAs are based on the year denoted in the agreement number and may differ from the year the agreement was executed.
The program began in 2008–2010 with a $40 million allocation toward hydrogen-fueling
infrastructure. The annual allocation was approximately $10 million for the three years between
2010 and 2012, inclusively. Since 2013, the CEC has allocated $20 million each year toward
hydrogen-fueling infrastructure in accordance with AB 8, which requires this annual allocation
until 100 public stations are available or funding is no longer needed to sustain their
development.
During this time, CEC had three main solicitations related to hydrogen infrastructure. Three
PONs—PON-09-608, PON-12-606, and PON-13-607—specifically targeted to hydrogen-fueling
stations awarded a total of $63.7 million to develop new stations and upgrade existing ones. In
addition, PON-14-603 supported hydrogen readiness planning and PON-13-604 supported the
demonstration of hydrogen fuel cell buses and vans. There were also IAs for additional station
development and upgrades and R&D work.

56
Finally, there were three IAs totaling $24.5 million to the CARB for the Clean Vehicle Rebate
Program (CVRP), which provides a monetary rebate incentive to buyers of BEVs, PHEVs, and
FCEVs. As of March 15, 2017, CARB has spent $388 million on rebates, but, as discussed later,
approximately 0.6 percent of this funding has to date gone to support FCEVs,56 presumably
because of limited availability of FCEVs. Thus, proportionally, approximately $150,000 of
ARFVTP funds may have gone to FCEV rebates to date. This program is discussed more fully in
Chapter Four on electricity, and we exclude these IAs from the discussion of hydrogen
applications and awards to avoid double counting.
3.4.2 Hydrogen Applications and Awards
CEC received 177 hydrogen applications and made 35 hydrogen awards between June 2010
(when PON-09-608 was released) and January 2015, totaling $93.1 million. Thus, the program
has awarded 85.6 percent of the $108.7 million allocated between the 2008–2010 and the 2014–
2015 investment plans.
Tables 3.4 and 3.5 show that the majority of applications (162 of 177, or 92 percent), awards
(26 of 35, or 74 percent), and the amount awarded ($90 million of $93.1 million, or 97 percent)
were made in fueling infrastructure. Nearly all of the 26 applications and awards in fueling
infrastructure were in production, distribution, and deployment (PD&D) (i.e., station
development). Of these 26, 17 awards were to build a total of 48 fueling stations, for a total of
$77.6 million, while seven awards supported operations and maintenance (O&M) of stations.
Two of the fueling infrastructure awards supported R&D of standards and technologies for
retail fueling.
There were no specific fuel-production awards, although one of the station development awards
included an on-site fuel-production component. There were two vehicle-development awards to
demonstrate a fuel-cell bus and a fuel-cell van. Three awards went to readiness planning for
hydrogen infrastructure.57 Finally, the “other” category includes four payments to fund CEC’s
ongoing participation in the CFCP. These are treated as a single award in our analysis. In many
cases, we exclude them from the results because they are administrative and do not have
technical objectives or other characteristics of the other 31 awards.
56 California Clean Vehicle Rebate Project, “CVRP Rebate Statistics,” last updated June 1, 2017. 57 Regional readiness awards help a region prepare for the rollout of alternative fuels and vehicles. For example, the awards can help local government agencies develop strategic plans for electric vehicle supply equipment (EVSE), establish best practices for PEV-ready building and public works guidelines, and help streamline PEV EVSE permitting, installation, and inspection processes.

57
Table 3.4. Summary of Hydrogen Awards by Market Segment and Technology Development Stage (Number of Awards and Percentage of Total Awards in Parentheses)
Technology Development Stage
Market Segment PD&D RD&D Regional
Readiness Total Fueling infrastructure 24 (69) 2 (6) 0 26 (74) Vehicles 0 2 (6) 0 2 (6) Fuel production 0 0 0 0 Regional readiness 0 0 3 (9) 3 (9) Other 0 4 (11) 0 4 (11) Total 24 (69) 8 (23) 3 (9) 35 (100) SOURCE: RAND Survey and data derived from project documents. NOTE: RD&D = research, development, and demonstration. This does not include ARFVTP’s contribution of $24.5 million as an IA to CARB’s CVRP. These IAs are reviewed in Chapter Four. Percentages do not sum to 100 percent because of rounding.
Table 3.5. Summary of Hydrogen Awards, 2009–2014
Market Segment Number of Awards
Award Amount ($ M) Award Details
Feedstock 0 $0 Fuel production 0 $0
Fueling infrastructure
17 $77.4
Construction of one or more hydrogen-refueling stations Total of 48 stations proposed Includes one $2.1 million project involving on-site fuel production
7 $8.5 O&M of hydrogen-refueling stations
2 $4.1 Standards and certification for refueling dispensers
Vehicles 2 $2.0 Development and demonstration of a fuel-cell bus and a fuel-cell van
Regional readiness 3 $0.6 Hydrogen readiness planning
Other 4 $0.5 Fund CEC’s participation in the CFCP Total 35 $93.1 SOURCE: Data from CEC’s award databases and project documents. NOTE: This does not include ARFVTP’s contribution of $24.5 million as an IA to CARB’s CVRP. These IAs are reviewed in Chapter Four.
3.4.3 Barriers Targeted
Table 3.6 compares the barriers respondents identified in the survey (Figure 3.1) with barriers
that the awards targeted as assessed in RAND’s review of the hydrogen projects’ technical
objectives. For this assessment, RAND researchers reviewed the technical objectives described
in each project’s statement of work and determined which, if any, barrier the technical objective
was aimed at reducing. This does not mean that the technical objective has been reduced;
rather, it means that targeting a barrier was an intentional goal of the award. Importantly, the
fraction of respondents identifying a barrier should not be construed as a benchmark for the
fraction of CEC awards that should target that barrier. As one example, 20 percent of
respondents noted that the lack of fueling standards posed a barrier, and 6 percent of awards
(two awards) targeted that barrier. As we discuss later, those two awards were adequate for
addressing that barrier.
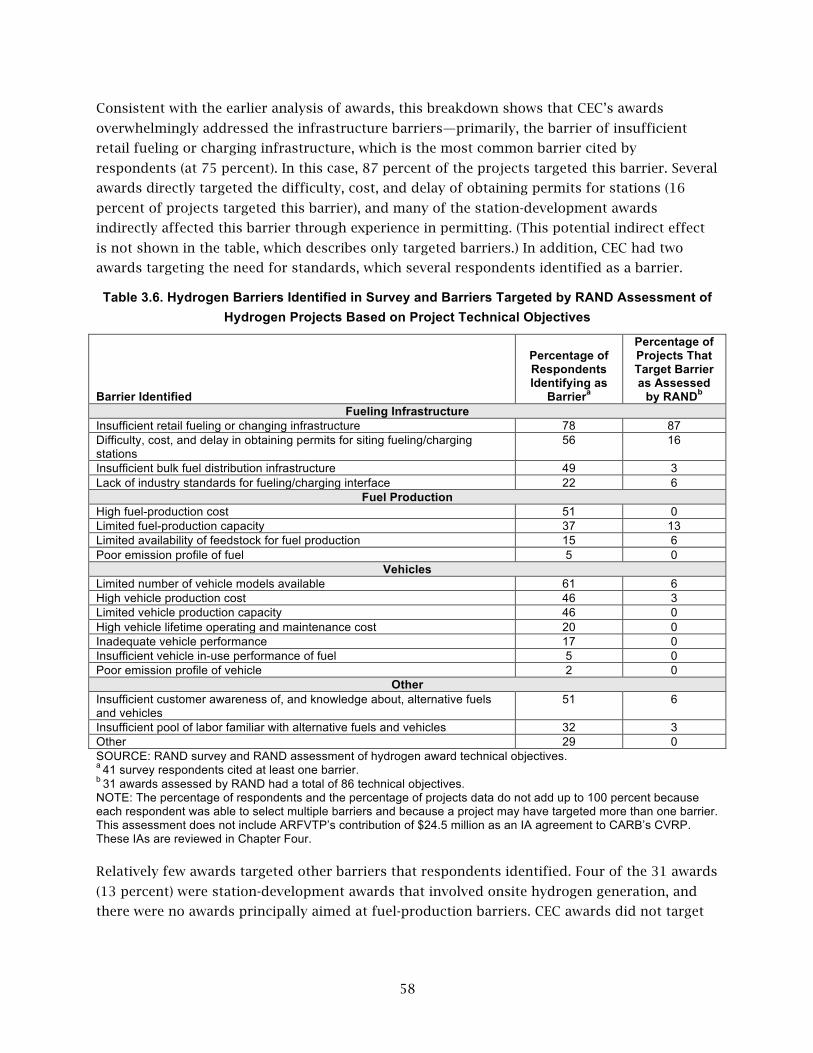
58
Consistent with the earlier analysis of awards, this breakdown shows that CEC’s awards
overwhelmingly addressed the infrastructure barriers—primarily, the barrier of insufficient
retail fueling or charging infrastructure, which is the most common barrier cited by
respondents (at 75 percent). In this case, 87 percent of the projects targeted this barrier. Several
awards directly targeted the difficulty, cost, and delay of obtaining permits for stations (16
percent of projects targeted this barrier), and many of the station-development awards
indirectly affected this barrier through experience in permitting. (This potential indirect effect
is not shown in the table, which describes only targeted barriers.) In addition, CEC had two
awards targeting the need for standards, which several respondents identified as a barrier.
Table 3.6. Hydrogen Barriers Identified in Survey and Barriers Targeted by RAND Assessment of Hydrogen Projects Based on Project Technical Objectives
Barrier Identified
Percentage of Respondents Identifying as
Barriera
Percentage of Projects That Target Barrier as Assessed
by RANDb Fueling Infrastructure
Insufficient retail fueling or changing infrastructure 78 87 Difficulty, cost, and delay in obtaining permits for siting fueling/charging stations
56 16
Insufficient bulk fuel distribution infrastructure 49 3 Lack of industry standards for fueling/charging interface 22 6
Fuel Production High fuel-production cost 51 0 Limited fuel-production capacity 37 13 Limited availability of feedstock for fuel production 15 6 Poor emission profile of fuel 5 0
Vehicles Limited number of vehicle models available 61 6 High vehicle production cost 46 3 Limited vehicle production capacity 46 0 High vehicle lifetime operating and maintenance cost 20 0 Inadequate vehicle performance 17 0 Insufficient vehicle in-use performance of fuel 5 0 Poor emission profile of vehicle 2 0
Other Insufficient customer awareness of, and knowledge about, alternative fuels and vehicles
51 6
Insufficient pool of labor familiar with alternative fuels and vehicles 32 3 Other 29 0 SOURCE: RAND survey and RAND assessment of hydrogen award technical objectives. a 41 survey respondents cited at least one barrier. b 31 awards assessed by RAND had a total of 86 technical objectives. NOTE: The percentage of respondents and the percentage of projects data do not add up to 100 percent because each respondent was able to select multiple barriers and because a project may have targeted more than one barrier. This assessment does not include ARFVTP’s contribution of $24.5 million as an IA agreement to CARB’s CVRP. These IAs are reviewed in Chapter Four. Relatively few awards targeted other barriers that respondents identified. Four of the 31 awards
(13 percent) were station-development awards that involved onsite hydrogen generation, and
there were no awards principally aimed at fuel-production barriers. CEC awards did not target

59
vehicle-related barriers, except with awards for hydrogen bus and van development. Three
hydrogen readiness plans targeted other barriers related to consumer awareness and labor.
It is important to note that CEC’s ARFVTP is not the only program seeking to facilitate the
commercialization of hydrogen as a transportation fuel. The focus of CEC’s funding on
infrastructure is at least partly because the focus of other funding programs is on other parts
of the hydrogen supply chain or technology development stage. As noted, CARB’s CVRP (to
which the ARFVTP contributes) provides rebates for the purchase of certain vehicles, including
FCEVs. In addition, DoE’s Fuel Cell Technologies Office has an annual program to fund
hydrogen and fuel-cell technologies research, development, and demonstration.58 The 2016
solicitation, for example, focused on R&D of materials for fuel cells, hydrogen production, and
on-board hydrogen storage. The 2015 solicitation focused on hydrogen production through
microbial biomass conversion; materials development for PEM fuel-cell applications;
development of an integrated intelligent hydrogen dispenser; and hydrogen delivery pipeline
manufacturing R&D. The Federal Transit Agency’s Low and No Emission Vehicle Deployment
Program provides funding for transit agencies to use zero-emission and low-emission transit
buses, including FCEV buses. Their support covers supporting facilities as well, such as
refueling and recharging stations.59 The ARFVTP’s focus on fueling stations addresses an
important and arguably underaddressed niche in this space, as suggested by the relative lack of
fueling stations in other parts of the country. This is discussed in detail in Section 3.7.1.
3.5 Awardee Performance
We assessed awardee performance by evaluating the status of each award, as well as the
technical, financial, and schedule performance. Except as noted, the results omit the four
projects to fund CEC’s participation in the CFCP, resulting in findings for 31 awards.
3.5.1 Project Status
Table 3.7 shows the status of the 35 hydrogen ARFVTP projects approved for funding through
January 2015. The status is current as of September 2016. Although the first PON occurred in
2009, there are only six completed hydrogen projects to date (and four of these were projects
to fund CEC’s participation in the CFCP). Another project was canceled because, according to
the awardee, the awardee could not come to agreement with study partners or subcontractors
on the scope of work (among other reasons). The majority of projects (28) are ongoing. The last
two columns of Table 3.7 show the amount awarded and the amount of invoices paid according
to project status, including the four awards for participation in the CFCP. It shows that
essentially 100 percent of invoices have been paid for completed projects, while 68 percent
have been paid for ongoing projects. No invoices were paid for the canceled project.
58 DoE, Energy Efficiency and Renewable Energy, “Fuel Cell Technologies Office Closed Funding Opportunities,” undated. 59 DoE, Energy Efficiency and Renewable Energy, Fuel Cell Technologies Market Report 2015, August 2016.

60
Table 3.7. Status of Hydrogen Awards as of September 2016
Project Status in September 2016 Number of Projects
Amount Awarded
($ M)
Invoices Paid Though December
2016 ($ M)a Completed 6b $8.4 $8.3 Ongoing 28 $84.1 $57.2 Canceled or terminated 1 $0.6 $0 Total 35 $93.1 $65.4
SOURCE: CEC administrative data. a Includes any retentions that are being held by CEC until project completion. b Includes four projects to fund participation in the CFCP.
3.5.2 Technical Performance
Hydrogen projects seem largely on track for meeting their technical objectives, although many
of these objectives are still in progress, and final conclusions cannot yet be drawn.
The 31 awards (excluding four projects to fund the CFCP) had a total of 86 objectives, as coded
by the RAND research team based on the project proposals and statements of work. This
included such objectives as “construct one hydrogen-refueling station,” “deliver 100%
renewable hydrogen to two stations in Southern California,” and “collect and analyze data on
the economic benefits and local impacts of the project.” They did not include administrative
activities such as progress reporting or contract management.
Twenty-nine of the 31 awards (94 percent) had one to four objectives, although one had five
objectives, and another had seven objectives. Where data were available for the RAND team to
make a determination of objective status, RAND’s assessment of objectives and RAND’s
assessment as updated by survey respondents were consistent: Respondents agreed that eight
objectives were fully complete, two were minimally complete, and 17 were in progress.60 RAND
identified 60 objectives as either not yet started or unknown, based on the data that were
available. Respondents provided more up-to-date information about these objectives, as shown
in Table 3.8.
60 Refer to Section 1.3.1 for definitions of the categories used to classify technical objectives by extent achieved.

61
Table 3.8. RAND and Awardee Assessments of Technical Objectives
RAND Assessment of Objectives
RAND Assessment of Objectives As Updated by Survey
Respondents 7 Fully met 7 Fully 2 Minimally met 2 Minimally 17 In progress 17 In progress
11 Not yet started
1 Fully met 3 In progress 6 Not yet started 1 Dropped
49 Unknown
10 Fully 1 Minimally 36 In progress 2 Unknown
Total: 86 technical objectives Total: 86 technical objectives SOURCE: RAND survey and RAND assessment of hydrogen award technical objectives.
Four technical objectives were denoted as modified. In two cases, the locations of stations had
changed, which does not constitute an actual change in technical objective in our analysis. The
other two changes relate to objectives for the same award. The two original technical objectives
for this project were to conduct O&M and to gather data about the equipment. The respondent
changed both objectives “to be operational for the period originally intended” and denoted one
as “already been met” and the other as “highly likely.” This suggests the modifications were
intended as clarifications rather than changes.
Finally, one technical objective coded by the RAND team was stated as dropped by an awardee,
although no reason was given. This objective was to “collect and analyze data on the economic
benefits and local impacts of the project throughout the term of the project and include that
analysis in the final report, including 12 months of throughput, usage, and operational data.”
The following figures describe the outcomes of the remaining 85 objectives.
Figure 3.2 shows, according to survey respondents, the percentage of objectives that have been
achieved to different extents among completed, ongoing, and canceled or terminated projects.
For instance, nearly all project technical objectives have been fully achieved among the
completed projects (five of six, or 83 percent). The remaining one technical objective—to
displace more than 357,000 gallons of gasoline annually—was minimally achieved, with no
explanation provided about why it was not fully achieved. It is possible that while the project
was complete, that amount of gasoline displacement has not taken place because not as much
hydrogen has been dispensed as anticipated in the proposal.
Among the ongoing projects, some objectives (14 of 77, or 18 percent) have already been
achieved, but most objectives (55 of 77, or 71 percent) are still in progress or have not yet
started (six of 77, or 8 percent). Of these, Figure 3.3 shows that a substantial majority are
reported to be highly likely to be achieved (49 of 55, or 89 percent of those in progress, and six
of six, or 100 percent of those not yet started), while respondents describe some as “somewhat

62
likely” to be achieved (six of 55, or 11 percent). The status of some technical objectives remains
unknown and was not reported by awardees. Finally, the two objectives of the
terminated/canceled project were minimally achieved.
Figure 3.2. Extent Objectives Achieved, by Project Status
SOURCE: RAND survey. NOTES: Percentages in each category (completed, ongoing, and canceled/terminated) sum to 100 percent; n = 6 objectives in 6 completed projects; n = 77 objectives in 23 ongoing projects; n = 2 objectives in 1 canceled/terminated project).
17%
83%
3% 8%
71%
18%
100%
0%
20%
40%
60%
80%
100%
120%
Unknown Not Yet Started Minimally In Progress Fully
Completed
Ongoing
Canceled/terminated

63
Figure 3.3. Likelihood of Completion of Objectives in Progress or Not Yet Started
SOURCE: RAND survey. NOTE: n = 55 in-progress or not-yet-started objectives.
3.5.3 Financial Performance
We measure financial performance in terms of the extent to which awardees were able to obtain
the proposed match amounts. We find that awardees almost always met their match obligation,
and in some cases exceeded it, suggesting potential budget overruns.
In our review, we omit the awards to fund CEC’s participation in the CFCP and combine the
financials of two awards that are from the same awardee and, thus, are essentially the same
project but split in two awards for administrative purposes. Of the resulting 30 awards (results
not shown), 12 (37 percent) had no match requirement. Ten projects (33 percent) reported
meeting their match amounts precisely. Three awards went over their specified match amount
(and, therefore, their total budgets) by 30 percent, 40 percent, and 90 percent. In addition, five
awards (17 percent) reported match amounts for which no match was denoted in CEC’s project
database. It is unclear whether this suggests errors in the CEC database, or that no match was
officially proposed but awardees anticipated this cost in their internal budget calculations, or
that these were costs above and beyond awardees’ estimates. Finally, one awardee did not
comment on whether the required match was obtained.
3.5.4 Schedule Performance
Hydrogen awards are largely behind schedule, as shown in Figure 3.6. As reported by awardees
in the survey, the two completed awards were both over two years delayed. Of the ongoing
89%
11%
0% 0% 0% 0%
20%
40%
60%
80%
100%
Highly likely Somewhat likely
Just as likely as unlikely
Somewhat unlikely
Highly unlikely Unknown
How likely is it that this technical objecFve will be met?

64
awards, only 25 percent are ahead of schedule or on schedule, while 60 percent are delayed
(with the remaining 14 percent unspecified). Of the delayed awards, 28 percent were delayed
more than a year.
These findings are largely consistent with CAM assessments of award schedules (results not
shown). In 77 percent of the delayed awards (23 of 31), the CAM and awardee assessments of
delay durations matched; the remaining eight awards (13 percent) were reported as being more
delayed by awardees than was noted by the CAM.
Figure 3.4. Schedule Performance Reported by Awardees
SOURCE: RAND survey. NOTE: Twenty-eight ongoing and two completed grants. This excludes one canceled award and four projects that fund CEC participation in the CFCP.
This suggests that delays in hydrogen-refueling stations may be a significant challenge for the
program. When hydrogen infrastructure award schedules are examined over time, it is clear
that earlier awards are more delayed than later awards, as shown in Table 3.9 (and highlighted
by the shading). There may be many reasons for this, including that lessons learned from
earlier awards have been overcome in later awards and that later awards have not had as much
opportunity for schedule slippage.
14% 11%
21%
11%
21%
7% 14%
100%
0%
20%
40%
60%
80%
100%
Ahead of schedule
On schedule 1–6 months behind
7–12 months behind
13–24 months behind
25+ months behind
Not specified
What is/was the status of the award relaFve to its original schedule?
Ongoing
Completed

65
Table 3.9. Award Delays Relative to Timing for Completed and Ongoing Infrastructure Awards
What is/what was status of the grant relative to its original schedule?
Year
Schedule (percentage of infrastructure awards) Ahead of Schedule On Schedule
1–6 Months Behind
7–12 Months Behind
13–24 Months Behind
25+ Months Behind
2009 (1 award) 0 0 0 0 0 100 2010 (3 awards) 0 0 0 0 33 67 2012 (5 awards) 0 0 20 0 60 20 2013 (5 awards) 40 40 0 20 0 0 2014 (10 awards) 20 10 20 40 10 SOURCE: RAND survey. NOTE: Based on 24 completed and ongoing infrastructure awards between 2009 and 2014.
Of the 17 projects reporting at least some delay (Figure 3.5), there were many common reasons
cited for the delay. Nearly all reported delays from permitting, while more than one-half
reported needing to change project locations. One-third also reported site owners’ hesitation or
reluctance about the project. These hurdles suggest widespread logistical “growing pains” in
developing stations for a fuel with which regulators, partners and collaborators, and the public
are unfamiliar.
Figure 3.5. Reasons for Delays Among Delayed Projects
SOURCE: RAND survey. NOTE: Based on 17 delayed projects. However, there is reason for optimism that these challenges can be and are being overcome.
One awardee has received two concurrent awards to build a total of 19 hydrogen-fueling
stations from June 2014 to December 2016—in about two and a half years. As of August 2016,
they had constructed and opened 14 of those stations, with two additional to be opened by
79%
57%
36%
36%
7%
7%
7%
7%
36%
0% 20% 40% 60% 80% 100%
Delay in gecng required permits
Needed to change project loca5on
Unexpected problems with the technology arose
Hesita5on or reluctance about the project from the site owner
Essen5al staff leg the company
CEC did not pay invoices in a 5mely manner
Took longer than expected to hire essen5al staff
Took longer than expected to secure matching funds
Other
Percentage of respondents ci5ng barrier

66
December 2016. According to the awardee, they were able to accelerate station development
time from 18–24 months to 12–18 months for a number of reasons, including
• efficiencies of scale (19 stations versus one or two)
• full-time focus on developing stations
• parallelizing engineering and design, negotiating agreements, and obtaining permits
• having key expertise, such as real estate agents and permitting experts, on their team
• pursuing station designs with small footprints.
The awardee is drawing on these experiences to assist other competing station developers in
completing their stations more quickly.
About one-third of awardees also reported unexpected problems with the technology, and
about one-third also reported other reasons, which were elaborated in three cases: (1) A
subcontractor left the project and therefore had to be replaced, (2) there were delays in
providing a final report, and (3) technology improvements were implemented to improve
performance.
3.6 Impacts on Awardees
The program had a number of impacts on awardees. A key impact is that it enabled awardees to
undertake hydrogen projects that they otherwise might have forgone. The program also broadly
increased their knowledge and capabilities and improved market prospects for their technology,
although the awards did not result in any specific patents.
3.6.1 Impact on Undertaking Project
The awards in hydrogen were instrumental to the undertaking of most projects (the bulk of
which involved station development), as shown in Figure 3.6. Only 6 percent of projects would
have proceeded within the year without the award. In contrast, 58 percent of respondents
expressed uncertainty about whether the project would have been undertaken, and 32 percent
noted that the project would not have proceeded.
Without the award, as shown in Figure 3.7, approximately a third of respondents indicated they
very likely would have sought funding from outside sources, while 10 percent noted they would
have sought internal funding. However, consistent with the importance and uniqueness of this
program, nearly 40 percent indicated they would not have sought other outside funding, and 55
percent said they would not have sought internal funding.

67
Figure 3.6. Whether Hydrogen Awardees Would Have Proceeded Without Award
SOURCE: RAND survey. NOTE: Based on 31 respondents.
6%
0%
58%
32%
3%
0% 20% 40% 60% 80%
Would have proceeded within a year
Would have proceeded 1 to 3 years later
Might have proceeded at some point in the future but I don't know for sure
Would not have proceeded with the project for the foreseeable future
No response
Percentage of respondents

68
Figure 3.7. What Would Hydrogen Awardee Have Done Without the Award?
SOURCE: RAND survey. NOTE: Based on 31 respondents.
Another useful indicator of the impact of the award would be whether unsuccessful applicants
in fact proceeded with the project after their application was denied. In the case of hydrogen,
however, the number of respondents may be too small to make inferences. (Only three of the
seven unsuccessful applicants responded to the survey.) Two of the three respondents who
were unsuccessful applicants indicated their organizations did undertake the project within the
year. From the PONs associated with these proposals, we infer that one of these projects was to
build a hydrogen-refueling station, while another was for readiness planning. The third
respondent said its organization has not proceeded, but the proposal’s objectives were not
clear.
3.6.2 Impact on Knowledge and Capabilities
Respondents felt that the awards had significant impact on their knowledge and capabilities.
Sixty-eight percent of awardees agreed or strongly agreed that the award allowed them to enter
new areas of work (Figure 3.8). Eighty-one percent agreed or strongly agreed that the award
allowed them to expand in areas in which they were already active. Eighty-seven percent agreed
or strongly agreed that the award allowed them to gain knowledge and experience that will be
useful in developing products and technologies besides those funded by the award.
32%
10%
13%
0%
39%
6%
10%
6%
10%
13%
55%
6%
0% 20% 40% 60%
Very likely
Somewhat likely
Just as likely as unlikely
Somewhat unlikely
Very unlikely
No Response
Percentage of respondents
...sought funding for the project from other external sources?
...funded the project at least in part with internal [normal] resources?

69
Figure 3.8. Effect of Award on Hydrogen Awardee’s Organization
SOURCE: RAND survey. NOTE: Based on 31 respondents.
Fifteen of the 31 awardees noted other impacts of the award in comments they made. All
comments but one are positive. Awardees noted that the award did the following:
• increased their knowledge (four comments)
• allowed them to reach their markets (one comment)
• enabled them to proceed with the project (two comments)
• enabled them to pursue their overarching mission (one comment)
• allowed them to gain experience with awards and funding (two comments)
• enabled them to collaborate with other actors in the industry (two comments)
• caused financial hardship because of specific tax requirements (one comment)
• reduced barriers in hydrogen (two comments), which is a question we specifically asked
later in the survey.
55%
13%
10%
10%
6%
6%
68%
13%
13%
6%
52%
35%
6%
6%
0% 20% 40% 60% 80%
Strongly agree
Somewhat agree
Neither agree nor disagree
Somewhat disagree
Strongly disagree
No Response
Percentage of respondents
This award allowed, or will allow, your organiza5on to enter a new area in which you had previously not been ac5ve This award allowed, or will allow, your orgniza5on to expand in an area in which you already had some exper5se or capacity This award allowed, or will allow, your organiza5no to gain knowledge and experience that will be useful in developing products and technologies besides those funded by the grant

70
Note that these comments do not sum to 15 because some awardees made multiple comments.
3.6.3 Inventions or Products Developed During the Project and Market Prospects
Among hydrogen awardees, ARFVTP did not result in any patented innovations. Nevertheless, it
did result in inventions or products with market impact.
In the survey, awardees with the two completed projects were asked if they had continued to
develop, market, install, or produce the product or technology funded by the award after the
project ended. Both reported that they had improved product performance. In addition, one
reported identifying potential customers for its product and working on ways to reduce cost.
Our site visits suggest that there have been market impacts among awardees who had not yet
completed their projects. As one example, one awardee with an ongoing project to build
hydrogen-fueling stations has developed a hydrogen station “kit.” The kit consists of a package
of technology and equipment that already meets local codes and that can be essentially
“dropped in” to new hydrogen stations. This kit has been purchased by another awardee to
rapidly develop a large number of hydrogen-refueling stations. This latter awardee, in turn, is
using its skills in making rapid agreements with station owners, permitting, and construction to
help accelerate its competitors’ deployment of hydrogen stations through subcontracting
arrangements. This suggests that the ARFVTP has helped create technical and logistical
knowledge for developing hydrogen-fueling stations and has facilitated a market for that
knowledge.
3.7 Impacts on Barriers
In this section, we examine the evidence that the ARFVTP reduced barriers to the
commercialization of hydrogen. We discuss infrastructure, fuel, vehicle, and other barriers
separately.
After asking respondents to identify current barriers, we asked awardees, “What contribution(s)
did or will your ARFVTP project make in reducing these barriers?” Table 3.10 compares survey
respondents’ views of current barriers (center column, same data as in Table 3.6) to awardees’
views of which barriers their projects are reducing (right column). According to awardees,
ARFVTP projects appear to be reducing all but one of the barriers, but in many cases, the
program did not make any awards that targeted those barriers (e.g., high fuel-production costs).
It appears that some survey respondents may have thought “reducing” barriers meant the same
thing as “targeting” the barrier, or that general industrywide effects might be attributable to the
program. Or perhaps their optimism led them to believe that if their projects targeted a barrier,
it would reduce the barrier. As a result, we are reluctant to place too much credence on the
meaning of the survey respondents' perceptions of barriers being reduced.

71
Table 3.10. Awardees’ Assessment of Impact of ARFVTP on Hydrogen Barriers
Barrier Existing Barriers (44 Respondents)
Barriers Reduced (31 Awardee
Respondents) Fueling Infrastructure
Insufficient retail fueling or charging infrastructure 78% 65% Difficulty, cost, and delay in obtaining permits for siting fueling/charging stations 56% 35%
Insufficient bulk fuel distribution infrastructure 49% 26%
Lack of industry standards for fueling/charging interface 22% 16% Feedstock and Fuel Production
High fuel-production cost 51% 42%
Limited fuel-production capacity 37% 16%
Limited availability of feedstock for fuel production 15% 16%
Poor emission profile of fuel 5% 10% Vehicles
Limited number of vehicle models available 61% 19%
High vehicle-production cost 46% 16%
Limited vehicle-production capacity 46% 23%
High vehicle lifetime operating and maintenance cost 20% 13%
Inadequate vehicle performance 17% 13%
Insufficient in-use performance of fuel 5% 0%
Poor emission profile of vehicle 2% 3% Other
Insufficient customer awareness of and knowledge about alternative fuels and vehicles 51% 45%
Insufficient pool of labor familiar with alternative fuels and vehicles 32% 29%
SOURCE: RAND survey.
Table 3.11 summarizes the impact of the program on barriers. Our assessments fall into one of
four categories:
• There is evidence that ARFVTP investment has reduced this barrier and that this
reduction would not have occurred without the investments. This is the strongest
argument that a reduction in the barrier has occurred and that it can be attributed to
the program.
• There is no evidence of reduction, but the reduction is a probable consequence of
the award. In this case, there is no clear, quantifiable data supporting that a reduction
has occurred, but a reduction can be expected nevertheless because of the nature of the
program activities undertaken.
• There is no evidence of reduction. This typically means that the program did not target
the barriers, that there is no plausible pathway for the program to have indirectly
reduced them, and that there is no evidence suggesting a reduction has taken place.
• This is not a barrier for hydrogen.

72
We discuss each assessment of the impact of the program on the hydrogen barriers next. These
impact assessments are subject to three limitations discussed in Chapter One. First, clearly
attributing market changes to the ARFVTP is challenging because it is impossible to
unequivocally determine what would have happened in the market without the ARFVTP.
Second, given the wide range in types of barriers and what is involved in addressing them, we
focus only on whether a barrier has been reduced and do not attempt to assess the amount by
which it has been reduced. Finally, while RD&D projects are often necessary to lay the
groundwork for subsequent commercialization, it is difficult to show the impact of such work.
Table 3.11. RAND Assessment of Impact of ARFVTP on Hydrogen Barriers
Barrier As Identified in RAND Survey ARFVTP Impact Fueling Infrastructure
Insufficient retail fueling or charging infrastructure Reduced this barrier; reduction would not have occurred without the investments
Difficulty, cost, and delay in obtaining permits for siting fueling/charging stations
Reduced this barrier; reduction would not have occurred without the investments
Insufficient bulk fuel distribution infrastructure No evidence of reduction
Lack of industry standards for fueling/charging interface
Reduced this barrier; reduction would not have occurred without the investments
Feedstock and Fuel Production
High fuel-production cost No evidence of reduction
Limited fuel-production capacity No evidence of reduction
Limited availability of feedstock for fuel production Not a barrier
Poor emission profile of fuel Not a barrier Vehicles
Limited number of vehicle models available No evidence of reduction, but reduction is a probable (if indirect) consequence of developing fueling stations
High vehicle-production cost No evidence of reduction
Limited vehicle-production capacity No evidence of reduction High vehicle lifetime operating and maintenance cost
No evidence of reduction Inadequate vehicle performance No evidence of reduction
Insufficient in-use performance of fuel Not a barrier
Poor emission profile of vehicle Not a barrier Other
Insufficient customer awareness of, and knowledge about, alternative fuels and vehicles
No evidence of reduction, but reduction is a probable consequence of developing fueling stations
Insufficient pool of labor familiar with alternative fuels and vehicles
No evidence of reduction, but reduction is a probable consequence of developing fueling stations
SOURCE: RAND analysis based on review of technical objectives, literature, and hydrogen data.
3.7.1 Impacts on Fueling Infrastructure Barriers
The ARFVTP had the most direct impact on the barrier of “insufficient fueling or charging
infrastructure” by facilitating the development of hydrogen retail infrastructure. As shown in
Table 3.6, this was also most often identified by awardees as a barrier to the commercial use of
hydrogen and was overwhelmingly targeted by CEC awards.

73
Figure 3.9 shows a map of the open and planned hydrogen stations in California listed in the
DoE’s Alternative Fuels Data Center (AFDC).61 RAND cross-referenced the database of stations in
this list with the addresses of stations noted in CEC’s award documents. It suggests that (at
least) 90 percent of California’s open public hydrogen-fueling stations (26 of 29) were
constructed with ARFVTP support. Additional stations (not shown) received O&M support. All
the planned stations noted in the DoE’s database (which are all public) are being supported by
the ARFVTP. Overall, 82 percent of all planned and open stations, both public and private, will
be supported through the program.
Figure 3.9. Map and Count of Hydrogen Stations in California
SOURCE: Authors, based on AFDC data and ARFVTP project award documents. See DoE, Energy Efficiency and Renewable Energy, “Alternative Fuels Data Center: Hydrogen Fueling Station Locations,” undated. Table 3.12 shows the number of open hydrogen-fueling stations over time until December 5,
2016. It suggests that while there is a long way to go toward reaching the AB 8 target of 100
stations, the program’s efforts are helping. There is very little change in the number of
hydrogen stations opened without ARFVTP support (from one in 2002 to four in 2016), whereas
there is a significant increase, particularly in recent years, in the number of stations that have
been built with the program’s support (from one in 2002 to 26 in 2016). Moreover, many
awardees reported that their projects would not or might not have gone forward without CEC
funding. This collectively suggests that government support to overcome this barrier is both
needed and working.
61 These data are largely but not perfectly consistent with data in ARB (2016 Annual Evaluation of Hydrogen Fuel Cell Electric Vehicle Deployment and Hydrogen Fuel Station Network Development, July 2016), which uses station data through June 2016 and projects station development through the end of 2016. We use the AFDC data because it is updated regularly and because it provides a database of stations with addresses that can be used to cross-reference with stations funded by CEC.

74
Table 3.12. Number of Open Hydrogen-Fueling Stations by Year
2002 2003 2008 2011 2012 2013 2014 2015 2016a CEC funded, public 1 2 2 2 3 4 5 7 26
Not CEC funded, public 1 1 2 3 3 3 4 4 4
SOURCE: AFDC and ARFVTP project award documents. a Through December 5, 2016.
Figure 3.10 shows the volume of retail sales of hydrogen according to CEC data. In 2008,
hydrogen in the California transportation energy pool was 23,980 kg. By 2015, that number
rose to an estimated 60,558 kg. By contrast, the total amount of gasoline consumed in
California in 2008 was 15,032,229,963 gallons, with 15,088,719,295 estimated gallons
consumed for 2015. This means that, while hydrogen use grew between 2008 and 2012, it
supplies only 0.0001 percent as much fuel to the California market as gasoline supplies.62
Figure 3.10. Volume of Retail Hydrogen Sales
SOURCE: CEC, Transportation Fuels Data Unit, Energy Commission Transportation Fuel Volume Summary (In Native Units), Table 2, 1st Quarter Update, provided to authors by CEC, 2016. NOTE: 2015 is an estimate. ARFVTP may also have reduced permitting barriers. While only a few projects specifically
targeted these barriers, others may have reduced them through the experiences of building
stations. Participants in our in-depth interviews noted that station development educated both
the station developers, on how to request permits, and the permitting authorities, in having
more familiarity and permitting experience with hydrogen stations. This is supported by data
62 CEC, Transportation Fuels Data Unit, Energy Commission Transportation Fuel Volume Summary (In Native Units), Table 2, 1st Quarter Update, provided to authors by CEC, 2016.

75
on how schedule delays have been reduced in later station-development awards compared with
earlier station-development awards (see Table 3.9). It is further supported by the recent
successes of rapid station development among some awardees, which they have attributed
partly to improvements in permitting.
There is no evidence that the program reduced bulk fuel-distribution barriers across the
industry (e.g., through a hydrogen pipeline). Instead, the program may have helped overcome
this challenge for specific developers. One project, for example, upgraded a central hydrogen
fill station and developed delivery trucks to deliver that fuel to a network of stations. A few
other projects involved on-site hydrogen production, thereby circumventing the bulk
distribution barrier. Respondents’ statements that their projects would not have taken place
without CEC funding suggest that these impacts can be attributed to the ARFVTP.
The program had significant impact on the lack of industry standards for fueling/charging
infrastructure. One of the functions of the California Department of Food and Agriculture
(CDFA) is to develop standards for fuel quality and testing. Through CEC’s award, CDFA
contributed to developing ASTM (formerly known as the American Society for Testing and
Materials) hydrogen standards, which have now been adopted in California. CDFA also built and
continuously uses a portable calibration vehicle to calibrate the fuel dispensers at a hydrogen
station. With the full-time operation of the certification vehicle and the California standard for
hydrogen quality and quantity verification, a path for commercial growth of hydrogen fueling
now exists. This path would probably not exist without ARFVTP, given that, as CDFA reported,
there was no alternative funding for hydrogen standards development.
3.7.2 Impacts on Feedstock and Fuel-Production Barriers
The program made no awards specifically to address feedstock and fuel-production barriers,
although there are some awards that touch on fuel-production issues. As such, it is difficult to
find evidence that these barriers were reduced and that any reduction can be attributed to the
program’s investments.
In particular, there were no awards that included objectives to target the cost of production,
and there is no evidence that hydrogen retail prices have decreased over time. So, there is no
reason to conclude that CEC’s investments have reduced fuel-production costs.
Limited fuel-production capacity was addressed by a few station-development awards that
included on-site generation of hydrogen, but these are localized increases in capacity rather
than broader market trends. So, here again, it is unclear that CEC’s investments reduced fuel-
production capacity barriers.
Limited availability of feedstock and a poor emission profile of the fuel are not generally viewed
as barriers to commercialization, given that feedstock is generally methane or water and that
FCEVs have no tailpipe emissions.
3.7.3 Impacts on Vehicle Barriers
The greatest vehicle barrier noted among awardees is the limited number of vehicle models.
Two projects sought to develop fuel-cell bus and fuel-cell van technologies, but the limitation

76
also applies to passenger vehicles. The attention to bus and van technology is helpful, but there
is no evidence yet to suggest the barrier has been reduced, given that these projects are still in
progress. There is also no evidence to suggest that the program has reduced barriers related to
vehicle production costs or capacity, vehicle performance, or vehicle operations and
maintenance costs.
Instead, the ARFVTP has left the reduction of vehicle barriers largely to other agencies, such as
CARB and the federal government. As noted, the ARFVTP has contributed $24.5 million to
CARB’s CVRP, which has, as of March 15, 2017, provided $388 million in rebates for plug-in
hybrid electric vehicles (PHEVs), BEVs, FCEVs, and other qualifying vehicles.63 Of the
$388 million, $5 million has been provided in FCEV rebates (0.6 percent), and 1,016 of the
179,713 rebates (0.6 percent) have gone to FCEVs. Assuming proportional use of ARFVTP funds,
approximately $150,000 of ARFVTP funds may have gone toward FCEVs. Until March 2016,
FCEVs were eligible for $5,000 in rebates, meaning the program may have supported the
purchase of approximately 30 FCEVs.64 While this is small in absolute terms, it is significant
considering that, as of April 2016, there were only 331 hydrogen fuel-cell vehicles registered in
the state.65
3.7.4 Impacts on Other Barriers
Two other barriers relate to insufficient customer awareness of, or knowledge about, hydrogen
and an insufficient pool of labor familiar with hydrogen. These were somewhat targeted
through readiness-planning efforts. Perhaps even more plausibly, the efforts to build fueling
stations may have contributed to reducing both of these barriers by drawing attention to, and
creating experiences with, hydrogen. We do not have data (e.g., number of skilled workers) to
test this hypothesis and determine how much this barrier may have been reduced.
3.8 State of the Industry
The survey asked respondents to comment on the state of the industry and the changes in the
industry over the past five years, in terms of both competition and private-sector investment.
As shown in Figure 3.11, two-thirds of respondents agreed or strongly agreed that there are
many competitors in developing and deploying hydrogen fuels and vehicles and that the
number of competitors has increased in the past five years. However, as shown in Figure 3.12,
only about one-third agreed or strongly agreed that there are many private-sector investors,
while an almost equal number (29 percent) disagreed or strongly disagreed with this statement.
And approximately one-third of respondents agreed or strongly agreed that private-sector
investment had increased over the past five years, while an equal number disagreed or strongly
disagreed. This suggests that, while the competition has grown and more firms are entering the
63 California Clean Vehicle Rebate Project, “CVRP Rebate Statistics,” last updated June 1, 2017. 64 From March 29, 2016, to October 31, 2016, this rebate increased to $6,500 per vehicle and was increased to $7,000 thereafter. See ARB, Implementation Manual for the Clean Vehicle Rebate Project (CVRP), May 23, 2017. 65 See ARB, 2016 Annual Evaluation of Hydrogen Fuel Cell Electric Vehicle Deployment and Hydrogen Fuel Station Network Development, 2016.

77
market, the number of investors may be lagging, or there may be mixed experiences with
investors in the hydrogen market.
Figure 3.11. Hydrogen Industry Competition
SOURCE: RAND survey. NOTE: Based on 43 respondents.
33%
33%
14%
9%
7%
5%
42%
23%
9%
12%
9%
5%
0% 20% 40% 60%
Strongly agree
Somewhat agree
Neither agree nor disagree
Somewhat disagree
Strongly disagree
No response
Percentage of respondents
Currently there are many organiza5ons compe5ng with your organiza5on
Compared to five years ago [that number] has increased.

78
Figure 3.12. Private-Sector Investment in Hydrogen Industry
SOURCE: RAND survey. NOTE: Based on 43 respondents.
Consistent with this, all respondents noted that some type of government support was required
(Figure 3.13). Ninety-eight percent said government funding was needed to support
demonstration and deployment programs. Seventy-one percent felt that the government needed
to set requirements on quantities of alternative fuels and vehicles sold. More than 60 percent
noted that consumer tax breaks were warranted. And approximately one-half supported each of
the remaining avenues of funding. In addition, more than one-third suggested other areas of
government support.
7%
26%
28%
12%
23%
5%
9%
23%
30%
16%
16%
5%
0% 20% 40%
Strongly agree
Somewhat agree
Neither agree nor disagree
Somewhat disagree
Strongly disagree
No response
Percentage of respondents
Currently there are many private-‐sector investors.
Compared to five years ago, [that number] has increased.

79
Figure 3.13. Activities Needed to Facilitate Market Viability of Hydrogen Industry
SOURCE: RAND survey. NOTE: Based on 42 respondents.
3.9 Views of Hydrogen Stakeholders on ARFVTP Investment Priorities
We asked hydrogen stakeholders open-ended questions about their views of how the ARFVTP
has invested its funding. We asked the question, “Based on your understanding of how CEC
allocates funds, how do you think CEC should allocate funds differently [by fuel type or market
segment]?” Thirty percent of survey respondents (13 of 44) did not have comments (data not
shown). Of the 31 responses, the most-common comments were that more investment should
be made in hydrogen in general (14 percent of respondents) and hydrogen infrastructure in
particular (14 percent of respondents). Others noted that less funding should be given to
electricity (9 percent), yet others suggested more (5 percent). In terms of the hydrogen market
segment, many noted a need for more investment in hydrogen-fuel production (11 percent of
respondents), vehicles (7 percent), and renewable hydrogen in particular (7 percent). Nine
percent of respondents felt that no change was necessary.
We next asked how resources should be allocated across hydrogen-technology development
stages. There was a very low response rate, with 64 percent of respondents not answering this
question and 35 percent (16 respondents) offering views (data not shown). Fourteen percent of
98%
71%
63%
63%
56%
51%
49%
39%
0% 20% 40% 60% 80% 100% 120%
Government grant programs that fund demonstra5on and deployment
Requirements on the quan55es of alterna5ve fuels and vehicles produced or sold
Carbon tax or tax on petroleum-‐based fuels
Consumer tax breaks or purchase subsidies
Government grant programs that fund research and development
Consumer awareness programs
Producer tax breaks or produc5on subsidies
Other
Percentage of respondents

80
respondents suggested more investment in RD&D, while 11 percent suggested more investment
in PD&D. No other common views were given by more than 2 percent of respondents.
Finally, we asked how CEC should invest its resources in the next five years. Twenty-three
percent of survey respondents (10 of 44) did not answer this question (data not shown). Of the
34 respondents who did, 40 percent expressed support for greater investment in hydrogen
infrastructure, and 20 percent expressed support for greater investment in renewable hydrogen
production in particular. Eleven percent supported further investment in heavy-duty vehicles
(HDVs), in hydrogen or more generally, and another 11 percent supported investment in
whatever fuel types or supply-chain pathways would lead to greatest reduction in GHG
emissions. No other common views were given by more than 5 percent of respondents.
3.10 Conclusions
In this chapter, we analyzed the impact of the ARFVTP on the barriers to the market viability of
hydrogen as a transportation fuel. The greatest barriers are the mutually reinforcing realities of
an insufficient number of hydrogen vehicles on the road to make developing a network of
hydrogen-refueling stations economically feasible and an insufficient network of hydrogen-
refueling stations to make consumers’ use of hydrogen vehicles practical. While other barriers
to widespread hydrogen use exist, solving this “chicken-and-egg” problem is necessary simply
to allow for a market for hydrogen as a transportation fuel.
The ARFVTP has invested nearly all its hydrogen funding into developing and operating
hydrogen-refueling stations, largely because federal and CARB incentives already exist to
support vehicle deployment. This investment priority became a legislative requirement with the
passing of AB 8 in September 2013, which required CEC to allocate $20 million to hydrogen-
fueling infrastructure annually until 100 public stations are available or funding is not needed.
The program has funded the development of 48 hydrogen-fueling stations and approximately
one-half of them are currently open, while the other one-half are still under development. Thus,
since the program began, there has been a significant increase in the number of hydrogen-
fueling stations in California, although many more stations are still needed, and the program’s
efforts are still very much in progress. In addition, the amount of hydrogen dispensed through
those stations remains low, so it is too soon to assess the returns on these investments. The
expectation is that as more FCEVs are adopted, hydrogen sales will increase, but, to date, very
little gasoline has been displaced. It will also be useful in the future to empirically evaluate
whether the locations of stations are appropriate, given how the adoption of FCEVs progresses
and how locations have shaped adoption.
Nevertheless, the growth can be clearly attributed to the program’s investments: Most stations
in California received funding from the ARFVTP, and, in the absence of this funding, these
stations would likely not have been built. This claim is supported by awardees who stated that
they would not have built hydrogen-fueling stations without ARFVTP support and is further
validated by the fact that there are almost no hydrogen stations in other states. A key lesson,
therefore, is that CEC support is needed in the hydrogen market, which does not appear self-

81
sustaining at this time. Trends in market competition are promising but not yet enough to
make CEC investment unnecessary.
The lessons learned in these station-development efforts are also helping to overcome
challenges associated with building hydrogen-refueling stations, such as permitting, technical
design, and cost. In the past, these issues have resulted in significant project delays.
Nevertheless, there is evidence that those delays are now being reduced. In addition, the
ARFVTP has funded the development of standards and protocols that were needed to allow
hydrogen to be sold to consumers at retail locations. Finally, the program has made a few
smaller investments in other areas (e.g., developing nonpassenger hydrogen vehicles and
hydrogen readiness plans), although the impacts of these efforts are less clear.
In sum, the ARFVTP’s investments have lowered (although not yet eliminated) one of the most
significant barriers to the use of hydrogen as a transportation fuel. Nevertheless, other barriers
still exist, related to feedstock, fuel production and bulk distribution, and vehicle design and
performance. There is no evidence at this time to suggest that CEC should prioritize the
reduction of those barriers over the funding of refueling stations. Moreover, doing so would
require spending in hydrogen above and beyond the $20 million legislatively earmarked
through AB 8 for refueling stations. Nevertheless, CEC should continue to review both its
priorities and its allocations in hydrogen in the years to come.

82
CHAPTER 4: Impact of Program on Barriers to Market Viability of Plug-In Electric Vehicles
In this chapter, we analyze the impact of the Alternative and Renewable Fuel and Vehicle
Technology Program (ARFVTP) on the barriers to the market viability of plug-in electric vehicles
(PEVs). We begin with a summary of the data sources that inform the analysis. We then provide
a brief technical overview of electric vehicle (EV) technologies, before describing the barriers to
using electricity as a transportation fuel. Following sections reviewing the California Energy
Commission’s (CEC’s) solicitations and awards related to PEVs, we discuss awardee
performance, before discussing the impact of the ARFVTP on the awardees and on the barriers
to market viability. We then discuss PEV stakeholder views about ARFVTP investment priorities
and end with our conclusions.
4.1 Summary of Data Sources
The data for the analysis are drawn from a number of sources, including administrative data
from CEC, project documentation (proposals, statements of work, critical project review
presentations and, for completed projects, final project reports), and external literature. In
addition, in-depth interviews with selected ARFVTP-funded projects and the survey of
awardees, potential applicants, and nonapplicants are important inputs to the analysis.
We also conducted 11 in-depth interviews with a sample of ARFVTP PEV awardees, selected
based on the range of experiences encountered during the execution of their projects. That is,
we interviewed awardees who were very successful in implementation and those who went
bankrupt during the project execution period. As part of the 11 in-depth interviews, we
interviewed awardees from different types of projects, including vehicle research, development,
and demonstration (RD&D) (three awardees); vehicle production, deployment and
demonstration (PD&D) (three awardees); charging infrastructure deployment (four awardees);
and development of regional plug-in vehicle readiness plans (one awardee). The goal of these in-
depth reviews was to gain detailed insight about the types of obstacles awardees encountered
and understand the extent to which their projects helped reduce barriers to the market viability
of PEVs. All projects for which we conducted in-depth reviews are either complete or nearly
complete (e.g., work completed but final report in process).
Our survey sought feedback from awardees, unsuccessful applicants, and potential applicants
to the ARFVTP. The data gathered in this survey provide a broad overview of the opinions and
experiences of EV stakeholders in the private and public sectors.
As shown in Table 4.1, the survey response rate for electricity awardees was 81 percent (106
out of 131), and the response rate for unsuccessful applicants was 49 percent (35 out of 72).
Twenty-two potential applicants for electricity awards also completed the survey.

83
Table 4.1. Response Rates of Electricity Survey Respondents
Category
Number in Survey Sample Respondents
Response Rate
(Percentage) Awardees 131 106 81%
Project complete 54 44 82% Project ongoing 67 56 84% Project not yet started 1 1 100% Project canceled/terminated 9 5 56%
Unsuccessful applicants 72 35 49% Potential applicants n/a 22 — Total — 163 —
SOURCE: RAND survey. NOTE: Potential applicants could not all be categorized by fuel type.
4.2 Technical Overview of Electricity as a Fuel and of Electric and Hybrid Vehicles
4.2.1 Electricity as a Transportation Fuel
If commercially successful, battery electric vehicles (BEVs) and plug-in hybrid electric vehicles
(PHEVs) promise significant reductions in greenhouse gas (GHG) emissions and other local air
pollutants. As electricity generation firms respond to expanded supplies and lower prices for
natural gas and the benefits of transitioning away from coal, the potential of grid-fueled BEVs
and PHEVs to reduce GHG emissions will grow. As GHG emission regulations on power plants
are phased in, the emissions reductions for these types of vehicles will also grow. The carbon
intensity (CI) of electricity as a transportation fuel depends on regional sources of the
electricity. According to the California Environmental Protection Agency’s Air Resources Board
(ARB), the Energy Economy Ratio (EER)–adjusted CI value for electricity in California averages 30
grams of carbon dioxide per megajoule (MJ) of conventional fuel displaced (gCO2e/MJ), based
on the state’s electricity generation sources in 2015.66 One would expect that this CI, which
places California’s electricity at a similar average EER-adjusted CI value as biomethane, would
decrease further as the state increases the share of electricity it draws from renewable sources.
Government policies are attempting to stimulate the commercial success of BEVs and PHEVs,
both federally and in individual states. Revisions to the state’s zero-emission vehicle (ZEV)
regulations adopted in 2012 by the CARB require significant increases in producing zero–
tailpipe emission vehicles through 2025. BEVs, PHEVs, and hydrogen fuel-cell vehicles (FCEVs)
represent the main technological options for meeting these requirements. Thirteen states and
the District of Columbia have adopted, or are planning to adopt, the new CARB provisions,
spreading government interventions to promote BEVs and PHEVs beyond California. Also, more-
stringent federal standards for GHGs adopted in 2012 for the 2017–2025 time frame could
further stimulate BEV and PHEV production and marketing on a national scale. Purchase and
tax incentives continue to exist as consumer stimuli, as do numerous executive orders at the
66 ARB, “Data Dashboard,” arb.ca.gov, chart 5, May 18, 2017.
84
federal and state level aimed at maintaining the high level of enthusiasm for BEVs and support
for incentive funding.
The recent generation of consumer EVs—beginning in 2011 with the nationwide availability of
the Nissan Leaf and Chevrolet Volt—have had relatively low electric range-per-charge (typically
between about 62 and 124 miles for BEVs, depending on particular vehicle and model year67)
compared with an internal combustion engine (ICE) vehicle, which can typically be driven more
than 300 miles per fill-up. These limitations on range-per-charge have been driven primarily by
the high cost of lithium-ion (Li-ion) battery cells and the need for auto manufacturers to
produce a vehicle that is affordable to the consumer after government incentives have been
applied. In the context of these range limits, BEVs in particular require convenient and reliable
electric-charging infrastructure, from which PHEVs can also benefit. (PHEVs can run on gasoline
when the batteries are depleted, but the all-electric mode offers much lower per-mile energy
costs, along with better environmental performance, an important consideration for many early
PHEV adopters.) As such, having access to convenient charging infrastructure—along with other
factors such as high vehicle cost, concern with battery longevity and safety, and customer
inconvenience associated with limited driving range per charge—is viewed as a critical issue
that should be addressed to help bolster the prospects for the commercial success of EVs.
It is worth noting that at time of writing, the 2017 Chevrolet Bolt is being introduced across the
United States for a manufacturer’s suggested retail price of $37,500 and with an Environmental
Protection Agency (EPA)–estimated range-per-charge of 238 miles. The future availability of
more BEV models with higher range and at lower cost are expected to mitigate the barriers to
adoption that have accompanied the range limitations of recent BEVs. Also, BEVs with
significantly longer range-per-charge have been available from Tesla Motor Corporation since
2008. The Roadster was first produced in 2008, with an EPA-estimated all-electric range of 221
miles, and the Model S and Model X were released in 2012 and 2015, respectively, with variants
offering between 208 and 315 miles per charge. However, with retail prices ranging from
$60,000 (for the 40 kilowatt-hour [kWh] Model S) to more than $140,000 (for the 90-kWh Model
X), these vehicles are marketed primarily for luxury buyers and are out of financial reach for
most drivers.
Another concern relates to the amount of time required to recharge an EV, which greatly
exceeds the amount of time required to refill a tank with gasoline or diesel fuel. The specific
amount of time depends on the electric configuration of the charging equipment, the storage
capacity of the battery pack, the efficiency of the vehicle, and the amount of driving before
recharging. Charging stations are typically grouped into three categories—Level 1, Level 2, and
Level 3 direct current fast charging (DCFC)—based on their voltage and, thus, kilowatt rating
67 The 2017 Mitsubishi MiEV has an EPA rating of 62 miles per charge. The 2017 Hyundai Ioniq Electric has an EPA-estimated 124 miles per charge. Most other BEVs have ranges somewhere between those values, with the notable exceptions being the 2017 Chevrolet Bolt (238 miles) and the Tesla vehicles, which have delivered ranges above 200 miles at a premium price since 2008. For the driving range for the broad array of all-electric vehicles, as estimated by the EPA, see U.S. Department of Energy (DoE), Energy Efficiency and Renewable Energy, www.fueleconomy.gov, May 21, 2017.

85
(where watts are computed as the product of circuit voltage and amperage).68 Table 4.2
summarizes key attributes of these charging levels.
Table 4.2. Charging Level Attributes for EVs
Charge Level Attributes
Approximate Charge Time from Emptya
Driving Range Replenishmentb
Typical Recharging Application
Level 1
• 120-volt, 12–16 amp, 1.4–1.9 kilowatt (kW) typical, standard electrical outlet
• Uses standard Society of Automotive Engineers (SAE) J1772 coupler
• In-vehicle power conversion
8–20+ hours 2–5 miles per hour of charging At home
Level 2
• 208–240-volt, 15–80 amp dedicated circuit, up to 19.2 kW (6-10 kW typical)
• Installation of special charging equipment • May require upgrades to local electrical
service (panel, wiring) • Uses standard SAE J1772 coupler • In-vehicle power conversion, charging
speed limited by the onboard charger
4–8 hours 10–20 miles per hour of charging
At home, workplace, public access
Level 3 (DCFC)
• 480-volt, up to 400 amp, up to 240 kW (~50 kW typical), requiring commercial-grade electrical power and utility upgrades
• Free-standing units, often higher profile • Rapid charging of EV battery to 80%
capacity • ChaDeMo or Combined Charging Standard
(CCS) plug
30–60 minutes
50–70 miles per 20 minutes of charging
Heavy-use public access
SOURCES: SAE International, “SAE Charging Configurations and Ratings Terminology,” 2011; DoE, Energy Efficiency and Renewable Energy, “Alternative Fuels Data Center: Developing Infrastructure to Charge Plug-in Electric Vehicles,” 2017. a Depends on the vehicle model, and vehicle models vary considerably in terms of electric range and battery size. b Depends on vehicle energy efficiency (typical 3–5 miles/kWh), and power delivery rate during charge. Electric utilities and the major vehicle original equipment manufacturers (OEMs) have
significantly studied the issue of consumer concerns about the limited range of BEVs. Available
evidence indicates that a BEV with a range of 60–70 miles between charges could accommodate
the daily needs of many travelers, because 95 percent of individual daily vehicle trip totals are
less than 40 miles.69 Even a PHEV with just 15 miles of all-electric range could support a
significant share of U.S. vehicle travel in all-electric mode. Still, given the higher cost of BEVs
and PHEVs—and the significant range limitations and potentially long charging times for
BEVs—OEMs are focusing on delivering early EV offerings to niche market consumers who can
comfortably live with these challenges. Focusing on better understanding where these niche
markets or geographic clusters of potential BEV owners exist nationally could provide benefits
for
68DoE, “Alternative Fuels Data Center: Developing Infrastructure to Charge Plug-in Electric Vehicles,” 2017. 69Federal Highway Administration, “National Household Transportation Survey: Our Nation’s Travel,” 2009.

86
• vehicle OEMs in defining markets and their scope and scale
• utilities in planning for electricity distribution and system upgrades
• recharging infrastructure providers, workplaces, multiunit dwellings, commercial/retail
destinations, and municipalities involved in charging port placement
• government regulators in developing their transportation and air quality planning
programs.
Addressing recharging infrastructure issues is critical to serving these niche markets, even if
they remain limited to small volumes in the next 10 to 15 years. Vehicle OEMs have a better
understanding based on their initial experiences in marketing BEVs in the 1990s that translates
to constructive solutions today. For example, several OEMs have recently established
nationwide processes to ease the burden experienced by BEV purchasers in upgrading their
single-family home garages for charging ports. OEMs also now have a much better
understanding of the management of onboard battery control, monitoring, and system
optimization, which has the benefit of providing optimized battery longevity and better
customer experience.
The EV Project created by DoE and managed by ECOtality and the Idaho National Laboratory
produced data on charging infrastructure use and BEV charging trends, which could inform
future decisions on the amount and type of charging infrastructure needed to support the
commercial success of BEVs. In total, more than 12,000 alternating current (AC) Level 2
stations70 and 111 DCFC stations71 were installed and have provided data.
4.2.2 Electric Vehicle Technologies
4.2.2.1 Hybrid Electric Vehicles
Hybrid electric vehicles (HEVs) use both energy from an ICE and electricity that is stored in a
battery, capacitor, or other device. In conventionally fueled hybrids, the electricity is generated
onboard the vehicle by the ICE or through regenerative braking, whereas in PHEVs, electricity
can also come from an external source such as the grid. Within the general category, HEVs are
often characterized as “mild,” “medium,” or “full,” depending on the electric-drive capabilities
of the vehicle and associated drivetrain voltage.
HEVs are used in a wide variety of light-, medium-, and heavy-duty vehicle (LDV, MDV, and HDV,
respectively) applications and are generally not limited in vehicle performance relative to
conventional vehicles. Conventional hybrid technology in the light-duty fleet is viewed by CEC
as already having reached a stage of self-sustaining commercial success; thus, CEC interest in
EV technology is generally focused on MDV and HDV applications.
70Idaho National Laboratory, Charging Infrastructure Use Profiles and Installation Costs for 17,000 Units, January 12, 2015. 71Idaho National Laboratory, The EV Project: What Were the Cost Drivers for the Direct Current Fast Charging Installations? March 2015.

87
A primary motivation behind conventional HEVs has been to reduce the amount of fuel
consumed by the ICE through the capture and use of energy otherwise lost during braking. Also
important is the downsizing of the ICE allowed in hybrids because the electric motor can
provide supplemental power when needed. Reduced fuel consumption translates into reduced
GHG emissions. Another motivation for policymakers to foster the development of conventional
HEVs is that although they are quite similar to conventional ICE-only vehicles, they may help
consumers transition to more advanced types of electric-drive vehicles. In addition, given that
many HEV components are also used with more advanced types of EVs, policymakers have also
promoted HEVs as a means of speeding the development of and reducing the cost of more
advanced EVs.
4.2.2.2 Plug-in Hybrid Electric Vehicles
PHEVs have hybrid electric-gasoline drivetrains with the equipment and battery capacity to
receive and store electricity from an external source. All PHEV designs are capable of traveling
for some distance on only electric power and then transitioning to power provided by an ICE.
However, some PHEV designs depend more on the simultaneous use of stored electrical energy
and power from the ICE. As with conventionally fueled HEVs, PHEVs do not face any significant
performance limitations compared with conventional ICE-only vehicles and could be used in a
wide variety of LDV, MDV, and HDV applications.
The motivation for policies promoting PHEVs includes the motivation associated with
conventional HEVs. However, additional factors motivate PHEV policies, including the absence
of emissions from the vehicle during all-electric operation, reduced dependence on petroleum,
and reduced GHG emissions. The overall reduction in GHG emissions and criteria emissions
(nitrous oxide [NOx], carbon monoxide, and hydrocarbons) depends on the methods used to
generate the electricity.
4.2.2.3 Battery Electric Vehicles
BEVs operate based on energy stored in a battery pack that is primarily recharged by connecting
it to an external electricity source. The vehicle also uses energy produced through regenerative
braking, which in some circumstances could be stored in devices other than the battery pack, if
present.
The most common application for BEVs is as small LDVs. However, BEV applications also
include motorcycles and MDVs and HDVs intended primarily for commercial uses. Because
most BEVs have limited range and require long recharging times, BEV applications have focused
on private vehicles used for commuting and commercial vehicles that do not require long travel
ranges.
The current development and marketing of BEVs is driven largely by the CARB’s ZEV
regulations and Advanced Clean Car program. The ZEV program was originally adopted in 1990
and required that BEVs account for 2 percent of 1998 model-year passenger car sales and for
higher fractions in later model years. In 1990, the primary motivation for BEVs was that they
produce no direct emissions of criteria air pollutants (hydrocarbons, carbon monoxide, and

88
NOx) and could thus significantly reduce air-quality problems associated with emissions from
operating large numbers of conventional vehicles. Additional advantages of BEVs sought by
policymakers included reduced dependence on petroleum in general and petroleum from
foreign sources in particular, as well as reductions in GHG emissions.
Considerable progress has occurred in improving BEV performance since the mid-1990s,
primarily because of the transition to Li-ion batteries, which have much higher energy density
relative to their predecessor technology—nickel-metal-hydride batteries—and thus are able to
accommodate longer driving ranges per charge. At the same time, though, it has not yet proven
possible to fully capitalize on the greater energy density of Li-ion chemistries because of the
higher cost and challenges associated with safety and quality control. Thus, most of the
currently available mass-market BEV models offer approximately 100 miles of driving range,
while most PHEV models offer less than 40 miles of all-electric range.
4.3 Barriers to Use of Electricity as a Transportation Fuel
In terms of the barriers to using electricity as a transportation fuel, we focused on two areas
where barriers exist: fuel infrastructure and vehicles. We do not include the generation of
renewable electricity because it is outside the scope of the ARFVTP. Table 4.3 identifies the
barriers in the two areas, which are discussed in more detail below.
Table 4.3. Barriers Identified for Using Electricity as a Transportation Fuel
Market Segment Barrier Description
Fueling infrastructure
• Low availability of public Level 2 (240V) charging stations • Low availability of DCFC stations • Difficult home charging at multifamily residences or where limited to on-street parking • Unclear commercial viability of unsubsidized public charging stations • Electrical codes and standards for installation of electric vehicle supply equipment (EVSE)
not universally adopted at beginning of modern EV rollout (~2011) • Cost of at-home charging infrastructure (~$2,000 for Level 2 EVSE and electrical upgrades) • Cost of installing public charging sites (~$5,000–$10,000 per DCFC station, ~$2,000 per
Level 2 station) • Variable interest from property owners for siting stations
Vehicles
• Higher vehicle cost compared with ICE vehicles • Low range per charge in most affordable cars (~60 miles to ~124 miles) • Lengthy recharge times (hours on Level 2; ~30 min on DCFC) • Impact of DCFC on battery degradation • Higher cost of PEV commercial/utility trucks compared with gasoline/diesel counterparts
SOURCE: The barriers were identified through discussions with awardees during in-depth interviews and through the review of awardee documentation and various other sources.
We also gleaned information on which barriers are regarded as most significant by the EV
community through the RAND survey. Figure 4.1 below shows some results from the survey,
with respondents answering the question, “What are the current barriers to the market viability
of the alternative fuels and vehicles most closely connected to your award, application, or
organization?” Respondents were allowed to select all barriers that applied; the results reflect
the perceived barriers at the time the survey was completed in September 2016. As shown in

89
Table 4.1, 163 electricity stakeholders responded to the survey in general. Of those, 157
responded to the question about current barriers, and their responses are tallied in Figure 4.1.
Figure 4.1. Barriers to Market Viability of EVs Cited in Survey Responses
SOURCE: RAND survey. NOTES: Full label for the second blue bar reads “Difficulty, cost, and delay in obtaining permits for siting fueling/charging stations.” Full label for the first gray bar reads, “Insufficient customer awareness of and knowledge about alternative fuels and vehicles.” Current barriers based on 157 electricity survey respondents who cited at least one barrier.
The barriers are listed in three categories: vehicle-related (red), fuel-related (blue), and other
(gray). In each category, the barriers with the most selections by respondents are listed first,
followed by those with fewer selections. The top five barriers identified by survey respondents,
in order of decreasing significance, were (1) high vehicle production cost (61 percent);
(2) insufficient retail charging infrastructure (60 percent); (3) insufficient customer awareness
of, and knowledge about, alternative fuel (55 percent); (4) inadequate vehicle performance
(47 percent); and (5) difficulty, cost, and delay in obtaining permits for siting fueling
infrastructure (38 percent). Very close in frequency to the fifth most frequently identified
barriers was the sixth: limited number of vehicle models available (35 percent).
Forty respondents indicated there were other barriers beyond the list provided and wrote in
explanations. Of those, 16 responses could arguably be placed in one or more of the existing
listed barriers, and two were disclaimers effectively stating that the question did not apply to
the respondent’s project (“none of the responses above apply to our situation” and “we are a
state agency”). The remaining 22 written explanations ranged from very specific to very vague.
61.1% 47.1%
35.0% 23.6%
11.5% 0.6%
59.9% 37.6%
23.6% 8.9%
5.7% 5.1%
0.6% 0.6% 0.6%
55.4% 26.8%
21.7%
0% 20% 40% 60% 80%
High vehicle produc5on cost
Inadequate vehicle performance
Limited number of vehicle models available
Limited vehicle produc5on capacity
High vehicle life5me opera5ng and maintenance cost
Poor emission profile of vehicle
Insufficient retail fueling or charging infrastructure
Difficulty, cost, and delay in obtaining permits for si5ng fueling/
Lack of industry standards for fueling/charging interface
Insufficient bulk fuel distribu5on infrastructure
High fuel produc5on cost
Limited fuel produc5on capacity
Limited availability of feedstock for fuel produc5on
Insufficient in-‐use performance of fuel
Poor emission profile of fuel
Insufficient customer awareness of and knowledge about alterna5ve
Other
Insufficient pool of labor familiar with alterna5ve fuels and vehicles
Percentage of respondents ci5ng barrier

90
Here are some examples of written-in “other” barriers that did not fit into the other listed
items:
• “There is a false perception of ‘inadequate vehicle performance (e.g., range, recharge)’ by
customers.”72
• “Limited EV inventory, disinterested distributors; range anxiety/tech maturity.”73
• “[Low] market demand.”
• “Railroad industry rejection of electrification.”
• “Need a universal DC [direct current] port. Each DC unit was 50% more for dual-port
handles (CHAdeMO and SAE combo).”74
• “The barriers listed are specific to MASS ADOPTION of plug in vehicles and are lessening
over time.”
• “Cooperation of CARB for alternative technologies, they follow one set of guidelines
only.”
• “Not enough commercial data points for fleet confidence.”
• “Requirements for networked charging systems drives the cost up almost tenfold.”
• “Regulatory issues on grid interconnection associated with V2G [vehicle to grid].”
Table 4.4 presents a revised list that takes into account the barriers identified in Table 4.3, as
well as the ranking of barriers identified by survey respondents in Figure 4.1. In addition, we
have grouped each barrier into either a “more critical” or “less critical” category, based on the
ranking of the barriers by the survey respondents and our discussions with awardees in the in-
depth reviews. We define “more critical” as those barriers that, if significantly reduced, would
be most effective at enabling widespread market viability of EVs in competition with ICE
vehicles. No ranking of these barriers is implied by the order within each box.
72This comment refers to the idea that EVs could meet most customers’ real needs, even if the customer’s perception is that they would not. 73“Disinterested distributors” may refer to retail car dealerships not being enthusiastic about selling EVs, an observation reported by customers (see Matt Richtel, “A Car Dealers Won’t Sell: It’s Electric,” New York Times, November 25, 2015. 74This refers to the two competing and non-cross-compatible standards for DCFC, with different vehicles adhering to different plug styles. This necessitates DCFC stations being built with one of each type of plug.

91
Table 4.4. Revised Barriers for Using Electricity as a Transportation Fuel Grouped by Criticality
Market Segment
Level of Importance Barrier Description
Fueling infrastructure
More critical
• Difficult home charging at multifamily residences or where limited to on-street parking
• Low availability of at-work charging • Low availability of DCFC stations • Cost to install public charging sites (ranging $8,500–$50,000 for DCFC stations
depending on site-specific issues,a ~$3,000 per Level 2 station)b
Less critical
• Low availability of public Level 2 (240V) charging stations • Unclear commercial viability of unsubsidized public charging stations • Electrical codes and standards for installation of EVSE not universally adopted
at beginning of modern EV rollout (~2011) • Cost of at-home charging infrastructure (~$1,400 for Level 2 EVSE and
electrical upgradesc) • Variable interest from property owners for siting stations • Insufficient retail fueling or charging infrastructure • Difficulties in siting charging stations • Multiple standards for charging interface
Vehicles
More critical
• Higher vehicle cost compared with ICE vehicles • Low range per charge in most affordable cars (~60 miles to ~124 miles) • Lengthy recharge times (several hours on Level 2; ~30 min to 1 hour on DCFC) • Insufficient customer awareness of and knowledge about EVs
Less critical • Impact of DCFC on battery degradation • Lack of enthusiasm for selling EVs at car dealerships • Limited number of vehicle models available
SOURCE: These barriers were identified through discussions with awardees during in-depth interviews and through review of awardee documentation and various other sources, as well as by the consideration of responses to the RAND survey on the importance of different barriers to PEV commercial viability. Sources for cost estimates of EVSE installations are listed in the notes for this table. a Cost range for DCFC installations is based on data analysis from the EV Project and is corroborated by discussions with CEC awardees in in-depth reviews. Idaho National Laboratory, The EV Project: What Were the Cost Drivers for the Direct Current Fast Charging Installations? March 2015. b Idaho National Laboratory, How Do Publicly Accessible Charging Infrastructure Installation Costs Vary by Geographic Location? May 2015. c Idaho National Laboratory, How Do Residential Level 2 Charging Installation Costs Vary by Geographic Location? April 2015. Note that we have placed those barriers about public availability of charging infrastructure in
the “less critical” section for fuel infrastructure. In particular, there is mounting evidence that
EV owners do the vast majority of their charging at home and at work when available. For
example, the Idaho National Laboratory analyzed data from more than 6 million “charging
events” carried out by over 8,300 PEVs (Nissan Leafs and Chevy Volts) and participating Blink
charging stations throughout the United States between January 2011 and December 2013,
during the federally funded EV Project. It found that PEV drivers who had access to both home
and workplace charging performed nearly all their charging at those locations, rarely using
public charging elsewhere. In particular, Volt drivers did 57 percent of their charging at home;
39 percent at work; and only 4 percent at other locations. Leaf drivers did 65 percent of their

92
charging at home; 32 percent at work; and only 3 percent at other locations.75 Thus, while
publicly accessible charging infrastructure is useful in certain circumstances, it seems “less
critical” to continue investing heavily in Level 2 (240V) public-charging infrastructure outside
the home or workplace. Conversely, it is “more critical” to invest in charging infrastructure
where parked PEVs spend most of their time: at home and at workplaces. It is also “more
critical” to invest in DCFC to enable longer road trips, especially between major metropolitan
areas, beyond the typical 100-mile range of a BEV.
As is apparent from our own analyses and discussions with awardees in in-depth reviews and in
survey responses from awardees, unsuccessful applicants, and potential applicants, there
appear to be myriad specific barriers that serve as obstacles to the market viability of EVs. We
will review how much the ARFVTP contributed toward reducing some of these barriers later in
this chapter.
4.4 Review of CEC’s Solicitations and Electricity Awards
The ARFVTP made 133 electricity awards totaling $179.1 million between July 2009 and
January 2015. As shown in Table 4.5, just under $49 million (27 percent) of that was awarded
for fueling infrastructure projects, and just over $130 million (73 percent) was awarded for
vehicle projects. Within the fueling infrastructure category, the vast majority of the funding
($41.4 million of $48.9 million) went to installing EVSE, with modest amounts allocated to
RD&D and PEV readiness plans. Most of the funding in the vehicle category went to producing
or deploying PEVs, with the remaining allocation to RD&D of EVs.
Table 4.5. Electricity Projects and Funding
Projects Amount Awarded
Project Type Number Percentage
of Total ($ M) Percentage
of Total Fueling Infrastructure
RD&D 3 2% $3.4 2% Installation of EVSE 69 52% $41.4 23% PEV readiness planning 18 14% $4.1 2% Other 0 0% $0 0%
Total fueling infrastructure 90 68% $48.9 27% Vehicles
RD&D 24 18% $55.8 31% PD&D 19 14% $74.4 42% Other 0 0% $0 0
Total vehicles 43 32% $130.2 73% Total for all electricity projects 133 100% $179.1 100%
SOURCE: CEC administrative data as updated by survey respondents.
The map in Figure 4.2 shows awards as circles with sizes based on the amount of funding
approved, plotted by the zip code of the recipient. The largest award was $18 million to
CALSTART Inc., for the CLEAN Truck Demonstration program, which had multiple subawards
and was headquartered out of Pasadena. The second largest award was $17.5 million to the
75Idaho National Laboratory, Summary Report: Plugged In: How Americans Charge Their Electric Vehicles, 2015.

93
CARB (in Sacramento) for the Clean Vehicle Rebate Program (CVRP), which provides a monetary
rebate incentive to buyers of BEVs ($2,500 per vehicle) and PHEVs ($1,500 per vehicle). The
smallest award was $5,000 to Joe Carlson Studio to install two Level 2 EVSEs at a commercial
building in Compton.
Figure 4.2. ARFVTP Awards for Electricity Projects by Zip Code Between July 2009 and January 2015
SOURCE: CEC list of ARFVTP awards and contracts.
4.4.1 Barriers Targeted by Electricity Projects
One way to assess the barriers targeted by the ARFVT program is to review the amount of
funding approved for different types of projects. Table 4.6 shows the barriers targeted by the
ARFVTP based on award funding. The targeted barriers listed are drawn from a combination of
the electricity-specific barriers stated in Table 4.4 and the generic fuel barriers selected by
survey respondents (shown in Figure 4.1).

94
Table 4.6. Barriers Targeted by Electricity Projects
Project Type Primary Barriers Targeted Types of Projects Funded
Number of
Projects Funded
Amount Approved
($ M) Fueling Infrastructure
Fueling infrastructure RD&D
• Insufficient bulk fuel distribution infrastructure
• Inadequate vehicle performance
• Difficulty, cost, or delay in obtaining permits for siting charging infrastructure
• Electrical codes and standards for EVSE installation not universally adopted
• Research electrical codes and wiring methods to power EVSE
• Electric bus–charging station demo project (canceled)
• Electric taxi demo project with swappable batteries (canceled)
3a $3.4
Fueling infrastructure PD&D
• Insufficient charging infrastructure
• Low availability of residential, workplace, and public Level 2 charging stations
• Low availability of DCFC stations
• Deploy several to several hundreds of EVSEs at residential, workplace, public, and commercial locations
• Upgrade existing “legacy” charging stations to the modern J1772 standard EV plug
69b $41.4
EV readiness planning
• Insufficient customer awareness
• Difficulty, cost, or delay in obtaining permits for siting charging infrastructure
• Lack of industry standards for charging infrastructure
• Insufficient pool of labor familiar with alternative fuel and vehicles
• Prepare regional plans to establish tailored guidelines for EV readiness building codes, permitting requirements, inspection processes, local agency roles, and EVSE deployment priorities in residential, commercial, public, and workplace settings
• Distribute plans to be implemented by regional agencies, cities, and counties; conduct outreach and training activities
• Develop a model for potential demand for PEVs in the region to guide infrastructure development
• Technical/policy assistance for statewide strategic plan for EVSE
18 $4.1
Vehicles
RD&D (vehicles)
• High vehicle-production cost • Inadequate vehicle
performance • Limited number of vehicle
models available
• Demonstrate plug-in hybrid class 2–5 truck
• Develop range-extended EV drive systems for medium and heavy-duty trucks and buses
• V2G demonstrations • Technical and economic feasibility
studies for EV manufacturing facility • Development of improved Li-ion
batteries and pilot production lines to produce them
24c $55.8

95
Table 4.6—Continued
Project Type Primary Barriers Targeted Types of Projects Funded
Number of
Projects Funded
Amount Approved
($ M)
PD&D (vehicles)
• Limited vehicle production capacity
• High vehicle-production cost • Limited deployment
• Augment CVRP and Hybrid and Zero-Emission Truck and Bus Voucher Incentive Program (HVIP)
• Build and expand vehicle manufacturing facilities
• Expand Li-ion battery production facilities
• Build, retrofit, and deploy PHEV trucks and vans for fleet deployment
19d $74.4
Total 133 $179.1 SOURCE: CEC administrative data as updated by survey respondents. a Includes two canceled projects. b Includes one canceled project. c Includes three canceled projects. d Includes three canceled projects.
Insufficient charging infrastructure was a primary barrier targeted, with $41.4 million approved
for projects to deploy or upgrade EVSE. ARFVTP-funded projects of varying sizes installed
EVSEs at residential, workplace, and public locations. For example, the $17 million Blink project
was funded to install 1,700 chargers in San Diego in 2010, a $4 million project was funded to
install 200 chargers in the Bay Area in 2011, and various smaller projects were funded in
Sacramento, Irvine, and other locations.76 (In later tables in the chapter, we list and tally the
number of charging stations installed by current and ongoing projects.)
Significantly less funding was provided for regional EV readiness planning projects, which
target such barriers as the difficulty or cost in permitting and siting charging infrastructure,
lack of industry standards for charging infrastructure, and insufficient pool of labor familiar
with the charging infrastructure. However, these planning projects could have impacts in
barrier reduction that do not scale with the amount of funding approved because they help lay
the groundwork for standardizing regional planning, building codes, and permitting for
accommodating PEVs and because the resulting plans can be drawn on as a reference by other
local governments. In an in-depth interview, an awardee that created a plug-in vehicle readiness
plan for a particular region of the state indicated that multiple organizations within the region
had already used the readiness plan to aid in their own planning activities, thus further
leveraging the product enabled by ARFVTP funding.
Recall that one of the barriers most frequently identified by survey respondents was
insufficient customer awareness of, and knowledge about, alternative fuels and vehicles. PEV
readiness projects often included public outreach and workshops, which would directly address
this barrier. Other projects, such as charging station deployment, sometimes had elements of
outreach and awareness written into their statements of work, and one could argue that their
efforts contributed to raising public awareness simply by making EV support infrastructure
76 See CEC, “Electric Drive Projects,” as of 2017, for highlights of ten charging infrastructure awards.

96
visibly available to the public. Fleet vehicle deployment, PHEV conversion of MDVs and HDVs,
and demonstration projects may also contribute to outreach and public awareness, just by
demonstrating the availability and performance of different types of vehicles.
The $55.8 million for vehicle RD&D-funded projects addressed high vehicle-production cost,
inadequate vehicle performance, and the limited number of EV models. Examples include the
demonstration of Class 2–5 PHEV trucks, development of extended-range drive systems for
MDVs and HDVs, and technical and feasibility studies for an EV manufacturing facility.
The $74.4 million in vehicle PD&D-funded projects targeted limited vehicle production capacity,
high vehicle-production cost, and limited deployment. For example, a project to expand
production facilities increased the capacity available to produce EVs and helped the awardee
reduce its capital costs.
The CVRP- and the Hybrid and Zero-Emission Truck and Bus Voucher Incentive Project (HVIP)–
provided financial assistance that helped offset some the incremental cost of an EV or a
traditional ICE vehicle. The CVRP is managed by CARB and issues rebates to customers who
lease or buy PEVs ($2,500 for BEVs and $1,500 for PHEVs) or hydrogen fuel cell electric vehicles.
From program inception in March 2010 through October 2016, the CVRP project has issued
102,953 rebates for BEVs and 67,026 rebates for PHEVs; thus, a total of 169,979 PEVs in total
were sold or leased in California with support from the program. The ARFVTP has contributed
$24.5 million of the $369.2 million spent on the CVRP to date.77
It is worth noting that the two canceled projects in the fuel infrastructure RD&D project type
may seem out of place in the fueling infrastructure category because the descriptions imply
that both involve vehicle demonstrations. However, each of the two projects involved a primary
infrastructure component. The project awarded to the Bay Area Air Quality Management
District to demonstrate electric taxis with swappable batteries was primarily aimed at
demonstrating battery-swapping stations for BEVs, carried out by the subcontractor Better
Place. The other project was an award to Foothill Transit to demonstrate fully electric buses in
its public transit fleet, but the part of the project funded by the ARFVTP award was the
installation of two 500-kW fast-charging stations along the BEV bus routes.78
4.5 Awardee Performance
4.5.1 Project Status
Table 4.7 shows the status of the 133 electricity ARFVTP projects approved for funding by
January 2015. The status shown is current as of September 2016. The majority of projects (68)
are ongoing, with 54 completed and ten canceled or terminated.
77 California Clean Vehicle Rebate Project, “CVRP Rebate Statistics,” last updated June 1, 2017. 78 Leslie Eudy, Robert Prohaska, Kenneth Kelly, and Matthew Post, Foothill Transit Battery Electric Bus Demonstration Results, Golden Colo.: National Renewable Energy Laboratory, January 2016.

97
Table 4.7. Status of Electricity Projects as of September 2016
Project Status in September 2016 Number of Projects
Amount Awarded
($ M)
Invoices Paid Though December
2016 ($ M)
Completed 54 $82.2 $79.1 Ongoing 68 $70.8 $49.5 Not yet started 1 $1.7 $0 Canceled or terminated 10 $24.4 $3.1 Total 133 $179.1 $131.7
SOURCE: CEC administrative data.
The last column of Table 4.7 reports the amount of invoices paid (including retention) through
December 2016. Award payments are approaching the total award amounts for the completed
projects, and invoices totaling 70 percent of the award amounts ($49.5 million of $70.8 million)
have been paid (including retention) for the ongoing projects.
As shown in Figure 4.3, the percentage of projects that have been completed varies by project
type. The percentage complete is lowest for the fueling infrastructure projects, where only
about one-third of the projects have been completed. The percentage completed is highest for
the EV readiness projects, with 56 percent completed.
Figure 4.3. Status of Electricity Projects
SOURCE: CEC administrative data and RAND survey. NOTE: For 72 fueling infrastructure projects, 24 vehicle RD&D projects, 19 vehicle PD&D projects, and 18 EV readiness projects. Percentages calculated separately and add to 100 for each of the four groups.
The ten canceled projects account for 7.5 percent of the 133 funded projects. The following
three projects in the fueling infrastructure category were canceled:
4%
17% 16%
0%
61%
46%
32%
44%
35% 38%
53% 56%
0%
10%
20%
30%
40%
50%
60%
70%
Fueling infrastructure Vehicle RD&D Vehicle PD&D EV readiness
Canceled Ongoing and not yet started Completed

98
• An EVSE deployment project was canceled when a city council denied a resolution to
complete the project because council members felt there were not enough EVs traveling
in the city to warrant installation.
• An electric bus demonstration project was canceled when the person who had applied
for the award left the awardee organization. The organization completed the project
without using the award funds and later declined the CEC’s offer to use the award for
additional work.
• An electric taxi demo project with swappable battery packs was canceled when the main
subcontractor decided to concentrate business efforts in another part of the world
instead and no other appropriate subcontractor was available.
Most in danger of failing were vehicle projects—17 percent and 16 percent of the vehicle RD&D
and PD&D projects, respectively, were canceled. The following four projects were canceled in
the vehicle RD&D area:
• A project to design a chassis for an electric bus was canceled when the awardee filed for
bankruptcy and liquidated all assets soon after winning the award.
• A project to demonstrate a plug-in hybrid system for medium- and heavy-duty utility
trucks was canceled when the awardee was unable to find a project partner after getting
significantly behind schedule.
• A project to design and build a new combination inverter/charger for PEVs was canceled
because of multiple technical problems carrying out the project and potential customers
going out of business. The awardee eventually went bankrupt.
• A project to design a new Li-ion battery technology was canceled when private investors
ceased funding the company and its working capital ran out. The awardee went into
bankruptcy and sold all its capital and intellectual property to another company, which
subsequently went bankrupt itself and was sold to a foreign company.
The three canceled projects in the vehicle PD&D area were to build production lines and
purchase manufacturing equipment for BEV production. One of these carried out the project,
but the reimbursement funding was canceled because of documentation and invoicing issues
on prevailing wages. Another was canceled because the awardee was unable to secure matching
funds, and a third was canceled because the awardee declared bankruptcy.
4.5.2 Technical Performance
In this section, we first examine the extent to which technical objectives were achieved for the
54 completed electricity projects to date. We then turn to prospects for achieving the technical
objectives of the 68 ongoing projects. The final part of this section reports findings from an
effort to verify that the charging stations reported installed by awardees were actually installed
and were operational.

99
4.5.2.1 Extent Technical Objectives Achieved for Completed Projects
A substantial proportion of the technical objectives most central to the project were fully
achieved for the 54 completed electricity projects. Figure 4.4 reports RAND’s independent
assessment of the extent to which the technical objectives were achieved, as well as the extent
achieved as updated by awardees who responded to the survey. As can be seen, the
assessments by RAND and the awardees are quite consistent. The primary difference is that
RAND had insufficient information to determine the extent achieved for a considerable number
of objectives (the unknown bars). During the survey, awardees typically indicated that these
objectives had been fully achieved.
Figure 4.4. Extent to Which Technical Objectives for Completed Electricity Projects Have Been Met
SOURCE: Authors’ analysis and RAND survey. NOTE: For 179 technical objectives from 54 projects that had been completed by the time of the survey. Once updated by awardees who participated in the survey, 82 percent of the 179 technical
objectives deemed most central to the project were fully achieved. A relatively small number of
objectives were confirmed either minimally or partially achieved (three [2 percent] minimally
achieved and 15 [8 percent] partially achieved). However, the extent achieved could not be
determined for another 14 (8 percent).
Table 4.8 provides more insight into the extent that technical objectives were achieved for
fueling infrastructure projects that placed charging stations. It shows the number of charging
stations proposed and actually deployed for the 23 completed fueling infrastructure projects
that deployed charging stations. In five cases, awardees did not install the proposed number of
charging stations. In 14 cases, the awardees met or exceeded the number proposed in the
statement of work, and, in four cases, sufficient information was not available to determine
2% 10%
63%
26%
2% 8%
82%
8%
0% 10% 20% 30% 40% 50% 60% 70% 80% 90%
Minimally Par5ally Fully Unknown
RAND evalua5on As updated by awardees

100
whether the awardee met the objective.79 While some awardees fell short of their objective, the
number of charging stations installed (6,753) exceeds the number proposed (6,741) (shown in
the bottom row of the table), even assuming that no stations were installed in those cases
where the number of stations actually deployed cannot be determined.
79 We were unable to verify the number of stations actually deployed by several of the projects that had been indicated by survey respondents as fully completing their technical objectives because of the lack of available progress or final reports for those projects.

101
Table 4.8. Charging Stations Proposed and Deployed by Completed Projects
Project ID Awardee Project Title
Number of Charging Stations
Proposeda
Number of Charging Stations
Deployedb Number Deployed Less than Number Proposed
ARV-09-005
Blink Acquisition LLC Formally-Electric Transportation Engineering Corporation (ETEC Corp.)
Blink EV charging infrastructure deployment in San Diego and Orange Counties
2,550 1,585
ARV-13-042 City of Burbank EV Charge N' Go 16 12
ARV-12-051 Los Angeles Department of Water and Power LADWP Workplace EVSE 32 28
ARV-12-020 Alternative Energy Systems Consulting, Inc.
Forty-One Workplace Charging Outlets at UC San Diego
41 16
ARV-10-032 The Association of Bay Area Governments
ABAG project to install EV charging stations in the Bay Area
423 340
Number Deployed Equal to Number Proposed
ARV-10-006 Los Angeles County Metropolitan Transportation Authority
Public Plug-In Electric Vehicle Charge Stations at LA Metro Transit Locations
20 20
ARV-12-011
California Department of General Services Office of Fleet & Asset Management
Upgrade Electric Vehicle Charging Infrastructure at the Sacramento State Garage
9 9
ARV-12-012 Our Evolution Energy & Engineering
North Coast Plug-in Electric Vehicle Infrastructure Project (NCPEVIP)
2 2
ARV-12-019 Joe Carlson Studio, Inc. EVSE Charging Stations in Commercial Building Public Parking Area
2 2
ARV-10-041 Sacramento Municipal Utility District (SMUD)
Charging Infrastructure for Plug-In Hybrid and electric Vehicle Demonstration with Chrysler
up to 50 14
ARV-12-036 Towbes Group, Inc. Workplace Charging in Santa Barbara 6 6
ARV-12-038 Schneider Electric USA, Inc.
San Mateo County Community College District EV Charging Project
19 19
ARV-12-013 Alternative Energy Systems Consulting, Inc.
Ten RWE Level II Fleet Charging Outlets at UC San Diego
10 10
ARV-12-039 Schneider Electric USA, Inc.
American Red Cross–Adopt-a-Charger EVSE
8 8
ARV-13-033 California State University, Fresno Foundation
Combination Level 2 and DC FC Electric Vehicle Charging Stations in the San
Joaquin Valley 6 6
Number Deployed Greater than Number Proposed
ARV-09-007 Coulomb Technologies, Inc.
Coulomb/ChargePoint Charge California Project
1,290 2,139
ARV-10-001 Clipper Creek, Inc.
Clipper Creek Project to update at least 500 existing legacy EVSEs to the SAE J1772 standard (aka "Reconnect California Project")`
500 760c
ARV-12-023 AeroVironment, Inc. Cal Electric: Residential EVSE Deployment Program—California-wide
1,425 1,758
ARV-12-017 AeroVironment, Inc.
Car2Go Fleet EVSE Program-Apartment Venues
4 7

102
Table 4.8—Continued
Project ID Awardee Project Title
Number of Charging Stations
Proposeda
Number of Charging Stations
Deployedb Performance Could Not Be Determined
ARV-13-035 City of Coronado Coronado EV Tourism EVSE Deployment Project
12 Could not be determined
ARV-10-045 Southern California Regional Collaborative
EV-Ready SoCal
300 Could not be determined
ARV-12-052 Green Charge Networks, LLC
Smart Grid Enabled DC Fast Charging with Energy Storage
16 Could not be determined
ARV-13-055 Cal Poly Corporation Cal Poly Electric Vehicle Charging Infrastructure Initiative
12 Could not be determined
Total
23 projects
6,753
6,741d SOURCE: Author analysis. a Based on project statement of work. b Based on final project reports or other project documentation. c According to ClipperCreek, Inc., “Comments: Funding Strategies for EV Infrastructure,” Auburn, Calif., July 13, 2016. d Excludes projects for which the number deployed could not be determined.
Cases where projects exceeded their originally proposed or estimated number of charging
stations can often be attributed to the variable cost of installing a given charging station in a
particular location because the cost of installation depends on elements unique to the site, such
as distance from electrical panel and whether the station can be wall mounted or installed as a
pedestal. Thus, when installation turned out to be less expensive than expected, more stations
could be installed. In addition, 60 percent of the EVSEs installed by these 23 completed projects
were residential installations (4,017 of 6,741), which, in some cases (such as ARV-12-023) were
provided as offerings to PEV purchasers or lessees in collaboration with car dealerships. In such
cases, the number of EVSEs eventually installed partially depended on the number of drivers
purchasing PEVs in the region and on the cost of each installation, which could explain how
awardees could underestimate their proposed number of EVSEs compared with the number
they eventually deployed.
Table 4.9 provides similar information for completed projects with technical objectives to
produce or demonstrate a specified number of PEVs (eight projects). In some cases, awardees
did not meet their targets for the proposed number of vehicles; in other cases, they met their
targets; and in some cases, they exceeded them. Overall, the total number of vehicles produced
or demonstrated fell short of the number proposed—389 versus 480, as shown on the bottom
row of the table.

103
Table 4.9. Vehicles Planned and Delivered by Completed Projects
Project ID Awardee Project Title
Number of Vehicles
Proposeda
Number of Vehicles
Produced or Demonstratedb
Actual Number Less Than Number Proposed
ARV-10-034 SMUD Charging Infrastructure for Plug-In Hybrids and Electric Vehicle Demonstration with General Motors
29 10
ARV-09-003 South Coast Air Quality Management District
PHEV Medium-Duty Commercial Fleet Demonstration and Evaluation 378 296
ARV-10-025 Wrightspeed, Inc. Wrightspeed Digital DriveSystem Retrofit Kit 3 2
Actual Number Equal to Number Proposed
600-09-001 Department of General Services
Plug-In Hybrid Electric Vehicle Retrofit Demonstration Project 50 50
ARV-10-039 Boulder Electric Vehicle, Inc.
Boulder Electric Vehicle Los Angeles Plant 3 3
ARV-09-015 Motiv Power Systems, Inc. Prototype Shuttle for Motiv's Power Control System 1 1
Actual Number Greater Than Number Proposed
ARV-12-006 Zero Motorcycles, Inc. Strategic Expansion of Volume Manufacturing Capacity for Electric Motorcycle Production in California
15 27
Performance Could Not Be Determined ARV-09-012
Kenworth, A PACCAR Company
Deployment of a Next Generation Alternative Fuel Power Truck 1
Could not be determinedc
Completed Subtotal 8 projects 480 389
SOURCE: Author analysis. a Based on awardee statement of work. b Based on final reports or other project documentation. c Indicates that we could not verify how many vehicles were actually planned or delivered because of a lack of verifying documentation (final reports, progress reports, critical project reviews) or a lack of statements on the number of vehicles in existing documentation.
The technical objectives for vehicle RD&D projects were by and large met, but as should be
expected, there were some cases in which they were not. Our review identified the following
unmet technical objectives for vehicle RD&D projects:
• Two minimally achieved objectives were from a project in which a Li-ion battery
company was not able to produce a significant number of additional R&D battery
modules or incorporate those modules in R&D projects (Quallion, ARV-10-010).
• Five partially achieved objectives were from a battery and vehicle manufacturing
company carrying out a project to develop high–energy density Li-ion batteries. The
awardee only partially met its technical objectives involving various experimental
methods to create silicon-coated anodes and cathodes, some of which did not meet their
intended performance goals, and integrations of those new anodes and cathodes into
high–energy density Li-ion pouch cells. (Envia, ARV-09-004).

104
4.5.2.2 Prospects for Achieving Technical Objectives for Ongoing Projects
Figure 4.5 shows the degree to which the technical objectives have been achieved for 67 of the
68 ongoing electricity projects (projects ongoing as of September 2016). Not surprisingly, the
bulk of technical objectives remains in-progress. However, as shown in Figure 4.6, awardees
were confident that nearly all these technical objectives would be met.
Figure 4.5. Extent to Which Technical Objectives for Ongoing Electricity Projects Have Been Met
SOURCE: Authors’ analysis and RAND survey. NOTE: For 226 technical objectives from 67 projects that were ongoing by the time of the survey.
Figure 4.6. Likelihood That In-Progress Technical Objectives for Ongoing Electricity Projects Will Be Met
SOURCE: RAND survey. NOTE: For 131 technical objectives from 49 ongoing projects.
6%
86%
2% 6% 0% 4%
71%
2%
19%
4%
0% 10% 20% 30% 40% 50% 60% 70% 80% 90% 100%
Not yet started In-‐progress Par5ally Fully Modified or dropped
RAND evalua5on As updated by awardees
2% 0% 1%
12%
83%
2% 0% 10% 20% 30% 40% 50% 60% 70% 80% 90%
Highly unlikely Somewhat unlikely
Just as likely as unlikely
Somewhat likely Highly likely No answer

105
4.5.2.3 Verification of EVSE Reported Placed by Awardees
An additional component of our evaluation of the electricity fuel type projects included
verification visits to a sample of the EV charging stations installed through the ARFVTP. The
objectives of this effort were to verify that the stations had been installed and that they
functioned properly and, when possible, to collect impressions from awardees or site
owners/operators about their and their users' experiences with the charging stations.
Overall, there were 67 ARFVTP projects that funded the deployment of over 8,286 EV charging
stations throughout the state.80 For our verification, our sampling strategy was to select
charging stations that spanned a range of geographic locations and a range of settings,
including publicly accessible stations, stations for specific agencies or companies, and stations
in private homes and apartments. We also sought to include both large and small projects
managed by both EVSE suppliers and local municipalities and alliances.
The size of the sample was restricted by the resources available for this task. We ultimately
selected 94 charging sites from 11 ARFVTP projects that contained a total of 326 charging
stations (Table 4.10). Sites included government office buildings, parks, transit stations, and
parking lots; private business; universities; apartments; and private homes. While this is a small
sample in terms of the percentage of stations installed by the program, it nonetheless provides
a glimpse into the choices made by awardees about where and how to install stations, the
extent to which stations are operable, and experiences and lessons learned from their use.
We initiated each visit by contacting the awardee to explain the objective of the visit and, if
necessary, arrange access to the site. In some cases, the awardee representative met us at the
site. In other cases, the awardee put us in touch with the site owner or operator, who then met
us at the site. In still other cases, the awardee welcomed us to visit the site unaccompanied.
We used a commercial electric vehicle simulator to test Level 2 charging stations. We were not
able to test Level 3 (DCFC) stations. The simulator, manufactured by Eaton Corporation,81 allows
one to confirm proper operation of any J1772-compliant EVSE without the need of an actual
PEV. It tests the station’s ability to charge a vehicle, confirm interlocked power, and confirm
ground fault detection and shutoff. The test, which takes one to two minutes to complete,
entails inserting the charging plug into the simulator, energizing the charging station,
confirming that the simulator detects proper charging capability, and triggering a ground-fault
simulator to test that the station detects the fault and de-energizes.
We tested all unoccupied charging stations and found only nine inoperable stations, which is
less than 3 percent of the 326 stations tested or in use. The tested units comprise a wide
variety of different brands. This suggests that EVSE is a relatively mature technology with high
reliability.
80 Includes stations installed by projects completed by September 2016 and stations planned by ongoing projects (some of which may have already been installed). The number of stations planned by ongoing projects is shown in Table 4.15. 81 The Eaton Electric Vehicle Simulator is the size of a small suitcase. See “Eaton Electric Vehicle Simulator,” eaton.com, 2017.

106
Table 4.10. EV Charging Station Verification Sample
Award Number Awardee Sites Stations Location Station Setting
Inoperable Stations
ARV-13-033
California State University, Fresno Foundation
1 6 Fresno University 0
600-13-005
California Department of General Services
1 1 Sacramento Government agency 0
ARV-09-007 Coulomb Technologies, Inc.
10 39 Sacramento Commercial business, government, and public parking lots
2
ARV-10-006
Los Angeles County Metropolitan Transportation Authority (MTA)
5 20 Los Angeles County MTA rail stations 6
ARV-10-045
Southern California Regional Collaborative
20 113 Los Angeles County
Airport, state park, museum, zoo, amusement park, universities, government facilities
0
ARV-12-024 Coulomb Technologies, Inc.
2 62 San Diego Apartment building and commercial parking garage
0
ARV-12-052 Green Charge Networks, LLC 4 4 San Diego,
Fullerton Commercial businesses, university 0
ARV-13-032 California EV Alliance 4 9
Benicia, Napa, Yountville, and Novato
Commercial businesses 0
ARV-10-001 Clipper Creek, Inc. 11 19 Davis
Commercial businesses, government, and university
1
ARV-12-023 AeroVironment, Inc. 27 27
Fremont, Mountain House, and Davis
Private homes 0
ARV-13-029 Redwood Coast Energy Authority
9 26 Humboldt County
Commercial businesses 0
Total 11 projects 94 326 9 SOURCE: Verification visits. The following paragraphs summarize some of the qualitative findings from the verification
visits. Note that these observations are intended to highlight potential concerns, strengths, and
weaknesses of some EVSE installations. Some apply to only a single site, while others reflect
multiple sites. In any case, they are not intended to reflect general or statistically significant
outcomes of the ARFVTP EVSE projects. Nonetheless, they may help in providing guidance to
awardees or tailoring awardee agreements to maximize the benefit of additional EVSE systems
funded by the program.

107
Methods of access and payment varied. Some systems were free, some used radio-frequency
identification access cards that were linked to a payment account, some used smart phone apps
that were linked to a payment account, and most also allowed the user to call a number and use
a credit card directly. A challenge with the latter approach is that several sites had no cellular
connections (e.g., underground parking garages). While some awardees had addressed this
limitation by installing local repeater antennas connected to an outdoor cellular antenna, some
sites had not. This made it impossible to call the customer service number to provide a credit
card to access the EVSE. A related challenge, encountered at a number of sites, is that even with
cellular access, we were unable to reach anyone to conduct the transaction. Calls reached
recordings indicating unavailability or were put on hold for extended durations.
Multiple sites were initially providing free charging to attract users, with plans to convert to a
pay-per-charge system after some time period. For example, the Getty Center in Los Angeles
elected to pay for electricity to its EVSEs for the first three years of operation, after which it
would reevaluate payment options. Prior to installing EVSEs within its parking structures, Getty
counted only seven employees who drove EVs. Seven months after installation of EVSEs, 26
employees drove EVs.
A general challenge with EVSEs in many settings is managing parking and charging times to
maximize access. Level 2 chargers generally require four to five hours to recharge an EV, while
in many sites, cars are parked for a full workday. This problem is even worse in the long-term
parking lot at the airport, where most cars are parked for more than one day. One approach is
to restrict parking times, typically to four hours. Several sites took this approach, as indicated
by clear signage posted with the EVSE. Another approach is to locate an EVSE so that it can
reach multiple parking spaces. This can be accomplished using extra-long cables or placing the
unit between two rows of parking spaces so it can reach four spaces. EVs typically have a visible
charge indicator, so the plug can be moved from a fully charged vehicle to begin charging
another vehicle. Sites appear to be experimenting with policies and communication approaches
for getting the greatest use out of chargers. Because demand varies with time of day and day of
the week, one awardee was considering dynamic signage, which is able to change at certain
times of day to reflect different parking restrictions during or after business hours. Another
site noted that it has the ability to allow users to scan a QR code to report an EVSE spot being
used by a non-EV or a fully charged EV.
A different problem arises for chargers at retail locations, where a user is typically parked for
only a short time. In these cases, such as the 7-Eleven stores, awardees installed Level 3
chargers, which can charge a vehicle in about 30 minutes.
At one site, the EVSE parking spaces had “Reserved for Handicap” signage and “reserved for
EV.” This appeared to be confusing, because it is unclear which had priority.82
82 Issues relating to parking rules, placement, and enforcement were also highlighted during several of our in-depth interviews with awardees. Several awardees described challenges and delays in siting stations because some site hosts needed very specific Americans with Disabilities Act drawings and calculations to confirm that the charging stations would not take spaces otherwise required by parking codes or laws. They indicated that some cities, for example, were concerned that if a certain number of parking spaces in

108
At some sites, nearly all the stations were occupied, while others were completely empty.
Because we visited each site only once, and the time of day and day of the week varied, we
cannot say much about the EVSE use in general. However, at one apartment building in San
Diego, none of the 32 EVSEs was in use, and each had a thick coat of dust that fell off when
they were being tested. This suggests that these EVSEs were rarely used, indicating that better
planning about where to site EVSEs may be warranted in some cases.
Users that installed EVSEs from multiple suppliers often expressed clear preferences for one
brand over another and sometimes indicated that they would not install any more of a
particular type. We did not collect enough data to make recommendations about particular
brands. While a cursory search identified numerous reviews of home EVSEs, we found no
reviews of commercial EVSE systems. Based on users' experiences, it appears that an
independent review of commercial EVSE would be quite helpful to organizations planning EVSE
installations.
Reasons for these preferences varied but generally had to do with the frequency of repair
requirements and propensity for failure. For example, one model of EVSE featured an
automated cable management system (to avoid tripping hazards and also to prevent the cable
from being damaged by vehicles or vandals) that was fraught with problems. Cables are stored
on a spool and are automatically deployed for charging and retracted after being unplugged
from the vehicle. The systems consistently failed, leading to the EVSE being inoperable within a
year of installation. This was the case for many of the EVSEs at the LA MTA stations. Another
brand with a similar cable management system appears to be well-built and operated well at all
EVSEs tested.
We noted some other hardware issues. At one site, the J1772 plug on the Leviton EVSEs fits
loosely in the Nissan Leaf, causing the EVSE to click on and off. The facility discovered that the
loose connection is eliminated by wrapping the cable around the Nissan Leaf. The Leviton EVSE
also causes problems with some Fiat 500e vehicles. Two out of the seven regular Fiat 500e
users at one site experience occasional charging issues that cause the Leviton EVSE to fault.
Representatives of Leviton and Fiat are aware of the problem, which apparently stems from a
mismatch between the pilot voltage signal sent by the EV and the voltage required by the EVSE
to maintain a charge. For another project, charging cables had been stolen for the copper
approximately 20 to 30 times. Another project installed a video camera to monitor security of
the EVSEs. Cables are also occasionally damaged after being run over by cars. At one site, the
plastic cover on the display screen on an outdoor EVSE was so badly discolored by the sun that
the display was unreadable.
For one project, the supplier installed a 30-kWh battery pack along with the EVSE at each site.
The battery pack consists of nine 24-VDC Li-ion batteries connected in series. The purpose of
the battery pack is to provide power to the charging stations during periods of peak demand
a structure were set aside for EV charging only, that could reduce the number of spaces available for other uses and could cause the structure to drop below a compliance threshold with the parking code.

109
when utility prices are highest. A controller monitors demand at the site and charges the
battery pack during periods of low demand when utility prices are lowest.
Our verification included several installations in private homes. The 27 users that agreed to
participate in a verification visit were uniformly pleased with the program and were thankful to
be included. None had experienced any problems with the system. Some residents were
informed about the ARFVT program by the local dealership that sold them their EVs and often
indicated that this program was a major factor in their decision to purchase an EV. The
program funds paid for the EVSE and, in most cases, installation costs as well. Some residents
were required to pay for installation. Among the private home systems
• 62 percent of users charged their vehicles almost every day; 23 percent, mostly on
weekdays; and 15 percent, less than three times per week
• 60 percent mostly waited until night to charge their vehicles, while 40 percent charged
whenever they returned home
• 15 percent of chargers were used for multiple vehicles.
4.5.3 Financial Performance
With few exceptions, awardees for electricity projects have been successful in obtaining the
match funds proposed for the project. As shown in Figure 4.7, awardees reported that the
match amount was not obtained for only 5 percent of the completed projects that required a
match. For ongoing projects, 29 percent reported they have not obtained the match obligation
so far; that percentage will likely fall as the projects move forward.
Figure 4.7. Success in Obtaining Matching Funds
SOURCE: CEC administrative data and RAND survey. NOTE: For projects with match fund target greater than $0 and a survey response; excludes canceled projects.
79%
5% 16%
66%
29%
5%
0%
20%
40%
60%
80%
100%
Obtained proposed matching funds
Have not obtained proposed matching funds
No response
38 Completed projects 38 On-‐going projects

110
4.5.4 Schedule Performance
Table 4.11 shows the schedule status of the 122 completed and ongoing electricity ARFVTP
projects that were approved for funding by January 2015. As shown in the penultimate row of
the table, 50 percent of completed projects were completed on time or ahead of schedule, and
most of the remaining completed projects were completed seven months to two years behind
schedule. The situation appears worse for ongoing projects, with only about 25 percent on time
or ahead of schedule. While some of these projects might catch up, others might fall further
behind schedule. The schedule performance for the different project types is comparable, with
the exception of the vehicle RD&D projects. These projects are more frequently behind schedule
than the other project types.
Table 4.11. Schedule Performance for Completed and Ongoing Electricity Projects
Amount of Time Behind Schedule (Percentage of Projects)
Project Type
Number of
Projects Ahead On
Schedule
1–6 Months Behind
7–12 Months Behind
13–24 Months Behind
25+ Months Behind Unknown
Fueling Infrastructure Completed 25 20 32 4 20 16 4 4 Ongoing 44 5 25 27 25 14 2 2
Vehicle RD&D Completed 9 0 11 11 33 33 11 0 Ongoing 10 0 10 20 20 50 0 0
Vehicle PD&D Completed 10 10 50 10 0 30 0 0 Ongoing 6 0 33 33 17 17 0 0
EV Readiness Completed 10 0 70 0 0 0 0 30 Ongoing 8 0 13 13 13 0 0 62
Total Completed 54 11 39 6 15 19 4 7 Ongoing 68 3 22 25 22 18 1 9
SOURCE: CEC CAM as updated by survey respondents.
Survey respondents whose projects were behind schedule were presented with a checklist of
the reasons for delay. The responses for the 66 respondents reporting reasons for delay are
reported in Figure 4.8. The most common reasons for delay were the need to change project
locations, problems with the technology, and delay in obtaining required permits. A number of
respondents (32 of the 66, or 48 percent) elaborated on other reasons for delay. Some of these
tended to reinforce reasons provided in the checklist, such as the difficulty in obtaining permits
(four of 35) and delays in obtaining CEC approvals of scope of work or budget changes (four of
35). The most–commonly cited additional reasons were as follows:
• problems with subcontractor performance (seven of 35)
• equipment procurement issues (five of 35)
• unexpected site-specific conditions (e.g., underground water lines) and need for
electrical upgrades (four of 35)
• site redesigns because of the Americans with Disabilities Act regulations (three of 35)

111
• site owners who were busy with other issues (two of 35).
Figure 4.8. Reasons for Delay in Electricity Projects
SOURCE: RAND survey. NOTE: Data encompass 66 awardees who reported delays.
4.6 Impacts on Awardees
4.6.1 Effect of Award on Ability to Undertake the Project
Central to assessing the impact of the ARFVTP is whether the award enabled the awardee to
proceed with the project or whether awardees would have proceeded with their projects even if
they had not received the awards. One indirect indicator of what awardees would have done
absent the award is the status of projects proposed by unsuccessful applicants. The advantage
of this indicator is that it is based on actual behavior. The disadvantage is that the projects
proposed by the unsuccessful applicants may have been more poorly conceived or planned than
those funded by the ARFVTP. As shown in the last row of Table 4.12, 49 percent of
unsuccessful electricity applicants reported that they had not proceeded with the proposed
project after their application was denied. Forty-six percent of unsuccessful applications had
proceeded, although they may have proceeded on a smaller scale than they would have had
they received ARFVTP funding.
48%
5%
6%
6%
8%
15%
14%
18%
24%
29%
41%
0% 10% 20% 30% 40% 50% 60%
Other
Delay in securing matching funds
CEC late in paying invoices
Waited on CEC approvals
Delay in hiring essen5al staff
Other ongoing projects
Staff leg company
Hesita5on by site owner
Delay in gecng permits
Problems with technology
Needed to change project loca5on

112
Table 4.12. Fate of Projects Proposed by Unsuccessful Applicants
After Your Unsuccessful Application for the ARFVTP Grant, Which of
the Following Best Characterizes the Status of the Project? (%)
Project Type Number of Projects
Proceeded Within 1 Year
Proceeded 1 to 3 Years Later
Has Not Proceeded
Did Not Answer
Fueling infrastructure 14 21 29 50 0 Vehicle RD&D 7 14 29 57 0 Vehicle PD&D 6 0 17 83 0 EV readiness 7 29 43 0 29 All projects 34 18 29 47 6 SOURCE: RAND survey. NOTES: For 34 unsuccessful applicants who completed the survey. Percentages do not sum to 100 percent because of rounding. A second indicator of the importance of the award is awardee predictions on whether they
would have proceeded with the project had they not received the award. Only 12 percent
indicated they would not have proceeded with the project anyway (last row of Table 4.13).
However, the most common response was that the awardee “might” have proceeded (56
percent), leaving considerable uncertainty about the role of the ARFVTP in the decision to
proceed with the project. An upper bound for the percentage who would not have proceeded is
71 percent (assuming all who said they might proceed or did not answer would not actually
have proceeded). Based on these two indicators, it seems reasonable to conclude that the
ARFVTP played an important role in the decision to proceed with a substantial percentage of
the projects funded, but the data available do not allow precise estimates.
Table 4.13. Awardee Predictions of Whether They Would Have Proceeded with the Project Absent ARFVTP Funding
Had Your Organization Not Received This ARFVTP Grant, Which of the Following Best Characterizes If and When You Would Have Proceeded
with a Similar Project? (%)
Project Type Number of Projects
Would Have Proceeded
within 1 Year
Would Have Proceeded 1
to 3 Years Later
Might Have Proceeded
Would Not Have
Proceeded Did Not Answer
Fueling infrastructure 58 9 17 57 14 3 Vehicle RD&D 15 20 7 73 0 0 Vehicle PD&D 11 27 45 18 9 0 EV readiness 17 0 12 65 18 6 All projects 101 11 18 56 12 3 SOURCE: RAND survey. NOTE: For 101 awardees who completed the survey, excluding canceled projects. Percentages do not sum to 100 percent because of rounding. No major patterns emerge for difference in the findings by project type. Unsuccessful
applicants for fueling infrastructure awards said they had not proceeded with only 50 percent
of the projects (Table 4.12), suggesting that these projects are more likely to have gone ahead
without ARFVTP funding—although perhaps at reduced scale. However, the sample sizes are
small, and no strong conclusions can be made.

113
Although some electricity projects might have proceeded without ARFVTP funding, the in-depth
project reviews provide a number of examples of the importance of ARFVTP funding in the
decision to proceed or in the scale of the project:
• CEC funding enabled more EVSE installations than would have been possible on federal
funding (e.g., DoE) alone. For example, a large effort to install EVSEs in at least 13
markets in the United States using federal funding was able to leverage ARFVTP
funding, which made it possible to add San Diego and Orange counties to the project;
1,585 charging stations were installed in the added areas.
• Some niche industries rely heavily on the ARFVTP because of the lack of federal support.
For example, DoE’s Advanced Technology Vehicles Manufacturing loan program clearly
excludes two-wheeled vehicles,83 and without ARFVTP funding, one awardee’s upgrades
of its electric motorcycle production line would not have taken place.
• Without ARFVTP funding, some projects would not have proceeded at all. For example,
one RD&D awardee needed the ARFVTP contribution to reach the minimum energy
delivery resource for a U.S. Air Force V2G project to reach its threshold for federal
funding and proceed.
4.6.2 Impact on Organizational Capabilities
Awards had a significant impact on awardees’ knowledge and capabilities. As reported in Figure
4.9, substantial majorities of survey respondents somewhat or strongly agreed that the awards
allowed their organizations to
• enter a new area in which they had not been active (blue bars)
• expand in an area in which they had some expertise or capacity (red bars)
• gain knowledge or experience that will be useful in developing products or technologies
besides those funded by the award (green bars).
The most strongly supported response was that the awards allowed awardees to expand in an
area in which they already had experience (as shown by the awardees who strongly or
somewhat strongly agreed with the statement—58-percent red bar in Figure 4.9); this provides
support for the notion that ARFVTP allowed for the installation of more charging stations than
would have been the case otherwise.
83See DoE, “AVTM,” website, undated, for a description of this program.

114
Figure 4.9. Impacts of Awards on Awardees’ Knowledge or Capabilities
SOURCE: RAND survey. NOTE: For 101 awardees who completed the survey, excluding canceled or terminated projects.
4.6.3 Market Prospects for the Product or Technology Funded by the Award
One indicator for whether the product or technology funded by the award will have ongoing
impact on barriers to market viability is whether awardees continue to develop, market, install,
or produce the product or technology funded by the award after the project has been
completed. As shown in the last row of Table 4.14, a high percentage of awardees for electricity
projects (84 percent) reported they had continued to do that.
Table 4.14. Awardee Efforts to Continue to Develop, Market, Install, or Produce Product or Technology After Completion of the Project
Project Type
Number of Completed
Projects
Continued to Develop, Market, Install, or Produce the Product or Technology Funded by the Award? (%)
Yes No Did Not Answer Fueling infrastructure 21 71 29 0 Vehicle RD&D 6 100 0 0 Vehicle PD&D 7 100 0 0 EV readiness 10 90 0 10 Total 44 84 14 2
SOURCE: RAND survey. NOTE: For 44 completed projects whose awardees completed the survey.
9% 10%
17%
30% 33%
2% 3% 6% 7%
24%
58%
2% 5% 5%
20%
29%
40%
2%
0%
10%
20%
30%
40%
50%
60%
70%
Strongly disagree Somewhat disagree
Neither agree or disagree
Somewhat agree Strongly agree Did not answer
The grant allowed your organiza5on to enter a new area in which you had previously not been ac5ve The grant allowed your organiza5on to expand in an area in which you already had some exper5se or capacity The grant allowed your organiza5on to gain knowledge or experience that will be useful in developing products and technologies besides those funded by the grant

115
Awardees who continued to develop, market, install, or produce the product or technology
funded by the award did so in a number of ways. The most common ways involved efforts to
reduce costs and to identify potential customers (Figure 4.10).
Figure 4.10. How Projects Continued to Develop, Market, Install, or Produce Product or Technology Funded by Award
SOURCE: RAND survey. NOTE: For 36 completed projects for which the awardee indicated that the organization had continued to develop, market, install, or produce the product or technology funded by the award.
4.7 Impacts on Barriers
In this section, we examine the degree to which the barriers to market adoption of PEVs have
been reduced through the ARFVTP’s efforts. We first discuss the program’s impact on fueling
infrastructure and then turn to vehicle-related barriers. These assessments are subject to the
three limitations discussed in Chapter 1. First, clearly attributing market changes to the
ARFVTP is challenging because it is impossible to unequivocally determine what would have
happened in the market without the ARFVTP. Second, given the wide range in types of barriers
and what is involved in addressing them, we focus only on whether a barrier has been reduced
and do not attempt to assess the amount by which it has been reduced. Finally, while RD&D
projects are often necessary to lay the groundwork for subsequent commercialization, it is
difficult to demonstrate the impact of such work.
4.7.1 Fueling Infrastructure Barriers Reduced by ARFVTP Projects
Limited availability of charging infrastructure has been identified as an important barrier to the
market viability of PEVs. As discussed earlier in this chapter, barriers include limited
availability of home and at-work charging and of publicly available DCFC stations (Table 4.4).
The ARFVTP has made progress in reducing these barriers. Table 4.15 reproduces the number
of charging stations funded by completed projects (6,741—does not include a few projects for
which the number of stations deployed could not be determined) and then breaks those
stations down by station type. Substantial numbers of publicly available and residential Level 2
22%
6%
28%
31%
44%
50%
56%
67%
72%
0% 10% 20% 30% 40% 50% 60% 70% 80%
Other
Licensed the technology
Scaled up manufacturing of the product
Sold product or technology to customers
Purchased more similar vehicles or fueling infra.
Improved product performance
Implemented tech. at a demonstra5on scale
Iden5fied poten5al customers
Worked on ways to reduce cost

116
chargers have been placed by completed projects, with more expected to be placed by ongoing
projects. A modest number of DCFC stations have been deployed by completed projects, but
the number will increase as the ongoing projects move to completion.
The number of stations installed by completed ARFVTP projects amounts to a significant
portion of the charging stations in California. The last column of the table reports the data
available on the number of stations in California as of January 2017.84 The 2,523 publicly
available Level 2 chargers funded by the program amount to 28 percent of the total publicly
available Level 2 chargers in the state. Once the stations planned by the ongoing projects are
added in, the ARFVTP-funded publicly available Level 2 chargers will amount to 35 percent of
the publicly accessible charging stations in the state and ARFVTP-funded DCFC will amount to
10 percent of the DCFC stations in the state.85
Table 4.15. Charging Stations Funded by the ARFVTP and Total Charging Stations in California
Stations Funded by ARFVTP
Station Type
Charging Stations Installed by 24
Completed Projects
Charging Stations Planned by 43
Ongoing Projectsa Total Installed and Planned
Charging Stations in
California as of January 2017b
Level 1 publicc 142 56 198 611 Level 2
Public 2,523 858 3,381 8,885 Residential 4,017 209 4,226 n/a Workplace 46 334 380 n/a
DCFC public 13 88 101 874 Total 6,741 1,545 8,286 —
SOURCE: CEC-provided ARFVTP project documentation and DoE’s Alternative Fuel Data Center data for charging stations in California as of January 2, 2017. a Proposed number of outlets, not actual counts of deployed stations. b Excludes 1,345 Tesla outlets. Also excludes National Electrical Manufacturers Association connector outlets, which are sometimes used by PEV drivers but were not specifically installed to support PEVs. c Includes any Level 1 outlet that was installed expressly for the purposes of EV charging.
Another source of information about the impact of the ARFVTP on market barriers is the survey
results by awardees of electricity projects. Figure 4.11 reproduces the current barriers reported
by survey respondents in Figure 4.1; the solid bars reproduce the current barriers from Figure
4.1, and the hashed bars show the percentage of awardees who perceived that their project has
or will reduce the specified barrier. Insufficient retail charging infrastructure was the barrier
that respondents most frequently reported that their projects reduced, after insufficient
customer awareness.
In addition to directly addressing the limited number of charging stations, respondents also
believed that their projects reduced barriers related to the limited number of stations. The
84See DoE, “Alternative Fuels Data Center: Electric Vehicle Charging Station Locations,” April 21, 2017, for charging station data. There can be multiple EVSE charging stations at a single site (geographic location) and multiple charging outlets at each station. 85To calculate the percentages, the number of stations planned or installed is divided by the total number of stations as of January 2017, plus the number planned.

117
third–most “reduced” barrier, according to the survey, with 34 percent of respondents claiming
to have reduced it, was “difficulty, cost, or delay in obtaining permits for siting
fueling/charging infrastructure.” In particular, all the awardees for completed EV Readiness
Planning projects (six respondents) who responded to the survey indicated that their projects
reduced this barrier.
It is important to note that the respondents’ perceptions of having reduced barriers as reported
in Figure 4.11 must be viewed critically when considering whether barriers were actually
reduced. It is also important to remember that the hashed bars show how many respondents
perceived themselves to have reduced a given barrier at all. They do not indicate how much
particular respondents think their projects reduced a barrier. Hence, it is possible, for example,
that the vehicle projects that produced some number of vehicles for use in regional fleets did
have a small impact on a firm's ability to produce vehicles at lower costs (top red hashed bar)
because of the associated expansion of production experience and capability, although the real
impact on the barrier may be small. The shorter hashed bars for “high vehicle production cost”
and “inadequate vehicle performance” compared with “insufficient retail charging
Figure 4.11. Current Barriers to Market Viability of EVs and Percentage of Awardees Who Said Their Projects Reduced Those Barriers
SOURCE: RAND survey. NOTES: Text for second blue bar should read, “Difficulty, cost, and delay in obtaining permits for siting fueling/charging stations.” Text for first gray bar should read, “Insufficient customer awareness of and knowledge about alternative fuels and vehicles.” Text for last gray bar should read, “Insufficient pool of labor familiar with alternative fuels and vehicles.” Current barriers based on 150 electricity survey respondents who cited at least one barrier; reduced barriers based on survey responses for 99 electricity awardees.
64%
49%
37%
25%
12%
1%
63%
39%
25%
9%
6%
5%
1%
1%
1%
58%
28%
23%
25%
22%
13%
15%
13%
6%
62%
36%
12%
4%
17%
1%
2%
1%
2%
64%
22%
34%
0% 20% 40% 60% 80%
High vehicle produc5on cost
Inadequate vehicle performance
Limited number of vehicle models available
Limited vehicle produc5on capacity
High vehicle life5me opera5ng and maintenance cost
Poor emission profile of vehicle
Insufficient retail fueling or charging infrastructure
Difficulty, cost, and delay in obtaining permits for si5ng
Lack of industry standards for fueling/charging interface
Insufficient bulk fuel distribu5on infrastructure
High fuel produc5on cost
Limited fuel produc5on capacity
Limited availability of feedstock for fuel produc5on
Insufficient in-‐use performance of fuel
Poor emission profile of fuel
Insufficient customer awareness of and knowledge about
Other
Insufficient pool of labor familiar with alterna5ve fuels and
Percentage respondents claiming to have reduced each barrier

118
infrastructure” and “difficulty in obtaining permits for siting” may largely reflect the smaller
number of vehicle PD&D and RD&D projects compared with infrastructure PD&D projects.
In-depth project reviews and awardee interviews provide insight into the difficulty of siting
stations and awardees’ progress in reducing those barriers. Awardees indicated that finding
business or property owners interested in installing EVSEs in their parking lots can be difficult
because the value proposition of having an EVSE is not always clear. Property and business
owners may, justifiably, not be convinced that an EVSE will bring enough benefits to justify the
cost and effort. Questions of concern to site owners often include the following:
• Will they need to maintain the equipment themselves?
• Will customers blame them for, or bother them about, malfunctioning equipment?
• Will a reserved parking space for EV charging affect the local requirements for the
number of freely available parking spaces for their facility?
• How will they handle enforcement of “EV-only” parking restrictions to prevent a non-
plug-in vehicle from occupying the spot and preventing PEV drivers from charging?
• Is it likely that charging stations could actually attract more customers to their
business? If so, would it be enough to compensate for any installation, maintenance, or
electricity costs the business owner might pay?
• If business owners lease the property, must they then convince the property owner of
the value of installing charging stations as well?
The answers to these questions will vary from site to site and across the companies carrying
out the sale, installation, or management of the EVSE.
Siting an EVSE may thus involve a significant amount of marketing, negotiation, and
investigation on the part of the awardee or installer. Then, once sited, the EVSE must be
installed in accordance with local building, safety, and electrical regulations and codes. In the
first few years of ARFVTP-funded projects, the particular codes associated with installing Level
2 and DCFC charging stations were not well established or standardized for all regions of the
state.
It is reasonable to expect that, by going through the process of siting, permitting, and installing
EVSEs, organizations carrying out these efforts have become more experienced at identifying
and working through the necessary processes and that experience has contributed to reducing
the difficulty in future installations, both for those installing and for those issuing permits and
conducting inspections. It seems likely that these efforts have contributed to reducing another
barrier related to EV charging infrastructure—the cost of installing charging stations.
4.7.2 Vehicle Barriers Reduced by ARFVTP Projects
Awardees responding to the survey indicated that their projects have reduced or will reduce a
broad range of vehicle-related barriers to the market viability of EVs (Figure 4.11). Barriers
reduced include high vehicle-production cost, inadequate vehicle performance, limited number

119
of vehicle models available, limited vehicle production capacity, and higher lifetime operating
and maintenance costs. It is difficult to confirm the extent to which these barriers have been
reduced by the program, but it is reasonable to believe that progress has been made in many
areas.
The ARFVTP has funded a number of projects to build or expand production capacity, so it is
reasonable to conclude that this barrier has been reduced.
A substantial number of projects have developed or demonstrated PEVs of varying types. The
program has funded hundreds of demonstration vehicles of varying types (LDVs, MDVs, and
HDVs), thus reducing limitations on the types of vehicles available. Recall from Table 4.9 that
completed projects delivered 389 vehicles. So far, 146 vehicles have been delivered by ongoing
projects (Table 4.16).
Table 4.16. Vehicles Planned and Delivered by Ongoing Projects
Project ID Awardee Project Title
Number of Vehicles Planneda
Number of Vehicles
Deliveredb
ARV-10-011 Electric Vehicles International
Electric Vehicle Manufacturing Modernization Project
Could not be determinedc 126
500-11-025 DOE-Lawrence Berkeley National Laboratory
LBL contribution to Los Angeles Air Force Base Vehicle To Grid Demonstration 4 13
ARV-12-032 Motiv Power Systems, Inc. Pilot Production Line for Powertrain Components of Medium-and-Heavy-Duty Electric Vehicles
Could not be determined 6
ARV-13-005 Trexa Corporation TREXA BEV M9 Pilot Production Facility and Third Party BEV Business Accelerator Facility 1 1
600-13-009 DOE-Lawrence Berkeley National Laboratory
Optimized Electric Vehicle Fleet Management and Grid Transaction at Mountain View Army Reserve Base
15 Could not be determined
ARV-11-012 Electricore, Inc.
Electricore Consortium Alternative and Renewable Fuel Truck Pre-Commercial Demonstration Program
14 Could not be determined
ARV-09-017 Electric Vehicles International
Range-Extended EV Medium-Duty Pickup Truck Application 10 Could not be
determined
ARV-13-010 Motiv Power Systems, Inc. Walk-in Van Repower Demonstration 7 Could not be determined
ARV-13-011 National Strategies, LLC Electric School Bus with Vehicle-to-Grid and Vehicle-to-Building Functionality (ESB-V2G/B) 6 Could not be
determined
ARV-11-013 Electric Power Research Institute
Retrofit Plug-in Hybrid Electric Truck Project - SOW and Budget Revision, and Schedule of Products & Due Dates
5 Could not be determined
600-12-011 South Coast Air Quality Management District Electric Truck Pantograph Retrofit Project 4 Could not be
determined
ARV-09-011 Parker-Hannifin Corporation Series Hydraulic Hybrid Drivetrain Implementation in Coke Beverage Delivery Tractor
4 Could not be determined
ARV-11-014 CALSTART, Inc. California CLEAN Truck Demonstration Program
Could not be determined
Could not be determined
Total 13 projects 70 146
SOURCE: CEC administrative data as updated by survey respondents and award documentation as described in this table. a Based on awardee statement of work. b Based on final reports or other project documentation. c Indicates that we could not verify how many vehicles were actually planned or delivered because of a lack of verifying documentation (final reports, progress reports, and critical progress reviews) or a lack of statements about the number of vehicles in existing documentation.

120
One of the primary impacts of the vehicle demonstration projects has been to test and evaluate
the suitability of PHEV MDVs and HDVs in a wide array of fleet applications, which contributed
to the development of those vehicle types. Examples include the demonstration of pantographs
on semitrucks for electrification of cargo transport from port to train depot and BEV and PHEV
conversions of large-class utility trucks for use in municipal and commercial fleets. Thus, it is
reasonable to conclude that the program contributed to reducing the limited vehicle-type
barrier.
The RD&D projects, the production and use of demonstration vehicles, and the expansion of
production capacity could arguably contribute to reducing vehicle production costs, but we
were not able to collect data that allowed us to determine the extent to which this was the case.
The program contributed a sizable amount of funds toward vehicle purchase subsidies. As
noted, $24.5 million of the $179.1 million in awards for PEV projects (about 14 percent) went to
the CARB’s CVRP. We estimate that these funds would have provided incentives for roughly
10,650 vehicles.86 The ARFVTP has also provided $4 million in funding for the HVIP run by
CARB. In this case, we estimate that the funds provided incentives to purchase about 133
hybrid trucks and buses.87 In addition to getting more PEVs on the road, these programs could
help manufacturers reduce costs as volumes increase and they “learn by doing.”
Although these purchase incentive programs could increase sales volumes, further work is
needed to better understand the effects of the incentives on sales levels. In the case of the
CVRP, manufacturers are required to produce a certain number of ZEVs for sale. Consumer
rebates may thus increase the amount manufacturers are able to charge for the vehicles rather
than the number of vehicles sold. In that case, they serve as a way to share the cost of
complying with CARB’s ZEV program between the public and private sector rather than as a way
of increasing vehicle sales. It is also possible that, without rebates, the manufacturers would
need to charge less to sell their vehicles, or else only market the vehicles to higher-income
consumers. Hence, the rebates may have the effect of enabling consumers with middle and
86To put the number in perspective, the California New Car Dealers Association reports that 94,069 plug-in hybrid vehicles and 97,187 BEVs were registered in California between 2011 and 2015 (California New Car Dealers Association, California Auto Outlook, Vol. 12, No. 1, February 2016). The number of vehicles subsidized by the rebate program was estimated in the following way: Three contracts injected CEC ARFVTP funds into CARB’s CVRP rebate program—contract 600-10-005 ($2 million in total funds including administration, $1.877 million of which was allocated directly for vehicle rebates); contract 600-12-004 ($17.5 million total, $16.275 million for rebates); and contract 600-14-001 ($5 million total, approximately $4.65 million for rebates). These amounts were extracted from the statements of work for these contracts. All contracts combined provided a total of $24.5 million to CARB’s CVRP, $22.8 million of which went directly into rebate checks. (The difference went to cover CARB’s administrative costs in managing the CVRP program.) CVRP rebate statistics show that 27.4 percent of funding went to PHEVs and 71.1 percent went to BEVs. So the estimated number of PHEVs subsidized is (0.274 x $22.8 million) / $1,500 = 4,165 PHEV rebates. The estimated number of BEVs subsidized is (0.711 x $22.8 million) / $2,500 = 6,485 BEV rebates. The sum of the two is 4,165+6,485 = 10,650 total vehicles subsidized by the ARFVTP-funded contracts. For more information on the CVRP, see California Clean Vehicle Rebate Project, 2017. 87These numbers are estimates of subsidized vehicles, assuming the $4 million in this contract was entirely used for vouchers and that the average incentive amount was $30,000 per vehicle. (The HVIP program provides incentives ranging from $10,000 to $60,000 per vehicle). See Air Resources Board, “California HVIP,” undated, for more information about the HVIP Voucher Program.

121
lower incomes to consider a PEV purchase or lease. Given the multiple variables at play, it is
difficult to determine the full effect of these rebates on vehicle sales and the ripple effects on
production cost and innovation.
Given all this, we conclude that it is likely that ARFVTP-funded projects helped reduce high
vehicle production costs, but there is little empirical evidence to support the case.
4.7.3 Consumer Awareness Barriers Reduced by ARFVTP Projects
Recall from Figure 4.11 that insufficient consumer knowledge and awareness of alternative
fuels and vehicles was one of the most commonly cited barriers by survey respondents. It was
also the barrier most frequently indicated as reduced, with 65 percent of electricity awardees
indicating that their projects had reduced or would reduce this barrier. The 17 funded PEV
readiness planning projects specifically include a component of public outreach to raise
awareness, and projects funding the installation of EV charging stations may arguably raise
public awareness simply by their visibility. Other projects, such as vehicle demonstration
projects, could also increase customer awareness of PEVs, but it is difficult to confirm or
quantify such an effect. We thus conclude that it is likely that the program helped reduce this
barrier, but that there is little empirical evidence to support the case.
4.8 State of the EV Industry
The survey asked respondents to comment on the state of the EV industry and the changes in
the industry over the past five years in terms of both competition and private-sector
investment. In general, awardees tended to indicate that there are many competitors and a
growing number of them in this market. There also appears to be some private interest in
investing in the industry. However, respondents believe that government grant programs that
fund demonstration and deployment remain needed.
In particular, 54 percent of respondents somewhat or strongly agreed that there are many
competitors in developing and deploying PEVs and charging infrastructure versus 26 percent
who somewhat or strongly disagreed (Figure 4.12). Higher percentages thought that the number
of competitors had increased over the past five years. Forty percent somewhat or strongly
agreed that there are many private-sector investors interested in the EV industry, considerably
above the 30 percent who somewhat or strongly disagreed (Figure 4.13). Most respondents also
did see an increase in the private investment over the past five years.

122
Figure 4.12. State of EV Industry and Changes in Industry over Past Five Years, in Terms of Competition
SOURCE: RAND survey. NOTE: For 163 survey respondents.
Figure 4.13. State of Electric Vehicle Industry and Changes in Industry over Past Five Years, in Terms of Private-Sector Investment
SOURCE RAND survey. NOTE: For 163 survey respondents.
9%
17%
20%
24%
29%
1%
6% 5%
25%
34%
29%
1%
0%
5%
10%
15%
20%
25%
30%
35%
40%
Strongly disagree
Somewhat disagree
Neither agree or disagree
Somewhat agree
Strongly agree Did not answer
Currently there are many organiza5ons compe5ng with your organiza5on in the development/deployment of alterna5ve fuels or vehicles
Compared with five years ago, the number of organiza5ons compe5ng with your organiza5on has increased
15% 15%
28%
31%
9%
2%
10%
15%
34%
28%
11%
2%
0%
5%
10%
15%
20%
25%
30%
35%
40%
Strongly disagree
Somewhat disagree
Neither agree or disagree
Somewhat agree
Strongly agree Did not answer
Currently there are many private-‐sector investors (i.e., nongovernmental funders such as angel investors, venture capital, strategic investors, and banks) interested in your industry
Compared with five years ago, the amount of private investment has increased

123
Consistent with this, all but five of the 160 electricity survey respondents who answered a
question on government support felt that some type of government support was required. As
shown in Figure 4.14, there was broad support for a wide range of regulations and financial
programs.
Figure 4.14. Government Activities That Electricity Survey Respondents Felt Were Required
SOURCE: RAND survey. NOTE: For 160 survey respondents who answered question. In addition to the survey results, we conducted several in-depth interviews with awardees who
had conducted projects to deploy charging stations. One awardee indicated that a primary
challenge in the business of deploying and operating publicly accessible charging stations is
that the revenue gained from having a fee for charging vehicles is unlikely to cover the cost of
installation and maintenance of those stations, partly because of low use. While use is expected
to increase as PEVs gain market share, there is also the expectation that many PEV commuters
would choose to avoid charging at publicly accessible stations that require payment, given the
comparatively lower cost of electricity for them to charge at home. (Typical rates at fee-based
publicly available charging stations may be about 50 cents per kWh, while a typical Tier 1 home
electrical rate in Los Angeles may be about 16 cents per kWh.) Hence, the rate one would need
to charge to cover the cost of the installation could potentially deter PEV drivers who have a
lower-cost charging option at home. (This would not deter PEV drivers who simply need to
charge because of long commutes or because they are on a long-distance road trip.) This
awardee indicated that the business of “charging for charging” was not currently viable without
either government or private investor funding to cover the costs of initial deployment, and it is
unclear whether that situation will change in the foreseeable future. Another awardee
interviewed indicated that their business model of deploying and operating charging stations is
viable for the foreseeable future without being dependent on government grants, but that
3%
16%
41%
54%
55%
66%
73%
78%
84%
0% 10% 20% 30% 40% 50% 60% 70% 80% 90%
None
Other
Producer tax breaks or subsidies
Carbon tax or tax on petroleum-‐based fuels
Quan5ty requirements for vehicles or fuels
Grants for RD&D
Consumer awareness programs
Consumer tax breaks or purchase subsidies
Grants for demonstra5on and deployment

124
awardee is also leveraging considerable (and “patient”) capital investment from private
industry.
4.9 Views of Electric Vehicle Stakeholders on ARFVTP Investment Priorities
We asked the awardees, unsuccessful applicants, and potential applicants for electricity awards
open-ended questions in the survey about how the ARFVTP has invested its funds. Respondents
were first asked to comment on the allocation of awards by fuel type and market segment.
Figure 4.15 shows the ten most common responses as a percentage of respondents suggesting
some sort of change in the ARFVTP’s investment priorities. For this question, 83 respondents
(out of 163 stakeholders) provided answers. As might be expected, the most common responses
were that more should have been invested in the electricity fuel type and that less should be
spent on other fuel types (especially hydrogen).
Figure 4.15. Electricity Respondents on How CEC Should Have Allocated Its Funds Differently
SOURCE: RAND survey. NOTE: Bars show percentage of respondents suggesting that change. For 83 survey respondents who answered question.
In terms of the split of the investment portfolio to date between RD&D and PD&D, the most
common response (not shown here) was that more RD&D funding was needed (50 percent of
the 34 respondents), followed by the assessment that the division was reasonable (32 percent);
only 9 percent of respondents think that more PD&D funding was needed.
We finally asked electricity stakeholders how the ARFVTP should prioritize investments over
the next five years. The suggestions were wide-ranging, but Figure 4.16 shows the 16 most
frequently stated suggestions by the 98 respondents who answered the question. Continued
deployment of electric fueling infrastructure was the most common response by far (31 percent
35%
30%
20%
19%
18%
13%
13%
11%
8%
6%
0% 5% 10% 15% 20% 25% 30% 35% 40%
More on electricity
Less on hydrogen
Less on methane
Less on ethanol
Less on biodiesel
More on hydrogen
More on electric-‐fueling infrastructure
More on workforce development
More on methane
Less on hydrogen-‐fueling infrastructure

125
of the 102 respondents). Respondents often called out which specific station and location types
they thought should be targeted, specifically primarily residential multiunit dwelling EVSEs (9
percent) and DCFCs (7 percent). Interestingly, the second most-frequent response was that the
CEC should focus on RD&D (13 percent), followed by funding for hydrogen as a vehicle fuel (11
percent) and fueling infrastructure in general, without specifying which fuel type (10 percent).
Figure 4.16. Views of Electricity Respondents on How the ARFVTP Should Prioritize Its Investments over the Next Five Years
SOURCE: RAND survey. NOTES: Bars show percentage of respondents suggesting that change. For 98 survey respondents who answered question.
4.10 Conclusions
The ARFVTP addressed a wide range of barriers to the market viability of PEVs. The program
funded 130 projects through January 2015, for a total of $161 million, with substantial
amounts for fueling infrastructure ($48 million), vehicle RD&D ($38 million), and vehicle PD&D
($74 million). The primary targeted barrier in fueling infrastructure was the low availability of
PEV fueling infrastructure, which the ARFVTP has addressed by funding projects to deploy or
upgrade EVSE. The program also targeted high vehicle production cost, inadequate vehicle
capabilities, and the limited number of vehicle models available by funding projects to
demonstrate and deploy PEVs (especially MDVs and HDVs) and projects to conduct R&D on
various innovative plug-in hybrid drivetrain improvements and vehicle retrofits.
31%
13%
11%
10%
9%
9%
9%
7%
6%
6%
6%
5%
5%
5%
5%
5%
0% 5% 10% 15% 20% 25% 30% 35%
EV fueling infrastructure deployment
RD&D (general)
Funding for hydrogen
Fueling infrastructure (general)
Mul5unit dwelling EVSE deployment
Funding for electricity
Funding for outreach and educa5on
DCFC deployment
Fueling infrastructure rebates and incen5ves
Funding for methane
Funding to develop electric MDVs and HDVs
Funding for Vehicle-‐to-‐Grid projects
Focus on zero-‐emission vehicles (electric and hydrogen)
Hydrogen-‐fueling infrastructure deployment
RD&D for EV bareries
Corridor EVSE deployment
126
In terms of performance, projects completed through September 2016 achieved a high
percentage of their technical objectives, and awardees were optimistic that technical objectives
for ongoing projects would be met. A sample of charging stations installed by the program was
inspected, and it was found that nearly all the stations that were claimed to be installed were in
fact installed and operational.
Projects did tend to run behind schedule. Only about one-half of projects completed to date
have been completed on schedule, and only 35 percent of ongoing projects were on schedule.
Remaining on schedule was particularly challenging for vehicle RD&D projects. Primary reasons
for delay were the need to change project location, problems with the technology, and difficulty
in obtaining permits. A number of awardees also pointed to delays in obtaining CEC approvals
for scope of work and budget changes as a reason for delay. While few charging infrastructure
projects were canceled, the number was not negligible for vehicle RD&D and vehicle PD&D
projects. Overall, approximately 15 percent of these projects were canceled, with $3.1 million of
ARFVTP funds spent out of the $24 million initially awarded for these projects.
While estimates are imprecise, our analysis indicates that the program enabled a substantial
number of projects to proceed that would not have proceeded without ARFVTP funding. The
projects in most, but not all, cases appear to have produced products or technologies that show
some market potential. About 85 percent of awardees continued to develop, market, install, or
produce the product or technology after completion of the project; percentages were high for
fueling infrastructure projects, vehicle RD&D, and vehicle PD&D.
The program had the most demonstrable effect on charging infrastructure. More than 6,500
charging stations were installed by projects completed through September 2016, and roughly
another 1,500 are expected to be installed by projects that remain ongoing. The 3,381 publicly
available Level 2 chargers installed or planned by the program amount to 35 percent of the
publicly available Level 2 chargers in the state. The increased availability of fueling
infrastructure is a real benefit that aids in supporting PEVs, and it also may improve public
awareness of the practicality of driving a PEV because of the visible availability of support
infrastructure.
The ARFVTP’s contribution to reducing vehicle-related barriers is more nuanced. The ARFVTP’s
funding of manufacturing capacity expansion projects also seems to have contributed to vehicle
component production capacity, potentially reducing the barrier of vehicle costs to customers.
The substantial number of vehicle development and demonstration projects appears to have
reduced limitations on the number of vehicle types, with impact on the medium- and heavy-
duty markets. The ARFVTP spent considerable funds on purchase incentives. Increased sales
would in principle help manufacturers improve products and reduce costs through scale
economies. However, more work needs to be done to evaluate the extent to which these
purchase incentives increased sales or were primarily a way to share the cost of complying with
CARB regulations between the public and private sectors.

127
The most common advice of EV stakeholders on allocating funds for electricity projects was
that charging station deployment should be continued or increased and that more should be
spent on RD&D.
What types of charging stations to focus on moving forward warrants careful consideration.
Near the beginning of the ARFVTP, it made sense to fund the deployment of charging stations
in all types of locations, including residential stations at single-family homes and multiunit
dwellings, workplace stations available primarily to employees, and publicly accessible charging
stations. Given the relative paucity of modern charging stations in 2009, it also made sense to
fund stations of all types, including Level 1, Level 2, and DCFC stations. After nearly eight years
and the continued widespread deployment of this broad variety of charging stations, it may
make sense to reevaluate the deployment strategy by concentrating funding on those station
types and circumstances best suited to demonstrated use patterns and by considering the
evolution of PEV model capabilities.
As mentioned in Section 4.3, studies have indicated that the vast majority of PEV charging is
done at home or at the workplace, with a relatively smaller utilization rate of public charging
stations. In addition, workplace charging station deployment has been part of the ARFVTP, but
it has produced fewer charging stations than residential and public station deployment efforts.
It may thus make sense to consider concentrating more funding on workplace charging
stations, where employee vehicles can be recharged while sitting mostly idle during the day,
and relatively less funding for Level 2 stations in those public places with less vehicle dwell
time (such as convenience stores), which tend to be used less. For residential charging stations,
it may make sense to concentrate funding efforts in deployment at multiunit dwellings, given
that a significant number of electric fuel stakeholders singled out that type of deployment, and
it may currently be difficult for residents living in multiunit dwellings to have access to any
kind of charging outlet in the location where they park their cars.
In addition, as more LDVs become available with larger battery packs (e.g., the recently released
Chevrolet Bolt with a 238 miles EPA-estimated range), one might expect even less use of public
Level 2 charging stations, since longer-range BEV drivers may need to recharge outside the
home or the workplace even less frequently than drivers of the current approximate 100-mile
range EVs do. This evolution to gradually larger battery packs and longer range per charge may
also increase relative demand for public DCFC stations, which can fuel vehicles seven to eight
times faster than Level 2 stations and greatly reduce the time needed to restore driving
capability for long-distance trips.

128
CHAPTER 5: Impact of Program on Barriers to Market Viability of Diesel Substitutes
In this chapter, we provide our analysis of the impact of the Alternative and Renewable Fuel
and Vehicle Technology Program (ARFVTP) on the barriers to the market viability of diesel
substitutes. We begin with a summary of data sources that inform the chapter’s findings,
followed by a technical overview of diesel substitutes as a transportation fuel and a discussion
of the barriers identified to using diesel substitutes as a transportation fuel. We then review the
California Energy Commission’s (CEC’s) solicitations and grants in diesel substitutes and
summarize the data sources used in the analysis. With that material discussed, we turn to a
discussion of awardee performance in the diesel-substitutes industry before discussing the
results of our impact analysis of the ARFVTP on the awardees, on the diesel-substitutes
industry, and on the barriers to market viability in the industry. We then discuss stakeholder
views about ARFVTP investment priorities and end with our conclusions.
5.1 Summary of Data Sources
The data in this chapter are drawn from a number of sources, including administrative data
from CEC, project documentation (proposal, statement of work, critical project review
presentations if available, and, for completed projects, the final project reports), research
literature on diesel substitutes, our in-depth reviews of selected ARFVTP-funded projects
involving diesel substitutes, and our survey. As shown in Table 5.1, the survey response rate for
diesel-substitute awardees was 78 percent (18 out of 23), and the response rate for
unsuccessful applicants was 43 percent (21 out of 49). Seven potential applicants for awards in
the diesel-substitutes area also completed the survey. There were 46 total respondents.
Table 5.1. Survey Respondents and Nonrespondents for Diesel Substitutes Fuel Type, by Category
Category Number in Survey Sample Respondents
Response Rate
(Percentage) Awardees 23 18 78%
Project complete 9 8 89% Project ongoing 10 8 80% Project not yet started 0 0 — Project canceled/terminated 4 2 50%
Unsuccessful applicants 49 21 43% Potential applicants n/a 7 — Total — 46 —
SOURCE: RAND survey. NOTE: Potential applicants could not all be categorized by fuel type.

129
5.2 Technical Overview of Diesel Substitutes as a Transportation Fuel
Diesel substitutes include biodiesel, renewable diesel, and Fischer-Tropsch (FT) diesel, each of
which is discussed below.
5.2.1 Biodiesel
Biodiesel is fuel that typically comprises fatty methyl esters (FAME) derived from vegetable oil,
animal fat, or waste oil. Biodiesel is produced using a transesterification process. Although
biodiesel is relatively easy to manufacture, close attention must be paid to product quality to
avoid performance problems in customers’ engines.
Common commercial biodiesel blends include B20 (20 percent biodiesel and 80 percent
petroleum diesel), B5, and B2. Because biodiesel gels in cold weather, a blend such as B20
avoids many of the cold-weather performance concerns associated with B100.88 For unmodified
vehicles, biodiesel can be used in blends up to B20. Biodiesel can be used as an alternative to
heating oil. B5 is a popular blend because this level of biodiesel is low enough that marketers
do not have to label their pumps as dispensing biodiesel.
Its tendency to gel means that it cannot be mixed with conventional diesel in the diesel pipeline
and distribution system at high blends. In addition to its tendency to gel, biodiesel has solvent
and cleaning properties that will pick up the dirt/rust in the pipeline and can throw the fuel in
the pipeline off specification.
Biodiesel can have very low carbon intensity (CI). Biodiesel made from recycled cooking oil has a
CI of around 12 grams carbon dioxide equivalent per megajoule (gCO2e/MJ), which is quite
helpful in reducing carbon emissions. Other than corn oil, the CI values for most other
nonrecycled vegetable oils are generally much higher, closer to that of petroleum diesel.89
Biodiesel improves air quality by providing reduced emissions of carbon monoxide, particulate
matter, unburned hydrocarbons, and sulfates compared with petroleum diesel fuel. Biodiesel
reduces emissions of carcinogenic compounds by as much as 85 percent compared with
petroleum diesel.90 When blended with petroleum diesel fuel, these emissions reductions tend
to be directly proportional to the amount of biodiesel in the blend. Biodiesel is biodegradable,
nontoxic, and free of sulfur and aromatics.
Like petroleum diesel, however, biodiesel exhaust does have high levels of nitrous oxide (NOx),
a source of concern for air regulators in California. The California Environmental Protection
Agency’s Air Resources Board (ARB’s) recent Alternative Diesel Fuel (ADF) rule establishes a
88At higher blends, biodiesel may also degrade some hoses, gaskets, seals elastomers, glues, and plastics with prolonged exposure. Natural or nitrile rubber compounds, polypropylene, polyvinyl, and Tygon materials are particularly vulnerable. 89ARB, “Table 6. Carbon Intensity Lookup Table for Gasoline and Fuels that Substitute for Gasoline,” November 28, 2012. 90Pacific Biodiesel, “Biodiesel Benefits—Why Use Biodiesel,” undated.

130
formalized process for commercialization of biodiesel for blends greater than 5 percent.91
Reporting began in January 2016, and enforcement commences in 2018, requiring detailed
testing of most blends above B5 and all blends above B10. This will most likely limit biodiesel
blends to B5.
5.2.2 Renewable Diesel
Renewable diesel is fuel comprising long-chain hydrocarbons that is nearly chemically identical
to petroleum diesel but, as with biodiesel, is produced using vegetable oil, animal fat, or waste
oil. Renewable diesel, which can be produced using a hydrotreating process, is also referred to
as green diesel, second-generation diesel, or drop-in diesel. Because renewable diesel is
chemically similar to petroleum diesel, it meets the ASTM (formerly known as the American
Society for Testing and Materials) standard for on-road diesel. As such, it can either be blended
with or entirely replace petroleum diesel without requiring any changes to the fuel distribution
infrastructure and vehicle engines. It also has a higher energy content and better cold-weather
performance compared with biodiesel.
5.2.3 Fischer-Tropsch Diesel
FT diesel is produced through FT processing using biomass feedstocks. In the FT process, the
feedstock is gasified and then long-chain hydrocarbons are constructed. FT diesel is chemically
similar to petroleum diesel, and it can either be blended with or entirely replace petroleum
diesel without requiring any changes to the fuel distribution infrastructure and vehicle engines.
5.3 Barriers to Using Diesel Substitutes as a Transportation Fuel
In terms of the barriers to using diesel substitutes as a transportation fuel, we focused on
barriers that exist in each market segment: feedstock, fuel production, fueling infrastructure,
vehicles, and consumer. Table 5.2 identifies the barriers, which are discussed in more detail
later.
91ARB, Final Regulation Order, Regulation on Commercialization of Alternative Diesel Fuels, November 15, 2015.

131
Table 5.2. Barriers Identified for Using Diesel Substitutes as a Transportation Fuel
Market Segment Barrier Description
Feedstock • Limited availability and/or high cost of low-CI feedstocks
Fuel production
• Limited production capacity • High production cost • Limited ability to process low-quality, low-CI feedstocks (for biodiesel) • Uneven product quality (for biodiesel)
Fueling infrastructure
• Limited bulk blending facilities and terminals (biodiesel) • Limited retail outlets (for biodiesel over B5)
Vehicles • CARB’s B5 blend limit for biodiesel
Consumer • Concerns about biodiesel quality • Lack of awareness about availability of renewable diesel
5.3.1 Feedstock Barriers
Biodiesel and renewable diesel feedstocks can be expensive and/or scarce. For example, soy
bean oil is plentiful, but because of its value as a food source, it tends to be expensive. Waste
grease is much less expensive than vegetable oil, but its supply is limited, and its quality is
more varied.
Researchers and innovators are experimenting with production processes using second-
generation feedstocks for diesel substitutes, including such options as jatropha; algae;
camelina; dairy waste; fats, oil, and grease (FOG) in municipal wastewater; and municipal solid
waste. However, the development of production plants able to use these feedstocks is often still
in the pilot or demonstration phases. Some production plants that use these feedstocks are
commercially available but only at production volumes that are low compared with production
processes using first-generation feedstocks.
Diesel substitutes produced from vegetable oil compete with other agriculture uses for those
products, including food, feed, and timber. The production of agricultural feedstocks for
substitute diesel raises concerns about indirect land-use changes. Effects on land use can
significantly impact the overall life-cycle greenhouse gas (GHG) emissions of biofuels. More
research is required to develop feedstocks that do not compete with food, feed, or timber (such
as algae or crops grown on marginal land such as jatropha) or that are grown between crop
cycles.
5.3.2 Fuel-Production Barriers
5.3.2.1 Production Capacity
To put limitations on the production capacity of diesel substitutes in perspective, it is useful to
start with an overview of past and projected consumption of biodiesel substitutes in California.
Consumption data for biodiesel and renewable diesel are available from the CARB and CEC
starting in 2011. As shown in Figure 5.1, consumption of both biodiesel and renewable diesel

132
started at low levels in 2011 and 2012 and then rose considerably.92 Note that these
consumption figures include consumption of diesel substitutes produced in the state and diesel
substitutes imported from elsewhere in the United States or from other countries. By 2015, 126
million gallons of biodiesel and 165 million gallons of renewable diesel were consumed in
California. Total consumption of petroleum diesel and diesel substitutes was 3.744 billion
gallons in 2015, meaning that biodiesel and renewable diesel combined accounted for 7.7
percent of total diesel consumption in the state.
Figure 5.1. Actual Consumption of Biodiesel and Renewable Diesel in California and Illustrative Compliance Scenario with the Low Carbon Fuel Standard (LCFS)
SOURCE: Actual consumption from California Environmental Protection Agency, CARB, “Low Carbon Fuel Standard Reporting Tool Quarterly Summaries,” April 19, 2017. For illustrative compliance scenarios, see California Environmental Protection Agency, CARB, Appendix B: Development of Illustrative Compliance Scenarios and Evaluation of Potential Compliance Curves, April 1, 2015.
The dotted lines in Figure 5.1 show the illustrative LCFS compliance scenario developed by
CARB in April 2015. In this scenario, biodiesel consumption levels off at 190 millions of gallons
per year (mgy) (the lower dotted line), which is about 5 percent of consumption of petroleum
diesel and diesel substitutes combined (3.9 billion gallons per year in 2025). This ceiling reflects
the CARB ADF rules that effectively limit biodiesel blends to B5 and that implicitly assume that
all diesel sold publicly in California will contain 5 percent biodiesel. Renewable diesel
92The ARFVTP began in 2008; however, the CEC and the CARB began reporting California biodiesel blending and sales in 2010. The amount of biomass-based diesel production and retailing when ARFVTP began was small.
0
200
400
600
800
1000
2011 2012 2013 2014 2015 2016 2017 2018 2019 2020 2021 2022 2023 2024 2025
Million of gallons/year
Biodiesel consump5on scenario (CARB)
Renewable diesel consump5on scenario (CARB) Combined biodiesel and renewable diesel consump5on scenario (CARB) Actual consump5on of biodiesel
Actual consump5on of renewable diesel Actual consump5on of bio-‐ and renewable diesel combined

133
consumption reaches 600 mgy in 2025 (the middle dotted line), which is about 15 percent of
total diesel consumption in the state. In total, the two will thus reach 790 mgy by 2025 (the
upper dotted line). As will be discussed in the section on infrastructure barriers following,
blends with 5 percent or less biodiesel and 5 percent or less renewable diesel do not need to be
labeled. To avoid labeling issues at public fueling outlets, the CARB scenario envisions that all
diesel sold at public fueling stations in California will be B5 and R5 and that fleets will fuel at
proprietary pumps with higher concentrations of renewable diesel (e.g., R99).93
According to Biodiesel Magazine, in 2010 there were eight biodiesel producers, defined as those
producing FAME through transesterification processes, operating in California with a nameplate
capacity of 84 mgy.94 Since 2010, the number of biodiesel production facilities and nameplate
capacity has risen to 11 active production facilities in 2015, with a total nameplate capacity of
134 mgy (Figure 5.2).
Figure 5.2. California Biodiesel Producers and Production Capacity (2010–2015)
SOURCE: Biodiesel Magazine, “U.S. Biodiesel Plants,” biodieselmagazine.com, December 12, 2016. What this means is that at the beginning of the ARFVTP, in-state biodiesel production capacity
was substantially below the 180 mgy now envisioned by CARB as being produced to meet the
LCFS.
93ARB, Appendix B: Development of Illustrative Compliance Scenarios and Evaluation of Potential Compliance Curves, 2015.
94Biodiesel Magazine, “U.S. Biodiesel Plants,” 2016. The ARFVTP began in 2008; however, for this report, we use a baseline year for the biomass-based diesel market of 2010 or later, depending on data availability. One reason for this baseline was that prior to 2010, there is inconsistent reporting of related statistics from the Energy Information Administration (EIA) and CEC. For example, the EIA provides reporting in 2009, stops for all of 2010, and resumes in 2011.
Because the EIA data are intermittent, we used Biodiesel Magazine’s plant list for biodiesel production capacity data, which includes production facility names, locations, open dates, and nameplate capacity.
8 9 9 10 10 11
84
99 99
114 114
134
0
20
40
60
80
100
120
140
160
2010 2011 2012 2013 2014 2015
Number of producers Nameplate capacity (mgy)

134
Turning to renewable diesel, our research has identified two renewable diesel production
facilities with an estimated combined production capacity of 53 mgy. The first is Kern Oil &
Refining in Bakersfield. In 2011, Kern Oil & Refining completed CARB’s LCFS biofuel-producer
registration, stating it would produce a coprocessed, hydrogenation-derived renewable diesel.
Kern’s process creates a 20-percent renewable diesel blend (R20) derived from 20 percent tallow
and 80 percent conventional hydrocarbons.95 Kern’s capacity is 15 mgy, which is reflected in the
capacity shown in Figure 5.3 for 2011 to 2013. The second renewable diesel production facility,
AltAir Fuels, is located in Paramount, California. Production capacity at the AltAir facility is 38
mgy of renewable diesel and renewable jet fuel.96
Figure 5.3. California Renewable Producers and Production Capacity (2010–2015)
SOURCE: Author research.
Thus, there was no production capacity in California when the ARFVTP started, and production
capacity in California remains far below the 400 mgy in CARB’s LCFS compliance scenario for
2020. The gap can be filled with imports. As will be discussed below, imports of biodiesel and
renewable diesel into California are substantial.
5.3.2.2 Production Cost
The cost of producing diesel substitutes can be high, relative to the petroleum diesel price.
The federal Renewable Fuel Standard allows fuel producers and importers to satisfy their
obligations under the program by buying and selling what are called Renewable Identification
Numbers (RINs). Under the federal system, each gallon of renewable fuel is assigned a RIN when
95 Hart Energy, “Kern, Neste Eyeing CARB Low-Carbon Fuel Standard with Renewable Diesel Fuels,” Diesel Fuel News, Vol. 15, No. 37, September 26, 2011. 96Phone conversation between Stillwater Associates and Marshall Bell of AltAir Fuels, June 14, 2016.
0 1 1 1 2 2 0
15 15 15
53 53
0
20
40
60
80
100
120
140
160
2010 2011 2012 2013 2014 2015
Number of producers Nameplate capacity (mgy)

135
the fuel is shipped from its manufacturing plant. RIN prices for diesel substitutes will tend to
fluctuate around the incremental cost of producing a gallon of diesel substitutes over a gallon
of petroleum diesel.97
Figure 5.4 shows RIN prices from 2012 through 2016 for diesel substitutes. The average RIN
price over this five-year period is 80 cents per gallon, and there is no obvious trend over the
period. With the exception of a price spike in mid-2013, prices tended to fall in 2012 and 2013
and have been on a general upswing over the last three years. These figures reflect both
domestically produced and imported diesel substitutes.
Figure 5.4. RINs Prices for Diesel Substitutes 2012–2016 (Cents/Gallon)
SOURCE: Oil Price Information Reporting Service, 2017.
5.3.3 Fueling Infrastructure Barriers
5.3.3.1 Biodiesel Fueling Infrastructure
As discussed, biodiesel cannot be mixed except at low blends with conventional diesel in the
diesel distribution system and is distributed by truck, rail, or barge. B100 can require heated or
insulated storage because biodiesel made from some feedstocks can gel in cold weather. To
avoid variation in the blend ratio when fuel is dispensed, tanks in which biodiesel are blended
can require mixers, and proportional blending of B99 and petroleum diesel can be required as
97The incremental cost of producing a gallon of diesel substitutes depends in part on the amount of diesel substitutes and RINs credits that need to be produced. The following significant dates in the development of the RFS program are thus relevant to RINs prices: February 7, 2013 (2013 proposed rule); August 15, 2013 (2013 final rule); November 29, 2013 (2014 proposed rule); December 9, 2014 (2014 proposed rule withdrawn); May 29, 2015 (2014–2016 proposed rule); November 30, 2014 (2014–2016 final rule).
0
20
40
60
80
100
120
140
160
180
1/3/12 1/3/13 1/3/14 1/3/15 1/3/16 1/3/17
Cents/gallon

136
they are loaded onto tanker trucks. Prior to the establishment of the ARFVTP, blending and
storage facilities for biodiesel were limited.
Blends of 5 percent or less of either biodiesel meet ASTM guidelines to qualify as ultra-low-
sulfur diesel and are not labeled as biodiesel at retail outlets. This biodiesel is sold through
traditional outlets as CARB diesel. However, the Federal Trade Commission requires that diesel
fuel containing more than 5 percent biodiesel must be labeled.98 CARB’s ADF rule may well limit
biodiesel blends to 5 percent, and if so, there will not be a need for higher blends of biodiesel at
retail outlets. However, to provide a full discussion of this potential barrier to biodiesel, we
review information on retail outlets for higher biodiesel blends.
There were only 14 public biodiesel retail stations operating in California in 2010 selling B20 or
higher blends. The majority of these stations are independent retailers with only one station.
Ten stations were located in Northern California, with four in Southern California.
Between two and five stations have been added each year since then, and by 2015 there were 33
biodiesel stations in California open to the public (Figure 5.5). These stations sell biodiesel
blends of at least 20 percent (B20) and up to 99 percent biodiesel (B99). This number does not
include the 28 biodiesel stations in California reserved for private enterprise or government
fleet refueling. 99
Figure 5.5. Number of Biodiesel Diesel Stations Selling B20 to B99 Opened Each Year
SOURCE: U.S. Department of Energy (DoE), Alternative Fuels Data Center, “Alternative Fuels Data Center: Biodiesel Fueling Station Locations,” undated.
98For examples of labels, see Steve Howell, “Summary of FTC Regulations Regarding Signage/Labelling,” May 20, 2014. 99 DoE, Alternative Fuels Data Center, “Alternative Fuel Stations: Biodiesel Fueling Locations,” undated.
1
0 0
1 1
8
2
3
2 2
6
1 1
2
0
1 1 1 1
5
3
5
2
5
4
2
0
1
2
3
4
5
6
7
8
9
2003 2004 2005 2006 2007 2008 2009 2010 2011 2012 2013 2014 2015
Addi5onal private sta5ons Addi5onal public sta5ons
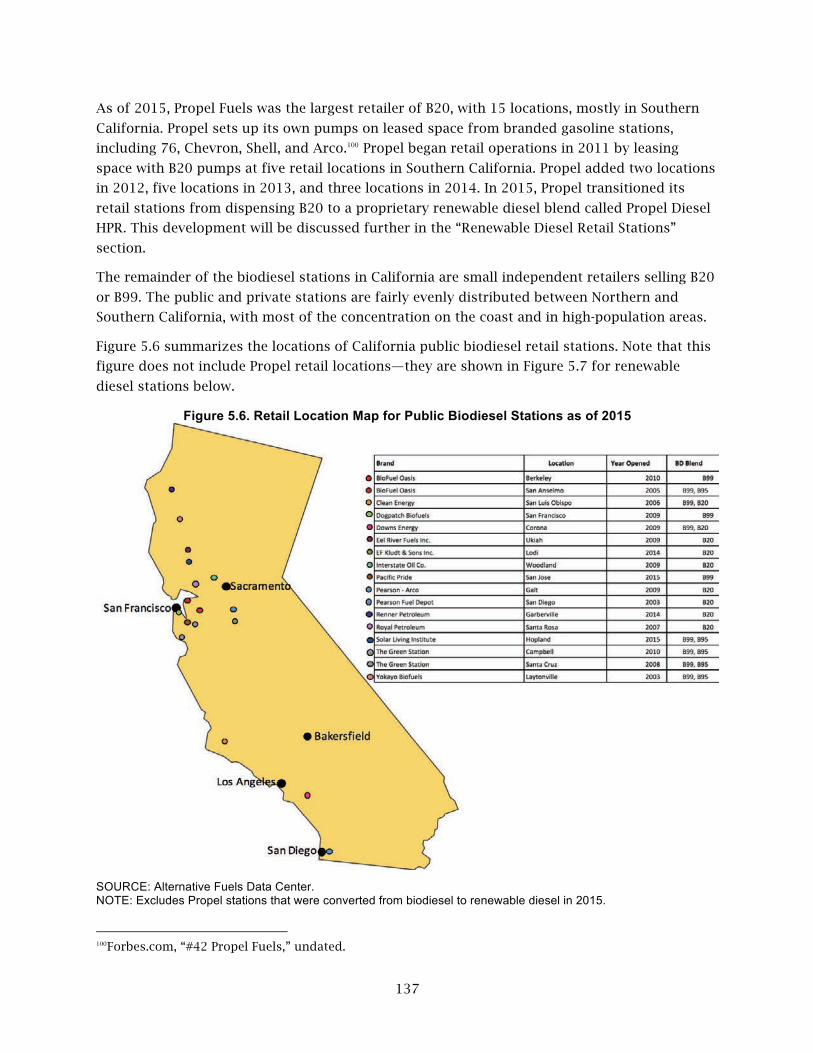
137
As of 2015, Propel Fuels was the largest retailer of B20, with 15 locations, mostly in Southern
California. Propel sets up its own pumps on leased space from branded gasoline stations,
including 76, Chevron, Shell, and Arco.100 Propel began retail operations in 2011 by leasing
space with B20 pumps at five retail locations in Southern California. Propel added two locations
in 2012, five locations in 2013, and three locations in 2014. In 2015, Propel transitioned its
retail stations from dispensing B20 to a proprietary renewable diesel blend called Propel Diesel
HPR. This development will be discussed further in the “Renewable Diesel Retail Stations”
section.
The remainder of the biodiesel stations in California are small independent retailers selling B20
or B99. The public and private stations are fairly evenly distributed between Northern and
Southern California, with most of the concentration on the coast and in high-population areas.
Figure 5.6 summarizes the locations of California public biodiesel retail stations. Note that this
figure does not include Propel retail locations—they are shown in Figure 5.7 for renewable
diesel stations below.
Figure 5.6. Retail Location Map for Public Biodiesel Stations as of 2015
SOURCE: Alternative Fuels Data Center. NOTE: Excludes Propel stations that were converted from biodiesel to renewable diesel in 2015.
100Forbes.com, “#42 Propel Fuels,” undated.

138
5.3.3.2 Renewable Diesel Fueling Infrastructure
Renewable diesel is a drop-in fuel and thus can use the existing petroleum diesel distribution
infrastructure. However, as with biodiesel, blends greater than 5 percent renewable diesel must
be labeled.101 The distribution system thus must be able to keep track of the proportion of the
fuel that is renewable diesel.
As mentioned, in 2015 Propel Fuels transitioned its 15 existing biodiesel retail stations to
renewable diesel. This retail renewable diesel is branded as Propel Diesel HPR. Diesel HPR is 98
percent renewable diesel and meets the ASTM D975 diesel specification for use in all diesel
engines. Along with converting its existing California stations to Diesel HPR, in 2015 Propel
opened ten more stations in California selling Diesel HPR and E85.102 Figure 5.7 summarizes the
locations of Propel Fuels renewable diesel retail stations.
Figure 5.7. Retail Location Map for Renewable Diesel Stations
SOURCE: Propel Fuels. 101Fuel containing 5 percent or less of biodiesel and 5 percent or less of renewable diesel does not have to be labeled. See Howell, “Summary of FTC Regulations Regarding Signage/Labelling,” 2014. 102Propel Fuels, “Diesel HPR,” undated.

139
As shown by the dates in the figure, there were no renewable diesel retail outlets when the
ARFVTP began, and the number of renewable diesel outlets remains limited. The limited
number of retail outlets is not an issue in terms of meeting CARB’s target for renewable diesel
consumption in its illustrative LCFS compliance scenario (Figure 5.1), as long as the total
amount of renewable diesel consumption remains below 5 percent. It may also not be a
problem if additional renewable diesel consumption is achieved by fleets that use nonpublic
pumps.
5.3.4 Vehicles Barriers
Biodiesel can be used in blends up to B20 in unmodified vehicles. However, as discussed,
CARB’s ADF rule will likely limit biodiesel blends to B5. In principle, vehicle emission control
technology could be modified to reduce NOx emissions when blends above B5 are used, but we
have not looked into the practicality and costs of such modifications. Because renewable and FT
diesel are drop-in fuels, there are no vehicle-related barriers to their use.
5.3.5 Consumer Barriers
In the past, there have been significant product quality problems with biodiesel produced
without close monitoring of product specifications, such as glycerin content. These quality
problems may likely affect some consumers’ acceptance of biodiesel, in part because some
engine manufacturers may void engine warranties if high blends of biodiesel are used. No
consumer acceptance barriers are anticipated with renewable diesel; however, consumer
education on the availability of renewable diesel may be needed.
5.3.6 Barriers Identified in the Survey
Findings from the survey are generally consistent with the barriers discussed. Recall that survey
respondents were asked to identify current barriers (which would be as of September 2016
when the survey was fielded) to the market viability of alternative fuels and vehicles. The
barriers identified by 41 awardees, unsuccessful applicants, and potential applicants at firms
involved with diesel substitutes are shown in Figure 5.8. (Five respondents identified no
barriers—perhaps because they skipped the question.) Each bar shows the percentage of
respondents that identified the barrier. Because respondents could select multiple barriers, the
percentages sum to more than 100 percent.
Fuel-related barriers (blue bars) were most commonly cited. High fuel-production costs, limited
availability of feedstocks for fuel production, and insufficient bulk fuel distribution
infrastructure were cited as barriers by over one-half of survey respondents who identified at
least one barrier. Limited fuel-production capacity and insufficient retail fuel infrastructure
followed in importance, cited by 46 percent and 37 percent of respondents, respectively. Lesser
emphasis was put on the difficulty, cost, and delay in obtaining permits for siting fueling
stations and on the emission performance or in-use performance of fuels. Vehicle-related
barriers (yellow bars) were identified by modest percentages of respondents. However,
insufficient customer awareness of, and knowledge about, diesel substitutes was identified by
nearly one-half of survey respondents.

140
Figure 5.8. Diesel Substitutes Barriers Identified by Survey Respondents
SOURCE: RAND survey. NOTE: For 41 survey respondents who identified at least one current barrier. Label for first gray bar should read, “Low customer awareness and knowledge about diesel substitutes.”
5.4 Review of CEC’s Solicitations and Awards in Alternative Diesel Vehicles
Table 5.3 shows a chronological summary of the ARFVTP funding solicitations and awards for
diesel substitutes. The first awards were made under a 2010 Project Opportunity Notice (PON)
and expanded terminal storage and fuel blending facilities for biodiesel. These awards were
followed by awards to develop and produce diesel substitutes (PON-09-604 and PON-11-601).
Many of these projects were research, development, and demonstration (RD&D) projects.
Attention increasingly turned to funding the expansion of biodiesel and renewable diesel
production capacity in California. PONs issued in 2013 and 2014 resulted in six projects that
promised substantial expansion of biodiesel or renewable diesel production capacity in
California.103 In sum, 24 diesel-substitute projects were funded by the ARFVTP through January
2015, for a total of $55.2 million.
103Viridis Fuels received a grant to build and operate a 20-mgy biodiesel production facility under PON-13-609 (project ARV-14-040). However, this project was funded after the January 2015 cutoff for projects examined in this evaluation.
34% 17%
46% 7%
17% 24%
37% 46%
54% 59% 59%
5% 10% 12% 15% 15% 17%
24%
0% 10% 20% 30% 40% 50% 60% 70%
Other Insufficient labor pool
Low customer awareness and Insufficient in-‐use fuel performance
Poor emission profile of fuel Difficulty in obtaining permits
Insufficient retail fueling infrastructure Limited fuel produc5on capacity
Insufficient bulk fueling infrastructure Limited feedstocks
High fuel produc5on cost High vehicle O&M High vehicle cost
Inadequate vehicle performance Lack of fueling/charging standards
Poor vehicle emission profile Limited vehicle produc5on capacity
Limited vehicle models

141
Table 5.3. Chronological Summary of Diesel Substitutes Solicitations and Awards
Solicitation Amount Diesel Substitute Awards
Through January 2015
Year Solicitation
Type of Diesel Substitute Projects Eligible
Total ($ M)
Earmarked for Diesel
Substitutes ($ M) Number
Combined Amount ($ M)
2009
PON-08-010: American Recovery and Reinvestment Act of 2009 Cost Share
Production plants and fuel storage and blending facilities
$176 $6 0 0
2010
PON-09-006: Alternative and Renewable Fuel Infrastructure
Fuel terminal storage and blending facilities
$13.8 $4 3 $3.9
2010 PON-09-604: Biofuel Production Plants
Develop/ produce alternative and renewable fuels
$14.9 for all fuels
N/A 6a $4.3
2012 PON-11-601: Biofuels Production Facilities
Projects from RD&D to commercial production
$37.7 $11.9 6b $16.8
2012
PON-11-602: Alternative Fuels Infrastructure: Electric, Natural Gas, Propane, E85 & Diesel Substitutes Terminals
Wholesale, bulk, or terminal distribution
$30.3 $3.1 3c $1.1
2013
PON-13-601: Commercial Scale Advanced Biofuels Production Facilities
Commercial scale production facilities
$9.3 for all fuels N/A 2 $9.9
2013 PON-13-603: Alternative Fuel Readiness Plans
Alternative Fuel Readiness Plans $2.1 N/A 0 0
2013
PON-13-604: Federal Cost Share for Emerging Technologies
Projects to develop an improve alternative and renewable fuels and feedstocks
$2.2 N/A 0 0
2014
PON-13-609: Pilot-Scale and Commercial-Scale Advanced Biofuels Production Facilities
Pilot-scale and commercial production facilities
$24 $9 4 $19.2
Total 24 $55.2 SOURCE: CEC administrative data.
a One of these projects was withdrawn before work got under way—amount awarded was $50,709. b One of these projects was canceled before work got under way—amount awarded was $1.86 million. c Two of there were canceled before work got under way—amount awarded for the two projects was $1 million.
As shown in the “Market Segment” section of Table 5.4, $50.2 million of the $55.2 million (91
percent) was awarded for fuel development or production, with the remaining 9 percent for
bulk and retail fueling infrastructure. Of the $55.2 million, $10.1 million (18 percent) was for
RD&D, with the remaining 82 percent for production or deployment (PD&D) (see “Technology
Development Stage” section). The last set of rows groups projects by both market segment and

142
technology development stage. For diesel substitutes, the bulk of funding went to fuel
production, with lesser amounts for fuel RD&D and the installation of fueling infrastructure.
Table 5.4. Diesel Substitutes Awards Through January 2015
Market Segment and Technology Development Phase Number
Amount ($ M)
Market Segment Fuel development or production 18 $50.2 Fueling infrastructure (bulk or retail) 6 $5.0 Vehicle or component development 0 0
Technology Development Stage RD&D 8 $10.1 PD&D 16 $45.1 Regional readiness 0 0
Project Type Fuel RD&D 8 $10.1 Fuel production 10 $40.1 Fueling infrastructure, RD&D 0 0 Fueling infrastructure, installation 6 $5.0 Vehicle or component development 0 0 Total 24 $55.2
SOURCE: CEC administrative data as updated by survey respondents.
Table 5.5 lists the funded diesel-substitute projects by project type, start date, and status. As
shown, the fuel RD&D projects started between 2010 and 2012 and are largely complete.
Similarly, the fueling infrastructure projects started in 2011 and 2012 and are largely complete
(or canceled). The fuel-production projects started between 2012 and 2014 were nearly all
ongoing as of September 2016.
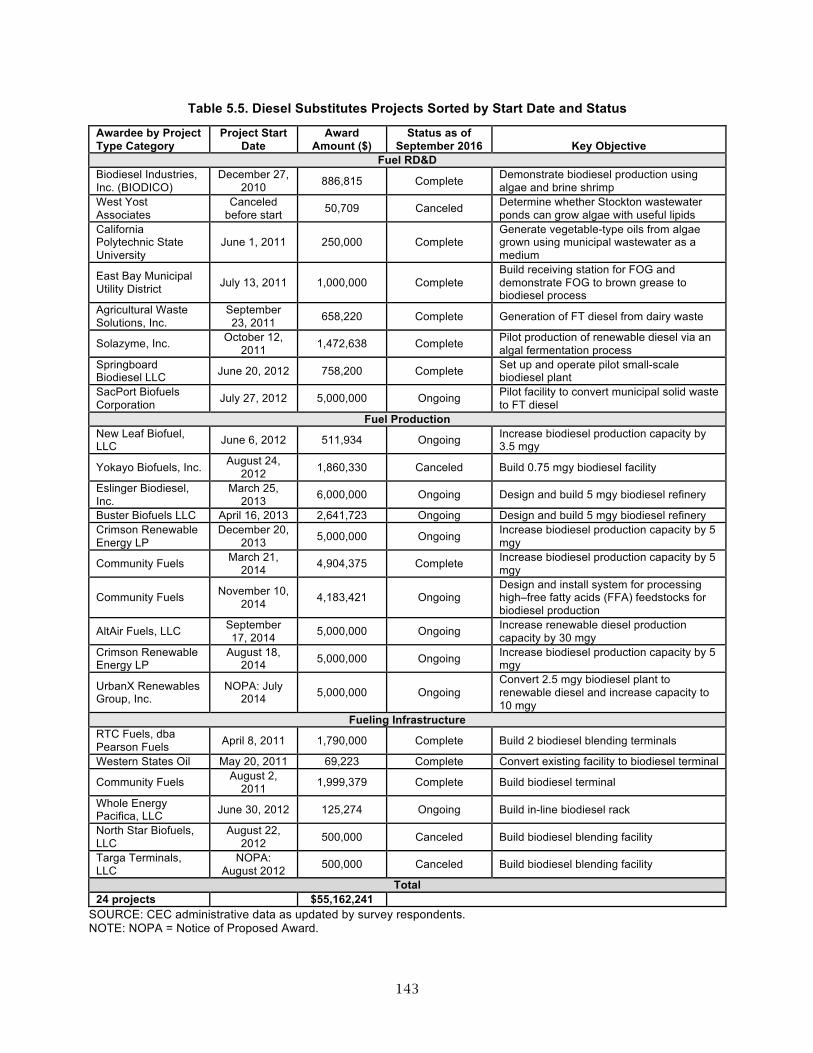
143
Table 5.5. Diesel Substitutes Projects Sorted by Start Date and Status
Awardee by Project Type Category
Project Start Date
Award Amount ($)
Status as of September 2016 Key Objective
Fuel RD&D Biodiesel Industries, Inc. (BIODICO)
December 27, 2010 886,815 Complete Demonstrate biodiesel production using
algae and brine shrimp West Yost Associates
Canceled before start 50,709 Canceled Determine whether Stockton wastewater
ponds can grow algae with useful lipids California Polytechnic State University
June 1, 2011 250,000 Complete Generate vegetable-type oils from algae grown using municipal wastewater as a medium
East Bay Municipal Utility District July 13, 2011 1,000,000 Complete
Build receiving station for FOG and demonstrate FOG to brown grease to biodiesel process
Agricultural Waste Solutions, Inc.
September 23, 2011 658,220 Complete Generation of FT diesel from dairy waste
Solazyme, Inc. October 12, 2011 1,472,638 Complete Pilot production of renewable diesel via an
algal fermentation process Springboard Biodiesel LLC June 20, 2012 758,200 Complete Set up and operate pilot small-scale
biodiesel plant SacPort Biofuels Corporation July 27, 2012 5,000,000 Ongoing Pilot facility to convert municipal solid waste
to FT diesel Fuel Production
New Leaf Biofuel, LLC June 6, 2012 511,934 Ongoing Increase biodiesel production capacity by
3.5 mgy
Yokayo Biofuels, Inc. August 24, 2012 1,860,330 Canceled Build 0.75 mgy biodiesel facility
Eslinger Biodiesel, Inc.
March 25, 2013 6,000,000 Ongoing Design and build 5 mgy biodiesel refinery
Buster Biofuels LLC April 16, 2013 2,641,723 Ongoing Design and build 5 mgy biodiesel refinery Crimson Renewable Energy LP
December 20, 2013 5,000,000 Ongoing Increase biodiesel production capacity by 5
mgy
Community Fuels March 21, 2014 4,904,375 Complete Increase biodiesel production capacity by 5
mgy
Community Fuels November 10, 2014 4,183,421 Ongoing
Design and install system for processing high–free fatty acids (FFA) feedstocks for biodiesel production
AltAir Fuels, LLC September 17, 2014 5,000,000 Ongoing Increase renewable diesel production
capacity by 30 mgy Crimson Renewable Energy LP
August 18, 2014 5,000,000 Ongoing Increase biodiesel production capacity by 5
mgy
UrbanX Renewables Group, Inc.
NOPA: July 2014 5,000,000 Ongoing
Convert 2.5 mgy biodiesel plant to renewable diesel and increase capacity to 10 mgy
Fueling Infrastructure RTC Fuels, dba Pearson Fuels April 8, 2011 1,790,000 Complete Build 2 biodiesel blending terminals
Western States Oil May 20, 2011 69,223 Complete Convert existing facility to biodiesel terminal
Community Fuels August 2, 2011 1,999,379 Complete Build biodiesel terminal
Whole Energy Pacifica, LLC June 30, 2012 125,274 Ongoing Build in-line biodiesel rack
North Star Biofuels, LLC
August 22, 2012 500,000 Canceled Build biodiesel blending facility
Targa Terminals, LLC
NOPA: August 2012 500,000 Canceled Build biodiesel blending facility
Total 24 projects $55,162,241
SOURCE: CEC administrative data as updated by survey respondents. NOTE: NOPA = Notice of Proposed Award.

144
5.4.1 Barriers Targeted by Diesel-Substitute Projects
The diesel-substitutes projects funded by the ARFVTP targeted most of the barriers identified
in Section 5.3. A number of projects were funded that addressed the availability of low-cost,
low-CI feedstocks. They did this in a number of ways. Three projects examined the cost and
feasibility of producing feedstocks from algae and one from brine shrimp. Three other projects
examined the feasibility of producing diesel substitutes from different waste streams—
specifically dairy waste, municipal solid waste, and FOG in municipal wastewater (Table 5.6).
Table 5.6. Barriers Targeted by Diesel Substitutes Projects
Market Segment
Primary Barrier Targeted Types of Projects Funded
Number of
Projects Funded
Amount Awarded
($ M)
Fuel RD&D
Limited ability to process low-quality, low-CI feedstocks
• Municipal solid waste to FT diesel • FOG collected at municipal wastewater
plants to biodiesel • Dairy waste to FT diesel
3 $6.7
High production cost • Demonstrate small-scale, replicable biodiesel production facility (0.36 mgy) 1 $0.8
Limited availability and/or high cost of low-CI feedstocks
• Demonstration of process for generating of algae biofuel feedstocks (three projects)
• Design process that produced biodiesel from oil harvested from brine shrimp that feed on algae
4a $2.7
Fuel production
Limited production capacity High production cost
• Build and/or expand 6 biodiesel facilities (adds 27 mgy capacity)
• Build and/or expand 2 renewable diesel facilities (adds 37.5 mgy capacity)
9a $35.9a
Limited ability to process low-quality, low-CI feedstocks
• Modify one biodiesel production facility to process high-FFA feedstocks 1 $4.2
Fueling infrastructure
Limited bulk blending facilities and terminals
• Build or expand terminals and blending racks 6b $5.0b
Limited retail outlets • None — —
Vehicles B5 blend limit for biodiesel • None — —
Consumer
Concerns about biodiesel quality and lack of awareness about properties of renewable diesel
• None — —
Total 24c $55.2Mc SOURCE: CEC administrative data. NOTE: Amount awarded does not add up to $55.2 million because of rounding. a Includes one canceled project. b Includes two canceled projects. c Includes four canceled projects whose awards total $2.9 million.
Substantial funding was allocated to increasing production capacity in California. More than
$35 million was allocated to expand production capacity by 27 mgy at six biodiesel facilities

145
and 37.5 mgy at two renewable diesel facilities. These projects directly targeted limitations on
production capacity, but they also addressed other barriers to the market viability of diesel
substitutes. Production at greater scale and using the up-to-date technology installed in the
expansions can help reduce production costs. The greater automation in larger-scale production
can help improve the consistency of biodiesel quality.
One project directly addressed the limited ability to process low-quality feedstocks by installing
the equipment at a biodiesel production facility needed to process feedstocks high in FFA.
Turning to fueling infrastructure for diesel substitutes, the ARFVTP also funded several
projects that addressed the limited number of bulk blending facilities and terminals. Six
projects, totaling $5 million, targeted this barrier.
There were some barriers that the ARFVTP did not directly target. The program did not fund
projects that aimed to improve consumer awareness of diesel substitutes or improve
understanding of the in-use performance of diesel substitutes. It also did not fund research on
how to improve the emission profile of biodiesel, through changes in either vehicle emission
control technology or the chemical composition of biodiesel. Finally, it did not fund refueling
sites for biodiesel or renewable diesel with blends greater then B5 or R5.
5.5 Awardee Performance
5.5.1 Project Status
Of the 24 projects funded through January 2015, about 40 percent (ten) were completed by the
time the survey was completed in September 2016 (Table 5.7). Ten remained ongoing, and four
projects were canceled or terminated. Two of the canceled projects proposed building blending
facilities—one in Stockton and one in Watsonville. The Watsonville project was canceled
because of prevailing wage issues.104 A third canceled project proposed to upgrade and expand a
biodiesel production facility in Mendocino County from 0.51 to 0.73 mgy.105 The awardee was
not able to raise the required matching funds. The fourth project aimed to conduct a study to
determine the economic feasibility of modifying the Stockton Regional Wastewater Control
Facility ponds and wetlands to grow algal species that are capable of yielding a sufficient
quantity of lipids to be converted to biodiesel.106 However, it was withdrawn before project
start. None of the $2.9 million approved for these four projects was spent.
The last column of Table 5.7 reports the amount of invoices paid (including retention) through
December 2016. Award payments closely total the award amounts for the completed projects,
and invoices totaling 64 percent of the award amounts ($24.5 million of $38.5 million) have
been paid (including retention) for the ongoing projects.
104The Watsonville project was award number ARV-11-035. The Stockton project was ARV-12-001. 105Award number ARV-11-030. 106Award ARV-10-014 to West Yost Associates.
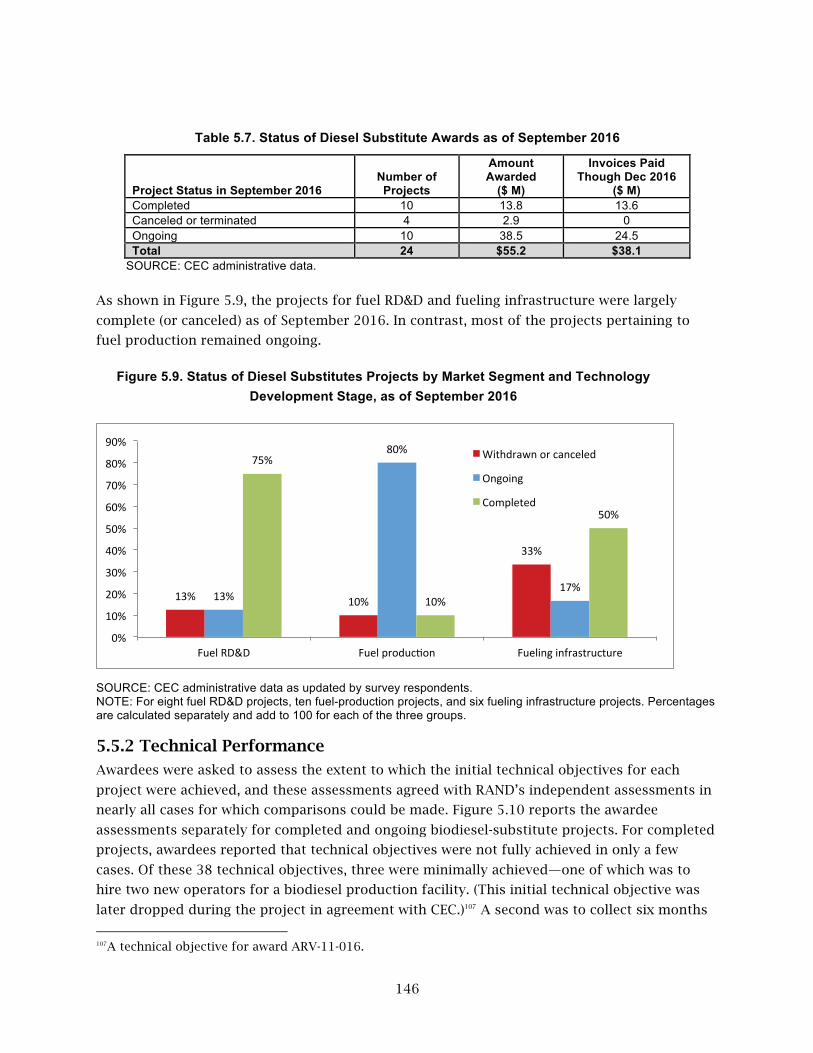
146
Table 5.7. Status of Diesel Substitute Awards as of September 2016
Project Status in September 2016 Number of Projects
Amount Awarded
($ M)
Invoices Paid Though Dec 2016
($ M) Completed 10 13.8 13.6 Canceled or terminated 4 2.9 0 Ongoing 10 38.5 24.5 Total 24 $55.2 $38.1
SOURCE: CEC administrative data.
As shown in Figure 5.9, the projects for fuel RD&D and fueling infrastructure were largely
complete (or canceled) as of September 2016. In contrast, most of the projects pertaining to
fuel production remained ongoing.
Figure 5.9. Status of Diesel Substitutes Projects by Market Segment and Technology Development Stage, as of September 2016
SOURCE: CEC administrative data as updated by survey respondents. NOTE: For eight fuel RD&D projects, ten fuel-production projects, and six fueling infrastructure projects. Percentages are calculated separately and add to 100 for each of the three groups.
5.5.2 Technical Performance
Awardees were asked to assess the extent to which the initial technical objectives for each
project were achieved, and these assessments agreed with RAND’s independent assessments in
nearly all cases for which comparisons could be made. Figure 5.10 reports the awardee
assessments separately for completed and ongoing biodiesel-substitute projects. For completed
projects, awardees reported that technical objectives were not fully achieved in only a few
cases. Of these 38 technical objectives, three were minimally achieved—one of which was to
hire two new operators for a biodiesel production facility. (This initial technical objective was
later dropped during the project in agreement with CEC.)107 A second was to collect six months
107A technical objective for award ARV-11-016.
13% 10%
33%
13%
80%
17%
75%
10%
50%
0%
10%
20%
30%
40%
50%
60%
70%
80%
90%
Fuel RD&D Fuel produc5on Fueling infrastructure
Withdrawn or canceled
Ongoing
Completed

147
of data on terminal operations,108 and the third was to distribute 1 million gallons of B99 during
the first year of operation of a bulk distribution terminal.109 An additional technical objective
was partially achieved—to dispense B99 at a rate of 5.25 mgy by end of 2013.110
Figure 5.10. Extent to Which Initial Technical Objectives Were Achieved According to Awardee for Completed and Ongoing Diesel Substitutes Projects
SOURCE: RAND assessment of extent technical objectives achieved as updated by survey respondents. *For 38 technical objectives from ten projects that had been completed by the time of the survey. **For 35 technical objectives from ten projects that were ongoing at the time of the survey. Figure 5.11 confirms the agreement between RAND and the awardee on whether the technical
objectives have been met. It shows results for completed projects for which the comparison
between the RAND and awardee assessments can be made. The primary difference between the
two assessments is that the RAND assessment has more “unknown” and less “fully” values,
which results from survey respondents correcting RAND’s assessments from “unknown” to
“fully.”
108A technical objective for award ARV-10-037. 109A technical objective for award ARV-10-008. 110A technical objective for award ARV-10-019.
0% 8%
3%
87%
3%
77%
0% 0%
17%
6%
0% 10% 20% 30% 40% 50% 60% 70% 80% 90% 100%
In-‐progress Minimally Par5ally Fully Unknown
Completed projects* Ongoing projects**

148
Figure 5.11. Extent to Which Initial Technical Objectives Were Achieved According to RAND Evaluation and Awardee for Completed Diesel Substitutes Projects
SOURCE: RAND survey and author analysis. NOTE: For 38 technical objectives from ten projects that had been completed by the time of the survey. Not surprisingly, a high percentage of technical objectives for the ongoing projects are still in
progress, as shown in Figure 5.10). However, as shown in Figure 5.12, awardees were confident
that a high percentage of these technical objectives would be met. In only one case did the
awardee believe it was highly unlikely that an in-progress technical objective would be met, and
in only two cases did the awardee believe that it was somewhat unlikely. These three technical
objectives were all from the same project—one to build a new biodiesel plant (ARV-12-035). The
awardee expected the facility would be built but that it was highly unlikely that it would be
operated for two years and that it was somewhat unlikely that the cost would come in at $0.71
per gallon of capacity and that six months of production data would be collected.
Figure 5.12. Likelihood That In-Progress Technical Objectives for Ongoing Diesel Substitute Projects Will Be Met
SOURCE: RAND survey. NOTE: For 24 technical objectives from seven projects that were ongoing at the time of the survey.
8% 5%
74%
13% 8%
3%
87%
3% 0% 10% 20% 30% 40% 50% 60% 70% 80% 90% 100%
Minimally Par5ally Fully Unknown
RAND Awardee
4% 8% 4% 8%
71%
4%
0% 10% 20% 30% 40% 50% 60% 70% 80%
Highly unlikely Somewhat unlikely
Just as likely as unlikely
Somewhat likely Highly likely No answer

149
5.5.3 Financial Performance
With few exceptions, awardees for diesel-substitutes projects have been successful in obtaining
the match funds proposed for the project. As shown in Figure 5.13, the match obligation was
obtained in nearly 90 percent of the completed projects that required a match. For ongoing
projects, 50 percent have obtained the match obligation so far, with the percentage likely to
increase as the projects move forward. As discussed previously in this chapter, one diesel-
substitutes project was canceled because of the failure to obtain the match obligation, but this
has been a rare occurrence for this fuel type.
Figure 5.13. Success in Obtaining Matching Funds
SOURCE: RAND survey. NOTE: For projects with match fund target greater than $0.
Match funds in some cases turned out to be higher than initially expected, indicating cost
overruns. (The CEC award is fixed.) Higher-than-expected in-kind services had been contributed
so far by the awardee or subcontractors in about 30 percent of diesel-substitutes projects, and
higher than expected financial payments were made by awardees and subcontractors in about
15 percent of projects. Private investors also contributed more than expected in about 15
percent of projects.111
5.5.4 Schedule Performance
Most of the diesel-substitutes projects have been completed on time. Figure 5.14 reports the
extent of delay according to the Commission Agreement Manager (CAM) as updated by survey
respondents separately for completed and ongoing projects. As can be seen, 70 percent of
completed projects were completed on schedule. Performance for ongoing projects so far is not
111In-kind contributions were higher for four of 14 completed and ongoing projects with positive match obligation (excludes missing responses for two projects); financial contributions by awardee and subcontractor were higher for two of 14 projects (two missing); private investors contributions were higher for two of 14 projects (three missing).
88%
13% 0%
50%
25% 25%
0% 10% 20% 30% 40% 50% 60% 70% 80% 90% 100%
Obtained proposed matching funds
Have not obtained proposed matching funds
No response
8 completed projects 8 ongoing projects

150
as positive, with 50 percent on schedule as of mid-2016; it is reasonable to expect that the
percentage on schedule will decline over time.
Figure 5.14. Schedule Performance for Completed and Ongoing Projects
SOURCE: CAM assessments provided to authors as updated by survey respondents.
Awardees whose projects were behind schedule were asked the reasons for delay. Only six
diesel-substitutes awardees provided reasons for delay. As shown in Figure 5.15, delay in
obtaining permits was the common reason, followed by a change in project location. Two
“other” reasons were indicated by awardees:
• upgrade in a key technology component during the project
• shortage of capital because of a shift in market conditions and increased infrastructure
costs.
0%
70%
0%
20%
0% 10%
0% 0%
50%
0%
20% 30%
0% 0% 0%
20%
40%
60%
80%
Ahead On schedule 1 to 6 mo. behind
7 to 12 mo. behind
13 to 24 mo. behind
25 or more mo. behind
Unknown
10 Completed projects 10 Ongoing projects

151
Figure 5.15. Reasons for Delay in Diesel-Substitutes Projects
SOURCE: RAND survey. NOTE: Six awardees reported delays.
5.6 Impacts on Awardee
5.6.1 Effect of Award on Ability to Undertake the Project
Central to assessing the impact of the ARFVTP is whether the award enabled the awardee to
proceed with the project or whether awardees would have proceeded with their projects anyway
if they had not received the awards. One indirect indicator of what awardees would have done
absent the award is the status of projects proposed by unsuccessful applicants. The advantage
of this indicator is that it is based on actual behavior. The disadvantage is that the projects
proposed by the unsuccessful applicants may have been more poorly conceived or planned that
those funded by the ARFVTP. As shown in the last row of Table 5.8, 62 percent of unsuccessful
Table 5.8. Fate of Projects Proposed by Unsuccessful Applicants
After your Unsuccessful Application for the ARFVTP Grant, Which of the Following Best Characterizes the Status of the Project?
(Percentage)
Project Type Number of Projects
Proceeded Within 1 Year
Proceeded 1 to 3 Years Later
Has Not Proceeded
Did Not Answer
Fuel RD&D 18 11 17 67 6 Fuel production 0 0 0 0 0 Fueling infrastructure 2 50 0 50 0 Vehicles 1 0 100 0 0 Total 21 14 19 62 5 SOURCE: RAND survey. NOTE: For 21 unsuccessful applicants who completed the survey. Percentages for fuel RD&D fuel type do not add because of rounding.
67%
0%
0%
0%
0%
0%
17%
17%
17%
50%
50%
0% 10% 20% 30% 40% 50% 60% 70%
Other
Delay in securing matching funds
Delay in hiring essen5al staff
Other ongoing projects
Staff leg company
Problems with technology
CEC late in paying invoices
Waited on CEC approvals
Hesita5on by site owner
Needed to change project loca5on
Delay in gecng permits

152
diesel-substitutes applicants had not proceeded with the proposed project when the survey was
fielded. However, one-third had proceeded, thus suggesting that ARFVTP funding was not
necessary for at least some of the projects actually funded.
A second indicator of the importance of the award is awardee predictions on whether they
would have proceeded with the project had they not received the award. As shown in the last
row of Table 5.9, 13 percent believed they would have proceeded, and many more said they
might have proceeded. Fuel RD&D projects, which are typically less expensive than fuel-
production projects, are the only ones for which the survey respondents said they would have
proceeded.
Table 5.9. Awardee Predictions of Whether They Would Have Proceeded with the Project Absent ARFVTP Funding
Had Your Organization Not Received This ARFVTP Grant, Which of the Following Best Characterizes If and When You Would Have Proceeded
with a Similar Project? (Percentage)
Project Type Number of Projects
Would Have Proceeded
Within 1 Year
Would Have Proceeded 1 to 3 Years Later
Might Have
Proceeded
Would Not Have
Proceeded Did Not Answer
Fuel RD&D 6 0 33 50 0 17 Fuel production 7 0 0 71 29 0 Fueling infrastructure 3 0 0 67 33 0 Total 16 0 13 63 19 6 SOURCE: RAND survey. NOTE: For 16 awardees who completed the survey.
5.6.2 Impact on Knowledge and Capabilities
Awards had a significant impact on awardees’ knowledge and capabilities. As reported in Figure
5.16, all but a few awardees somewhat agreed or strongly agreed that the awards allowed their
organizations to
• enter a new area in which they had not been active (blue bars)
• expand in an area in which they had some expertise or capacity (red bars)
• gain knowledge or experience that will be useful in developing products or technologies
besides those funded by the grant (green bars).

153
Figure 5.16. Impact of ARFVTP on Grantee Knowledge and Capabilities
SOURCE: RAND survey. NOTE: For 16 awardees who completed the survey, excluding canceled or terminated projects.
5.6.3 Market Prospects for the Product or Technology Funded by the Award
One indicator for whether the product or technology funded by the award will have ongoing
impact on barriers to market viability is whether awardees continue to develop, market, install,
or produce the product or technology funded by the award after the project has been
completed. As shown in the last row of Table 5.10, awardees for six of eight completed projects
reported they had continued to do that. Both awardees who did not proceed had projects on
fuel RD&D. While sample sizes are small, these findings point out the mixed success for
projects attempting to produce diesel substitutes from novel feedstocks.
13%
0%
6%
38% 38%
6% 6%
0% 0%
19%
69%
6%
0%
6%
0%
50%
38%
6%
0%
10%
20%
30%
40%
50%
60%
70%
80%
Strongly disagree Somewhat disagree Neither agree or disagree
Somewhat agree Strongly agree Did not Answer

154
Table 5.10. Awardee Efforts to Continue to Develop, Market, Install, or Produce Product or Technology After Completion of the Project
Project Type
Number of Completed
Projects
Continued to Develop, Market, Install, or Produce the Product or
Technology Funded by the Award? Yes No
Fuel RD&D 5 3 2 Fuel production 1 1 0 Fueling infrastructure 2 2 0 Total 8 6 2
SOURCE: RAND survey. NOTE: For eight completed projects whose awardees completed the survey.
Awardees who continued to develop, market, install, or produce the product or technology
funded by the award did so in a number of ways. The most common ways involved efforts to
reduce costs, identify potential customers, or improve performance of the product or
production process (Figure 5.17).
Figure 5.17. How Awardees Who Continued to Develop, Market, Install, or Produce the Product or Technology Funded by Award Proceeded
SOURCE: RAND survey. NOTE: For six completed projects for which the awardee indicated that the organization had continued to develop, market, install, or produce the product or technology funded by the award.
5.7 Impacts on Barriers
This section examines the impact of the ARFVTP so far on barriers to the market viability of
diesel substitutes. The program’s biggest impact has arguably been on production capacity,
which we discuss first. We then turn to the impact on production costs, the ability to process
low-cost, low-CI feedstocks, and fueling infrastructure. As previously noted, these assessments
are subject to three limitations discussed in Chapter 1. First, clearly attributing market changes
to the ARFVTP is challenging because it is impossible to unequivocally determine what would
0%
0%
17%
33%
33%
50%
83%
83%
83%
0% 10% 20% 30% 40% 50% 60% 70% 80% 90%
Other
Purchased more similar vehicles or fueling infra.
Licensed the technology
Sold product or technology to customers
Implemented tech. at a demonstra5on scale
Scaled up manufacturing of the product
Improved product performance
Iden5ed poten5al customers
Worked on ways to reduce cost

155
have happened in the market without the ARFVTP. Second, given the wide range in types of
barriers and what is involved in addressing them, we focus only on whether a barrier has been
reduced and do not attempt to assess the amount by which it has been reduced. Finally, while
RD&D projects are often necessary to lay the groundwork for subsequent commercialization, it
is difficult to demonstrate the impact of such work.
5.7.1 Impact on Fuel-Production Capacity
5.7.1.1 Impact on Biodiesel Production Capacity
Table 5.11 presents data on production capacity in California by facility and by the amount of
the capacity that has been financed in part by the ARFVTP. Recall from Figure 5.2 that biodiesel
production capacity was an estimated 84 mgy in 2010 and that it increased to 134 mgy by
2015. Table 5.11 shows that 24.6 mgy of the 134 mgy (18 percent) was cofunded by the
ARFVTP. What is more, the bottom section of Table 5.11 shows that an additional 50 mgy is
under development, of which approximately 60 percent (29.7 of 50 mgy) is financed in part by
the ARFVTP. Overall, the ARFVTP has financed nearly 30 percent of the 184 mgy of biodiesel
capacity added or under development in California. It is likely that many of these projects
would not have proceeded without the ARFVTP, as noted in the discussion of Table 5.9.
Table 5.11. Biodiesel Production Facilities in Place and Under Development as of 2016
Company Name
Year Facility Opened Location
Nameplate Capacity (mgy)a
Capacity Funded
by ARFVTPb
Production Volume in
2015c
Status of ARFVTP Project
In Place Imperial Western Products 2001 Coachella 12 0 10 — Biodico Sustainable Biorefineries 2003 Ventura 10 0 0 Completed Extreme Biodiesel 2003 Corona 2 0 n.a. — Bay Biodiesel 2005 San Jose 5 0 n.a. —
Community Fuels 2008 Stockton 25 10.9 5 Completed
and ongoing
New Leaf Biofuel 2008 San Diego 6 2.1 n.a. Ongoing Crimson Renewable Energy 2009 Bakersfield 22 11.6 16.1 Ongoing Simple Fuels Biodiesel 2010 Chilcoot 2 0 0.4 — Agron Bioenergy 2013 Watsonville 15 0 n.a. — Biodico Sustainable Biorefineries 2015 Five Points 20 0 0 — Otherd various various 15 n.a. — Total in place 134 24.6
Under Development Eslinger Biodiesel Planned Fresno 5 4.7 0 Ongoing Menlo Biorefinery Planned Richmond 20 0 0 — Viridis Fuels Planned Oakland 20 20 0 Ongoing Buster Biofuels Planned Escondido 5 5 0 Ongoing Total under development 50 29.7 Total in place and under development 184 54.3
a Biodiesel Magazine, “U.S. Biodiesel Plants,” 2016. b Author review of project documents. c See references in text accompanying table. d Calculated as difference between 134-mgy total capacity from Figure 5.2 and 119-mgy capacity of the plants in place that are listed in the table.

156
The 184 mgy in biodiesel production capacity that is in place or under development is just
under the 190-mgy upper bound on biodiesel consumption projected by the CARB in Figure 5.1.
Recall that CARB’s upper bound reflects ADF rules that effectively limit biodiesel blends to B5.
Thus, there seems little need for additional biodiesel production capacity in California.
Although there may be adequate production capacity in California, it does not necessary follow
that production of biodiesel in California has approached or will approach capacity. Production
data is hard to come by, but it appears that several facilities are not fully utilizing the capacity
funded by the ARFVTP. As shown in Table 5.11, Community Fuels, which opened in 2008, lists
its nameplate capacity at 25 mgy; however, the facility’s actual production in 2015 was about 5
mgy.112 On the more productive side of the spectrum, Crimson Renewable Energy’s facility in
Bakersfield has a nameplate capacity of 22 mgy and produced 16.1 mgy in 2015, or 73 percent
of capacity.113 Biodiesel facilities that did not receive ARFVTP funding are also running below
capacity. Simple Fuels Biodiesel, which opened in 2010, lists its nameplate capacity at 2 mgy;
however, its actual production has been about 400,000 gallons per year.114 Biodico’s two
facilities list a combined nameplate capacity of 30 mgy but have yet to produce any biodiesel.115
Estimates of the overall utilization of the biodiesel production capacity in California vary
considerably. According to the California Biodiesel Alliance, actual production was 32 mgy in
2015, which is approximately 25 percent of the reported nameplate capacity.116 Then again,
Biodiesel Magazine reports that 44.6 million gallons of biodiesel were imported into California
in 2015, up from 32 million gallons in 2014.117 Subtracting imports from the 126 million gallons
of biodiesel consumed in 2015 means that in-state production was 81.4 million gallons, or
approximately 60 percent of the 134 mgy production capacity reported by Biodiesel Magazine.
This estimate needs to be further refined to reflect biodiesel exports from California and the
drawdown of existing stockpiles. Exports would increase the estimated capacity utilization, but
the drawdown of existing stockpiles would decrease it. Further analysis is warranted to
determine which estimate of capacity utilization is more accurate. In any case, it appears there
is substantial underutilization of biodiesel production capacity in California—at least some of
which was funded by the ARFVTP.
5.7.1.2 Impact on California Renewable Production Capacity
There was no renewable diesel production capacity when the ARFVTP started, and the ARFVTP
has financed a substantial proportion of the renewable diesel production capacity built since or
under development. As shown in Table 5.12, CEC financed 17.5 of the 63-mgy capacity in place
or under development (28 percent). In addition, the CEC funding may have enabled the awardee
112Email exchange between Stillwater and Lisa Mortenson, Community Fuels, February 16, 2016. 113Phone conversation between Stillwater and Crimson Renewable Energy employee, August 15, 2016. 114Phone conversation between Stillwater and Simple Fuels Biodiesel employee, February 16, 2016. 115Phone conversation between Stillwater and Biodico Sustainable Biorefineries employee, August 15, 2016. Biodico did receive ARFVTP funds for an RD&D project, but not to build refinery capacity. 116California Biodiesel Alliance, website, undated. 117These imports arrived from Canada, South Korea, and Argentina. See Ron Kotrba, “Importing to Meet California Demand,” Biodiesel Magazine, March 25, 2016.

157
to secure some of the match funding used to construct part of the capacity not funded by the
ARFVTP.
Table 5.12. Renewable Diesel Production Facilities, in Place and Planned as of 2016
Company Name Year
Opened Location
Nameplate Capacity
(mgy)
Capacity Funded by ARFVTP
Production Volume in
2015
Status of ARFVTP Project
In Place Kern Oil & Refining 2011 Bakersfield 15 — n/a — AltAir Fuels 2014 Paramount 38 10 n/a Ongoing Total In place 53 10
Under Development UrbanX Renewable Group Planned Long Beach 10 7.5 0 Ongoing Total in place and under development 63 17.5
SOURCE: Authors’ research. The 63 mgy of renewable diesel capacity that is in place or under development remains far
short of the 600 mgy of renewable diesel consumption in the CARB scenario for 2025 (Figure
5.1).
According to Biodiesel Magazine, 126 million gallons of renewable diesel were imported into
California in 2015, up from 107 million gallons imported in 2014.118 Subtracting from the 165
million gallons consumed in 2015 implies that 39 million gallons of renewable diesel were
produced in California, which amounts to 74 percent of the capacity in place.119 Thus, the use
rate of renewable diesel capacity appears substantial.
Another source of information on the impact of the ARFVTP on market barriers is the survey
responses by diesel-substitute awardees. Figure 5.18 reproduces the current barriers reported
by survey respondents in Figure 5.8 as the solid bars, and the red-hatched bars show the
percentage of awardees who indicated their project has reduced or will reduce the specified
barrier. As can been seen, a substantial percentage of respondents believed their project had
reduced the production capacity barrier. (The response category in the survey did not
distinguish between biodiesel and renewable diesel.)
118The entire volume of imported renewable diesel came from the Nestle renewable diesel production facility in Singapore. See Kotrba, “Importing to Meet California Demand,” 2016. 119Exports of renewable diesel from California and the drawdown of existing stockpiles need to be factored in to produce a more accurate estimate.

158
Figure 5.18. Current Barriers in Diesel Substitutes and Percentage of Awardees Who Said Their Projects Have Reduced or Will Reduce Those Barriers
SOURCE: RAND survey. NOTE: Current barriers based on 41 survey respondents who selected at least one current barrier; reduced barriers based on 15 awardees who completed the survey and indicated that their project reduced at least one barrier.
5.7.1.3 Observations of Impact of ARFVTP on Production Capacity
The ARFVTP has facilitated the construction of a substantial amount of biodiesel production
capacity in the state. Capacity in place or under development now approaches the maximum
biodiesel consumption levels projected by CARB in its analysis of LCFS compliance. This
maximum limits biodiesel consumption to 5 percent of overall diesel consumption because of
air quality concerns. However, the capacity appears underutilized, raising the possibility that
California will not fully benefit from its investment in biodiesel production capacity. Concerns
about the underutilization of biodiesel capacity arose during the interviews we conducted.
Some existing biodiesel producers called for a hiatus on funding of additional biodiesel
capacity. Some also supported a subsidy for in-state production, citing regulatory requirements
34%
17%
46%
7%
17%
24%
37%
46%
54%
59%
59%
5%
10%
12%
15%
15%
17%
24%
13%
13%
27%
27%
47%
7%
7%
60%
27%
33%
67%
0%
0%
0%
0%
7%
0%
0%
0% 10% 20% 30% 40% 50% 60% 70%
Other
Insufficient labor pool
Insufficient custsomer awareness
Insufficient in-‐use fuel performance
Poor emission profile of fuel
Difficulty in obtaining permits
Insufficient retail fueling infrastructure
Limited fuel produc5on capacity
Insufficient bulk fueling infrastructure
Limited feedstocks
High fuel produc5on cost
High vehicle O&M
High vehicle cost
Inadequate vehicle performance
Lack of fueling/charging standards
Poor vehicle emission profile
Limited vehicle produc5on capacity
Limited vehicle models
159
and labor market conditions that increase in-state production costs and subsidies provided by
other states or countries.
The concern about low-capacity utilization was also apparent in the survey results.
Respondents were asked how CEC should prioritize ARFVTP investments over the next five
years. One of the most common responses from the diesel-substitute respondents was that the
CEC should establish production subsidies for in-state production (21 percent of the 29
responding) (data not shown). Such operating subsidies may make sense if an important policy
goal is production (and production jobs) in California. However, it will come at a cost to
taxpayers.
The ARFVTP has also facilitated the construction of a substantial amount of renewable diesel
capacity in California. The amount of renewable diesel capacity is still far below levels
necessary to meet the LCFS, but capacity utilization is substantial. Consideration of funding for
additional production capacity should closely follow trends in the utilization of existing
capacity.
5.7.2 Impact on Production Cost
The ARFVTP has funded multiple projects that could reduce production costs. These include
projects that increase production scale and fund the installation of the latest production
technology, as well as numerous RD&D efforts on the cost and feasibility of producing diesel
substitutes from various waste streams.
It is difficult, however, to find evidence that these projects have reduced production costs. The
incremental cost of producing diesel substitutes came down in 2012 (Figure 5.4), but that was
before all but a few ARFVTP projects were complete. There has been little trend in incremental
production costs since, and even if there had been, it would be difficult to attribute it to the
ARFVTP. As shown in Figure 5.18, two-thirds of awardees participating in the survey who
indicated that their projects have reduced or will reduce one or more barriers indicated that
their projects have reduced or laid the groundwork for future reductions in production costs
(for completed projects) or will reduce or lay the groundwork for future reductions in fuel-
production cost (for ongoing projects). However, we have not been able to confirm or quantify
any such reductions.
5.7.3 Impact on Ability to Generate and Process Low-Cost, Low-CI Feedstocks
The ARFVTP funded seven fuel RD&D projects (Table 5.5). It does seem clear that many of these
projects would not have proceeded without ARFVTP—two-thirds of unsuccessful applicants
have not proceeded with their RD&D projects, and only 33 percent of RD&D awardees said they
would have proceeded without the grant (Tables 5.8 and 5.9, respectively). These projects met
their technical objectives. However, it was more common for awardees not to continue to
pursue the technology or process after completing these projects than it was for other types of
projects (Table 5.10).

160
Although these projects have generated knowledge and, in some cases, experience with
biodiesel production, there is little indication the projects have made progress toward
commercial viability:
• Two projects demonstrated the use of the FT process to generate renewable diesel—one
from dairy waste and a second from municipal solid waste. Both projects showed the
technology was feasible, but the commercial potential for both processes remains to be
proved.
• Two projects demonstrated triglyceride oils can be produced from algae—one using
municipal wastewater for nutrients, and a second using beet sugar and a type of algae
that grows in the dark (heterotrophic algae). Both projects demonstrated the feasibility
of the technology, but again the prospects for commercialization are unclear. The
lifecycle CI of the biodiesel produced by the heterotrophic algae project was
substantially higher than expected, and prospects for commercialization are not
promising. It is not clear what the long-term prospects for commercialization are for
algae grown using municipal wastewater.
• One project demonstrated how FOG collected at municipal wastewater plants could be
processed into biodiesel. The project was done at a lab scale and progress was made in
identifying a potentially low-cost process. However, the study concluded that the
technology was not sufficiently reliable yet and that it could not yet be determined
whether the process was cost-effective.
• One project demonstrated a small-scale, automated biodiesel production process that
uses traditional feedstocks (e.g., used cooking oil) and that can produce 1,000 gallons
per day. The cost of the facility was expensive per gallon of capacity (approximately $2
per gallon capacity, compared with industry targets of $1 per gallon capacity), and there
is not any indication yet that the process is commercially viable.
• A final project designed an integrated process that produced biodiesel using oil
harvested from brine shrimp that feed on algae. The process was done at a lab scale,
and the commercial potential for the process is far from clear.
One should not necessarily expect all RD&D efforts to pay off, and it is highly likely that some
of these projects are dead ends. But some may lay the groundwork for further advances that
lead to commercial applications. As yet, however, there is no indication that projects have taken
significant steps toward commercial viability.
5.7.4 Impact on Bulk and Retail Fueling Infrastructure
The ARFVTP has funded a number of projects to build or expand bulk fueling infrastructure for
biodiesel, and Tables 5.8 and 5.9 suggest that many of these would not have proceeded without
the award. As shown in Figure 5.18, survey respondents reported that their projects had
addressed insufficient bulk fueling infrastructure, although the percentage of respondents
indicating this was less than it was for other barriers.
161
Despite these projects, insufficient bulk fueling infrastructure remains one of the most
commonly cited barriers by diesel-substitutes survey respondents (solid bars in Figure 5.18). It
was also the most common priority for ARFVTP investment over the next five years, desired by
survey respondents (24 percent of 29 respondents). Presumably, these comments apply
primarily to biodiesel because renewable diesel is a drop-in fuel. If biodiesel consumption
remains limited at B5 by CARB regulation, there may not be much need for additional biodiesel
bulk blending facilities.
The ARFVTP did not fund projects to expand retail outlets for biodiesel or renewable diesel.
Survey respondents considered insufficient retail fueling infrastructure of medium importance
(Figure 5.18), although the responses do not distinguish between biodiesel and renewable
diesel. Expanded retail outlets are not necessary if biodiesel and renewable diesel blends are
kept to B5 and R5, respectively (no labeling is required). Higher biodiesel blends are not likely
because of CARB regulations. Higher renewable diesel blends would require labeling, but at this
point, CARB envisions that these higher blends would be used by fleets that do not need to fuel
at retail outlets. The expansion of retail outlets for renewable diesel or biodiesel was not
identified as a priority for ARFVTP investment by survey respondents over the next five years.
5.8 State of the Industry
The survey asked respondents to comment on the state of the industry and the changes in the
industry over the past five years, in terms of both competition and private-sector investment. In
general, awardees tended to indicate that there are many competitors and a growing number of
them in this market. However, they were more definite that private financing is limited and,
thus, that government grant programs that fund demonstration and deployment are needed.
In particular, as shown in Figure 5.19, 50 percent of respondents somewhat or strongly agreed
that there are many competitors in developing and deploying diesel substitutes versus 18
percent who somewhat or strongly disagreed. However, as shown in Figure 5.20, only 13
percent somewhat or strongly agreed that there are many private-sector investors, while 61
percent somewhat or strongly disagreed with this statement. Most respondents also did not see
an increase in private investment over the previous five years.

162
Figure 5.19. State of Diesel-Substitutes Industry and Changes in Industry over the Past Five Years, in Terms of Competition
SOURCE: RAND survey. NOTE: For 46 survey respondents.
Figure 5.20. State of Diesel-Substitutes Industry and Changes in Industry over the Past Five Years, in Terms of Private-Sector Investment
SOURCE: RAND survey. NOTE: For 46 survey respondents.
11% 7%
24% 26%
24%
9%
2%
15%
26% 26% 22%
9%
0%
5%
10%
15%
20%
25%
30%
35%
40%
45%
Strongly disagree Somewhat disagree
Neither agree or disagree
Somewhat agree Strongly agree Did not answer
Currently there are many organiza5ons compe5ng with your organiza5on in the development/deployment of alterna5ve fuels or vehicles Compared to five years ago, the number of organiza5ons compe5ng with your organiza5on has increased
28% 33%
11% 15%
4% 9%
39%
20% 22%
7% 4%
9%
0%
5%
10%
15%
20%
25%
30%
35%
40%
45%
Strongly disagree Somewhat disagree
Neither agree or disagree
Somewhat agree Strongly agree Did not answer
Currently there are many private-‐sector investors (i.e. non-‐governmental funders such as angel investors, venture capital, strategic investors, and banks) interested in your industry
Compared with five years ago, the amount of private investment has increased

163
Consistent with this, all but one of the 43 diesel-substitutes survey respondents felt that some
type of government support was required. As shown in Figure 5.21, there was broad support for
a wide range of regulations and financial programs. Respondents checking the “other” category
were asked to specify the type of government activity needed. Relevant responses included
funding the California Biofuels Initiative120 and setting sulfur standards for biodiesel produced
from wastes.
Figure 5.21. Government Activities That Diesel-Substitutes Survey Respondents Felt Were Required
SOURCE: RAND survey. NOTE: For 43 survey respondents who answered question.
5.9 Views of Diesel-Substitutes Stakeholders on ARFVTP Investment Priorities
We asked the 46 awardees, unsuccessful applicants, and potential applicants for diesel-
substitutes awards open-ended questions about how the ARFVTP has invested its funds.
Respondents were first asked to comment on the allocation of awards by fuel type and market
segment. As might be expected, the most common responses were that more should have been
invested in biodiesel and renewable diesel fuel types (Figure 5.22). Interestingly, however, the
most common response after that was that the ARFVTP should have spent more on fueling
infrastructure.
120For information on the Biofuels Initiative, see California Biodiesel Alliance, “California Cap and Trade Biofuels Initiative,” undated.
2%
21%
33%
49%
63%
65%
70%
77%
84%
0% 10% 20% 30% 40% 50% 60% 70% 80% 90%
None
Other
Consumer tax breaks or purchase subsidies
Consumer awareness programs
Carbon tax or tax on petroleum-‐based fuels
Grants for RD&D
Producer tax breaks or subsidies
Grants for demonstra5on and deployment
Quan5ty requirements for vehicles or fuels

164
Figure 5.22. Diesel-Substitutes Respondents on How CEC Should Have Allocated Its Funds Differently
SOURCE: RAND survey. For 30 survey respondents who answered question. In terms of the split of the investment portfolio to date between RD&D and PD&D, the most
common response (not shown here) was that the division was reasonable (45 percent of the 13
respondents who answered the question)—with a few respondents believing that the program
should have spent more on RD&D and a few believing it should have spent less.
We finally asked diesel-substitutes stakeholders how the ARFVTP should prioritize investments
over the next five years (not shown here). Fueling infrastructure was the most common
response (24 percent of the 29 respondents who answered the question), followed by incentives
for in-state production (21 percent). Several respondents said the program should prioritize
investments that provide quantifiable benefits for reducing carbon emissions or petroleum fuel
use.
5.10 Conclusions
The ARFVTP has addressed several key barriers to the market viability of diesel substitutes.
And while the projects have, with few exceptions, met their technical objectives so far, they
have run behind schedule. More than one-half of the projects completed to date were
completed behind schedule, and two-thirds of the ongoing projects are currently behind
schedule; the delays can exceed two years. There are multiple reasons for the delays, but delay
in obtaining required permits is the most commonly cited.
The ARFVTP has played a key role in expanding biodiesel production capacity in the state.
However, that capacity is currently being underutilized, which raises the troubling possibility
that California will not fully benefit from its investment in biodiesel production capacity. Some
biodiesel producers point to subsidies provided by other states or other countries as the reason
10%
13%
17%
20%
30%
37%
0% 5% 10% 15% 20% 25% 30% 35% 40%
More on biomethane
Less on methane (not including biomethane)
Less on electricity
More on fueling infrastructure
More on renewable diesel
More on biodiesel

165
they are not able to operate at greater capacity. In their view, these subsidies provide out-of-
state producers with an unfair cost advantage and put in-state producers at a competitive
disadvantage. In-state producers have thus increasingly called for the ARFVTP to provide
operating subsidies for in-state production.
The ARFVTP should consider providing these subsidies rather than continuing to invest in
production capacity. As shown in this chapter, biodiesel production capacity in the state is
already at 5 percent of projected diesel consumption (the limit effectively imposed by CARB’s
ADF rule). However, even if that were not the case, or even if some of the existing production
capacity is outdated, it may not make sense to fund biodiesel or renewable diesel production
capacity. A more direct method of generating in-state production would be to provide a subsidy
per gallon of diesel substitutes produced and consumed in the state. The existence of such a
subsidy could allow in-state producers to obtain the financing to construct production capacity
on their own. It would also relieve CEC of the responsibility of picking which firms should
receive state funding to build production capacity—the firms that succeed in producing the fuel
would receive the subsidy, while those that do not produce the fuel would not.
Such an operating subsidy would obviously put a burden on taxpayers. Absent such a subsidy,
the majority of diesel substitutes might be imported into the state; although importing diesel
substitutes is a reasonable strategy for lowering carbon emissions and complying with the
LCFS, providing operating subsidies becomes attractive when creating in-state jobs is a priority.
How much weight to put on that objective is a policy decision.
The ARFVTP has also made progress in reducing bulk fueling infrastructure barriers. Although
progress has been made, it appears more work needs to be done in this area. Survey
respondents identified insufficient bulk fueling infrastructure as one of the top barriers in
September 2016, and increased priority on bulking fueling infrastructure was one of the most
common suggestions for the ARFVTP investment portfolio over the next five years.
The ARFVTP has not invested in retail outlets for either biodiesel or renewable diesel. There
may be little need to do so. If biodiesel blends stay at or below B5, there is no need to label the
pumps and no need for separate biodiesel retail outlets. Renewable diesel will need to exceed 5
percent of diesel consumption to meet the LCFS. This may be achievable by having fleets fueled
at private pumps. But if not, retail infrastructure will have to be built to label and sell blends
above R5. The ARFVTP should keep an eye on how the renewable diesel roll-out unfolds.
Finally, the ARFVTP has allocated a relatively modest share of its diesel-substitute investment
portfolio (18 percent) to RD&D. These projects have investigated new feedstock sources and the
cost and feasibility of producing diesel substitutes from novel waste streams. Our analysis
suggests that many of these projects would not have proceeded without ARFVTP funding. We
also found the awardee did not consider the results promising enough for some of these
projects to justify further investment in the technology, at least presently. It is very difficult to
quantify the benefits of such RD&D projects. However, that should not prevent the ARFVTP
from funding them. It would be a mistake to prioritize only those types of projects that have
easily quantifiable benefits (such as the amount of production capacity installed). Projects with

166
longer-term uncertain outcomes presumably have the most difficulty in finding private-sector
financing and are thus appropriate for a public-sector portfolio.

167
CHAPTER 6: Impact of Program on Barriers to Market Viability of Gasoline Substitutes
In this chapter, we analyze the impact of the Alternative and Renewable Fuel and Vehicle
Technology Program (ARFVTP) on the barriers to the market viability of gasoline substitutes.
This fuel category encompasses ethanol from sugarcane and from other non–corn grain food
crops, cellulosic ethanol, and other gasoline substitutes, such as biobutanol and biogasoline.
While corn grain ethanol does count as a renewable biofuel under the Renewable Fuel Standard
(RFS), its environmental benefits are modest, and it is ineligible for funding under the
ARFVTP.121
We begin with a discussion of the data sources underlying the analysis and follow that with a
technical overview of gasoline substitutes as a transportation fuel and a discussion of the
barriers identified to its use. We then review the CEC’s solicitations and awards in gasoline
substitutes and discuss awardee performance. We next discuss the results of our impact
analysis of the ARFVTP on the awardees and on the barriers to market viability in the industry.
We then turn to a discussion of gasoline-substitutes stakeholder views about ARFVTP
investment priorities and end with our conclusions.
6.1 Summary of Data Sources
The data in the following sections are drawn from a number of sources, including
administrative data from CEC, project documentation (proposal, statement of work, critical
project review, presentations [if present], and, for completed projects, the final project report)
literature, our in-depth reviews of selected ARFVTP-funded projects, and our survey. The survey
sample, responses, and response rate for gasoline substitutes are summarized in Table 6.1.
Table 6.1. Survey Sample and Respondents for Gasoline Substitutes
Category
Number in Survey Sample Respondents
Response Rate
(Percentage) Awardees 18 12 67
Project complete 5 4 80 Project ongoing 10 6 60 Project not yet started 0 0 — Project canceled/terminated 3 2 67
Unsuccessful applicants 20 9 45 Potential applicants n/a 1 — Total 38 22 55
SOURCE: RAND survey.
121Assembly Bill No. 523, Ethanol: Alternative and Renewable Fuel and Vehicle Technology Program, August 27, 2012.
168
6.2 Technical Overview of Gasoline Substitutes as a Transportation Fuel
Compared with other alternative transportation fuels in the ARFVTP, ethanol has a relatively
long history as a transportation fuel. The 1990 Clean Air Act amendments mandated the
introduction of oxygenating agents in gasoline to help it burn more completely in combustion,
reducing tailpipe emissions and improving air quality. An early oxygenating compound, methyl
tert-butyl ether, was found to be contaminating drinking water and was soon replaced with
ethanol. Use of ethanol in gasoline was further supported by the RFS. Today, nearly all the
gasoline sold in the United States contains ethanol.122 In 2015, about 13.7 billion gallons of
ethanol were added to gasoline,123 constituting just less than 10 percent of the 141 billion
gallons of finished motor gasoline consumed.124
All gasoline engines can run with a blend of up to 10 percent ethanol (known as E10), and more
than 95 percent of the fuel consumed in motor vehicles with gasoline engines in the United
States is E10. As of 2011, the Environmental Protection Agency (EPA) approved the use of E15 in
model-year 2001 and newer gasoline vehicles. Blends of nominally 85 percent ethanol, or E85
(which actually contains 51 percent to 83 percent ethanol, depending on geography and
season),125 can be used in specially designed flex-fuel vehicles. Despite their nominal availability,
E15 and E85 amount to less than 2 percent of total ethanol consumption in transportation fuel
because of a variety of regulatory, economic, and distribution system challenges.126 For example,
despite EPA approval at the federal level, many states (including California) have yet to approve
the use of E15. Reasons for the low use of E85 are discussed in the following barriers sections.
While the amount of ethanol consumed as a transportation fuel in the United States is quite
high, the vast majority (more than 95 percent) of this is conventional ethanol made from corn
grain. The life-cycle greenhouse gas (GHG) reductions for corn grain ethanol compared with
gasoline is in the range of 0 to 20 percent.127 Hence, while conventional ethanol is beneficial as
an oxygenating agent in improving air quality, it offers little benefit in terms of reducing GHG
emissions. Meeting GHG-emission reduction goals requires investing in so-called advanced
ethanol and cellulosic ethanol. As defined in RFS, advanced ethanol is ethanol derived from
renewable biomass other than corn grain that achieves a 50-percent reduction in GHG
122U.S. Energy Information Administration, “Today in Energy: Almost All U.S. Gasoline Is Blended with 10% Ethanol,” May 4, 2016. 123U.S. Energy Information Administration, “Frequently Asked Questions, How Much Ethanol Is in Gasoline, and How Does It Affect Fuel Economy?” March 29, 2017. 124U.S. Energy Information Administration, “Frequently Asked Questions, How Much Ethanol Is in Gasoline, and How Does It Affect Fuel Economy?” 2017; U.S. Energy Information Administration, “Petroleum and Other Liquids,” April 28, 2017. 125U.S. Department of Energy (DoE), Energy Efficiency and Renewable Energy, “www.fueleconomy.gov: Ethanol,” undated. 126U.S. Energy Information Administration, “Today in Energy: Almost All U.S. Gasoline Is Blended with 10% Ethanol,” 2016. 127 Air Resources Board (ARB), “Data Dashboard,” 2017; National Research Council: Committee on Transitions to Alternative Vehicles and Fuels, Transitions to Alternative Vehicles and Fuels, 2013.

169
emissions relative to the petroleum baseline.128 Advanced ethanol can be made from sugar-
based feedstocks, such as sugarcane, sugar beets, sweet sorghum, and other noncellulosic
biomass. Cellulosic ethanol is ethanol produced from cellulose, hemicellulose, or lignin (e.g.,
grasses, leaves, stalks, and wood) that achieves a 60 percent reduction in GHG emissions
relative to the petroleum baseline.129
Advanced ethanol, cellulosic ethanol, and other gasoline substitutes vary in terms of
environmental benefits, scalability, and commercial readiness. Sugarcane is an inexpensive
feedstock, and sugarcane ethanol production is a mature technology. Brazil produced more
than 7 billion gallons of sugarcane ethanol in 2015.130 Methods and experience for growing and
converting other advanced ethanol feedstocks are far less advanced but are beginning to
expand.
Although cellulosic ethanol is promising in small-scale demonstrations, it is proving difficult to
expand to commercial scale. A significant advantage of cellulosic ethanol is that the feedstocks
are more abundant than agricultural ethanol feedstocks. They require less energy to grow,
collect, and convert to ethanol, thus reducing GHG emissions. In the case of dedicated energy
crops such as switch grass or poplar, they can be grown on marginal lands not suitable for
other food crops. The main disadvantage thus far is that the technology for converting
cellulosic biomass to ethanol has proven difficult to scale to commercial production levels.
Other gasoline substitutes such as biobutanol and biogasoline are also promising, although
they are still in the early stages of research and development (R&D). Biobutanol is a four-carbon
alcohol fuel that can be produced through a fermentation process using bacteria from the same
feedstocks as ethanol or cellulosic ethanol, including corn, sugarcane, crop residues, and
dedicated energy crops. Biobutanol can also be produced from algae. Biobutanol can be used as
an oxygenate and blended with gasoline in concentrations up to 11.5 percent by volume.131
Biogasoline is a hydrocarbon fuel that can also be produced from the same feedstocks as
biobutanol. It is engineered to be chemically similar to petroleum gasoline and is a drop-in fuel,
meaning it can replace gasoline completely without any changes to the current fueling
infrastructure.
The ARFVTP addresses the expansion of the advanced ethanol, cellulosic ethanol, and other
gasoline-substitutes markets in California. As previously noted, projects involving ethanol
produced from corn grain are ineligible for the ARFVTP.
128 EPA, “What Is a Fuel Pathway?” 2016. 129 EPA, “What Is a Fuel Pathway?” 2016. 130 DoE, Energy Efficiency and Renewable Energy, “Alternative Fuels Data Center: Maps and Data—Global Ethanol Production,” March 2016. 131 DoE, Energy Efficiency and Renewable Energy, “Alternative Fuels Data Center: Biobutanol,” undated.

170
6.3 Barriers to the Use of Gasoline Substitutes as a Transportation Fuel
Our assessment of the barriers to developing and using gasoline substitutes is based on
reviewing the literature, in-depth reviews of selected ARFVTP-funded projects, and the survey.
Barriers for each fuel type can be grouped into five areas: feedstock, fuel production, fueling
infrastructure, and vehicles. Our assessment of the barriers developed from a review of the
literature and from in-depth project reviews is listed in Table 6.2. We discuss each barrier
market segment in more detail.
Table 6.2. Barriers Identified for Using Gasoline Substitutes as a Transportation Fuel
Market Segment Barrier Description
Feedstock • Low availability and/or high cost of feedstocks • Land use change undermines GHG emissions reductions
Fuel production
• Limited production capacity • Cost is greater than that of corn grain ethanol or gasoline on an energy-equivalent basis • Technical challenges with cellulosic conversion
Fueling infrastructure
• Lack of distribution network—cannot be transported in petroleum pipelines • Low availability of fueling stations
Vehicles • Range limitation for E85 relative to E10 • Wide range in E85 specifications impedes optimizing engines for particular fuel
SOURCE: Author analysis.
6.3.1 Feedstock Barriers
An important barrier to the production of advanced ethanol is that non–corn grain feedstocks
are not generally available for fuel production. Despite substantial sugarcane, sweet sorghum,
and sugar beet production in the United States, essentially all the harvest is used for sugar and
syrup production. Further, sugarcane is generally only grown in the extreme southern reaches
of the country (Hawaii and southern Florida, Louisiana, and Texas). While some growth trials
are being conducted in California, no production is planned.132 Sweet sorghum is similarly
generally limited to the southeastern United States, although it can be grown in other areas,
including California. Sugar beets are grown over much wider geographic range, including a
small amount in California.133 Sugar beet and sweet sorghum biofuel production in California is
therefore feasible, although production is extremely limited. There is also a concern that
continuous harvesting of sweet sorghum will result in diminishing biomass yields over the
years; thus, crop rotation is recommended. In some areas of the country, like the South, it is
possible to rotate sweet sorghum with sugar beets.
The availability and price of cellulosic feedstocks can be unpredictable. Cellulosic feedstocks
are susceptible to extreme weather and can rot or combust in storage. Many of these feedstocks
132 Harry Cline, “Sugarcane: California's Triple Threat?” Western Farm Press, June 20, 2001. 133 U.S. Department of Agriculture, Economic Research Service, “Sugar and Sweeteners,” April 28, 2017.

171
may also be diverted for other uses. For example, farmers use crop residue feedstocks such as
corn stover to improve soil, thus limiting the amount that can be removed from the field.
Most biofuel feedstocks, particularly food crops, require land dedicated to agricultural
production and hence generate GHG emissions through land-use change. Unmanaged land
stores substantial carbon in the biomass, and converting that land to agricultural production
generates a one-time GHG release that undermines the GHG emission benefit of biofuels. Land-
use change can be direct (conversion of unmanaged land to energy crop production) or indirect
(replacing food crops with energy crops, leading to the conversion of unmanaged land to food
cropland elsewhere in the world to replace the food crop supply lost in the change). The
magnitude of these effects is a topic of active debate.134
6.3.2 Fuel-Production Barriers
Production of Brazilian sugarcane has been long established at the commercial scale. But there
are currently no commercial-scale sugarcane ethanol facilities in the United States, mainly
because of the cost of feedstocks. In 2006, the U.S. Department of Agriculture estimated that
the cost of producing one gallon of ethanol from sugarcane is $2.40, which compares with
$1.03–$1.05 for milled corn.135 Even with ethanol produced from corn grain, the price of E85 is
generally higher than that of E10 on an energy-equivalent basis. Since ethanol contains about
one-third less energy than gasoline, a vehicle fueled with E85 will get around 15 percent to 27
percent fewer miles per gallon than when operating on E10.136 The price of E85 must therefore
be commensurately less than that of E10 to be competitive. Historically, the price of E85 has
been higher than that of E10 on an energy-equivalent basis, limiting the use of E85.137 Advanced
ethanol production from other feedstocks faces similar barriers: Costs are high and facilities
are still in the pilot phase because of a limited feedstock base.
Cellulosic ethanol’s greatest production barrier is technological. Small-scale pilot plants have
been able to produce cellulosic ethanol, but two problems exist with the current technologies
that need to be overcome before commercial-scale cellulosic ethanol production becomes
viable. First, researchers have yet to find an economical and effective way to separate the lignin
and hemicellulose from the feedstock. Second, researchers have been unable to develop
enzymes or organisms that efficiently chop the cellulose into smaller pieces of glucose for
fermentation.138 Because of these remaining technology challenges, cellulosic ethanol
134 Timothy Searchinger, Ralph Heimlich, R. A. Houghton, Fengxia Dong, Amani Elobeid, Jacinto Fabiosa, Simla Tokgoz, Dermot Hayes, and Tun-Hsiang Yu, “Use of U.S. Croplands for Biofuels Increases Greenhouse Gases Through Emissions from Land Use Change,” Science, Vol. 319, No. 1238–1240, February 2008; John A. Mathews and Hao Tan, “Biofuels and Indirect Land Use Change Effects: The Debate Continues,” Biofuels, Bioproducts, and Biorefining, Vol. 3, No. 3, May/June 2009, pp. 305–317. 135 Hossein Shapouri and Michael J. Salassi, The Economic Feasibility of Ethanol Production from Sugar in the United States, Washington, D.C.: U.S. Department of Agriculture, 2006. 136 DoE, Energy Efficiency and Renewable Energy, www.fueleconomy.gov: Ethanol, undated. 137 Renewable Fuels Association, “E85 Prices,” undated. 138Great Lakes Bioenergy Research Center, Why Is It So Difficult to Make Cellulosic Ethanol? 2010.

172
production in the United States is limited to about 85 million gallons per year, just 0.6 percent
of the 15.2 billion gallons per year of total ethanol produced.139
6.3.3 Fueling Infrastructure Barriers
Ethanol cannot be transported in existing petroleum pipelines because it is corrosive and
absorbs water and impurities in the pipelines, thus adversely affecting fuel quality. Instead, it
must be shipped by rail, truck, or barge to storage and blending centers—often over long
distances from the Midwest or Brazil to large markets on the East and West Coasts. Production
closer to markets (e.g., in California) would reduce the required transport distances, but it
would still require vehicle transport. Without more development of rail infrastructure suitable
for transporting ethanol, bottlenecks could occur.
A second distribution barrier is the limited number of E85 fueling stations in California. There
are about 20 million flex-fuel light-duty vehicles (LDVs) on the road in the United States, which
is around 8 percent of the total.140 If all flex-fuel vehicles used E85, they would use around 8
percent of the 141 billion gallons of fuel consumed by LDVs each year, or 11.3 billion gallons.
However, the EPA estimates that only about 0.2 billion gallons of E85 will be used in 2016.141
Thus, despite the relatively widespread adoption of flex-fuel vehicles, most use E10 rather than
E85. Part of the reason for this is the typically higher cost (on an energy-equivalent basis) of E85
compared with E10, as previously noted. However, cost aside, the use of E85 appears to be
limited in California by the low availability of E85 fueling stations. There were an estimated 1
million flex-fuel vehicles in California by 2016,142 but only 99 E85 fueling stations.143 For a state
the size of California, 99 stations seem far fewer than needed to support one million vehicles.
6.3.4 Vehicle Barriers
As previously noted, flex-fuel vehicles are in relatively common use, and vehicle availability
tends not to be a limiting factor in the use of gasoline substitutes. The price premium for a flex-
fuel vehicle relative to an equivalent non-flex-fuel vehicle is relatively modest at about $50–
$300.144 One challenge with flex-fuel vehicle acceptance is that such vehicles have poorer fuel
economy than conventionally fueled vehicles. Even if the cost of E85 were favorable, the lower
fuel economy of ethanol requires more frequent fill-ups, which is presumably a disincentive to
using flex-fuel vehicles.
139Official Nebraska Government Website, “Ethanol Production Capacity by Plant—Archive 2005–2017,” 2017. 140DoE, Energy Efficiency and Renewable Energy, Alternative Fuels Data Center, “Alternative Fuels Data Center: Flexible Fuel Vehicles,” undated; U.S. Energy Information Administration, “Annual Energy Outlook 2017, Table: Light-Duty Vehicle Stock by Technology Type, Case: Reference Case,” 2017-a. 141U.S. Energy Information Administration, “Today in Energy: Almost All U.S. Gasoline Is Blended with 10% Ethanol,” 2016. 142ARB, “Methodology Worksheet and Additional Supporting Information,” undated; Rob Elam, Will Faulkner, Chris LaPlante, and Parker Chase, E85: A California Success Story, A Propel Fuels White Paper, June 2015. 143 DoE, Energy Efficiency and Renewable Energy, Alternative Fuels Data Center, “Alternative Fuels Data Center: Ethanol Fueling Station Locations,” 2017. 144Biofuels Digest, “Ethanol Infrastructure or Drop-in Biofuels? Congress Debates,” biofuelsdigest.com, April 11, 2011.

173
While the difference in design between conventional and flex-fuel vehicles is relatively minor,
flex-fuel vehicles must be able to operate on a wide range of ethanol contents. A vehicle
designed to operate on a fuel with a fixed ethanol concentration could be optimized for that
fuel, and, thus, the fuel efficiency could be increased.
6.3.5 Barriers Identified in the Survey
Findings from our survey are generally consistent with the barriers discussed earlier in this
chapter. Barriers identified by 19 awardees, unsuccessful applicants, and potential applicants
are shown in Figure 6.1. Each bar shows the percentage of respondents that identified that
barrier. Because respondents could select multiple barriers, the percentages sum to greater than
100 percent.
These results show that the most commonly cited barriers are fuel related. Fueling
infrastructure, in particular, was a frequent concern. The most commonly cited barrier was
“difficulty, cost, and delay in obtaining permits for siting fueling/charging stations,” and
“insufficient retail fueling or charging infrastructure” was tied as the second most-commonly
cited barrier. In the context of ethanol, these barriers refer to E15 and E85 fueling stations. As
noted earlier in this chapter, existing E85 fuel is underused by flex-fuel vehicle operators, and
the citing of these barriers suggests that limited station availability may contribute to that
situation. While these were the most commonly cited barriers, they were cited by only about a
third of the respondents, indicating that there is no overwhelming consensus about particular
barriers. Survey respondents also prioritized limitations in fuel-production capacity and
availability of feedstocks, lack of standardization of fueling infrastructure, high fuel-production
cost, and insufficient consumer awareness as important barriers. Vehicle-related barriers were
less commonly cited.
Of the seven “other” responses, two provided explanations, including “artificial cap on blend
rates into gasoline” and “regulatory change—sorghum's carbon intensity [CI] changed from low
to somewhat high.” The first refers to the demand limit imposed by the 10-percent ethanol
blend wall for pre-2001 non-flex-fuel vehicles. The very low adoption rates of E15 and E85
suggest that this barrier is intimately linked with customer acceptance and the low availability
of E15 and E85 fueling stations. The second response is consistent with a general concern
raised in our site visits about uncertainty in the stability of policies that incentivize biofuel
production. Changing the CI of a fuel pathway affects the extent to which that pathway
contributes to meeting the state Low Carbon Fuel Standard (LCFS) and federal Renewable Fuel
Standard (RFS). More fundamentally, respondents noted that the uncertainty about whether
these regulatory policies will remain stable is a barrier to private investment in biofuels.

174
Figure 6.1. Barriers to Market Viability of Gasoline Substitutes Cited in Survey Responses
SOURCE: RAND survey. NOTES: Based on 57 barriers cited by 19 respondents. Label for first green bar should read, “Difficulty, cost, and delay in obtaining permits for siting fueling/charging stations.” Label for first gray bar should read, “Insufficient customer awareness of and knowledge about alternative fuels and vehicles.” Label for second gray bar should read, “Insufficient pool of labor familiar with alternative fuels and vehicles.”
6.4 Review of CEC’s Solicitations and Awards in Gasoline Substitutes
Table 6.3 provides a chronological summary of the ARFVTP funding solicitations and awards in
the areas of gasoline substitutes. Note that several of the solicitations cover more than just
gasoline substitutes. When available, the table breaks out the funding amount allocated for
gasoline substitutes. Only awards associated with gasoline substitutes are listed. Investment
focus transitioned gradually over time, initially emphasizing fueling infrastructure and
feedstock development, then shifting more toward fuel production in later years.
32%
5%
26%
5%
26%
26%
32%
11%
21%
32%
37%
5%
11%
16%
16%
0%
0%
0% 5% 10% 15% 20% 25% 30% 35% 40%
Other
Insufficient pool of labor familiar with alternaFve fuels and
Insufficient customer awareness of and knowledge about
Poor emission profile of fuel
High fuel producFon cost
Limited availability of feedstock for fuel producFon
Limited fuel producFon capacity
Insufficient bulk fuel distribuFon infrastructure
Lack of industry standards for fueling/charging interface
Insufficient retail fueling or charging infrastructure
Difficulty, cost, and delay in obtaining permits for siFng fueling/
Inadequate vehicle performance
Limited vehicle producFon capacity
Limited number of vehicle models available
High vehicle producFon cost
High vehicle lifeFme operaFng and maintenance cost
Poor emission profile of vehicle
% of respondents ciFng barrier
Vehicle-‐related Fueling infrastructure-‐related Feedstock and fuel producFon-‐related Other

175
Table 6.3. Chronological Summary of Gasoline Substitutes Solicitations and Awards
Year Solicitation
Number Solicitation Title Solicitation Amount ($) Awards ($)
Interagency Agreements
and Contractsc
Total Awards
2009
PON-08-010 American Recovery and Reinvestment Act of 2009 Cost Share
$12 M for ethanol
feedstocks and fueling
stations
1 ($4 M)
3 PON-09-004
Medium- and Heavy-Duty Advanced Vehicle Technology
$9.5 M 1 ($2.7 M)
PON-09-006 Alternative and Renewable Fuel Infrastructure
$13.8 M 1 ($1 M)
2010
PON-09-604 Biofuel Production Plants $14.9 M 3a ($5.4 M)
6 PON-09-607
California Ethanol Producer Incentive Program
$6 M 3 ($6 M)
2011 PON-10-603
Advanced Medium- and Heavy-Duty Vehicle Technologies Pre-Commercial Demonstrations
$16.9 M 0 1 ($1.9 M) 1
2012
PON-11-601 Biofuels Production Facilities
$12.5 M for gasoline
substitutes
4b ($15.1 M)
1 ($0.23 M) 7
PON-11-602
Alternative Fuels Infrastructure: Electric, Natural Gas, Propane, E85 & Diesel-Substitutes Terminals
$30.3 M 2 ($11.5 M)
2013 PON-13-601 Commercial Scale Advanced Biofuels Production Facilities
$9.3 M 0 1 ($5 M) 1
2014 PON-13-609
Pilot-Scale and Commercial-Scale Advanced Biofuels Production Facilities
$9 M for gasoline
substitutes
3 ($9 M) 3
Total 18 ($54.7 M)
3 ($7.1 M) 21
SOURCE: CEC administrative data. a One of these projects was withdrawn by the applicant. b Two of these projects were canceled before work got under way, and one was canceled by CEC for cause. c Interagency agreements and contracts are listed by year and are not associated with solicitations.
As of April 2015, 21 gasoline-substitutes projects have been funded by the ARFVTP for a total
of $62 million. Three of these were contracts. The projects are grouped according to market
segment in Figure 6.2. The majority of the funded gasoline-substitutes projects have been
related to fuel production and/or feedstock development, with fewer addressing fueling
infrastructure and only one addressing vehicles. Figure 6.2 also shows that the per-project
funding for fueling infrastructure projects tends to be somewhat higher than that for feedstock
and fuel-production projects.

176
Figure 6.2. Gasoline Substitutes Projects and Funding by Market Segment
SOURCE: CEC administrative data. NOTE: Based on 21 projects.
In terms of development stage, there are more research, development, and demonstration
(RD&D) projects than production, distribution, and deployment (PD&D) projects (Figure 6.3).
Most of the fuel-development projects and the vehicle-engine project are RD&D. The fueling
infrastructure and California Ethanol Producer Incentive Program (CEPIP) projects are PD&D.
Figure 6.3. Gasoline Substitutes Projects, by Technology Development Stage
SOURCE: CEC administrative data. NOTE: Based on 21 projects.
16 4
1
21 projects
Feedstocks and Fuel Produc5on Fueling Infrastructure Vehicles
$42.5 $16.5
$2.7
$62 M funding
Feedstocks and Fuel Produc5on Fueling Infrastructure Vehicles
38%
62%
0%
10%
20%
30%
40%
50%
60%
70%
Produc5on, distribu5on, or deployment
Research, development, or demonstra5on
Percentage of projects

177
6.4.1 Barriers Targeted by Gasoline Substitutes Projects
Table 6.4 provides a summary of the distribution of ARFVTP projects across the different
barrier categories discussed in Section 6.3. As previously noted, substantially more projects and
funding have been allocated to feedstocks and fuel production than to fueling infrastructure or
vehicles (16 versus five). Because of the wide range of different feedstocks and fuel-production
methods being explored, ARFVTP investments span a range of approaches, some of which may
prove technically or economically infeasible. In general, the gasoline-substitutes projects are
targeting most of the current barriers identified in Table 6.2.

178
Table 6.4. Barriers Targeted
Market Segment Primary Barrier
Targeted Types of Projects
Funded
Number of Projects Funded
Combined Amount of
Awards ($ M)
Feedstock and fuel production
Feedstock availability and cost; limited production capacity
Grain sorghum crop production and ethanol production
3 9
Sugar beet and sweet sorghum ethanol production
3a 8.5
Feedstock availability and cost
Synthetic biofuels through artificial photosynthesis
1 5
Bio-based gasoline blendstock from woody biomass
1b 4.7
Ethanol from microalgal biomass 1b 1.5
Woody biomass from forest residues for biofuels
2 2.1
Limited production capacity CEPIP 3 6 Technical challenges with cellulosic conversion
Cellulosic ethanol production 2c 5.8
Subtotal 16 $42.6 Fueling infrastructure
Low availability of fueling stations
Installation of E85 fueling stations 4 16.5
Vehicles
Wide range in E85 specifications impedes optimizing engines for particular fuel
Development of E85-optimized medium-duty truck engine
1 2.7
Total 21 $62 SOURCE: CEC administrative data. a One project was canceled by CEC for cause. b Project was withdrawn by applicant before project started. c One project was withdrawn by applicant before project started. NOTE: Combined amount of awards column does not sum because of rounding.
6.4.1.1 Projects Targeting Feedstock and Fuel-Production Barriers
The 16 feedstock and fuel-production and development projects shown in Table 6.4 address
new agricultural feedstocks and associated ethanol-production processes, other novel
feedstocks and technologies, and developing and demonstrating cellulosic ethanol-production
methods.
The projects focusing on agricultural feedstocks and production include crop trials, best
agricultural practices for sustainability, grower outreach and education, preprocessing
techniques, engineering and market-feasibility analyses, and pilot-scale production operations.
They are projected to produce several million gallons of ethanol over several years to
demonstrate the feasibility of future commercial production.
Four of these projects, totaling $11 million, focus on sorghum. Three of the projects are to each
of the three major ethanol refineries in California—Pacific Ethanol, Aemetis, and Calgren—
which have historically used Midwest corn as a feedstock, with the goal of facilitating the

179
transition to sorghum feedstock. These projects are all ongoing. The fourth is a completed
project to a small company specializing in developing sugar-based ethanol production.
The other two agricultural feedstock projects, totaling $6.5 million and to the same awardee,
focus on sugar beets. Sugar beets have historically been grown in California for sugar
production. As that market contracted, producers have begun exploring the use of sugar beets
to produce ethanol. These two projects were to support a cooperative of nine sugar beet
farmers in what is intended to be the nation’s first commercial-scale sugar beet ethanol
operation. The plant is targeted to produce 15 million gallons per year.145 However, in December
2015, the CEC announced it was terminating the second award (for $5 million) “due to multiple,
significant breaches of the agreement terms.”146
Three additional feedstock and fuel-production projects include a $5 million award to a
university for basic research to develop synthetic biofuels through artificial photosynthesis and
two projects that were canceled or withdrawn before any work was undertaken: a $4.7 million
award to develop a bio-based gasoline blendstock from woody biomass, and a $1.5 million
award to develop ethanol from microalgal biomass.
Four of the feedstock and fuel-production projects address cellulosic ethanol production. One
$3.9 million project was to develop a precommercial plant using corn stover with a CI of up to
90 percent less than gasoline. While this demonstration project was technically successful, the
costs are currently too high to attract investment for commercial production. A second
cellulosic ethanol project proposal for $1.9 million was funded but withdrawn by the recipient
before any work was undertaken. Two closely related projects totaling $2.1 million addressed
the suitability of forest-derived woody biomass as biofuel feedstocks. These projects focused
on feedstocks and were largely agnostic about fuels and production technologies (although
ethanol produced from woody biomass would necessarily be cellulosic). This project consisted
of a suite of diverse tasks, ranging from understanding forest-practice regulations, to fuel-
treatment management options, to carbon storage and GHG emissions, to ecological and habitat
impacts, to the economic feasibility of different harvesting and fuel-production technology
scenarios.
Finally, three of the feedstock and fuel-production projects supported the CEPIP. This program
was “designed to provide payments to operating California ethanol producers under specific
unfavorable economic conditions and requires reimbursement by participants to the state of
any outstanding CEPIP payment balances under specifically identified favorable economic
conditions.”147 The program also requires refiners to begin the transition to lower-carbon
feedstocks and more-efficient operations and process technologies. The program provided up
to $2 million to each of the three major California ethanol refiners. The rationale was to assist
145 Ben Keller, “Beet Ethanol Demonstration Project to Begin Next Month,” Business Journal, November 18, 2014. 146 Biofuels Digest, “California Energy Commission Cancels Deal with Mendota Bioenergy,” biofuelsdigest.com, December 10, 2015. 147 CEC, Alternative and Renewable Fuel and Vehicle Technology Program Solicitation Number PON-09-607, Subject Area: California Ethanol Producer Incentive Program, 2010.

180
major corn grain ethanol producers during challenging economic conditions to allow them to
make the transition to advanced biofuels. However, the program was canceled, and corn grain
ethanol was made ineligible for ARFVTP funding in response to protests from dairy producers,
livestock industry representatives, and environmental groups about the negative implications of
supporting corn grain ethanol production.148 Because the program requires the awardees to
reimburse the payments back to the state, the awards are akin to loans, and the net cost to the
state was minimal.
6.4.1.2 Projects Targeting Fueling Infrastructure Barriers
Compared with feedstocks and fuel-production projects, fueling-infrastructure projects are
fewer and larger, possibly reflecting less emphasis on the need for a diversity of approaches
and more emphasis on the benefits of economies of scale in deploying commercially available
technologies. There have been four ARFVTP projects to install new E85 fueling stations in
California. Three were essentially to a single company, Propel Fuels, the technology provider for
an award to the California Department of General Services and the direct recipient of two
additional awards. The fourth fueling-infrastructure project was an award to Pearson Fuels. The
four projects were originally intended to install a total of 114 E85 stations throughout the state.
6.4.1.3 Projects Targeting Vehicle Barriers
The modest investment in vehicle technologies is consistent with the fact that the challenges in
developing vehicles compatible with advanced ethanol fuel are relatively small. Only one
ethanol vehicle project has been undertaken in the ARFVTP—a project to a major national
engine manufacturer to design, build, and demonstrate a prototype medium-duty truck engine
that was purpose-built for running on E85 fuel. While light-duty flex-fuel vehicles are widely
available, there are no full-production medium-duty vehicles (MDVs) or heavy-duty vehicles
(HDVs) that can use E85. That project was successfully completed. Thus far, there is no market
for this technology.
6.5 Awardee Performance
6.5.1 Project Status
The status, as of September 2016, of the 21 projects funded through January 2015 is shown in
Figure 6.4. Ten projects are still ongoing, with seven projects completed and four projects that
have been withdrawn or canceled. Survey respondents declined to provide reasons why their
projects were withdrawn or canceled. However, we know from documentation and discussions
with CEC that three of these withdrawals or cancelations occurred before any work on the
project had begun. One awardee withdrew because of inability to raise the required match
funding. Another withdrew because changing market conditions between the time the project
was proposed and when it was approved to start made completing the project infeasible. None
148 Kris Bevill, “Corn Ethanol Policy Under Attack in California,” Ethanol Producer Magazine, April 26, 2011; Erin Voegele, “New Calif. Law Excludes Corn Ethanol from DRIVE Program Funding,” Ethanol Producer Magazine, September 6, 2012.

181
of the $8 million approved for these three projects was spent. The fourth canceled project was
terminated by CEC for breaches of the agreement terms. In this case, approximately $2.7
million of the $5 million award was spent.
Figure 6.4. Gasoline Substitutes Project Status as of September 16, 2016
SOURCE: RAND survey. NOTE: Based on 21 gasoline-substitutes projects.
6.5.2 Technical Performance
We present results both for the initial RAND assessment based on the review of project
documents and for the assessment as corrected by the survey respondents. Results for
completed ethanol projects are shown in Figure 6.5. Note that this includes only seven projects.
The primary difference between the RAND and survey respondent assessments is that the
RAND assessment has more “unknown” and fewer “fully” values. This difference results from
survey respondents correcting RAND's assessments from “unknown” to “fully.” The
documentation for some projects was incomplete, making it impossible for RAND to make an
assessment. The fact that respondents left some assessments as “unknown” suggests that some
respondents were unfamiliar with the details of the project or were unwilling to make the effort
to update RAND’s assessments.
The respondent results for the completed projects indicate that the vast majority of technical
objectives for which the extent achieved is known were fully achieved. This high success rate
suggests that the gasoline-substitutes projects completed so far have been, in general, well
designed and successfully executed. Results for ongoing ethanol projects are shown in Figure
6.6. In this case, the two assessments agree. However, little can be concluded at this point
because most objectives are still in progress.
5%
43%
33%
19%
0%
5%
10%
15%
20%
25%
30%
35%
40%
45%
50%
Grant awarded but contract has not been
signed
Ongoing Completed Canceled/terminated
Percentage of projecs

182
Figure 6.5. Extent to Which Technical Objectives in Completed Gasoline Substitutes Projects Have Been Met
SOURCE: Authors’ analysis and RAND survey. NOTE: For 37 technical objectives from seven projects that had been completed by the time of the survey
Figure 6.6. Extent to Which Technical Objectives in Ongoing Gasoline Substitutes Projects Have Been Met
SOURCE: RAND review of technical objectives from project documents and RAND survey responses. NOTE: RAND assessment based on 21 objectives identified for nine ongoing projects. Awardee assessment based on survey responses for 13 objectives from five projects plus eight objectives from four projects carried over from RAND assessment. Four objectives have been partially met—three in completed projects and another in an ongoing
project. Two of these partially met objectives are fueling infrastructure projects. In one case,
only 36 of the originally proposed 75 E85 stations were completed; in the other case, only two
of the proposed ten stations were completed. Despite being relatively straightforward
3% 8%
46% 43%
3% 8%
70%
19%
0% 10% 20% 30% 40% 50% 60% 70% 80%
Minimally Par5ally Fully Unknown
RAND evalua5on As updated by awardees
29%
67%
5%
29%
67%
5%
0%
10%
20%
30%
40%
50%
60%
70%
Fully In progress Par5ally
Percentage of objec5ves
Awardee
RAND

183
technically, there are other challenges in deploying E85 fueling stations. Findings from our site
visits indicate that awardees have had difficulty in obtaining cooperation from station owners.
(E85 dispensers are typically installed at existing gasoline stations.) First, E85 is not well known
in California, so station owners need to be educated. Second, with the low price of oil, E85 is
not cost-competitive. Thus, station owners are reluctant to host E85 dispensers, believing that it
will not sell. Station owners also face resistance from the major gasoline brand oil companies
they have branded agreements with, who view E85 as cutting into their sales. These types of
partnering challenges, while not unexpected, have proven to be greater than anticipated and
have raised the importance of fueling infrastructure barriers. Challenges with siting fueling
infrastructure was the barrier most frequently noted by survey respondents (Figure 6.1).
When asked how likely it was that the in-progress objectives from ongoing projects would be
completed, respondents in six out of 12 cases candidly indicated that it was only somewhat
likely (Figure 6.7). There is no clear difference between the technical objectives listed as
somewhat likely to be completed and those listed as highly likely.
Figure 6.7. Likelihood That In-Progress Technical Objectives for Ongoing Gasoline Substitutes Projects Will Be Met
SOURCE: RAND survey. NOTE: Based on 12 in-progress technical objectives from four ongoing gasoline-substitutes projects.
6.5.3 Financial Performance
Most ARFVTP awards require the awardee to fund a portion of the project through matching
funds. Although the required match amount varies from solicitation to solicitation, generally
the awardees are required to fund at least 50 percent of the project through match funding.
Proposals that offer higher matches are scored more favorably. Initially, match funding could
be provided in any combination of cash or in-kind contributions. However, after several
projects experienced financial problems, the CEC began requiring that at least 50 percent of the
match funding be cash. Proposals must disclose the source and provide verification and
documentation for the matching funds.
0% 0% 0%
50%
33%
17%
0%
10%
20%
30%
40%
50%
60%
Highly unlikely Somewhat unlikely
Just as likely as unlikely
Somewhat likely
Highly likely No response
Percentage of objec5ves

184
The extent to which projects were able to raise the amount of match funding originally
proposed is shown in Figure 6.8. Of the five projects that had a match-funding target greater
than $0 and that completed the survey, three achieved their match, one did not, and one did
not respond to this question.
Figure 6.8. Success in Raising Proposed Match Funding
SOURCE: CEC administrative data and RAND survey. NOTE: For projects with match fund target greater than $0 and a survey response; excludes canceled projects.
6.5.4 Schedule Performance
The RAND team compiled estimates of project schedule performance, and the survey
instrument was customized to include an assessment of the extent to which a project met, or
was meeting, the originally planned schedule. CEC Commission Agreement Managers (CAMs)
overseeing the particular project provided the schedule performance estimates used in the
survey instrument. As with the technical objectives, survey respondents were shown the CAM
schedule estimates and asked to correct them if needed. In general, survey responses agreed
well with the CAM estimates. Results are shown in Figure 6.9. These results show that all but
one of the completed projects fell behind schedule. As with the completed projects, most
ongoing projects are behind schedule.
1 1 1
2
0 0 0
1
2
3
Obtained proposed matching funds
Have not obtained proposed matching funds
No response
Num
ber of projects
Completed project Ongoing projects

185
Figure 6.9. Schedule Performance of Gasoline Substitutes Projects
SOURCE: CAM reports of schedule performance as updated by RAND survey responses. NOTE: Based on seven completed and nine ongoing projects.
Respondents from seven of the delayed projects provided reasons for the delay (Figure 6.10).
Respondents could provide multiple reasons. The sample is very small, making it difficult to
know how generalizable the cited reasons are.
Figure 6.10. Reasons for Schedule Delays
SOURCE: RAND survey. NOTES: Based on seven projects. Label on sixth bar should read, “Competition for time and resources from other ongoing projects in your company.”
0
1
2 2 2
0 0
3 3
2
1
0 0
1
2
3
4
Ahead of schedule On schedule About 1 to 6 months behind
schedule
About 7 to 12 months behind
schedule
About 13 to 24 months behind
schedule
About 25 months or more behind
schedule
Num
ber of projects
Completed
Ongoing
4
1
1
1
1
1
1
2
2
3
0 1 2 3 4 5
Other
CEC did not pay invoices in a 5mely manner
Hesita5on or reluctance about the project from site owner
Needed to change project loca5on
Compe55on for 5me and resources from other ongoing
Took longer than expected to secure matching funds
Delay in ger5ng required permits
Unexpected problems with the technolgoy arose
Took longer than expected to hire essen5al staff
Essen5al staff leg company
Number of Times Cited

186
6.6 Impacts on Awardee
One of the topics the survey explored is how unsuccessful applicants have proceeded and how
successful applicants would have proceeded with the project had they not received ARFVTP
funding. The responses (Figures 6.11 and 6.12) indicate that four unsuccessful applicants have
proceeded with the project, while five have not, and that successful applicants were generally
uncertain whether and when they would have conducted the project had they not been funded.
Figure 6.11. Whether Unsuccessful Applicants for Gasoline Substitutes Projects Proceeded with Project
SOURCE: RAND survey. NOTE: Based on nine unsuccessful applicants for projects.
2 2
5
0
1
2
3
4
5
6
Your organiza5on proceeded with a similar project within a year
Your organiza5on proceeded with a similar project 1 to 3 years later
Your organiza5on has not proceeded with the project
Num
ber of respondents

187
Figure 6.12. Whether Successful Applicants for Gasoline Substitutes Projects Would Have Proceeded with Project
SOURCE: RAND survey. NOTE: Based on ten projects that were not canceled.
Another set of questions explored is the extent to which ARFVTP funding helped the knowledge
and capabilities of organizations that it funded. A series of three related questions asked
project awardees about the extent to which ARFVTP funding allowed them to pursue work in
areas related and unrelated to the funded project (Figure 6.13). Responses indicate that the
funding was generally viewed positively, particularly for supporting work in areas in which the
organization already has some expertise or capacity.
1
3
6
0
1
2
3
4
5
6
7
Your organiza5on would have proceeded within a year
Your organiza5on would have proceeded 1 to 3 years later
Your organiza5on might have proceeded at some point in
the future but I don't know for sure
Your organiza5on would not have proceeded with the project for the foreseeable
future
Num
ber of respondents

188
Figure 6.13. Effect of Gasoline Substitutes Awards on Organization
SOURCE: RAND survey. NOTE: Based on ten projects.
Respondents of completed projects were also asked if they had continued to work on the
technology funded by the ARFVTP project after the funding expired. Of the four respondents,
three confirmed they are continuing to develop, market, install, or produce the funded product
or technology (Figure 6.14).
2
1
2
3
2
1 1
3
5
1
4
1
4
0
1
2
3
4
5
6
Strongly disagree Somewhat disagree Neither agree nor disagree
Somewhat agree Strongly agree
Num
ber of respondents
The award allowed, or will allow, your organiza5on to enter a new area in which you had previously not been ac5ve The award allowed, or will allow, your organiza5on to expand in an area in which you already had some exper5se or capacity The award allowed, or will allow, your organiza5on to gain knowledge and experience that will be useful in developing products and technologies besides those funded by the grant.

189
Figure 6.14. Whether Organization Is Continuing to Develop, Market, Install, or Produce Gasoline Substitutes Product or Technology Funded by Award
SOURCE: RAND survey. NOTE: Based on four completed projects.
The survey further asked those who are continuing what particular activities they are
undertaking. Responses for those three respondents who are continuing are shown in Figure
6.15. This figure shows that the gasoline-substitutes projects tend to be in the relatively earlier
stages of development; none are licensing, purchasing or installing, or scaling up production.
Figure 6.15. Steps Taken by Organization to Develop, Market, Install, or Produce Gasoline Substitutes Product or Technology Funded by Award
SOURCE: RAND survey. NOTE: Based on three completed projects that have continued to develop, market, install, or produce product or technology funded by the award.
3
1
0
1
2
3
4
Yes No
Num
ber of respondents
2
1
1
1
1
0
0
0
2
0 1 2 3
Iden5fied poten5al customers for the product
Worked on ways to reduce cost
Improved product performance
Implemented the technology at a demonstra5on scale
Sold the product or technology to customers
Entered into licenses for the technology
Purchased more similar vehicles or constructed more
Scaled up the manufacturing of the product
Other
Number of projects

190
6.7 Impacts on Barriers
The survey results provide one view into the extent to which ARFVTP investments are reducing
current barriers to the use of gasoline substitutes as a transportation fuel. After a request to
identify current barriers, awardees were asked, "What contribution(s) did or will your ARFVTP
project make in reducing these barriers?" Responses were largely understandable based on the
range of project technical objectives, with some unexpected exceptions. Figure 6.16 compares
survey respondents' views of current barriers to their views of which barriers their projects are
reducing. The current barriers are shown in the solid bars and are the same as those shown in
Figure 6.1. The hatched bars show the barriers that survey respondents state they are reducing
with their ARFVTP projects. Figure 6.16 indicates that, according to the awardees, ARFVTP
projects appear to be reducing nearly all the current barriers.
Figure 6.16. Assessment of Gasoline Substitutes Barriers Being Reduced
SOURCE: RAND survey. NOTES: Current barriers based on 57 barriers cited by 19 respondents (from Figure 6.1). Barriers reduced based on 36 barriers cited by ten respondents. Label for first green bar should read, “Difficult, cost, and delay in obtaining permits for siting fueling/charging stations.” Label for first gray bar should read, “Insufficient customer awareness of and knowledge about alternative fuels and vehicles.” Awardees were asked only whether their projects reduced a barrier, not by how much. Thus, the
relative lengths of the bars for the barriers being reduced do not indicate that the awardees
have reduced or will reduce one barrier more or less than another. Moreover, there is
10%
20%
30%
50%
20%
50%
30%
30%
20%
20%
20%
20%
0%
0%
10%
10%
20%
32%
5%
26%
5%
26%
26%
32%
11%
21%
32%
37%
5%
11%
16%
16%
0%
0%
0% 10% 20% 30% 40% 50% 60%
Other
Insufficient pool of labor familiar with alternaFve fuels and vehicles
Insufficient customer awareness of and knowledge about
Poor emission profile of fuel
High fuel producFon cost
Limited availability of feedstock for fuel producFon
Limited fuel producFon capacity
Insufficient bulk fuel distribuFon infrastructure
Lack of industry standards for fueling/charging interface
Insufficient retail fueling or charging infrastructure
Difficulty, cost, and delay in obtaining permits for siFng fueling/
Inadequate vehicle performance
Limited vehicle producFon capacity
Limited number of vehicle models available
High vehicle producFon cost
High vehicle lifeFme operaFng and maintenance cost
Poor emission profile of vehicle
Percentage of respondents ci5ng barrier
Vehicle-‐related Fueling infrastructure-‐related Feedstock and fuel producFon-‐related Other Barriers reduced

191
substantial uncertainty and possibly unintentional bias in some of the survey responses. For
example, none of the projects is addressing bulk fuel distribution infrastructure, yet multiple
survey respondents noted that their projects were reducing this barrier. More strikingly, no
vehicle project awardees responded to the survey, yet several vehicle-related barriers were cited
as being reduced, two of which were not even cited as current barriers. Conversely, many
feedstock and fuel-production projects reasonably claim to be reducing the emission profile of
ethanol, yet this was not commonly cited as a current barrier. As a result, we are reluctant to
place too much credence in the meaning of the survey respondents’ perceptions of barriers
being reduced.149
We further assess the impact of the ARFVTP on barriers by examining how indicators of the
gasoline-substitutes market in California have changed since 2009 (when the first ARFVTP
projects began) and discuss the extent to which the changes can be attributed to the ARFVTP.
As noted in previous chapters, these assessments are subject to three limitations discussed in
Chapter 1. First, clearly attributing market changes to the ARFVTP is challenging because it is
impossible to unequivocally determine what would have happened in the market without the
ARFVTP. Second, given the wide range in types of barriers and what is involved in addressing
them, we focus only on whether a barrier has been reduced and do not attempt to assess the
amount by which it has been reduced. Finally, while RD&D projects are often necessary to lay
the groundwork for subsequent commercialization, it is difficult to demonstrate the impact of
such work.
6.7.1 Fueling Infrastructure Barriers Reduced by ARFVTP Projects
The number of E85 fueling stations perhaps provides the clearest evidence of the impact of the
ARFVTP. As shown in Figure 6.17, the number of stations has increased more than threefold
since 2009. As of April 2015, ARFVTP funding has resulted in 40 completed E85 stations in
California. Seventeen ARFVTP-funded stations are still pending. Although this is less than half
of the number of stations intended to be added with ARFVTP funding, these stations account
for 42 percent of the 96 E85 stations in the state in 2016. Given that most ARFVTP awardees
indicated that they are unsure whether they would have proceeded with the project without
ARFVTP funding (Figure 6.12), these 40 stations likely would not have been installed without
ARFVTP funding. Thus, the impact of the ARFVTP on the density of E85 stations is quite
substantial.
149Some survey respondents may have thought “reducing” barriers meant the same thing as “targeting” the barrier. Their optimism may have led them to believe that if their projects targeted a barrier, it would reduce the barrier.

192
Figure 6.17. E85 Stations’ Growth in California
SOURCE: DoE, Energy Efficiency and Renewable Energy, “Alternative Fuels Data Center: Ethanol Fueling Station Locations,” 2017.
The increase in E85 fueling stations is associated with an increase in E85 consumption in
California. California has the highest growth rate of E85 sales in the nation, with E85 sales
volume having grown 600 percent in the five years since 2009, from 1.6 million gallons per year
(mgy) in 2009 to 11.1 mgy in 2014 (Figure 6.18). This occurred at the same time that gasoline
demand fell by 100 million gallons.150 California has the second-lowest ratio of E85 fueling
stations to the amount of E85 sold,151 and California’s retail E85 volume per station exceeds the
national average by 300 percent, averaging 140,585 gallons per station per year in 2014.152
Given the low density and high demand for E85 stations in California, it seems reasonable to
attribute at least part of the increase in E85 consumption to the increase in E85 fueling stations
and, hence, to the ARFVTP.
150Elam et al., E85: A California Success Story, 2015. 151Fuels Institute, E85–A Market, Performance Analysis and Forecast, 2014. 152Elam et al., E85: A California Success Story, 2015.
1
29 36
42
62
76 83 87
96
0
20
40
60
80
100
120
2003 2009 2010 2011 2012 2013 2014 2015 2016
Num
ber of sta5ons
Year

193
Figure 6.18. Growth in California E85 Annual Consumption
SOURCE: Elam et al., E85: A California Success Story, 2015.
While the dramatic growth in E85 fueling stations and E85 consumption in California can be
attributed at least partly to the ARFVTP, nearly all the ethanol being consumed in California
(and the rest of the country) is still made from corn grain and is not considered a low-carbon
fuel. Of course, the intention is to create the fueling infrastructure and demand for ethanol
while ethanol production transitions to advanced ethanol.
6.7.2 Feedstock and Fuel-Production Barriers Reduced by ARFVTP Projects
Another important market indicator is ethanol production in California. Most ethanol
consumed in California is not produced in California; instead, it arrives by truck, rail tank car,
or marine vessel from the Midwest and Brazil. However, while the fraction of ethanol consumed
in California coming from in-state production is small, it increased from 8 percent in 2000–
2010 to 18 percent in 2011–2013.153 As of July 2016, there were seven producers of ethanol in
California, with a combined production of 219 million gallons per year.154 This production
represents about 14 percent of the 1.5 billion gallons of ethanol used for transportation in
California in 2015.155 Figure 6.19 shows how California ethanol production has changed over
time.
153 Elam et al., E85: A California Success Story, 2015 154 Official Nebraska Government Website, “Ethanol Production Capacity by Plant—Archive 2005–2017,” 2017. 155 CEC, “Ethanol in California,” undated.
1.6
2.9
5.0
6.3
8.8
11.1
0.0
2.0
4.0
6.0
8.0
10.0
12.0
2009 2010 2011 2012 2013 2014
Million Gallons per Year

194
Figure 6.19. How California Ethanol Production Has Changed over Time
SOURCE: Official Nebraska Government Website, “Ethanol Production Capacity by Plant—Archive 2005–2017,” 2017.
The amount of ethanol produced in California has increased modestly since 2009. However, the
majority of California ethanol production is still from corn grain. While corn grain ethanol does
qualify for Renewable Fuel Standard (RFS) credits, it provides little benefit over petroleum in
terms of GHG reductions. In addition, the plateau on corn grain ethanol production
requirements under RFS since 2015 eliminates incentives to increase production any further.156
This creates an incentive for producers to transition to other feedstocks and technologies for
continued growth in ethanol production.
None of the ARFVTP projects focused on increasing ethanol-production volumes. The program
has, however, facilitated the transition from corn grain to lower-CI feedstocks. The three major
California ethanol refineries are beginning to use some sorghum in their operations. Sorghum
ethanol that achieves a 50-percent reduction in GHG emissions relative to the petroleum
baseline qualifies as advanced ethanol under the RFS. The amount of sorghum varies based on
availability and price. Pacific Ethanol used sorghum for approximately 30 percent of the
156Under the RFS, the amount of “renewable ethanol,” which consists primarily of corn grain ethanol, required to be produced for transportation fuel has increased each year since 2008 but plateaued at 15 billion gallons per year in 2015. Annual growth in U.S. production has closely tracked the RFS requirements (Renewable Fuels Association, “World Fuel Ethanol Production: Production 1980–2016,” undated).
9
68 68
118
140
195 195
255 255 255
223 224 224
9 8 8 8
100
40 40
183 178 178 178
219 219
0
50
100
150
200
250
300
Millions of gallons per year
Mgy nameplate Mgy opera5ng

195
feedstock at its Stockton plant in the third quarter of 2012.157 Aemetis announced in late 2012
that it intends to transition from corn grain to grain sorghum and ultimately to biomass
sorghum and agricultural wastes available in California. It has already processed about 80
million pounds of grain sorghum at its 60-million-gallons-per-year Keyes refinery.158 The
ARFVTP has awarded four projects to refiners and others to conduct RD&D of sorghum ethanol
production. While the combined production from these efforts is under 5 million gallons per
year, the primary objective of these projects has been process development (e.g., grower
outreach, crop trials, preprocessing methods, engineering design). It thus appears appropriate
to conclude that this shift from corn grain to sorghum ethanol is attributable at least partly to
the ARFVTP.
As the sugar market in California contracted, sugar beet producers began exploring using sugar
beets to produce ethanol. However, the ARFVTP projects supporting ethanol production from
sugar beets have been problematic, leading the CEC to cancel one major award. As of 2014, no
ethanol is being produced from sugar beets in California or anywhere else in the United
States.159
The only commercial cellulosic ethanol plant currently operating in California is Pacific Ethanol
at Stockton. Beginning in December 2015, it shows production of 0.75 million gallons per year
of cellulosic from corn kernel fiber.160 Edeniq developed the technology for this operation with a
grant from DoE. The ARFVTP awarded Edeniq follow-on funding to develop a precommercial
plant using corn stover. While this demonstration project was technically successful, the costs
are too high for commercial production. Cellulosic ethanol production in California remains
minimal.
Overall, the ARFVTP is helping shift current California ethanol production from corn grain to
sorghum. It has supported a number of other efforts to develop alternative ethanol and
gasoline-substitute feedstocks and production technologies, but these have not reached
commercial production.
6.7.3 Vehicle Barriers Reduced by ARFVTP Projects
Another relevant market indicator is the number of flex-fuel vehicles on the road in California.
Unfortunately, state-level data are difficult to obtain. According to CARB, manufacturers began
selling flex-fuel vehicles in the late 1990s, and, as of 2009, the cumulative number of flex-fuel
vehicles sold or leased in California was more than 684,000.161 More recent data do not appear
to be available, but estimates suggest that there were around 1 million flex-fuel vehicles in
157 Harry Cline, “30,000 Grain Sorghum Acres Target California Ethanol Plants,” Western Farm Press, February 25, 2013. 158 Aemetis, “Aemetis Achieves Milestones in Advanced Feedstock for Biofuels,” September 28, 2015. 159 Bruce Dorminey, “Ethanol from Energy Beets: A Viable Option?” Renewable Energy World, Vol. 17, No. 2, April 22, 2014. 160 Pacific Ethanol, Inc., “Pacific Ethanol Begins Commercial Production of Cellulosic Ethanol at Its Stockton Plant,” Sacramento, Calif., December 16, 2015. 161 ARB, Appendix C: Status of Alternative Fuel Infrastructure, for Non-ZEV Alternative Fuel Vehicles, undated.
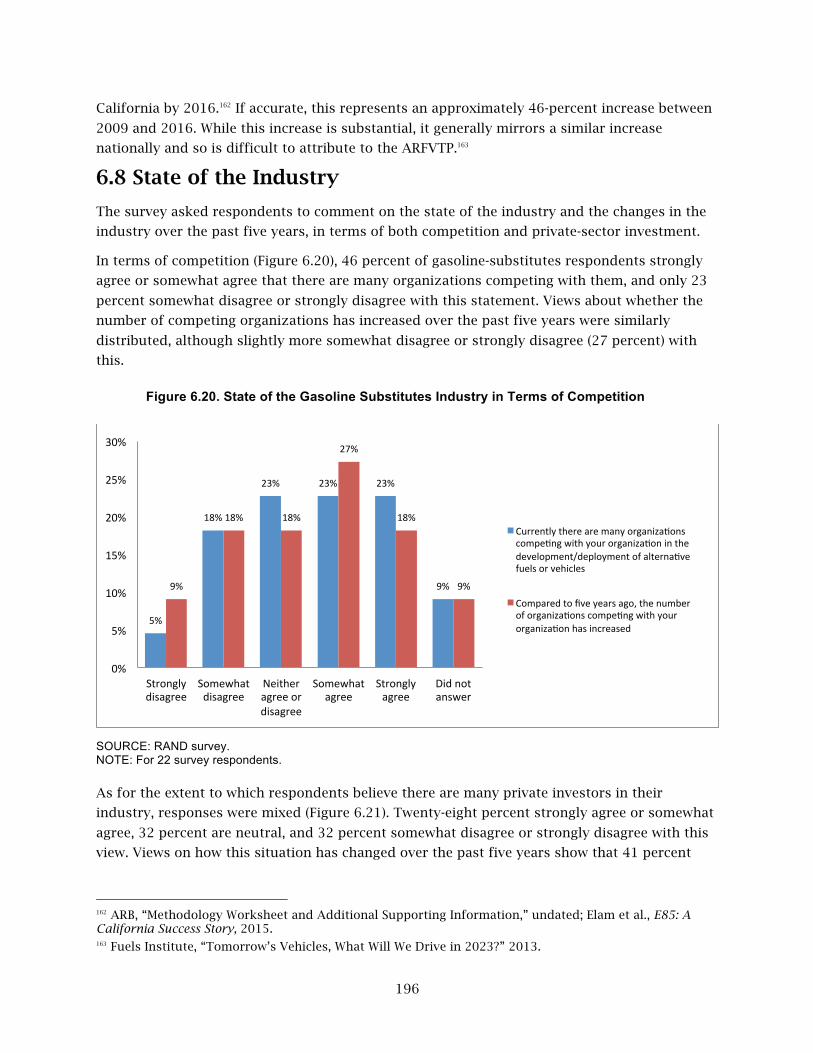
196
California by 2016.162 If accurate, this represents an approximately 46-percent increase between
2009 and 2016. While this increase is substantial, it generally mirrors a similar increase
nationally and so is difficult to attribute to the ARFVTP.163
6.8 State of the Industry
The survey asked respondents to comment on the state of the industry and the changes in the
industry over the past five years, in terms of both competition and private-sector investment.
In terms of competition (Figure 6.20), 46 percent of gasoline-substitutes respondents strongly
agree or somewhat agree that there are many organizations competing with them, and only 23
percent somewhat disagree or strongly disagree with this statement. Views about whether the
number of competing organizations has increased over the past five years were similarly
distributed, although slightly more somewhat disagree or strongly disagree (27 percent) with
this.
Figure 6.20. State of the Gasoline Substitutes Industry in Terms of Competition
SOURCE: RAND survey. NOTE: For 22 survey respondents. As for the extent to which respondents believe there are many private investors in their
industry, responses were mixed (Figure 6.21). Twenty-eight percent strongly agree or somewhat
agree, 32 percent are neutral, and 32 percent somewhat disagree or strongly disagree with this
view. Views on how this situation has changed over the past five years show that 41 percent
162 ARB, “Methodology Worksheet and Additional Supporting Information,” undated; Elam et al., E85: A California Success Story, 2015. 163 Fuels Institute, “Tomorrow’s Vehicles, What Will We Drive in 2023?” 2013.
5%
18%
23% 23% 23%
9% 9%
18% 18%
27%
18%
9%
0%
5%
10%
15%
20%
25%
30%
Strongly disagree
Somewhat disagree
Neither agree or disagree
Somewhat agree
Strongly agree
Did not answer
Currently there are many organiza5ons compe5ng with your organiza5on in the development/deployment of alterna5ve fuels or vehicles
Compared to five years ago, the number of organiza5ons compe5ng with your organiza5on has increased

197
somewhat disagree or strongly disagree that private investment has increased, and only 14
percent somewhat agree or strongly agree with this.
Figure 6.21. State of the Gasoline Substitutes Industry in Terms of Private-Sector Investment
SOURCE: RAND survey. NOTE: For 22 survey respondents. Taken together, these responses indicate that the gasoline-substitutes industry has ample
competition that has been increasing over time but that there is only modest interest from
private investors. This situation appears consistent with respondents' support for all types of
government support for the gasoline-substitutes industry (Figure 6.22).
32%
0%
32%
14% 14%
9%
36%
5%
36%
14%
0%
9%
0%
5%
10%
15%
20%
25%
30%
35%
40%
Strongly disagree
Somewhat disagree
Neither agree or disagree
Somewhat agree
Strongly agree
Did not answer
Currently there are many private-‐sector investors (i.e. nongovernmental funders such as angel investors, venture capital, strategic investors, and banks) interested in your industry
Compared to five years ago, the amount of private investment has increased

198
Figure 6.22. Kinds of Government Support Needed for the Gasoline Substitutes Industry
SOURCE: RAND survey. NOTE: Based on 21 survey responses.
6.9 Views of Gasoline Substitutes Stakeholders on ARFVTP Investment Priorities
The final section of our survey asked respondents for their perceptions and feedback on the
ARFVTP funding portfolio. Respondents were asked to comment on the funding allocations in
terms of fuel type and market segment (fueling infrastructure, fuel production, vehicles) and in
terms of development stage (RD&D projects versus PD&D projects). Respondents were shown
graphic representations of the cumulative allocations over the program history for each and
asked how they thought CEC should have allocated the funds differently. A third question
asked what areas CEC should prioritize over the next five years. The questions were asked to
ARFVTP awardees, unsuccessful applicants, and potential applicants.
Responses on fuel type and market segment allocations varied from one another significantly,
and there was no clear theme overall for gasoline-substitutes respondents (data not shown).
The responses addressed fuel type only and did not comment on market segment. Of the 15
responses, four felt there should have been more funding for advanced ethanol or liquid
biofuels, and two more felt allocations should “allocate based on real GHG reductions,” which
presumably includes advanced ethanol. Some felt there was too much spending on hydrogen
and electricity, while others felt there was too little. There were calls for less spending on
alternative fuel technology across the board and more emphasis on behavioral change and on
decreasing the CI of the existing gasoline fuel system. Two responses felt there should be more
funding for diesel substitutes.
When asked about development stage allocations, most (seven out of nine) respondents (data
not shown) felt the balance should shift more toward RD&D, with some noting that production
is the role of private investment. One specifically noted the importance of funding
demonstrations projects to help firms cross the “valley of death” between investment-funded
14.3%
23.8%
38.1%
42.9%
42.9%
61.9%
61.9%
61.9%
0% 10% 20% 30% 40% 50% 60% 70%
Other
Consumer tax breaks or purchase subsidies
Consumer awareness programs
Government grant programs that fund research and development
Carbon tax or tax on petroleum-‐based fuels
Government grant programs that fund demonstra5on and deployment
Requirements on the quan55es of alterna5ve fuels and vehicles produced or sold
Producer tax breaks or produc5on subsidies
Percentage of respondents

199
RD&D and revenue-generating sales. Two respondents felt that none of the funding has been
wisely spent.
The 13 responses about how CEC should prioritize funding over the next five years (data not
shown) largely mirrored perceptions about funding allocations to date. Additional comments
included a call to support new technology companies; integration of mobile technology with
transit systems; development of off-road alternative fuel equipment; consumer education; more
emphasis on production; more focus on carbon intensity; access, equity, and co-benefits; more
creative, less capital-intensive projects; and projects that connect fuel production, feedstock
supply, and regulators. There was also one call for no government investment at all.
6.10 Conclusions
Fueling infrastructure and fuel production are the two principal barriers to the market viability
of gasoline substitutes. Our review of the literature, survey, and in-depth project reviews reveal
that insufficient availability of E85 fueling stations is an important barrier to increased
advanced ethanol use, particularly given that we have reached saturation in the supply of corn
grain ethanol under the RFS. Increasing ethanol use now requires advanced and cellulosic
feedstocks, either displacing corn grain in E10 or increasing the supply of higher concentration
blends, such as E15 and E85. There are fewer than 100 E85 stations in California, suggesting
that, along with high cost, lack of access to E85 stations may be a reason that flex-fuel vehicle
operators in California generally choose not to use E85. This conclusion is supported by the
observation that California has among the greatest E85 sales per station in the country.
Another key barrier is the limited availability and high cost of low-carbon ethanol feedstocks.
As CI requirements of the LCFS and RFS continue to decrease, refiners must transition from
corn grain to lower CI feedstocks. Developing reliable supplies of alternative feedstocks
requires developing an entirely new supply chain from growers on up. Closely related are
challenges with conversion technologies for these new feedstocks: New processing and refining
methods need to be developed, particularly for cellulosic ethanol.
ARFVTP projects appear to be appropriately targeting these key barriers and making progress
in reducing some. The number of E85 fueling stations, in particular, has increased significantly
through ARFVTP funding. The program has also facilitated the beginnings of a transition from
corn grain to sorghum for major ethanol producers in California. Because of the unresolved
challenges with low-CI ethanol feedstocks and fuel production, it appears premature for the
program to make significant investments in increasing commercial production.
Another key finding is that there was a near consensus among gasoline-substitutes survey
respondents that the overall ARFVTP portfolio should increase the priority of RD&D projects
over PD&D projects. ARFVTP-wide, PD&D spending has been about three times greater than
RD&D spending to date. In the case of gasoline substitutes, some of the barriers related to
feedstock production and conversion are relatively fundamental and require more research-
oriented work to resolve.

200
Most projects are still ongoing, so it is difficult to definitively summarize the performance of
gasoline-substitutes projects under the ARFVTP. Most projects are behind schedule. For the
projects that have finished, the technical objectives have generally been fully met. Fueling
infrastructure projects appear to be having the most difficulty in meeting technical objectives.
For ongoing projects, respondents were remarkably candid that more often than not technical
objectives were only somewhat likely to be met. Unfortunately, survey respondents declined to
explain why they felt this way.
A final observation relates to the fact that most flex-fuel vehicle owners use E10 rather than
E85. If estimates that there are a million flex-fuel vehicles in California are correct, these
vehicles could use around 500 million gallons of E85 per year. Instead, E85 consumption is only
about 11 million gallons per year (Figure 6.18). This presumably reflects a combination of the
low availability of E85 fueling stations, the high price of E85, and the low price premium for
flex-fuel vehicles. Whatever the reason, this low demand raises the question of the relative
benefits of the two main thrusts of CEC’s approach to increasing use of gasoline substitutes as
a transportation fuel: transitioning from corn grain to low-CI ethanol feedstocks and
transitioning from E10 to E85. To illustrate the relative benefits, we can compare the CI for the
LDV fleet in California under different scenarios. If all ethanol were cellulosic and all vehicles
used E10, the CI would be approximately 95 percent of the current baseline (E10 made from
corn grain ethanol).164 On the other hand, if all existing flex-fuel vehicles used E85 (and the
remaining vehicles used E10) and all ethanol was made from corn grain, the CI would be
approximately 98 percent of the current baseline. While transitioning to low-CI ethanol for E10
would have a somewhat greater benefit in terms of CI reduction than transitioning to E85 using
corn grain ethanol, the benefit in either case would be small. In an extreme case in which the
LDV fleet was made up entirely of flex-fuel vehicles using E85, the CIs for corn grain ethanol
and cellulosic ethanol would be approximately 81 percent and 42 percent of the current
baseline, respectively.
These comparisons show that appreciable CI reduction can be accomplished only with both low
CI feedstocks and a greatly expanded E85 infrastructure. The greatest CI reduction we can ever
expect with current feedstocks is about 19 percent. Realizing more appreciable reductions will
require lower-CI ethanol pathways. Given the long-running challenges with cellulosic ethanol
technology and continuing uncertainty about whether it will ever be technically feasible at a
competitive cost, it makes sense to suspend building out the E85 infrastructure and concentrate
resources on research to develop cellulosic ethanol production. If and when that investment
comes to fruition, investment can return to expanding the E85 infrastructure. The ARFVTP
adopted this approach by discontinuing funding for E85 infrastructure as of 2013.165
164Estimate based on an EER-adjusted CI for cellulosic ethanol of 30 gCO
2e/MJ (ARB, 2017).
165CEC, 2017–2018 Investment Plan for the Alternative and Renewable Fuel and Vehicle Technology Program, 2016, p. 36.

201
CHAPTER 7: Impact of Program on Barriers to Market Viability of Natural Gas and Biomethane
In this chapter, we analyze the impact of the Alternative and Renewable Fuel and Vehicle
Technology Program (ARFVTP) on the barriers to the market viability of natural gas and
biomethane as transportation fuels. The chapter begins with a summary of data sources that
inform the chapter’s findings. We then provide a technical overview of natural gas and
biomethane as transportation fuels and a discussion of the barriers identified to their use. We
then review the California Energy Commission’s (CEC’s) solicitations and awards in natural gas
and biomethane and discuss awardee performance. We next discuss the results of our impact
analysis of the ARFVTP on the awardees and on the barriers to market viability in the industry.
We then turn to a discussion of stakeholder views about ARFVTP investment priorities and end
with our conclusions.
7.1 Summary of Data Sources
The data in the following sections are drawn from a number of sources, including
administrative data from CEC, project documentation literature (proposal, statement of work,
critical project review presentations, and, for completed projects, the final project report), our
in-depth reviews of selected ARFVTP-funded projects, and our survey. The survey response
rates for natural gas and biomethane are shown in Table 7.1. As shown in Table 7.1, the survey
response rate for natural gas and biomethane awardees was 83 percent (62 out of 75), and the
response rate for unsuccessful applicants was 49 percent (30 out of 61). Six potential applicants
for awards in the natural gas and biomethane area also completed the survey. The total number
of survey respondents was 98 out of 142 in the survey sample, for a response rate of 68
percent.
Table 7.1. Survey Respondents and Nonrespondents for Natural Gas and Biomethane
Category Number in Survey
Sample Respondents
Response Rate
(Percentage) Awardees 75 62 83
Project complete 29 25 86 Project ongoing 33 28 85 Project canceled/terminated 13 9 69
Unsuccessful applicants 61 30 49 Potential applicants n/a 6 — Total 142 98 68
SOURCE: RAND survey.
202
7.2 Technical Overview of Natural Gas and Biomethane as Transportation Fuels
Natural gas and biomethane are both methane-rich gases (typically more than 90 percent)
derived from different sources. Natural gas is a mixture of hydrocarbon and nonhydrocarbon
gases found in porous geologic formations beneath the earth's surface, often in association
with petroleum.166 Biomethane is a similarly methane-rich gas produced from organic matter
through biological or chemical processes.167 Natural gas has been exploited as a fuel source for
almost two centuries, while the introduction of biomethane production is much more recent.
Because natural gas has been the dominant source of methane fuel for energy production and
transportation systems for so long, much of the terminology related to methane-fuel system
components uses the expression natural gas, even when the component partly or entirely
involves biomethane. For example, pipeline-quality biomethane is referred to as renewable
natural gas,168 and terms such as compressed natural gas (CNG), liquefied natural gas (LNG),
natural gas pipeline, and natural gas vehicle (NGV) are generally used regardless of whether the
fuel is natural gas or biomethane. In the past, the fraction of biomethane used as a
transportation fuel was so small compared with natural gas that this distinction was
unimportant. However, as biomethane use has increased in recent years, it has become
necessary to distinguish biomethane from natural gas to appropriately characterize trends and
barriers in the methane-fueled transportation market. We first summarize general aspects of
methane as a transportation fuel and then describe aspects specific to natural gas and
biomethane.
7.2.1 Methane (Natural Gas and Biomethane) as a Transportation Fuel
Methane is viewed as an attractive transportation fuel for replacing diesel and gasoline because
of its lower tailpipe emissions and reduced carbon intensity (CI). The expanded U.S. supply and
declining prices of natural gas have contributed to the growing popularity of methane as well.
Methane powers about 150,000 vehicles in the United States and roughly 15.2 million vehicles
worldwide.169 In 2015, about 39 billion cubic feet of natural gas was used to fuel vehicles in the
United States. Almost one-half of this amount was used in California.170 Methane makes up
about 3 percent of all transportation fuel nationwide.171
166 American Gas Association, “Natural Gas Glossary,” aga.org, 2017. 167 U.S. Department of Energy (DoE), Energy Efficiency and Renewable Energy, “Alternative Fuels Data Center: Renewable Natural Gas (Biomethane) Production,” undated. 168 Marsha W. Johnston, “Breaking Down Renewable Natural Gas Injection Barriers,” BioCycle.net, Vol. 55, No. 8, September 2014, p. 60. 169 DoE, Energy Efficiency and Renewable Energy, “Alternative Fuels Data Center: Natural Gas Vehicles,” undated. 170U.S. Energy Information Administration, “Natural Gas Consumption by End Use (Data Series: Volumes Delivered to Vehicle Fuel Customers),” April 28, 2017. 171U.S. Energy Information Administration, “Use of Energy in the United States Explained: Energy Use for Transportation,” May 17, 2017.

203
Methane can be used in internal combustion engine (ICE) vehicles that are modified to receive,
store, and make use of methane. Because methane is a gas at room temperature and pressure,
methane must be compressed or liquefied for a vehicle to carry enough fuel to provide an
adequate driving range. CNG is typically compressed at a fueling station and transferred to a
vehicle at a pressure of 3,000–3,600 pounds per square inch (psi). CNG is a versatile storage
form and can be used in light-, medium-, and heavy-duty applications.172 A CNG-powered vehicle
gets about the same fuel economy as a conventional gasoline vehicle on an energy-equivalent
basis. LNG is produced by super-cooling methane to –260°F to turn it into a liquid. Because it
must be kept at cold temperatures, LNG is stored in double-walled, vacuum-insulated pressure
vessels. Because LNG is denser than CNG, it is suitable for trucks needing a longer range; thus,
more energy can be stored by volume in a given tank.
CNG and LNG are inventoried and sold in units of diesel- or gasoline-gallon equivalents (DGEs
or GGEs, respectively) based on the energy content of a gallon of gasoline or diesel fuel. Both
CNG and LNG are considered alternative fuels under the Renewable Fuel Standard (RFS).
To date, the use of methane as a vehicle fuel has been greatest in fleet applications, such as
waste collection and parcel delivery, because the higher initial cost of a methane vehicle can be
amortized much more quickly and because the vehicles can be centrally refueled.
7.2.2 Natural Gas
Natural gas is drawn from wells targeting natural gas specifically or in conjunction with crude
oil production. The produced gas is processed in gas plants to extract most of the heavier
hydrocarbons and remove impurities before being injected into the natural gas pipelines. These
high-pressure pipelines transport the gas from producing areas to consuming areas, which are
often urban centers.
Historically, natural gas has been used for heat and power generation by the residential,
commercial, and industrial sectors. The proportion of natural gas used as a vehicle fuel in the
United States was just 0.14 percent in 2015.173
Under California’s Low Carbon Fuel Standard (LCFS), natural gas is considered to be an alternate
fuel to gasoline with lower carbon emissions. Compared with gasoline, the CIs of fossil-based
CNG and LNG under the LCFS are about 77 percent and 83 percent, respectively.174
7.2.3 Biomethane
Biomethane is produced either biologically, through anaerobic digestion, or through
thermochemical gasification. Both approaches use well-established commercial technologies to
create a precursor gas, which then must be upgraded or converted to methane.
172 DoE, Energy Efficiency and Renewable Energy, “Alternative Fuels Data Center: Natural Gas Vehicles,” undated. 173U.S. Energy Information Administration, “Natural Gas Consumption by End Use,” 2013. 174 Air Resources Board (ARB), “Data Dashboard,” 2017.
204
Biologic production occurs through anaerobic digestion (decomposition without oxygen), in
which bacteria digest organic material to produce biogas. Anaerobic digestion occurs naturally
in landfills and is induced in anaerobic digester systems. Biogas is typically 50–70 percent
methane and 30–50 percent carbon dioxide, with trace amounts of other contaminants. With
minor cleanup, biogas can be combusted to generate electricity and heat. Biogas is produced for
power and heat generation at hundreds of landfills, wastewater treatment plants, and dairies
around the country.175 Biogas can be upgraded to produce biomethane by removing carbon
dioxide and other contaminants.
Thermochemical production entails first converting the feedstock by using oxygen to a syngas
consisting primarily of carbon monoxide and hydrogen. After this, the syngas is converted to
methane through a series of reaction and purification steps.176
Biomethane is essentially identical to natural gas and can be used for any purpose for which
natural gas is used. While it is possible to inject biomethane into pipelines, so far this is rare
(see Section 7.3). When used as a transportation fuel, the biomethane is compressed or liquefied
to create bio-CNG or bio-LNG.
From a climate perspective, the benefits of biomethane are significant; compared with gasoline,
the CIs of bio-CNG and bio-LNG under the LCFS average about 25 percent and 30 percent,
respectively, with some pathways having negative CIs.177
7.2.4 Natural Gas Vehicles
NGVs have been used in both light-duty vehicle (LDV) and heavy-duty vehicle (HDV) applications
for several decades. Although the fuel for methane-powered vehicles is increasingly a mix of
natural gas and biomethane, the term NGV remains in common use for such vehicles regardless
of the source of the methane fuel. Engines used in NGVs are generally based on designs
originally intended for operation on gasoline or diesel fuel that have been modified for
operation with natural gas. Historically, NGVs were of interest because of their potential to
reduce emissions of certain air pollutants relative to conventional vehicles. Current interest in
NGVs has been further enhanced because of their potential to reduce GHG emissions and
because, in heavy-duty applications, of their ability to reduce operating costs given the large
historical difference between the costs of natural gas and diesel fuel on an energy-equivalent
basis.
Light-duty NGVs generally use CNG in spark-ignition engines. The major difference between
NGVs and conventional gasoline vehicles is the high-pressure CNG storage tank. Commercially
available light-duty NGVs have included several dedicated CNG models and several bifuel pick-
up truck models that can operate on both CNG and gasoline. There are also kits for retrofitting
175DoE, “Alternative Fuels Data Center: Renewable Natural Gas (Biomethane) Production,” undated; U.S. Environmental Protection Agency (EPA), Combined Heat and Power Partnership, Opportunities for Combined Heat and Power at Wastewater Treatment Facilities: Market Analysis and Lessons from the Field, October 2011. 176 DoE, “Alternative Fuels Data Center: Renewable Natural Gas (Biomethane) Production,” undated. 177 ARB, “Data Dashboard,” 2017.

205
conventional vehicles to run on natural gas. These require CARB approval for sale in California
and EPA approval for sale in other states.
In the heavy-duty sector, NGVs are generally based on compression-ignition engines intended
for diesel applications that have been modified for spark-ignition operation. In addition to
spark-ignition designs, there are so-called compression-ignition “dual-fuel” engines that operate
using both diesel fuel and natural gas. With dual-fuel engines, at least a small amount of diesel
fuel is always injected to initiate combustion. In the heavy-duty sector, most NGVs are designed
for operation on CNG; however, there are NGVs that use LNG. The motivation for using LNG is
that it has a higher energy density than CNG, which allows vehicles to have greater range.
CARB has adopted several regulatory programs for in-use HDV fleets that have provided
incentives to use NGVs for compliance with pollutant emission reduction requirements. With
respect to operating costs, fuel price differentials are a more important issue for commercial
operators in the heavy-duty sector than for individual motorists in the light-duty sector.
7.3 Barriers to the Use of Natural Gas and Biomethane as a Transportation Fuel
Our assessment of the barriers to developing and using advanced natural gas and biomethane
is based on reviewing the literature, in-depth reviews of selected ARFVTP-funded projects, and
the survey. Barriers can be grouped into four areas: feedstock, fuel production, fueling
infrastructure, and vehicles. Our assessments of the barriers developed from a review of the
literature and from in-depth project reviews are listed and discussed in more detail in Table 7.2.
Table 7.2. Barriers Identified for Using Natural Gas and Biomethane as a Transportation Fuel
Market Segment Barrier Description Feedstock • Feedstock acquisition, collection, and transportation
Fuel production
• Limited production capacity • Preference for using biogas for heat and power rather than for transportation
Fueling infrastructure
• Limited number of fueling stations • Technical design of CNG stations • Safety concerns of LNG stations • Stringent quality requirements for pipeline injection
Vehicles
• Performance limitations compared with gasoline or diesel vehicles (reduced range, reduced cargo space, power loss)
• Safety concerns • Limited vehicle models • Higher cost than gasoline or diesel vehicle
SOURCE: Author analysis.
7.3.1 Feedstock and Fuel-Production Barriers
As just described, natural gas is abundant and currently cheap to produce, so there are no
substantial barriers to production and supply.

206
Biomethane is most commonly produced through anaerobic digestion or by recovering landfill
gas. Common feedstocks include manure and wastewater treatment sludge, which can be
digested, or solid waste that has been buried in landfill operations. A broader range of
feedstocks can also be made into biogas, including food waste, food-processing wastewater,
aquaculture wastewater, seafood-processing wastewater, yard wastes, and municipal solid
wastes. These feedstocks typically provide a lower concentration of digestible material and
would require larger equipment for the same biogas output.
Because of the importance of a reliable supply of feedstock, digesters are most commonly
located at sites where feedstock is produced, such as wastewater treatment facilities and
dairies. While this ensures a readily accessible feedstock supply, it limits the options for siting
digesters. The alternative approach of bringing feedstock to a digester introduces new
challenges. Identifying and securing access to sufficient material and collecting and
transporting that material can be substantial barriers to more widespread use of anaerobic
digestion. Many possible feedstocks, while perhaps plentiful, are generated at small, widely
dispersed sources, such as homes and restaurants. The administrative and materials-handling
logistics required to get the material to a digester site can be complex and expensive, as well as
unreliable.
A closely related barrier is the lack of biomethane production capacity. The American Biogas
Council estimates that there were 276 operational biogas production systems in California in
2013.178 However, the majority of this biogas production is used for on-site electricity
generation and heating.179 Part of the reason for this is that electricity and heat can be generated
directly from biogas. This eliminates the need to invest in equipment to upgrade the biogas to
biomethane and to compress or liquefy the biomethane. The emphasis on electricity is also a
result of historical government incentives focused on reducing GHG emissions from electricity
production rather than transportation.180 Finally, as described in the next section, challenges
with connecting to the natural gas pipeline grid make it difficult to deliver biomethane to users
and, hence, reduce the incentive to produce it.
7.3.2 Fueling Infrastructure Barriers
7.3.2.1 Limited Stations
Increased use of natural gas, particularly within the passenger vehicle fleet, is constrained by
the limited availability of publicly accessible refueling stations. According to DoE, there are
about 150,000 NGVs operating in the United States. There are 1,691 CNG stations (938 are
178 American Biogas Council, “Biogas State Profile: California,” August 7, 2015. 179 U.S. Environmental Protection Agency, Landfill Methane Outreach Program (LMOP), “Landfill Gas Energy Project Data and Landfill Technical Data,” undated; DoE, “Alternative Fuels Data Center: Renewable Natural Gas (Biomethane) Production,” undated; Johnston, “Breaking Down Renewable Natural Gas Injection Barriers,” 2014. 180Johnston, “Breaking Down Renewable Natural Gas Injection Barriers,” 2014.

207
public) and 140 LNG stations (83 are public) in the United States.181 In contrast, in 2015, there
were nearly 130,000 gas stations in the United States.182
There is interest in NGVs for use in the goods movement industry, including line-haul trucking
applications. While this would still require considerable investment in refueling infrastructure,
it would be a smaller task to establish a network of natural gas dispensers along major goods
movement corridors than to develop a much more extensive network of dispensers to serve the
broader light-duty passenger fleet.
7.3.2.2 Technical Design and Distribution of CNG Stations
Natural gas is distributed to most developed areas, although some rural areas do not have
access. Developing a CNG station requires more technical design than a typical gasoline or
diesel station.183 In particular, CNG stations must have access to gas pipelines with enough
capacity to supply compressors that must pressurize the gas to more than 3,600 psi to
dispense to vehicles. Depending on the type of fill (fast-fill or time-fill), the station design must
balance pressure and storage requirements to ensure delivery.
7.3.2.3 Safety Considerations for LNG Stations
LNG, in contrast, is normally produced at centralized liquefaction facilities and subsequently
delivered by truck to dispensing sites. As such, LNG stations are similar to gasoline and diesel
stations in that they all dispense liquid fuel, but LNG must be stored and dispensed at –260°F,
which requires more safety considerations and precautions.
7.2.2.4 Stringent Quality Requirements for Pipeline Injection
An important barrier to developing a robust biomethane-fueling infrastructure is the stringent
quality requirements for injecting biomethane into the natural gas pipeline grid. Because
biomethane is relatively new and unknown, risk-averse public utilities have been reluctant to
accept biomethane into their pipeline systems. Without access to the pipeline grid, biomethane
production and use is thus limited to sites with easy access to a tethered fleet of vehicles.
Unfortunately, most anaerobic digesters have historically been located at sites with ample
sources of feedstocks, such as dairies and wastewater treatment plants, which typically do not
have large vehicle fleets and, hence, have little way of using biomethane.
In an effort to address this, California passed AB 1900 in 2012, which defines gas quality
standards for biomethane to qualify for pipeline injection. While intended to facilitate access to
pipelines, the quality requirements specified in the law are quite stringent and “were written
181 DoE, Energy Efficiency and Renewable Energy, “Alternative Fuels Data Center: Natural Gas Vehicles,” undated; DoE, Energy Efficiency and Renewable Energy, “Alternative Fuels Data Center: Natural Gas Fueling Station Locations,” undated. 182U.S. Census Bureau, “2014 SUSB Annual Data Tables by Establishment Industry, U.S., 6-Digit NAICS,” 2016.
183 DoE, Energy Efficiency and Renewable Energy, “Natural Gas Fueling Infrastructure Development,”
undated.

208
never to be met.”184 Part of the reason for this is that landfill gas, which has great potential as a
biomethane source, may be contaminated with toxins by virtue of intermingling with paints and
other chemicals in landfills. Biogas producers note that natural gas is held to far less stringent
standards for pipeline injection. As one stakeholder noted, “[t]he irony is that fossil fuel gases
probably can’t meet the new standards. . . . The [AB 1900] standards are not necessarily
inappropriate, but they should be applied equally to fossil fuels or we will still not have a level
playing field.”185 Compliance testing and ongoing monitoring requirements increase the cost of
pipeline injection to the point of making it prohibitive for most producers. This view was
confirmed in an in-depth project review; in that review, we found that although a natural gas
utility pipeline ran directly under the company’s property, the estimated cost to connect to it
was over $3 million, which the company could not afford. Costs for sites that must build a new
pipeline to reach the existing pipeline grid would be even higher.
7.3.2.5 Fugitive Emissions
The problem of fugitive methane emissions cuts across the specific barrier categories but is
listed under fueling infrastructure for convenience. Fossil natural gas emits about 25 percent
less carbon dioxide than diesel and gasoline on an energy-equivalent basis. However, there are
typically leaks throughout the natural gas–production and distribution system that undermine
the GHG emission benefits of natural gas. Methane is a potent GHG, and these leaks reduce
natural gas’ GHG advantage as a vehicle fuel. Taking these life-cycle effects into account, the
effective CI of natural gas is only 6–11 percent less than that of gasoline. This can act as a
barrier to commercialization because it means the fuel is a weaker tool in meeting the LCFS or
other GHG-reduction policies that might otherwise strengthen the market for natural gas. There
are also fugitive emissions in the biomethane life cycle, and these occur to different extents,
have different sources, and have different mitigation potentials compared with fossil natural
gas, depending on how they are produced and used. Note, however, that the effect of fugitive
emissions is not yet accounted for in California’s LCFS and has been the subject of debate
between CARB, the natural gas industry, and other stakeholders.186
7.3.3 Vehicles Barriers
NGV technologies are generally well-developed. Their lack of commercial deployment to date
stems from issues relating to performance, potential safety concerns, and higher vehicle costs.
The lack of available refueling infrastructure is also a barrier to the adoption of vehicles, but we
discussed this in the previous section as a fueling infrastructure barrier rather than as a
vehicles barrier.
184Johnston, “Breaking Down Renewable Natural Gas Injection Barriers,” 2014. 185Johnston, “Breaking Down Renewable Natural Gas Injection Barriers,” 2014. 186NGV Today, “Fugitive Methane Emissions Rising Policy Concern for the NGV Industry,” January 22, 2015; Samantha Caputo, Towards a Reduction in Methane Emissions from Natural Gas in California: A Policy Brief on the Short-Lived Climate Pollutant Strategy, master’s thesis, Worcester, Mass.: Clark University, May 2016.

209
7.3.3.1 Performance Limitations
NGVs are similar to conventional vehicles in terms of power and acceleration. However, because
of the lower energy density of CNG, along with the space requirements associated with high-
pressure gas storage systems, the range of NGVs is typically significantly shorter than that of
conventional vehicles. The use of LNG can allow for greater range in heavy-duty applications.187
There is also a loss of power when CNG is used in bifuel vehicles because of the smaller
effective displacement of the engine when using CNG.
7.3.3.2 Safety Concerns
The presence of high-pressure storage vessels on NGVs may also raise safety concerns, or at
least perceptions of safety issues, among potential consumers. It should be noted that there are
also safety concerns with gasoline, and it may be that NGVs are safer than gasoline vehicles.
7.3.3.3 Limited Available Models
Partly because natural gas has not yet achieved major commercial penetration, there are
relatively few models available for purchase. This also limits the prospects for adoption.
However, with recent declines in the price of natural gas, automakers are now beginning to
develop and market more models.
7.3.3.4 Higher Vehicle Cost
Incremental costs for NGVs relative to conventional vehicles may range from a couple of
thousand dollars for LDVs to as much as one hundred thousand dollars in some heavy-duty
applications. These incremental costs are partly the result of the high cost of CNG or LNG
storage vessels, along with the relatively low NGV production volumes.
However, natural gas has generally been cheaper than gasoline or diesel on an energy-
equivalent basis, resulting in an opportunity for net savings over the life of the vehicle. In
October 2011, for example, CNG retailed at $2.09/gasoline gallon equivalent (GGE) compared
with $3.46/gallon and $3.42/gallon for gasoline and diesel, respectively. However, this
difference has diminished significantly in recent years even as the price of natural gas has
fallen. In October 2016, CNG cost $2.06/GGE compared with gasoline and diesel, which cost
$2.22/gallon and $2.48/gallon, respectively.188 This near-parity in price is a barrier for many in
that it reduces the economic case for conversion to a natural gas fleet.
7.3.4 Barriers Identified in the Survey
Survey respondents identified a wide variety of barriers to the market viability of natural gas
and biomethane as a transportation fuel. Barriers identified by 91 awardees, unsuccessful
applicants, and potential applicants are shown in Figure 7.1. Each bar shows the percentage of
187 DoE, Energy Efficiency and Renewable Energy, “Alternative Fuels Data Center: Natural Gas Benefits and Considerations,” undated. 188 DoE, Energy Efficiency and Renewable Energy, “Alternative Fuels Data Center: Fuel Prices,” May 2017.

210
respondents that identified that barrier. Because respondents could select multiple barriers, the
percentages sum to greater than 100.
Respondents noted significant barriers in each of the market segment categories of vehicles,
fueling infrastructure, fuel production, and consumer. High vehicle production cost, the limited
number of vehicle models available, and insufficient fueling stations were the most commonly
cited barriers at 56 percent, 47 percent, and 43 percent, respectively. Of the eight respondents
who noted “other” barriers, three provided explanations, two of which cited high costs for
pipeline injection. In general, the most commonly cited barriers identified by survey
respondents agree with those in Table 7.1. One marked exception is the emphasis on
insufficient customer awareness in the survey, cited by about 41 percent of respondents.
Figure 7.1. Barriers to Market Viability of Natural Gas and Biomethane Cited in Survey Responses
SOURCE: RAND survey. NOTES: Based on 403 barriers cited by 91 respondents. Labe for the second green bar should read, “Difficult, cost, and delay in obtaining permits for siting fueling stations.” Label for first gray bar should read, “Insufficient customer awareness of and knowledge about alternative fuels and vehicles.” Label for second gray bar should read, “Insufficient pool of labor familiar with alternative fuels and vehicles.”
7.4 Review of CEC’s Solicitations and Awards in Natural Gas and Biomethane
Table 7.3 provides a chronological summary of the ARFVTP funding solicitations and awards in
the area of natural gas and biomethane. Note that several of the solicitations cover more than
just natural gas and biomethane.
8.8% 26.4%
40.7%
2.2%
5.5%
14.3%
17.6%
38.5%
11.0%
22.0%
28.6%
42.9%
4.4%
17.6%
22.0%
35.2%
47.3%
56.0%
0% 10% 20% 30% 40% 50% 60%
Other
Insufficient pool of labor familiar with alterna5ve fuels and
Insufficient customer awareness of and knowledge about
Poor emission profile of fuel
Insufficient in-‐use performance of fuel
Limited availability of feedstock for fuel produc5on
Limited fuel produc5on capacity
High fuel produc5on cost
Lack of industry standards for fueling/charging interface
Insufficient bulk fuel distribu5on infrastructure
Difficulty, cost, and delay in obtaining permits for si5ng
Insufficient retail fueling or charging infrastructure
Poor emission profile of vehicle
High vehicle life5me opera5ng and maintenance cost
Limited vehicle produc5on capacity
Inadequate vehicle performance
Limited number of vehicle models available
High vehicle produc5on cost
Percentage of respondents ci5ng barrier
Vehicle-‐related
Fueling infrastructure-‐related
Feedstock and fuel produc5on-‐related
Other

211
Table 7.3. Chronological Summary of Natural Gas and Biomethane Solicitations and Awards
Year Solicitation
Number Solicitation
Title Solicitation
Amountd Grant
Awards Interagency Agreements
and Contracts Total
Awards
2009
PON-08-010
American Recovery and Reinvestment Act of 2009 Cost Share
$43 M for methane
vehicles, fueling
stations, & production
plants
2 ($14.5 M)
18 ($50.7 M)
PON-09-003 Biomethane Production $21.5M 5a
($27.5 M)
PON-09-004
Medium- and Heavy-Duty Advanced Vehicle Technology
$9.5 M 2a ($3.9 M)
PON-09-006 Alternative and Renewable Fuel Infrastructure
$5.6 M for natural gas fueling stations
9c ($4.8 M)
2010 PON-09-604
Biofuel Production Plants
$14.9 M 4a ($7.8 M) 4
($7.8 M) PON-09-605 Manufacturing
Plants $19 M 0
2011
PON-10-603
Advanced Medium- and Heavy-Duty Vehicle Technologies Pre-Commercial Demonstrations
$8 M for nonelectric
vehicle technologies
1 ($4.6M)
2 ($23.5 M)
PON-10-604 CEC Vehicle Incentive Program 1
$18.9M for natural gas
vehicle incentives
Various ($18.9M)
2012
PON-11-601 Biofuels Production Facilities
$13.3M for biomethane 4a ($14.6M)
1 ($2 M for natural gas truck
demonstration)
46 ($29.3M)
PON-11-602
Alternative Fuels Infrastructure: Electric, Natural Gas, Propane, E85 & Diesel-Substitutes Terminals
$9.6 M for natural gas fueling stations
23b ($7 M)

212
Table 7.3—Continued
Year Solicitation
Number Solicitation
Title Solicitation
Amountd Grant
Awards Interagency Agreements and
Contracts Total
Awards
2012
PON-11-604
Advanced Vehicle Technology Manufacturing
$10 M 0
PON-12-605 Natural Gas Fueling Infrastructure
$2.6 M 18c ($5.7 M)
2013
PON-13-601
Commercial Scale Advanced Biofuels Production Facilities
$9.3 M 0 1
($10.2 M for natural gas vehicle incentives)
1 ($10.2 M)
PON-13-604
Federal Cost Share for Emerging Technologies
$2.2 M 0
2014
PON-13-610 CEC Vehicle Incentive Program 3
$21 M for natural gas vehicle incentives
Various ($21 M)
6 ($38.5 M)
PON-13-609
Pilot-Scale and Commercial-Scale Advanced Biofuels Production Facilities
$6 M for
biomethane
5a ($17.5 M)
Total 75 ($148 M)
2 ($12 M)
77 ($160 M)
SOURCE: CEC administrative data. a One project canceled before starting. b Four projects canceled before starting. c Two projects canceled before starting. d Several solicitations cover more than natural gas and biomethane. When specified in the solicitation, we note the amount allotted to natural gas and/or biomethane.
As of January 2015, 77 natural gas and biomethane projects have been funded by the ARFVTP,
for a total of $160 million. There have been an additional 98 unsuccessful applications for
methane projects (175 total applications less 77 successful applications). The projects are
grouped according to market segment in Figure 7.2. Sixty-five percent of projects relate to
fueling infrastructure, 23 percent relate to fuel production, and 12 percent relate to vehicles.
Funding levels for the different types of projects vary considerably, with an average of
$8.3 million for vehicle projects, $3.7 million for fuel-production projects, and $0.36 million for
fueling-infrastructure projects. The high award allocation to the vehicle projects is driven by
three large incentive program projects ($21 million, $19 million, and $10.2 million) that provide
incentives for purchases of NGVs.
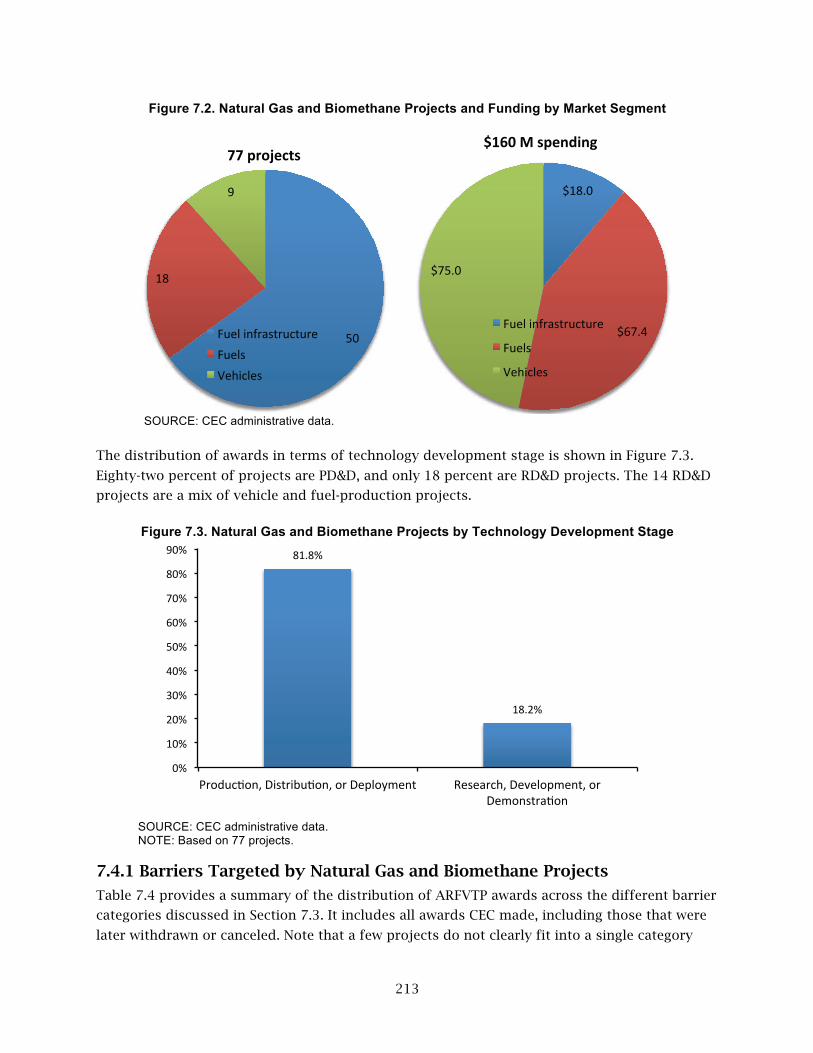
213
Figure 7.2. Natural Gas and Biomethane Projects and Funding by Market Segment
SOURCE: CEC administrative data.
The distribution of awards in terms of technology development stage is shown in Figure 7.3.
Eighty-two percent of projects are PD&D, and only 18 percent are RD&D projects. The 14 RD&D
projects are a mix of vehicle and fuel-production projects.
Figure 7.3. Natural Gas and Biomethane Projects by Technology Development Stage
SOURCE: CEC administrative data. NOTE: Based on 77 projects.
7.4.1 Barriers Targeted by Natural Gas and Biomethane Projects
Table 7.4 provides a summary of the distribution of ARFVTP awards across the different barrier
categories discussed in Section 7.3. It includes all awards CEC made, including those that were
later withdrawn or canceled. Note that a few projects do not clearly fit into a single category
50
18
9
77 projects
Fuel infrastructure Fuels Vehicles
$18.0
$67.4
$75.0
$160 M spending
Fuel infrastructure
Fuels
Vehicles
81.8%
18.2%
0%
10%
20%
30%
40%
50%
60%
70%
80%
90%
Produc5on, Distribu5on, or Deployment Research, Development, or Demonstra5on

214
because they include elements of more than one (e.g., one large vehicle project is also building
two fueling stations, three fuel-production projects are also converting vehicles or installing a
private fueling station, and two fueling infrastructure projects involve both CNG and LNG
stations). In these cases, the project is classified according to the principal objective of the
project according to the proposal and statement of work.
Table 7.4. Barriers Targeted
Market Segment
Primary Barrier Targeted Types of Projects Funded
Number of Projects Funded
Number of Funded Projects Canceled
Combined Amount of
Awards ($ M)
Feedstock and fuel production
Limited production capacity Feedstock acquisition, collection, and transportation Preference for using biogas for heat and power rather than for transportation
Anaerobic digestion development or enhancement 15 3 $53.2
Thermochemical biomethane production 2 0 $3.1
Landfill gas purification and liquefaction 1 1 $11.0
Subtotal 18a 4 $67.3
Fueling infrastructure
Limited number of fueling stations
Construction of 36 CNG stations, including two bio-CNG stations
29 5 $10.9
Construction of 6 LNG stations 4 1 $2.3
Construction of 1 CNG/LNG station 1 0 $0.6
Upgrade of 13 CNG stations 13 1 $3.3 Upgrade of 1 LNG station 1 0 $0.49 Upgrade of one CNG/LNG station 1 0 $0.1
CNG station (project details unknown) 1 1 $0.2
Subtotal 50b 8 $17.9
Vehicles
Safety concerns Limited vehicle models Higher cost than gasoline or diesel vehicle
Deploy 300+ heavy-duty CNG and LNG NGVs 2 0 $14.5
Higher cost than gasoline or diesel vehicle
NGV incentive programs to deploy an unspecified number of vehicles of unspecified class
3 0 $50.2
Performance limitations compared with gasoline or diesel vehicles Limited vehicle models
Develop, demonstrate, and help commercialize heavy-duty LNG and CNG engines
4 1 $10.4
Subtotal 9c 1 $75.1 Total 77 13 $160
SOURCE: CEC administrative data. a Eight projects are PD&D, and ten are RD&D. b All projects are PD&D. c Five projects are PD&D, and four are RD&D; two of the six LNG stations were developed as part of a much larger vehicle project, so the project and its award amount are not included in the tally here.
7.4.1.1 Projects Targeting Feedstock and Fuel-Production Barriers
As shown in Table 7.4, 15 projects entail building, expanding, or enhancing anaerobic digester
systems to generate biomethane for transportation. Using anaerobic digestion to produce

215
vehicle fuel entails procuring, collecting, and preprocessing feedstock, digesting feedstock to
produce biogas, cleaning or “upgrading” the biogas to biomethane by removing the carbon
dioxide and other nonmethane components, compressing or liquefying the biomethane, and
providing a vehicle fueling system. The scope and objectives of the anaerobic digester projects
span different aspects of this overall process. Seven of these are PD&D projects focused on
creating new production capacity, while eight are RD&D projects exploring improvements to
different process steps. Several of the projects are developing entirely new systems that include
all the steps. Three projects building new digesters were canceled before they got started.
Others are enhancing existing digester facilities to procure and process new types of
feedstocks, increase capacity, improve the digestion process, and/or develop new gas upgrading
systems. Two of the projects also include converting or buying vehicles to use the biomethane
fuel. As noted, biogas from anaerobic digesters and landfill has historically been used primarily
for energy and heat production. Most of the ARFVTP biomethane production projects use some
of the biogas for energy production prior to upgrading it to biomethane; one project is using all
the biogas for energy production and is producing no biomethane.
In most cases, the biomethane is used to fuel vehicle fleets that are operationally or
contractually linked to the producer (“tethered fleets”). A typical case is a waste-processing
facility using biomethane produced on-site to fuel its waste-hauling trucks. Using biomethane
with a tethered fleet does not require interconnecting with the natural gas pipeline grid. While
some project descriptions mention the possibility of injecting excess biomethane into the
pipeline, we are not aware of any biomethane being injected into the natural gas grid in
California.
Producing biomethane through anaerobic digestion is quite new, and these ARFVTP-funded
projects are the first in the state and among the first in the nation. The biomethane production
that did exist prior to these projects came primarily from landfill biogas. The ARFVTP-funded
biomethane production projects to date have created approximately 5 million diesel gallon
equivalents (DGEs) in new biomethane production capacity.
Two RD&D projects address thermochemical biomethane production from woody biomass,
such as urban wood waste and forest residues. One intended to use a gasification and
methanation approach to produce biomethane from urban wood waste. The project was later
modified to demonstrate the feasibility of producing syngas suitable for subsequent conversion
to liquid biofuels. The project has subsequently stalled as a result of dispute between the
awardee and a subcontractor. The other project was a demonstration effort that developed a
proprietary low-temperature thermochemical conversion process to produce biomethane from
forest wood residues.
Finally, one production project was slated to upgrade and liquefy landfill biogas to produce bio-
LNG to fuel 500 waste-hauling trucks. However, the awardee withdrew this project before it
started.

216
7.4.1.2 Projects Targeting Fueling Infrastructure Barriers
As shown in Table 7.4, the infrastructure awards CEC has made almost exclusively focused on
constructing new or upgrading existing CNG and LNG stations. The size of the infrastructure
network is the biggest barrier in this category, and these awards are intended to increase that
size. The 50 infrastructure awards totaling $17.9 million were to fund the construction of 41
new LNG or CNG fueling stations and upgrade 15 others. Five of the awards for constructing
CNG stations were later canceled, one award for upgrading a CNG station was later canceled,
and one award for constructing an LNG station was later canceled. (One additional CNG award
was canceled, but it is not known whether this award was to build or upgrade a station.) In
many cases, the upgrades are to expand the number of dispensers, thereby increasing fueling
capacity, even if the number of stations is not increased. In addition to the 50 infrastructure
awards, one vehicle award also included the objective of constructing two additional LNG
stations.
These awards necessarily involve technical design and safety considerations of the stations, but
based on the technical objectives, no station was designed specifically to target safety and
technical design barriers.
Two of the CNG station development awards are to develop fueling stations colocated with an
anaerobic digester to dispense bio-CNG. One facility generates bio-CNG from a biorefinery that
uses organic waste from the food industry to fuel local waste disposal and other local fleets.
Nevertheless, it does introduce another station and is the only public biomethane station of all
the awards. The other project, to develop a fueling station to complete a digester-to-pump
biomethane facility, was one of the three canceled CNG station projects.
7.4.1.3 Projects Targeting Vehicle Barriers
As shown in Table 7.4, CEC’s awards targeting vehicle barriers focus on the HDV market. CEC
made seven awards to demonstrate and deploy CNG and LNG vehicles in the HDV market. Two
of the awards, totaling $14.5 million, were to deploy, in total, upwards of 300 heavy-duty CNG
and LNG vehicles with the aim of building consumer awareness, understanding performance,
and improving operations and maintenance. One of these awards also included the construction
of two LNG stations.
The program also entered into a contract with the University of California, Irvine, to administer
an NGV incentive program for $10.2 million for individuals, firms, governmental agencies, and
other entities purchasing new NGVs for use in California. The vehicles must be new on-road
vehicles and can be LDVs, medium-duty vehicles (MDVs), or HDVs, but not transit buses. The
amount of the incentive depends on the class of the vehicle. The program requires that vehicles
must be purchased on or after August 7, 2015, and must be registered and operated on natural
gas in California (at least 90 percent of the time) for at least three years.
The program itself further administered two NGV incentive programs, with a total approved
funding allocation of $39.9 million. PON-10-604 and PON-13-610 each involved various awards
to provide buy-down incentives for specific classes of natural gas and propane vehicles at

217
varying levels, depending on vehicle class. The incentives are intended to reduce the purchase
price of natural gas and propane vehicles and are available to original equipment
manufacturers (OEMs). These incentive programs ultimately spent $29.5 million to provide
incentive funding for 1,734 vehicles.
The other four vehicle awards, totaling $8.4 million, were to develop, demonstrate, and help
commercialize HDV engines, with the aim of improving consumer awareness, reducing cost,
increasing the number of vehicle models, and improving vehicle performance. One of these
awards was later canceled.
Collectively, these projects target nearly all the barriers associated with vehicles: performance
limitations, cost, and vehicle models. Safety concerns are likely implicitly addressed in the
engineering design and deployment but are not specifically outlined in the technical objectives.
7.5 Awardee Performance
7.5.1 Project Status
The status as of September 2016 of the 77 projects funded as of January 2015 is shown in
Figure 7.4. Approximately 44 percent have been completed, 17 percent have been withdrawn or
canceled, and 39 percent are still ongoing.
Of the 13 canceled or withdrawn projects, eight gave at least one reason for the cancellation or
withdrawal; three reported cancellation because of the inability to secure matching funds; four
reported that they could not come to an agreement with study partners or subcontractors on
the scope of work; and two reported other unspecified reasons.
Figure 7.4. Natural Gas and Biomethane Project Status as of September 2016
SOURCE: RAND survey. NOTE: Based on 77 projects.
39.0%
44.2%
16.9%
0%
5%
10%
15%
20%
25%
30%
35%
40%
45%
50%
Ongoing Completed Cancelled/terminated

218
7.5.2 Technical Performance
Figures 7.5 and 7.6 show the extent to which technical objectives have been met as judged by
RAND staff and as subsequently revised or clarified by awardees through the survey. As noted
in Figure 7.5, awardees noted that the vast majority (82 percent) of technical objectives in
completed projects had been achieved fully. Eleven percent were partially achieved, and 6
percent were minimally achieved. This is similar to RAND’s assessment of technical objectives,
except that RAND staff could not make a determination on 41 percent of objectives, largely
because there were too few project reports or missing final reports to make determinations.
Respondents subsequently noted that nearly all the objectives that were in the “unknown”
category according RAND’s assessment were fully achieved. This indicates that natural gas and
biomethane awards are largely meeting their technical objectives.
Figure 7.5. Extent to Which Technical Objectives for Completed Natural Gas and Biomethane Projects Have Been Met
SOURCE: Authors’ analysis and RAND survey. NOTE: For 104 technical objectives from 33 projects that had been completed by the time of the survey.
Figure 7.6 shows analogous results for ongoing projects. The results show that 24 percent of
technical objectives in ongoing projects have already been met, while 56 percent are in
progress. A much smaller fraction of objectives are partially or minimally achieved, not yet
started, or modified or dropped. This is consistent with RAND’s assessment, except that RAND
was again unable to make determinations for 34 percent of objectives because of the limited
availability of progress reports and other documentation. Survey responses generally indicate
these objectives either were achieved or are in progress.
5% 9%
45% 41%
6% 11%
82%
2% 0% 10% 20% 30% 40% 50% 60% 70% 80% 90%
Minimally Par5ally Fully Unknown
RAND evalua5on As updated by awardees

219
Figure 7.6. Extent to Which Technical Objectives Have Been Achieved for Ongoing Natural Gas and Biomethane Projects
SOURCE: RAND review of technical objectives from project documents and RAND survey responses. NOTE: RAND assessment based on 95 objectives from 28 ongoing projects. Awardee assessment based on 89 objectives from 25 projects that responded to survey plus six objectives from three projects carried over from RAND assessment.
Figure 7.7 shows respondents’ estimates of how likely in-progress objectives for ongoing
projects will be met. Respondents noted that 88 percent of technical objectives are highly likely
to be met, and 7 percent are somewhat likely to be met.
Figure 7.7. Likelihood That In-Progress Technical Objectives for Ongoing Natural Gas and Biomethane Projects Will Be Met
SOURCE: RAND survey. NOTE: For 56 technical objectives from 21 ongoing projects.
11.58%
1.05% 1.05%
38.95%
13.68%
0.00%
33.68%
24.21%
1.05% 1.05%
55.79%
6.32% 8.42%
3.16%
0%
10%
20%
30%
40%
50%
60%
Fully Par5ally Minimally In-‐progress Not-‐yet-‐started Modified or dropped
Unknown
RAND
Awardee
0% 4% 2% 7%
88%
0% 0% 10% 20% 30% 40% 50% 60% 70% 80% 90% 100%
Highly unlikely Somewhat unlikely
Just as likely as unlikely
Somewhat likely Highly likely No answer

220
7.5.3 Financial Performance
Most ARFVTP awards require the awardee to fund at least 50 percent of the project through
match funding. Proposals must disclose the source and provide verification and documentation
for the matching funds.
The extent to which projects were able to raise the amount of match funding originally
proposed is shown in Figure 7.8. Projects were generally successful in doing this. There is no
obvious distinction in terms of project characteristics (e.g., status, size, market segment, RD&D
vs. PD&D) that distinguishes those that did and did not achieve their match goal.
Figure 7.8. Success in Obtaining Matching Funds
SOURCE: CEC administrative data and RAND survey. NOTE: For projects with match fund target greater than $0 and a survey response. Excludes canceled projects.
7.5.4 Schedule Performance
Figure 7.9 shows the CEC Commission Agreement Manager (CAM) assessments of schedule
performance for natural gas and biomethane projects as updated or corrected by awardees
through the survey. In general, awardees’ survey responses agreed well with the CAM estimates.
About 62 percent of completed projects were on time or ahead of schedule, 36 percent were
one to 12 months behind schedule, and 3 percent were more than one year behind. More of the
ongoing projects are behind schedule, with only 33 percent on or ahead of schedule, and 63
percent running behind.
68%
14% 18%
71%
19% 10%
0% 10% 20% 30% 40% 50% 60% 70% 80%
Obtained proposed matching funds Have not obtained proposed matching funds
No response
22 completed projects 21 ongoing projects

221
Figure 7.9. Schedule Performance of Natural Gas and Biomethane Projects
SOURCE: CAM reports of schedule performance as updated by RAND survey responses. NOTE: Based on 34 completed and 30 ongoing projects.
Figure 7.10 shows the reasons for delay among completed and ongoing projects that experience
delays. Each bar shows the percentage of projects that are behind schedule that cite that
reason. The largest sources of delay in completed projects relate to delays in obtaining permits
(43 percent), competition from other projects, and unexpected problems with the technology
(25 percent each). Among ongoing projects (data not shown), permitting was still a large share
of the reason for delay (36 percent), but technology problems were reported far less often
(14 percent), which could hint at a growing technological maturity. Around 46 percent of
respondents for completed projects reported other reasons for delays, but there was no
discernable common theme among those reasons.
11.8%
50.0%
11.8%
23.5%
2.9% 0.0% 0.0%
3.3%
30.0%
20.0%
10.0%
26.7%
6.7%
3.3%
0%
10%
20%
30%
40%
50%
60%
Ahead of schedule
On schedule About 1 to 6 months behind
schedule
About 7 to 12 months behind
schedule
About 13 to 24 months behind
schedule
About 25 months or more behind
schedule
Not specified
Completed
Ongoing

222
Figure 7.10. Reasons for Schedule Delays
SOURCE: RAND survey. NOTES: Based on 28 delayed projects. Label on second bar should read, “Competition for time and resources from other ongoing projects in your company.”
7.6 Impacts on Awardee
One of the topics the survey explored is how unsuccessful applicants have proceeded and how
successful applicants would have proceeded with the project had they not received ARFVTP
funding. The responses (Figures 7.11 and 7.12) indicate that while many unsuccessful
applicants (37 percent) have proceeded with the project, more (53 percent) have not. When
successful applicants were asked whether they would have conducted the project had they not
been funded, 28 percent said yes, 32 percent said no, and 38 percent were uncertain.
Figure 7.11. Whether Unsuccessful Applicants for Natural Gas and Biomethane Projects Proceeded with Project
SOURCE: RAND survey. NOTE: Based on 35 unsuccessful applicants.
46.4%
3.6%
7.1%
7.1%
7.1%
7.1%
10.7%
14.3%
25.0%
25.0%
42.9%
0% 5% 10% 15% 20% 25% 30% 35% 40% 45% 50%
Other
CEC did not pay invoices in a 5mely manner
CEC did not provide approvals in a 5mely manner
Hesita5on or reluctance about the project from site owner
Took longer than expected to hire essen5al staff
Took longer than expected to secure matching funds
Needed to change project loca5on
Esssen5al staff leg the company
Unexpected problems with the technology arose
Compe55on for 5me and resources from other ongoing
Delay in gecng required permits
Percentage of projects ci5ng reason
13%
24%
53%
10%
0%
10%
20%
30%
40%
50%
60%
Your organiza5on proceeded with a similar project within a year
Your organiza5on proceeded with a similar project 1 to 3 years later
Your organiza5on has not proceeded with the
project
Did not answer

223
Figure 7.12. Whether Successful Applicants for Natural Gas and Biomethane Projects Would Have Proceeded with Project
SOURCE: RAND survey. NOTE: Based on 53 noncanceled projects.
The extent to which ARFVTP funding helped the knowledge and capabilities of organizations
that it funded was another set of questions explored. A series of three related questions asked
project awardees about the extent to which ARFVTP funding allowed them to pursue work in
areas related to and unrelated to the funded project (Figure 7.13). Responses indicate that the
funding was generally viewed as being very beneficial to increasing and expanding the
capabilities of the recipient organizations.
11% 17%
38% 32%
2%
0% 5% 10% 15% 20% 25% 30% 35% 40%
Your organiza5on would have
proceeded within a year
Your organiza5on would have
proceeded 1 to 3 years later
Your organiza5on might have proceeded at some point in the future but you don't
know for sure
Your organiza5on would not have
proceeded with the project for the
foreseeable future
Did not answer
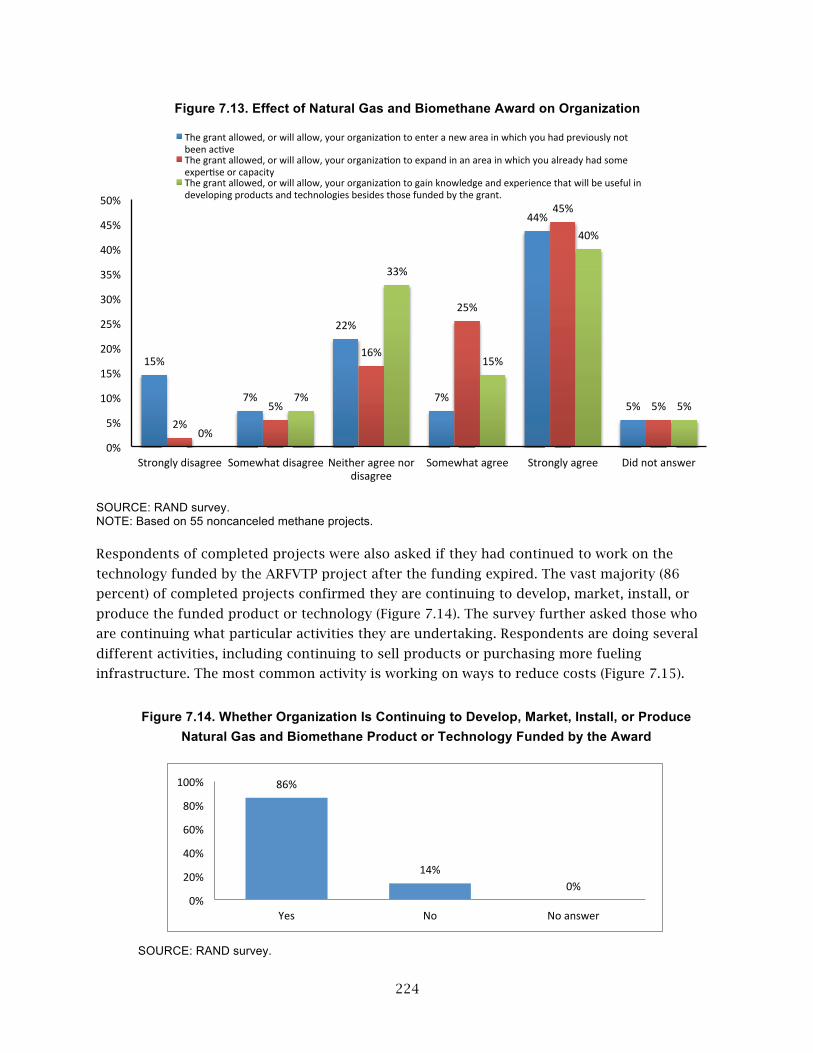
224
Figure 7.13. Effect of Natural Gas and Biomethane Award on Organization
SOURCE: RAND survey. NOTE: Based on 55 noncanceled methane projects. Respondents of completed projects were also asked if they had continued to work on the
technology funded by the ARFVTP project after the funding expired. The vast majority (86
percent) of completed projects confirmed they are continuing to develop, market, install, or
produce the funded product or technology (Figure 7.14). The survey further asked those who
are continuing what particular activities they are undertaking. Respondents are doing several
different activities, including continuing to sell products or purchasing more fueling
infrastructure. The most common activity is working on ways to reduce costs (Figure 7.15).
Figure 7.14. Whether Organization Is Continuing to Develop, Market, Install, or Produce
Natural Gas and Biomethane Product or Technology Funded by the Award
SOURCE: RAND survey.
15%
7%
22%
7%
44%
5% 2%
5%
16%
25%
45%
5%
0%
7%
33%
15%
40%
5%
0%
5%
10%
15%
20%
25%
30%
35%
40%
45%
50%
Strongly disagree Somewhat disagree Neither agree nor disagree
Somewhat agree Strongly agree Did not answer
The grant allowed, or will allow, your organiza5on to enter a new area in which you had previously not been ac5ve The grant allowed, or will allow, your organiza5on to expand in an area in which you already had some exper5se or capacity The grant allowed, or will allow, your organiza5on to gain knowledge and experience that will be useful in developing products and technologies besides those funded by the grant.
86%
14% 0%
0%
20%
40%
60%
80%
100%
Yes No No answer
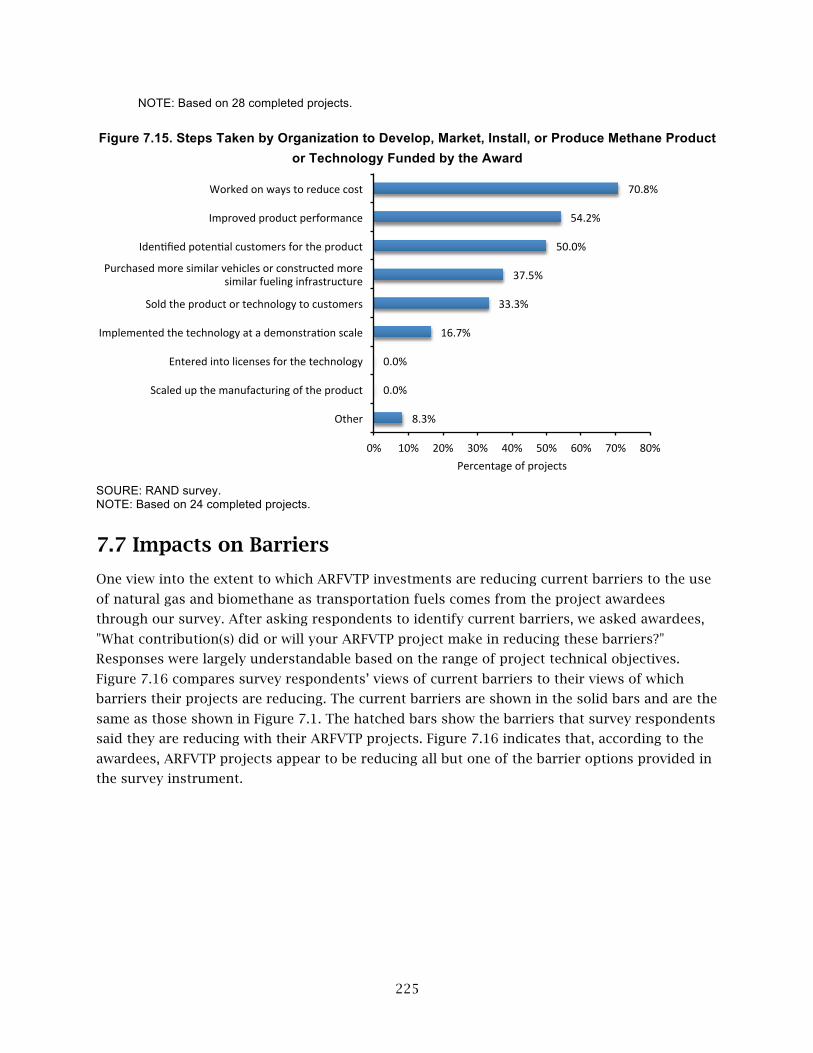
225
NOTE: Based on 28 completed projects.
Figure 7.15. Steps Taken by Organization to Develop, Market, Install, or Produce Methane Product or Technology Funded by the Award
SOURE: RAND survey. NOTE: Based on 24 completed projects.
7.7 Impacts on Barriers
One view into the extent to which ARFVTP investments are reducing current barriers to the use
of natural gas and biomethane as transportation fuels comes from the project awardees
through our survey. After asking respondents to identify current barriers, we asked awardees,
"What contribution(s) did or will your ARFVTP project make in reducing these barriers?"
Responses were largely understandable based on the range of project technical objectives.
Figure 7.16 compares survey respondents’ views of current barriers to their views of which
barriers their projects are reducing. The current barriers are shown in the solid bars and are the
same as those shown in Figure 7.1. The hatched bars show the barriers that survey respondents
said they are reducing with their ARFVTP projects. Figure 7.16 indicates that, according to the
awardees, ARFVTP projects appear to be reducing all but one of the barrier options provided in
the survey instrument.
70.8%
54.2%
50.0%
37.5%
33.3%
16.7%
0.0%
0.0%
8.3%
0% 10% 20% 30% 40% 50% 60% 70% 80%
Worked on ways to reduce cost
Improved product performance
Iden5fied poten5al customers for the product
Purchased more similar vehicles or constructed more similar fueling infrastructure
Sold the product or technology to customers
Implemented the technology at a demonstra5on scale
Entered into licenses for the technology
Scaled up the manufacturing of the product
Other
Percentage of projects

226
Figure 7.16. Assessment of Methane Barriers Being Reduced by Methane Projects
SOURCE: RAND survey. NOTE: Current barriers based on 91 respondents; barriers reduced based on 48 respondents. Awardees were asked only whether their projects reduced a barrier, not by how much. Thus, the
relative lengths of the bars for the barriers being reduced do not indicate that the awardees
have reduced or will reduce one barrier more or less than another. In addition, given that the
respondents indicated that projects are reducing essentially every barrier listed, it appears that
some survey respondents may have thought “reducing” barriers meant the same thing as
“targeting” barriers. Or perhaps their optimism led them to believe that if their projects
targeted a barrier, it would reduce the barrier. As a result, we are reluctant to place too much
credence in the survey respondents’ perceptions of barriers being reduced.
We further assess the impact of the ARFVTP on barriers by examining how indicators of the
natural gas and biomethane market in California have changed since 2009 (when the first
ARFVTP projects began) and discuss the extent to which the changes can be attributed to the
ARFVTP. As noted in previous chapters, these assessments are subject to three limitations
discussed in Chapter 1. First, clearly attributing market changes to the ARFVTP is challenging
because it is impossible to unequivocally determine what would have happened in the market
without the ARFVTP. Second, given the wide range in types of barriers and what is involved in
4.2%
22.9%
45.8%
18.8%
0.0%
12.5%
31.3%
45.8%
18.8%
22.9%
10.4%
50.0%
25.0%
12.5%
10.4%
27.1%
12.5%
29.2%
8.8%
26.4%
40.7%
2.2%
5.5%
14.3%
17.6%
38.5%
11.0%
22.0%
28.6%
42.9%
4.4%
17.6%
22.0%
35.2%
47.3%
56.0%
0% 10% 20% 30% 40% 50% 60%
Other
Insufficient pool of labor familiar with alterna5ve fuels and vehicles
Insufficient customer awareness of and knowledge about alterna5ve fuels and vehicles
Poor emission profile of fuel
Insufficient in-‐use performance of fuel
Limited availability of feedstock for fuel produc5on
Limited fuel produc5on capacity
High fuel produc5on cost
Lack of industry standards for fueling/charging interface
Insufficient bulk fuel distribu5on infrastructure
Difficulty, cost, and delay in obtaining permits for si5ng fueling/charging sta5ons
Insufficient retail fueling or charging infrastructure
Poor emission profile of vehicle
High vehicle life5me opera5ng and maintenance cost
Limited vehicle produc5on capacity
Inadequate vehicle performance
Limited number of vehicle models available
High vehicle produc5on cost
Vehicle-‐related Fueling infrastructure-‐related Feedstock and fuel produc5on-‐related Other
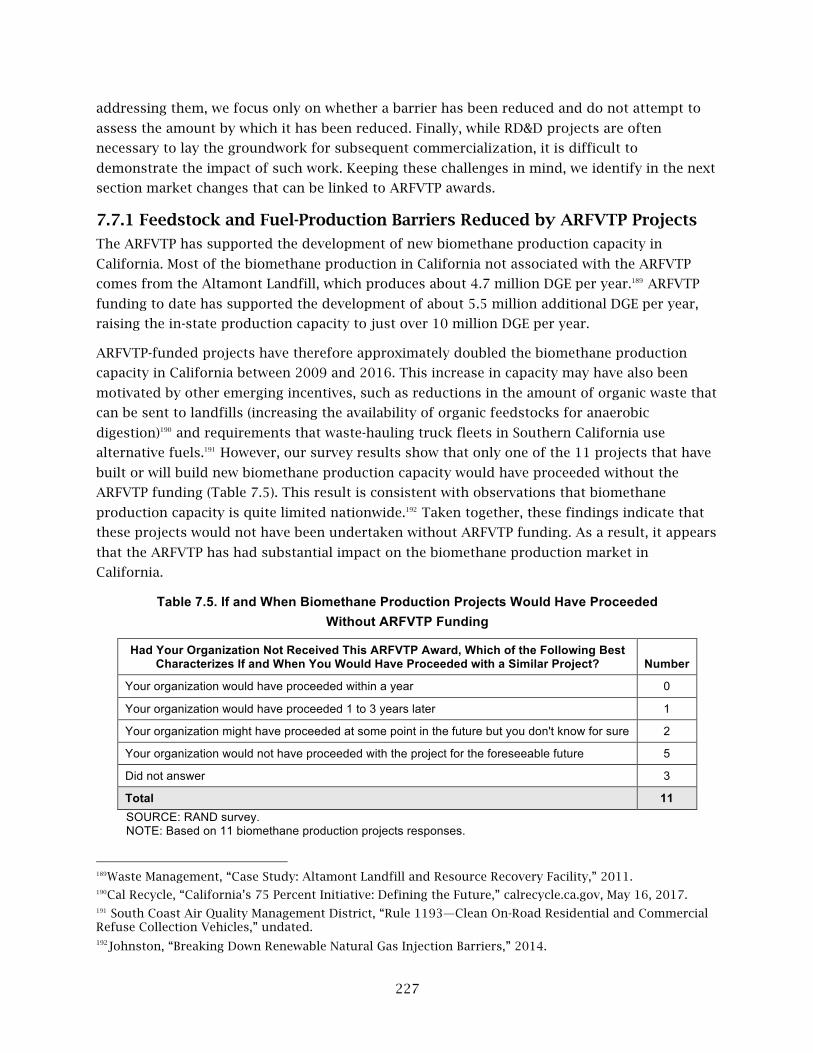
227
addressing them, we focus only on whether a barrier has been reduced and do not attempt to
assess the amount by which it has been reduced. Finally, while RD&D projects are often
necessary to lay the groundwork for subsequent commercialization, it is difficult to
demonstrate the impact of such work. Keeping these challenges in mind, we identify in the next
section market changes that can be linked to ARFVTP awards.
7.7.1 Feedstock and Fuel-Production Barriers Reduced by ARFVTP Projects
The ARFVTP has supported the development of new biomethane production capacity in
California. Most of the biomethane production in California not associated with the ARFVTP
comes from the Altamont Landfill, which produces about 4.7 million DGE per year.189 ARFVTP
funding to date has supported the development of about 5.5 million additional DGE per year,
raising the in-state production capacity to just over 10 million DGE per year.
ARFVTP-funded projects have therefore approximately doubled the biomethane production
capacity in California between 2009 and 2016. This increase in capacity may have also been
motivated by other emerging incentives, such as reductions in the amount of organic waste that
can be sent to landfills (increasing the availability of organic feedstocks for anaerobic
digestion)190 and requirements that waste-hauling truck fleets in Southern California use
alternative fuels.191 However, our survey results show that only one of the 11 projects that have
built or will build new biomethane production capacity would have proceeded without the
ARFVTP funding (Table 7.5). This result is consistent with observations that biomethane
production capacity is quite limited nationwide.192 Taken together, these findings indicate that
these projects would not have been undertaken without ARFVTP funding. As a result, it appears
that the ARFVTP has had substantial impact on the biomethane production market in
California.
Table 7.5. If and When Biomethane Production Projects Would Have Proceeded Without ARFVTP Funding
Had Your Organization Not Received This ARFVTP Award, Which of the Following Best Characterizes If and When You Would Have Proceeded with a Similar Project? Number
Your organization would have proceeded within a year 0
Your organization would have proceeded 1 to 3 years later 1
Your organization might have proceeded at some point in the future but you don't know for sure 2
Your organization would not have proceeded with the project for the foreseeable future 5
Did not answer 3
Total 11 SOURCE: RAND survey. NOTE: Based on 11 biomethane production projects responses.
189Waste Management, “Case Study: Altamont Landfill and Resource Recovery Facility,” 2011. 190Cal Recycle, “California’s 75 Percent Initiative: Defining the Future,” calrecycle.ca.gov, May 16, 2017. 191 South Coast Air Quality Management District, “Rule 1193—Clean On-Road Residential and Commercial Refuse Collection Vehicles,” undated. 192Johnston, “Breaking Down Renewable Natural Gas Injection Barriers,” 2014.

228
Actual production from ARFVTP projects is unknown, but it is likely less than 100 percent of
planned capacity. Several of the digesters are still under development. In addition, based on in-
depth project reviews, we know that at least one completed project is not currently producing
because business is very slow, and there is little demand for vehicle fuel. And, as noted, another
project has been stalled because of contractor disputes and has thus far failed to begin building
the proposed production facility.
Note that CARB reports that compressed and liquefied biomethane use in California has
increased from about 1.5 million DGE in 2011 to over 68 million–DGE in 2015. At the same
time, the use of fossil natural gas increased much more slowly and actually decreased in 2015,
such that the biomethane share of all methane transportation fuel used in California has risen
from just 2 percent in 2011 to 50 percent in 2015.193 This suggests that in-state production
(approximately 10 million DGE per year) is only about 15 percent of total consumption.
However, such a conclusion would be incorrect, because the 68 million–DGE value does not
actually reflect use in California. Biomethane producers around the country that inject their
product into the pipeline receive LCFS credits from CARB, which they can then sell to other fuel
producers that sell fuel in California to allow them to meet their LCFS requirements. In this
way, California supported the production of 68 million DGE of biomethane nationwide in 2015,
but actual consumption in California from the pipeline still has only trace amounts of
biomethane compared with natural gas. Further, biomethane supplied from the approximately
10 million DGE–per–year in-state production capacity from nonpipeline sources described
earlier does not qualify for LCFS credit and so is not included in the CARB value, despite being
the actual amount of biomethane used in California.
7.7.2 Fueling Infrastructure Barriers Reduced by ARFVTP Projects
CEC’s investments have helped increase the natural gas refueling infrastructure in the state.
There were six public LNG retail stations operating in California by 2008. One to two LNG
stations were added each year until 2014, when three stations were added that year and the
next. Currently, there are 17 LNG stations open to the public in California, and one additional
public LNG station is planned, for an increase of 12 public stations since 2008 (Figure 7.17).194
As of January 2015, CEC funded the development or upgrade of nine LNG stations.195 Of these,
five are new public stations that represent 42 percent of the 12 new public stations that have
been built or planned since 2008, when ARFVTP support began. Moreover, this may be an
underestimate, because the data on the total number of stations are current as of March 2017,
while the data on CEC-funded stations are current only through January 2015. The program
funded fewer private LNG stations. There are 27 open or planned private stations in California,
and only two have been supported by CEC.
193ARB, “Data Dashboard,” 2017. 194 DoE, “Alternative Fuels Data Center: Natural Gas Fueling Station Locations,” undated. 195This total includes two CNG/LNG stations and two LNG stations developed as part of vehicle deployment projects.

229
Figure 7.17. Number of Public LNG Stations in California, by Year
SOURCE: DoE, “Alternative Fuels Data Center: Natural Gas Fueling Station Locations,” undated.
There were 105 public CNG retail stations operating in California by 2008. The largest increase
in stations occurred between 2008 and 2009, when 15 new stations opened. Since 2009,
between four and 13 stations opened each year. These stations are spread fairly evenly
throughout Northern and Southern California, although there are fewer stations north of
Sacramento.196 Currently, there are 173 public CNG stations in California, and an additional 17
are planned, for an increase of 85 stations since 2008 (data shown to 2015 in Figure 7.18).
There are 144 private CNG stations, and an additional ten private stations are planned (data not
shown).
As of January 2015, CEC funded the development of 19 new public CNG stations, 19 new
private stations, and the upgrade of seven stations. The 19 new public stations represent 22
percent of the 85 opened or planned stations since 2008. As with LNG stations, this may be an
underestimate of the actual fraction of CEC-supported stations given the differences in timing
of data. The program funded a smaller fraction of private CNG stations. The 19 CEC-supported
private stations make up only 12 percent of the private stations open or planned in California
since 2008. Many of the CEC-funded private stations support government fleets or school bus
fleets.
196 DoE, “Alternative Fuels Data Center: Natural Gas Fueling Station Locations,” undated.
6
7
8 8
9
11
14
17
0
2
4
6
8
10
12
14
16
18
2008 2009 2010 2011 2012 2013 2014 2015
Number of Stations

230
Figure 7.18. Number of Public CNG Stations in California, by Year
SOURCE: DoE, “Alternative Fuels Data Center: Natural Gas Fueling Station Locations,” undated.
These data show that CEC has supported a significant fraction of the public natural gas stations
in California. Further, as shown in Table 7.6, only 15 percent of the awardees developing public
stations reported that they would have proceeded with the project without the award, whereas
75 percent reported they were not sure or would not have proceeded in the future. This
suggests that CEC funding was necessary for the development of these stations.
The ARFVTP has focused less on private stations. Interestingly, a higher fraction of private than
public station awardees indicated that they would have proceeded even without the award (35
percent) (Table 7.6), possibly consistent with a lesser need for ARFVTP funding.
Table 7.6. Awardee-Reported Likelihood of Project Continuation Without ARFVTP Support
Had Your Organization Not Received This ARFVTP Award, Which of the Following Best Characterizes If and When You Would Have Proceeded with a Similar Project?
Public Stations
(%)
Private Stations
(%) Your organization would have proceeded within a year 10 20 Your organization would have proceeded 1–3 years later 5 15 Your organization might have proceeded at some point in the future but you don't know for sure 35 40 Your organization would not have proceeded with the project for the foreseeable future 40 20 No response 10 5 SOURCE: RAND survey. NOTE: Based on 20 projects to install public stations and 20 projects to install private stations. Excludes eight canceled or terminated projects and two projects to install semiprivate stations.
105
120124
130135
144
155
168
0
20
40
60
80
100
120
140
160
180
2008 2009 2010 2011 2012 2013 2014 2015
Number of Stations

231
7.7.3 Vehicle Barriers Reduced by ARFVTP Projects
The ARFVTP has had some impact on the number of vehicle models available. The program has
funded the development of four HDV engines in three awards (with one additional award made
but withdrawn before the project began):
• the Cummings Westport ISX 12G 11.9L engine, which is complete and on the market
• the Cummings Westport ISL G 8.9L near–zero emissions engine, which is complete and
on the market
• a Cummings Westport 12L near-zero engine, which is still under development and not
yet on the market
• a natural gas version of the Navistar MaxxForce 13L engine, which is still under
development and not yet on the market.
These efforts have helped increase the number of heavy-duty NGV models on the market. There
are approximately 23 total engines on the natural gas mid- and heavy-duty market.197 The two
CEC-funded engines on the market—the CW ISX 12G and the ISL G—have a measurable
presence: Of the 76 models of NGVs with heavy-duty powertrains, 15 (20 percent) offer the ISX
12G and six (8 percent) use the CW ISL G. In addition, the ISX 12G engine model is one of only
two available for tractors and is offered in five of the 11 tractor models.
The ISL G near-zero engine also increases the environmental performance of NGVs. Whereas the
current EPA nitrous oxide (NOx) limit is 0.2 grams per brake horsepower-hour (g/bhp-hr), this
vehicle has a “near-zero” emissions level certified at 0.02 g/bhp-hr NOx, a reduction of 90
percent. The awardee for this engine clearly indicated that the project would not have been
undertaken in the foreseeable future without CEC funding, because there is no regulatory
mandate (and therefore little market) for an ultra–low emission engine. However, this award
makes such an engine available as a solution if a stricter standard is implemented in the future.
Other awardees did not respond about whether their project would have proceeded without
ARFVTP funding. Given the lack of data, it is difficult to determine whether CEC funding was
necessary for the development of all these engine models, and it is not clear whether other
alternative engine models would have been developed in the absence of these projects.
ARFVTP awards also helped increase the knowledge and acceptance of NGVs and reduced the
cost to owners and operators of using them. Two projects deployed approximately 330 heavy-
duty NGVs among a variety of users. These projects increased consumer familiarity and
acceptance of NGVs, grew the workforce familiar with the technology, and improved knowledge
about the operations and maintenance cost of NGVs. It is not clear whether consumers would
have gained this knowledge without the awards, because awardees’ responses are mixed on
whether they would have undertaken the projects without CEC support.
197 DoE, U.S. Department of Energy, Energy Efficiency and Renewable Energy, “Alternative Fuels Data Center: Alternative Fuel and Advanced Vehicle Search,” undated.

232
ARFVTP also helped encourage the adoption of NGVs through three incentive programs. The
Natural Gas Vehicle Incentive Program (NGVIP), administered by the University of California,
Irvine, provided up to $10.2 million to purchases to apply toward the cost of NGVs. Table 7.7
shows the incentive amount and approved incentives by vehicle weight. The program reports
providing 453 incentives in total across all vehicle classes (the bottom row of Table 7.7), with 71
percent of those incentives going to heavy-duty class 8 vehicles (i.e., with a gross vehicle weight
rating of at least 33,001). In total, $9 million in incentives have been confirmed, at
approximately $20,000 per vehicle.198
The CEC’s 2017–2018 Investment Plan Update provides information on the other two incentive
programs—PON-10-604 and PON-13-610—which offered buy-down incentives to OEMs to
reduce the purchase price of NGVs. (PON-10-604 also offered incentives for propane vehicles,
which are not shown and which were discontinued later in the program.) Together, these two
programs provided incentives to a little more than 1,700 vehicles (the bottom row of Table 7.7),
approximately one-half of which had a gross vehicle weight above 26,000 pounds (vehicle class
7 or 8).
In sum, these three incentive programs and the two deployment programs helped put
approximately 2,500 NGVs on the roads, most of which were MDVs and HDVs. Focusing on
these vehicles may be appropriate because, while they make up a small fraction of vehicles on
the road, they account for a disproportionate amount of emissions. Thus, replacing these
vehicles may be an efficient way to achieve reductions in GHG and other emissions.
Table 7.7. Incentive Amounts, by Vehicle Weight, for Different Incentive Programs
Gross Vehicle Weight (GVW)
(lbs.) Incentive
Amount ($)
PON-10-604 Vehicles and Amounts (Reflects
All Approved Incentives)
PON-13-610 Vehicles and Amounts (Reflects
Approved and Reserved Incentives)
NGVIP Vehicles and Amounts (Reflects
Approved Incentives)
Up to 8,500 $1,000 117 ($0.1 M) 4 ($0.004 M)
$3,000 245 ($0.7 M)
8,501–16,000 $6,000 154 ($0.9 M) 79 ($0.474 M)
8,501–14,000 $8,000 137 ($1.1 M)
16,001–26,000 $11,000 71 ($0.8 M) 46 ($0.506 M)
14,001–26,000 $20,000 211 ($4.2 M)
26,001–33,000 $20,000 0 ($0 M) 4 ($0.08 M)
33,000+ $25,000 353 ($8.8 M) 320 ($8 M)
26,001+ $32,000 445 ($12.9 M)
Total 1,038 ($18.9 M) 695 ($10.6 M) 453 ($9 M) SOURCE: PON-10-604, PON-13-610, and NGVIP application manuals (see State of California Energy Commission and the University of California, Irvine, Application Manual: Natural Gas Vehicle Incentive Project (NGVIP), August 3, 2015).
198Institute of Transportation Studies, University of California, Irvine, “Natural Gas Vehicle Incentive Funding Status,” 2015.

233
The CEC’s 2015 natural gas roadmap notes that there were approximately 24,600 NGVs
registered in California by the end of 2013. Approximately 50 percent (11,776 vehicles) were
LDVs in class 1–3, 40 percent (9,794 vehicles) were heavy-duty class 8 vehicles, and the
remaining 10 percent were class 4–7. This does not include undocumented aftermarket
conversions.199
This suggests that the HDVs deployed through these incentive programs, in particular, make up
a significant fraction of the total of such vehicles registered in the state. (It is difficult to
provide a precise proportion because it is not clear how many of these incentives were made
available before 2013 and how many after, and because the PON-10-604 data do not distinguish
between class 7 (GVW 26,001–33,000) and class 8 vehicles [GVW 33,000+]).
The fact that many vehicles were purchased without incentives suggests that there is an
existing market for NGVs. Some of the ARFVTP vehicle purchases might have occurred without
the program, although no doubt many would not have, particularly as the gap between the cost
of natural gas and diesel/gasoline has shrunk, as previously noted.
7.8 State of the Industry
The survey asked respondents to comment on the state of the industry and the changes in the
industry over the past five years, in terms of both competition and private-sector investment.
In terms of competition (Figure 7.19), 44 percent of respondents strongly agree or somewhat
agree that there are many organizations competing with them, and only 20 percent somewhat
disagree or strongly disagree with this statement. Views about whether the number of
competing organizations has increased over the past five years were similarly distributed.
199CEC, DRAFT REVIEW COPY–2015 Natural Gas Vehicle Research Roadmap, undated.

234
Figure 7.19. State of the Natural Gas and Biomethane Industry in Terms of Competition
SOURCE: RAND survey. NOTE: For 98 survey respondents. As for the extent to which respondents believe there are many private investors in their
industry, most respondents declined to weigh in (Figure 7.20). There is a slight preference
toward there being many private investors; overall, the sense is that this is not an active area of
investment but that neither is it particularly lacking in investment, and that this situation has
not changed dramatically over the past five years.
7%
13%
28%
24%
20%
7% 5%
15%
22%
28%
22%
7%
0%
5%
10%
15%
20%
25%
30%
Strongly disagree
Somewhat disagree
Neither agree or disagree
Somewhat agree
Strongly agree
Did not answer
Currently there are many organiza5ons compe5ng with your organiza5on in the development/deployment of alterna5ve fuels or vehicles
Compared to five years ago, the number of organiza5ons compe5ng with your organiza5on has increased

235
Figure 7.20. State of Natural Gas and Biomethane Industry and Changes in Industry over Past Five Years, in Terms of Private-Sector Investment
SOURCE: RAND survey. NOTE: For 98 survey respondents. Taken together, these responses indicate that the methane industry has a reasonable amount of
competition and that it has been increasing over time, but that there is only modest interest
from private investors. This situation appears consistent with respondents’ support for all
types of government support for the natural gas and biomethane industry (Figure 7.21).
Figure 7.21. Kinds of Government Support Needed for the Natural Gas and Biomethane Industry
SOURCE: RAND survey. NOTE: Based on 91 methane applicants.
12% 14%
32%
28%
7% 7%
13% 11%
41%
18%
8% 8%
0%
5%
10%
15%
20%
25%
30%
35%
40%
45%
Strongly disagree
Somewhat disagree
Neither agree or disagree
Somewhat agree
Strongly agree
Did not answer
Currently there are many private-‐sector investors (i.e. nongovernmental funders such as angel investors, venture capital, strategic investors, and banks) interested in your industry
Compared to five years ago, the amount of private investment has increased
3.3%
12.1%
46.2%
50.5%
52.7%
53.8%
56.0%
56.0%
76.9%
0% 10% 20% 30% 40% 50% 60% 70% 80% 90%
None
Other
Carbon tax or tax on petroleum-‐based fuels
Consumer tax breaks or purchase subsidies
Producer tax breaks or produc5on subsidies
Requirements on the quan55es of alterna5ve fuels and vehicles produced or sold
Government grant programs that fund research and development
Consumer awareness programs
Government grant programs that fund demonstra5on and deployment
Percentage of respondents

236
7.9 Views of Natural Gas and Biomethane Stakeholders on ARFVTP Investment Priorities
We asked natural gas and biomethane stakeholders open-ended questions about how the
ARFVTP has invested and should invest its funding.
We asked the question, “Based on your understanding of how CEC allocates funds, how do you
think CEC should allocate funds differently [by fuel type or market segment]?” Forty-one
percent of survey respondents (43 of 104) did not have comments (data not shown). Of the 61
responses, the most common comments were that more investment should be made in natural
gas and biomethane in general (5 percent of respondents) and biomethane in particular as a
separate fuel from natural gas (10 percent of respondents). Others noted that less funding
should be given to hydrogen (8 percent) or electricity (5 percent). Six percent of respondents
felt that no change was necessary.
Ten respondents offered views about CEC’s investments across biomethane market segments
(data not shown). Of these, there were five suggestions to increase investment in infrastructure,
in particular because of the increase in natural gas and biomethane vehicles on the road; there
were three suggestions for more investment in fuel development/production; one suggestion
for more investment in vehicles while another for less investment; one suggestion for less
investment in workforce; and finally one suggestion that no change was needed.
We next asked how resources should be allocated between RD&D and PD&D (data not shown).
There was a very low response rate, with 85 percent of respondents not answering this question
and 15 percent (16 respondents) offering views. Seven percent of respondents suggested no
change was needed. No other common views were given by more than 2 percent of respondents.
Finally, we asked how CEC should invest its resources in the next five years (data not shown).
Forty-five percent of survey respondents (57 of 104) did not answer this question. Of those that
did, 13 percent expressed interest in greater funding for vehicles, in some cases for NGVs, while
others supported vehicle investment more generally. Seven and one-half percent supported
investments in whatever fuels and vehicles that CEC determines have greatest environmental
benefit, without a preference or specification for what those should be. Another 8.5 percent
supported added investment in biomethane in various ways. No other common views were
given by more than 5 percent of respondents.
7.10 Conclusions
Use of natural gas, and more so of biomethane, for transportation faces a number of barriers to
market viability. Barriers are vehicle-related, fueling infrastructure–related, and, for
biomethane, feedstock- and fuel production–related. Among the most limiting appear to be the
limited capacity for biomethane production, challenges associated with injecting biomethane
into the natural gas pipeline system, the limited number of fueling stations, and the relatively
high incremental cost and shorter range of natural gas- and biomethane-powered vehicles
compared with gasoline- and diesel-powered ones.

237
Several of these barriers are being targeted by a wide range of ARFVTP-funded projects. The
program has funded 77 projects addressing fuel production, fueling infrastructure, and
vehicles, for a total of $160 million. Fuel-production projects focus primarily on anaerobic
digestion and associated biogas upgrading. Fueling infrastructure includes development of, and
upgrades to, a mix of private and public CNG and LNG stations. Vehicle projects focus primarily
on deploying commercially available NGVs, but they have also targeted new heavy-duty engine
technologies. Most projects (81 percent) entail PD&D, suggesting that natural gas– and
biomethane-based transpiration technology is relatively more advanced than, for example,
advanced ethanol, for which most awards have been for RD&D.
In terms of performance, completed projects successfully completed most of the technical
objectives, and ongoing projects are optimistic that remaining technical objectives will be met.
About one-half of the completed projects finished on schedule, while only about 25 percent of
the ongoing projects are on schedule. While a substantial fraction of projects were canceled (16
percent), in most cases, the cancellation was because the awardee withdrew before the project
began. No funding was expended on any of the canceled projects.
The ARFVTP has had some demonstrable impacts on the barriers to the natural gas and
biomethane transportation market in California. ARFVTP funding has approximately doubled
the biomethane fuel-production capacity in the state, adding about 5.5 million DGE per year in
capacity at 11 facilities since 2009.
The RFS and LCFS, along with state and local regulations, are increasing incentives to produce
biomethane for transportation. However, production is still small and impeded by high costs
relative to the current low prices for natural gas and barriers to pipeline injection that deter
many potential producers from entering the market for lack of access to customers. It appears
that continued grant funding for research to help drive costs down may be warranted.
A second area in which it appears the ARFVTP has had an impact on barriers to the natural gas
and biomethane transportation market is in increasing the number of fueling stations. So far,
the program has funded 40 new natural gas refueling stations (33 CNG, six LNG, and one
CNG/LNG). The new public stations represent a significant fraction of all new open and planned
public stations added since 2009, when the ARFVTP projects started. While it is difficult to
know how many stations would have been built without ARFVTP funding, three-fourths of
awardees reported they would not have continued their projects without the program’s
support. Thus, the program made the prospect more attractive and hence deserves significant
credit for the growth.
A final area of impact is on NGV deployment. The program helped develop several heavy-duty
natural gas engines that make up a significant fraction of the engine models in heavy-duty
NGVs. In addition, the program has provided incentives for NGV purchases that have helped put
approximately 2,500 vehicles on the road, most of them MDVs and HDVs.
Given the much higher CI of natural gas compared with biomethane, use of natural gas as an
alternative transportation fuel really only makes sense from a GHG emissions perspective until
biomethane production can increase to displace it. Nonetheless, the availability of natural gas

238
facilitates the transition to a methane-fuel transportation system by eliminating any
disincentive to deploying methane vehicles and fueling infrastructure. Because methane in the
form of natural gas is affordable and plentiful, one leg of the fuel-vehicle-fueling infrastructure
system is already in place, albeit in an interim form. This situation is somewhat analogous to
the case for advanced ethanol, in which corn ethanol can be used in its stead and the fueling
infrastructure built up while fuel production continues to develop.
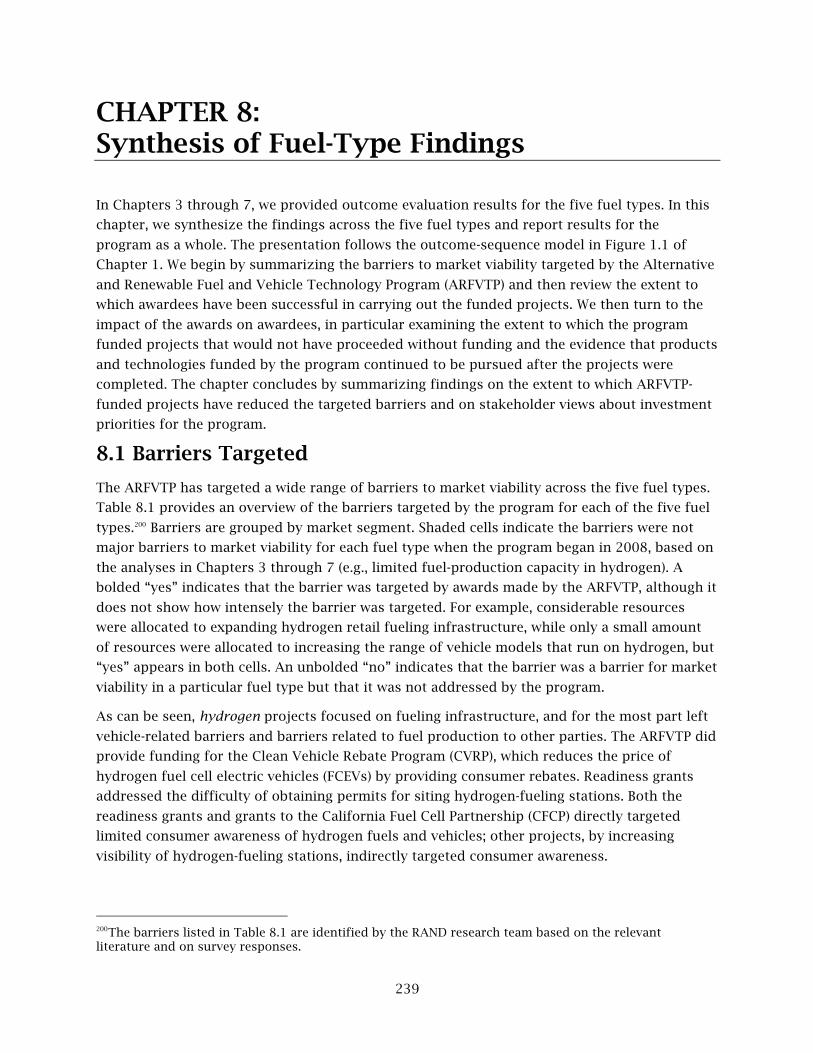
239
CHAPTER 8: Synthesis of Fuel-Type Findings
In Chapters 3 through 7, we provided outcome evaluation results for the five fuel types. In this
chapter, we synthesize the findings across the five fuel types and report results for the
program as a whole. The presentation follows the outcome-sequence model in Figure 1.1 of
Chapter 1. We begin by summarizing the barriers to market viability targeted by the Alternative
and Renewable Fuel and Vehicle Technology Program (ARFVTP) and then review the extent to
which awardees have been successful in carrying out the funded projects. We then turn to the
impact of the awards on awardees, in particular examining the extent to which the program
funded projects that would not have proceeded without funding and the evidence that products
and technologies funded by the program continued to be pursued after the projects were
completed. The chapter concludes by summarizing findings on the extent to which ARFVTP-
funded projects have reduced the targeted barriers and on stakeholder views about investment
priorities for the program.
8.1 Barriers Targeted
The ARFVTP has targeted a wide range of barriers to market viability across the five fuel types.
Table 8.1 provides an overview of the barriers targeted by the program for each of the five fuel
types.200 Barriers are grouped by market segment. Shaded cells indicate the barriers were not
major barriers to market viability for each fuel type when the program began in 2008, based on
the analyses in Chapters 3 through 7 (e.g., limited fuel-production capacity in hydrogen). A
bolded “yes” indicates that the barrier was targeted by awards made by the ARFVTP, although it
does not show how intensely the barrier was targeted. For example, considerable resources
were allocated to expanding hydrogen retail fueling infrastructure, while only a small amount
of resources were allocated to increasing the range of vehicle models that run on hydrogen, but
“yes” appears in both cells. An unbolded “no” indicates that the barrier was a barrier for market
viability in a particular fuel type but that it was not addressed by the program.
As can be seen, hydrogen projects focused on fueling infrastructure, and for the most part left
vehicle-related barriers and barriers related to fuel production to other parties. The ARFVTP did
provide funding for the Clean Vehicle Rebate Program (CVRP), which reduces the price of
hydrogen fuel cell electric vehicles (FCEVs) by providing consumer rebates. Readiness grants
addressed the difficulty of obtaining permits for siting hydrogen-fueling stations. Both the
readiness grants and grants to the California Fuel Cell Partnership (CFCP) directly targeted
limited consumer awareness of hydrogen fuels and vehicles; other projects, by increasing
visibility of hydrogen-fueling stations, indirectly targeted consumer awareness.
200The barriers listed in Table 8.1 are identified by the RAND research team based on the relevant literature and on survey responses.

240
Table 8.1. Barriers Targeted by the ARFVTP
Market Segment Barrier Hydrogen Electricity
Diesel Substitutes
Gasoline Substitutes
Natural Gas and
Biomethane
Feedstocks and fuel production
Limited ability to procure and use alternative feedstocksa
No Yes Yes Yes
Limited fuel-production capacity Yes No Yes
High fuel-production cost No Yes No No
Fueling infra-structure
Insufficient bulk fueling infrastructure Yes Yes
Insufficient retail fueling infrastructure Yes Yes No Yes Yes
Difficulty in obtaining permits for fueling/charging infrastructure
Yes Yes No No
Lack of fueling/charging standards Yes
Vehicles
Limited vehicle production capacity No Yes
High vehicle production cost or vehicle price Yes Yes Yes
Inadequate vehicle performance Yes Yes Yes
Limited vehicle models Yes Yes Yes Consumer awareness
Insufficient consumer awareness and knowledge Yes Yes No No Yes
SOURCE: Author analysis. NOTE: Shading signifies that this was not considered a major barrier for this fuel type when the ARFVTP program began. Includes barriers targeted by canceled projects. a Alternative feedstocks vary by fuel type and include sorghum, woody biomass, and cellulosic feedstocks such as woody biomass and corn stover (ethanol); mixed organic waste and animal rendering waste (biomethane); algal oil, dairy waste, and municipal solid waste; and fats, oil, and grease (FOG) from municipal wastewater (diesel substitutes).
Electricity projects related to electric vehicles (EVs) targeted all the major barriers to market
viability that existed when the program began. As with hydrogen, a substantial number of
regional readiness grants addressed the difficulty of obtaining permits and included
components to promote consumer awareness about EVs and the charging infrastructure.
Vehicle barriers were of less importance for both diesel substitutes and gasoline substitutes, and
the ARFVTP has funded few vehicle projects for these two fuel types. Feedstock, fuel
production, and fueling infrastructure barriers were targeted for both fuel types. In neither case
were there efforts to directly improve limited consumer awareness.
The natural gas and biomethane projects targeted the widest range of barriers, addressing
feedstock, fuel production, fueling infrastructure, vehicle, and consumer awareness barriers.
Tables 8.2 and 8.3 report how ARFVTP resources were allocated to address these barriers. The
tables show the market segment and technology development stage, respectively, that were the
focus of attention for each fuel type and illuminate how the funding emphasis has varied by
fuel type. Readiness plans are typically part of the fueling infrastructure market segment but
are separated out because of their unique characteristics. For the most part, funding has

241
focused on production, distribution, and deployment (PD&D) rather than research,
development, and demonstration (RD&D) (Table 8.3). The exception was funding for gasoline
substitutes, where the bulk of the funding was for RD&D.
Table 8.2. ARFVTP Awards Through January 2015, by Fuel Type and Market Segment (Percentage of Total Amount Awarded)
Market Segment All Fuel Types Hydrogen Electricity
Diesel Substitutes
Gasoline Substitutes
Natural Gas and
Biomethane Feedstocks and fuel production 29% 0% 0% 91% 69% 42%
Fueling Infrastructure 32% 97% 25% 9% 27% 11% Readiness plans 1% 1% 2% 0% 0% 0% Vehicles 38% 2% 73% 0% 4% 47%
Othera 0.1% 1% 0% 0% 0% 0% Total amount awarded ($) $549 M $93 M $179 M $55 M $62 M $160 M
SOURCE: California Energy Commission (CEC) administrative data. NOTE: Excludes three workforce projects and ten multifuel projects. Percentages do not all sum to 100 percent because of rounding. a Awards that cover membership fees for participation in the CFCP.
Table 8.3. ARFVTP Awards Through January 2015, by Fuel Type and Technology Development Stage (Percentage of Total Amount Awarded)
Technology Development Stage
All Fuel Types Hydrogen Electricity
Diesel Substitutes
Gasoline Substitutes
Natural Gas and
Biomethane RD&D 27% 7% 33% 18% 59% 21%
PD&D 73% 92% 65% 82% 41% 79% Readiness plans 1% 1% 2% 0% 0% 0%
Total amount awarded ($) $549 M $93 M $179 M $55 M $62 M $160 M SOURCE: CEC administrative data. NOTE: Excludes three workforce projects and ten multifuel projects.
Overall, RD&D funding as a percentage of total funding ranged between 24 and 34 percent
between 2010 and 2013 (Figure 8.1). However, it dropped to 10 percent in 2014.
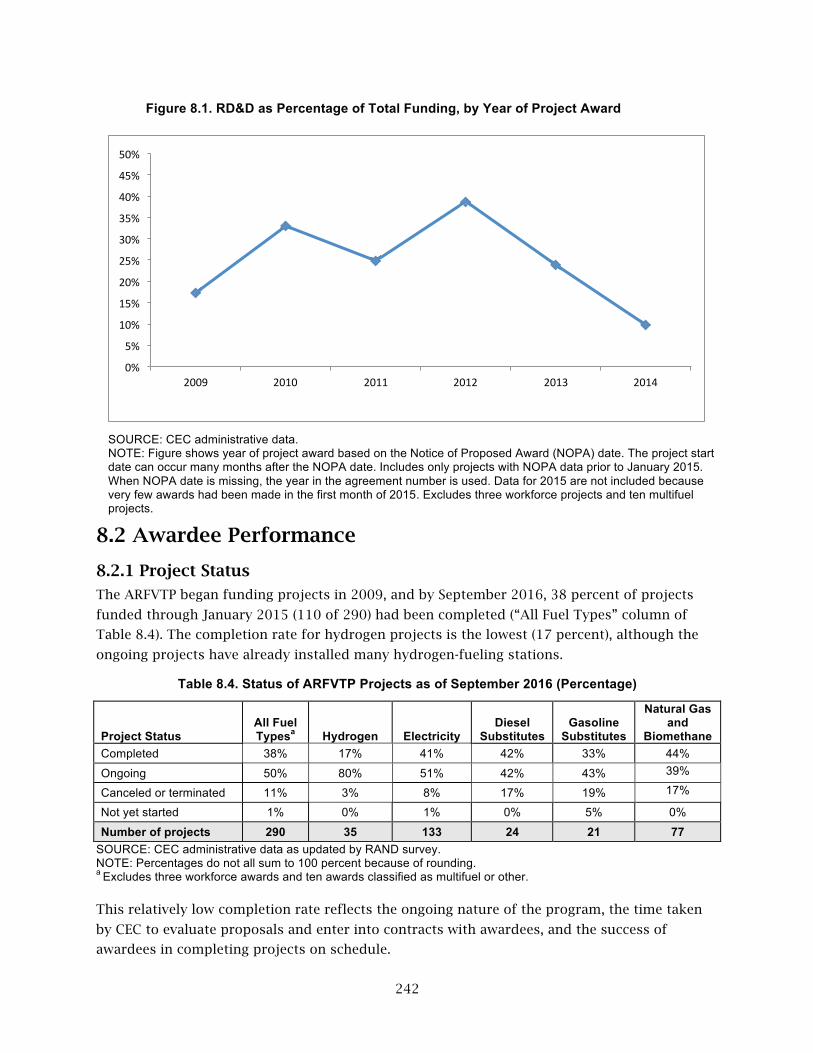
242
Figure 8.1. RD&D as Percentage of Total Funding, by Year of Project Award
SOURCE: CEC administrative data. NOTE: Figure shows year of project award based on the Notice of Proposed Award (NOPA) date. The project start date can occur many months after the NOPA date. Includes only projects with NOPA data prior to January 2015. When NOPA date is missing, the year in the agreement number is used. Data for 2015 are not included because very few awards had been made in the first month of 2015. Excludes three workforce projects and ten multifuel projects.
8.2 Awardee Performance
8.2.1 Project Status
The ARFVTP began funding projects in 2009, and by September 2016, 38 percent of projects
funded through January 2015 (110 of 290) had been completed (“All Fuel Types” column of
Table 8.4). The completion rate for hydrogen projects is the lowest (17 percent), although the
ongoing projects have already installed many hydrogen-fueling stations.
Table 8.4. Status of ARFVTP Projects as of September 2016 (Percentage)
Project Status All Fuel Typesa Hydrogen Electricity
Diesel Substitutes
Gasoline Substitutes
Natural Gas and
Biomethane Completed 38% 17% 41% 42% 33% 44%
Ongoing 50% 80% 51% 42% 43% 39%
Canceled or terminated 11% 3% 8% 17% 19% 17%
Not yet started 1% 0% 1% 0% 5% 0%
Number of projects 290 35 133 24 21 77 SOURCE: CEC administrative data as updated by RAND survey. NOTE: Percentages do not all sum to 100 percent because of rounding. a Excludes three workforce awards and ten awards classified as multifuel or other. This relatively low completion rate reflects the ongoing nature of the program, the time taken
by CEC to evaluate proposals and enter into contracts with awardees, and the success of
awardees in completing projects on schedule.
0%
5%
10%
15%
20%
25%
30%
35%
40%
45%
50%
2009 2010 2011 2012 2013 2014

243
As discussed in Section 2.9 of Chapter 2, it takes considerable time for CEC to evaluate
proposals and enter into contracts—the time between proposal submission and contract
awarded has averaged about one year. The schedule performance for hydrogen and other
awardees will be reviewed below.
Overall, 11 percent of the projects funded by the ARFVTP have been canceled (Table 8.4). The
most common reason for cancellation was a failure to obtain the proposed matching funds.
Other projects were canceled because of problems with subcontractors, because the awardee
went bankrupt, because of issues about paying the prevailing wage, because of problems with
the technology, and because of market conditions that had changed since the project proposal
was submitted to CEC.
In most cases, projects were canceled because they were withdrawn by the awardee prior to any
work being undertaken or any CEC funds being expended. Of the 32 canceled projects
amounting to a total of $70 million in approved funding, only $6 million was spent on four
projects. Higher cancellation rates are observed for diesel substitutes, gasoline substitutes, and
natural gas and biomethane awards, but the cancellation rates are still modest.
8.2.2 Technical Performance
By and large, awardees achieved the main technical objectives for their completed projects. The
RAND team identified the main technical objectives for each project and independently
assessed the extent to which the technical objectives were achieved using project monthly
status reports and final project reports. Awardees who completed the survey were given the
opportunity to correct our assessment, but as discussed in the previous fuel type chapters,
there was little disagreement in those cases for which we had sufficient information to make an
assessment. There were some technical objectives that awardees confirmed were fully achieved
when we did not have sufficient information to make our independent assessment.
Table 8.5 summarizes RAND assessment of the extent to which technical objectives have been
achieved for completed projects. Across the five fuel types, only 12 percent of the objectives
have been partially or minimally achieved, and the percentage partially or minimally achieved
does not vary a great deal by fuel type. There was insufficient information in monthly progress
reports, final project reports, or other project documentation to determine the extent to which
the technical objectives had been achieved.

244
Table 8.5. RAND Assessment of Extent to Which Technical Objectives Were Achieved for Completed Projects, by Fuel Type (Percentage)
Extent Achieved All Fuel Types Hydrogena Electricity
Diesel Substitutes
Gasoline Substitutes
Natural Gas and
Biomethane Fully 57% 50% 63% 74% 46% 45%
Partially 9% 0% 10% 5% 8% 9% Minimally 3% 0% 2% 8% 3% 5%
Unknown 31% 50% 26% 13% 43% 41% Number of technical objectives 364 6 179 38 37 104
Number of projects 106 2 54 10 7 33 SOURCE: RAND assessment. NOTE: Percentages do not all sum to 100 percent because of rounding. a Excludes four projects to fund participation in the CFCP.
Table 8.6 repeats the analysis after the extent achieved had been updated by survey
respondents. Again, only 12 percent of 364 technical objectives have been partially or
minimally achieved, and the percentage partially or minimally achieved does not vary a great
deal by fuel type. The major difference between RAND’s assessment and the assessment as
updated by survey respondents is that objectives have moved from the “unknown” category to
the “fully” category.
Table 8.6. Extent to Which Technical Objectives Were Achieved for Completed Projects by Fuel Type (Percentage)
Extent Achieved All Fuel Types Hydrogena Electricity
Diesel Substitutes
Gasoline Substitutes
Natural Gas and
Biomethane Fully 81% 83% 82% 87% 70% 82%
Partially 8% 0% 8% 3% 8% 11% Minimally 4% 17% 2% 8% 3% 6% Unknown 7% 0% 8% 3% 19% 2% Number of technical objectives 364 6 179 38 37 104
Number of projects 106 2 54 10 7 33 SOURCE: RAND assessment as updated by survey respondents. NOTE: Percentages do not all sum to 100 percent because of rounding. a Excludes four projects to fund participation in the CFCP.
As shown in Table 8.7, the percentage of technical objectives that is partially or minimally
achieved is somewhat higher for PD&D projects than for RD&D projects (16 versus 9 percent),
but the difference is not great.

245
Table 8.7. Extent to Which Technical Objectives Were Achieved for Completed Projects, by Technology Development Phase (Percentage)
Extent Achieved All Fuel Types RD&D PD&D
Regional Readiness
Fully 81% 81% 78% 100%
Partially 8% 4% 12% 0% Minimally 4% 5% 4% 0%
Unknown 7% 9% 6% 0% Number of technical objectives 364 133 199 32
Number of projects 106 32 68 10 SOURCE: RAND assessment as updated by survey respondents. NOTE: Table data exclude four projects to fund participation in the CFCP. Percentages do not all sum to 100 percent because of rounding.
Examples of technical objectives that were not fully met include the following:
• a hydrogen-fueling infrastructure project that failed to achieve the gasoline
displacement goal because the targeted amount of hydrogen was not dispensed at the
station
• several EV retail infrastructure projects that failed to install the proposed number of
stations (however, as shown in Chapter 4, these shortfalls were more than offset by
other awardees who installed more than the proposed number of stations)
• a research project on lithium ion (Li-ion) batteries that failed to achieve the proposed
performance goals
• a gasolines substitutes project that installed fewer than one-half of the proposed E85
stations
• a biodiesel bulk fueling infrastructure project that did not meet the throughput targets
for the facility
• an RD&D project that failed to complete a biomass gasification and methanation facility
that could produce a 20-percent methane syngas from urban wood waste.
For the EV charging station projects, we visited and verified the operability of 326 (about 4
percent) of the more than 8,000 stations installed or funded to be installed by the program. We
found that more than 95 percent of these stations were operating properly.
As expected, most of the main technical objectives for the ongoing projects are in progress.
Awardees were confident that they would ultimately achieve these in-progress objectives,
reporting that it is highly likely that more than 80 percent would be achieved (Table 8.8).
Gasoline substitutes awardees were less optimistic. However, the number of technical
objectives (ten) and the number of projects (three) on which the percentage is based are small,
and the results for just a few objectives can cause the percentages to swing around a great deal.
There was not a substantial difference between ongoing RD&D projects versus PD&D projects
(Table 8.9).
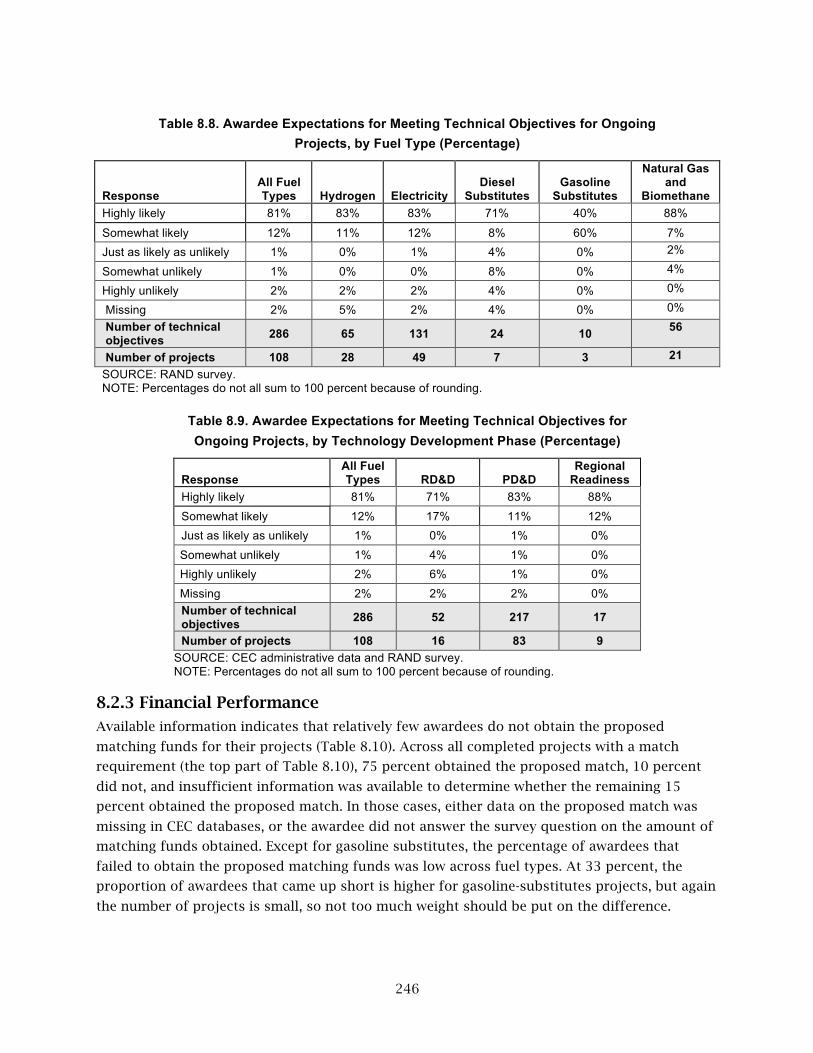
246
Table 8.8. Awardee Expectations for Meeting Technical Objectives for Ongoing
Projects, by Fuel Type (Percentage)
Response All Fuel Types Hydrogen Electricity
Diesel Substitutes
Gasoline Substitutes
Natural Gas and
Biomethane Highly likely 81% 83% 83% 71% 40% 88%
Somewhat likely 12% 11% 12% 8% 60% 7% Just as likely as unlikely 1% 0% 1% 4% 0% 2%
Somewhat unlikely 1% 0% 0% 8% 0% 4%
Highly unlikely 2% 2% 2% 4% 0% 0%
Missing 2% 5% 2% 4% 0% 0% Number of technical objectives 286 65 131 24 10 56
Number of projects 108 28 49 7 3 21 SOURCE: RAND survey. NOTE: Percentages do not all sum to 100 percent because of rounding.
Table 8.9. Awardee Expectations for Meeting Technical Objectives for Ongoing Projects, by Technology Development Phase (Percentage)
Response All Fuel Types RD&D PD&D
Regional Readiness
Highly likely 81% 71% 83% 88% Somewhat likely 12% 17% 11% 12% Just as likely as unlikely 1% 0% 1% 0% Somewhat unlikely 1% 4% 1% 0% Highly unlikely 2% 6% 1% 0% Missing 2% 2% 2% 0% Number of technical objectives 286 52 217 17
Number of projects 108 16 83 9 SOURCE: CEC administrative data and RAND survey. NOTE: Percentages do not all sum to 100 percent because of rounding.
8.2.3 Financial Performance
Available information indicates that relatively few awardees do not obtain the proposed
matching funds for their projects (Table 8.10). Across all completed projects with a match
requirement (the top part of Table 8.10), 75 percent obtained the proposed match, 10 percent
did not, and insufficient information was available to determine whether the remaining 15
percent obtained the proposed match. In those cases, either data on the proposed match was
missing in CEC databases, or the awardee did not answer the survey question on the amount of
matching funds obtained. Except for gasoline substitutes, the percentage of awardees that
failed to obtain the proposed matching funds was low across fuel types. At 33 percent, the
proportion of awardees that came up short is higher for gasoline-substitutes projects, but again
the number of projects is small, so not too much weight should be put on the difference.

247
Table 8.10. Awardee Success in Obtaining Matching Funds, by Fuel Type (Percentage of Projects That Require Matching Funds)
Response All Fuel Types Hydrogen Electricity
Diesel Substitutes
Gasoline Substitutes
Natural Gas and
Biomethane Completed Projects
Match achieved 75% 100% 79% 88% 33% 68% Match not achieved 10% 0% 5% 13% 33% 14% Missing 15% 0% 16% 0% 33% 18% Number of projects 72 1 38 8 3 22
Ongoing Projects Match achieved 68% 73% 66% 50% 100% 71% Match not achieved 23% 13% 29% 25% 0% 19% Missing 10% 13% 5% 25% 0% 10% Number of projects 84 15 38 8 2 21
SOURCE: CEC administrative data and RAND survey. NOTE: Includes only projects for which a survey was completed. Excludes canceled projects. Percentages do not all sum to 100 percent because of rounding.
For ongoing projects, the percentage of awardees who have not yet achieved the proposed
match is substantially higher (23 percent in Table 8.10). It seems plausible that the percentage
will decline as the projects progress. A decline over time would indicate that the match is not
something that many awardees have in place right from project start.
The ARFVTP will not increase state funding to offset a shortfall in matching. Thus, failure to
obtain the proposed amount of matching funds by project completion could mean either that
the awardee did not achieve all the project technical objectives or that the project has ended up
costing less than expected.
8.2.4 Schedule Performance
Completing projects on time has been a challenge for many awardees. The top half of Table
8.11 shows that overall, 52 percent of completed projects were completed on or ahead of
schedule. Most of the remaining projects were completed one to 24 months behind schedule
(42 percent). A small percentage of projects were completed more than two years behind
schedule. Results are much less positive for ongoing projects (bottom half of Table 8.11)—only
29 percent were completed on or ahead of schedule, and, if anything, one should expect that
delays for these projects will lengthen over time.201 At the moment, 60 percent of the ongoing
projects are one to 24 months behind schedule.
Delays are most severe for the completed hydrogen projects. The two completed projects were
completed more than two years behind schedule. Completed gasoline-substitutes projects also
were completed further behind schedule than other projects. For both sets of projects, however,
there is some indication that improvements are being made. As reported in Section 3.5.4 of
201It seems reasonable that delays for ongoing projects will end up being greater than delays for completed projects—after all, on-schedule projects are more likely to have been completed by this point in the program than projects that are behind schedule.

248
Chapter 3, awardees reported that they had been able to reduce the time needed to place a
hydrogen-fueling station from 18 to 24 months to 12 to 18 months and that the delays for
ongoing hydrogen projects are now more in line with the delays for other types of projects
(bottom set of rows in Table 8.11). Similarly, delays for ongoing gasoline-substitutes projects
are comparable with those for other fuel types.
Table 8.11. Schedule Performance of Completed and Ongoing Projects, by Fuel Type (Percentage of Projects)
All Fuel Types Hydrogena Electricity
Diesel Substitutes
Gasoline Substitutes
Natural Gas and
Biomethane Completed Projects
On or ahead of schedule 52% 0% 50% 70% 14% 62%
1 month to 2 years behind schedule 42% 0% 39% 20% 86% 38%
More than 2 years behind schedule 5% 100% 4% 10% 0% 0%
Could not be determined 4% 0% 7% 0% 0% 0%
Number of projects 107 2 54 10 7 34 Ongoing Projects
On or ahead of schedule 29% 25% 25% 50% 33% 33%
1 month to 2 years behind schedule 60% 54% 65% 50% 67% 57%
More than 2 years behind schedule 3% 7% 1% 0% 0% 7%
Could not be determined 8% 14% 9% 0% 0% 3%
Number of projects 145 28 68 10 9 30 SOURCE: Data provided by CEC CAMs as updated by survey respondents.
a Excludes four projects to fund participation in the CFCP.
Table 8.12 suggests that delays tend to be greater for RD&D projects than for PD&D projects.
Sixty-five percent of RD&D projects were completed behind schedule versus 42 percent of
RD&D projects.202 For ongoing projects, 83 percent of RD&D projects are behind schedule versus
64 percent of PD&D projects. Further work is needed to understand why RD&D projects tend to
be further behind schedule.203
202When the projects for which schedule performance could not be determined are excluded, the percentage of RD&D projects completed behind schedule rises to 64 percent. 203The literature on the “planning fallacy” (first proposed by Daniel Kahneman and Amos Tversky in 1979 (“Prospect Theory: An Analysis of Decision Making Under Risk,” Econometrica, Vol. 47, No. 2, March 1979, pp. 263–291) finds that even experts in a field underestimate the time and resources required to complete a project because of their own biases (e.g., because of competition for limited funding). We could not find research in this area that systematically compares RD&D and PD&D projects).

249
Table 8.12. Schedule Performance of Completed and Ongoing Projects, by Technology Development Phase (Percentage of Projects)
All Fuel Types RD&D PD&D
Regional Readiness
Completed Projects On or ahead of schedule 52% 32% 58% 70%
1 month to 2 years behind schedule 39% 54% 39% 0%
More than 2 years behind schedule 5% 11% 3% 0%
Could not be determined 4% 4% 0% 30%
Number of projects 107 28 69 10 Ongoing Projects
On or ahead of schedule 29% 9% 35% 9%
1 month to 2 years behind schedule 60% 83% 59% 27%
More than 2 years behind schedule 3% 0% 5% 0%
Could not be determined 8% 9% 2% 64%
Number of projects 145 23 111 11 SOURCE: Data provided by CEC CAMs as updated by survey respondents. NOTE: Excludes four projects to fund participation in the CFCP. Percentages do not all sum to 100 percent because of rounding.
There are similarities in the reasons for delay across fuel type. Table 8.13 indicates the top
three reasons cited by awardees whose projects are behind schedule. Delay in obtaining
required permits was one of the top three reasons for four of the five fuel types. The need to
change project location and unexpected problems with the technology were among the top
three reasons for three of the five fuel types.
Table 8.13. Top Three Reasons for Project Delay Indicated by Awardees, by Fuel Type
Reason for Delay Hydrogen Electricity Diesel
Substitutes Gasoline
Substitutes
Natural Gas and
Biomethane Delay in obtaining required permits X X X X Needed to change project location X X X Unexpected problems with technology X X X
Essential staff left company X
Other projects had priority X SOURCE: RAND survey. NOTE: The X in this table indicates that the reason for delay was one of the top three indicated by survey respondents for that fuel type and that at least three respondents in that fuel type category selected the reason for delay. For this reason, only two reasons are marked for diesel substitutes and one for gasoline substitutes.
8.3 Impact of Awards on Awardee
Critical to the assessment of the ARFVTP’s impact is the extent to which awards have allowed
awardees to pursue projects that would not have been otherwise pursued. If the awardees
250
would have undertaken the projects without the award, it is hard to argue that the ARFVTP had
much impact. After summarizing the findings on this topic, we examine the impact of awards
on the capabilities of awardees and then turn to evidence that the projects have resulted in
products or technologies that have been pursued after project completion. How often this
occurs is an indicator of the impact of the ARFVTP on the alternative and renewable fuels and
vehicles industries.
8.3.1 Effect of Award on Decision to Proceed with the Project
One indirect indicator for whether awardees would not have proceeded with the project absent
the award is whether unsuccessful applicants have in fact not proceeded with the projects after
their applications were denied. The advantage of this indicator is that it is based on actual
behavior. The disadvantage is that the projects proposed by the unsuccessful applicants may
have been more poorly conceived or planned that those funded by the ARFVTP. As shown in the
top half of Table 8.14, 53 percent of unsuccessful applicants who completed the survey had not
yet proceeded with the project. With the exception of hydrogen projects, the responses are
similar across fuel types, with between 49 percent and 62 percent reporting that they had not
proceeded. The percentage is lower for hydrogen, but the number of unsuccessful applicants
responding is small.
A smaller percentage of awardees indicated that they would not have proceeded without the
award (as shown in the bottom half of Table 8.14). For all fuel types combined, 20 percent said
they would not have proceeded, and the percentages are low across fuel types. However, a
considerable percentage of awardees for each fuel type said they might have proceeded,
creating substantial uncertainly over the percentage that would not have proceeded. Assuming
alternatively that none or all of those in the “might have proceeded” category would not
actually have proceeded, the percentage that would not have proceeded could vary from 20
percent to 73 percent. This range symmetrically brackets the 53 percent of unsuccessful
applicants who have not proceeded and thus provides support for a conclusion that roughly 50
percent of funded projects would not have proceeded without ARFVTP funding. However, the
wide range does underscore the difficulty of pinning down what awardees would have done had
they not received the award.

251
Table 8.14. Indicators of Award Impact, by Fuel Type
All Fuel Types Hydrogen Electricity
Diesel Substitutes
Gasoline Substitutes
Natural Gas and
Biomethane Unsuccessful Applicants
Has proceeded with the project 41% 67% 46% 33% 44% 37%
Has not proceeded 53% 33% 49% 62% 56% 53% Did not answer 6% 0% 6% 5% 0% 10%
Number of proposals 98 3 35 21 9 30 Awardees
Would have proceeded without the award 25% 6% 29% 13% 40% 28%
Might have proceeded without the award 52% 58% 56% 63% 60% 38%
Would not have proceeded without the award 20% 32% 12% 19% 0% 32%
Did not answer 3% 3% 3% 6% 0% 2% Number of projects 211 31 101 16 10 53 SOURCE: RAND survey. NOTE: Percentages do not all sum to 100 percent because of rounding.
There is no clear difference between RD&D and PD&D projects in terms of whether awardees
would have proceeded with the projects. As shown in Table 8.15, equal percentages of
unsuccessful applicants had not yet proceeded with the projects (58 percent for both RD&D and
PD&D projects). Once the large percentage of awardees who said they might have proceeded is
considered, there is no clear-cut difference between RD&D and PD&D projects on the percentage
of awardees who would not have proceeded absent the award.
Table 8.15. Indicators of Award Impact, by Technology Development Stage
All Fuel Types RD&D PD&D
Regional Readiness
Unsuccessful Applicants Has proceeded with the project 41% 38% 38% 75% Has not proceeded 53% 58% 58% 0% Did not answer 6% 4% 5% 25% Number of proposals 98 50 40 8
Awardees Would have proceeded without the award 25% 26% 26% 10%
Might have proceeded without the award 52% 62% 48% 70%
Would not have proceeded without the award 20% 8% 24% 15%
Did not answer 3% 5% 2% 5% Number of projects 211 39 152 20 SOURCE: RAND survey. NOTE: Percentages do not all sum to 100 percent because of rounding.

252
Based on these findings, one could tentatively argue that roughly 50 percent of the projects
funded by the ARFVTP would have not have proceeded except for program funding, although
arguments can be made that the percentage could be higher or lower. The possibility that
unsuccessful applicants that have not yet proceeded with the proposed project will do so in the
future would tend to reduce the percentage below 50 percent. The possibility that submitting
an ARFVTP proposal helped unsuccessful applicants develop a proposal that they successfully
submitted to another funding source would tend to increase the percentage of projects that
would not have proceeded without the ARFVTP above 50 percent.204
8.3.2 Impact on Organizational Capabilities
There was substantial agreement across awardees that ARFVTP awards allowed their
organizations to enter a new area in which they had not previously been active, expand in an
area in which they already had some expertise or capacity, and gain knowledge and experience
that will be useful in developing products and technologies besides those funded by the grant
(Figure 8.2).
Comparable figures in Chapters 3 through 7 indicate that the results are similar across fuel
types. These are strong, favorable results for the program, although again one could argue that
some of the progress in these areas would have happened absent the award.
Figure 8.2. Effect of Awards on Organizational Capabilities
SOURCE: RAND survey. NOTE: For 222 awardees who completed the survey, excluding canceled or terminated projects.
204This argument rests on the availability of other funding sources. In the extreme, if every funding source decided to eliminate its program assuming that other funding sources would remain, there would be no funding sources.
10% 8%
16% 23%
40%
2% 3% 5% 10%
23%
57%
2% 2% 5%
22% 27%
42%
2%
0%
10%
20%
30%
40%
50%
60%
70%
Strongly disagree Somewhat disagree
Neither agree or disagree
Somewhat agree Strongly agree Did not answer
The grant allowed your organiza5on to enter a new area in which you had previously not been ac5ve.
The grant allowed your organiza5on to expand in an area in which you already had some exper5se or capacity.
The grant allowed your organiza5on to gain knowledge or experience that will be useful in developing products and technologies besides those funded by the grant.

253
8.3.3 Market Prospects for the Product or Technology Funded by the Award
After completing their ARFVTP projects, awardees overwhelmingly indicated they have taken
steps to develop, market, install, or produce the product or technology funded by the award. Of
the 87 completed projects for which this survey question was answered, 84 percent of awardees
reported doing so (top set of rows of Table 8.16). The percentages were high for all fuel-type
categories. In addition, there does not seem to be any substantial difference between RD&D and
PD&D projects.
Table 8.16. Awardee Efforts to Develop, Market, Install, or Produce Product or Technology After Project Completion by Technology-Development Stage
All Fuel Types Hydrogen Electricity
Diesel Substitutes
Gasoline Substitutes
Natural Gas and
Biomethane All Projects
Took steps 84% 100% 84% 75% 75% 86% Did not answer 1% 0% 2% 0% 0% 0%
Number of projects 87 3 44 8 4 28 RD&D Projects
Took steps 84% 100% 100% 60% 67% 100% Number of projects 20 2 7 5 3 3
PD&D Projects Took steps 82% 100% 78% 100% 100% 84%
Number of projects 57 1 27 3 1 25 Regional Readiness
Took steps 90% — 90% — — —
Did not answer 10% — 10% — — — Number of projects 10 0 10 0 0 0
SOURCE: RAND survey.
Awardees who did continue to develop, market, install, or produce the product or technology
indicated that they had taken multiple steps to do so (data not shown). Substantial percentages
reported that they had worked on ways to reduce costs and to improve product performance
and had attempted to identify potential customers for the product. Awardees financed these
activities with a number of sources. Nearly all used internal resources, and substantial
majorities used revenue from the sales of the product or technology and funds from private
investors.
8.4 Impacts on Barriers
A central goal of the ARFVTP is to reduce barriers to the market viability of alternative fuels
and vehicles. The findings in Chapters 3 through 7 indicate that the ARFVTP has indeed helped
reduce many barriers; those findings are summarized in Table 8.17.
The shaded cells indicate barriers that were not major barriers when the ARFVTP began in
2009, as identified in Table 8.1. Cells labeled “not targeted” demark barriers that were not
targeted by the ARFVTP—the “no’s” in Table 8.1. All the remaining cells correspond to the

254
”yeses” in Table 8.1. These cells are the ones targeted by the program and are the ones we
assess here. Our assessment falls into the following four categories:
• Yes: There is solid evidence the projects funded by the program helped reduce this
barrier. The extent to which the barrier has been reduced is not differentiated. Major
reductions and reductions that are arguably minor are both marked “Yes.”
• Probable: It is likely the projects funded by the program helped reduce this barrier, but
there is little empirical evidence to support the case.
• Could not be determined: Because there was either insufficient data on project
outcomes or the project team was unable to assess and interpret those outcomes, it
could not be determined whether the projects reduced this barrier.
• No: There is no indication that the projects funded by the program helped reduce the
barrier.
Table 8.17. Barriers Reduced by the ARFVTP
Market Segment Barrier Hydrogen Electricity
Diesel Substitutes
Gasoline Substitutes
Natural Gas and
Biomethane
Feedstock and fuel production
Limited ability to procure and use alternative feedstocksa
No Yes Yes
Limited fuel-production capacity Yes Not targeted Yes
High fuel-production cost Not targeted Could not be determined Not targeted Not targeted
Fueling infra-structure
Insufficient bulk fueling infrastructure No Yes
Insufficient retail fueling infrastructure Yes Yes Not targeted Yes Yes
Difficulty in obtaining permits for fueling/charging infrastructure
Yes Yes Not targeted Not targeted
Lack of fueling/charging standards Yes
Vehicles
Limited vehicle production capacity Not targeted Yes
High vehicle production cost or vehicle price
Could not be determined
Could not be determined Yes
Inadequate vehicle performance Could not be
determined Could not be determined
Could not be determined
Limited vehicle models Yes Yes No Consumer awareness
Insufficient consumer awareness Probable Probable Not targeted Probable Probable
SOURCE: Author analysis. NOTE: Shading signifies that this was not a major barrier for this fuel type when the ARFVTP began. a Alternative feedstocks vary by fuel type and include sorghum, woody biomass, and cellulosic feedstocks such as woody biomass and corn stover (ethanol); mixed organic waste and animal rendering waste (biomethane); algal oil; dairy waste; municipal solid waste; and fats, oil, and grease from municipal wastewater (diesel substitutes).
The ARFVTP has made considerable progress in reducing many barriers to the market viability
of alternative fuels and vehicles. For hydrogen projects, 48 out of the 60 hydrogen-refueling

255
stations in California have been built with ARFVTP funding, and 48 more ARFVTP-funded
stations are under development. While only a few projects specifically targeted reducing
permitting barriers, others may have reduced them through the experience of building stations.
The program also had significant impact on the lack of standards for fueling infrastructure.
Consumer rebates through the CVRP for purchasing FCEVs may have reduced the price of
FCEVs, but few vehicles were purchased during the period covered by this evaluation, and the
magnitude of any such decline is difficult to determine. A few new hydrogen vehicle models
were demonstrated with ARFVTP funding, so as noted in Table 8.17, the program helped reduce
this barrier; the impact is probably minor. Hydrogen readiness projects and funding for the
CVRP, as well as the retail fueling stations funded by the ARFVTP, probably contributed to
improving consumer awareness, but there is not clear, quantifiable evidence that a reduction
has occurred.
For electricity projects, the large number of EV charging stations funded by the program is clear
evidence that the program has reduced fuel infrastructure barriers, and the EV readiness grants
have helped reduce the difficulty of obtaining permits. About 35 percent of the publicly
available charging stations in the state appear to have been financed in part by the program.
Vehicle barriers have been reduced by awards to build or expand EV production lines and to
develop and demonstrate different types of electrically powered vehicles. It is likely that
projects to expand production lines and to design and demonstrate advanced EV components
will contribute to reducing vehicle cost, but data by which to confirm such effects are hard to
come by. The program may have also helped reduce vehicle prices by funding the CVRP.
However, the extent is hard to determine because, absent the CVRP, automakers might have had
to reduce prices by a similar amount to sell the number of vehicles required by the zero-
emission vehicle (ZEV) program. Projects have been funded to improve battery performance, but
the study team was not able to determine whether these efforts have paid off in terms of
improved vehicle performance.
As for the hydrogen portfolio of projects, EV readiness grants and the increased visibility of
charging stations probably contributed to improving consumer awareness, but there is not
clear, quantifiable evidence that a reduction has occurred.
Turning to diesel substitutes, the ARFVTP has made demonstrable progress in reducing barriers
related to production capacity and bulk fueling infrastructure. Fifty-four million gallons per
year (mgy) of the 184-mgy biodiesel production capacity in California has been financed in part
by the ARFVTP, as has 17.5 mgy of the 63-mgy renewable diesel capacity. Although more needs
to be done, the modest number of bulk fueling infrastructure projects funded by the program
has helped reduce barriers in this area to some extent. RD&D projects have sought to
demonstrate the feasibility of generating low-cost, low–carbon intensity (CI) feedstocks (algal
oil) or producing alternative diesel from different types of feedstocks (e.g., dairy waste and fats,
oil, and gas in municipal wastewater); however, there is no indication that the projects have
taken significant steps toward commercial viability. Projects to expand production capacity and
install the latest technology may well have helped reduce the production costs of alternative
diesel, but data on production costs is hard to come by.

256
As far as gasoline-substitutes projects are concerned, demonstrable progress has been made in
expanding the number of E85 fueling stations, and the production capacity available in
California to produce ethanol from sorghum has been expanded. The number of E85 stations in
California increased from 29 to 96 between 2009 and 2016, 40 of which were funded by the
ARFVTP. Progress in reducing the other barriers targeted is less clear. A demonstration project
appears to have improved the ability to process cellulosic feedstocks, but the progress was
incremental, and it is unclear whether it will become commercial. While there is some evidence
that California ethanol producers have transitioned at least some of their corn feedstock to
sorghum, we have been unable to determine how much. It does not appear that the projects
have made progress in reducing production costs of advanced ethanol, and it could not be
determined whether a project to optimize a medium-duty truck engine to run on E85 made
progress in improving vehicle performance.
In the case of natural gas and biomethane, there is clear evidence of impact in terms of
developing new biomethane production capacity and increasing the number of natural gas
vehicle (NGV) fueling stations. ARFVTP-funded projects have approximately doubled the
biomethane production capacity in California. Similarly, 42 percent of new liquid natural gas
(LNG) stations and 22 percent of new compressed natural gas (CNG) stations in California added
since 2008 were funded by ARFVTP projects. The program also provided substantial funding
for subsidies for the purchase of NGVs, which addresses the vehicle price barrier.
There was also progress in introducing and/or more efficiently utilizing feedstocks for
biomethane production and increased public awareness, although the magnitude of these
contributions is unclear. Some vehicle technology–development projects helped to demonstrate
new methane-powered engines, although, again, the impact is unclear. Finally, there is no
evidence the program reduced vehicle production cost, except perhaps indirectly through larger
sales that can increase production volumes and result in economies of scale.
8.5 Views on ARFVTP Investment Priorities
The ARFVTP has enjoyed considerable success so far; in this section, we summarize
stakeholder views of what it should focus on in the future. Relevant to the discussion is the
health of alternative and renewable fuel and vehicle technology (ARFVT) industries. Lack of
private-investor interest or an inadequate number of firms in the industry suggest an ongoing
need for the program. Thus, we first summarize stakeholder views on the health of ARFVT
industries along these dimensions. Stakeholder views of the need for continued government
involvement are then summarized, followed by suggestions for ARFVTP investment priorities.
8.5.1 State of the ARFVT Industry
The analyses in Chapters 3 through 7 have generally shown that a substantial proportion of
stakeholders see a substantial and growing number of firms in their industries. Perceptions are
fairly consistent across fuel types, although the responses are somewhat more positive for the
hydrogen and electricity industries (top part of Table 8.18).

257
However, a different picture emerges for private investment (the bottom half of the table)—
relatively few perceive that many private investors are interested in their industries or that
private-investor interest is growing.205 Investor interest in the diesel-substitute and gasoline-
substitute industries appears particularly weak.
Table 8.18. Trends in Competition and Private Investment (Percentage Who Agree or Strongly Agree with the Statement)
Statement
All Fuel
Typesa Hydrogen Electricity Diesel
Substitutes Gasoline
Substitutes
Natural Gas and
Biomethane Competition
Currently there are many organizations competing with your organization in the development/deployment of alternative fuels and vehicles
50% 65% 53% 50% 45% 45%
Compared to five years ago, the number of organizations competing with your organization has increased
56% 65% 63% 48% 45% 50%
Private Investment Currently there are many private-sector investors (i.e., nongovernmental funders such as angel investors, venture capital, strategic investors, and banks) interested in your industry
33% 32% 40% 20% 27% 35%
Compared to five years ago, the amount of private investment has increased
32% 33% 39% 11% 14% 27%
Number of respondents 475 43 163 46 22 98 SOURCE: RAND survey. a Includes all survey respondents, including those for workforce and multifuel awards. Thus, the 475 number for “all fuel types” is greater than the sum of the totals of the five fuel types listed.
The availability of qualified workers to work in the ARFVT industries is also important to the
health of these industries. Respondent perceptions on this topic are discussed in Chapter 9.
8.5.2 View of Need for Continued Government Involvement
Tepid private investor interest in the ARFVT industry suggests an ongoing need for government
involvement, and a substantial majority of awardees, unsuccessful applicants, and potential
applicants believe that some type of government involvement continues to be necessary for the
market viability of alternative fuels and vehicles. Only 3 percent of respondents believed that
no government involvement is necessary (Figure 8.3). The percentages for awardees,
unsuccessful applicants, and potential applicants were all low.
Government grant programs that fund demonstration and deployment received the most
support, with approximately 81 percent of survey respondents supporting such a program. The
205Data to corroborate the survey responses on private investment would be desirable, but we have not been able to find adequately disaggregated data. Data on private investment in clean energy, for example, typically includes investment in solar energy.

258
majority of respondents believed that five out of the other six government activities listed in
Figure 8.3 were also necessary for the market viability of alternative fuels and vehicles (and
support for the six was just under 50 percent).
The responses were similar across fuel types.
Figure 8.3. Government Activities Needed to Support the ARFVT Industries
SOURCE: RAND survey. NOTE: For 458 survey respondents who answered question.
8.5.3 Stakeholder Views on Investment Priorities
Stakeholder views on how the ARFVTP should prioritize investments moving forward varied
importantly by fuel type. As expected, stakeholders generally thought that a higher percentage
of ARFVTP funds should be allocated to their fuel types, but they sometimes made useful
observations on how to prioritize investments within their fuel types.
Hydrogen stakeholders saw little need to change the current focus on retail infrastructure
(Table 8.19). Electricity stakeholders tended to call for continued emphasis on increasing the
number of charging stations and more spending on RD&D. Increased funding for bulk fueling
distribution infrastructure was a priority identified by a number of diesel-substitutes
stakeholders, as was funding for in-state production incentives. Diesel-substitute stakeholders
also viewed the current division between RD&D and PD&D as reasonable. The call for in-state
production incentives reflects that fact that in-state biodiesel production capacity now
approximates the volume of biodiesel consumption needed to comply with the LCFS, and it
appears that much of that capacity is currently underutilized.
20%
3%
48%
52%
59%
60%
60%
61%
81%
0% 10% 20% 30% 40% 50% 60% 70% 80% 90%
Other
None
Producer tax breaks or subsidies
Carbon tax or tax on petroleum-‐based fuels
Quan5ty requirements for vehicles or fuels
Consumer awareness programs
Grants for R&D
Consumer tax breaks or purchase subsidies
Grants for demonstra5on and deployment

259
Table 8.19. Stakeholder Views on Investment Priorities for Their Own Fuel Type
Fuel Type Views on Investment Priorities Hydrogen • No need for major adjustments
Electricity • Emphasize placement of more charging stations • More spending on RD&D
Diesel substitutes • Funding for bulk fueling infrastructure remains a priority • Current division between RD&D and PD&D reasonable • Provide production incentives for in-state production
Gasoline substitutes • More funding for RD&D; leave production to the private sector Natural gas and biomethane
• Focus investments on biomethane as opposed to natural gas • Some support for more spending on NGVs
SOURCE: RAND survey. The main message delivered by gasoline-substitutes awardees, unsuccessful applicants, and
potential applicants was that the ARFVTP should focus more on RD&D and leave production to
the private sector. Although there were no widely held views among the natural gas and
biomethane stakeholders, a number suggested that the program focus its attention on
promoting biomethane as opposed to natural gas more generally. Presumably this means
focusing on biomethane production and distribution. Somewhat inconsistent with this, others
supported spending more on NGVs, which would promote natural gas and biomethane use.
Calls for increased RD&D funding by electricity and gasoline-substitutes stakeholders should be
interpreted with caution. Recall from Table 8.3 that the majority of gasoline-substitutes funding
goes to RD&D, and the percentage going to RD&D is far higher than for other fuel types. Survey
participants were provided with the split between RD&D and PD&D for all fuel types combined,
but not for the individual fuel types. Gasoline substitutes respondents who called for more
RD&D spending may not have realized that the ARFVTP already allocated close to 60 percent of
the gasoline-substitutes funding to RD&D. A similar caveat applies to the calls for more
electricity spending on RD&D, although, as shown in Table 8.3, the percentage of electricity
funding allocated to RD&D has so far been modest.
8.6 Conclusions
This chapter has examined how the findings on awardee performance and program impacts
vary across fuel type and by technology development stage. It also combines the results from
the fuel type chapters to provide an overall picture of outcomes for the program as a whole. We
found many commonalities across fuel types, but we also found some important differences.
The barriers targeted and the allocation of program resources across feedstocks and fuel
production, fueling infrastructure, and vehicles vary significantly by fuel type, but awardee
performance was similar across fuel types. Awardees achieved their technical objectives for the
most part across all fuel types and also secured the proposed matching funds. Completing
projects on schedule has been and remains a challenge for all types of awardees.
Findings were similar on the proportion of projects that would not have proceeded without the
ARFVTP, and the awardees of different fuel types reported similar experiences on the impact of
the program on their organizations’ capabilities. Awardees across all fuel types generally
260
continued to develop, market, install, or produce the product or technology funded by the
award. The program helped reduce barriers to market viability of all fuel types, although data
or analysis was unavailable to determine the extent to which the program reduced barriers in
some cases.
We looked for differences between RD&D and PD&D projects, but somewhat to our surprise, no
strong patterns emerged. RD&D projects tend to fall behind schedule more frequently than
PD&D ones, but substantial differences were not detected in several other dimensions. The
frequency with which technical objectives were achieved, the probability that the awardee
would have proceeded with the project without the award, and the proportion of awardees who
continued to develop, market, install, or produce the product or technology funded by the
award were similar for RD&D and PD&D projects. Part of the reason for this is that a number of
projects share both research and production aspects, so the distinction between many RD&D
and PD&D projects may not be as clear as the labels suggest.
It is more difficult to evaluate the impact of RD&D projects than the impact of PD&D projects,
because RD&D projects do not typically influence measureable market indicators. This is
reflected by those cells in Table 8.17 for which we could not determine the impact of the
program. However, that does not mean that the program should fund only projects with more
easily measured outcomes, such as the number of charging stations placed or the amount of
production capacity installed. RD&D projects may create the processes or develop the
knowledge that helps reduce production costs or broaden the range of feedstocks that can be
used in the future.
There do appear to be differences in the health and dynamism of the different fuel type sectors.
The hydrogen and electricity sectors appear on the upswing, while the diesel-substitutes and
gasoline-substitutes sectors seem less dynamic. The natural gas and biomethane sector appears
somewhere in the middle. Nevertheless, based on the survey responses, private investor interest
does not appear strong in any sector, and stakeholders from all sectors overwhelmingly saw a
role for continued government involvement in the markets for alternative fuels and vehicles.
In the next chapter, we turn to the impact of the ARFVTP on employment and workforce
capabilities.

261
CHAPTER 9: Impact of Program on Employment and Workforce Capabilities
Workforce development is a natural complement to the technology investments discussed in
the previous chapters. To realize the investments in alternative and renewable fuel and vehicle
technology (ARFVT), employers need workers with relevant skills. This is particularly so when
an industry is new, because these required skills may not be produced by existing education
and training programs.
The evaluation in this chapter reflects the stated Alternative and Renewable Fuel and Vehicle
Technology Program (ARFVTP) goal noted in Chapter 1 of building the workforce for the ARFVT
industries. We begin by reviewing the rationale for public investment in workforce development
and summarizing the barriers that a new industry faces in developing its workforce. We then
use this rationale and the barriers to examine the implementation and impact of three large
contracts specifically targeted to workforce development. We continue by reviewing the
workforce impacts and employment issues related to the individual projects. We conclude with
a review of attempts to measure the growth and quality of the workforce of interest.
9.1 Rationales for Public Intervention in Workforce Development
Before we discuss workforce development specifically in the ARFVTP, we introduce a simple
theoretical framework for understanding how workers acquire skills and the common
arrangements for financing skill development.
A worker’s capacity to perform depends on his or her personal work-related competencies,
which may include knowledge, skills, abilities, and attitudes. Human capital theories commonly
distinguish general competency (or generalizable) development from firm-specific development
in common workforce environments.206 General development, such as literacy, is generalizable
to many different situations. Thus, it can benefit both employees and almost all employers. In
contrast, firm-specific development provides only a very limited range of knowledge and skills,
and they are of value to only a small number of employers. A third type of development is
industry-specific, which can benefit most (if not all) employers that are in a particular industry.
206 Gary Becker developed and articulated this theory in his seminal work (Gary S. Becker, Human Capital: A Theoretical and Empirical Analysis, with Special Reference to Education, 3rd ed., Chicago, Ill.: University of Chicago Press, 1993). This discussion draws on his formulation and extensions made by more recent researchers (Daron Acemoglu and Jörn-Steffen Pischke, “Beyond Becker: Training in Imperfect Labour Markets,” The Economic Journal, Vol. 109, No. 453, 1999, Features, pp. F112–F142; Edwin Leuven, “The Economics of Private Sector Training: A Survey of the Literature,” Journal of Economic Surveys, Vol. 19, No. 1, February 2005, pp. 91–111; and Edward P. Lazear, “Firm-Specific Human Capital: A Skill-Weights Approach,” Journal of Political Economy, Vol. 117, No. 5, October 2009).

262
General competency development is most commonly acquired through formal schooling, such
as primary, secondary, and postsecondary education, before an employee is hired. Firm-specific
development is most common after hiring, such as through on-the-job training where
employees learn while doing productive work, perhaps with more experienced employees or
managers as mentors. Industry-specific development might be attained through career and
technical education in high schools, community colleges, and other educational institutions,
where there are very close and deliberate connections between curricula and employers within
specific industries. In this sense, associate degrees and certificates may be more specifically
linked to an industry than bachelor’s degrees.
According to human capital theory, employers are reluctant to provide general skills training
after hiring employees because these general skills will raise the “productive value” (i.e., general
competence) of employees. As a result, those employees are more likely to be lured away by
other employers competing in the general labor market.
Workforce development that is truly firm-specific has limited value outside a specific firm. For
these types of knowledge and skills, the employer can capture the full benefit of development
because the firm’s employees cannot transfer the company-provided development to more
attractive jobs at other firms.
Workforce development, then, can be divided into three broad categories, each of which has
distinct types of sponsors. These relationships are shown in Table 9.1, where funding for
developmental programs, shown in the shaded cells, is limited to four of the most common
sources. Those sources include government (at all levels), unions (labor and trade), employers
(i.e., individual firms), and the individuals who acquire the development (including self-
development).
Table 9.1. Typical Sponsors of Competency Development
Competency Type Category
Typical Funders
Government Unions Employers Individuals
General
Industry-specific
Firm-specific
SOURCE: Designed by authors based on references cited in text.
Table 9.1 shows that all the typical funding sources might sponsor industry-specific
development, while only employers are likely to sponsor firm-specific development. Both
government sources and individuals are the most common sponsors of general competency
development.

263
Given these different sources and types of incentives, there is justification for the public
subsidy of general education programs, such as those offered for individuals enrolled in college
degree and certificate programs. The rationale of human capital runs as follows: The recipients
of that general education can transfer their knowledge and skills virtually anywhere and have
no obligation to apply them at any particular firm. Because general education confers general
benefits (plus long periods of costly development and delivery), individual firms have very
limited incentive to make investments of time and capital in them. Therefore, the public has
chosen to improve society by subsidizing public (general) education.
Using the same line of reasoning, there is generally not a strong justification for the public to
subsidize employer-specific development. This form of development is so specific to the firm
that each employer is free to decide whether it makes financial sense to develop those types of
knowledge and skills, given that it will bear the full costs and reap the full benefits from this
form of workforce development. But there are definite exceptions to this general presumption
against public financing of employer-specific skills development, as we discuss next.
Workforce development in industry-specific skills follows something of a middle ground
between employer-specific and general. An industry’s developmental needs might not be
sufficiently addressed by general education alone, but these needs are too broad to be
considered employer-specific. This gap has traditionally been filled by career and technical
education in high schools and community colleges. These schools and colleges rely heavily on
public funding to offer industry-specific programs and certificates (as well as general skills
development).
When it comes to new and emerging technologies, the incentives for workforce development
might be even less straightforward. Simply by being new and emerging, firms in new technology
sectors usually extend beyond single employers, but they might not yet constitute a recognized
industry. In addition, the state of new technologies might not yet be sufficiently advanced to
develop general education programs suitable for degree or certificate programs.
In new industries, high schools and community colleges might have insufficient information
about employer needs, and firms in new industries might lack sufficient resources to acquire
physical capital both for production processes and for developing the knowledge and skills
necessary to operate those processes. Any party that subsidizes general skill programs risks a
mismatch between the knowledge and skills developed and the knowledge and skills needed by
employers. So for all these reasons, there may be justification for overturning the usual
presumption that public subsidies should go to general rather than more specific knowledge
and skill development.
Turning specifically to the ARFVT industry, the RAND survey provides evidence that some
public intervention in industry-specific (and possibly firm-specific) skills development has been
warranted. Figure 3.1 in Chapter 3 shows that 32 percent of 41 hydrogen-related survey
respondents who identified at least one current barrier to alternative fuels and vehicles
indicated that “insufficient pool of labor familiar with alternative fuels and vehicles” is a
current barrier to the market viability of alternative fuels and vehicles. The percentages were

264
lower, but of similar magnitude, for electric vehicle (EV)–related and natural gas and
biomethane stakeholders (22 and 26 percent, see Figures 4.1 and 7.1). Less than 20 percent of
diesel-substitute and gasoline-substitute stakeholders indicated an insufficient labor pool
familiar with alternative fuels and vehicles was a barrier (Figures 5.1 and 6.1).
9.2 Potential Barriers to Workforce Development
Building on the theoretical framework in the previous section, here we draw out a set of
barriers that emerging industries such as the ARVFT industries face.
In the broadest sense, barriers to workforce development may be similar to those that all
businesses face: limited time and resources in the face of many competing demands for
investment. For the ARFVT industries, barriers to workforce development are likely to be those
faced specifically by new and emerging industries. Foremost of those expected barriers is the
shortage of workers who possess all the knowledge, skills, and abilities needed for successful
performance on the job. An existing workforce might develop such competencies over a period
of time, but an expanding workforce needs more immediate sources—or pipelines—of new
employees who are already qualified for the work.207
We identify four major barriers to workforce development in new and emerging industries such
as the ARFVT industries.
9.2.1 Limited Understanding of the Industry’s Education and Training Needs
Because requirements are still developing rapidly, firms in newer industries may lack clarity
about what the new competency requirements are in general and, in particular, the specific
types of knowledge, skills, and abilities they need. In addition to identifying new qualifications,
such firms must ensure that the requirements also include the extent of mastery called for and
methods for employers to provide the needed development most effectively. Particularly in new
technologies, these requirements can be unclear because required skill sets can change quickly
as the technology evolves.208
9.2.2 Limited Capacity to Train Workers
As technology emerges, the knowledge, skills, and abilities required to work proficiently with
that technology are typically identified only by hands-on experience and ongoing analyses by
senior professionals in the field. That process is iterative, repeating itself as the field evolves
with new equipment, materials, and techniques. Thus, the process of creating effective
development strategies can be lengthy and expensive and have abundant challenges. Given that
new firms typically have limited capacity in general, their ability to train and develop their own
workforces might also be especially limited for many years.
207Federal Reserve Bank of San Francisco, “Lessons for a New Context: Workforce Development in an Era of Economic Challenge,” Community Investments, Vol. 21, No. 1, Spring 2009. 208New Mexico State University, Arrowhead Center, Identification of Key Barriers in Workforce Development, Las Cruces, N. M.: National Security Preparedness Project Grant No: DE-FG52-07NA28084, March 31, 2008.

265
9.2.3 Limited Interest in New Careers
Outside the individual firms in the new industry, limited coordination can be expected among
those sectors of society that are tasked with planning and developing education, training, and
pipelines of industry talent. New industries are relatively unknown and poorly understood until
they achieve a sufficient critical mass to gain the public’s attention and interest. Potential
campus recruits for such industries are less likely to learn about or understand those
industries’ unique career opportunities and, thus, are less likely to search out those
opportunities. Even then, efforts to target new career paths might remain dormant until
significant effort is made to raise the profile of the new industry. The up-front investment in
such programs can be risky, of substantial size, and unlikely to earn any return for years to
come.
9.2.4 Limited Coordination Within Sectors to Plan Education and Training
Virtually by definition, new and emerging industries have not had time to develop and mature
on the order that established industries have. Thus, activities that make up workforce
developmental programs have not had time to become normative to the industry, and local
workforce development resources have not been fully explored. During this period, plans for
long-range training and education often must rely on educated guesses as much as they do on
established facts.
9.3 ARFVTP Awards for Workforce Development
Arguably in recognition of the workforce development barriers in the ARFVT industry, the
California Energy Commission (CEC) awarded $25.2 million in funding specifically targeted to
labor market and employee development for ARFVT industries between 2009 and 2016. These
awards were made through interagency agreements with three agencies of the state of
California. These awards are summarized in Table 9.2. In contrast to many of the project
awards reviewed in previous chapters, these awards continued year after year, with periodic
increments of funding, and each was performed through networks of subawardees, which
reached across the state.
Table 9.2. ARFVTP Awards (Interagency Agreements) for Workforce Development
Awardee Start End Funding as of
June 2016 ($ M)
Invoices Paid Through
Dec 2016 ($ M)
Employment Development Department (EDD) 2009 Ongoing 8.2 8.0
California Community Colleges (CCCCO) 2009 2015 5.5 5.5
Employment Training Panel (ETP) 2010 Ongoing 11.5 6.8
Total 25.2 20.3 SOURCE: CEC agreement records.
The California Employment Development Department (EDD) funded several activities,
including labor market research, regional training initiatives, and Regional Industry Clusters of

266
Opportunity (RICOs). RICO funding included funding for network building across several
phases, for talent pipeline development, and for ten multiple-industry sectors, of which five
were related to ARFVT and funded by Assembly Bill (AB) 118 awards.
The California Community College Chancellor’s Office (CCCCO) funded analytical studies of
the ARFVT industry’s education and training needs, both short- and long-term. Those studies
included analyses of employer needs and community college capabilities and opportunities to
develop ARFVT programs. Program development was also funded for designing and developing
community college programs. Included in those funds for college programs were the costs of
curriculum design, materials, faculty development, and equipment.
The Employment Training Panel (ETP) funded firm-specific and industry-specific training. ETP
is funded on an ongoing basis by the Employment Training Tax on private-sector payrolls, and
it normally makes awards to for-profit firms to fund worker training. Employers must pay
upfront—and receive reimbursement—only for trainees who complete training and remain
employed for 90 days at specific hourly wages.
AB 118 funding allowed ETP to make many more awards to ARFVT firms and to make awards to
public-sector organizations such as transit agencies. Many providers, including community
colleges, used ETP awards to deliver training and development services.
Table 9.3 summarizes how these three award programs targeted the four barriers discussed
earlier. The EDD and CCCCO research awards were used to fund analytical studies of the ARFVT
workforce training and development needs of both employers and the industry in general.
These studies were intended to allow the funding departments to acquire a better
understanding of the emerging occupations and competency requirements within the industry.
That knowledge would then enable department managers to focus their AB 118 program award
funds most effectively.
Table 9.3. Barriers to ARFVT Industry Workforce Development Targeted by Workforce Awards
Barrier
Targeted by
EDD CCCCO ETP
Limited understanding of the industry’s education and training needs X X
Limited capacity to train workers X X X
Limited interest in new careers X X
Limited coordination within sectors to plan education and training X
SOURCE: Authors.
All three agreements were intended to address the ARFVT industry’s capacity to train and
develop workers. The programs provided both employer- and industry-specific training. The
CCCCO agreements also funded the development of curricula and materials for new
educational programs that were aligned with AB 118 goals and ARFVT capacity needs. Where

267
appropriate, funds also could be used to purchase training equipment and to obtain private
sector training for college instructors.
9.3.1 Employment Development Department
The EDD funded three types of initiatives using the CEC’s funding. First, EDD funded a series of
regional training initiatives related to ARFVT industries. Second, EDD funded research into
ARFVT labor market and employer needs. Finally, EDD funded and continues to fund the RICOs
introduced earlier in this chapter.
9.3.1.1 Regional Training Initiatives
From 2009 to 2012, the EDD used CEC funding to make awards to regional workforce boards
for training initiatives related to ARFVT industries. These awards were provided to eight
regions of the state, as shown in Table 9.4.
Table 9.4. EDD ARFVT Workforce Training Programs, 2009–2012
Region or County Primary Training Topics
Long Beach Liquefied Natural Gas (LNG)/Compressed Natural Gas (CNG)/Hybrid
Richmond CNG/hybrid Sacramento CNG/hybrid/electric Los Angeles Electric/transit vehicle conversions Imperial Biofuel production Solano Hybrid vehicle maintenance NorTec (11 northern counties) Propane conversion and maintenance Orange Hybrid/EV maintenance SOURCE: EDD award records.
Unfortunately, background records from the first set of task activities could not be provided by
EDD because they were destroyed under the agency’s record-retention policies. In addition, EDD
and CEC staff reported to us that during the early stages of their agreement, EDD faced
significant budget cuts and personnel turnover, so we were unable to locate agency staff with
direct knowledge of these activities. Although CEC staff gave us a general overview of this early-
stage work, we do not have detailed information on the activities performed or their impact. As
a result, we cannot assess these activities.
9.3.1.2 Labor Market Research
When new industries and occupations develop, formal labor market statistics programs often
take years to modify data collection and reporting systems to capture the new occupations and
industries. Thus, it is challenging to measure the labor force in new industries such as ARFVT,
and, thus, worthwhile to undertake specific efforts to collect baseline and trend data.
According to our interviews, the U.S. Department of Labor was working to develop a
classification of green jobs for national statistics during this period. However, that effort was
terminated prematurely in 2013 when the federal budget was sequestered. As a result, national
standards and data on this workforce were unavailable.

268
Under other funding, the EDD Labor Market Information Division (LMID) conducted the
California Green Jobs Survey in 2009 and 2010 (described in Section 9.6.1). To increase
knowledge of current employment, employer demand, and current and emerging ARFVT
occupations, the LMID worked with CEC to identify ways to use and interpret the Green Jobs
Survey data specifically in ways relevant to the ARFVTP.
9.3.1.3 Regional Industry Clusters of Opportunity
Beginning in 2009, CEC provided funding to the California Workforce Investment Board (now
the California Workforce Development Board [CWDB]) through EDD (which manages its
finances) to develop and implement strategies that would advance regional economies and
workforce in targeted clusters related to ARFVT.
The workforce board funded a new concept called RICOs, which were intended to develop
regionally integrated networks of agencies and colleges to serve the needs of several industries.
The EDD used CEC funding for five RICOs related to ARFVT industries and used other funding
to support five more RICOs in health care and other industries. The RICOs had three primary
goals: (1) provide a convenient source for labor market information, (2) match employees and
potential employees to training and employment, and (3) promote investment and growth in the
targeted industries.
The RICOs’ overarching strategy for this effort was to work at local and regional levels to create
partnerships between employers and public agencies for shared efforts in economic
development in the targeted industry or cluster. According to program managers and
participants we interviewed, all the work was to be identified and performed by local and
regional partners to apply the available CEC award funds in ways that responded effectively to
local needs and opportunities.
The process was extensively data-driven. The state workforce board hired Collaborative
Economics (COECON) to conduct custom data analysis on ARFVT employment in the five
regions: (1) Orange and Los Angeles counties; (2) Sacramento; (3) San Diego and Imperial
counties; (4) San Joaquin Valley; and (5) Silicon Valley. We present an overview of that research
in Section 9.5.2.
COECON staff facilitated each RICO regional team to convene industry and public-sector
partners, examine the available data on their industry and workforce, and identify
opportunities for workforce and economic development within that region based on the data
and stakeholder engagements. Each team was told to develop a workable plan for action that
included defined roles and specific commitments from all the key parties taking part. The five
ARFVT regions chosen for RICO awards and their respective targets for growth in advanced
transportation development were described in a 2014 RICO report209 and are summarized in
Table 9.5.
209COECON, How California Regions Are Expanding the Advanced Transportation Industry, December 2014.
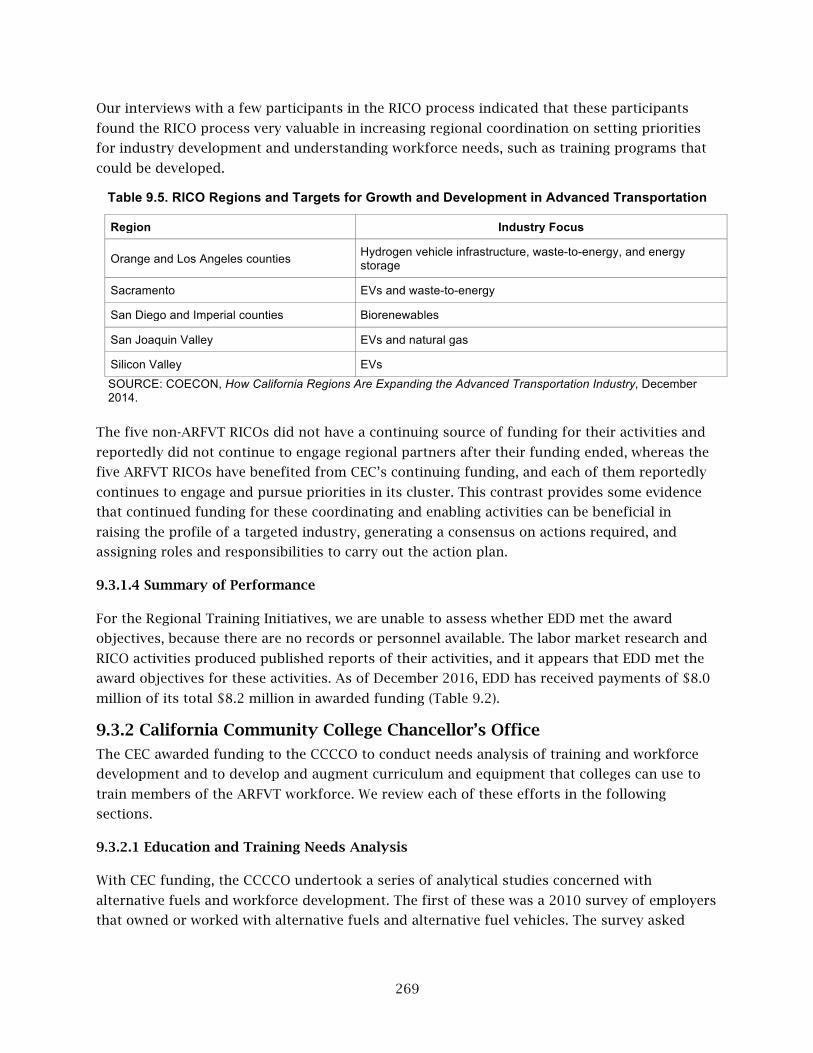
269
Our interviews with a few participants in the RICO process indicated that these participants
found the RICO process very valuable in increasing regional coordination on setting priorities
for industry development and understanding workforce needs, such as training programs that
could be developed.
Table 9.5. RICO Regions and Targets for Growth and Development in Advanced Transportation
Region Industry Focus
Orange and Los Angeles counties Hydrogen vehicle infrastructure, waste-to-energy, and energy storage
Sacramento EVs and waste-to-energy
San Diego and Imperial counties Biorenewables
San Joaquin Valley EVs and natural gas
Silicon Valley EVs SOURCE: COECON, How California Regions Are Expanding the Advanced Transportation Industry, December 2014.
The five non-ARFVT RICOs did not have a continuing source of funding for their activities and
reportedly did not continue to engage regional partners after their funding ended, whereas the
five ARFVT RICOs have benefited from CEC’s continuing funding, and each of them reportedly
continues to engage and pursue priorities in its cluster. This contrast provides some evidence
that continued funding for these coordinating and enabling activities can be beneficial in
raising the profile of a targeted industry, generating a consensus on actions required, and
assigning roles and responsibilities to carry out the action plan.
9.3.1.4 Summary of Performance
For the Regional Training Initiatives, we are unable to assess whether EDD met the award
objectives, because there are no records or personnel available. The labor market research and
RICO activities produced published reports of their activities, and it appears that EDD met the
award objectives for these activities. As of December 2016, EDD has received payments of $8.0
million of its total $8.2 million in awarded funding (Table 9.2).
9.3.2 California Community College Chancellor’s Office
The CEC awarded funding to the CCCCO to conduct needs analysis of training and workforce
development and to develop and augment curriculum and equipment that colleges can use to
train members of the ARFVT workforce. We review each of these efforts in the following
sections.
9.3.2.1 Education and Training Needs Analysis
With CEC funding, the CCCCO undertook a series of analytical studies concerned with
alternative fuels and workforce development. The first of these was a 2010 survey of employers
that owned or worked with alternative fuels and alternative fuel vehicles. The survey asked

270
employers about their current and future vehicle use, their current occupational employment,
and their need for, or interest in, specific training topics.210
The overall results from the needs survey showed that employers saw clear differences among
ARFVT types of workforce development needs. As summarized in Figure 9.1, a majority of
employers indicated a need for all seven training areas presented in the survey. Fuel-station
maintenance was the least frequently cited (32 percent immediate needs and 21 percent future
needs, for a total of 53 percent). Engine diagnosis and repair was the most frequently cited,
with a total of 87 percent citing either immediate or future needs.
Figure 9.1. Employer Training Needs Survey Results, CCCCO, 2010
SOURCE: CCCCO, Training Needs Assessment: Alternative Fuels and Alternative Fuel Vehicles, November 2010. NOTE: Based on 77 respondents to the CCCCO survey.
The CCCCO also surveyed the administrative programs at community colleges on alternative
fuel course topics and made recommendations for new or expanded programs to meet industry
needs.211
210CCCCO, Training Needs Assessment: Alternative Fuels and Alternative Fuel Vehicles, 2010. 211The 14 colleges that responded to the survey were Cerritos, Rio Hondo, Long Beach City, Cypress and Los Angeles Trade Technical colleges, and College of the Desert (in the Los Angeles region); American River College, Yuba College, and Solano College (in the Sacramento region); Fresno City College (in the San Joaquin Valley region); De Anza College and Evergreen College (in the Bay Area region); Imperial Valley College (in the Imperial Valley region); and San Diego Miramar College (in the San Diego region).
25
32
36
39
43
43
57
31
21
17
32
19
27
30
0 20 40 60 80 100
Fuel proper5es
Fuel sta5on maintenance
First responder safety training
High-‐pressure fuel systems analysis
Emissions systems inspec5on
Electrical drive systems and barery technologies
Engine diagnosis and repair
Percentage of respondents
Immediate need (next 6 months) Future need (next 2 years)

271
The final report of the survey provided a list of recommendations for training programs to be
developed at specific community colleges in identified regions of the state.212
9.3.2.2 Community College Program Development
Based on the needs analysis survey findings, the CCCCO and the CEC worked together to
identify colleges that might benefit most from funding to meet the training needs of the
employers in their region. Each college had particular needs, and its funding requests were
approved jointly by CCCCO and the CEC. Providing the training necessary to meet the needs of
their respective employers required that students be exposed to the kinds of vehicles and
equipment used on the shop floor. As shown by the examples listed in Table 9.6, much of the
need was in diagnostic equipment, upgrading of curriculum, and even complete vehicles.213
Table 9.6. Summary of Community College Equipment Acquisition and Curriculum Development
Community College Use of Funds
Fresno City College Hybrid motor/generator diagnostic sets; Honda/Toyota–specific scanning tools
Cerritos College CNG and hydrogen fuel cell curriculum development; professional development for instructors; CNG and EV equipment and supplies
Rio Hondo College Curriculum development, including new associate of arts degree design and approval; certificate of achievement for hybrid-battery-electric-fuel-cell technician; professional development
Imperial Valley College Supplies and equipment for CNG, plug-in hybrid, EV and fuel cell training
College of the Desert Curriculum development and updates; professional development to certify instructors in CNG inspection, diagnostic equipment
SOURCE: CCCCO award reports to CEC. Table 9.7 shows three colleges that received additional funding to create new curricula and to
update existing curricula that were being shared with other community colleges statewide. All
three colleges did outreach and training for instructors statewide, including high school
instructors looking to improve their curricula and thereby provide a pipeline into the
community colleges.
212CCCCO, Program Assessment of Regional Community College Alternative Fuels Technical Education Programs, May 2013. 213CCCCO, ARFVTP Final Project Report, June 2015.
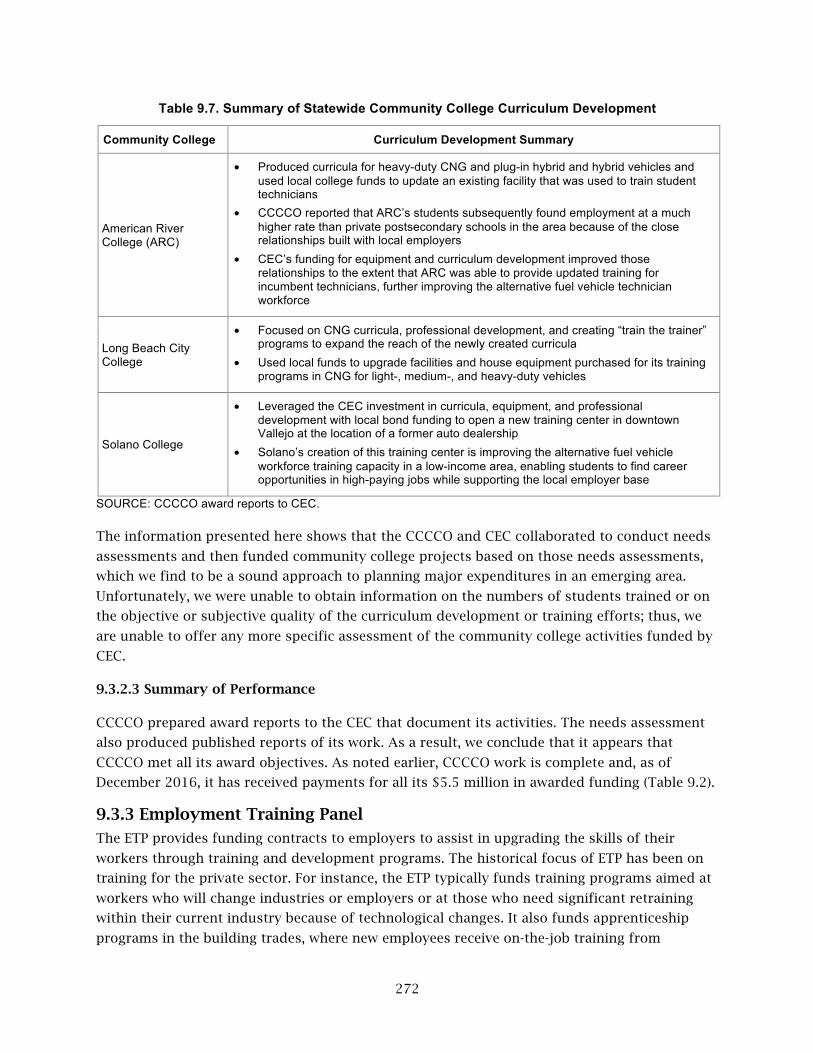
272
Table 9.7. Summary of Statewide Community College Curriculum Development
Community College Curriculum Development Summary
American River College (ARC)
• Produced curricula for heavy-duty CNG and plug-in hybrid and hybrid vehicles and used local college funds to update an existing facility that was used to train student technicians
• CCCCO reported that ARC’s students subsequently found employment at a much higher rate than private postsecondary schools in the area because of the close relationships built with local employers
• CEC’s funding for equipment and curriculum development improved those relationships to the extent that ARC was able to provide updated training for incumbent technicians, further improving the alternative fuel vehicle technician workforce
Long Beach City College
• Focused on CNG curricula, professional development, and creating “train the trainer” programs to expand the reach of the newly created curricula
• Used local funds to upgrade facilities and house equipment purchased for its training programs in CNG for light-, medium-, and heavy-duty vehicles
Solano College
• Leveraged the CEC investment in curricula, equipment, and professional development with local bond funding to open a new training center in downtown Vallejo at the location of a former auto dealership
• Solano’s creation of this training center is improving the alternative fuel vehicle workforce training capacity in a low-income area, enabling students to find career opportunities in high-paying jobs while supporting the local employer base
SOURCE: CCCCO award reports to CEC. The information presented here shows that the CCCCO and CEC collaborated to conduct needs
assessments and then funded community college projects based on those needs assessments,
which we find to be a sound approach to planning major expenditures in an emerging area.
Unfortunately, we were unable to obtain information on the numbers of students trained or on
the objective or subjective quality of the curriculum development or training efforts; thus, we
are unable to offer any more specific assessment of the community college activities funded by
CEC.
9.3.2.3 Summary of Performance
CCCCO prepared award reports to the CEC that document its activities. The needs assessment
also produced published reports of its work. As a result, we conclude that it appears that
CCCCO met all its award objectives. As noted earlier, CCCCO work is complete and, as of
December 2016, it has received payments for all its $5.5 million in awarded funding (Table 9.2).
9.3.3 Employment Training Panel
The ETP provides funding contracts to employers to assist in upgrading the skills of their
workers through training and development programs. The historical focus of ETP has been on
training for the private sector. For instance, the ETP typically funds training programs aimed at
workers who will change industries or employers or at those who need significant retraining
within their current industry because of technological changes. It also funds apprenticeship
programs in the building trades, where new employees receive on-the-job training from

273
experienced professionals in preparation for career employment. The ETP’s core program is
funded by a payroll tax on private-sector employers in California, so only private-sector
employers are eligible for its core funding.
9.3.3.1 Structure of ETP Contracts in General
Employers define their training needs and contract for the training delivery through companies,
individuals, or community colleges. Applicants must meet program requirements and must be
approved by the panel. ETP staff assist companies in learning about the opportunity, preparing
their applications, and identifying their needs and potential training providers. Once a contract
is approved, ETP staff monitor the performance of the contract, including in-person or virtual
site visits to observe training, review enrollment records, and help recipients troubleshoot any
issues that arise during the contract. ETP also performs audits of contracts.
ETP uses a performance-based contracting system that helps maximize the impact of money
invested in its projects. A key aspect is that payments are made only for employees who
complete training, are retained in the targeted employment, and earn a minimum wage level.
Specifically, a company can claim funds under its ETP award only when
1. the trainee completed all hours and courses of training
2. the trainee was retained by the employer for a specified minimum time period (normally
90 consecutive days of full-time employment)
3. the trainee was paid at least a specified hourly wage (based on region of the state)
during the retention period.
Employer expenses were not reimbursed for trainees who did not complete the designated
training or who do not remain employed through the full 90-day retention period.
ETP contracts can be awarded to a single employer or to an organization that works on behalf
of multiple employers in the same or similar industries. Community colleges, labor unions, and
industry associations all serve as the managers for these multiemployer contracts.
9.3.3.2 Structure of ETP’s ARFVT Training Program
Starting in 2009 and periodically since then, CEC has awarded funds to ETP to implement an
employer-based training program to develop the ARFVTP workforce. The initial agreement
provided $6 million in funding, and later increments have increased cumulative funding to
$11.5 million as of June 2016. Ten percent of the total funding is allocated to ETP’s costs of
administering the program, and the remaining 90 percent ($10.34 million) is intended for
training contracts. Because this program is funded separately from ETP’s core program, ETP is
permitted to make awards to public agencies and private-sector firms.214
Aside from making awards to a broader class of eligible employers, ETP decided to follow all
the other requirements of its core program, including the three criteria listed above for
payment eligibility. As a result of these requirements, some awardees do not claim the full
214California Employment Training Panel, Employment Training Panel Annual Report 2014–2015, undated.

274
amount of their ETP awards. When that happens, ETP can recycle the unspent funds to new
awardees after the contract ends. The other principal program change is that the training
curriculum was limited to the technical training directly supporting the development and
deployment of alternative fuels technologies. As a result, the ETP agreements approved under
the ARFVTP were initially more restrictive that those under ETP’s core program.
As an example of this process, in 2012 ETP awarded a training contract to an auto dealership
that was intended to impart commercial skills to employees for the sales and servicing of
hybrid vehicles. ETP awarded a contract allowing up to $136,708 for the training of 201
employees, and 201 employees were enrolled in the program. However, only 41 employees
completed the training program and were retained in employment for the full 90-day retention
period to trigger reimbursement of the training expenses. For the employees that met ETP’s
requirements, the employer earned $22,996, only about 17 percent of the ETP funds committed
to the project. ETP did not reimburse any expenses that the employer incurred for the
employees who were enrolled in the program but who were not retained. The unclaimed
amount of $151,712 was retained by ETP and became available for ETP’s investments in other
development projects after this contract was closed.
As a result of this recycling of unspent funds, the ETP has awarded $13.1 million in training
contracts to date, more than the $10.3 million in actual funds available for training contracts.
The ETP needed a new budgetary authority from the Legislature to make the process of
funding, making awards, and recycling unspent funds more timely and efficient. For several
years, the ETP has not needed to request funding from CEC, because it still had sufficient
unspent amounts from prior CEC funding increments. In fiscal year (FY) 2012–2013, ETP
received $3.0 million in reimbursable spending authority from the state. That enabled ETP to
receive, market, and use ARFVTP funds starting at the beginning of the fiscal year rather than
having to wait months, as had been the practice in the past. The amount of $3.0 million was
based on ETP’s average expenditures of ARFVTP funds over the prior three fiscal years.
In FY 2013–2014, to support the ARFVTP on an ongoing basis, the state granted ETP approval
for $3.0 million in ongoing reimbursable budget authority, year after year. Prior to June 30,
2014, $1.68 million in nonobligated funds reverted to CEC because of spending authority
limitations. The reversion did not affect ETP’s current awarded contracts, but it made it more
cumbersome to recycle unspent funding into new projects.
9.3.3.3 Outcomes of ETP’s ARFVT Training Program
ETP awarded 43 contracts between FY 2010 and FY 2016. Seven of these contracts were never
executed; the recipients decided that they would not proceed with the approved training project
either before signing the contract or before they incurred any expenses, so those seven
contracts were closed without any expenditure. As a result, ETP awarded 36 contracts that were
performed. In the remainder of our analysis, we will consider only these 36 contracts.
ETP also awarded a few contracts that were initially intended to be funded with CEC funding,
because they supported the goals of the ARFVTP, but ultimately were funded out of ETP’s core

275
funding, which allowed for more flexibility with regard to training curriculum selection. We did
not examine the performance of these core-funded contracts.
Of the 36 contracts, 17 (47 percent) were awarded to multiemployer consortia, and 19 (53
percent) were awarded to individual employers. Of the 19 individual awards, seven went to
businesses with fewer than 500 employees, and the remaining 12 went to larger companies.
Multiemployer consortia were used for a variety of purposes. Some consortia benefited multiple
private-sector employers. Several of them served public-sector employers such as transit
agencies. ETP staff reported that multiemployer contracts are typically simpler to award for
ARFVTP training that benefits public employers, so that these local government agencies and
municipalities do not have to undertake the administrative work of contracting with ETP
directly.
Some recipients received a second or third contract after completing their first two-year
agreement. There were a total of 27 discrete recipients within the 36 awarded contracts.
Training covered a number of broad topics, which we list in Figure 9.2. The figure gives the
percentage of contracts that covered each topic. Commercial skills, continuous process
improvement, and advanced technology (with specific content related to ARFVT) are the most
common topics, and each contract typically covers a number of skills, so the percentages add to
more than 100.
Figure 9.2. Training Topics Covered by ETP Training Contracts
SOURCE: RAND analysis of ETP contracts. NOTE: Percentages add to more than 100 because each contract covers multiple topics.
As noted, AB 118 funding allowed ETP to make awards to public agencies. It supported worker
retraining at three public transit agencies in the state under three ETP multiemployer training
6%
11%
14%
17%
17%
36%
39%
72%
0 20 40 60 80
Management Skills
Hazardous Materials
Business Skills
Manufacturing Skills
Computer Skills
Advanced Technology
Con5nuous Process Improvement
Commercial Skills
Percentage of contracts

276
contracts in succession. These contracts provided training for employees of these agencies on
the maintenance of alternative fuel buses, light rail, and related infrastructure.
Most of the 2014 contracts and all the 2015 and 2016 ones are ongoing as of the 2016 data we
received; thus, there are 22 completed contracts that originated between 2010 and 2014. Table
9.8 provides a summary of the experiences of the full set of 36 contracts and of the 22
complete contracts. The completed contracts permit analysis of their outcomes, whereas the
full set of them contains open contracts that may continue to generate training and payments.
Table 9.8. Summary of Performance on ETP Contracts
Total Contracts Completed Contracts
Total Median per Contract Total Median per
Contract Trainees
Projected 16,329 155 12,403 364 Enrolled 17,973 143 14,246 209 Placed to date 6,785 35 6,768 141
Contract Value ($) Awarded $13,157,079 $365,958 $9,770,448 $436,654 Paid through January 2016 $5,527,022 $28,027 $5,502,044 $67,922 SOURCE: RAND analysis of ETP contracts. NOTE: Based on 36 total contracts and 22 completed contracts.
Table 9.8’s analysis of the completed contracts shows that the outcomes fell short of the
anticipated level of training. These contracts called for 12,403 trainees to be placed. While
14,246 were enrolled, only 6,768 were placed and met the full set of criteria for payment. As a
result, recipients received only about $5.5 million rather than the nearly $9.8 million in contract
amounts awarded. ETP invoiced CEC only for the amounts it actually paid out, plus its
administrative allowance. The unspent funds are recycled over time into new ETP awards. These
completed contracts received 56 percent of their awarded funding, which is notably lower than
the average of 78 percent that ETP reported that core program contractors received. This lower
usage rate may reflect the rapidly changing needs in the new ARFVT market. ETP staff told us
they expect higher usage rates on newer contracts because needs have become clearer.
The contracts as a whole anticipate spending about $900 per placed trainee, and the completed
contracts show an average cost per placed trainee of about $800. For completed contracts, the
trainees received a median of 48 hours each in training, which is almost equal to the anticipated
value of 46 hours.
The structure of ETP’s requirements means that money is expended only when a specific
employee is trained and employed (for at least 90 days). As a result, unlike the efforts under
the EDD and CCCCO awards, we know that a certain number of employees have been trained
with the ETP funding. We do not have information on the objective or subjective quality of the
training, but the ETP process of making the employer responsible for the training, with
oversight from ETP staff, ought to promote relevant and high-quality training.
277
9.3.3.4 Summary of Performance
ETP prepared annual reports to CEC that document its activities. ETP appears to have used CEC
funding for its intended objectives, although, as noted earlier, several awardees were not able
to use the funds they were awarded. In total, only a little over half the intended trainees have
actually been placed on the completed contracts. Because of this lower placement amount, the
corresponding funds are being recycled to fund other awards. As a result, as of December 2016,
CEC has paid only $6.8 million of $11.5 million in awarded funding (Table 9.2), representing the
amounts actually used on awarded projects plus the ETP administrative allowance. It appears
that the funding actually paid corresponds to the training carried out according to the award
objectives. The structure of ETP’s program, where payments are made to employers or
consortia only after training has occurred and they have met all contract requirements, means
that it is possible that in the future, awardees will not receive all their projected award amounts
and ETP will continue to recycle these funds into future awards.
CEC and ETP staff told us that the program’s performance has improved as the training needs
of the alternative fuel workforce have become more clearly articulated. Through ongoing
engagement and a maturing of the marketplace, ETPs’ ARFVTP contracts and program
requirements have adjusted to the training needs of occupations. Additionally, ETP has
increased the flexibility of the ARFVTP contracts, including lowering the minimum number of
training hours required on a case-by-case basis and allowing more flexible training delivery
options, including on-the-job training.
9.4 Employment Effects of Project Awards
The second major topic is the employment effects of CEC’s project awards, as distinct from the
impacts of the three large workforce development contracts reviewed in the previous section.
In the RAND survey, we asked awardees about employment related to their awards. For many
topics, we asked them about employment at their own firms and also at subcontractors,
suppliers, or partners (which we often just call subcontractors for simplicity).
We asked awardees about the number of full-time equivalent (FTE) employees supported by the
award at their own firms and at subcontractors (regardless of whether they were hired
specifically for the project). Table 9.9 shows that 66 percent of awardees reported employment
supported by the award at their own firm, and 68 percent reported it at subcontractors.

278
Table 9.9. Employment Supported by Award
Percentage of Awardees Reporting
Positive Employment No Employment Do Not Know/ No Response
Location Awardee Subcon-tractors Awardee
Subcon-tractors Awardee
Subcon-tractors
California 66 68 20 10 14 22 Rest of the United States 10 17 40 31 49 52
Outside the United States 5 8 44 36 51 56
Anywhere 67 69 19 10 14 22 SOURCE: RAND survey. NOTE: Based on 220 grantees.
We also asked them to identify the location of the FTEs. Virtually all the awardees that reported
employment supported by the award have employment in California. A much smaller number
of awardees report employment outside California at locations of their own firms: 10 percent in
the United States outside California and 5 percent outside the United States. Subcontractors are
more likely to have some employment outside California: 17 percent have employment in the
United States outside California and 8 percent outside the United States. It is noteworthy that
awardees tend to report that employment is supported at a subcontractor more often than at
their own organization, although the fairly high rate of “do not know” and “no response” to
these questions (especially for the questions relating to employment outside California) may
make such judgments unreliable.
Looking more in depth at the level of California employment, Figure 9.3 shows the range of
FTEs supported by the award at the awardee organization and at subcontractors. As we
discussed earlier, more subcontractors have employment than awardees (although there is a
higher rate of respondents who do not know the employment level at their subcontractors). But
otherwise, the distribution of employee FTEs is quite similar between awardees and
subcontractors, as indicated by the similar height of the paired bars. By far the most common
range for employment is one to five FTEs at both awardees and subcontractors. But there are
some awardees that report employment between six and 100 FTEs.

279
Figure 9.3. Employment in California
SOURCE: RAND survey. NOTE: Based on 220 awardees.
While not shown in the figure, the distribution of employment reported outside California or
outside the United States is even more concentrated in the lowest range. As shown in Table 9.9,
very few awardees reported that they supported employment outside California. Almost all
respondents with some employment at awardees or subcontractors outside California or
outside the United States said that one to five FTEs were supported in these locations. There is
some significant uncertainty in these estimates, because about one-half of awardees said they
did not know the levels of employment outside California and the United States for themselves
or their subcontractors (as shown in Table 9.9), but we think such employment was generally
infrequent, as indicated by those who gave responses.
We next asked awardees whether they hired new employees to work on the award project. As
shown in Figure 9.4, just 31 percent of awardees reported that they hired new employees. The
level of new hiring at most awardees was also fairly modest. Of those awardees that hired, 86
percent hired ten or fewer FTEs, 10 percent hired more than ten FTEs, and 4 percent did not
know or did not respond (data not shown).
20%
50%
5% 9%
3% 1%
14% 10%
48%
9% 7% 5% 0%
22%
0
10
20
30
40
50
60
0 1-‐5 6-‐10 11-‐20 21-‐50 51-‐100 Don't Know or No Response
Percentage
FTEs
On average, during the course of the project funded by this grant, approximately how many FTE posiFons were supported at your organizaFon
by the project in California?
Grantee Subcontractors

280
Figure 9.4. New Employment
SOURCE: RAND survey. NOTE: Based on 220 awardees.
As shown in Table 8.14 in Chapter 8, many awardees would have proceeded with their projects
even if they had not received CEC funding. So the net increase in state employment as a result
of the CEC funding is likely even lower than the amounts of new hiring reported by the
awardees. Thus, it appears that the awards did not result in a large volume of hiring.
As Table 9.10 shows in the column labeled “some workers,” only a few awardees who
completed their awards (16 percent) reported that they eliminated some employees when the
award ended. Many awardees (37 percent) said that at least some employees continued to work
on the same type of project after the award ended. Some awardees (19 percent) said that they
reassigned at least some employees to different types of projects within their organization.
Table 9.10. Disposition of Workers After Award Ended
After the ARFVTP-Funded Project Ended, What Happened to the Positions (Both New and Existing) at Your Organization That Were Supported by the Project?
Disposition of Workers
Percentage of Completed Awardees Reporting That… Some
Workers No Workers Don’t Know or No Response Total
…were eliminated 16 53 31 100 …continued to work on the same type of project 37 28 36 100
…were reassigned to projects of different types within your organization 19 40 41 100
SOURCE: RAND survey. NOTE: Based on 90 awardees with completed projects. Row percentages do not all sum to 100 percent because of rounding. In contrast to how they treated their own employees, most awardees (67 percent) who used
subcontractors reported they reduced or eliminated work sourced to subcontractors, suppliers,
or partners at the end of the award. Of the ones that reduced or eliminated such work, 67
percent eliminated all or at least 75 percent of the work; 33 percent maintained somewhere
58%
31%
10%
0 10 20 30 40 50 60 70
No Yes Don't Know or No Response
Percentage
To the best of your knowledge, were any of the posiFons supported by this project at your organizaFon new posiFons?

281
between 1 and 74 percent of the work (data not shown). So it appears that the effects of the
award ending were felt much more by the subcontractors than by the awardees.
9.5 Awardee Perceptions of Labor Market
On the survey, we asked all awardees except those who had not yet started and those whose
projects were canceled or terminated to answer three questions about the labor force. First, we
asked them to tell us whether the number of appropriately qualified job seekers in the labor
pool was satisfactory at the time they were hiring employees to work on the project. As Figure
9.5 shows, 26 percent of awardees said this was not applicable to their projects, perhaps
because their projects did not involve hiring. Another 3 percent omitted this question. Of the
remainder, a clear majority (41 percent) agreed (somewhat or strongly) that the number of
qualified job seekers was satisfactory. Only 10 percent of awardees thought the labor pool was
unsatisfactory.
These findings are broadly consistent with some more-general results from the EDD’s Green
Jobs Survey described earlier in this chapter (conducted in 2009 and 2010). In that survey, a
much more general sample of firms was asked about barriers to implementing green practices.
Less than 5 percent of respondents reported that availability of employees or training
opportunities was a barrier to them. In contrast, about 25 percent of those respondents said
that costs of implementation or economic conditions posed a barrier to implementing green
practices.215
Figure 9.5. Awardee Perception of Qualified Labor Available
SOURCE: RAND survey. NOTE: Based on 220 awardees. Bars do not sum to 100 percent because of rounding.
215The timing of the survey at the end of the Great Recession could have magnified concerns about costs and economic conditions.
4% 6%
19%
27%
14%
26%
3%
0 5
10 15 20 25 30
Strongly disagree
Somewhat disagree
Neither agree nor disagree
Somewhat agree
Strongly agree
Not applicable
No response
Percentage
When your organizaFon was hiring employees to work on the project funded by this grant, the number of appropriately qualified job seekers in the labor pool was
saFsfactory

282
We also asked awardees whether deficiencies in employee skills posed a barrier to the success
of their projects. As Figure 9.6 shows, 15 percent of awardees said this was not applicable to
their projects, perhaps because their projects did not involve employees, and another 3 percent
omitted this question. Of the remainder, a clear majority disagreed (most of them strongly—38
percent) that skill deficiencies created a significant barrier. But 18 percent of awardees said that
Figure 9.6. Awardee Perception of Employee Skills
SOURCE: RAND survey. NOTE: Based on 220 awardees. Bars do not sum to 100 percent because of rounding.
such deficiencies did create a significant barrier. So, while skill deficiencies did not appear to
hinder the majority of awardees, a notable minority did face significant barriers related to
skills.
Finally, we asked awardees whether they thought it was getting easier or harder to find skilled
labor for their type of projects compared with five years ago. As Figure 9.7 shows, 10 percent of
awardees said this was not applicable to their projects, perhaps because their projects did not
involve employees, and another 2 percent did not answer this question. Of the remainder, a
clear majority (52 percent) said it was easier to find skilled labor than it was five years ago, with
most of those reporting it was somewhat easier (37 percent). Only 9 percent of awardees said
that it was harder to find skilled labor now, while 26 percent said it was about the same as five
years ago.
38%
16% 11%
14%
4%
15%
3%
0 5
10 15 20 25 30 35 40 45
Strongly disagree
Somewhat disagree
Neither agree nor disagree
Somewhat agree
Strongly agree
Not applicable
No response
Percentage
Thinking about the employees who worked on the project, deficiencies in skills created a significant barrier to the success of the project

283
Figure 9.7. Awardee Perception of Changes in the Labor Market
SOURCE: RAND survey. NOTE: Based on 220 awardees. Bars do not sum to 100 percent because of rounding.
In Section 9.3, we reviewed efforts by the EDD, community colleges, and ETP to provide training
for workers before and during their employment. Given that at least some awardees report
concern about skill deficiencies and most awardees said that it was getting easier to find skilled
labor over time, these training investments may have been worthwhile. For example, CEC-
funded training may have contributed to skill improvements in the state’s workforce. However,
we do not have a method of evaluating whether those programs addressed the specific barriers
that the awardees faced or contributed specifically to improvements in the availability of skilled
labor.
9.6 Measuring the Size of and Change in the ARFVT Workforce
Measuring a workforce in a new and emerging sector is challenging because standard public
data sources often take years to develop appropriate categories for employers and occupations
that reflect the changes in new industries. We are aware of two efforts to measure the size and
composition of the workforce related to ARFVT occupations, which we review in this section.
9.6.1 EDD’s Green Jobs and Green Transportation Jobs Reports
In early 2008, following the enactment of the federal Green Jobs Act of 2007, the California
EDD’s LMID began a study of California’s green economy. EDD had a strong interest in
understanding the nature of the green economy, the number of green jobs, and the effects of
environmental policy initiatives on the growth of industries in the state.
This survey of California firms was conducted in 2009–2010 to identify green jobs in five areas.
Each of the green areas was linked to one of the five letters in the word “green,” as follows:
2%
7%
26%
37%
15%
10%
2%
0
5
10
15
20
25
30
35
40
Much harder Somewhat harder
About the same
Somewhat easier
Much easier Not applicable
No response
Percentage
Compared to five years ago, do you think it is easier or harder to find skilled labor for this type of project today?

284
• generating and storing renewable energy
• recycling existing materials
• energy-efficient product manufacturing, distribution, construction, installation, and
maintenance
• education, compliance, and awareness
• natural and sustainable product manufacturing.
The survey was sent in May 2009 to 51,100 randomly stratified private- and public-sector
employers representing all industries, firm sizes, and counties in the state. About 35 percent of
firms responded to the survey.216
The survey found that 7.9 percent of employers had workers who produced green products or
services. The survey also found that 3.4 percent of jobs, or about 433,000 statewide, ever
required work in one or more of these areas. About 263,000 jobs (2.1 percent) in the state
entailed working 50 percent or more of the time in these green areas.
Using CEC funding, the EDD analyzed these data subsequently to prepare a Green
Transportation Jobs Report.217 The EDD looked at employees who worked 50 percent or more of
their time in a green job related to the ARFVT industry.
About 72,000 green jobs were found in ARFVT-related categories, out of the state’s total of
263,000 green jobs in all industries. Thus, green jobs in ARFVT categories accounted for 27
percent of all green jobs in the state. About one-half of the green transportation jobs were in
the alternative fuels industry group, with the remainder divided between alternative advanced
vehicles and transportation systems industry groups.
The report also analyzed employment trends at firms in California. For all firms in the state
that reported employment in both 2007 and 2009, average employment declined by 7.4 percent.
For ARFVT firms responding to the Green Survey, average employment during the same period
declined 2.7 percent, indicating that, while these firms were shrinking, they were shrinking less
than firms on average.
9.6.2 Collaborative Economics’ Core ARFVT Employment (RICO Regions and Industries)
COECON worked closely with the California Workforce Investment Board (later CWDB) to
implement the RICO process. Part of its role was to analyze employment and help the RICO
teams use that analysis to set priorities in their regions.
COECON conducted custom data analysis of the National Establishment Time Series (NETS)
Database, which track firms and their characteristics over time. In contrast to the much broader
definitions used by EDD, COECON defined firms much more narrowly. COECON defined core
216 California Employment Development Department (CA EDD), Labor Market Information Division, California’s Green Economy: Summary of Survey Results, October 2010. 217 CA EDD, Labor Market Information Division, California Green Transportation Jobs Report, July 2010.

285
ARFVT firms as those that derive a majority of their revenue from ARFVT technologies and
services. Firms that derived less than one-half of their revenue from these sources were
excluded. For example, vehicle repair shops with employees who serviced alternative vehicles
but worked primarily with conventional vehicles were not included in the COECON analysis.
Similarly, large automakers, even though they had significant alternative fuel vehicle programs,
were excluded if the majority of their sales were conventional vehicles.218
COECON determined the classification of each firm based on information in the data set,
reviews of company websites, and requests to companies for information and clarification. In
an interview, COECON reported to us that this process is labor-intensive and time-consuming.
COECON found that there were more than 500 core establishments by 2011, as shown in Figure
9.8. There was strong growth between 2001 and 2011, with the number of establishments more
than tripling. These firms spanned five ARFVT industry segments: alternative motor vehicles
and equipment; alternative fuels; fueling infrastructure; alternative transportation energy
storage; and logistics.
In terms of employment, COECON found that these core firms employed about 4,700 people in
2001. By January 2011, core employment had increased to 8,200, as illustrated in Figure 9.8.
The 2011 level of core employment and the number of core establishments are quite small,
with each figure representing about 0.07 percent of the respective totals in California.219
Figure 9.8. California Core ARFVT Firms, 2001–2011
SOURCE: COECON, 2013.
218COECON, California’s Advanced Transportation Industry Clusters of Opportunity: Driving Market Expansion, Technology, Innovation and Job Growth, 2013. 219Total establishments and employment derived from U.S. Census Bureau, “Business Dynamics Statistics: Establishment Characteristics Data Tables,” undated.
142
260
504
0
100
200
300
400
500
600
2001 2006 2011
Num
ber o
f core firms

286
In work not shown in this graph, COECON found that new firms generated an average of 42
percent of new ARFVT jobs per year in California between 2005 and 2010, while firm
expansions accounted for an average of 56 percent of industry employment growth over the
same period. Firms moving into California contributed roughly 2 percent of ARFVT jobs per
year.
As a comparison, the employment of the state’s core ARFVT firms appeared to be less affected
by the 2008 recession than the general economy was, both in California and across the nation.
Core ARFVT employment actually increased between 2007 and 2009, when the recession made
its greatest impact. This growth across COECON’s five green segments of the state economy is
shown in Figure 9.9.
Figure 9.9. California Core ARFVT Jobs, 2001–2011
SOURCE: COECON, 2013, analysis from the NETS database.
COECON found that core employment in the small fueling infrastructure segment grew fastest
between 2006 and 2011, with an average annual increase of 21 percent. Alternative fuels and
logistics also had high growth rates over the same time period, increasing at average annual
rates of 6.6 percent and 14 percent, respectively. Alternative motor vehicles and equipment
accounted for the largest share of ARFVT jobs (39 percent, or more than 3,200 jobs), although
Alterna5ve motor vehicles and equipment
Alterna5ve fuels
Advanced transporta5on energy
storage
Logis5cs
Fueling infrastructure
0
1,000
2,000
3,000
4,000
5,000
6,000
7,000
8,000
9,000
2001 2002 2003 2004 2005 2006 2007 2008 2009 2010 2011
Num
ber o
f job
s
Year

287
2011 employment declined slightly from 2010 levels. After 2011, several California ARFVT
companies filed for bankruptcy protection and reduced their workforces, but those companies
were relatively small employers in 2011, each accounting for 40 employees or fewer.
COECON’s estimates around the Great Recession differ from EDD’s findings. While EDD found a
modest decline in employment among ARFVT jobs between 2007 and 2009, COECON finds that
core employment grew in every year.
9.6.3 Discussion
Both the EDD’s and COECON’s efforts helped to define and measure the ARFVT workforce in
California. The EDD used a broad definition and conducted its analysis over just two years. As a
result, the EDD data provide no information on growth or change in this workforce over a
longer time span.
COECON, however, used a narrow definition, focusing on establishments that have the majority
of their effort in ARFVT. This core employment is about one-tenth of the overall ARFVT
employment that EDD estimated. An advantage of COECON’s work is that it generated custom
data over a decade-long period from 2001 to 2011, allowing us to see the growth in this core
workforce over that decade. The COECON methodology of identifying individual firms required
substantial manual effort and is, therefore, probably impractical to replicate on an ongoing
basis.
Thus, despite these two efforts in California, the state still does not have an ongoing capability
and associated definitions for measuring the size and change in the workforce over time. CEC
may wish to consider investing in this data infrastructure to support analysis of industry
growth and needs in the future.
9.7 Conclusions
From 2009 through 2016, the CEC provided a significant sum, about $25 million, in funding to
other state agencies (EDD, CCCCO, and ETP) for workforce development. In addition, the
ARFVTP project awards also may have helped to develop the workforce in this industry.
The EDD project funded some research on the size and composition of the workforce, funded
some training efforts, and incubated the RICO process, which appears to have raised the
visibility of this industry in key regions of the state. The CCCCO project also funded some
research on industry needs and enabled several community colleges around the state to build
workforce training programs in areas of industry interest and need. The ETP provided funding
directly to employers or organizations that supported training at employers.
These projects generally targeted barriers that a new industry faces in developing its workforce,
especially the barriers of limited understanding of industry needs and lack of coordination
among stakeholders. We are, however, limited in our ability to evaluate these efforts. In the case
of the early EDD work, since they kept no records of any kind from their beginning tasks, we
cannot say whether the objectives of the award were accomplished. For the EDD and CCCCO
research efforts, reports were published, so we know these objectives were accomplished.

288
Administrative records document that CCCCO and the later EDD projects generally
accomplished their stated objectives.
While ETP also accomplished its award objectives in general, only 59 percent of the anticipated
number of workers were trained. Because ETP pays its awardees only after they meet all
requirements, ETP did not use a substantial portion of its CEC funding and is recycling this
funding into new awards. As the market matures and needs become clearer, ETP contractors
may be able to train a higher percentage of their current and future contract amounts.
For most of these activities, we did not have access to records that document the quality of
efforts undertaken or their value to stakeholders in the industry. Many of the records we were
able to use consisted of activity reports with little attempt to evaluate the results of the
activities. ETP relies on employers to determine what training they needed and the value of that
training to them.
The community college efforts were aligned to the results of a needs assessment, and the ETP’s
contracts are driven by employer demand for public assistance with training, so we think these
efforts are likely to have addressed some of the industry needs. However, without more
evaluative information, we cannot say to what extent. Furthermore, the records we obtained did
not provide subjective or objective evaluations of the quality of programs, training, or job
placement.
According to the RAND survey, CEC’s ARFVTP project awards did support some employment
both in California and elsewhere and did result in some hiring for the projects. According to the
survey, many of the hired workers were retained after award expirations. Overall, the
magnitude of employment and hiring appeared to be modest.
Most survey respondents did not report that skilled labor presented a barrier and most said
that it is getting easier over time to find skilled labor for their projects. Since we asked only
respondents who received CEC assistance, there may be other firms that do see barriers to
finding skilled labor. As a result, the need for CEC to continue to invest directly in workforce
development may be diminishing. The RICO network appears to have benefits for the
stakeholders that engage in these regional groups, and it should be possible to sustain these
networks for some additional period at a modest further investment because the basic work of
establishing the networks is now complete. CEC has already discontinued direct funding for
community colleges, although some colleges continue to access funding through the ETP
mechanism when they provide training to eligible employers. The ETP process depends on
employers’ interest in applying for public funding and complying with the conditions necessary
to receive payment for their training. We suggest that CEC continue to work with ETP to identify
whether industry appears to demand additional increments of funding for this program and, if
so, to continue to provide some funding for this program. As we noted earlier in this chapter,
CEC’s funding of ETP does allow it to finance projects that its core program cannot (either
because of limited funds or ineligibility of public agencies).
In closing, we offer some suggestions to help CEC target workforce development in this
industry.

289
Require records to be kept for future evaluations. We were hampered by a lack of records
from some activities. CEC should require that records of spending, activities, and outcomes be
retained for a considerable period (such as ten years) following the completion of each award
activity to support future evaluations.
Consider funding data infrastructure to measure the ARFVT workforce. Consistently
collected and reported data over time can enable many participants in the industry to align
their workforce development activities and measure progress. We, however, found only two
efforts to measure the size and composition of the ARFVT workforce, and these efforts were
not sustained over time to generate consistent data series. We suggest that CEC consider
funding either a state agency or a private contractor to support ongoing, sustainable collection
and reporting of data on this workforce. The efforts we summarized earlier by EDD and
COECON could serve as a basis for this ongoing effort.
Connect workforce development projects to a clear objective. Some of the efforts funded to
date have not demonstrated alignment to a clear objective in workforce development. We
suggest that all future workforce development activities have a clear objective, whether by
linking to specific employers or to other clearly defined workforce development goals. The ETP
process is tightly aligned to a specific employer’s needs and thus meets this criterion. Broader
efforts, like supporting the RICO process, can also meet this criterion, especially if industry
stakeholder input is considered carefully in setting priorities and project objectives.

290
CHAPTER 10: Overall Conclusions and Observations for Future ARFVTP Investment Priorities
The Alternative and Renewable Fuel and Vehicle Technology Program (ARFVTP) is an ambitious
effort established by California Energy Commission (CEC) to facilitate the transformation of
California’s transportation sector to help attain the state’s climate change goals. Between 2009,
when the first awards were made, and January 2015, the program has awarded $0.59 billion to
private firms, nonprofits, and government agencies and will be able invest a total of $1.5 billion
by the program’s current sunset date in 2024.
Key to achieving the program goals is reducing the barriers to the market viability of alternative
fuels and vehicles. By market viability, we mean the ability of the private sector to produce and
sell alternative fuels and vehicles without government subsidy.220 This report evaluates the
extent to which the program has so far targeted and reduced these barriers.
Chapter 1 presented an outcome-sequence model in Figure 1.1 and included a set of evaluation
questions that we used to evaluate both the processes that CEC has set up to implement the
program and the outcomes observed to date. In this concluding chapter, we summarize our
conclusions about these questions based on the analyses presented in Chapters 2 through 9.
We start with conclusions from the process evaluation and then turn to those from the outcome
evaluation, before concluding with observations on priorities for future ARFVTP investments.
10.1 Conclusions from the Process Evaluation
10.1.1 Has the Process for Developing the ARFVTP Investment Plan Been Reasonable?
We find the process for developing the plan has been reasonable. Key challenges in the ARFVTP
investment planning process include keeping sufficiently abreast of technologies and market
trends in a wide variety of markets/sectors and managing the inevitable uncertainty that comes
from investing in approaches that have not yet reached market viability. To address these
challenges, CEC has heavily relied on engaging with industry and other stakeholders to
understand changing conditions in the economic and technological environments.
Opportunities for input come in several forms, including a 25-member advisory board and
regular public workshops during which stakeholders and members of the general public can
learn about, and provide input to, investment plans—either in person or remotely. In the early
years of the program, more than 100 people per year provided input at the public workshops
and more than 1,000 pages of written input per year were submitted to the docket. However,
220Market viability, as we define it, does not imply the repeal of regulatory programs, such as the zero-emission vehicle (ZEV), the Low Carbon Fuel Standard (LCFS), or Renewable Fuel Standard (RFS) programs.

291
the number of participants and amount of written material fell precipitously in the 2014–2015
and 2015–2016 investment plan years.
Recently, CEC has sought to deepen its stakeholder engagement by using “merit review”
workshops that, unlike earlier public hearings and workshops, drill down into specific
investment areas (e.g., electric vehicle [EV] fueling stations), glean lessons learned from past
projects, and hear from panels of experts who provide critical feedback on past investments
and insights into future trends. The result has been a slight uptick in the number of
participants and a large upswing in the amount of written input. Our analysis also suggests that
stakeholders believe that CEC takes their input seriously; specifically, based on data from our
survey, more than 70 percent of those surveyed who participated in ARFVTP workshops and
public hearings somewhat or strongly agreed that CEC seriously considers their input.
10.1.2 Has the Program Targeted Major Barriers?
CEC has targeted major barriers to market viability across the five main fuel types funded by the
program: hydrogen, electricity, diesel substitutes, gasoline substitutes, and natural gas and
biomethane. During the project, we identified major barriers to market viability in each of the
different market segments: feedstocks, fuel production, fueling infrastructure, vehicles, and
consumers. We also identified barriers to the development of the workforce needed to staff
growing alternative and renewable fuel and vehicle technology (ARFVT) industries. ARFVTP-
funded projects have aimed to reduce many, but not all, of these barriers.
Hydrogen projects focused on fueling infrastructure and with few exceptions left vehicle-
related barriers and barriers related to fuel production to other parties. Readiness awards
addressed the difficulty of obtaining permits for siting hydrogen-fueling stations. Both the
readiness awards and awards to the California Fuel Cell Partnership (CFCP) directly targeted
limited consumer awareness of hydrogen fuels and vehicles and other projects by increasing
visibility of hydrogen-fueling stations, indirectly targeting consumer awareness. The program
also supported the California Environmental Protection Agency’s Air Resources Board’s (ARB’s)
Clean Vehicle Rebate Program (CVRP), which includes rebates for fuel cell EVs, through a series
of interagency rebates.
Electricity projects targeted all the major barriers to market viability that existed when the
program began. These include both fueling infrastructure and vehicle-related barriers. As with
hydrogen, a substantial number of regional readiness awards addressed the difficulty of
obtaining permits and included components to promote consumer awareness about EVs and
the charging infrastructure.
Feedstock, fuel production, and fueling infrastructure barriers were targeted for both the diesel
substitutes and gasoline substitutes fuel types. Vehicle barriers were of less importance for both
fuel types, and the ARFVTP has funded few vehicle projects for these two fuel types.
Natural gas and biomethane projects targeted the widest range of barriers, addressing
feedstock, fuel production, fueling infrastructure, vehicle, and consumer barriers.

292
The workforce development projects generally targeted barriers that a new industry faces in
developing its workforce, especially the barriers of limited understanding of industry needs and
lack of coordination among stakeholders.
10.1.3 Has the ARFVTP Been Successful in Soliciting Proposals?
The first step to attracting high-quality applicants is achieving broad-based awareness about a
program; in the case of the ARFVTP, there does appear to be a general awareness about the
program. A majority of potential applicants participating in this study were aware of the
program, and nearly all current and past awardees interviewed said that the program is well
known in their industries.
Most project opportunity notices have attracted more requests for funds than the total amount of
funds available and appear to attract a healthy diversity of applicants, with only one-third of
applicants applying more than once. There is considerable competition for awards, with only 26
percent of applications successful overall. The success rate is modest across all fuel types,
varying from 16 percent for hydrogen to 42 percent for natural gas and biomethane.
10.1.4 Has the ARFVTP Been Successful in Evaluating Proposals and Awarding Contracts in a Timely Manner?
We found that survey respondents believe the criteria and weights used by CEC to evaluate
award applications are appropriate, but there were some concerns. A small number of
interviewees (both CEC staff and awardees) expressed concerns about whether the agency has
the skill and bandwidth to fully assess the financial and operational capacities of applicants.
A bigger concern was the amount of time required to review applications and execute
agreements, given awardees’ perceptions about the speed at which commercialization
opportunities change. Indeed, the mean time elapsed between application due date and notice of
whether the project has been chosen for funding (the notice of proposed award [NOPA] date) is
four months. It takes even longer for CEC to enter into a contract with the awardee: The average
time elapsed between the NOPA date and the contract date is nearly 8.5 months. We heard
concerns from CEC and grantees alike that the time required to review and award grants is too
long given the speed at which market conditions change. CEC must take adequate time to
ensure that proposed projects represent worthy uses of public funds and to enter into
contracts that protect the public interest, but the long period between proposal submission and
project funding for many projects can limit the awardees’ ability to capitalize on technology
and market opportunities. However, there is evidence that these time lines have improved as
CEC gained more experience running the program.
10.1.5 Has the ARFVTP Done an Effective Job in Administering the Awards?
We found that there were both strengths and weaknesses in how CEC oversees awards once they
begin. On the strengths side, the Commission Agreement Managers (CAMs)—the CEC staff who
directly oversee individual projects—were generally well regarded by awardees. On the
weaknesses side, a small number of awardees expressed concern about CAM turnover, but for
the most part, this problem appears to be limited. Some awardees cited the burdens associated

293
with performance reporting but recognized the need for public accountability and noted that
the process had become easier as they became more accustomed to ARFVTP’s format and
requirements.
Awardees were more critical of financial reporting requirements, which many regarded as
unreasonably detailed. Many found CEC’s process for approving changes in project scope or
budget allocation burdensome. More than 60 percent of awardees who answered a survey
question on the CEC process for approving project modifications either somewhat agreed or
strongly agreed that the process was burdensome, and more than one-quarter of those believed
that the delays had a substantial impact on administrative cost and project schedule.221
CEC often withholds 10 percent until all award requirements have been completed. Although
this practice helps ensure that awardees provide the work product they promised, just under 30
percent of awardees responding to the survey said the practice caused their organizations some
or substantial financial difficulty. In interpreting findings about administrative burdens, one
must bear in mind that awardee convenience must be balanced against the need for
accountability in the use of public funds.
Despite these concerns, survey respondents and interviewees were generally positive about their
experiences with the program. Indeed, a clear majority indicated they appreciated the program
and would apply again if the opportunity or need arose. However, there were some differences
across the fuel-type sectors. Firms involved with developing and producing gasoline substitutes
were much more ambivalent about ARFVTP.
Our evaluation also revealed a need for better document management practices and a more
systematic approach to data collection on the part of CEC. Project documents are difficult to
locate, often poorly labeled, and sometimes exist in multiple versions. Such chaotic document
management creates impediments for new CAMs inheriting existing projects and independent
program evaluators in understanding the history and status of projects. In addition, final
reports have no required structure or elements, and, as a result, it is often difficult to ascertain
what the project accomplishments were and how those might compare with, or add to, those of
other similar projects.
10.1.6 Have Awardees Secured the Proposed Matching Funds?
Most, but not all, projects require matching funds, and some applicants propose a match
amount that exceeds the minimum requirement. We found that awardees by and large secure
the proposed matching funds. The required match was not achieved for only 10 percent of
completed projects. ARFVTP funding will not increase to offset a shortfall in matching funds.
Thus, failure to secure the required matching funds could either mean that the awardee did not
221Only about one-half of awardees participating in the survey answered the question on whether the CEC process for approving project modifications was burdensome. They may not have answered because they did not think the process was burdensome. However, the response rate for this question is unusually low, and it seems more likely that those who had not requested project modifications did not answer the question. We thus restricted our attention to only those who answered the question.

294
achieve all the project technical objectives or that the project ended up costing less than
expected.
10.1.7 Have Awardees Completed Their Projects on Time?
Completing projects on time has been a challenge for awardees. Approximately 50 percent of
completed projects were completed on or ahead of schedule. Most of the remaining projects
were completed seven to 24 months behind schedule, while a small percentage of projects were
completed more than two years behind schedule. Delays are greater for ongoing projects, and,
if anything, one should expect delays for these projects to lengthen over time because some of
the projects have not been active long enough to fall far behind schedule.
Delays are most severe for the hydrogen projects. Two of the three projects for which
information is available were completed more than two years behind schedule. However, there
is some indication that improvements are being made. Hydrogen awardees report that they
have been able to reduce the time needed to place a hydrogen-fueling station from 18 to 24
months to 12 to 18 months.
Delays in obtaining required permits, the need to change project location, and unexpected
problems with the technology were the most common reasons for delay.
10.1.8 To What Extent Have Awardees Achieved the Main Technical Objectives of Their Projects?
Awardees are by and large achieving the technical objectives most central to their projects.222 The
project team independently evaluated the extent to which project technical objectives were
achieved. We then allowed survey respondents to update these assessments. There was little
difference between the RAND and the awardee assessments, except that awardees were able to
report the extent achieved in cases for which RAND had insufficient information to make a
determination. Using the RAND assessment as updated by survey respondents, we found that
only 11 percent of the 351 technical objectives for the 104 completed projects (not including
workforce development projects) had not been fully achieved, and the percentage does not vary
a great deal by fuel type. Eighty-two percent of the technical objectives were fully achieved, and
the technical objectives remained in progress or the extent achieved could not be determined
for the remaining 7 percent. In some cases, a shortfall in one project (e.g., a technical objective
to install a specific number of EV charging stations) was offset by surfeits in other projects with
a similar technical objective. Not all the technical objectives analyzed are of equal importance,
but we restricted our attention to the technical objectives most central to the project.
As expected, most of the main technical objectives for the ongoing projects remain in progress,
but awardees told us in their answers to our survey that they are confident that a high
percentage of their technical objectives will be fully achieved. We also found that the success in
222Technical objectives are distinguished in CEC awards from administrative objectives. Technical objectives can include objectives such as installing a specified number of fueling or charging stations, building a specified amount of production capacity, or achieving a target production rate once the proposed facilities have been installed.
295
achieving technical objectives was similar for research, development, and demonstration
(RD&D) projects and production, distribution, and deployment (PD&D) ones.
For the EV charging station projects, we visited and verified the operability of 326 (about 4
percent) of the more than 8,000 stations funded by the program (more than 6,700 of which
have already been installed). We found that more than 95 percent of these stations were
operating properly. We also highlighted a number of installation and operation issues that may
help guide future awardees in getting the most benefit from ARFVTP funding.
Although the technical objectives for three large ARFVTP-funded workforce development
projects were in many cases achieved, there were important exceptions and data limitations. In
one case, only about one-half of the anticipated number of workers were trained. In another,
almost no records of any kind were available, so we could not evaluate whether the technical
objectives of the award were accomplished.
10.2 Conclusions from the Outcome Evaluation
10.2.1 What Has Been the Impact of the Awards on the Products and Technologies Offered by the Awardee?
Critical to the assessment of the ARFVTP’s impact is the extent to which awards have allowed
awardees to pursue projects that would not have been otherwise pursued. One way to
determine this is to see what those who applied for awards but were turned down—
unsuccessful applicants—have done. The advantage of this indicator is that it is based on actual
behavior. The disadvantage is that the projects proposed by the unsuccessful applicants may
have been more poorly conceived or planned that those funded by the ARFVTP. Based on survey
responses, slightly over one-half of unsuccessful applicants participating in this evaluation had
not yet proceeded with the project after their application was denied. Estimates of the
percentage of awardees that would not have proceeded without the award are imprecise, but
they are consistent with those for the unsuccessful applications. Findings were similar for
RD&D and PD&D projects, and there was no strong evidence of differences across fuel types.
Based on these findings, we tentatively conclude that roughly one-half of the projects funded by
the ARFVTP would not have proceeded otherwise. However, the ability to proceed absent
ARFVTP funding rests on the availability of other government and private funding sources. If
one funding source disappears, other funding sources may be able to fill in the gap. However, if
the ARFVTP disappears and other funding sources follow suit, then the project may not be able
to proceed.
10.2.2 What Are the Market Prospects of the Products or Technologies Funded by the Award?
After completing their ARFVTP projects, awardees overwhelmingly indicated they had taken
steps to develop, market, install, or produce the product or technology funded by the award.
Substantial percentages reported that they had worked on ways to reduce costs and to improve
product performance and had attempted to identify potential customers for the product. These
findings suggest that awardees believe that the products of their ARFVTP-funded projects have

296
market potential. The growing number of competitors that awardees are seeing in their
industries (discussed in Section 10.3) provides additional evidence of market potential. The
findings keep open the possibility that the project outputs will have ongoing impact on barriers
to market viability.
10.2.3 To What Extent Have Funded Projects Reduced Barriers to the Market Viability of Alternative Fuels and Vehicles?
The ARFVTP has made considerable progress reducing many barriers to the market viability of
alternative fuels and vehicles. For hydrogen, ARFVTP’s investments have lowered (although not
yet eliminated) one of the most significant barriers to the use of hydrogen as a transportation
fuel: 48 out of the 60 hydrogen-refueling stations in California have been built with ARFVTP
funding, and 48 more ARFVTP-funded stations are under development. By funding a project to
develop standards for hydrogen fueling, the program has, for the most part, eliminated an
important barrier to the market viability of hydrogen fuels and vehicles. By funding regional
readiness awards and the first hydrogen-fueling stations, the program has also helped reduce
the time and cost of installing new fueling stations. Nevertheless, other barriers still exist,
related to feedstock, fuel production and bulk distribution, and vehicle design and
performance.
For electricity projects, the large number of EV charging stations funded by the program is clear
evidence that the program has reduced fuel infrastructure barriers for EVs, and the EV
readiness awards have helped reduce the difficulty of obtaining permits. About 35 percent of
the publicly available charging stations in the state appear to have been partly financed by the
program. Vehicle barriers have been reduced by awards to build or expand production lines and
to develop and demonstrate different types of electrically powered vehicles. It is likely that
projects to expand production lines and to design and demonstrate advanced EV components
will contribute to reducing vehicle cost, but few data to confirm such effects are available. The
program may have also helped reduce vehicle prices by funding the CVRP. However, the extent
of that reduction is hard to determine because, absent the CVRP, automakers might have had to
reduce prices by a similar amount to sell the number of vehicles required by the ZEV program.
Projects have been funded to improve battery performance, but the study team was not able to
determine whether these efforts have paid off in terms of improved vehicle performance.
Turning to diesel substitutes, the ARFVTP has made demonstrable progress in reducing barriers
related to production capacity and bulk fueling infrastructure. Fifty-four million gallons per
year (mgy) of the 184-mgy biodiesel production capacity in California has been financed partly
by the ARFVTP, as has 17.5 mgy of the 63-mgy renewable diesel capacity. The modest number
of bulk fueling infrastructure projects funded by the program has helped reduce barriers in this
area to some extent. RD&D projects have sought to demonstrate the feasibility of generating
low-cost, low–carbon intensity (CI) feedstocks (algal oil) or producing alternative diesel from
different types of feedstocks (e.g., dairy waste and fats, oil, and gas in municipal wastewater);
however, there are no indications that the projects have taken significant steps toward
commercial viability. Projects to expand production capacity and install the latest technology

297
may well have helped reduce the production costs of alternative diesel, but we were not able to
collect any systematic data on production cost.
As for gasoline substitutes, demonstrable progress has been made in expanding the number of
E85 (recall that E85 refers to an 85 percent ethanol fuel blend that contains from 51 percent to
83 percent ethanol) fueling stations in California. The number of E85 stations in California
increased from 29 to 96 between 2009 and 2016, 40 of which were funded by the ARFVTP. The
program has also facilitated the beginnings of a transition from corn to sorghum for major
ethanol producers in California. Progress in reducing the other barriers targeted is less clear. It
does not appear that the projects have made progress in reducing production costs, and it
could not be determined whether a project to optimize a medium-duty truck engine to run on
E85 made progress in improving vehicle performance. We also could not determine whether
projects that sought to increase feedstocks available for ethanol production have had an
impact.
The ARFVTP has had some demonstrable impacts on the barriers to the natural gas and
biomethane transportation market in California. ARFVTP funding has approximately doubled
the biomethane fuel-production capacity in the state, adding about 5.5 million diesel gallon
equivalents per year in capacity at 11 facilities since 2009. Similarly, 42 percent of new liquid
natural gas (LNG) stations and 22 percent of new compressed natural gas (CNG) stations in
California added since 2008 were funded by ARFVTP projects. The program also provided
substantial funding for subsidies for the purchase of natural gas vehicles (NGVs), which address
the vehicle price barrier. Finally, there was also progress in introducing and/or more efficiently
using feedstocks for biomethane production and in increasing public awareness.
10.2.4 What Has Been the Impact of the Program on Employment and Workforce Capabilities?
CEC’s ARFVTP project awards did support some employment both in California and elsewhere
and did result in some hiring for the projects. Many of the hired workers were retained after
award expirations; however, the magnitude of employment and hiring appear to be modest.
It is likely that the ARFVTP-funded projects have addressed some of the needs of the ARFVT
industry. However, without more evaluative information, we cannot determine the extent. We
do note that most stakeholders completing the survey in September 2016 did not report that
skilled labor presented a barrier, and most said that it is getting easier over time to find skilled
labor for their projects.
10.3 Observations on ARFVTP Investment Priorities
Our findings of health and vibrancy of the ARFVT industry are mixed. On the one hand, there
appears to be a substantial and growing number of firms competing in the various fuel-type
sectors. On the other hand, private-investor interest does not appear strong. Relatively few of
the stakeholders responding to our survey believed that there are currently many private-sector
investors interested in their industries or that there is any upward momentum. Investor interest
in the diesel-substitutes and gasoline-substitutes industries appears particularly weak.

298
Tepid private-investor interest in the ARFVT industry suggests an ongoing need for the
government involvement, and a substantial majority of awardees, unsuccessful applicants, and
potential applicants in our survey believe that some type of government involvement continues
to be necessary for the market viability of alternative fuels and vehicles. For example, more
than 80 percent believed that awards for demonstration and deployment continue to be
necessary for the market viability of the alternative fuels and vehicles their organizations are
involved with.
We conclude by providing suggestions by ARFVTP stakeholders within the five market sectors
for funding priorities moving forward and observations from the study team on factors to
consider in making investment decisions. These observations concern how investments within a
fuel type might be modified. Suggestions for adjustments of investment across fuel types are
beyond the scope of this study.
10.3.1 Observations for Hydrogen
There is no evidence at this time to suggest that CEC should prioritize the reduction of vehicle-
related and fuel-production barriers over the continued expansion of retail fueling stations.
Indeed, hydrogen stakeholders saw little need to change the current emphasis on retail
infrastructure. The amount of hydrogen dispensed through hydrogen-fueling stations remains
low, so it is too soon to assess the returns on these investments. The expectation is that as
more fuel cell vehicles (FCEVs) are adopted, hydrogen sales will increase, but to date, very little
gasoline has been displaced. It will be useful in the future to empirically reevaluate whether the
number and location of stations is appropriate given how adoption of FCEVs progresses and
how locations have shaped adoption. Such an evaluation can provide insight into how long
continued ARFVTP program funding is necessary.
10.3.2 Observations for Electricity
The most common advice of EV stakeholders on allocating funds for EV-related projects was
that charging station deployment should be continued or increased and that more should be
spent on RD&D.
What types of charging stations to focus on moving forward warrants careful consideration.
When the ARFVTP began, it made sense to fund the deployment of charging stations in all types
of locations, including residential stations at single-family homes and multiunit dwellings,
workplace stations available primarily to employees, and publicly accessible charging stations.
Given the relative paucity of modern charging stations in 2009, it also made sense to fund
stations of all types, including Level 1, Level 2, and direct current fast-charging stations. After
nearly eight years and the continued widespread deployment of this broad variety of charging
stations, it may make sense to reevaluate the deployment strategy by concentrating funding on
those station types and circumstances best suited for demonstrated utilization patterns and by
considering the evolution of plug-in electric vehicle model capabilities.

299
10.3.3 Observations for Diesel Substitutes
The ARFVTP has played a key role in expanding biodiesel production capacity in the state.
However, that capacity is currently being underutilized, which raises the troubling possibility
that California will not fully benefit from its investment in biodiesel production capacity.
Importing biodiesel and renewable diesel from outside the state may be the most efficient way
to lower carbon emissions and comply with the LCFS. However, if in-state production and
employment are top political goals, the ARFVTP should consider providing incentives rather
than continuing to invest in biodiesel production capacity. The existence of such a subsidy
could allow in-state producers to obtain the financing to construct production capacity on their
own. It would also relieve CEC of the responsibility of picking which firms should receive state
funding to build production capacity—the firms that succeed in producing the fuel would
receive the subsidy, while those that do not produce the fuel would not.
Along with in-state production incentives, increased funding for bulk fueling distribution
infrastructure was a priority identified by a number of diesel-substitutes stakeholders.
10.3.4 Observations for Gasoline Substitutes
The main message delivered by gasoline-substitutes awardees, unsuccessful applicants, and
potential applicants was that the ARFVTP should focus more on RD&D and leave production to
the private sector. However, gasoline-substitutes stakeholders may not have realized that a
substantial proportion of funding for gasoline-substitutes projects already goes to RD&D: At 59
percent, it is substantially higher than the 27 percent for the program as a whole.
It is estimated that 1 million flex-fuel vehicles on the road in California can use E85. However,
consumption of E85 remains low, which presumably reflects a combination of the low
availability of E85 fueling stations, the high price of E85, and the low price premium for flex-
fuel vehicles. Achieving an appreciable reduction in CI using ethanol requires both low CI
feedstocks and a greatly expanded E85 infrastructure. Given the ongoing challenges with
cellulosic ethanol production technology, it makes sense to suspend building out the E85
infrastructure and concentrate on cellulosic ethanol production. If that investment comes to
fruition, investment can return to expanding the E85 infrastructure. The ARFVTP adopted this
approach in 2013, and there is no evidence to suggest that CEC should change course at this
time.
10.3.5 Observations for Natural Gas and Biomethane
There are no widely held views among the natural gas and biomethane stakeholders, but a
number suggested that the program focus its attention on promoting biomethane as opposed
to natural gas more generally. Presumably this means focusing on biomethane production and
distribution. Somewhat inconsistent with this, others supported spending more on NGVs, which
would promote natural gas and biomethane use.
The RFS and the LCFS, along with state and local regulations, are increasing incentives to
produce biomethane for transportation. However, in-state production remains low and is
impeded by high costs relative to the current low prices for natural gas and barriers to pipeline
injection that deter many potential producers from entering the market for lack of access to

300
customers. It appears that all the biomethane that is used to comply with the LCFS is produced
in other states. Continued award funding for research to help drive costs down appears
warranted, and the ARFVTP should consider tackling head-on barriers to injecting the
biomethane produced in the state into California’s natural gas pipelines.
10.3.6 Observations on Workforce Development
As noted earlier in this chapter, most awardees surveyed during the evaluation did not report
that the lack of skilled labor was a barrier, and most said that it was getting easier over time to
find skilled labor for their projects. As a result, the need for the ARFVTP to continue to invest
directly in workforce development may be diminishing. We do recommend that CEC continue to
work with California’s Employment Training Panel to identify whether industry appears to
demand additional increments of funding for this program, and, if so, to continue to provide
some funding for this program. We offer the following suggestions to help CEC target
workforce development in this industry:
• Require records to be kept for future evaluations. Lack of records has hampered the evaluation of past projects. CEC should require that records of spending, activities, and outcomes be retained for a considerable period (such as ten years) following the completion of each award activity to support future evaluations.
• Consider funding data infrastructure to measure the ARVFT workforce. Better data can enable many participants in the industry to align their workforce development activities and measure progress.
• Connect workforce development projects to a clear objective. Some of the efforts funded to date have not demonstrated alignment to a clear objective in workforce development. We suggest that all future workforce-development activities have a clear objective, by linking either to specific employers or to other clearly defined workforce development goals.
10.3.7 Observations on Consumer Awareness
Insufficient consumer awareness of, and knowledge about, alternative fuels and vehicles was
one of the most frequently identified barriers to market viability across all fuel types. This
finding does not necessarily mean that insufficient consumer awareness is one of the most
important barriers, but it is clearly of general concern to the firms that make up the industry. In
some cases, the ARFVTP has funded projects that directly attempt to improve consumer
awareness and knowledge, and one can argue that projects that demonstrate different types of
vehicles or expand fueling infrastructure increase consumer awareness and understanding as a
byproduct. The fact remains, however, that the lack of consumer awareness and understanding
remains a significant concern, and the ARFVTP should consider how to address it.
10.3.8 Observations on Research, Development, and Demonstration
The proportion of program resources spent on RD&D dropped substantially in 2014, the last
year that awards were made for the projects covered in this evaluation.223 It is too soon to tell
223Projects are categorized by the year the award was made (NOPA date), which can be many months before project start date.

301
whether this is a trend, and there may be good justifications for this decline. However, the
program should not shy away from RD&D projects simply because their outcomes can be
difficult to quantify. Indeed, in this evaluation, we have often not been able to determine the
effects of RD&D projects on barriers. It would be a mistake for the program to fund only
projects with more easily measured outcomes, such as the number of charging stations placed
or the amount of production capacity installed. RD&D projects may create the processes or
develop the knowledge that helps reduce production costs or broaden the range of feedstocks
that can be used in the future. For example, despite the ARFVTP supporting many E85 and
CNG/LNG fueling stations, these stations are still dispensing primarily corn grain ethanol and
natural gas, respectively. The investment in fueling stations will be largely unrealized until
advanced and cellulosic ethanol and biomethane production increase substantially, both of
which require more RD&D.

302
Acronyms
A
ADF Alternative Diesel Fuel rule
AFDC Alternative Fuels Data Center
ARB Air Resources Board (California Environmental Protection Agency)
ARC American River College
ARFVT Alternative and Renewable Fuel and Vehicle Technology(ies)
ARFVTP Alternative and Renewable Fuel and Vehicle Technology Program
ASTM ASTM International, formerly known as American Society for Testing and
Materials
B
B2 2 percent biodiesel and 98 percent petroleum diesel
B5 5 percent biodiesel and 95 percent petroleum diesel
B10 10 percent biodiesel and 90 percent petroleum diesel
B20 20 percent biodiesel and 80 percent petroleum diesel
B100 100 percent biodiesel
BEV battery electric vehicle
C
CAM Commission Agreement Manager
CASES Computer-Assisted Survey Execution System
CCCCO California Community Colleges Chancellor’s Office
CDFA California Department of Food and Agriculture
CEC California Energy Commission
CEPIP California Ethanol Producer Incentive Program
CFCP California Fuel Cell Partnership
CI carbon intensity
CO2e carbon dioxide equivalency or equivalent
CNG compressed natural gas

303
COECON Collaborative Economics, Inc.
CSFAP California Sustainable Freight Action Plan
CVRP Clean Vehicle Rebate Program
CWDB California Workforce Development Board
D
DCFC DC fast charging
DGE diesel gallon equivalent
DoE U.S. Department of Energy
E
E10 10 percent ethanol fuel blend
E15 15 percent ethanol fuel blend
E85 85 percent ethanol fuel blend with 51 percent to 83 percent ethanol
EDD California Employment Development Department
EER Energy Economy Ratio
EIA Energy Information Administration
EPA Environmental Protection Agency
ETP Employment Training Panel
EV electric-drive vehicle (see HEV, PHEV, BEV, and FCEV)
EVSE electric vehicle supply equipment
F
FAME fatty methyl esters
FCEV fuel cell electric vehicle
FFA free fatty acids
FOG fats, oil, and grease
FT Fischer-Tropsch (type of diesel)
FTE full-time equivalent
G
g/bhp-hr grams per brake horsepower-hour
GGE gasoline gallon equivalent

304
GHG greenhouse gas(es)
GVW gross vehicle weight
H
HDV heavy-duty vehicle
HEV hybrid electric vehicle
HVIP Hybrid and Zero-Emission Truck and Bus Voucher Incentive Project
I
IA interagency agreement
ICE internal combustion engine
IFB invitations for bids
K
kg kilogram
kW kilowatt
kWh kilowatt hour
L
LCFS Low Carbon Fuel Standard
Li-ion lithium-ion
LDV light-duty vehicle
LMID California Employment Development Department’s Labor Market
Information Division
LNG liquefied natural gas
M
MDV medium-duty vehicle
mgy millions of gallons per year
MJ megajoule
MPa megapascal
N
NETS National Establishment Time-Series (database)
NGV natural gas vehicle
NGVIP Natural Gas Vehicle Incentive Project

305
NOx nitrous oxide
NOPA Notice of Proposed Award
NREL National Renewable Energy Laboratory
O
O&M operations and maintenance
OEM original equipment manufacturer
P
PD&D production, distribution, and deployment
PEM polymer-electrolyte membrane
PEV plug-in electric vehicle
PHEV plug-in hybrid electric vehicle
PON Project Opportunity Notice
psi pounds per square inch
R
R5 5 percent renewable diesel and 95 percent petroleum diesel
R20 20 percent renewable diesel and 80 percent petroleum diesel
R99 99 percent renewable diesel and 1 percent petroleum diesel
RD&D research, development, and demonstration
RFP request for proposal
RFQ request for qualifications
RFS Renewable Fuel Standard (known as RFS2 [for version 2], federal
mandate set forth in the Energy Independence and Security Act of 2007)
RICO Regional Industry Clusters of Opportunity
RIN Renewable Identification Number
S
SAE Society of Automotive Engineers
SMR steam methane reformation
SMUD Sacramento Municipal Utility District

306
V
V2G vehicle to grid
Z
ZEV zero-emission vehicle

307
APPENDIX A: Web-Based Survey of Awardees, Unsuccessful Applicants, and Potential Applicants
In this appendix, we expand on the shorter discussion of the web-based survey in Chapter 1 and
discuss the questionnaire design, sample selection, survey implementation, and survey
response rates.
A.1 Questionnaire Design
To inform the evaluation questions set out in Chapter 1, the project team developed a web-
based survey to collect relevant data. Several considerations underpin the design of the survey,
including
• Target population: The survey aimed to capture perspectives from a wide range of
program participants—those who were successfully funded and those who were not, as
well as those who have experience with the Alternative and Renewable Fuel and Vehicle
Technology Program (ARFVTP) and those who do not. Thus, respondents from three
different subpopulations were recruited: awardees, unsuccessful applicants, and
potential applicants.
• Survey mode: Web surveys have a number of advantages, including the fact that they
cost less to field compared with phone surveys and that data management is relatively
easy. However, many of the program’s awardees, unsuccessful applicants, and potential
applicants are businesses, which are known to be a “hard-to-reach” group in survey
research—because it is often unclear who in the organization should respond to the
survey, and there are often gatekeepers who decide whether the survey will be
redirected.224 To ensure a high response rate, we included a phone follow-up component
to supplement the web survey.
• Customized survey for each subpopulation: The survey contained questions that were
common across the three subpopulations and modules tailored to each subpopulation.
Experience has shown that a customized approach reduces respondent burden and
hence improves the quality of the responses. The length of the survey therefore varies
depending on the subpopulation. The awardee survey is the longest, whereas the
potential applicant survey is the shortest, as shown in Table A.1.
224 Brenda G. Cox, David A. Binder, B. Nanjamma Chinnappa, Anders Christianson, Michael J. Colledge, and Phillip S. Kott, eds. Business Survey Methods, 1st ed., New York: John Wiley & Sons, 1995.

308
Table A.1. Targeting the Survey’s Three Subpopulations
Subpopulation Number of Questions
Time Taken to Complete Survey
Awardees (completed, ongoing, yet to be started, canceled/terminated projects)
60–80 20-30 minutes
Unsuccessful applicants 40 15–20 minutes Potential applicants 30 10–15 minutes
SOURCE: Authors. In terms of content, the survey focused specifically on addressing the evaluation questions
related to Steps 2–5 of the outcome-sequence chart discussed in Chapter 1 (and reproduced in
in Figure A.1; Steps 1, 6, and 7 are grayed out because they have no evaluation questions). As
such, the survey was used in both the process and outcomes evaluation, as well as to get at
opinions of the respondents to ARFVTP’s investment portfolio and to the need for government
policy interventions.
More details about the topics covered and the thinking behind some of the survey questions are
discussed in the following sections. The 60-page survey instrument is available from the
authors on request.
Figure A.1. Focus of Survey in Terms of the Outcome-Sequence Model
A.1.1 Process Evaluation
For Step 2—CEC solicits awards and makes award—the survey is structured around the
applicants’ “journeys” in getting an ARFVTP award, from how they first became aware of the
program, to their initial engagement with the California Energy Commission (CEC), to the actual
solicitation and application process, and finally to their interactions with CEC during the
execution of their project. The specific questions asked in the survey are shown in Table A.2.

309
Table A.2. Focus of Survey Content for Step 2 of Outcome-Sequence Model
Categories Focus
Awareness • [for potential applicants only] “Have you heard about the CEC’s ARFVTP before?” • [If yes] “Why haven’t you applied to the program?”
Engagement • “How did you hear about the ARFVTP?” • “Has a representative from your organization ever attended or participated in an ARFVTP-
related workshop?
Solicitation • Adequacy of information provided about the application requirements • Appropriateness of the criteria used by CEC to evaluate the applications
Execution
• Administrative requirements—how burdensome? • Pros and cons (e.g., is the CEC perceived to be more willing to fund higher risk projects?) • “Given your experience with the ARFVTP program, would you apply for funding from CEC
again?” SOURCE: Authors. For Step 3—awardees implement projects—the survey focused on these specific topics:
• awardee performance: technical, schedule, and financial
• impact on knowledge or capabilities
• employment and labor market
• market prospects for the technology or product developed by the project
• what would have happened had the organization not received the award.
For the technical performance assessment in the survey, we used a series of questions to get at
the extent to which the technical objectives of the projects were achieved, as shown in Figure
A.2. Ideally, this information can be derived from a detailed review of the progress and final
reports of the projects. However, such documents were often not up-to-date or incomplete.
Therefore, we decided to collect this information through the survey. To this end, in this part of
the survey, we used a “correct as necessary” approach: Starting with the RAND team’s
assessment on the extent to which a technical objective was achieved, we asked the respondent
to verify that assessment for each technical objective—whether it was fully, partially, or
minimally achieved. If an objective was not fully achieved, we asked a follow-up question to
understand why.
This approach meant that, as part of the survey design and implementation, the RAND team
had to first review and analyze project documents in detail and then code and assess each
technical objective for each project. Since survey respondents have self-interests that may bias
their responses to this series of questions, we judged that this “correct as necessary” approach
was well worth the effort to get at the truthful answer.
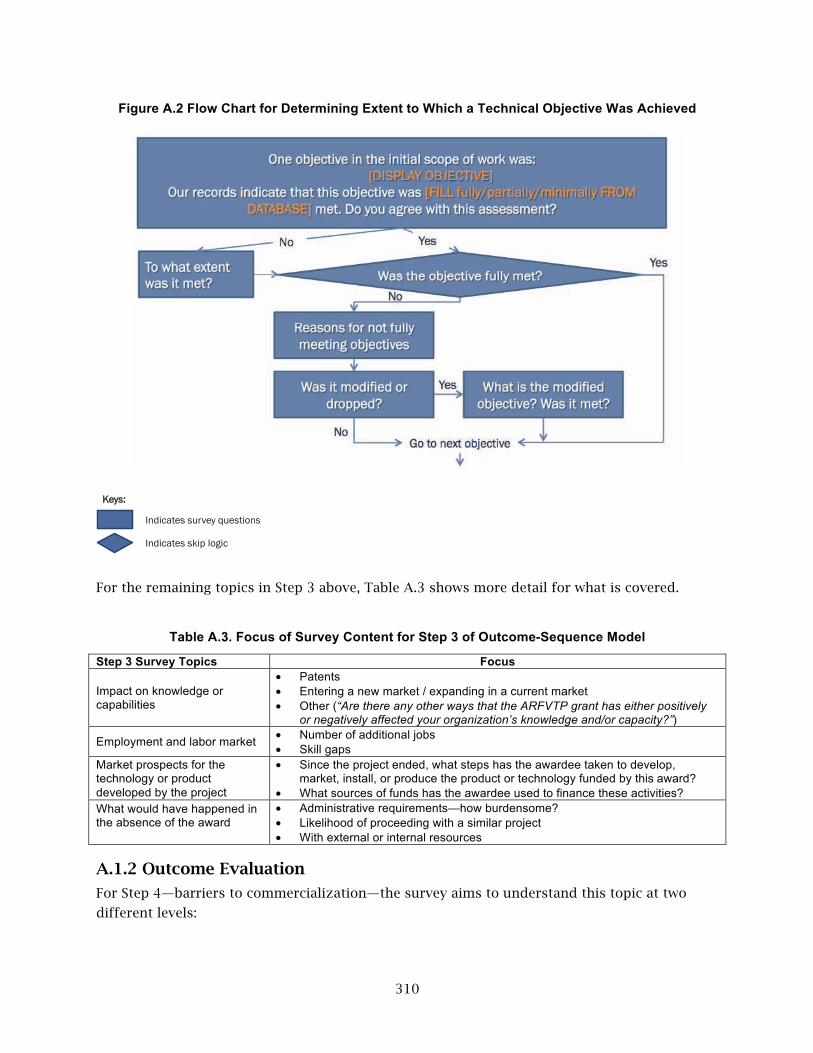
310
Figure A.2 Flow Chart for Determining Extent to Which a Technical Objective Was Achieved
For the remaining topics in Step 3 above, Table A.3 shows more detail for what is covered.
Table A.3. Focus of Survey Content for Step 3 of Outcome-Sequence Model
Step 3 Survey Topics Focus
Impact on knowledge or capabilities
• Patents • Entering a new market / expanding in a current market • Other (“Are there any other ways that the ARFVTP grant has either positively
or negatively affected your organization’s knowledge and/or capacity?”)
Employment and labor market • Number of additional jobs • Skill gaps
Market prospects for the technology or product developed by the project
• Since the project ended, what steps has the awardee taken to develop, market, install, or produce the product or technology funded by this award?
• What sources of funds has the awardee used to finance these activities? What would have happened in the absence of the award
• Administrative requirements—how burdensome? • Likelihood of proceeding with a similar project • With external or internal resources
A.1.2 Outcome Evaluation
For Step 4—barriers to commercialization—the survey aims to understand this topic at two
different levels:
KKeeyyss::
Indicates survey questions
Indicates skip logic

311
• barriers in the industry: “What are the current barriers to the market viability of the
alternative fuels and vehicles most closely connected to your grant?”
• barriers targeted by the funded project: “What contribution(s) did your ARFVTP project
make in reducing these barriers?”
For Step 5—industry structure changes—the survey focused on the following questions,
assessing how much respondents agreed or disagreed with them:
• “Currently there are many organizations competing with your organization.”
• “Compared to five years ago, the number of organizations that are competing with your
organization has increased.”
• “Currently there are many private-sector investors (i.e., nongovernmental funders, such
as angel investors, venture capital, strategic investors, and banks) interested in your
industry.”
• “Compared to five years ago, the amount of private investment (e.g., nongovernmental
funding from angel investors, venture capital, strategic investors, and banks) has
increased.”
A.1.3 Respondent Views
Closing questions in the survey sought to query respondents on their views on the role of
government policies (“What government activities are perceived to be necessary for facilitating
the market viability of the alternative fuels or vehicle technologies?”) and elicit their feedback
on ARFVTP’s investment portfolio. For the latter, to ensure survey respondents were equipped
with the necessary background to provide an informed answer, we presented a data
visualization showing ARFVTP funding allocation in previous years (see Figure A.3), along with
the question “Looking back at this allocation, in what ways do you think CEC should have
allocated the funds differently?”

312
Figure A.3. Visualization Used in Question on ARFVTP Investment Portfolio
SOURCE: Authors.
The survey concludes with a few final questions about the respondents’ organizations,
including age and size (annual revenue and number of employees).
A.2 Sample Selection
An important part of the survey design is sample selection. As discussed at the beginning of
this appendix, the target respondents of this survey comprised three subpopulations (awardees,
unsuccessful applicants, and potential applicants). The sample selection strategy for each were
as follows:
• Awardees: All awardees who received an award from the ARFVTP between April 2009
and January 2015 (approximately 300 of them) were asked to participate in the survey.
This means that for this subpopulation there is no sample selection strategy per se, but
it is important to note that the survey unit is award; thus, organizations that received
multiple ARFVTP awards were asked to complete a separate survey for each.
• Unsuccessful applicants: All unsuccessful applicants (about 250) were asked to
participate in the survey. While this strategy seems similar to the one applied to the

313
awardees, there is an important difference in the survey unit. For this subpopulation,
the survey unit is organization and fuel type. This means an organization with multiple
unsuccessful applications for a single fuel type was asked to participate in only one
survey, and an organization with unsuccessful applications for two different fuel types
(regardless of the total number of submissions) was asked to complete two surveys, and
so forth. This choice of survey unit helps to minimize the time and effort demanded
from respondent organizations, while ensuring the experience associated with the
different fuel types can be captured.
• Potential applicants: By definition, these organizations were not currently engaged with
(or even known to) the ARFVTP, so there was no existing contact list to start from. The
RAND team therefore identified potential applicants (i.e., organizations that are active in
Alternative and Renewable Fuel and Vehicle Technology [ARFVT] industries) from
various sources, including membership lists of relevant industry groups, various lists of
public agencies, and a business directory (see Table A.4). Given the resources available
for the survey, we reached out to approximately 200 organizations. For this
subpopulation, the survey unit is organization, i.e., each organization is asked to
complete only one survey.
Altogether, across the three subpopulations, we reached out to approximately 750
organizations. A summary of the size of each of the subpopulations and their respective survey
units is shown in Table A.5. The numbers reported here reflect the number of surveys sent out.
The number of complete responses is discussed in Section A.4.
Table A.4. Sources Used for the Identification of Potential Applicants
Industry groups
• CALSTART • California Hydrogen Business Council (CHBC) • California Fuel Cell Partnership (CAFCP) • American Biogas Council (ABC) • Ethanol Renewable Fuels Association (ERFA) • California Biodiesel Alliance (CBA) • National Biodiesel Board (NBB)
Public agencies (or agencies that provide a public service)
• Air districts (Air Quality Management Districts, [AQMDs] and Air Pollution Control Districts [APCDs])
• Transit agencies • Gas/electric utilities • Cities • Counties
Business directory
• LexisNexis Academic—Company Dossier
SOURCE: Authors.
Table A.5. Number of Surveys Sent by Subpopulation
Subpopulation Number of Surveys Sent Survey Unit Awardees 291 Awards Unsuccessful applicants 244 Organization and fuel type Potential applicants 204 Organization Total 739
SOURCE: Authors.

314
A.3 Survey Implementation
The survey proceeded in two phases: (1) survey development and pretesting and (2) fielding.
A.3.1 Survey Development and Pretesting
In this phase, we did the following:
• acquired the list of applicants and awardees from CEC and developed contact
information for the sample of potential applicants
• developed, reviewed, and revised the initial survey with input from CEC staff
• recruited and interviewed six respondents to pretest the survey: two for each type of
respondent (awardees, unsuccessful applicants, and potential applicants). Pretests were
conducted in the form of “cognitive interviews” in which our interviewers asked the
respondents detailed probes after each section of the questionnaire to check whether
the respondents’ understanding of the question aligned with the researchers’ intended
interpretation. Each respondent was given $150 to participate in the pretests. The
interviews lasted about one hour.
• evaluated how participants interpreted questions, identified points of confusion, and
considered how questions might be rephrased
• revised survey questions as appropriate
• programmed survey for Web administration. The software platform used was the
Computer-Assisted Survey Execution System (CASES).225
A.3.2 Survey Fielding
The survey was fielded over a 4.5-month period, from May 30, 2016 to October 17, 2016. As
discussed at the beginning of this appendix, the target respondents are a hard-to-reach group.
To encourage respondents to complete the survey, our fieldwork included the following
contacts:
• weeks 1–3: preliminary calls to identify appropriate person to whom to direct the survey
• week 4: mailed prenotification letter, signed by the ARFVTP program manager at CEC
• week 5: initial email invitation to web survey link (sent on June 27, 2016)
• week 6: first email reminder
• week 7: second email reminder
• week 8: FedEx reminder letter
• weeks 9–15: phone interviews with nonresponders
225For more information about the survey software, see “Computer-Assisted Survey Execution System (CASES),” undated.
315
• weeks 15–20: follow-up by ARFVTP Commission Agreement Managers to awardees who
have not responded.
A.4 Response Rates
The survey results were analyzed in the statistical software Stata. The findings are reported in
the main body of this report. This final section of the appendix focuses on discussing the
response rate of the survey.
Table A.6 shows the numbers in the survey from all three subpopulations by fuel type, along
with the corresponding response rates.
Out of the three subpopulations, the awardees have the highest response rate (82 percent). This
is not surprising, given this subpopulation has (or had) a working relationship with the ARFVTP.
The unsuccessful applicants have the lowest response rate (49 percent). There were a number of
reasons for this. Some of the organizations went out of business. Some of them, for unknown
reasons, were no longer reachable using the contact information on their applications. Some
reported that the specific individual responsible for the application was no longer working at
the organization and that they did not have the organizational knowledge to provide responses.
The potential applicants had a higher response rate than the unsuccessful applicants, at 57
percent. This subpopulation typically was quite interested to learn about the ARFVTP.
For the awardees, there are some variations across the fuel types: hydrogen had the highest
response rate (100 percent), whereas gasoline substitutes had the lowest response rate (60
percent). The variation in response rates may be indicative of how engaged the industries are
with the ARFVTP program.
For the unsuccessful applicants, there were relatively small variations in response rate by fuel
type. One exception is workforce, which had a response rate of 100 percent, but this was
because there was only one unsuccessful applicant in the sample.
For the potential applicants, response rates by fuel type are not reported here because the types
of alternative fuel with which potential applicants are involved could often not be precisely
determined ex ante.
According to previous studies on survey methods, the average response rate of organizational
surveys is about 36 percent.226 Thus, the response rate of this survey is considered very good,
even when broken down by subpopulation and fuel type.
226According to Yehuda Baruch and Brooks C. Holtom (2008), in which 117 articles published in top- or second-tier refereed management and behavioral sciences journals were reviewed, the average response rate of studies that used data collected from organizations was 36 percent. See Yehuda Baruch and Brooks C. Holtom, “Survey Response Rate Levels and Trends in Organizational Research,” Human Relations, Vol. 61, No. 8, August 1, 2008, pp. 1139–1160).

316
Table A.6. Survey Sample and Response Rates by Fuel Type
Categories Number in
Survey Sample Surveys
Completed Response Rate
(Percentage) Project Awardees
Hydrogen 32 32 100 Electricity 131 106 81 Diesel substitutes 23 18 78 Gasoline substitutes 18 12 67 Natural gas and biomethane 75 62 83 Workforce 3 2 67 Multifuel and other 9 8 89 Total 291a 240c 82
Unsuccessful Applicants Hydrogen 7 3 43 Electricity 72 35 49 Diesel substitutes 49 21 43 Gasoline substitutes 20 9 45 Natural gas and biomethane 61 30 49 Workforce 4 2 50 Multifuel and other 31 19 61 Total 244 119 49
Potential Applicants Hydrogen —b 8 — Electricity — 22 — Diesel substitutes — 7 — Gasoline substitutes — 1 — Natural gas and biomethane — 6 — Workforce — 1 — Multifuel and other — 71 — Total 204 116 57
All Awardees, Applicants, and Potential Applicants Total 739 475 64
a There were 303 projects; 12 projects were not included in the survey sample, leaving 291 projects sampled. These 12 dropped projects include those used to test the survey instrument and three projects where there was ongoing litigation between CEC and the awardee. b The types of alternative fuel with which potential applicants are involved could often not be precisely determined ex ante. We thus cannot report the breakdown of the survey sample for potential applicants by fuel type. Many of these organizations reported in the survey that they are involved with multiple fuel types. c These 240 awardees represent 178 different organizations (as some organizations received more than one award). Because many of the survey questions were project-based, we used awardees as the unit of analysis; thus, the results are represented on the basis of awards rather than organizations.

317
Appendix B: Procedures for In-Depth Project Reviews and Protocol
In this appendix, we discuss the procedures for the in-depth project reviews and the protocol
used for the interviews.
B.1 Procedures
The process of preparing for and conducting the in-depth project reviews included the
following steps:
• Conduct background research into the awardee’s project to establish baseline
conditions, assumptions, expected outcomes, and appropriate methods of analysis for
measuring and verifying the awardee’s performance; review the awardee’s proposal,
contract, monthly progress reports, and other documents submitted to CEC awardee.
• Discuss project status and issues with the California Energy Commission (CEC)
Commission Agreement Manager (CAM).
• Sign nondisclosure agreements with the awardees if requested to allow for the receipt of
confidential information.
• Conduct phone call or site visit with awardee as necessary to support the analysis, with
two team members generally participating in each visit.
• Follow up with the CAM as appropriate to discuss outstanding issues.
• Prepare the draft project review report.
• Prepare the final project review report based on comments from the CAMs.
B.2 Protocol for Interviews with Awardee
I. Introduction
1. Purpose of the evaluation
2. Purpose of the site visits
a. Part of evaluation
b. Generate information for high-level case studies
3. Disclosure: Information provided in this visit may be made public in overview report or
case studies. Interviewee should identify information that should remain confidential.
4. Recording the interview
5. Short background on firm or organization (distinguish California branch/establishment
from headquarters, if applicable)

318
a. When founded?
b. Public or private?
c. Firm size? (Approximate annual revenues and number of employees)
d. What mergers/etc. have occurred?
II. Market Trends
1. How would you classify your firm and the CEC award-funded technology within the
overall alternative and renewable fuels and vehicles market?
2. How is the number of firms developing or deploying these technologies changing?
a. Is it increasing or decreasing?
b. Is there an adequate number of firms?
c. Is there an adequate amount of human capital that is capable of performing the
work needed?
d. Is there adequate production capacity?
3. What programs, incentives, or market forces are driving the development/deployment of
the technology?
4. What are the major barriers to the commercialization of this technology?
5. What sources of funding are available to continue to develop or deploy the technology?
6. How much is industry investing and how has the amount and mix of investment
changed?
III. Awardee Performance
A. Performance on project objectives
1. What are the technical objectives of the project?
a. How do you measure progress towards these objectives?
2. Were objectives modified during the course of the project? Why?
3. Have the objectives been met thus far?
4. If the objectives are not being met, why not?
a. What technical issues came up in meeting the objectives?
B. Schedule performance
1. How did the actual timeline compare to the proposed timeline?
2. What were the reasons for delay, if any?
C. Financial performance

319
1. What was the overall cost of the project?
2. Were matching funds obtained?
a. Explore sources and any issues obtaining matching funds
b. Was the cost share required reasonable for this type of project?
IV. Effect of Award on Awardees
A. Impact of award on knowledge and capabilities of firm
1. To what extent did the award enable the firm to proceed with the project or to
proceed more quickly or at less cost than otherwise?
a. Had you not received the award, would you have sought funding from other
sources or filled the gap with internal resources?
2. What is the size of the award relative to revenue and to research, development, and
demonstration (RD&D) budget? (Qualitative response adequate.)
3. What other sources of funding/capital were available?
4. To what extent has the award improved the knowledge or capability of the firm?
a. Patents?
b. New processes?
c. Creativity, flexibility, or the ability to achieve results under adverse
conditions?
d. Other?
5. What is the change in the firm's annual revenue and research budget from three
years prior to the award to the present? (Qualitative response adequate. Purpose of
question is to provide context for the following question.)
6. What role has the award played in the growth of the firm?
B. Workforce impacts
1. Were any in-house full-time equivalents (FTEs) created as a result of the project?
How many and what types? If so, roughly what proportion of those FTEs were
a. in California?
b. elsewhere in the United States?
c. outside the United States?
2. Were any aspects of the work subcontracted? If so, where were the subcontractors
located? About how many FTEs were created? Roughly what proportion of those
FTEs were
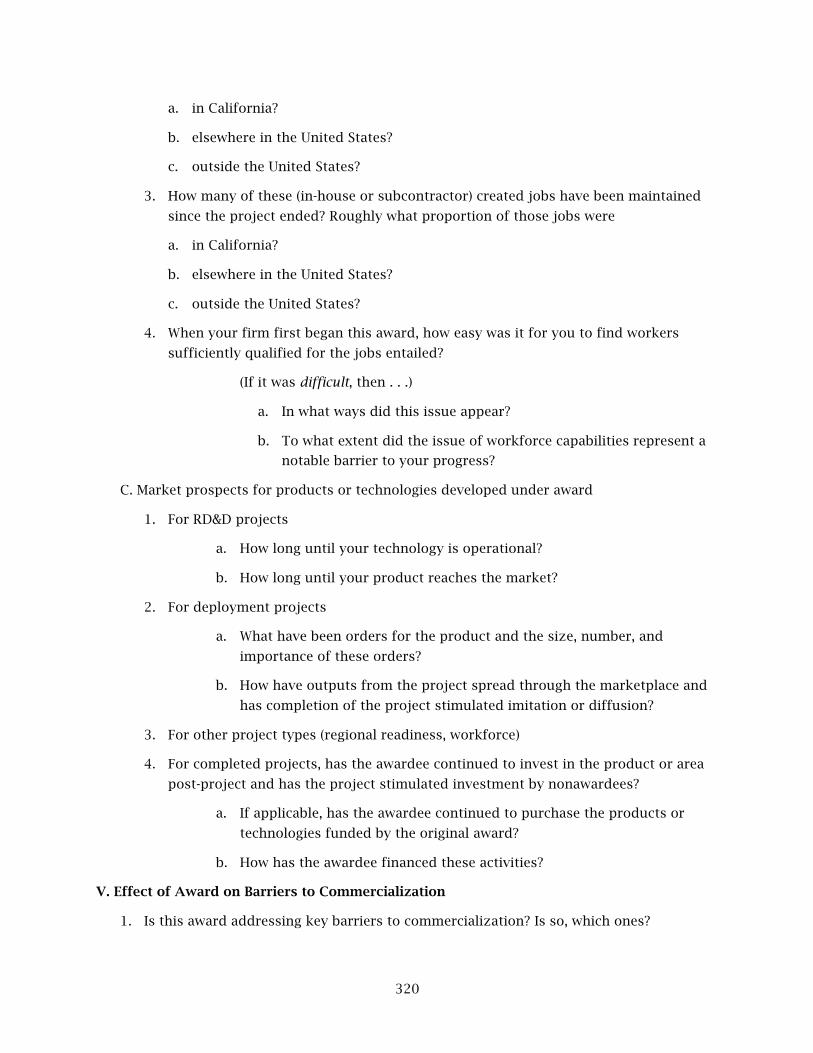
320
a. in California?
b. elsewhere in the United States?
c. outside the United States?
3. How many of these (in-house or subcontractor) created jobs have been maintained
since the project ended? Roughly what proportion of those jobs were
a. in California?
b. elsewhere in the United States?
c. outside the United States?
4. When your firm first began this award, how easy was it for you to find workers
sufficiently qualified for the jobs entailed?
(If it was difficult, then . . .)
a. In what ways did this issue appear?
b. To what extent did the issue of workforce capabilities represent a
notable barrier to your progress?
C. Market prospects for products or technologies developed under award
1. For RD&D projects
a. How long until your technology is operational?
b. How long until your product reaches the market?
2. For deployment projects
a. What have been orders for the product and the size, number, and
importance of these orders?
b. How have outputs from the project spread through the marketplace and
has completion of the project stimulated imitation or diffusion?
3. For other project types (regional readiness, workforce)
4. For completed projects, has the awardee continued to invest in the product or area
post-project and has the project stimulated investment by nonawardees?
a. If applicable, has the awardee continued to purchase the products or
technologies funded by the original award?
b. How has the awardee financed these activities?
V. Effect of Award on Barriers to Commercialization
1. Is this award addressing key barriers to commercialization? Is so, which ones?

321
2. How has your project helped to reduce the barriers to successful commercialization of
an alternative and renewable fuel and vehicle technology (ARFVT)?
a. Has it reduced costs? Or will it lead to future cost reductions?
b. Has it improved performance (of the product or of emissions profile)?
c. Has it improved fueling infrastructure?
d. Has it advanced the technology or made a new technology available?
3. Are continued awards necessary to support the commercialization of this product (i.e.,
is progress temporary or sustainable)?
a. Will progress ever be sufficient to enable commercialization without government
support?
b. What type of government support is necessary?
VI. CEC Program and Project Management
1. How did you hear about the Alternative and Renewable Fuel and Vehicle Technology
Program (ARFVTP)?
a. Is the program widely known about in your industry?
b. How could outreach be improved?
2. Are the CEC solicitations in your areas effectively targeted/crafted?
3. What has your experience been with how CEC administers and monitors the award?
a. Were CEC project managers helpful and informed?
b. Was turnover of the CAM a problem?
c. Were invoices paid in a timely manner
d. Were reporting requirements reasonable?
4. What are the advantages and disadvantages of using CEC funding?
5. What is your overall satisfaction with the program?
6. Given your experience with this ARFVTP award, would you apply for funding from CEC
again?
7. How can the program be improved?
8. Has the mix of ARFVTP awards in the past been reasonable? How should it be
rebalanced moving forward?
a. By fuel type and point in the supply chain
b. By RD&D phase.

322

323
References
AB—See Assembly Bill.
Acemoglu, Daron, and Jörn-Steffen Pischke, “Beyond Becker: Training in Imperfect Labour
Markets,” The Economic Journal, Vol. 109, No. 453, 1999, pp. F112–F142.
Aemetis, “Aemetis Achieves Milestones in Advanced Feedstock for Biofuels,” September 28,
2015. As of March 20, 2017:
http://www.aemetis.com/aemetis-achieves-milestones-in-advanced-feedstock-for-biofuels/
ARB—See California Environmental Protection Agency, Air Resources Board.
American Biogas Council, “Biogas State Profile: California,” August 7, 2015. As of March 20,
2017:
https://www.americanbiogascouncil.org/State%20Profiles/ABCBiogasStateProfile_CA.pdf
American Gas Association, “Natural Gas Glossary,” aga.org, 2017. As of March 20, 2017:
https://www.aga.org/knowledgecenter/natural-gas-101/natural-gas-glossary
Assembly Bill No. 109, Air Pollution: Alternative Fuels and Vehicle Technologies, September 26,
2008. As of June 16, 2017:
http://www.energy.ca.gov/altfuels/documents/ab_109_bill_20080926_chaptered.pdf
Assembly Bill No. 118, Alternative Fuels and Vehicles Technology Program, October 14, 2007.
As of May 24, 2017:
http://www.energy.ca.gov/altfuels/documents/ab_118_bill_20071014_chaptered.pdf
Assembly Bill No. 523, Ethanol: Alternative and Renewable Fuel and Vehicle Technology
Program, August 27, 2012. As of June 1, 2017:
http://leginfo.legislature.ca.gov/faces/billNavClient.xhtml?bill_id=201120120AB523
Assembly Bill No. 1314, Amendments to Alternative and Renewable Fuel and Technology
Program, October 5, 2011. As of June 1, 2017:
http://leginfo.legislature.ca.gov/faces/billNavClient.xhtml?bill_id=201120120AB1314
Baruch, Yehuda, and Brooks C. Holtom, “Survey Response Rate Levels and Trends in
Organizational Research,” Human Relations, Vol. 61, No. 8, August 1, 2008, pp. 1139–1160.
Becker, Gary S., Human Capital: A Theoretical and Empirical Analysis, with Special Reference to
Education, 3rd ed., Chicago, Ill.: University of Chicago Press, 1993.
Bevill, Kris, “Corn Ethanol Policy Under Attack in California,” Ethanol Producer Magazine, April
26, 2011. As of May 24, 2017:
http://ethanolproducer.com/articles/7714/corn-ethanol-policy-under-attack-in-california
Biodiesel Magazine, “U.S. Biodiesel Plants,” biodieselmagazine.com, December 12, 2016. As of
March 15, 2017:
http://www.biodieselmagazine.com/plants/listplants/USA/
324
Biofuels Digest, “California Energy Commission Cancels Deal with Mendota Bioenergy,”
biofuelsdigest.com, December 10, 2015. As of March 20, 2017:
http://www.biofuelsdigest.com/bdigest/2015/12/10/california-energy-commission-cancels-
deal-with-mendota-bioenergy/
———, “Ethanol Infrastructure or Drop-in Biofuels? Congress Debates,” biofuelsdigest.com, April 11, 2011. As of March 20, 2017:
http://www.biofuelsdigest.com/bdigest/2011/04/11/ethanol-infrastructure-or-drop-in-
biofuels-congress-debates/
Cal Recycle, “California’s 75 Percent Initiative: Defining the Future,” calrecycle.ca.gov, May 16,
2017. As of March 20, 2017:
http://www.calrecycle.ca.gov/75Percent/
California Air Resources Board, “California HVIP,” undated. As of June 11, 2017:
https://www.californiahvip.org/default.aspx
California Biodiesel Alliance, “California Cap and Trade Biofuels Initiative,” undated. As of March 21, 2017:
http://www.californiabiodieselalliance.org/page7/code-2/page5.html
———, website, undated. As of June 1, 2017:
http://www.californiabiodieselalliance.org/
California Clean Vehicle Rebate Project, “CVRP Rebate Statistics,” last updated June 1, 2017. As
of June 1, 2017:
https://cleanvehiclerebate.org/eng/rebate-statistics
California Community College Chancellor’s Office, Program Assessment of Regional Community
College Alternative Fuels Technical Education Programs, May 2013. As of June 20, 2017:
https://www.gcccd.edu/sdic-regional-consortium/documents/consortium/sswg/altfuel-
ccc_custom_ca_13.pdf
———, Training Needs Assessment: Alternative Fuels and Alternative Fuel Vehicles, November
2010.
———, California Community Colleges Alternative and Renewable Fuel and Vehicle Technology
Programs, ARFVTP Final Project Report, June 2015.
California Environmental Protection Agency, Air Resources Board, Appendix C: Status of Alternative Fuel Infrastructure, for Non-ZEV Alternative Fuel Vehicles, undated. As of March
20, 2017:
https://www.arb.ca.gov/regact/2012/cfo2012/cfoappc.pdf
———, “Methodology Worksheet and Additional Supporting Information,” undated. As of June
15, 2017:
http://www.arb.ca.gov/fuels/lcfs/regamend14/nlb_e85worksheet_10162014.pdf
———, Detailed California Modified GREET Pathway for Compressed Gaseous Hydrogen from North American Natural Gas, February 27, 2009. As of March 22, 2017:
https://www.arb.ca.gov/fuels/lcfs/022709lcfs_h2.pdf

325
———, Staff Report: Initial Statement of Reasons, Advanced Clean Cars, 2012 Proposed
Amendments to the California Zero Emission Vehicle Program Regulations, December 7,
2011. As of August 27, 2013:
http://www.arb.ca.gov/regact/2012/zev2012/zevisor.pdf
———, “Table 6. Carbon Intensity Lookup Table for Gasoline and Fuels that Substitute for Gasoline,” November 28, 2012. As of March 21, 2017:
http://www.arb.ca.gov/fuels/lcfs/lu_tables_11282012.pdf
———, Appendix B: Development of Illustrative Compliance Scenarios and Evaluation of Potential
Compliance Curves, April 1, 2015. As of March 21, 2017:
https://www.arb.ca.gov/regact/2015/lcfs2015/lcfs15appb.pdf
———, 2016 Annual Evaluation of Hydrogen Fuel Cell Electric Vehicle Deployment and Hydrogen
Fuel Station Network Development, July 2016. As of March 10, 2017:
https://www.arb.ca.gov/msprog/zevprog/ab8/ab8_report_2016.pdf
———, “Data Dashboard,” arb.ca.gov, May 18, 2017. As of March 20, 2017: https://www.arb.ca.gov/fuels/lcfs/dashboard/dashboard.htm
———, Final Regulation Order, Regulation on Commercialization of Alternative Diesel Fuels,
November 15, 2015. As of March 21, 2017:
https://www.arb.ca.gov/regact/2015/adf2015/adffinalregorder.pdf
———, “Low Carbon Fuel Standard Reporting Tool Quarterly Summaries,” April 19, 2017. As of
June 12, 2017:
http://www.arb.ca.gov/fuels/lcfs/lrtqsummaries.htm
———, “Low Carbon Fuel Standard,” arb.ca.gov, May 17, 2017. As of March 20, 2017:
https://www.arb.ca.gov/fuels/lcfs/lcfs.htm
———, Implementation Manual for the Clean Vehicle Rebate Project (CVRP), May 23, 2017. As of
June 7, 2017:
https://cleanvehiclerebate.org/sites/default/files/docs/nav/transportation/cvrp/document
s/CVRP-Implementation-Manual.pdf
California Employment Development Department, Labor Market Information Division,
California Green Transportation Jobs Report, July 2010.
———, California’s Green Economy: Summary of Survey Results, October 2010. As of March 13, 2017:
http://www.labormarketinfo.edd.ca.gov/contentpub/GreenDigest/CA-Green-Economy-
SummarySurveyResults.pdf
California Employment Training Panel, Employment Training Panel Annual Report 2014–2015,
undated. As of March 20, 2017:
https://www.etp.ca.gov/About-Us/Annual-Reports.aspx
California Energy Commission, “Advisory Committee Members for the Alternative and Fuel and
Vehicle Technology Program,” undated. As of June 1, 2017:
http://www.energy.ca.gov/2012-ALT-2/documents/advisory_committee_members.pdf

326
———, “Alternative and Renewable Fuel and Vehicle Technology Program Proceedings,”
undated. As of June 1, 2017:
http://www.energy.ca.gov/altfuels/
———, “California Retail Fuel Outlet Annual Reporting (CEC-A15) Results,” undated. As of
November 23, 2016: http://www.energy.ca.gov/almanac/transportation_data/gasoline/piira_retail_survey.html
———, “Documents, Notices and Reports: Fuels and Transportation Technology Merit Review,”
docket #15-MISC-04, undated. As of March 24, 2017:
http://www.energy.ca.gov/altfuels/2015-MISC-04/documents/
———, DRAFT REVIEW COPY–2015 Natural Gas Vehicle Research Roadmap, undated. As of
March 20, 2017:
http://www.afdc.energy.gov/pdfs/draft-natural-gas-vehicle-research-roadmap.pdf
———, “Electric Drive Projects,” undated. As of June 8, 2017:
http://www.energy.ca.gov/drive/projects/electric.html
———, Transportation Fuels Data Unit, Energy Commission Transportation Fuel Volume
Summary (in Native Units), Table 2, 2016 1st Quarter Update, provided to authors by CEC, 2016.
———, “Ethanol in California,” undated. As of March 20, 2017:
http://www.energy.ca.gov/almanac/transportation_data/ethanol.html
———, Investment Plan for the Alternative and Renewable Fuel and Vehicle Technology Program,
CEC-600-2009-008-CMF, April 2009. As of June 21, 2017:
http://www.energy.ca.gov/2009publications/CEC-600-2009-008/CEC-600-2009-008-
CMF.PDF
———, 2010–2011 Investment Plan for the Alternative and Renewable Fuel and Vehicle
Technology Program, CEC-600-2010-001-SD-REV2, April 2010. As of June 21, 2017:
http://www.energy.ca.gov/2010publications/CEC-600-2010-001/CEC-600-2010-001-SD-
REV2.PDF.
———, Alternative and Renewable Fuel and Vehicle Technology Program Solicitation Number
PON-09-607, Subject Area: California Ethanol Producer Incentive Program, 2010.
———, 2012–2013 Investment Plan for the Alternative and Renewable Fuel and Vehicle
Technology Program, CEC-600-2010-001-SD-REV2, April 2012. As of June21, 2017:
http://www.energy.ca.gov/2010publications/CEC-600-2010-001/CEC-600-2010-001-SD-
REV2.PDF
———, 2016–2017 Investment Plan for the Alternative and Renewable Fuel and Vehicle
Technology Program, CEC-600-2015-014-CMF, May 2016. As of June 21, 2017: http://www.energy.ca.gov/2015publications/CEC-600-2015-014/CEC-600-2015-014-CMF.pdf
———, 2017–2018 Investment Plan for the Alternative and Renewable Fuel and Vehicle
Technology Program, CEC-600-2016-007-SD, October 2016. As of June 21, 2017:
http://www.energy.ca.gov/2016publications/CEC-600-2016-007/CEC-600-2016-007-SD.pdf

327
California New Car Dealers Association, California Auto Outlook, Vol. 12, No. 1, February 2016.
As of June 1, 2017:
http://www.cncda.org/CMS/Pubs/Cal%20Covering%204Q%2015.pdf
Caputo, Samantha, Towards a Reduction in Methane Emissions from Natural Gas in California: A
Policy Brief on the Short-Lived Climate Pollutant Strategy, master’s thesis, Worcester, Mass.: Clark University, May 2016.
CCCCO—See California Community College Chancellor’s Office.
CEC—See California Energy Commission.
Cline, Harry, “Sugarcane: California's Triple Threat?” Western Farm Press, June 20, 2001. As of
June 1, 2017:
http://www.westernfarmpress.com/sugarcane-californias-triple-threat
———, “30,000 Grain Sorghum Acres Target California Ethanol Plants,” Western Farm Press, February 25, 2013. As of March 20, 2017:
http://westernfarmpress.com/markets/30000-grain-sorghum-acres-target-california-
ethanol-plants?page=5
ClipperCreek, Inc., “Comments: Funding Strategies for EV Infrastructure,” Auburn, Calif., July
13, 2016. As of June 10, 2017:
http://docketpublic.energy.ca.gov/PublicDocuments/16-ALT-
01/TN212275_20160713T122544_ClipperCreek_Inc_Comments_ClipperCreek_inc_Comment
s_to_Docket_N.pdf
COECON—See Collaborative Economics, Inc.
Collaborative Economics, Inc., California’s Advanced Transportation Industry Clusters of
Opportunity: Driving Market Expansion, Technology, Innovation and Job Growth, September
2013. As of June 20, 2017:
http://www.coecon.com/assets/ca_advancedtransportclusters_2013.pdf
———, How California Regions Are Expanding the Advanced Transportation Industry, December
2014. As of June 20, 2017: http://www.coecon.com/assets/rico_summary_2014.pdf
“Computer-Assisted Survey Execution System (CASES),” undated. As of March 29, 2017:
http://cases.berkeley.edu/index.html
Cox, Brenda G., David A. Binder, B. Nanjamma Chinnappa, Anders Christianson, Michael J.
Colledge, and Phillip S. Kott, eds. Business Survey Methods, 1st ed., New York: John Wiley &
Sons, 1995.
DoE—See U.S. Department of Energy.
Dorminey, Bruce, “Ethanol from Energy Beets: A Viable Option?” Renewable Energy World,
Vol. 17, No. 2, April 22, 2014. As of June 1, 2017:
http://www.renewableenergyworld.com/articles/print/volume-17/issue-
2/bioenergy/ethanol-from-energy-beets-a-viable-option.html

328
“Eaton Electric Vehicle Simulator,” eaton.com, undated. As of March 21, 2017:
http://www.eaton.com/EatonCA/ProductsSolutions/Electrical/ProductsandServices/Electric
alDistribution/ElectricVehicleChargingSolutions/ElectricVehicleSimulator/index.htm
EDD—See California Employment Development Department,.
Elam, Rob, Will Faulkner, Chris LaPlante, and Parker Chase, E85: A California Success Story, A
Propel Fuels White Paper, June 2015. As of June 1, 2017:
http://web-
assets.propelfuels.com.s3.amazonaws.com/pfc15/CA_E85_Propel_White_Paper_6.1.15.pdf
EPA—See U.S. Environmental Protection Agency.
Eudy, Leslie, Robert Prohaska, Kenneth Kelly, and Matthew Post, Foothill Transit Battery Electric
Bus Demonstration Results, Golden, Colo.: National Renewable Energy Laboratory, January
2016. As of March 21, 2017:
http://www.nrel.gov/docs/fy16osti/65274.pdf
Federal Highway Administration, “National Household Transportation Survey: Our Nation’s
Travel,” 2009. As of March 22, 2017:
http://nhts.ornl.gov/download.shtml
Federal Reserve Bank of San Francisco, “Lessons for a New Context: Workforce Development in
an Era of Economic Challenge,” Community Investments, Vol. 21, No. 1, Spring 2009. As of March 20, 2017:
http://www.frbsf.org/community-development/publications/community-
investments/2009/may/workforce-development-economic-challenge/
Forbes.com, “#42 Propel Fuels,” undated. As of November 15, 2015:
http://www.forbes.com/lists/2011/28/most-promising-companies-11_Propel-
Fuels_1ZLH.html
Fuels Institute, “Tomorrow’s Vehicles: What Will We Drive in 2023?” 2013. As of March 20,
2017: http://www.fuelsinstitute.org/ResearchArticles%5CTomorrowsVehicles.pdf
———, E85: A Market, Performance Analysis and Forecast, 2014. As of June 1, 2017:
http://www.fuelsinstitute.org/researcharticles/e85_amarketperformanceanalysisforecast.pdf
Great Lakes Bioenergy Research Center, Why Is It So Difficult to Make Cellulosic Ethanol? 2010,
http://www.glbrc.org/sites/default/files/Cellulosic_Ethanol.pdf
Hart Energy, “Kern, Neste Eyeing CARB Low-Carbon Fuel Standard with Renewable Diesel Fuels,” Diesel Fuel News, Vol. 15, No. 37, September 26, 2011.
Hatry, Harry P., Performance Measurement: Getting Results, 2nd ed., Washington, D.C.: The
Urban Institute Press, 2006.
Howell, Steve, “Summary of FTC Regulations Regarding Signage/Labelling,” May 20, 2014. As of
March 21, 2017:
http://www.mda.state.mn.us/renewable/biodiesel/~/media/Files/renewable/biodiesel/biodl
abel201405.pdf

329
Hyundai, “2017 Tucson Fuel Cell,” print advertisement, undated. As of November 23, 2016:
https://www.hyundaiusa.com/tucsonfuelcell/index.aspx
Idaho National Laboratory, Summary Report: Plugged In: How Americans Charge Their Electric
Vehicles, 2015. As of March 20, 2017:
https://avt.inl.gov/sites/default/files/pdf/arra/SummaryReport.pdf
———, The EV Project: What Were the Cost Drivers for the Direct Current Fast Charging
Installations? March 2015. As of March 22, 2017:
https://avt.inl.gov/sites/default/files/pdf/EVProj/WhatWereTheCostDriversForDCFCinstalla
tions.pdf
———, How Do Residential Level 2 Charging Installation Costs Vary by Geographic Location?
April 2015. As of March 22, 2017:
https://avt.inl.gov/sites/default/files/pdf/EVProj/HowDoResidentialChargingInstallationCo
stsVaryByGeographicLocations.pdf
———, How Do Publicly Accessible Charging Infrastructure Installation Costs Vary by Geographic
Location? May 2015. As of March 22, 2017:
https://avt.inl.gov/sites/default/files/pdf/EVProj/HowDoPubliclyAccessibleInfrastructureIn
stallationCostsVaryByGeographicLocation.pdf
Institute of Transportation Studies, University of California, Irvine, “Natural Gas Vehicle
Incentive Funding Status,” 2015. As of March 20, 2017:
https://ngvip.its.uci.edu/funding-status
Johnston, Marsha W, “Breaking Down Renewable Natural Gas Injection Barriers,” BioCycle.net,
Vol. 55, No. 8, September 2014, p. 60. As of March 20, 2017:
https://www.biocycle.net/2014/09/18/breaking-down-renewable-natural-gas-injection-
barriers/
Kahneman, Daniel, and Amos Tversky, “Prospect Theory: An Analysis of Decision Making under
Risk,” Econometrica, Vol. 47, No. 2, March 1979, pp. 263–291.
Keller, Ben, “Beet Ethanol Demonstration Project to Begin Next Month,” Business Journal,
November 18, 2014. As of May 24, 2017:
http://www.thebusinessjournal.com/news/energy-and-environment/14782-beet-ethanol-
demonstration-project-to-begin-next-month
Kotrba, Ron, “Importing to Meet California Demand,” Biodiesel Magazine, March 25, 2016. As of
June 9, 2016:
http://biodieselmagazine.com/articles/924511/importing-to-meet-california-demand
Krok, Andrew, “Automakers, Oil Companies Team Up to Push Hydrogen Investments,”
CNET.com, January 18, 2017. As of March 22, 2017:
https://www.cnet.com/roadshow/news/automakers-oil-companies-team-up-to-push-
hydrogen-investments/
Lazear, Edward P., “Firm-Specific Human Capital: A Skill-Weights Approach,” Journal of Political Economy, Vol. 117, No. 5, October 2009, pp. 914–940.
330
Leuven, Edwin, “The Economics of Private Sector Training: A Survey of the Literature,” Journal
of Economic Surveys, Vol. 19, No. 1, February 2005, pp. 91–111.
Mathews, John A., and Hao Tan, “Biofuels and Indirect Land Use Change Effects: The Debate
Continues,” Biofuels, Bioproducts, and Biorefining, Vol. 3, No. 3, May/June 2009, pp. 305–
317.
McKinney, Jim, Élan Bond, Miki Crowell, and Esther Odufuwa, Joint Agency Staff Report on
Assembly Bill 8: Assessment of Time and Cost Needed to Attain 100 Hydrogen Refueling
Stations in California, CEC-600-2015-016 Sacramento, Calif.: California Energy Commission,
December 2015.
Melaina, M. W., and M. Penev, Hydrogen Refueling Infrastructure Cost Analysis, Arlington, Va.,
May 15, 2012.
Melaina, Marc, Ethan Warner, Yongling Sun, Emily Newes, and Adam Ragatz (National Renewable Energy Laboratory), Program Benefits Guidance: Analysis of Benefits Associated With Projects
and Technologies Supported by the Alternative and Renewable Fuel and Vehicle Technology
Program, Publication Number CEC‐600‐2014‐005‐D, Sacramento, Calif.: California Energy
Commission, June 2014. As of June 1, 2017:
http://www.energy.ca.gov/2014publications/CEC-600-2014-005/CEC-600-2014-005-D.pdf
National Renewable Energy Laboratory, “Hydrogen and Fuel Cell Research,” undated. As of July
15, 2013: http://www.nrel.gov/hydrogen/proj_production_delivery.html
———, “Energy Analysis: Biogas Potential in the United States,” Golden, Colo., October 2013. As of June 1, 2017:
http://www.nrel.gov/docs/fy14osti/60178.pdf
National Research Council: Committee on Transitions to Alternative Vehicles and Fuels,
Transitions to Alternative Vehicles and Fuels, 2013. As of March 20, 2017:
https://www.nap.edu/download/18264
New Mexico State University, Arrowhead Center, Identification of Key Barriers in Workforce
Development, Las Cruces, N. M.: National Security Preparedness Project Grant No: DE-FG52-
07NA28084, March 31, 2008. As of March 20, 2017:
http://www.osti.gov/scitech/servlets/purl/926219
NGV Today, “Fugitive Methane Emissions Rising Policy Concern for the NGV Industry,” January
22, 2015.
Office of the Governor of California, Executive Order S-3-05, June 2005. As of June 16, 2017:
https://www.gov.ca.gov/news.php?id=1861
Office of the Governor of California, Executive Order B-30-15, April 29,2015. As of June 16,
2017: https://www.gov.ca.gov/news.php?id=18938
Official Nebraska Government Website, “Ethanol Production Capacity by Plant—Archive 2005–
2017,” 2017. As of May 30, 2017:
http://www.neo.ne.gov/statshtml/122_archive.htm

331
Office of the State Fire Marshal, The Emergency Response Guide to Alternative Fuel Vehicles,
June 2009. As of August 30, 2013:
http://osfm.fire.ca.gov/Training/pdf/alternativefuelvehicles/Altfuelintroduction.pdf
Oil Price Information Reporting Service, RIN price database, accessed January 2017.
Pacific Biodiesel, “Biodiesel Benefits—Why Use Biodiesel,” undated. As of May 30, 2017: http://www.biodiesel.com/biodiesel/benefits/
Pacific Ethanol, Inc., “Pacific Ethanol Begins Commercial Production of Cellulosic Ethanol at Its
Stockton Plant,” Sacramento, Calif., December 16, 2015. As of May 30, 2017:
http://ir.stockpr.com/pacificethanol/press-releases/detail/470/pacific-ethanol-begins-
commercial-production-of-cellulosic-ethanol-at-its-stockton-plant
Propel Fuels, “Diesel HPR,” undated. As of August 1, 2016:
https://propelfuels.com/our_fuels
Renewable Fuels Association, “E85 Prices,” undated. As of May 30, 2017:
https://e85prices.com/california.html
———, “World Fuel Ethanol Production: Production 1980–2016,” undated. As of May 30, 2017:
http://ethanolrfa.org/resources/industry/statistics/#1454099788442-e48b2782-ea53
Richtel, Matt, “A Car Dealers Won’t Sell: It’s Electric,” New York Times, November 25, 2015. As
of June 8, 2017:
https://www.nytimes.com/2015/12/01/science/electric-car-auto-dealers.html
SAE International, “SAE Charging Configurations and Ratings Terminology,” 2011.
http://www.sae.org/smartgrid/chargingspeeds.pdf
———, “Recommended Practice for General Fuel Cell Vehicle Safety,” August 26, 2014. As of
May 30, 2017:
http://standards.sae.org/j2578_201408/
Satyapal, Sunita, Larry Blair, Grace Ordaz, Carole Read, Ned Stetson, and George Thomas. “The
U.S. National Hydrogen Storage Project Overview,” presented at the Combinatorial/High
Throughput Techniques for Hydrogen Storage Meeting, Bethesda, Md., June 26, 2007. As of
June 22, 2017:
https://energy.gov/sites/prod/files/2014/03/f12/doe_overview_satyapal.pdf
Searchinger, Timothy, Ralph Heimlich, R. A. Houghton, Fengxia Dong, Amani Elobeid, Jacinto
Fabiosa, Simla Tokgoz, Dermot Hayes, and Tun-Hsiang Yu, “Use of U.S. Croplands for
Biofuels Increases Greenhouse Gases Through Emissions from Land Use Change,” Science,
Vol. 319, No. 1238–1240, February 2008.
Shapouri, Hossein, and Michael J. Salassi, The Economic Feasibility of Ethanol Production from
Sugar in the United States, Washington, D.C.: U.S. Department of Agriculture, 2006.
South Coast Air Quality Management District, “Rule 1193—Clean On-Road Residential and
Commercial Refuse Collection Vehicles,” undated. As of March 20, 2017:
http://www.aqmd.gov/home/regulations/fleet-rules/refuse-collection-vehicles

332
State of California Energy Commission and the University of California, Irvine, Application
Manual: Natural Gas Vehicle Incentive Project (NGVIP), August 3, 2015. As of June 14, 2017:
https://ngvip.its.uci.edu/docs/ngvip-application-manual-2015-08-03-rev2.pdf
Toyota, “Mirai Fuel Cell Vehicle,” online promotion, undated. As of May 30, 2017:
https://ssl.toyota.com/mirai/fcv.html
U.S. Census Bureau, “Business Dynamics Statistics: Establishment Characteristics Data Tables,”
undated. As of March 20, 2017:
http://www.census.gov/ces/dataproducts/bds/data_estab.html
———, “2014 SUSB Annual Data Tables by Establishment Industry (U.S., 6-Digit NAICS),
December 2016.
U.S. Department of Agriculture, Economic Research Service, “Sugar and Sweeteners,” April 28,
2017. As of May 30, 2017:
http://www.ers.usda.gov/topics/crops/sugar-sweeteners/background/
U.S. Department of Energy, Energy Efficiency and Renewable Energy, “Alternative Fuels Data
Center: Alternative Fuel and Advanced Vehicle Search,” undated. As of March 20, 2017:
http://www.afdc.energy.gov/vehicles/search/
———, “Alternative Fuels Data Center: Biobutanol,” undated. As of March 20, 2017:
http://www.afdc.energy.gov/fuels/emerging_biobutanol.html
———, “Alternative Fuels Data Center: Biodiesel Fueling Station Locations,” undated. As of May
30, 2017:
https://www.afdc.energy.gov/locator/stations/
———, “Alternative Fuels Data Center: Developing Infrastructure to Charge Plug-in Electric
Vehicles,” undated. As of March 22, 2017:
http://www.afdc.energy.gov/fuels/electricity_infrastructure.html
———, “Alternative Fuels Data Center: Electric Vehicle Charging Station Locations,” April 21,
2017. As of June 11, 2017:
https://www.afdc.energy.gov/fuels/electricity_locations.html
———, “Alternative Fuels Data Center: Flexible Fuel Vehicles,” undated. As of July 31, 2017:
http://www.afdc.energy.gov/vehicles/flexible_fuel.html
———, “Alternative Fuels Data Center: Hydrogen Basics,” undated. As of March 10, 2017:
http://www.afdc.energy.gov/fuels/hydrogen_basics.html
———, “Alternative Fuels Data Center: Hydrogen Fueling Station Locations,” undated. As of
November 23, 2016:
http://www.afdc.energy.gov/fuels/hydrogen_locations.html
———, “Alternative Fuels Data Center: Natural Gas Benefits and Considerations,” undated. As of
May 30, 2017:
http://www.afdc.energy.gov/fuels/natural_gas_benefits.html

333
———, “Alternative Fuels Data Center: Natural Gas Fueling Station Locations,” undated. As of
May 30, 2017:
http://www.afdc.energy.gov/fuels/natural_gas_locations.html
———, “Alternative Fuels Data Center: Natural Gas Fueling Infrastructure Development,”
undated. As of May 30, 2017: https://www.afdc.energy.gov/fuels/natural_gas_infrastructure.html
———, “Alternative Fuels Data Center: Natural Gas Vehicles,” undated. As of May 30, 2017:
http://www.afdc.energy.gov/vehicles/natural_gas.html
———, “Alternative Fuels Data Center: Renewable Natural Gas (Biomethane) Production,”
undated. As of March 20, 2017:
http://www.afdc.energy.gov/fuels/natural_gas_renewable.html
———, “www.fueleconomy.gov,” undated. As of June 8, 2017:
http://fueleconomy.gov/
———, “www.fueleconomy.gov: Ethanol,” undated. As of June 1, 2017:
http://www.fueleconomy.gov/feg/ethanol.shtml
———, "Fuel Cell Technologies Office Closed Funding Opportunities,” undated. As of March 22, 2017:
https://energy.gov/eere/fuelcells/fuel-cell-technologies-office-closed-funding-opportunities
———, "Hydrogen Production: Electrolysis," undated. As of March 22, 2017:
https://energy.gov/eere/fuelcells/hydrogen-production-electrolysis
———, “Alternative Fuels Data Center: Maps and Data—Global Ethanol Production,” March
2016. As of March 20, 2017:
http://www.afdc.energy.gov/data/10331
———, Cost Reduction and Performance Improvements of Composite Overwrapped Pressure
Vessel Systems for Compressed Hydrogen for Onboard Vehicle Applications, June 7, 2016. As of March 22, 2017:
https://eere-exchange.energy.gov/FileContent.aspx?FileID=15fe03e3-cec9-48de-8f7e-
8d2c337b1282
———, Clean Cities Alternative Fuel Price Report, July 2016. As of March 21, 2017:
http://www.afdc.energy.gov/uploads/publication/alternative_fuel_price_report_july_2016.p
df
———, Fuel Cell Technologies Market Report 2015, August 2016. As of March 22, 2017:
https://energy.gov/sites/prod/files/2016/10/f33/fcto_2015_market_report.pdf
———, “Alternative Fuels Data Center: Ethanol Fueling Station Locations,” 2017. As of March 20,
2017:
http://www.afdc.energy.gov/fuels/ethanol_locations.html
———, “Alternative Fuels Data Center: Fuel Prices,” May 2017. As of May 30, 2017:
http://www.afdc.energy.gov/fuels/prices.html

334
U.S. Department of Transportation, National Highway Traffic Safety Administration,
Compressed Hydrogen Cylinder Research and Testing in Accordance with FMVSS 304, June
2009. As of May 30, 2017:
https://www.nhtsa.gov/sites/nhtsa.dot.gov/files/811150_0.pdf
U.S. Energy Information Administration, “Today in Energy: Almost All U.S. Gasoline Is Blended with 10% Ethanol,” May 4, 2016. As of March 20, 2017:
https://www.eia.gov/todayinenergy/detail.php?id=26092
———, “Annual Energy Outlook 2017, Table: Light-Duty Vehicle Stock by Technology Type,
Case: Reference Case,” 2017. As of June 15, 2017:
https://www.eia.gov/outlooks/aeo/data/browser/#/?id=49-AEO2017®ion=0-
0&cases=ref2017&start=2015&end=2050&f=A&linechart=~~~~~~~~~ref2017-d120816a.52-
49-AEO2017&ctype=linechart&sourcekey=0
———, “Frequently Asked Questions: How Much Ethanol Is in Gasoline, and How Does It Affect
Fuel Economy?” March 29, 2017. As of May 30, 2017: http://www.eia.gov/tools/faqs/faq.cfm?id=27&t=10
———, “Natural Gas Consumption by End Use (Data Series: Volumes Delivered to Vehicle Fuel
Customers),” April 28, 2017. As of July 1, 2013:
http://www.eia.gov/dnav/ng/ng_cons_sum_a_epg0_vdv_mmcf_a.htm
———, “Petroleum and Other Liquids,” April 28, 2017. As of May 25, 2017:
http://www.eia.gov/dnav/pet/pet_cons_psup_dc_nus_mbbl_a.htm
———, “Use of Energy in the United States Explained: Energy Use for Transportation,” May 17,
2017. As of March 20, 2017:
http://www.eia.gov/energyexplained/?page=us_energy_transportation
———, “Natural Gas: Natural Gas Consumption by End Use,” May 31, 2017. As of May 25, 2017:
http://www.eia.gov/dnav/ng/ng_cons_sum_dcu_nus_a.htm
U.S. Environmental Protection Agency, Combined Heat and Power Partnership, Opportunities for
Combined Heat and Power at Wastewater Treatment Facilities: Market Analysis and Lessons
from the Field, October 2011. As of March 20, 2017:
https://www.epa.gov/sites/production/files/2015-
07/documents/opportunities_for_combined_heat_and_power_at_wastewater_treatment_facil
ities_market_analysis_and_lessons_from_the_field.pdf
U.S. Environmental Protection Agency, Landfill Methane Outreach Program (LMOP), “Landfill Gas
Energy Project Data and Landfill Technical Data,” undated. As of March 20, 2017:
https://www.epa.gov/lmop/landfill-gas-energy-project-data-and-landfill-technical-data#states
U.S. Environmental Protection Agency, Renewable Fuel Standard Program, “What Is a Fuel
Pathway?” 2016. As of March 20, 2017:
https://www.epa.gov/renewable-fuel-standard-program/what-fuel-pathway
Voegele, Erin, “New Calif. Law Excludes Corn Ethanol from DRIVE Program Funding,” Ethanol
Producer Magazine, September 06, 2012. As of May 24, 2017:

335
http://ethanolproducer.com/articles/9085/new-calif-law-excludes-corn-ethanol-from-drive-
program-funding
Waste Management, “Case Study: Altamont Landfill and Resource Recovery Facility,” 2011. As of
March 20, 2017:
http://www0.wm.com/federal/case-studies/altamont.html