Embed Size (px)
Citation preview
Persistent link: http://hdl.handle.net/2345/bc-ir:104266
This work is posted on eScholarship@BC,Boston College University Libraries.
Boston College Electronic Thesis or Dissertation, 2013
Copyright is held by the author, with all rights reserved, unless otherwise noted.
The effect of grain size on river deltaprocess and morphology
Author: Rebecca Lee Caldwell
Boston College
The Graduate School of Arts and Sciences
Department of Earth and Environmental Sciences
THE EFFECT OF GRAIN SIZE ON RIVER DELTA PROCESS AND MORPHOLOGY
a thesis
by
REBECCA LEE CALDWELL
submitted in partial fulfillment of the requirements
for the degree of
Master of Science
May, 2013

© copyright by REBECCA LEE CALDWELL 2013
Abstract
The effect of grain size on river delta process and morphology
Rebecca L. Caldwell
Advisor: Douglas Edmonds
Delta morphology is traditionally explained by differences in fluvial energy and wave
and tidal energy. However, deltas influenced by similar ratios of river to marine energy
can display strikingly different morphologies. Other variables, such as grain size of the
sediment load delivered to the delta, influence delta morphology, but these models are
largely qualitative leaving many questions unanswered. To better understand how grain
size modifies deltaic processes and morphologies I conducted 33 numerical modeling
experiments and quantified the effects produced by different grain sizes. In these 33 runs
I change the median (0.01 – 1 mm), standard deviation (0.1 – 3 φ), and skewness (-0.7 –
0.7) of the incoming grain-size distribution. The model setup includes a river carrying
constant discharge entering a standing body of water devoid of tides, waves, and sea-
level change. The results show that delta morphology undergoes a transition as median
grain size and standard deviation increase while changing skewness has little effect. At
small median grain size and standard deviation, deltas have elongate planform
morphologies with sinuous shorelines characterized by shallow topset gradients ranging
from 1 x 10⁻⁴ to 3 x 10⁻⁴, and by 1 - 8 stable active channels. At large median grain size
and standard deviation, deltas transition to semi-circular planform morphologies with
smooth shorelines characterized by steeper topset gradients ranging from 1 x 10⁻³ to 2 x
10-3, and by 14 - 16 mobile channels. The change in delta morphology can be
morphodynamically linked to changes in grain size. As grain size increases delta
morphology transitions from elongate to semi-circular because the average topset
gradient increases. For a given set of flow conditions, larger grain sizes require a steeper
topset gradient to mobilize and transport. The average topset gradient reaches a dynamic
equilibrium through time. This requires that, per unit length of seaward progradation,
deltas with steeper gradients have higher vertical sedimentation rates. Higher
sedimentation rates, in turn, perch the channel above the surrounding floodplain (so-
called ‘super-elevation’), resulting in unstable channels that frequently avulse and create
periods of overbank flow. The overbank flow is more erosive because the steeper
gradient causes higher shear stresses on the floodplain, which creates more channels.
More channels reduce the average water and sediment discharge at a given channel
mouth, which creates time scales for mouth bar formation in coarse-grained deltas that
are longer than the avulsion time scale. This effectively suppresses the process of
bifurcation around river mouth bars in coarse-grained deltas, which in turn creates semi-
circular morphologies with smooth shorelines as channels avulse across the topset. On
the other hand, the finest-grained (i.e. mud) deltas have low topset gradients and fewer
channels. The high water and sediment discharge per channel, coupled with the slow
settling velocity of mud, advects the sediment far from channel mouths, which in turn
creates mouth bar growth and avulsion time scales that are longer than the delta life. This
creates an elongate delta as stable channels prograde basinward. Deltas with intermediate
grain sizes have nearly equal avulsion and bifurcation time scales, creating roughly semi-
circular shapes but with significant shoreline roughness where mouth bars form.
i
Table of Contents Acknowledgements ............................................................................................................. ii List of Figures .................................................................................................................... iii List of Tables .......................................................................................................................v 1. Introduction ......................................................................................................................1
2. Background ......................................................................................................................4
3. Methods............................................................................................................................9
3.1. Description of the Delft3D Model ............................................................................9
3.2. Model Setup ............................................................................................................12
3.3. Parameter Space ......................................................................................................18
4. Results ............................................................................................................................22
4.1. Variation in Delta-Building Processes ....................................................................26
4.2. Variation in Delta Channel Network and Planform Morphology ...........................27
4.2.1. Description of Morphometric Parameters ........................................................28
4.2.2. Effect of Median Grain Size on Delta Channel Network and Planform Morphology................................................................................................................31
4.2.3. Effect of Cohesion on Delta Channel Network and Planform Morphology ....38
5. Discussion ......................................................................................................................41
5.1. Does Median Grain Size Control Topset Gradient? ...............................................41
5.2. How Does Median Grain Size Control the Number of Channel Mouths? .............44
5.3. How Does Cohesion Control the Number of Channel Mouths?.............................49
5.4. Process-Based Model for Grain Size Effects on Delta Channel Network Morphology and Planform Morphology ........................................................................51
5.5. Influence of Catchment Characteristics on Delta Morphology ..............................53
6. Conclusion .....................................................................................................................55
Notation..............................................................................................................................57
REFERENCES ..................................................................................................................59

ii
Acknowledgements This research was funded by the National Science Foundation (OCE-1061380) awarded to Douglas Edmonds. Thank you to my advisor, Douglas Edmonds, for putting up with me for as long as you have and somehow agreeing to continue through a second degree. Your guidance has helped me grow into a more capable researcher and your encouragement has supported me through the long hours. Let’s keep it up over the next few (fingers crossed) years. I would also like to thank my professors at Boston College for teaching me the ways of the geologic world. Special thanks to my committee members, Gail Kineke and John Ebel, for extending that teaching to my thesis work. Similarly, I want to thank my fellow graduate students. You all have taught me just as much as my professors have, and I will (somehow) miss working through seemingly impossible problem sets late into the night together. Finally, thanks to my Mom. You are an inspiration and source of never-ending support. I don’t know how I could have done this without you.
iii
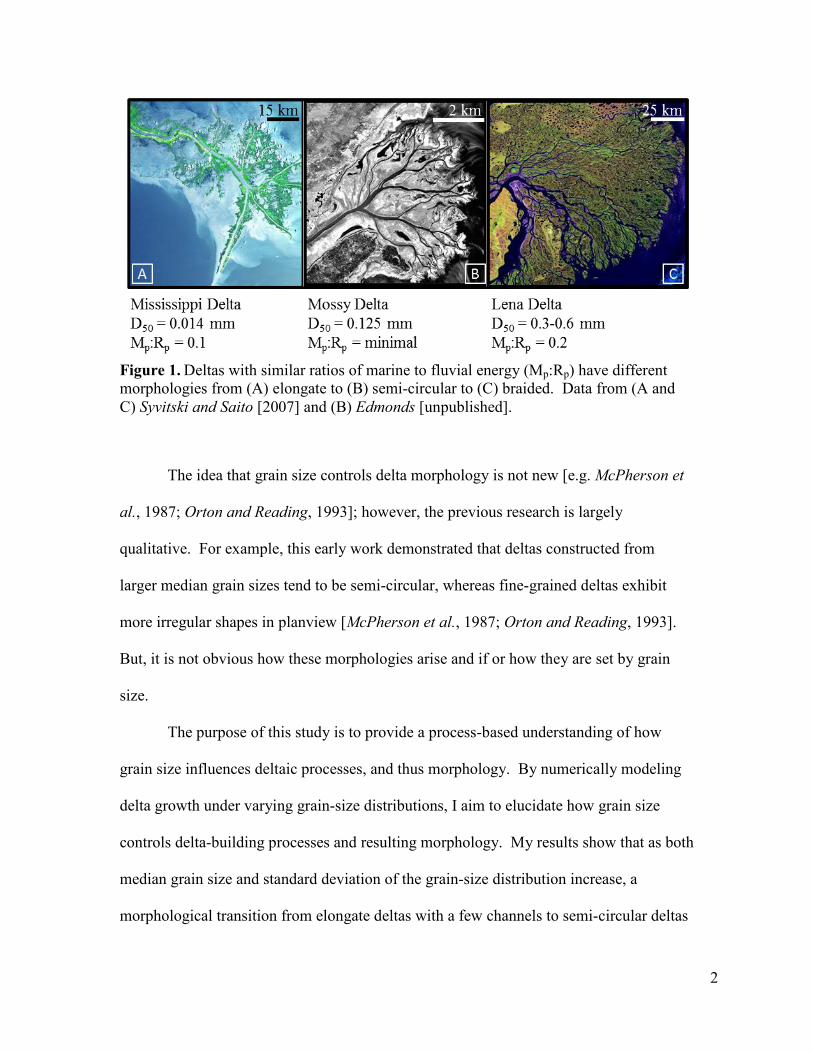
List of Figures Figure 1. Deltas with similar ratios of marine to fluvial energy (Mp:Rp) have different
morphologies from (A) elongate to (B) semi-circular to (C) braided. Data from (A and C) Syvitski and Saito [2007] and (B) Edmonds [unpublished]. ..........2
Figure 2. Delta morphology is related to grain size in addition to river, wave, and tidal energy (modified from Orton and Reading, 1993). .................................................5
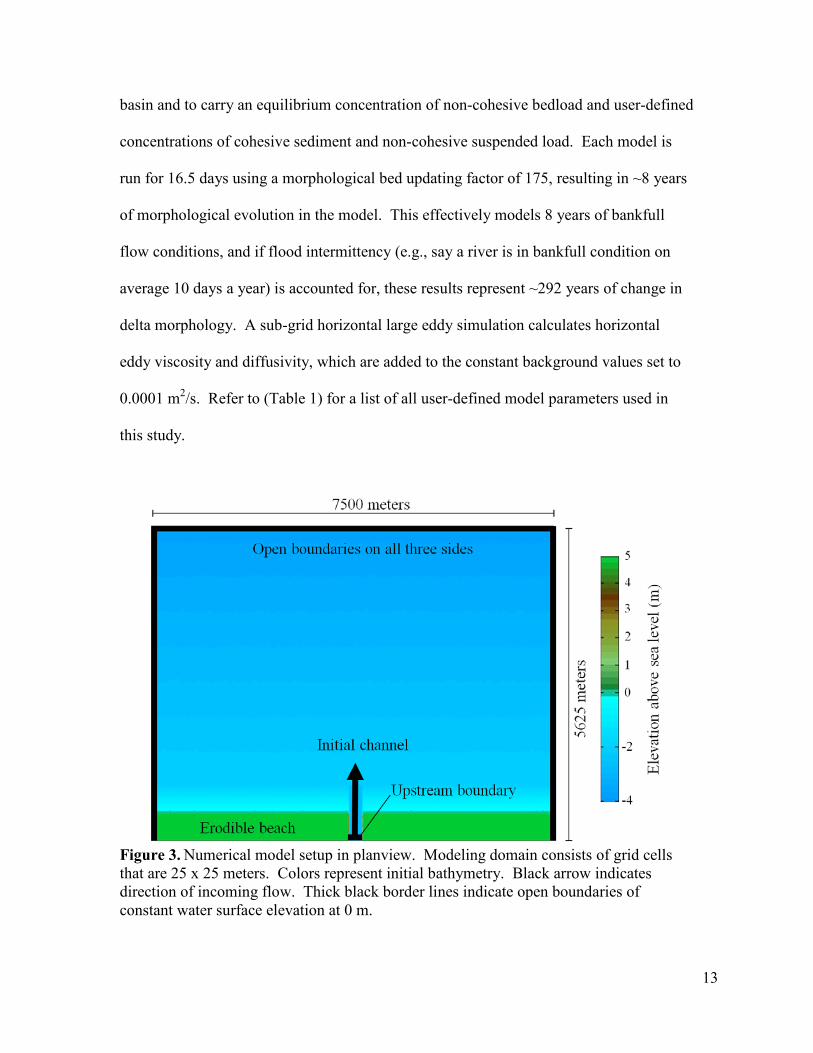
Figure 3. Numerical model setup in planview. Modeling domain consists of grid cells that are 25 x 25 meters. Colors represent initial bathymetry. Black arrow indicates direction of incoming flow. Thick black border lines indicate open boundaries of constant water surface elevation at 0 m. .........................................13
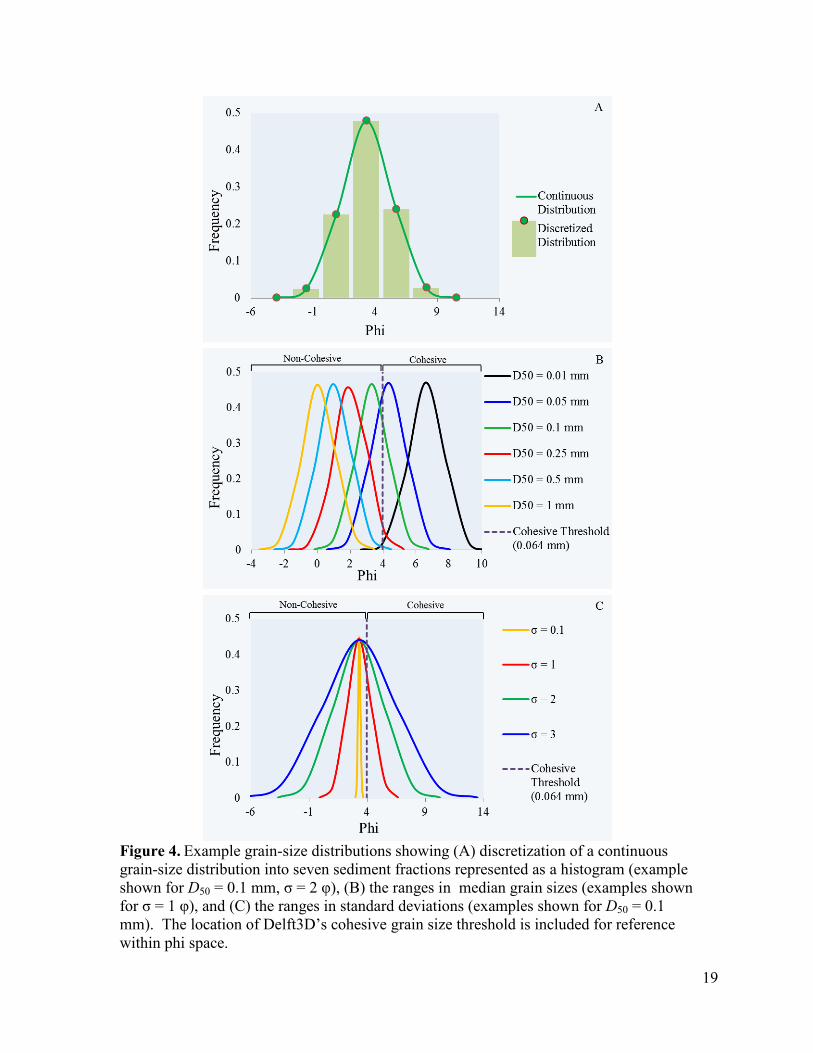
Figure 4. Example grain-size distributions showing (A) discretization of a continuous grain-size distribution into seven sediment fractions represented as a histogram (example shown for D50 = 0.1 mm, σ = 2 φ), (B) the ranges in median grain sizes (examples shown for σ = 1 φ), and (C) the ranges in standard deviations (examples shown for D50 = 0.1 mm). The location of Delft3D’s cohesive grain size threshold is included for reference within phi space. ......................................................................................................................19
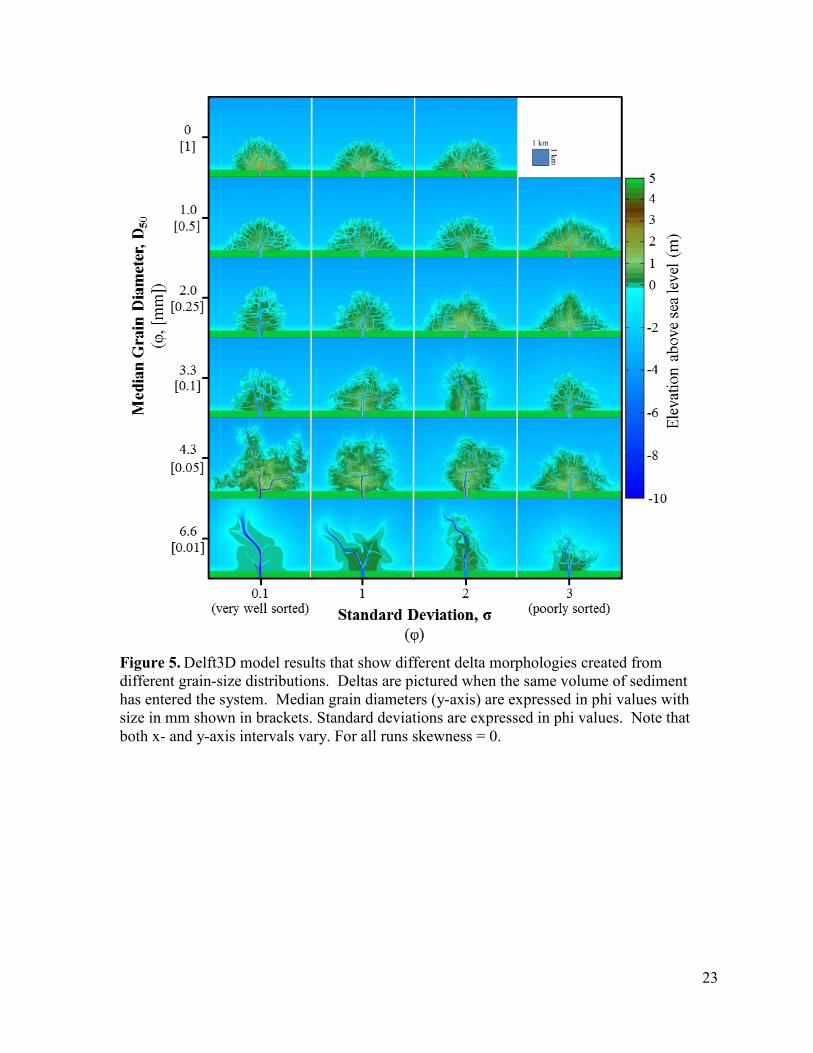
Figure 5. Delft3D model results that show different delta morphologies created from different grain-size distributions. Deltas are pictured when the same volume of sediment has entered the system. Median grain diameters (y-axis) are expressed in phi values with size in mm shown in brackets. Standard deviations are expressed in phi values. Note that both x- and y-axis intervals vary. For all runs skewness = 0. .............................................................................23
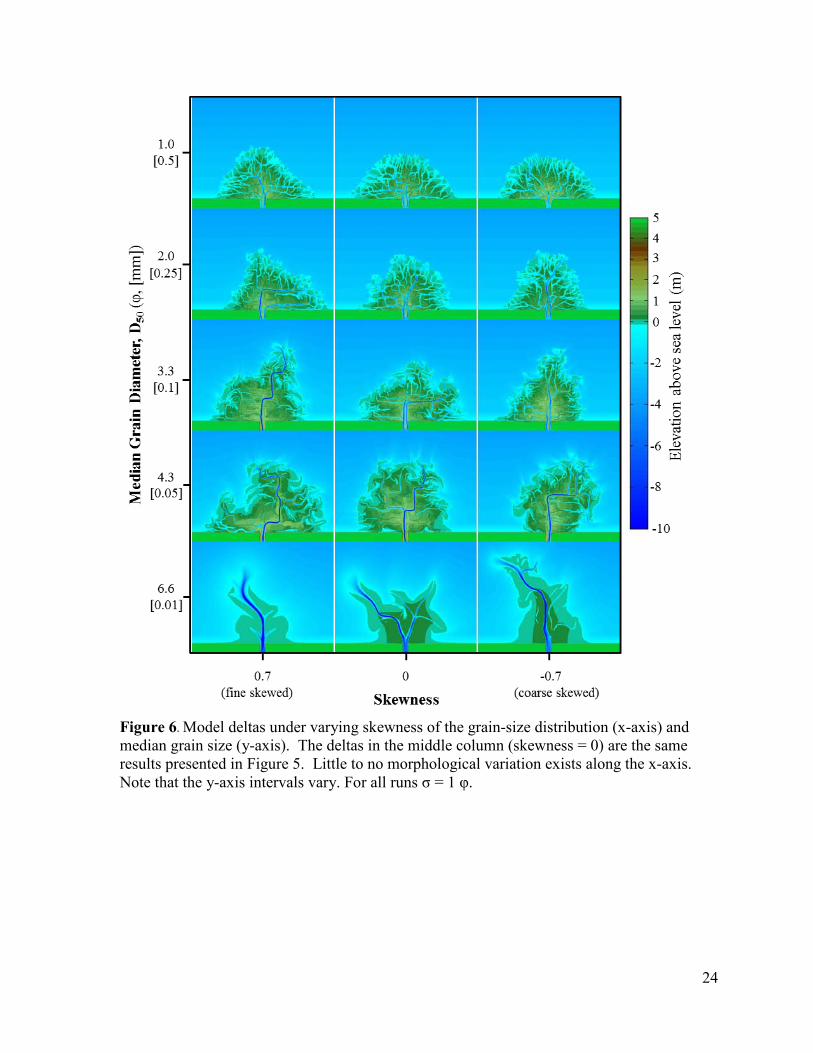
Figure 6. Model deltas under varying skewness of the grain-size distribution (x-axis) and median grain size (y-axis). The deltas in the middle column (skewness = 0) are the same results presented in Figure 5. Little to no morphological variation exists along the x-axis. Note that the y-axis intervals vary. For all runs σ = 1 φ. ...........................................................................................................24
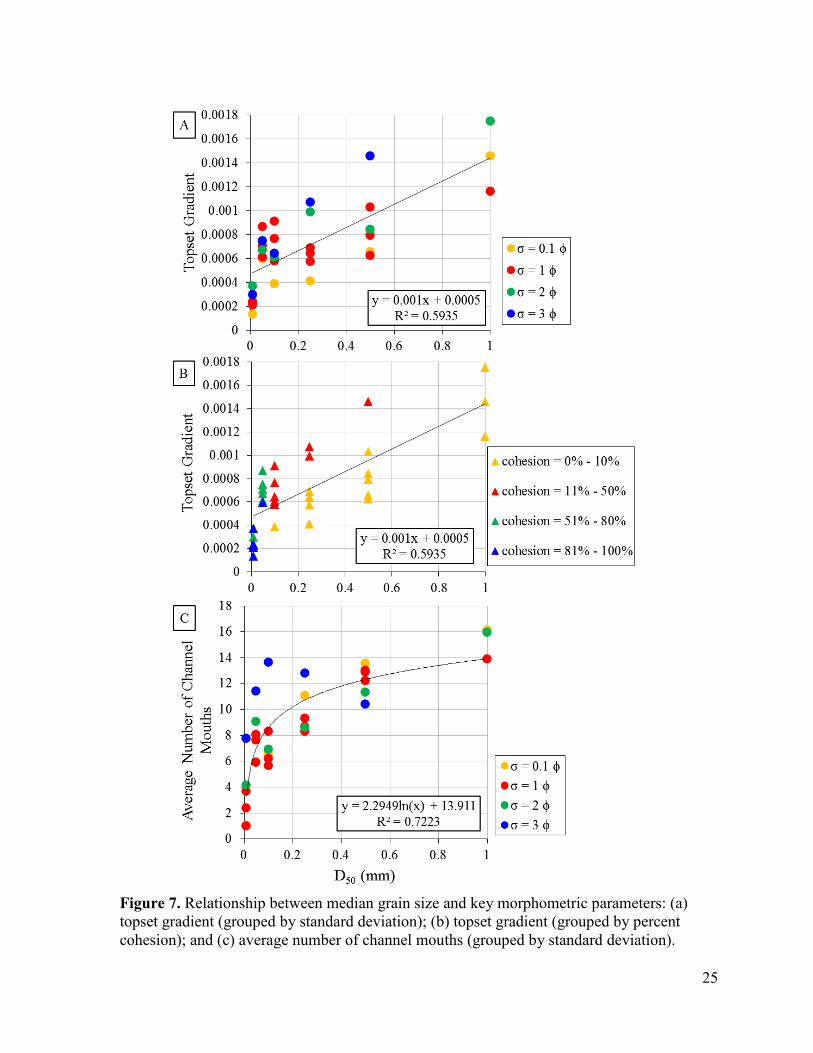
Figure 7. Relationship between median grain size and key morphometric parameters: (a) topset gradient (grouped by standard deviation); (b) topset gradient (grouped by percent cohesion); and (c) average number of channel mouths (grouped by standard deviation). ...........................................................................25
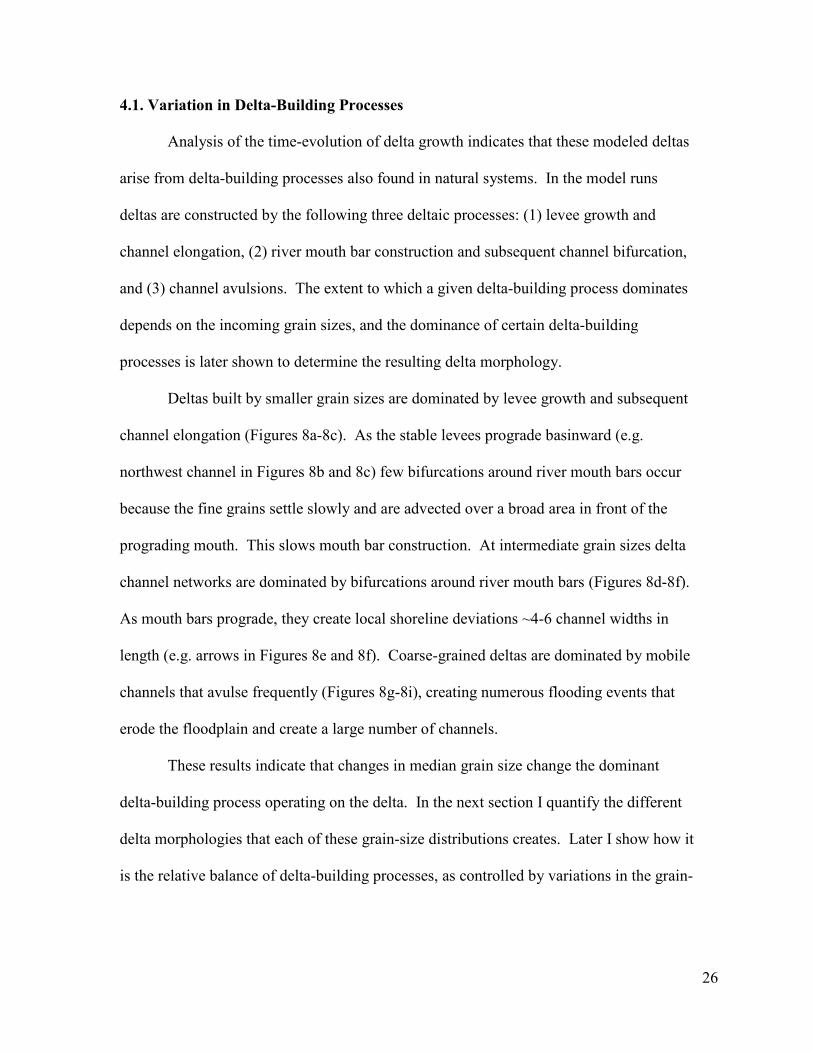
Figure 8. Evolution of fine (a-c), intermediate (d-f), and coarse (g-i) grained deltas. (b-c): brackets highlight northwest channel elongation. (e-f): arrows show shoreline deviations ~4-6 channel widths in length. The x-axis represents relative delta growth, where t is time and T is total time. T is calculated when a predetermined volume of sediment has entered the system. Runs shown here have σ = 1 φ and skewness = 0. .....................................................................27
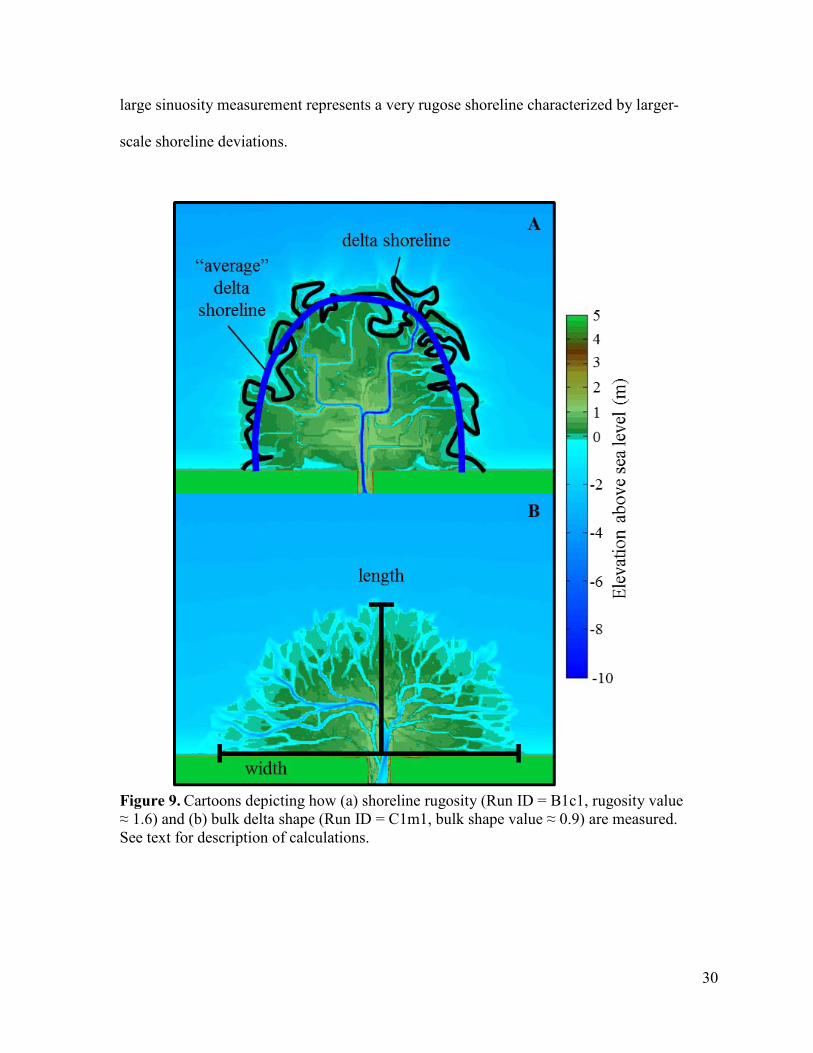
Figure 9. Cartoons depicting how (a) shoreline rugosity (Run ID = B1c1, rugosity value ≈ 1.6) and (b) bulk delta shape (Run ID = C1m1, bulk shape value ≈ 0.9) are measured. See text for description of calculations. .................................30
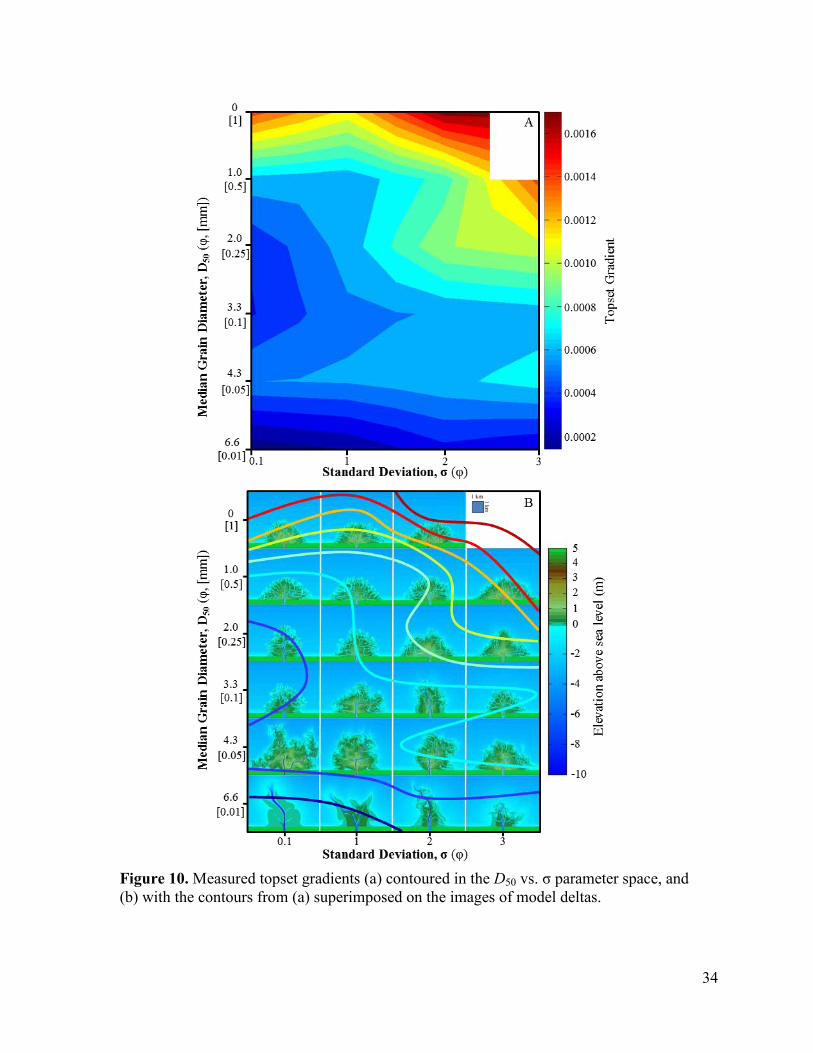
Figure 10. Measured topset gradients (a) contoured in the D50 vs. σ parameter space, and (b) with the contours from (a) superimposed on the images of model deltas. .....................................................................................................................34
iv
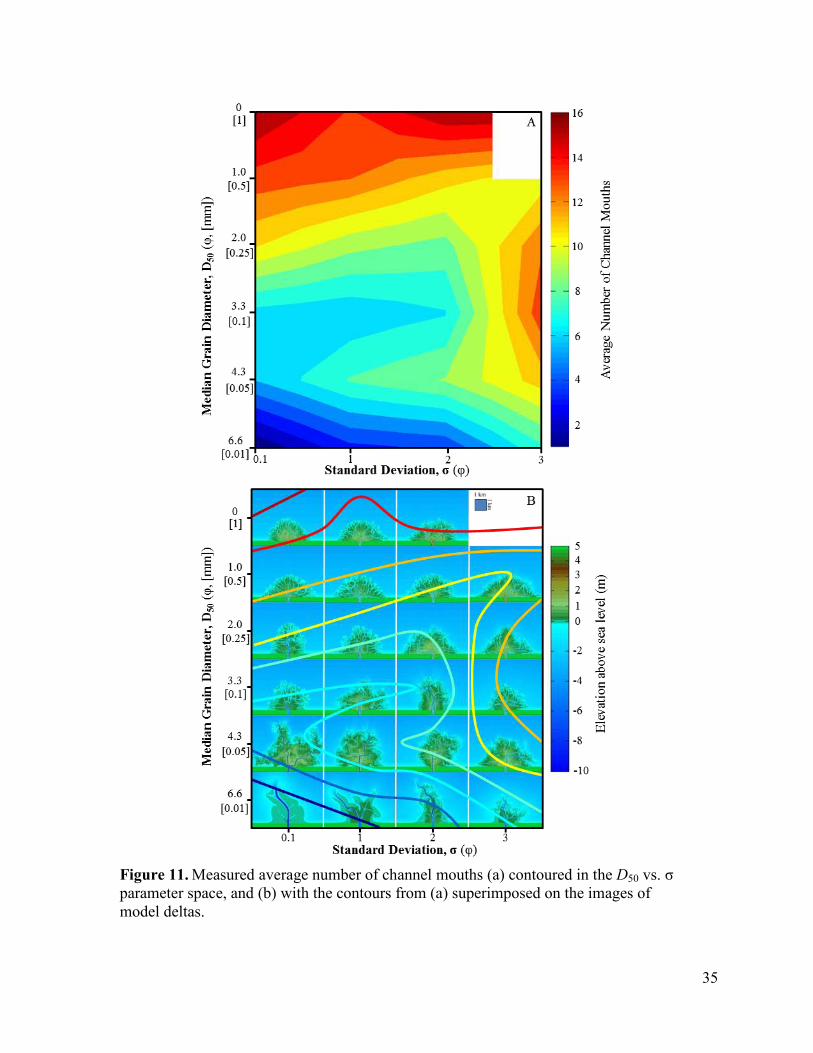
Figure 11. Measured average number of channel mouths (a) contoured in the D50 vs. σ parameter space, and (b) with the contours from (a) superimposed on the images of model deltas...........................................................................................35
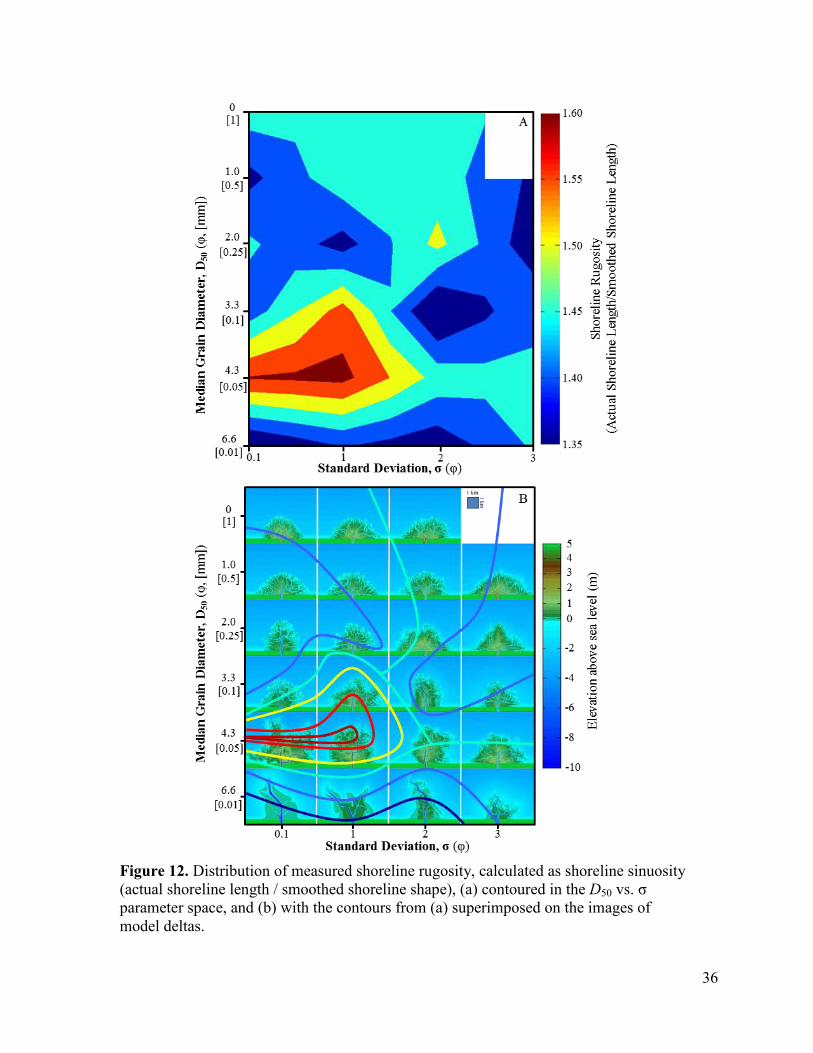
Figure 12. Distribution of measured shoreline rugosity, calculated as shoreline sinuosity (actual shoreline length / smoothed shoreline shape), (a) contoured in the D50 vs. σ parameter space, and (b) with the contours from (a) superimposed on the images of model deltas. .......................................................36
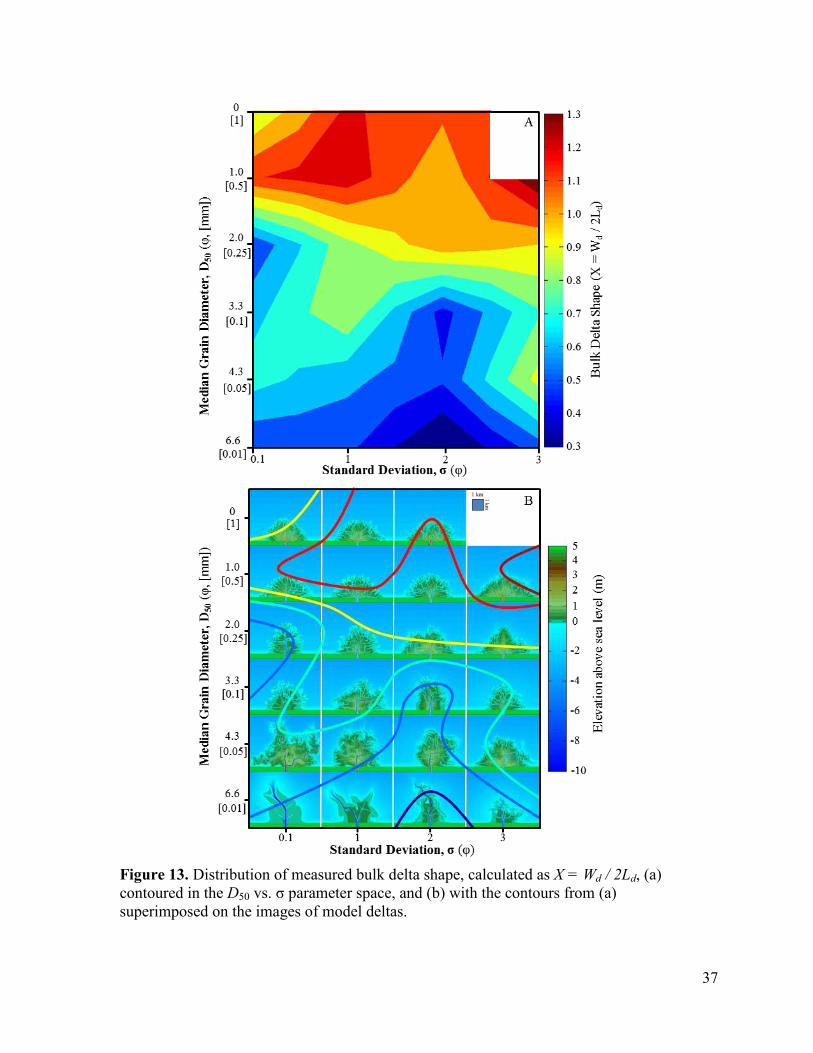
Figure 13. Distribution of measured bulk delta shape, calculated as X = Wd / 2Ld, (a) contoured in the D50 vs. σ parameter space, and (b) with the contours from (a) superimposed on the images of model deltas. .......................................................37
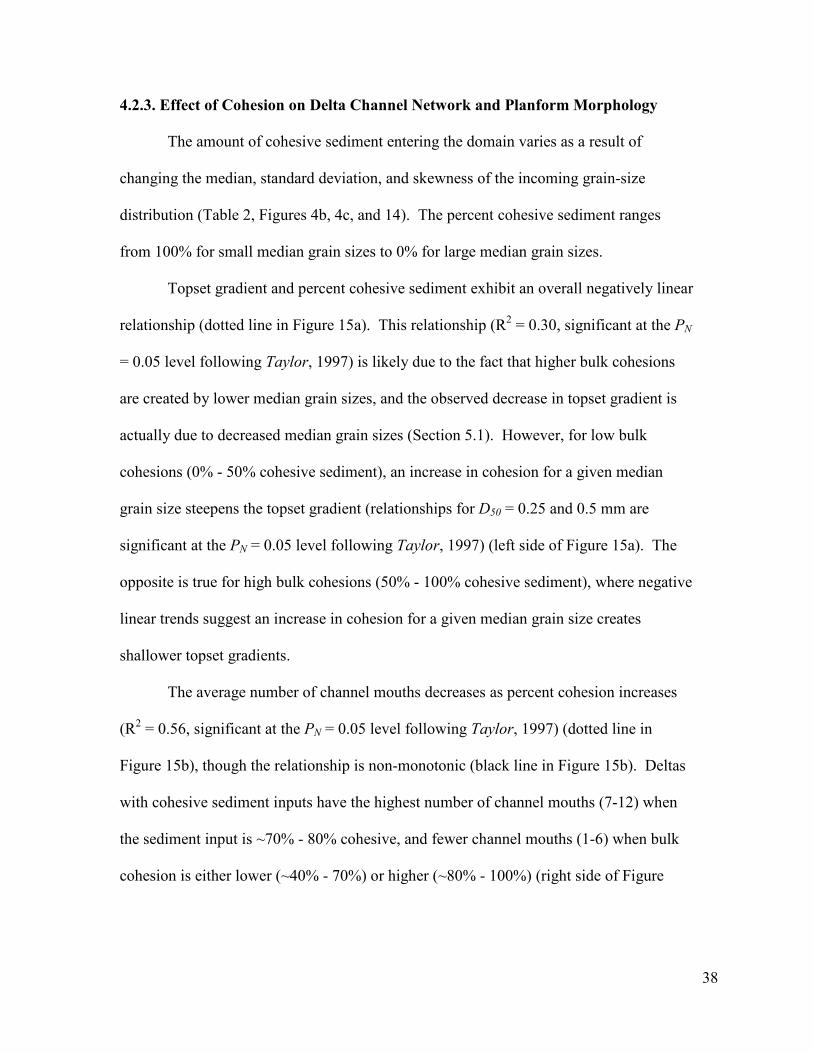
Figure 14. Percent cohesive sediment that makes up the incoming sediment load (a) contoured in the D50 vs. σ parameter space, and (b) with the contours from (a) superimposed on the images of model deltas. .......................................................39
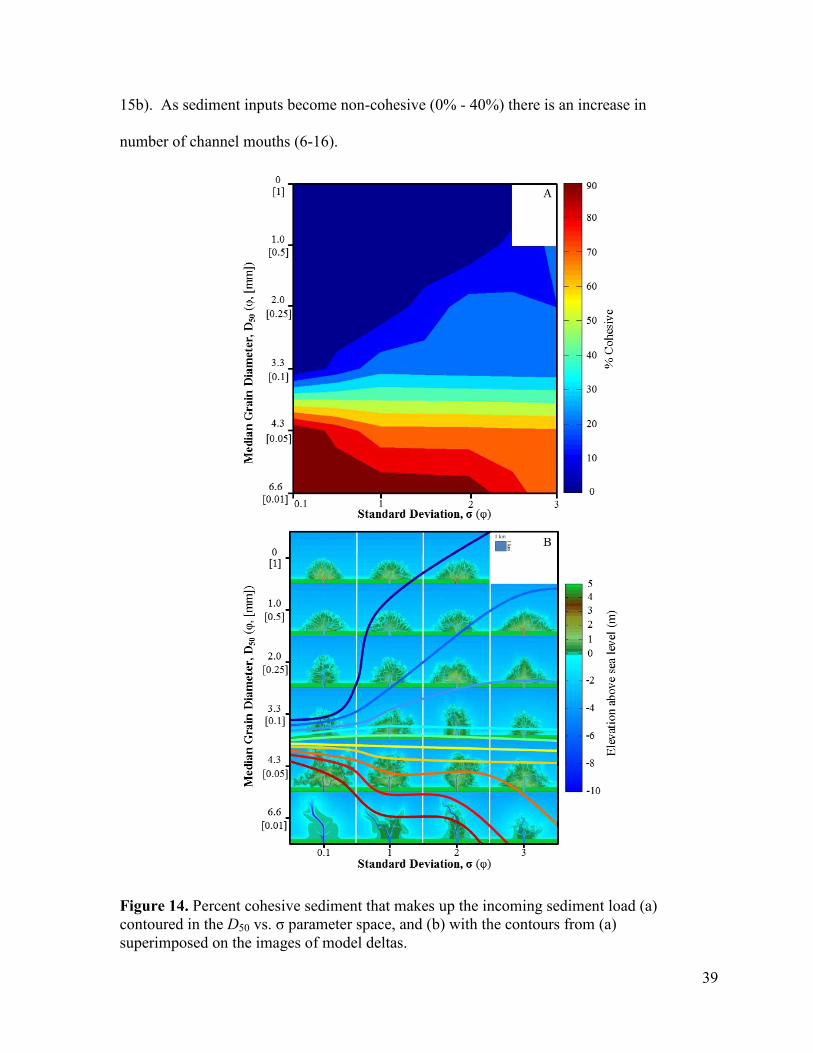
Figure 15. Relationship between percent cohesive sediment and (A) topset gradient, and (B) average number of channel mouths. Colors denote median grain size. ...40
Figure 16. Predicted topset gradients (S in equation 10) vs. measured topset gradients. Black line denotes perfect agreement. ...................................................................42
Figure 17. Measured topset gradient throughout delta growth shows topset gradient reaches a dynamic equilibrium after t/T of ~0.1 for C1h1 and C1o1, and after t/T of ~0.3 for C1a1. Representative examples shown for fine (C1a1, D50 = 0.01 mm), intermediate (C1h1, D50 = 0.25 mm), and coarse (C1o1, D50 = 1 mm) grained deltas. The x-axis represents relative delta growth, where t is time and T is total time. Runs shown here have σ = 2 φ. ......................................43
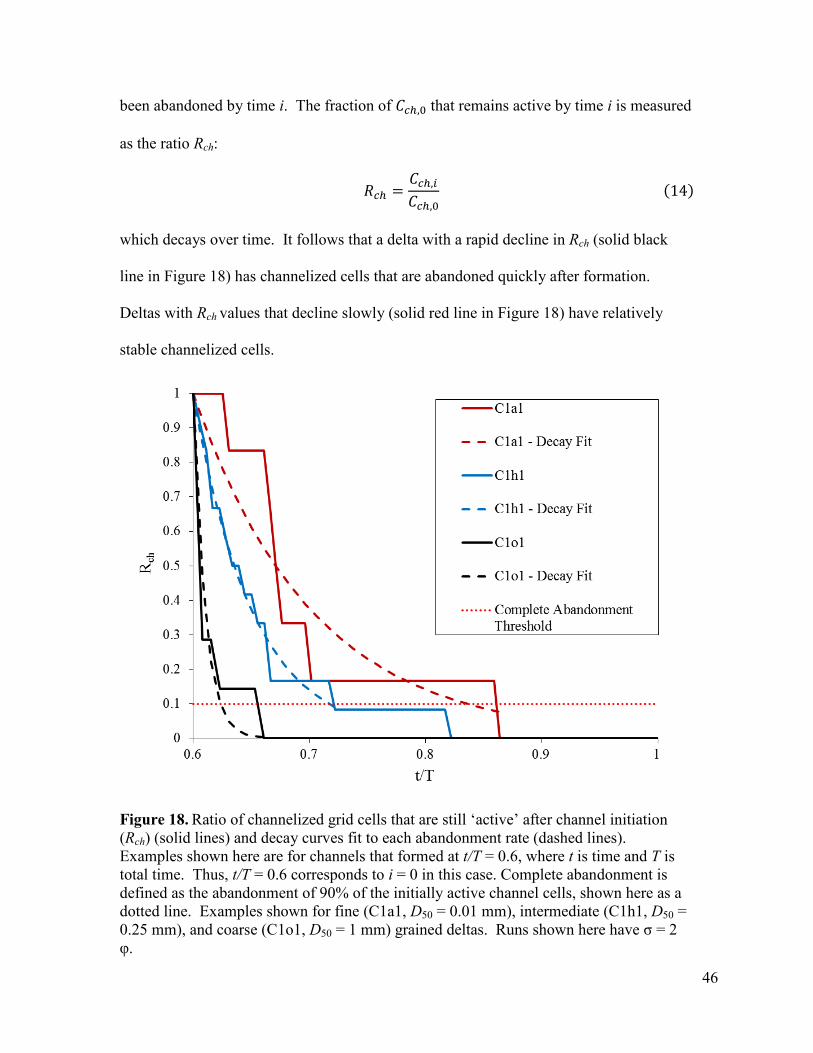
Figure 18. Ratio of channelized grid cells that are still ‘active’ after channel initiation (Rch) (solid lines) and decay curves fit to each abandonment rate (dashed lines). Examples shown here are for channels that formed at t/T = 0.6, where t is time and T is total time. Thus, t/T = 0.6 corresponds to i = 0 in this case. Complete abandonment is defined as the abandonment of 90% of the initially active channel cells, shown here as a dotted line. Examples shown for fine (C1a1, D50 = 0.01 mm), intermediate (C1h1, D50 = 0.25 mm), and coarse (C1o1, D50 = 1 mm) grained deltas. Runs shown here have σ = 2 φ. ...................46
Figure 19. Measured 𝑇𝑐ℎ values and theoretical TA values plotted against median grain size (D50). TA is a theoretical avulsion frequency based on average channel depth and aggradation rates, and 𝑇𝑐ℎ is measured channel-switching frequency. Vertical bars on 𝑇𝑐ℎ represent measured standard deviation. See text for description of calculations. ........................................................................48

v
List of Tables Table 1. Model Parameters ......................................................................................... 14 Table 2. Model Run IDs and Sediment Parameters .................................................... 15 Table 3. Sensitivity Runs Testing User-Defined Model Parameters .......................... 17
1
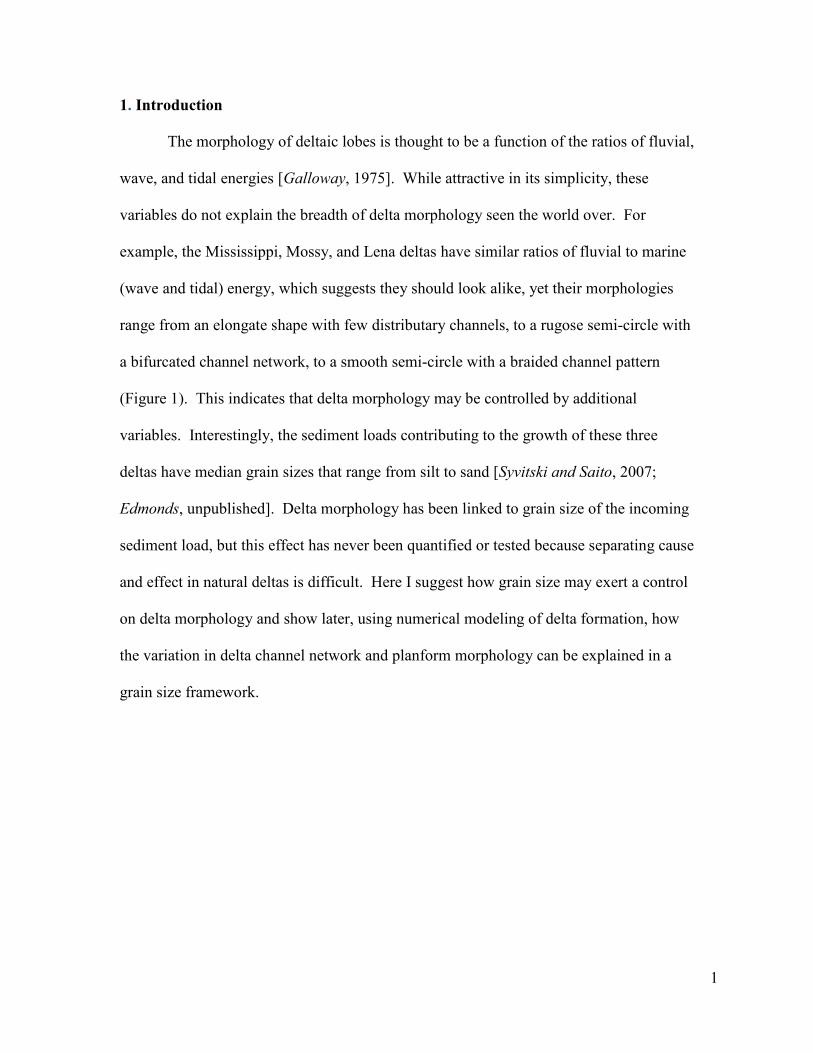
1. Introduction
The morphology of deltaic lobes is thought to be a function of the ratios of fluvial,
wave, and tidal energies [Galloway, 1975]. While attractive in its simplicity, these
variables do not explain the breadth of delta morphology seen the world over. For
example, the Mississippi, Mossy, and Lena deltas have similar ratios of fluvial to marine
(wave and tidal) energy, which suggests they should look alike, yet their morphologies
range from an elongate shape with few distributary channels, to a rugose semi-circle with
a bifurcated channel network, to a smooth semi-circle with a braided channel pattern
(Figure 1). This indicates that delta morphology may be controlled by additional
variables. Interestingly, the sediment loads contributing to the growth of these three
deltas have median grain sizes that range from silt to sand [Syvitski and Saito, 2007;
Edmonds, unpublished]. Delta morphology has been linked to grain size of the incoming
sediment load, but this effect has never been quantified or tested because separating cause
and effect in natural deltas is difficult. Here I suggest how grain size may exert a control
on delta morphology and show later, using numerical modeling of delta formation, how
the variation in delta channel network and planform morphology can be explained in a
grain size framework.
2
Figure 1. Deltas with similar ratios of marine to fluvial energy (Mp:Rp) have different morphologies from (A) elongate to (B) semi-circular to (C) braided. Data from (A and C) Syvitski and Saito [2007] and (B) Edmonds [unpublished].
The idea that grain size controls delta morphology is not new [e.g. McPherson et
al., 1987; Orton and Reading, 1993]; however, the previous research is largely
qualitative. For example, this early work demonstrated that deltas constructed from
larger median grain sizes tend to be semi-circular, whereas fine-grained deltas exhibit
more irregular shapes in planview [McPherson et al., 1987; Orton and Reading, 1993].
But, it is not obvious how these morphologies arise and if or how they are set by grain
size.
The purpose of this study is to provide a process-based understanding of how
grain size influences deltaic processes, and thus morphology. By numerically modeling
delta growth under varying grain-size distributions, I aim to elucidate how grain size
controls delta-building processes and resulting morphology. My results show that as both
median grain size and standard deviation of the grain-size distribution increase, a
morphological transition from elongate deltas with a few channels to semi-circular deltas
3
with many, mobile channels occurs. The change in delta morphology can be
morphodynamically linked to changes in grain size. Results show that grain size can
control the delta topset gradient, which reaches a dynamic equilibrium through time.
Vertical sedimentation rates adjust to maintain topset gradients, which affects channel
avulsion frequency and overbank flow, and ultimately sets the number of channel mouths
along the delta shoreline. The number of channel mouths and advection lengths of
varying grain sizes set the depositional pattern along the shoreline, which translates into
shoreline rugosity and delta shape patterns. A process-based model for effect of grain
size is presented, describing how changes in grain size shift deltas into different process-
based regimes, where a dominant growth process is expressed through the resulting
morphology.
4
2. Background
The factors that influence delta morphology can be grouped into those that
originate upstream or downstream from the delta. Upstream factors control delta
morphology via the fluvial system, such as river discharge [e.g. Hooke and Rohrer, 1979;
Edmonds et al., 2010], feeder system geometry and pattern [e.g. Postma, 1990; Geleynse
et al., 2010], and rates and properties of sediment input [e.g. Postma, 1990; Orton and
Reading, 1993]. Downstream factors control delta morphology via marine processes
such as buoyancy, waves [e.g. Bhattacharya and Giosan, 2003; Jerolmack and Swenson,
2007], tides [e.g. Dalrymple and Choi, 2007], and sea-level variations [Jerolmack, 2009].
Galloway [1975] (bottom right of Figure 2) suggested that the balance between
upstream fluvial energy and downstream wave and tidal energy controls delta
morphology. He claimed that fluvial energy generated by river discharge promotes
basinward channel progradation, resulting in elongate deltas such as the Mississippi.
Downstream marine forces generated by waves and tides work to redistribute sediment
delivered to the delta apex along the adjacent shoreline. Galloway’s classification was
semi-quantitative and only recently have studies started to show how waves and tides
affect delta processes. In general, wave energy creates broad, often asymmetric, smooth
shorelines by setting up along-shore currents that redistribute sediment lateral to the
shoreline and suppress mouth bar formation [Jerolmack and Swenson, 2007; Ashton and
Giosan, 2011; Nardin and Fagherazzi, 2012]. Additionally, wave energy has been
shown to create shoreline perturbations [Ashton and Giosan, 2011] and influence mouth
bar formation patterns [Nardin and Fagherazzi, 2012] due to varying degrees of wave
amplitude and angle to the shoreline. Tides cause the remobilization of sediment,
5
eroding mouth bars and maintaining abandoned distributary channels, which results in
delta morphologies characterized by dendritic channel networks with a large number of
distributaries that widen basinward [Dalrymple and Choi, 2007; Fagherazzi and
Overeem, 2007; Fagherazzi, 2008].
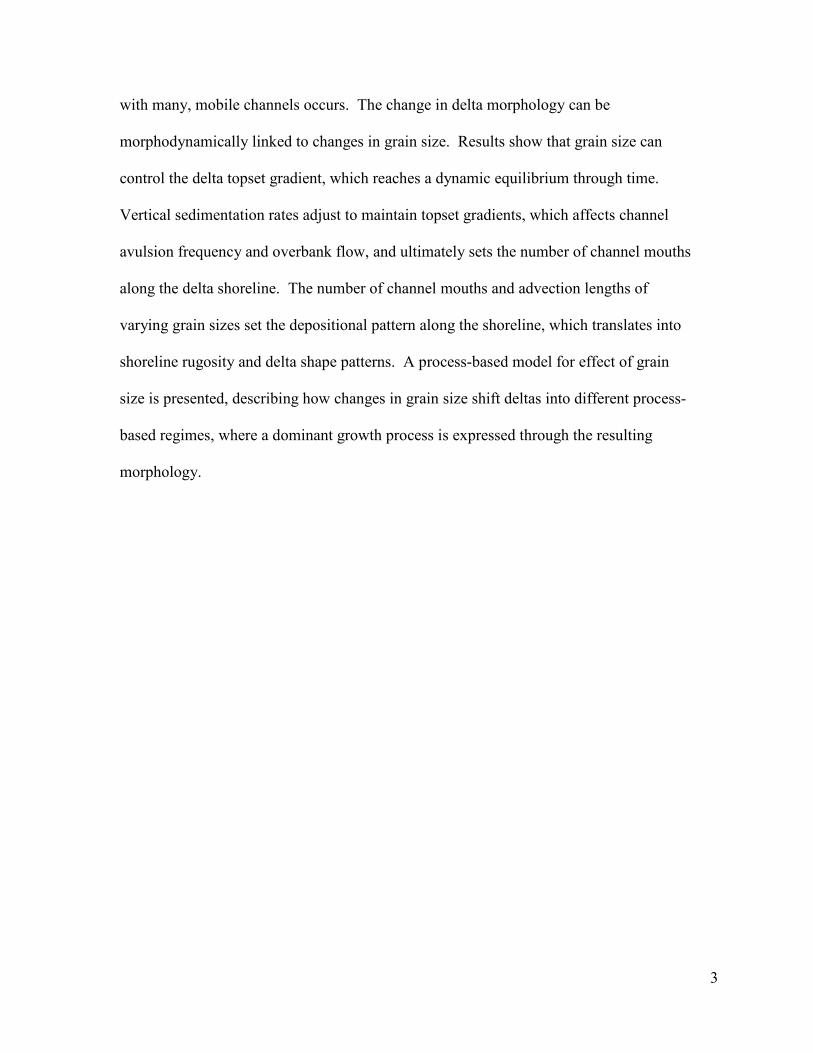
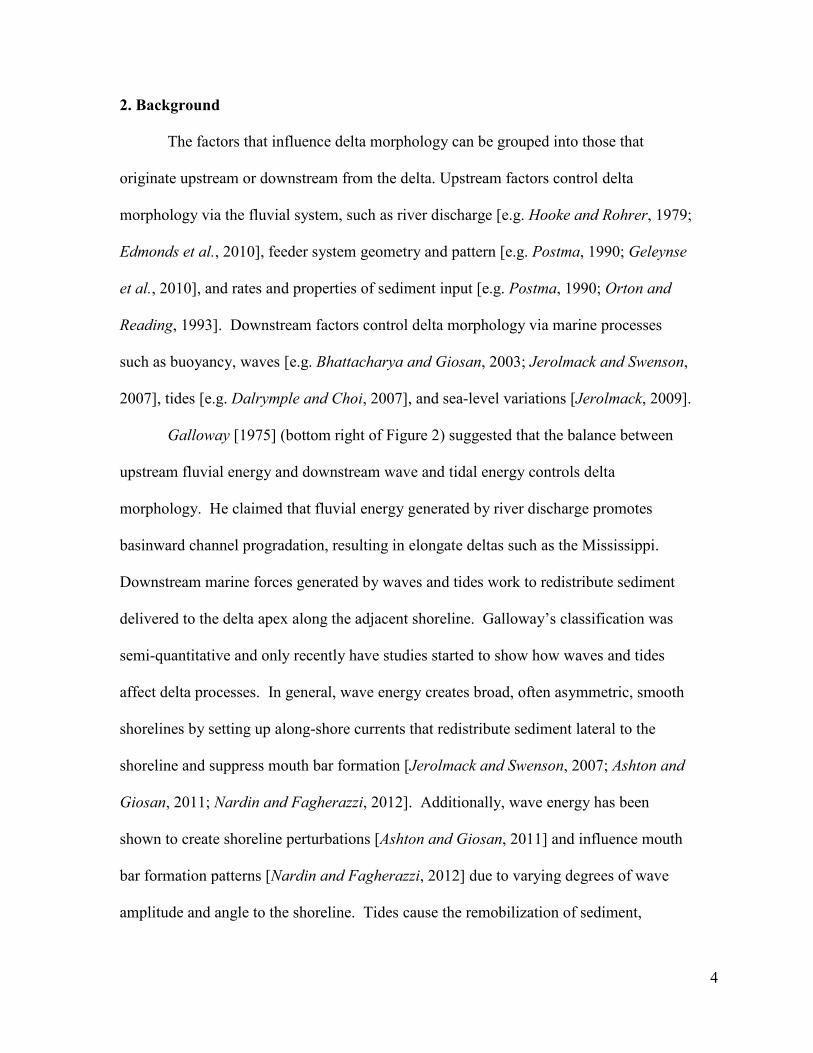
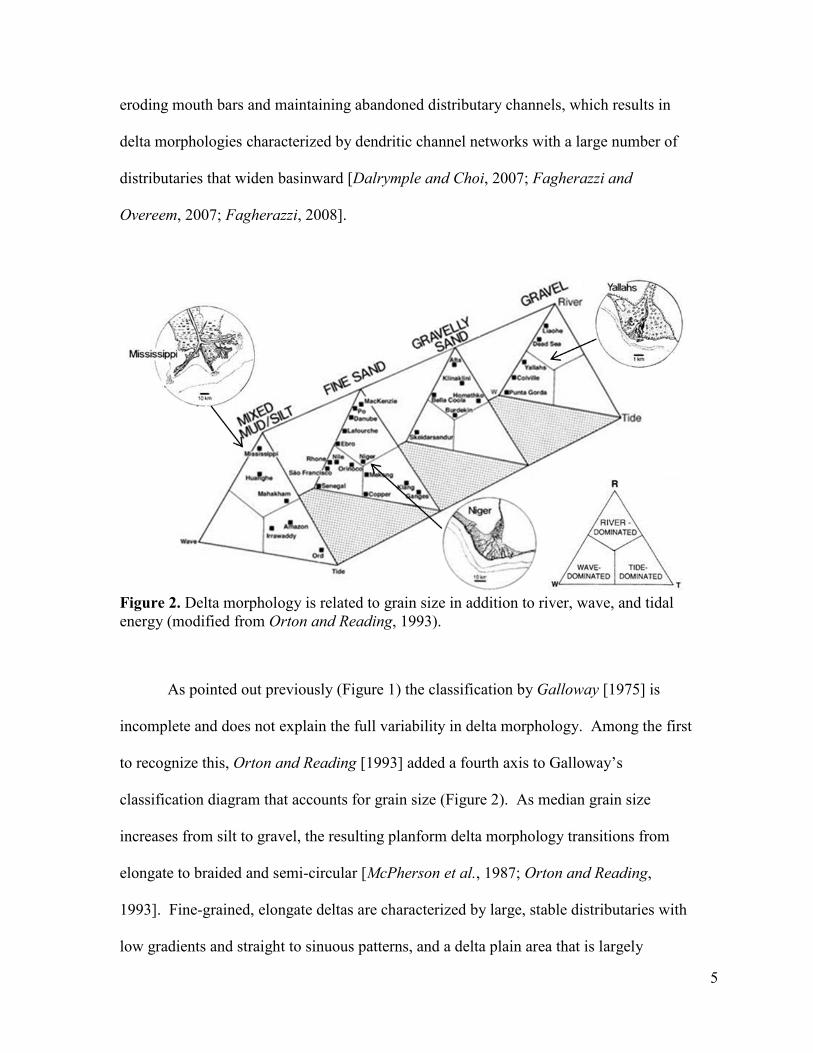
Figure 2. Delta morphology is related to grain size in addition to river, wave, and tidal energy (modified from Orton and Reading, 1993).
As pointed out previously (Figure 1) the classification by Galloway [1975] is
incomplete and does not explain the full variability in delta morphology. Among the first
to recognize this, Orton and Reading [1993] added a fourth axis to Galloway’s
classification diagram that accounts for grain size (Figure 2). As median grain size
increases from silt to gravel, the resulting planform delta morphology transitions from
elongate to braided and semi-circular [McPherson et al., 1987; Orton and Reading,
1993]. Fine-grained, elongate deltas are characterized by large, stable distributaries with
low gradients and straight to sinuous patterns, and a delta plain area that is largely
6
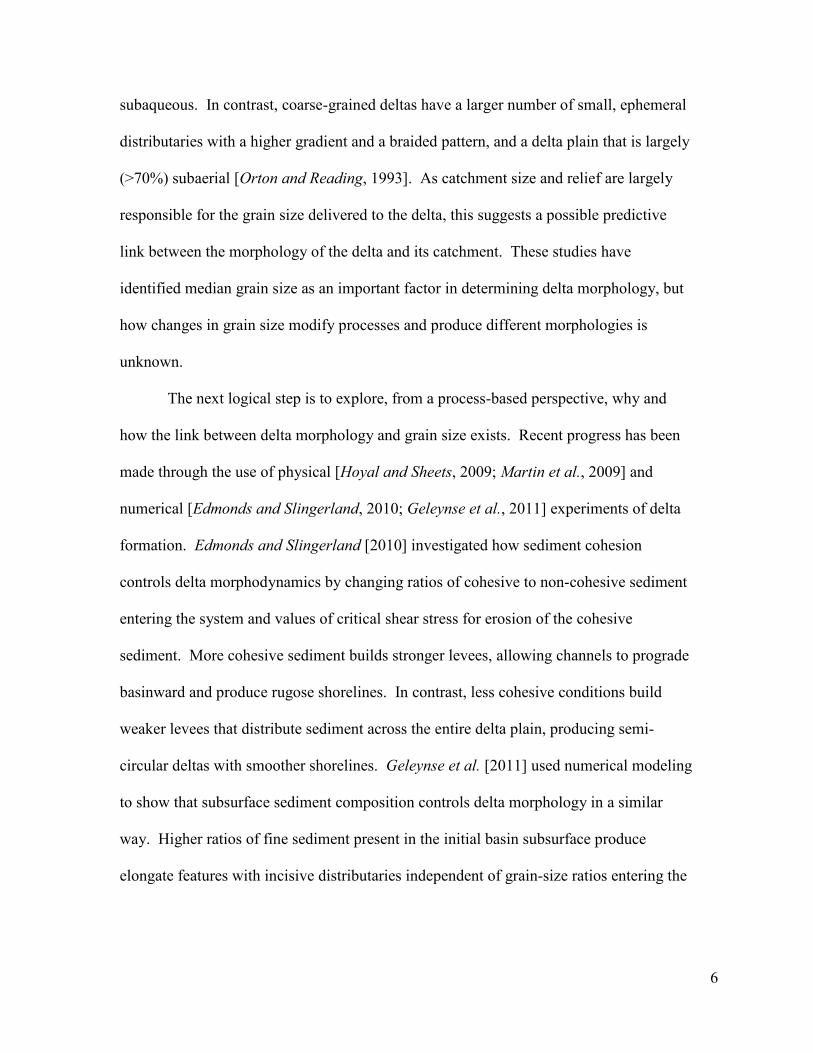
subaqueous. In contrast, coarse-grained deltas have a larger number of small, ephemeral
distributaries with a higher gradient and a braided pattern, and a delta plain that is largely
(>70%) subaerial [Orton and Reading, 1993]. As catchment size and relief are largely
responsible for the grain size delivered to the delta, this suggests a possible predictive
link between the morphology of the delta and its catchment. These studies have
identified median grain size as an important factor in determining delta morphology, but
how changes in grain size modify processes and produce different morphologies is
unknown.
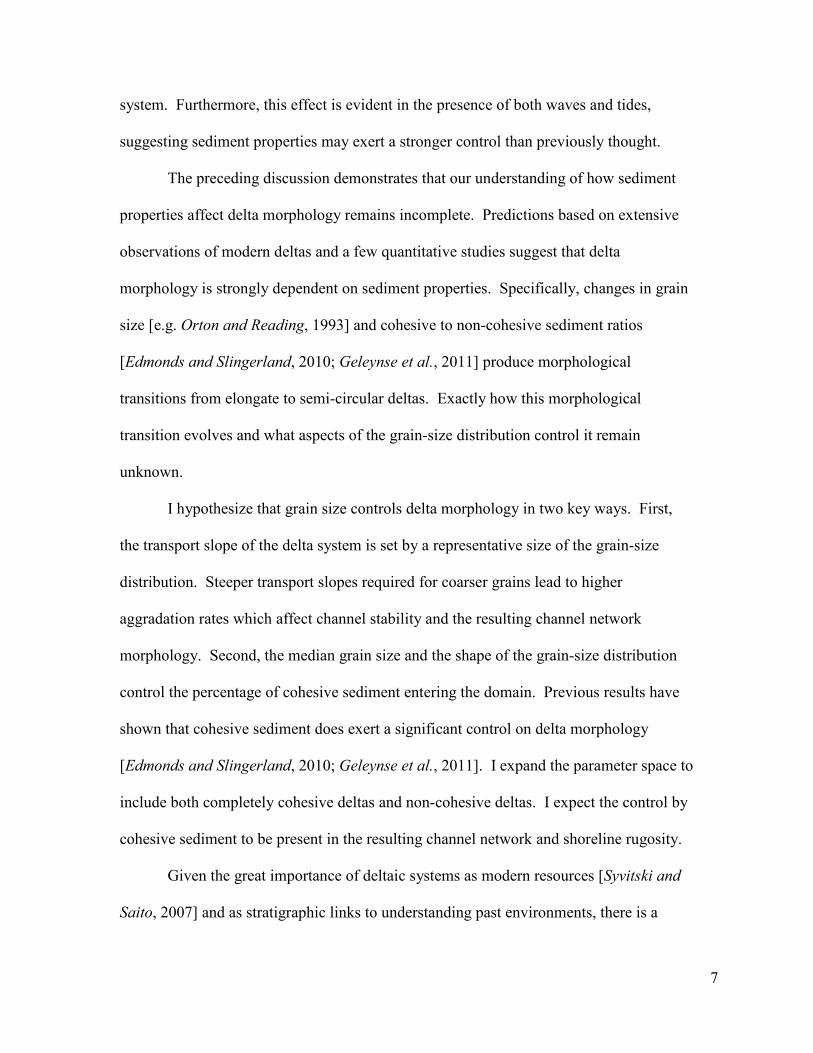
The next logical step is to explore, from a process-based perspective, why and
how the link between delta morphology and grain size exists. Recent progress has been
made through the use of physical [Hoyal and Sheets, 2009; Martin et al., 2009] and
numerical [Edmonds and Slingerland, 2010; Geleynse et al., 2011] experiments of delta
formation. Edmonds and Slingerland [2010] investigated how sediment cohesion
controls delta morphodynamics by changing ratios of cohesive to non-cohesive sediment
entering the system and values of critical shear stress for erosion of the cohesive
sediment. More cohesive sediment builds stronger levees, allowing channels to prograde
basinward and produce rugose shorelines. In contrast, less cohesive conditions build
weaker levees that distribute sediment across the entire delta plain, producing semi-
circular deltas with smoother shorelines. Geleynse et al. [2011] used numerical modeling
to show that subsurface sediment composition controls delta morphology in a similar
way. Higher ratios of fine sediment present in the initial basin subsurface produce
elongate features with incisive distributaries independent of grain-size ratios entering the
7
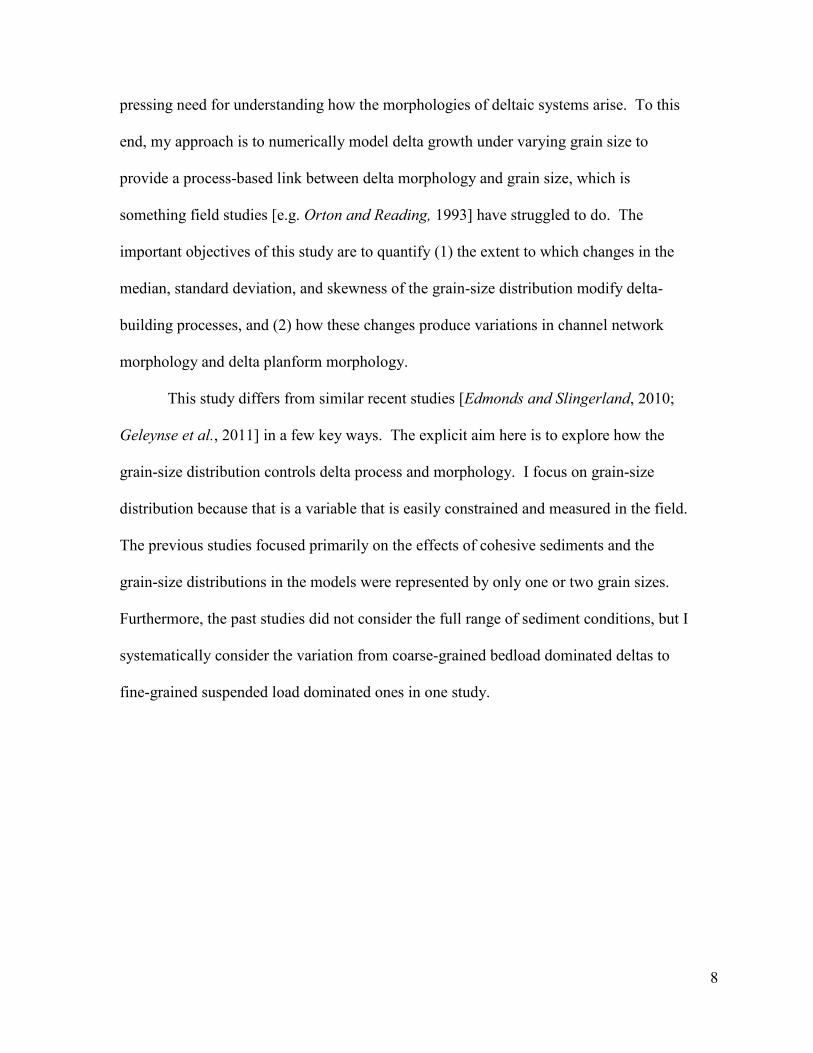
system. Furthermore, this effect is evident in the presence of both waves and tides,
suggesting sediment properties may exert a stronger control than previously thought.
The preceding discussion demonstrates that our understanding of how sediment
properties affect delta morphology remains incomplete. Predictions based on extensive
observations of modern deltas and a few quantitative studies suggest that delta
morphology is strongly dependent on sediment properties. Specifically, changes in grain
size [e.g. Orton and Reading, 1993] and cohesive to non-cohesive sediment ratios
[Edmonds and Slingerland, 2010; Geleynse et al., 2011] produce morphological
transitions from elongate to semi-circular deltas. Exactly how this morphological
transition evolves and what aspects of the grain-size distribution control it remain
unknown.
I hypothesize that grain size controls delta morphology in two key ways. First,
the transport slope of the delta system is set by a representative size of the grain-size
distribution. Steeper transport slopes required for coarser grains lead to higher
aggradation rates which affect channel stability and the resulting channel network
morphology. Second, the median grain size and the shape of the grain-size distribution
control the percentage of cohesive sediment entering the domain. Previous results have
shown that cohesive sediment does exert a significant control on delta morphology
[Edmonds and Slingerland, 2010; Geleynse et al., 2011]. I expand the parameter space to
include both completely cohesive deltas and non-cohesive deltas. I expect the control by
cohesive sediment to be present in the resulting channel network and shoreline rugosity.
Given the great importance of deltaic systems as modern resources [Syvitski and
Saito, 2007] and as stratigraphic links to understanding past environments, there is a
8
pressing need for understanding how the morphologies of deltaic systems arise. To this
end, my approach is to numerically model delta growth under varying grain size to
provide a process-based link between delta morphology and grain size, which is
something field studies [e.g. Orton and Reading, 1993] have struggled to do. The
important objectives of this study are to quantify (1) the extent to which changes in the
median, standard deviation, and skewness of the grain-size distribution modify delta-
building processes, and (2) how these changes produce variations in channel network
morphology and delta planform morphology.
This study differs from similar recent studies [Edmonds and Slingerland, 2010;
Geleynse et al., 2011] in a few key ways. The explicit aim here is to explore how the
grain-size distribution controls delta process and morphology. I focus on grain-size
distribution because that is a variable that is easily constrained and measured in the field.
The previous studies focused primarily on the effects of cohesive sediments and the
grain-size distributions in the models were represented by only one or two grain sizes.
Furthermore, the past studies did not consider the full range of sediment conditions, but I
systematically consider the variation from coarse-grained bedload dominated deltas to
fine-grained suspended load dominated ones in one study.
9
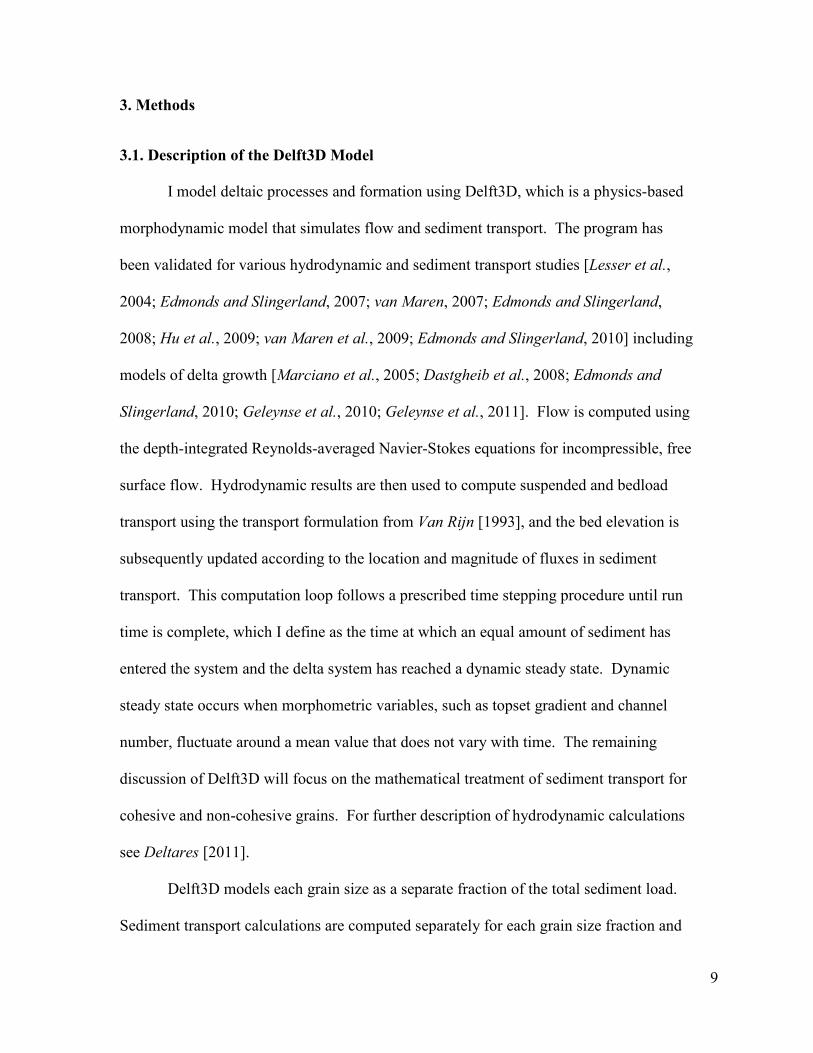
3. Methods
3.1. Description of the Delft3D Model
I model deltaic processes and formation using Delft3D, which is a physics-based
morphodynamic model that simulates flow and sediment transport. The program has
been validated for various hydrodynamic and sediment transport studies [Lesser et al.,
2004; Edmonds and Slingerland, 2007; van Maren, 2007; Edmonds and Slingerland,
2008; Hu et al., 2009; van Maren et al., 2009; Edmonds and Slingerland, 2010] including
models of delta growth [Marciano et al., 2005; Dastgheib et al., 2008; Edmonds and
Slingerland, 2010; Geleynse et al., 2010; Geleynse et al., 2011]. Flow is computed using
the depth-integrated Reynolds-averaged Navier-Stokes equations for incompressible, free
surface flow. Hydrodynamic results are then used to compute suspended and bedload
transport using the transport formulation from Van Rijn [1993], and the bed elevation is
subsequently updated according to the location and magnitude of fluxes in sediment
transport. This computation loop follows a prescribed time stepping procedure until run
time is complete, which I define as the time at which an equal amount of sediment has
entered the system and the delta system has reached a dynamic steady state. Dynamic
steady state occurs when morphometric variables, such as topset gradient and channel
number, fluctuate around a mean value that does not vary with time. The remaining
discussion of Delft3D will focus on the mathematical treatment of sediment transport for
cohesive and non-cohesive grains. For further description of hydrodynamic calculations
see Deltares [2011].
Delft3D models each grain size as a separate fraction of the total sediment load.
Sediment transport calculations are computed separately for each grain size fraction and
10
applied to the total sediment load according to each fraction’s weight percent and
availability in the topmost bed layer. Delft3D records a layered bed stratigraphy that
keeps track of sediment deposition. The topmost bed layer is updated according to local
erosional and depositional fluxes of each grain size fraction, and when a threshold layer
thickness is reached the layer is recorded in the subsurface and a new one started. Only
sediments in the topmost layer are available for erosion.
Cohesive and non-cohesive sediment transport, erosion, and deposition are
handled separately in Delft3D. Any sediment fraction ≤ 64 μm in diameter is considered
cohesive sediment in the model, whereas those > 64 μm in diameter are non-cohesive.
Cohesive sediment is only transported in suspension, whereas non-cohesive sediment is
transported as both suspended load and bedload.
Transport of cohesive and non-cohesive suspended sediment is computed by
solving the depth-averaged version of the 3D advection-diffusion equation:
𝜕𝑐𝑖
𝜕𝑡+𝜕𝑢𝑐𝑖
𝜕𝑥+𝜕𝑣𝑐𝑖
𝜕𝑦+𝜕�𝑤 − 𝑤𝑠𝑖�𝑐𝑖
𝜕𝑧
=𝜕𝜕𝑥
�𝜀𝑖𝑠,𝑥𝜕𝑐𝑖
𝜕𝑥� +
𝜕𝜕𝑦
�𝜀𝑖𝑠,𝑦𝜕𝑐𝑖
𝜕𝑦� +
𝜕𝜕𝑧�𝜀𝑖𝑠,𝑧
𝜕𝑐𝑖
𝜕𝑧� (1)
where 𝑐𝑖 is the mass concentration of the ith sediment fraction (kg/m3) assuming a
standard Rouse profile concentration gradient, u, v, and w are the x-, y-, and z-directed
fluid velocities (m/s), 𝑤𝑠𝑖 is the settling velocity of the ith sediment fraction (m/s), and
𝜀𝑖𝑠,𝑥, 𝜀𝑖𝑠,𝑦, and 𝜀𝑖𝑠,𝑧 are directional eddy diffusivities of the ith sediment fraction (m2/s).
Settling velocities of cohesive sediment fractions are set according to Stokes’ law, and
the effects of cohesive sediment flocculation are ignored. Non-cohesive sediment settling
11
velocities are calculated according to Van Rijn [1993] depending on the user-defined
grain diameter, such that:
𝑤𝑠𝑖 =
⎩⎪⎪⎪⎨
⎪⎪⎪⎧ (𝑠 − 1)𝑔𝐷50𝑖
2
18𝜈, 65 𝜇m < 𝐷50𝑖 < 100 𝜇m
10𝜈𝐷50𝑖
��1 +0.01(𝑠 − 1)𝑔𝐷50𝑖
3
𝜈2− 1� , 100 𝜇m < 𝐷50𝑖 < 1000 𝜇m
1.1�(𝑠 − 1)𝑔𝐷50𝑖, 1000 𝜇m < 𝐷50𝑖
(2)
where s is the relative density (𝜌𝑠/𝜌𝑤), 𝜌𝑠 is the specific density of sediment (kg/m3), 𝜌𝑤
is the specific density of water (kg/m3), g is acceleration due to gravity (9.8 m/s2), 𝐷50𝑖 is
the median grain diameter of the ith grain size fraction (m), and ν is the kinematic
viscosity coefficient of water (m2/s).
The transport of non-cohesive bedload is calculated by the method described by
Van Rijn [1993]:
𝑆𝑏 = 0.006𝜌𝑠𝑤𝑠𝑖𝐷50𝑖 �𝑢(𝑢 − 𝑢𝑐𝑟)1.4
�(𝑠 − 1)𝑔𝐷50𝑖�1.2� (3)
where u is depth-averaged velocity (m/s), and 𝑢𝑐𝑟 is the critical depth-averaged velocity
(m/s) for initiation of motion based on a parameterization of the Shields curve. The
direction of bedload transport is determined by local flow conditions and is adjusted for
bed-slope effects [Bagnold, 1966; Ikeda, 1982]. While suspended load transport entering
the upstream open boundary is prescribed by the user, the bedload transport is determined
by local hydrodynamic conditions. Thus, time-averaged bedload sediment fluxes vary
minimally between simulations.
12
Erosion and deposition of cohesive sediment is calculated according to the
Partheniades-Krone formulations [Partheniades, 1965], which require a user-defined
critical shear stress for erosion (𝜏ce(C)) and deposition (𝜏cd(C)). Exchange of non-
cohesive suspended sediment with the bed is calculated as an erosive flux due to upward
diffusion and depositional flux due to sediment settling. These fluxes are then applied as
source and sink terms and the bed level is updated accordingly.
3.2. Model Setup
The experimental setup is based on the runs in Edmonds and Slingerland [2010].
An initial grid of 300 x 225 computation cells, each 25 x 25 m, creates a 7500 x 5625 m
basin with a bed slope of 0.000375 to the north (Figure 3). Open boundaries of constant
water surface elevation at 0 m border the north, east, and west boundaries of the grid
(thick black lines in Figure 3), and there is an absence of waves, tides, and buoyancy
forces within the basin. In the subsurface there is initially 10 m of erodible sediment that
is homogeneously mixed and in the same proportions to the incoming grain-size
distribution for each respective run. An initial bed roughness with amplitudes of a few
centimeters is imposed on the basin floor, and a spatially constant Chézy value (C) of 45
is used for hydrodynamic roughness, calculated as C = (8g/f)1/2 where g is acceleration
due to gravity and f is the Darcy-Weisbach friction factor. Flow enters from the south
through an initial channel 250 m wide and 2.5 m deep. The channel is 500 m long and is
cut through an erodible beach 5.5 m in elevation above water level. The high elevation
does not allow any water flow over the initial beach, thereby confining all water to the
channel. The channel is allowed to change width and depth in response to different
conditions. I specify a temporally constant water discharge of Q = 1000 m3/s to enter the
13
basin and to carry an equilibrium concentration of non-cohesive bedload and user-defined
concentrations of cohesive sediment and non-cohesive suspended load. Each model is
run for 16.5 days using a morphological bed updating factor of 175, resulting in ~8 years
of morphological evolution in the model. This effectively models 8 years of bankfull
flow conditions, and if flood intermittency (e.g., say a river is in bankfull condition on
average 10 days a year) is accounted for, these results represent ~292 years of change in
delta morphology. A sub-grid horizontal large eddy simulation calculates horizontal
eddy viscosity and diffusivity, which are added to the constant background values set to
0.0001 m2/s. Refer to (Table 1) for a list of all user-defined model parameters used in
this study.
Figure 3. Numerical model setup in planview. Modeling domain consists of grid cells that are 25 x 25 meters. Colors represent initial bathymetry. Black arrow indicates direction of incoming flow. Thick black border lines indicate open boundaries of constant water surface elevation at 0 m.
14
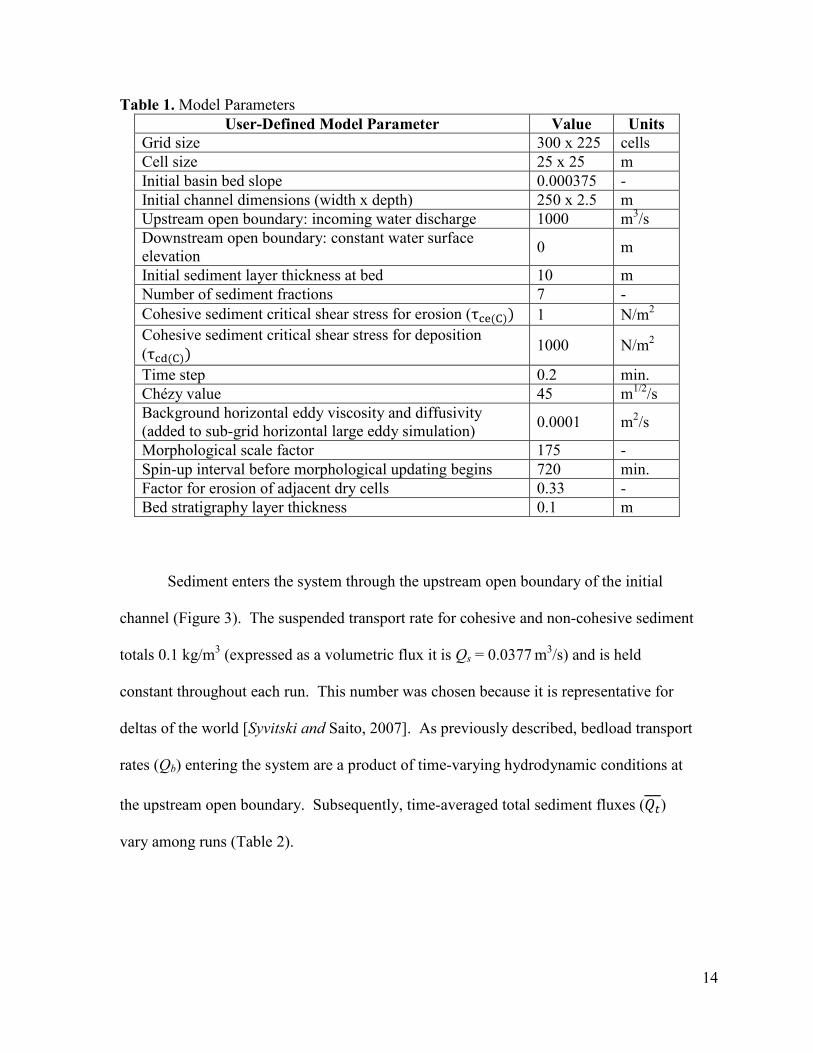
Table 1. Model Parameters User-Defined Model Parameter Value Units
Grid size 300 x 225 cells Cell size 25 x 25 m Initial basin bed slope 0.000375 - Initial channel dimensions (width x depth) 250 x 2.5 m Upstream open boundary: incoming water discharge 1000 m3/s
Downstream open boundary: constant water surface elevation 0 m
Initial sediment layer thickness at bed 10 m Number of sediment fractions 7 - Cohesive sediment critical shear stress for erosion (τce(C)) 1 N/m2 Cohesive sediment critical shear stress for deposition (τcd(C)) 1000 N/m2
Time step 0.2 min. Chézy value 45 m1/2/s Background horizontal eddy viscosity and diffusivity (added to sub-grid horizontal large eddy simulation) 0.0001 m2/s
Morphological scale factor 175 - Spin-up interval before morphological updating begins 720 min. Factor for erosion of adjacent dry cells 0.33 - Bed stratigraphy layer thickness 0.1 m
Sediment enters the system through the upstream open boundary of the initial
channel (Figure 3). The suspended transport rate for cohesive and non-cohesive sediment
totals 0.1 kg/m3 (expressed as a volumetric flux it is Qs = 0.0377 m3/s) and is held
constant throughout each run. This number was chosen because it is representative for
deltas of the world [Syvitski and Saito, 2007]. As previously described, bedload transport
rates (Qb) entering the system are a product of time-varying hydrodynamic conditions at
the upstream open boundary. Subsequently, time-averaged total sediment fluxes (𝑄𝑡)
vary among runs (Table 2).
15
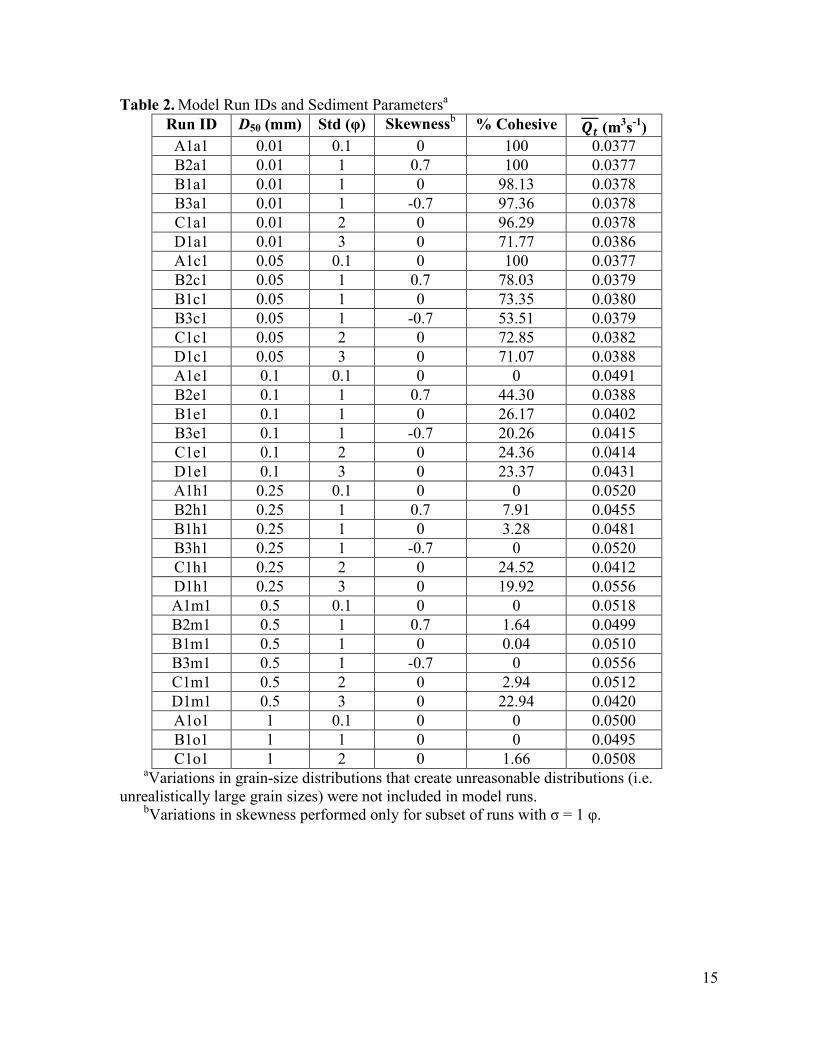
Table 2. Model Run IDs and Sediment Parametersa
aVariations in grain-size distributions that create unreasonable distributions (i.e. unrealistically large grain sizes) were not included in model runs.
bVariations in skewness performed only for subset of runs with σ = 1 φ.
Run ID D50 (mm) Std (φ) Skewnessb % Cohesive 𝑸𝒕 (m3s-1) A1a1 0.01 0.1 0 100 0.0377 B2a1 0.01 1 0.7 100 0.0377 B1a1 0.01 1 0 98.13 0.0378 B3a1 0.01 1 -0.7 97.36 0.0378 C1a1 0.01 2 0 96.29 0.0378 D1a1 0.01 3 0 71.77 0.0386 A1c1 0.05 0.1 0 100 0.0377 B2c1 0.05 1 0.7 78.03 0.0379 B1c1 0.05 1 0 73.35 0.0380 B3c1 0.05 1 -0.7 53.51 0.0379 C1c1 0.05 2 0 72.85 0.0382 D1c1 0.05 3 0 71.07 0.0388 A1e1 0.1 0.1 0 0 0.0491 B2e1 0.1 1 0.7 44.30 0.0388 B1e1 0.1 1 0 26.17 0.0402 B3e1 0.1 1 -0.7 20.26 0.0415 C1e1 0.1 2 0 24.36 0.0414 D1e1 0.1 3 0 23.37 0.0431 A1h1 0.25 0.1 0 0 0.0520 B2h1 0.25 1 0.7 7.91 0.0455 B1h1 0.25 1 0 3.28 0.0481 B3h1 0.25 1 -0.7 0 0.0520 C1h1 0.25 2 0 24.52 0.0412 D1h1 0.25 3 0 19.92 0.0556 A1m1 0.5 0.1 0 0 0.0518 B2m1 0.5 1 0.7 1.64 0.0499 B1m1 0.5 1 0 0.04 0.0510 B3m1 0.5 1 -0.7 0 0.0556 C1m1 0.5 2 0 2.94 0.0512 D1m1 0.5 3 0 22.94 0.0420 A1o1 1 0.1 0 0 0.0500 B1o1 1 1 0 0 0.0495 C1o1 1 2 0 1.66 0.0508
16
For each model run the incoming sediment flux consists of seven different grain
sizes, represented as sediment fractions. A sediment fraction is a user-controlled
parameter used to discretize the theoretically continuous grain-size distribution (Figure
4a). Each sediment fraction is assigned a grain size diameter and frequency, or
representative fraction of the total incoming sediment flux. It follows that using more
sediment fractions creates a more highly resolved grain-size distribution. Sensitivity tests
varying the number of sediment fractions showed that a grain-size distribution discretized
by seven sediment fractions results in the same overall delta shape, shoreline
characteristics, and channel network as a higher resolution grain-size distribution of 14
fractions.
Delft3D requires the user to define values for critical shear stress for erosion
(𝜏ce(C)) and deposition (𝜏cd(C)) of the cohesive sediment fractions. I set 𝜏ce(C) = 1 N/m2,
which represents a mud of intermediate cohesion [Black et al., 2002]. There is
considerable debate concerning the value of 𝜏cd(C) in natural sediments [Black et al.,
2002]. By setting 𝜏cd(C) = 1000 N/m2 mud is continuously deposited, and the flow field
adjusts until the erosional flux and depositional flux are equal. This avoids the issue of
mutually exclusive erosion and deposition of cohesive sediment, which occurs when
𝜏cd(C)< 𝜏ce(C). I avoid mutually exclusive erosion and deposition in the current runs
because if 𝜏cd(C)< 𝜏ce(C) then cells would erode until the shear stress is less than
𝜏ce(C), which would result in an equilibrium form highly dependent on the chosen 𝜏ce(C)
value. Additionally, the effects of flocculation on cohesive sediment settling velocity are
ignored.
17
I conducted a suite of test runs to assess the sensitivity of the results to user-
defined model parameters (Table 3). Changing these parameters indeed created different
deltas, but the deltas were only different in the details. There was little variation in delta
shape, shoreline characteristics, and number of channels, which are the morphometric
parameters of interest for this study.
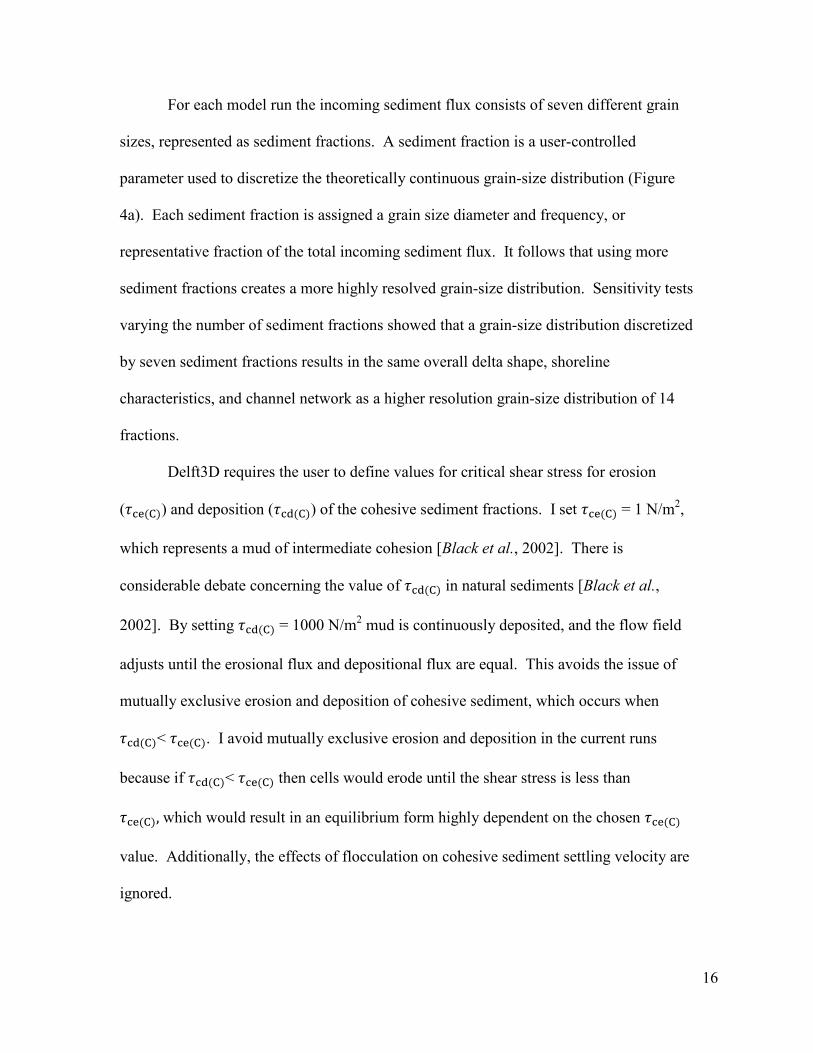
Table 3. Sensitivity Runs Testing User-Defined Model Parametersa User-Defined
Model Parameter Values Tested [D50(mm)/Std (φ)]
Grid resolutionb 25 x 25 meters, 10 x 10 meters
[0.1/1], [1/0.1]
Number of sediment fractions
1, 3, 5, 7, 14 [0.05/1]
Time step 0.05, 0.1, 0.2, 1 (min.) [0.1/1] Morphological Scale Factor
50, 100, 175, 300 [0.1/1]
Bedload transport formulationb
van Rijn [1993], Meyer-Peter-Muller [1948],
Engelund-Hansen [1967]
[0.01/1], [0.5/1]
Roughness formulationb
Chézy, Manning, White-Colebrook
[0.05/3], [0.1/1]
aTested user-defined model parameters are varied while all other run variables are held constant. Median and standard deviation are shown in brackets: [D50/Std]. For all runs skewness = 0.
bSelect model parameters are tested using two grain-size distributions.
18
3.3. Parameter Space
The parameter space explored in this study is defined by changes in the grain-size
distribution of the sediment load entering the delta apex. I vary four aspects of the grain-
size distribution (Table 2 and Figures 4b and 4c): (1) median grain size: the simplest
value representing the caliber of the sediment load, (2) standard deviation: a value
characterizing the sorting of the sediment load, (3) skewness: a value that determines
whether the bulk of the sediment is larger or smaller in size than the mean grain diameter,
(4) percent cohesive sediment: determines the bulk amount of cohesion within the
system.
19
Figure 4. Example grain-size distributions showing (A) discretization of a continuous grain-size distribution into seven sediment fractions represented as a histogram (example shown for D50 = 0.1 mm, σ = 2 φ), (B) the ranges in median grain sizes (examples shown for σ = 1 φ), and (C) the ranges in standard deviations (examples shown for D50 = 0.1 mm). The location of Delft3D’s cohesive grain size threshold is included for reference within phi space.
20
In this study I assume a unimodal, log-normal grain-size distribution (normal in
phi space) for simplicity, although there is debate as to whether a bimodal or log-
hyperbolic distribution is more common in natural river systems [e.g. Hajek et al., 2010].
I start with a unimodal distribution because it is characterized by fewer parameters (i.e.
one median, standard deviation, and skewness). This makes constraining cause and
effect between the input grain-size distribution parameters and the output delta
morphology metrics more straightforward than it would be if a multimodal distribution
was used. In this study median grain size (D50) is varied from 0.01 mm (silt) to 1 mm
(coarse sand), which is consistent with global deltaic systems [Orton and Reading, 1993;
Syvitski and Saito, 2007]. Standard deviation (σ) is calculated by the following formula
[Folk, 1974]:
𝜎 = ��𝑓𝑖(𝐷𝑖 − 𝐷50)2 (4)
where fi is the weight percent of each ith sediment fraction and 𝐷𝑖 is the size of each ith
sediment fraction. Standard deviation of the distribution is varied (presented here with
units of phi) from 0.1 (well sorted) to 3 (poorly sorted). Skewness (Sk) is calculated as
[Folk, 1974]:
𝑆𝑘 =∑𝑓𝑖(𝐷𝑖 − 𝐷50)3
100𝜎3 (5)
and is varied from -0.7 to 0.7 which encompasses varying degrees of fine and coarse
skewed distributions as well as a normal Gaussian distribution (skewness = 0). For
example, a positively skewed distribution (by phi value) corresponds to a “tail” that lies
to the right of the distribution’s mean, or the finer grain size end. It follows that a
positively skewed distribution will be composed of a higher volume of sediment below
21
the cohesive grain size threshold, and thus represents a more cohesive sediment input.
Similarly, a negatively skewed distribution represents a sediment input characterized by a
higher volume of larger grain sizes, and thus a less cohesive sediment load.
The variations in grain-size distribution parameters determine the fraction of
sediment below the 64 µm threshold for cohesive sediment in Delft3D (Figures 4b and
4c), resulting in different ratios of cohesive:non-cohesive sediment contributing to delta
growth. These ratios are represented as a percentage of the total volume of sediment that
is defined as cohesive (% cohesive) and range from 0% to 100% (Table 2), thus
representing a full range in bulk sediment cohesion within the system. Although
additional variables affect bulk sediment cohesion within natural systems (e.g.
vegetation), I only consider the effect due to the mud:sand ratio.
The dependency of the cohesive:non-cohesive sediment ratio variations on the
median, standard deviation, and skewness of the grain-size distribution makes it difficult
to determine which of the four aspects exerts the strongest control on delta morphology.
Despite this complication, it creates a suite of more realistic sediment loads capturing
natural variations in grain sizes [Orton and Reading, 1993; Syvitski and Saito, 2007] and
a full range of bulk cohesion.
22
4. Results
I conducted 33 runs of delta growth, each with a different grain-size distribution
(Table 2, Figures 5 and 6). Deltas are compared at equivalent morphological times,
defined as the time when the same volume of sediment has entered the system.
The key result of the 33 runs is that deltas undergo a morphological transition as
the median of the grain-size distribution increases (Figures 5 and 7). At relatively small
median grain size values deltas have elongate planform morphologies with shallow topset
gradients and few distributary channels. On the other hand, deltas built by larger grain
sizes exhibit semi-circular shapes with smooth shorelines, steep gradients, and many
active channels.
In this section I explore this morphological transition by (1) describing how grain
sizes change the dominant delta-building process, and (2) measuring four morphometric
parameters (topset gradient, number of channel mouths at the delta shoreline, shoreline
rugosity, and bulk delta shape) designed to quantify this morphological transition.
23
Figure 5. Delft3D model results that show different delta morphologies created from different grain-size distributions. Deltas are pictured when the same volume of sediment has entered the system. Median grain diameters (y-axis) are expressed in phi values with size in mm shown in brackets. Standard deviations are expressed in phi values. Note that both x- and y-axis intervals vary. For all runs skewness = 0.
24
Figure 6. Model deltas under varying skewness of the grain-size distribution (x-axis) and median grain size (y-axis). The deltas in the middle column (skewness = 0) are the same results presented in Figure 5. Little to no morphological variation exists along the x-axis. Note that the y-axis intervals vary. For all runs σ = 1 φ.
25
Figure 7. Relationship between median grain size and key morphometric parameters: (a) topset gradient (grouped by standard deviation); (b) topset gradient (grouped by percent cohesion); and (c) average number of channel mouths (grouped by standard deviation).
26
4.1. Variation in Delta-Building Processes
Analysis of the time-evolution of delta growth indicates that these modeled deltas
arise from delta-building processes also found in natural systems. In the model runs
deltas are constructed by the following three deltaic processes: (1) levee growth and
channel elongation, (2) river mouth bar construction and subsequent channel bifurcation,
and (3) channel avulsions. The extent to which a given delta-building process dominates
depends on the incoming grain sizes, and the dominance of certain delta-building
processes is later shown to determine the resulting delta morphology.
Deltas built by smaller grain sizes are dominated by levee growth and subsequent
channel elongation (Figures 8a-8c). As the stable levees prograde basinward (e.g.
northwest channel in Figures 8b and 8c) few bifurcations around river mouth bars occur
because the fine grains settle slowly and are advected over a broad area in front of the
prograding mouth. This slows mouth bar construction. At intermediate grain sizes delta
channel networks are dominated by bifurcations around river mouth bars (Figures 8d-8f).
As mouth bars prograde, they create local shoreline deviations ~4-6 channel widths in
length (e.g. arrows in Figures 8e and 8f). Coarse-grained deltas are dominated by mobile
channels that avulse frequently (Figures 8g-8i), creating numerous flooding events that
erode the floodplain and create a large number of channels.
These results indicate that changes in median grain size change the dominant
delta-building process operating on the delta. In the next section I quantify the different
delta morphologies that each of these grain-size distributions creates. Later I show how it
is the relative balance of delta-building processes, as controlled by variations in the grain-
27
size distribution, which determines channel network morphology and delta planform
morphology.
Figure 8. Evolution of fine (a-c), intermediate (d-f), and coarse (g-i) grained deltas. (b-c): brackets highlight northwest channel elongation. (e-f): arrows show shoreline deviations ~4-6 channel widths in length. The x-axis represents relative delta growth, where t is time and T is total time. T is calculated when a predetermined volume of sediment has entered the system. Runs shown here have σ = 1 φ and skewness = 0.
4.2. Variation in Delta Channel Network and Planform Morphology
Numerical results show that delta morphology varies as a function of the median
and standard deviation of the grain-size distribution. This is evident by the qualitative
observation that a morphological transition occurs within grain size parameter space as
both median and standard deviation are increased (lower-left to upper-right of Figure 5).
At low median grain size and standard deviation values (a silty, well sorted sediment
28
input), deltas have shallow topset gradients, few active channel mouths, smooth
shorelines, and elongate planform morphologies. At high median grain size and standard
deviation (a sandy, poorly sorted sediment input), deltas have steeper topset gradients,
more active channel mouths, somewhat smooth shorelines, and semi-circular planform
morphologies.
To further substantiate these observations I measure four morphometric
parameters: topset gradient, number of channel mouths, shoreline rugosity, and bulk delta
shape. These metrics are chosen because they highlight the differences among the
observed end-member morphologies. Additionally, they are simple measurements that
can be applied to any field delta, and measurement of number of channel mouths,
shoreline rugosity, and bulk delta shape requires only a single aerial image. This ensures
that conclusions based on these metrics can easily be applied to images of global deltas
for comparison.
4.2.1. Description of Morphometric Parameters
To calculate these morphometric parameters I first classify all grid cells in the
modeling domain as shoreline, open water, channelized topset, or land. I use the
Opening-Angle Method (OAM) [Shaw et al., 2008] to delineate the delta shoreline, which
defines a grid cell as ‘seaward’ or ‘landward’ of the shoreline based on the angular swath
that is ‘open’ to the ocean. The shoreline is then defined as the boundary between the
two domains. For example, if a grid cell behind a large mouth bar cannot ‘see’ any open
ocean it would be classified as landward of the shoreline. This permits an objective
definition of the shoreline because it is otherwise difficult to decide if a detached mouth
bar is part of the shoreline or how to draw the shoreline across open delta river mouths.
29
For all the grid cells marked as ‘landward’ I differentiate between those that are
channelized and those that are unchannelized (i.e. land). Active channelized cells are
defined by depth (D), water velocity (u), and total sediment flux thresholds (Qt), where D
≥ 0.25 m, u ≥ 0.2 m/s, and Qt ≥ 2.25 x 10⁻⁴ m3/s (per 25 m cell). All remaining cells
within the shoreline polygon that are not channelized are considered land.
To calculate delta topset gradient I measure rays from the delta apex to points
along the shoreline spaced ~20 meters apart, and I assume a linear slope between the
apex and shoreline points. The average of these values is used as a representative topset
gradient.
A channel mouth is defined as those locations where there are two or more
adjacent channelized cells that intersect the shoreline. The number of active channel
mouths was measured throughout delta growth and the average of these values calculated
after the delta reached a state of dynamic equilibrium, where the number of channel
mouths no longer changes significantly with time. The number of active channel mouths
at the delta shoreline is an important morphometric parameter for two reasons. First, the
channel mouth represents the location where sediment is deposited at the shoreline and
thus represents locations of localized shoreline progradation. Therefore, number and
spacing of channel mouths should relate to shoreline rugosity and overall delta shape.
Second, the number of channel mouths is the result of flow splitting within the delta
topset, and thus is a simple quantitative representation of the channel network.
Shoreline rugosity is calculated as a sinuosity value, where the total delta
shoreline length is normalized by the length of a smoothed, or “average”, shoreline
location (Figure 9a). This measures local deviations from the “average” shoreline. A
30
large sinuosity measurement represents a very rugose shoreline characterized by larger-
scale shoreline deviations.
Figure 9. Cartoons depicting how (a) shoreline rugosity (Run ID = B1c1, rugosity value ≈ 1.6) and (b) bulk delta shape (Run ID = C1m1, bulk shape value ≈ 0.9) are measured. See text for description of calculations.
31
Changes in delta planform morphology are quantified with a simple bulk shape
metric where X = Wd / 2Ld. Wd is delta width defined as the maximum, shore-parallel
distance of the delta shoreline, and Ld is delta length defined as the maximum shore-
perpendicular longitudinal distance from the delta apex to the furthest basinward
shoreline point (Figure 9b). This ratio is divided by two so that deltas that have
prograded equal amounts laterally and basinward of the delta apex (Wd ≈ 2Ld) have a bulk
shape value of one. Deltas with X = 1 resemble semi-circles and deltas with X < 1 or X >
1 are elongate with long axes perpendicular or parallel to the shore, respectively.
4.2.2. Effect of Median Grain Size on Delta Channel Network and Planform
Morphology
Median grain size exerts the strongest control on delta morphology of the
parameters considered in this study. While standard deviation of the grain-size
distribution creates some variability in delta form (Figure 5) it is not as significant as
median grain size. Skewness of the grain-size distribution has little effect on delta
morphology (Figure 6). The following discussion will focus on the effect of median
grain size on delta morphology.
Average topset gradient increases linearly as median grain size increases (Figures
7a and 10). Topset gradients vary an order of magnitude from 1.4 x 10⁻⁴ to 2 x 10⁻⁴ for
the smallest median grain sizes to 1 x 10⁻³ to 1.8 x 10⁻³ for the largest median grain sizes.
The spread in the relationship (R2 = 0.59, significant at the PN = 0.05 level following
Taylor, 1997) between median grain size and gradient is likely due to the effects of
standard deviation (Figure 7a) and cohesion (Figure 7b), where deltas built by grain-size
32
distributions with larger standard deviations and higher percent cohesion tend to have
steeper topset gradients.
The number of active channel mouths increases logarithmically with respect to
median grain size (Figures 7c and 11). At low median grain size, deltas have 1-8 active
channel mouths, whereas grain-size distributions with high median grain sizes create
deltas with 13-16 active channel mouths. The correlation between median grain size and
average number of channel mouths is strong (R2 = 0.72, significant at the PN = 0.05 level
following Taylor, 1997) and the spread in the data is likely due to standard deviation of
the grain-size distribution. Deltas built by poorly sorted sediment inputs (σ = 3 φ) have a
larger number of channel mouths than average (blue circles in Figure 7c).
Shoreline rugosity exhibits a non-monotonic relationship with respect to median
grain size, where the most rugose shorelines are created by intermediate median grain
sizes (Figure 12). At both low and high median grain sizes, rugosity values range from
1.34 to 1.49, indicating a smooth shoreline that deviates minimally from the average
shoreline location. On deltas built by low median grain sizes, the development of river
mouth bars is unlikely, which in turn decreases the local progradation at river mouths.
Instead, the runaway progradation of only a few channels dominates the smooth shoreline
development (e.g. Figure 8c). Similarly, delta shorelines built by high median grain sizes
are also smooth because of the absence of localized progradation at individual channel
mouths (e.g. Figure 8i). The highest rugosity values of ~1.57 – 1.62 are measured on
deltas built by low-intermediate median grain sizes and low standard deviation (D50 =
0.05 – 0.1 mm, σ = 0.1 – 1 φ). Based on inspection of the data this high rugosity value is
33
linked to local progradation at river mouths due to bar and levee development (Figures 8e
and 8f).
Bulk delta shape increases with respect to median grain size (Figure 13). At low
median grain sizes, deltas exhibit bulk shape values ranging from 0.3 to 0.5 X, indicating
that the planform morphologies are elongate and deviate from that of a semi-circle. High
median grain sizes have bulk shape values closest to one, and thus approximate a semi-
circle.
34
Figure 10. Measured topset gradients (a) contoured in the D50 vs. σ parameter space, and (b) with the contours from (a) superimposed on the images of model deltas.
35
Figure 11. Measured average number of channel mouths (a) contoured in the D50 vs. σ parameter space, and (b) with the contours from (a) superimposed on the images of model deltas.
36
Figure 12. Distribution of measured shoreline rugosity, calculated as shoreline sinuosity (actual shoreline length / smoothed shoreline shape), (a) contoured in the D50 vs. σ parameter space, and (b) with the contours from (a) superimposed on the images of model deltas.
37
Figure 13. Distribution of measured bulk delta shape, calculated as X = Wd / 2Ld, (a) contoured in the D50 vs. σ parameter space, and (b) with the contours from (a) superimposed on the images of model deltas.
38
4.2.3. Effect of Cohesion on Delta Channel Network and Planform Morphology
The amount of cohesive sediment entering the domain varies as a result of
changing the median, standard deviation, and skewness of the incoming grain-size
distribution (Table 2, Figures 4b, 4c, and 14). The percent cohesive sediment ranges
from 100% for small median grain sizes to 0% for large median grain sizes.
Topset gradient and percent cohesive sediment exhibit an overall negatively linear
relationship (dotted line in Figure 15a). This relationship (R2 = 0.30, significant at the PN
= 0.05 level following Taylor, 1997) is likely due to the fact that higher bulk cohesions
are created by lower median grain sizes, and the observed decrease in topset gradient is
actually due to decreased median grain sizes (Section 5.1). However, for low bulk
cohesions (0% - 50% cohesive sediment), an increase in cohesion for a given median
grain size steepens the topset gradient (relationships for D50 = 0.25 and 0.5 mm are
significant at the PN = 0.05 level following Taylor, 1997) (left side of Figure 15a). The
opposite is true for high bulk cohesions (50% - 100% cohesive sediment), where negative
linear trends suggest an increase in cohesion for a given median grain size creates
shallower topset gradients.
The average number of channel mouths decreases as percent cohesion increases
(R2 = 0.56, significant at the PN = 0.05 level following Taylor, 1997) (dotted line in
Figure 15b), though the relationship is non-monotonic (black line in Figure 15b). Deltas
with cohesive sediment inputs have the highest number of channel mouths (7-12) when
the sediment input is ~70% - 80% cohesive, and fewer channel mouths (1-6) when bulk
cohesion is either lower (~40% - 70%) or higher (~80% - 100%) (right side of Figure
39
15b). As sediment inputs become non-cohesive (0% - 40%) there is an increase in
number of channel mouths (6-16).
Figure 14. Percent cohesive sediment that makes up the incoming sediment load (a) contoured in the D50 vs. σ parameter space, and (b) with the contours from (a) superimposed on the images of model deltas.
40
Figure 15. Relationship between percent cohesive sediment and (A) topset gradient, and (B) average number of channel mouths. Colors denote median grain size.
41
5. Discussion
In this section I show how changes in the grain-size distribution set the dominant
delta-building processes that produce variations in channel network morphology and
delta planform morphology. The final product is a process-based model for grain size
effects on delta morphodynamics.
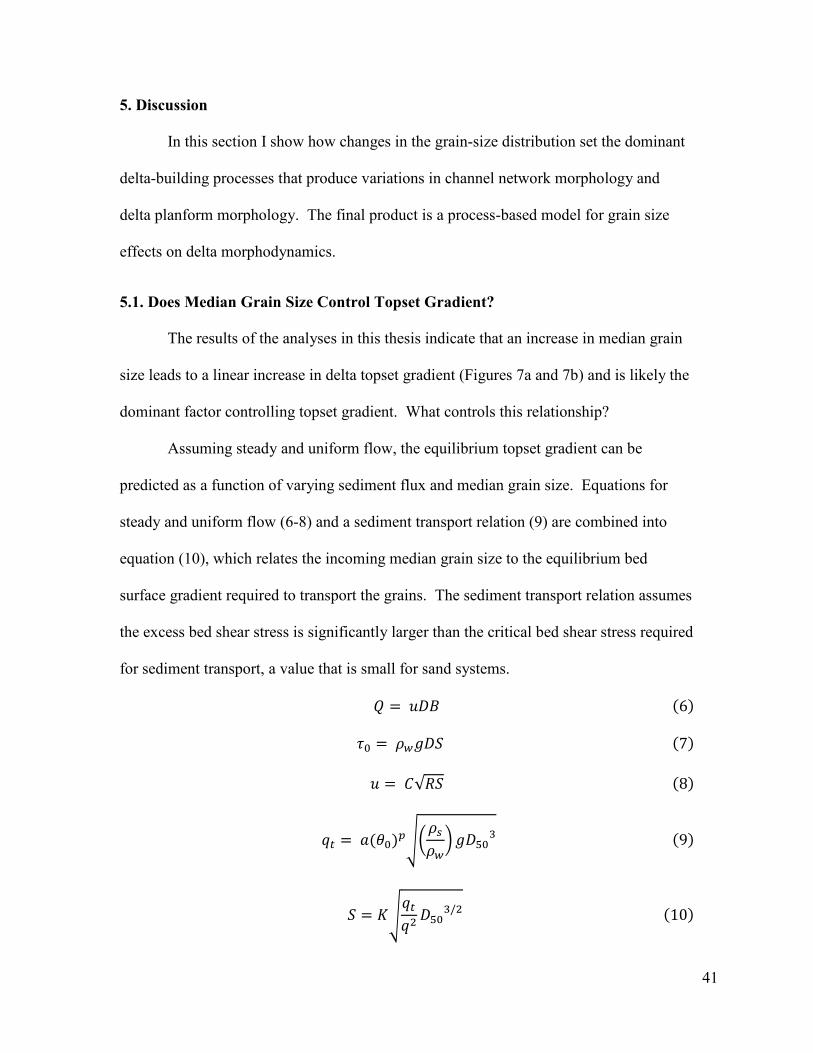
5.1. Does Median Grain Size Control Topset Gradient?
The results of the analyses in this thesis indicate that an increase in median grain
size leads to a linear increase in delta topset gradient (Figures 7a and 7b) and is likely the
dominant factor controlling topset gradient. What controls this relationship?
Assuming steady and uniform flow, the equilibrium topset gradient can be
predicted as a function of varying sediment flux and median grain size. Equations for
steady and uniform flow (6-8) and a sediment transport relation (9) are combined into
equation (10), which relates the incoming median grain size to the equilibrium bed
surface gradient required to transport the grains. The sediment transport relation assumes
the excess bed shear stress is significantly larger than the critical bed shear stress required
for sediment transport, a value that is small for sand systems.
𝑄 = 𝑢𝐷𝐵 (6)
𝜏0 = 𝜌𝑤𝑔𝐷𝑆 (7)
𝑢 = 𝐶√𝑅𝑆 (8)
𝑞𝑡 = 𝑎(𝜃0)𝑝��𝜌𝑠𝜌𝑤�𝑔𝐷503 (9)
𝑆 = 𝐾�𝑞𝑡𝑞2𝐷503/2 (10)
42
B is channel width (m), 𝜏0 is bed shear stress (N/m2), S is the equilibrium gradient, qt is
total sediment flux per unit width (m2/s), a and p are constants used in the sediment
transport relation, and q is water discharge per unit width (m2/s). When equations (6-9)
are combined to form equation (10), the remaining constant K is a function of roughness,
gravity, and density.
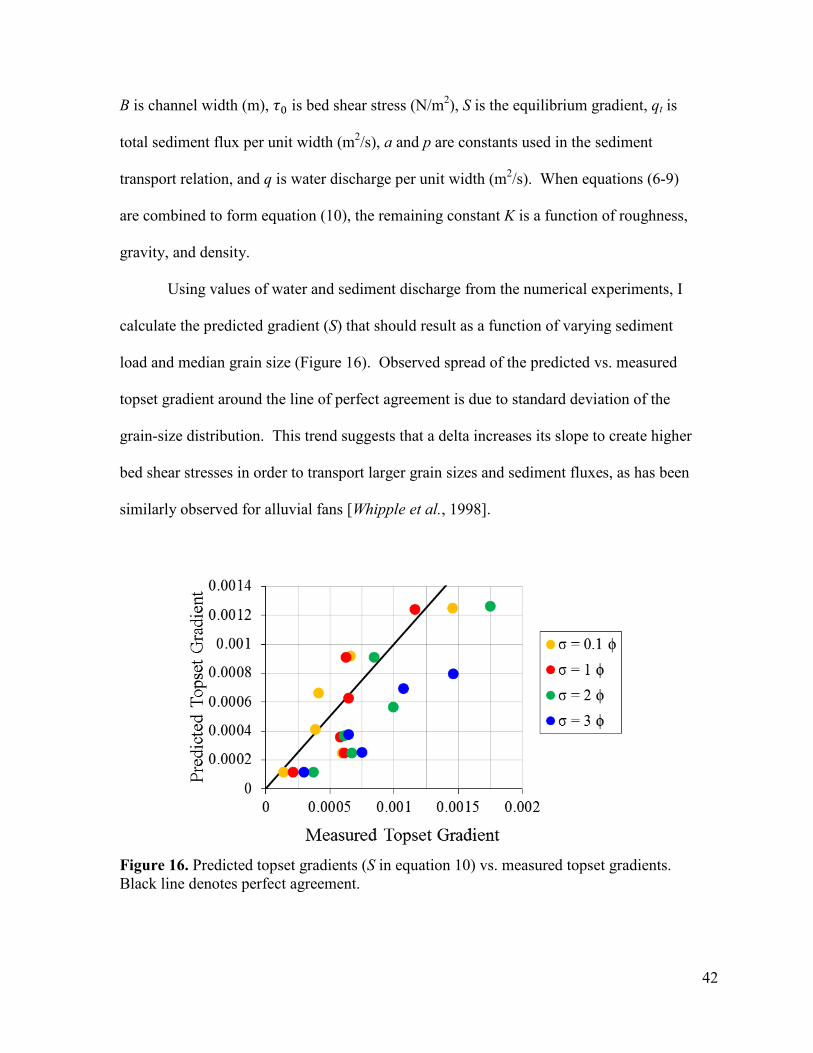
Using values of water and sediment discharge from the numerical experiments, I
calculate the predicted gradient (S) that should result as a function of varying sediment
load and median grain size (Figure 16). Observed spread of the predicted vs. measured
topset gradient around the line of perfect agreement is due to standard deviation of the
grain-size distribution. This trend suggests that a delta increases its slope to create higher
bed shear stresses in order to transport larger grain sizes and sediment fluxes, as has been
similarly observed for alluvial fans [Whipple et al., 1998].
Figure 16. Predicted topset gradients (S in equation 10) vs. measured topset gradients. Black line denotes perfect agreement.
43
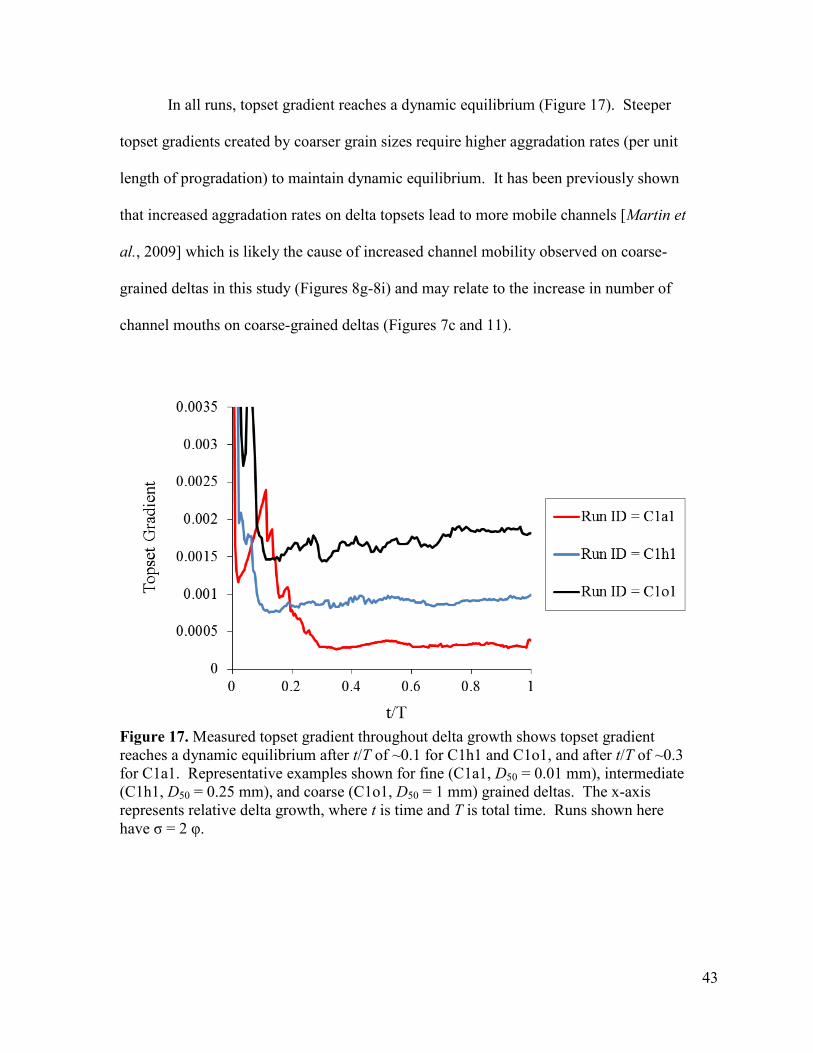
In all runs, topset gradient reaches a dynamic equilibrium (Figure 17). Steeper
topset gradients created by coarser grain sizes require higher aggradation rates (per unit
length of progradation) to maintain dynamic equilibrium. It has been previously shown
that increased aggradation rates on delta topsets lead to more mobile channels [Martin et
al., 2009] which is likely the cause of increased channel mobility observed on coarse-
grained deltas in this study (Figures 8g-8i) and may relate to the increase in number of
channel mouths on coarse-grained deltas (Figures 7c and 11).
Figure 17. Measured topset gradient throughout delta growth shows topset gradient reaches a dynamic equilibrium after t/T of ~0.1 for C1h1 and C1o1, and after t/T of ~0.3 for C1a1. Representative examples shown for fine (C1a1, D50 = 0.01 mm), intermediate (C1h1, D50 = 0.25 mm), and coarse (C1o1, D50 = 1 mm) grained deltas. The x-axis represents relative delta growth, where t is time and T is total time. Runs shown here have σ = 2 φ.
44
5.2. How Does Median Grain Size Control the Number of Channel Mouths?
Sediment loads with larger median grain sizes create deltas with more channel
mouths (Figures 7c and 11). Channels on a delta can be created by three processes: (1)
bifurcation around river mouth bars, (2) bifurcation around braid bars initiated within the
channel rather than at the channel mouth, and (3) avulsion to new locations and creation
of crevasse channels. Channel avulsion and crevassing is typically associated with
aggrading river systems [Slingerland and Smith, 2004] because the aggradation perches
the channel above the floodplain, creating a gravitationally unstable channel that will
seek the steeper and lower path in the adjacent floodplain. I suggest that the higher
aggradation rates on coarse-grained deltas (as inferred from Figure 17 and from the
higher elevations at the delta apex in Figure 5) create frequently avulsing channels with
morphologies similar to crevasse channels.
To test this idea, I measure an average channel-switching time scale (𝑇𝑐ℎ����) once
delta growth has reached a state of dynamic equilibrium where the number of channel
mouths and topset gradient (Figure 17) no longer change with time. Although the
average number of channel mouths is constant through time, individual channels are
mobile – they are abandoning their initial channel mouth locations for new locations on
the delta topset. As previously described, a channel is defined by channelized grid cells
(see Section 4.2 for threshold requirements). A channel’s abandonment is thus defined
by the abandonment of its channelized grid cells as they become inactive over time. As I
will show later (Figure 18, Equation 15), channelized grid cells abandon at a rate that can
be fit with an exponential decay function. I measure 𝑇𝑐ℎ���� by calculating an average
channelized grid cell decay rate constant and then converting that to an average channel
45
lifetime. I use a decay constant to estimate 𝑇𝑐ℎ���� instead of directly measuring the average
channel lifetime because the channels in some runs abandon slowly and persist for the
entire time while the delta is at dynamic equilibrium. With a decay constant I can
estimate the lifetimes of channels that abandon slowly beyond what is recorded in the
model output.
A direct measurement of the channel-switching time scale is calculated as:
𝑇𝑐ℎ���� = 𝜏 ∙ 𝐵�𝑐𝑒𝑙𝑙𝑠 (11)
where τ is the mean lifetime of a channelized grid cell and 𝐵�𝑐𝑒𝑙𝑙𝑠 is mean channel width
in number of grid cells for a given numerical experiment. τ is calculated from the decay
rate constant (λ), where:
𝜏 =1𝜆
(12)
Once the delta reaches dynamic equilibrium, a representative value for λ is obtained for
each experiment by tracking the newly channelized grid cells that represent new channels
as they decay through time. I mark the location of every newly channelized grid cell not
associated with an existing channel (i.e. excluding those created by channel progradation)
throughout the rest of the delta’s lifetime. I then track the decay of those newly
channelized grid cells (as they become inactive, or no longer meet the active
channelization threshold requirements stated in Section 4.2) (Figure 18). At any time i
following channel initiation, the total number of initially ‘active channel cells’ (𝐶𝑐ℎ,0)
will be:
𝐶𝑐ℎ,0 = 𝐶𝑐ℎ,𝑖 + 𝐶𝑎,𝑖 (13)
where Cch,i is the number of initially ‘active channel cells’ that have remained continually
active by time i, and Ca,i is the number of those initially ‘active channel cells’ that have
46
been abandoned by time i. The fraction of 𝐶𝑐ℎ,0 that remains active by time i is measured
as the ratio Rch:
𝑅𝑐ℎ =𝐶𝑐ℎ,𝑖
𝐶𝑐ℎ,0 (14)
which decays over time. It follows that a delta with a rapid decline in Rch (solid black
line in Figure 18) has channelized cells that are abandoned quickly after formation.
Deltas with Rch values that decline slowly (solid red line in Figure 18) have relatively
stable channelized cells.
Figure 18. Ratio of channelized grid cells that are still ‘active’ after channel initiation (Rch) (solid lines) and decay curves fit to each abandonment rate (dashed lines). Examples shown here are for channels that formed at t/T = 0.6, where t is time and T is total time. Thus, t/T = 0.6 corresponds to i = 0 in this case. Complete abandonment is defined as the abandonment of 90% of the initially active channel cells, shown here as a dotted line. Examples shown for fine (C1a1, D50 = 0.01 mm), intermediate (C1h1, D50 = 0.25 mm), and coarse (C1o1, D50 = 1 mm) grained deltas. Runs shown here have σ = 2 φ.
47
The abandonment of channelized grid cells through time is fit with an exponential
decay function (dashed lines in Figure 18). This function has the form
𝑅𝑐ℎ = 𝑒−𝜆∙𝑖 (15)
where λ is the decay rate, and i is the time since channel formation (years). I define
‘complete abandonment’ as the abandonment of 90% of the initial ‘active channel cells’
(red dotted line in Figure 18). The decay rate is converted to 𝑇𝑐ℎ���� using equations (11 and
12).
Increasing median grain size leads to deltas with smaller 𝑇𝑐ℎ���� values. Fine-grained
deltas, on the other hand, create stable channels that have much larger 𝑇𝑐ℎ���� values. This
negative correlation between 𝑇𝑐ℎ���� and grain size arises because the faster aggradation
rates needed to maintain steeper topset gradients in coarse-grained deltas lead to more
frequent channel-switching. In all runs topset gradient reaches a dynamic equilibrium
that increases with increasing grain size (Figure 17). To maintain a steeper gradient, a
delta’s topset must aggrade at a faster rate (per unit length of progradation). The majority
of aggradation in fluvial systems occurs in or near channels [Heller and Paola, 1996;
Törnqvist and Bridge, 2002], which leads to superelevation of the channel relative to the
adjacent floodplain, and subsequent channel avulsion [Mohrig et al., 2000]. Jerolmack
and Mohrig [2007] show that a theoretical channel avulsion time scale, TA (years), may
be predicted as:
𝑇𝐴 =𝐷�𝜈𝐴
(16)
where 𝐷� is average channel depth (m) and νA is channel aggradation rate (m/yr). This
relation accurately predicts measured avulsion time scales for natural systems [Jerolmack
and Mohrig, 2007]. Using equation (16), I calculate theoretical channel avulsion time
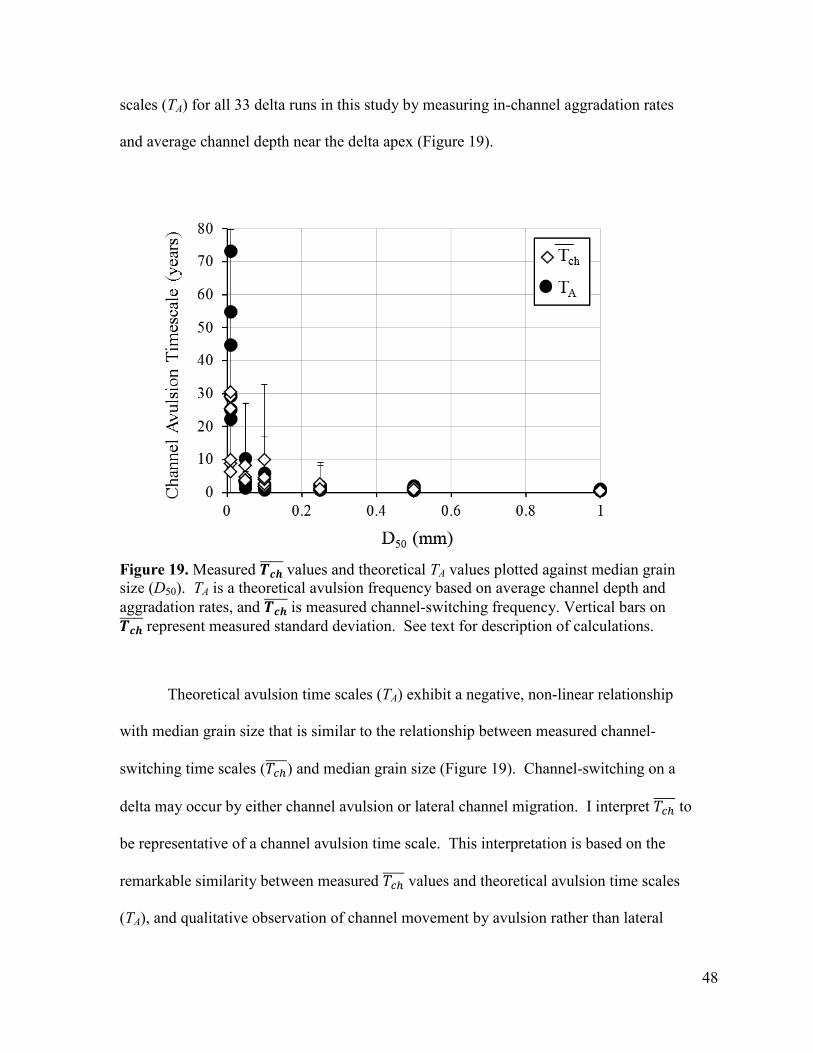
48
scales (TA) for all 33 delta runs in this study by measuring in-channel aggradation rates
and average channel depth near the delta apex (Figure 19).
Figure 19. Measured 𝑻𝒄𝒉����� values and theoretical TA values plotted against median grain size (D50). TA is a theoretical avulsion frequency based on average channel depth and aggradation rates, and 𝑻𝒄𝒉����� is measured channel-switching frequency. Vertical bars on 𝑻𝒄𝒉����� represent measured standard deviation. See text for description of calculations.
Theoretical avulsion time scales (TA) exhibit a negative, non-linear relationship
with median grain size that is similar to the relationship between measured channel-
switching time scales (𝑇𝑐ℎ����) and median grain size (Figure 19). Channel-switching on a
delta may occur by either channel avulsion or lateral channel migration. I interpret 𝑇𝑐ℎ���� to
be representative of a channel avulsion time scale. This interpretation is based on the
remarkable similarity between measured 𝑇𝑐ℎ���� values and theoretical avulsion time scales
(TA), and qualitative observation of channel movement by avulsion rather than lateral
49
migration (Figures 8g-8i). Theoretical TA values are on average 1.3 times larger than
measured 𝑇𝑐ℎ���� values, predicting that the channel avulsion time scale should be longer
than observed in the model. This offset is due to the fact that the TA formulation of
equation (16) assumes that a channel must aggrade an entire channel depth above the
adjacent floodplain before avulsing, whereas inspection of my model results suggests that
channel avulsions often occur before this threshold is met. Despite the offset, the
negative relationship between both TA and 𝑇𝑐ℎ���� with median grain size suggests that
increased aggradation rates on coarse-grained deltas cause superelevation of channels
relative to the adjacent floodplain, which leads to more frequent channel avulsions.
Increased channel avulsion frequency should lead to a channel network with
multiple simultaneously active channels [Makaske, 2001; Jerolmack and Mohrig, 2007],
explaining the increase in number of observed channel mouths on coarse-grained deltas
(Figures 7c and 11). More frequent channel avulsions on coarse-grained deltas result in
increased periods of overbank flow. Because coarse-grained deltas are steeper than fine-
grained deltas, the overbank flow on coarse-grained deltas exerts a higher shear stress on
the floodplain topset. This leads to more frequent and more erosive overbank flow on
coarse-grained deltas, which in turn creates more channels.
5.3. How Does Cohesion Control the Number of Channel Mouths?
Previous research [Edmonds and Slingerland, 2010] has established a link
between cohesion and number of bifurcations. Edmonds and Slingerland [2010]
considered sediment mixtures ranging from ~55% - 96% cohesive sediment and found a
peak in the number of bifurcations at intermediate cohesion. While I did not strictly
measure the number of bifurcations, the number of channel mouths should be related to
50
the number of bifurcations provided channels are generally distributive and do not rejoin
downstream from the bifurcations frequently. Indeed, the results of this study suggest
that the number of channel mouths peaks at a similar value of percent cohesive sediment
as that reported by Edmonds and Slingerland [2010], although the greatest number of
channel mouths in this study are created by sediment mixtures with ~0% - 30% cohesive
sediment (Figure 15b), a range in percent cohesive sediment not explored by Edmonds
and Slingerland [2010].
The number of channel mouths in my results can be explained by considering two
different process-regimes. At low median grain sizes (or high percent cohesion) the
dynamics of sediment cohesion set the number of channel mouths. Distributary channels
have highly stable levees that confine the flow to only a few channels and inhibit
avulsions and bifurcations around river mouth bars. As the percentage of cohesive
sediment is decreased to around ~70% - 80%, bifurcations around river mouth bars occur
and are stabilized by the still highly cohesive levees, leading to an increase in distributary
channel number. As the percent cohesive sediment is further decreased (~40% - 70%),
levees and river mouth bars are unstable and easily eroded, decreasing the number of
channels that form. This is consistent with the Edmonds and Slingerland [2010] model.
At high median grain sizes (low percent cohesion) the number of channel mouths
is set by avulsion dynamics. Once the percent cohesive sediment input is below ~40%,
the strong relationship between bulk cohesion and number of channel mouths breaks
down (evidenced by the spread in the data in Figure 15), and the dominant process
controlling the increase in number of channel mouths is channel avulsion as controlled by
median grain size and topset gradient.
51
5.4. Process-Based Model for Grain Size Effects on Delta Channel Network
Morphology and Planform Morphology
Grain size dictates delta morphology by shifting the delta into different process-
regimes. I define a process-regime as a part of the model parameter space where the
boundary conditions conspire to make a delta that is dominated by a given set of delta –
building processes. For example, a delta dominated by a subsidence boundary condition
is in an aggradation process-regime, provided sediment supply is large enough. Here I
present a conceptual process-regime model for how changes in grain size modify delta-
building processes and in turn, how that is expressed in the morphology. This model
only considers the different process-regimes created by changes in grain size and
therefore does not consider other potentially important process-regimes such as those
created by crustal subsidence or wave energy.
Results from this study show that grain size of the incoming sediment load can
control the topset gradient on the delta. Median grain size and cohesion set the channel
network, and thus the number of channel mouths along the delta shoreline. The number
of channel mouths and advection lengths of varying grain sizes set the deposition pattern
along the shoreline, which translates into shoreline rugosity and delta shape patterns.
Fine-grained deltas occupy a process-regime that is dominated by levee growth.
Low median grain sizes create shallow topset gradients with few distributary channels
that are deep and aggrade slowly, and thus avulse infrequently (Figure 19). Fine-grained,
highly cohesive sediment loads create stable levees that confine the majority of water and
sediment discharge to the deep channel mouths, which promotes basinward progradation
of elongate channels [Kim et al., 2009; Edmonds and Slingerland, 2010; Falcini and
52
Jerolmack, 2010; Rowland et al., 2010]. These growth processes result in deltas with a
few, sinuous channels, smooth shorelines, and elongate shapes.
Intermediate-grained deltas occupy a process-regime that is dominated by river
mouth bar growth. Although avulsion is more frequent than in fine-grained deltas
(Figure 19), channels remain in their original location long enough for river mouth bars
to grow. Intermediate values of cohesion (~50% - 80% cohesive sediment) aid in
stabilizing mouth bars and levees [Edmonds and Slingerland, 2010], leading to successful
channel bifurcations at the shoreline [Edmonds and Slingerland, 2007] and an increase in
the number of active channel mouths. The bifurcated channel network deposits sediment
along the entire shoreline creating a semi-circular delta shape (Figure 13), though the
increased mouth bar deposition and progradation creates local shoreline perturbations
(Figures 8e and 8f), leading to the most rugose shorelines observed (Figure 12).
Coarse-grained deltas occupy a process-regime that is dominated by frequent
channel avulsions. In order to maintain steeper topset gradients (Figure 17), coarse-
grained deltas aggrade at faster rates than finer-grained deltas, leading to more frequent
channel superelevation above the adjacent floodplain and increased avulsion frequency
(Figure 19) [Mohrig et al., 2000; Jerolmack and Mohrig, 2007]. More frequent avulsions
result in more concurrently active channels [Makaske, 2001] as new channels are easily
eroded into the delta topset due to high shear stresses exerted on the floodplain by
overbank flow. The large number of mobile channel mouths deposit sediment evenly
along the delta shoreline, resulting in a semi-circular delta shape (Figure 13). The
process of channel bifurcation around river mouth bars is suppressed on coarse-grained
deltas, as channel mouths are highly mobile and rarely remain in one location long
53
enough to build a mature mouth bar. The absence of river mouth bar progradation creates
smoother shorelines relative to intermediate-grained deltas (Figure 12).
The process-based model presented here provides a previously lacking
mechanistic understanding of grain size effects on delta channel network and planform
morphology that is in agreement with qualitative observations linking grain size to delta
morphologies [McPherson et al., 1987; Orton and Reading, 1993]. Changes in the grain-
size distribution delivered to the delta apex shift deltas into the different process-regimes
described above, resulting in variations in delta morphology related to grain size that are
consistent with the previous qualitative studies. For example, it was previously shown
that an increase in grain size from silt to gravel results in a morphological transition from
elongate to semi-circular delta shapes [McPherson et al., 1987; Orton and Reading,
1993]. Here I show that this transition is related to an increase in topset gradient and
subsequent increase in avulsion frequency, creating a large number of channels on the
delta topset that have a braided pattern and that deliver sediment evenly across the
shoreline, creating a semi-circular shape.
5.5. Influence of Catchment Characteristics on Delta Morphology
If grain size is as important as this study indicates, then a natural question is what
controls the incoming grain-size distribution? To a first order, variations in natural grain-
size distributions entering a delta apex result from differences in upstream catchment area
characteristics. These include source properties that build the initial grain-size
distribution (e.g. lithology, weathering processes), and modification of the distribution
downstream by fluvial processes through abrasion and selective deposition [e.g.
Ferguson et al., 1996; Rice, 1999; Fedele and Paola, 2007]. The most recent effort in
54
quantifying this relationship is Syvitski and Milliman’s [2007] analysis of modern
sediment loads delivered to the world’s coasts. They found that a majority of the
between-river variation in total sediment load is a function of basin area, relief, lithology,
and ice erosion. Thus, to a first order, one can relate the sediment loads delivered to a
delta to its catchment characteristics. Relating sediment size to source terrain is more
difficult, but in general, larger catchments with low relief deliver more predominantly
fine sediment, whereas smaller catchments with high ruggedness deliver more coarse-
grained sediment [Milliman and Syvitski, 1992; Orton and Reading, 1993; Mulder and
Syvitski, 1995; Syvitski and Milliman, 2007]. Thus, my results suggest that to a first
order, active margin coasts that are generally dominated by steep, high relief catchments
with short transport distances should be dominated by coarse-grained deltas that are semi-
circular with many active channels. Passive margin coasts with large drainage basins that
drain the low-relief continental interiors and have long transport distances should deliver
finer grains to the coasts and produce elongate deltas. Thus, in a sense, grain-size
distribution is a function of catchment area related to a given delta. With this in mind,
the model presented here may be used to connect delta morphology to catchment area,
though additional work developing such predictive capabilities is necessary.
55
6. Conclusion
Natural deltas exhibit a range of morphologies not completely explained by the
control of fluvial, wave, and tidal energies (Figure 1). I show that this additional,
unexplained morphological variation may be attributed to variations in the grain-size
distribution, primarily by the median grain size, and to a lesser extent by the standard
deviation of the grain-size distribution. For example, changing median grain size alone
produces delta morphologies that are qualitatively similar to natural deltas (compare
deltas in Figure 1 to modeled deltas of similar median grain size in Figure 5). Analysis of
33 numerically modeled deltas shows that topset gradient and average number of channel
mouths are positive functions of median grain size. Shoreline rugosity is highest at
intermediate median grain sizes, and delta shapes most closely approximate a semi-circle
at coarse median grain sizes. Percent cohesive sediment varies as a function of the grain-
size distribution. Results reveal an overall negative relationship between percent
cohesive sediment and number of channel mouths. This relationship is characterized by
an additional peak in number of channel mouths around ~70% - 80% cohesive sediment
that has been predicted by previous studies.
Relationships between median grain size and delta morphologies can be explained
by a shift of deltas into different process-regimes, where dominant delta-building
processes are expressed in the resulting delta channel network and planform morphology.
To explain this control by grain size I present a process-based model for the effect of
grain size on delta morphology. This model shows that (1) an increase in median grain
size results in an increase in delta topset gradient, (2) as coarse-grained deltas aggrade at
faster rates to maintain steeper equilibrium gradients channels avulse more frequently, (3)
56
increased channel avulsion leads to increased periods of overbank flow which exerts
higher shear stresses on the floodplain due to steeper gradients, creating more channels
on the delta topset, (4) the increased number of channel mouths delivers sediment evenly
along the delta shoreline, and (5) the increased channel mobility due to increased
avulsion frequency suppresses levee and river mouth bar growth at the shoreline.
Variations in median grain size from silt to coarse sand shift deltas into 3 different
process-regimes, expressed as 3 end-member delta morphologies. Fine-grained deltas are
dominated by levee growth and channel elongation, resulting in smooth shorelines and
elongate planforms. Intermediate-grained deltas are dominated by channel bifurcations
around river mouth bars, resulting in semi-circular deltas with rugose shorelines. Coarse-
grained deltas are dominated by channel avulsions, resulting in semi-circular delta shapes
with many channels and relatively smooth shorelines.
The grain-size distribution of the incoming sediment load is determined by
upstream catchment characteristics. Thus, the relationships between grain size and
resulting delta morphology presented here may aid in interpreting past catchment area
characteristics related to deltaic deposition preserved in the stratigraphic record. Future
work should focus on determining the degree to which the described variations in delta
morphology are preserved in the stratigraphic record and test the predictive capabilities
for determining past upstream catchment area characteristics. Additionally, the model for
grain size effects on delta morphology presented here shows that changing grain size
alone creates a large range in delta morphologies. Future work will focus on testing this
model with data from natural deltaic systems, and determining the degree to which global
delta morphological variation can be explained by changes in grain size.
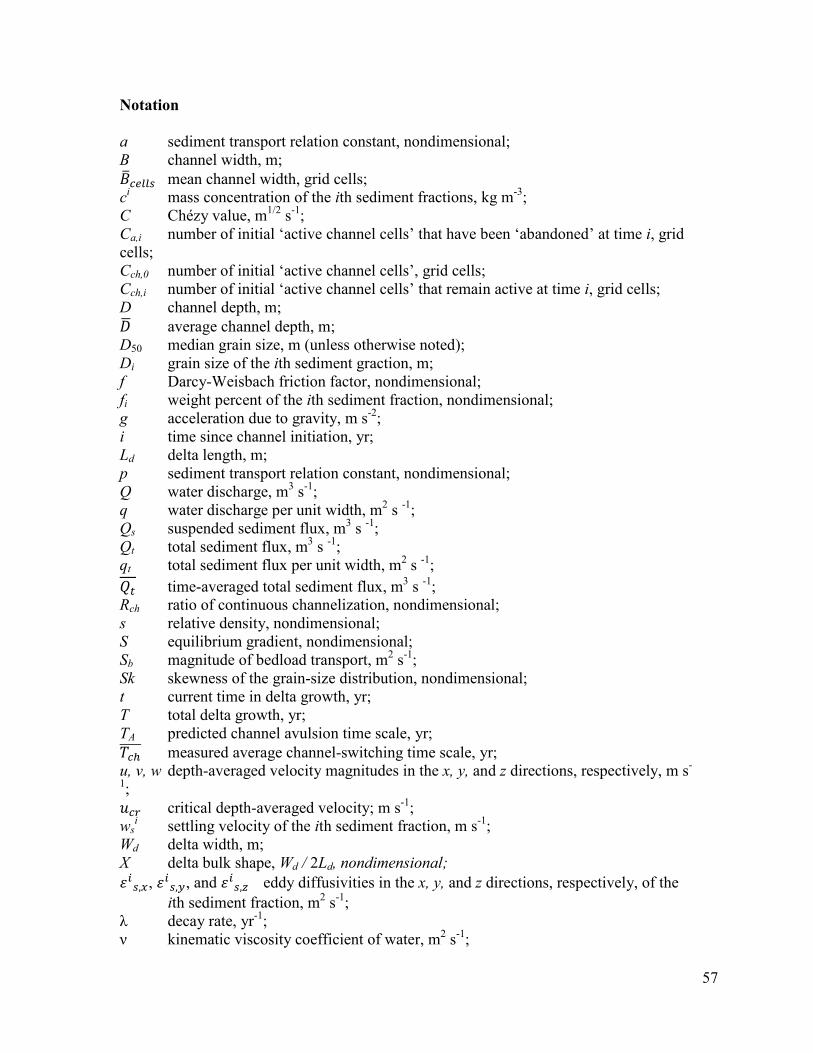
57
Notation a sediment transport relation constant, nondimensional; B channel width, m; 𝐵�𝑐𝑒𝑙𝑙𝑠 mean channel width, grid cells; ci mass concentration of the ith sediment fractions, kg m-3; C Chézy value, m1/2 s-1; Ca,i number of initial ‘active channel cells’ that have been ‘abandoned’ at time i, grid cells; Cch,0 number of initial ‘active channel cells’, grid cells; Cch,i number of initial ‘active channel cells’ that remain active at time i, grid cells; D channel depth, m; 𝐷� average channel depth, m; D50 median grain size, m (unless otherwise noted); Di grain size of the ith sediment graction, m; f Darcy-Weisbach friction factor, nondimensional; fi weight percent of the ith sediment fraction, nondimensional; g acceleration due to gravity, m s-2; i time since channel initiation, yr; Ld delta length, m; p sediment transport relation constant, nondimensional; Q water discharge, m3 s-1; q water discharge per unit width, m2 s -1; Qs suspended sediment flux, m3 s -1; Qt total sediment flux, m3 s -1; qt total sediment flux per unit width, m2 s -1; 𝑄𝑡 time-averaged total sediment flux, m3 s -1; Rch ratio of continuous channelization, nondimensional; s relative density, nondimensional; S equilibrium gradient, nondimensional; Sb magnitude of bedload transport, m2 s-1; Sk skewness of the grain-size distribution, nondimensional; t current time in delta growth, yr; T total delta growth, yr; TA predicted channel avulsion time scale, yr; 𝑇𝑐ℎ���� measured average channel-switching time scale, yr; u, v, w depth-averaged velocity magnitudes in the x, y, and z directions, respectively, m s-
1; 𝑢𝑐𝑟 critical depth-averaged velocity; m s-1; ws
i settling velocity of the ith sediment fraction, m s-1; Wd delta width, m; X delta bulk shape, Wd / 2Ld, nondimensional; 𝜀𝑖𝑠,𝑥, 𝜀𝑖𝑠,𝑦, and 𝜀𝑖𝑠,𝑧 eddy diffusivities in the x, y, and z directions, respectively, of the
ith sediment fraction, m2 s-1; λ decay rate, yr-1; ν kinematic viscosity coefficient of water, m2 s-1;
58
𝜈𝐴 channel aggradation rate, m yr-1; ρs specific density of sediment, kg m-3; ρw specific density of water, kg m-3; σ standard deviation of the grain-size distribution, φ; τ mean lifetime of an ‘active channel cell’, yr; 𝜏0 bed shear stress, N m-2; 𝜏ce(C) critical shear stress for erosion of cohesive sediment fractions, N m-2; 𝜏cd(C) critical shear stress for deposition of cohesive sediment fractions, N m-2; φ phi value, nondimensional;
59
REFERENCES
Ashton, A. D., and L. Giosan (2011), Wave-angle control of delta evolution, Geophysical Research Letters, 38(13), L13405.
Bagnold, R. A. (1966), An approach to the sediment transport problem from general physics, U. S. Geological Survey Professional Paper, 37-37.
Bhattacharya, J. P., and L. Giosan (2003), Wave-influenced deltas: geomorphological implications for facies reconstruction, Sedimentology, 50(1), 187-210.
Black, K., T. Tolhurst, D. Paterson, and S. Hagerthey (2002), Working with natural cohesive sediments, Journal of Hydraulic Engineering, 128(1), 2-8.
Dalrymple, R. W., and K. Choi (2007), Morphologic and facies trends through the fluvial–marine transition in tide-dominated depositional systems: a schematic framework for environmental and sequence-stratigraphic interpretation, Earth-Science Reviews, 81(3), 135-174.
Dastgheib, A., J. A. Roelvink, and Z. B. Wang (2008), Long-term process-based morphological modeling of the Marsdiep Tidal Basin, Marine Geology, 256(1-4), 90-100.
Deltares (2011), Delft3D-Flow Manual 3.15.5661, 672 pp., Delft, Netherlands.
Edmonds, D., and R. Slingerland (2008), Stability of delta distributary networks and their bifurcations, Water Resources Research, 44(9), W09426.
Edmonds, D. A., and R. L. Slingerland (2007), Mechanics of river mouth bar formation: Implications for the morphodynamics of delta distributary networks, J Geophys Res-Earth, 112(F2).
Edmonds, D. A., and R. L. Slingerland (2010), Significant effect of sediment cohesion on delta morphology, Nat Geosci, 3(2), 105-109.
Edmonds, D. A., R. Slingerland, J. Best, D. Parsons, and N. Smith (2010), Response of river-dominated delta channel networks to permanent changes in river discharge, Geophysical Research Letters, 37(12).
Fagherazzi, S. (2008), Self-organization of tidal deltas, Proceedings of the National Academy of Sciences of the United States of America, 105(48), 18692-18695.
Fagherazzi, S., and I. Overeem (2007), Models of deltaic and inner continental shelf landform evolution, Annual Review of Earth and Planetary Sciences, 35, 685-715.
Falcini, F., and D. J. Jerolmack (2010), A potential vorticity theory for the formation of elongate channels in river deltas and lakes, Journal of Geophysical Research, 115(F4), F04038.
60
Fedele, J. J., and C. Paola (2007), Similarity solutions for fluvial sediment fining by selective deposition, Journal of Geophysical Research, 112(F2), 0-F02038.
Ferguson, R., T. Hoey, S. Wathen, and A. Werritty (1996), Field evidence for rapid downstream fining of river gravels through selective transport, Geology, 24(2), 179-182.
Folk, R. L. (1974), Petrology of sedimentary rocks, Hemphill Pub. Comp., Austin, Texas, United States (USA).
Galloway, W. E. (1975), Process framework for describing the morphologic and stratigraphic evolution of deltaic depositional systems, Houston Geol. Soc., Houston, Texas, United States (USA).
Geleynse, N., J. E. A. Storms, M. J. F. Stive, H. R. A. Jagers, and D. J. R. Walstra (2010), Modeling of a mixed-load fluvio-deltaic system, Geophysical Research Letters, 37(05).
Geleynse, N., J. E. A. Storms, D. J. R. Walstra, H. R. A. Jagers, Z. B. Wang, and M. J. F. Stive (2011), Controls on river delta formation; insights from numerical modelling, Earth Planet Sc Lett, 302(1-2), 217-226.
Hajek, E. A., S. V. Huzurbazar, D. Mohrig, R. M. Lynds, and P. L. Heller (2010), Statistical characterization of grain-size distributions in sandy fluvial systems, J Sediment Res, 80(2), 184-192.
Heller, P. L., and C. Paola (1996), Downstream changes in alluvial architecture: An exploration of controls on channel-stacking patterns, J Sediment Res, 66(2), 297-306.
Hooke, R. L., and W. L. Rohrer (1979), Geometry of alluvial fans; effect of discharge and sediment size, Earth Surface Processes, 4(2), 147-166.
Hoyal, D. C. J. D., and B. A. Sheets (2009), Morphodynamic evolution of experimental cohesive deltas, Journal of Geophysical Research, 114(F2), 0-Citation F02009.
Hu, K., P. Ding, Z. Wang, and S. Yang (2009), A 2D/3D hydrodynamic and sediment transport model for the Yangtze Estuary, China, Journal of Marine Systems, 77(1), 114-136.
Ikeda, S. (1982), Incipient motion of sand particles on side slopes, Journal of the Hydraulics Division, 108(HY1), 95-114.
Jerolmack, D. J. (2009), Conceptual framework for assessing the response of delta channel networks to Holocene sea-level rise, Quaternary Science Reviews, 28(17-18), 1786-1800.
61
Jerolmack, D. J., and J. B. Swenson (2007), Scaling relationships and evolution of distributary networks on wave-influenced deltas, Geophysical Research Letters, 34(23), L23402.
Jerolmack, D. J., and D. Mohrig (2007), Conditions for branching in depositional rivers, Geology, 35(5), 463-466.
Kim, W., A. Dai, T. Muto, and G. Parker (2009), Delta progradation driven by an advancing sediment source: Coupled theory and experiment describing the evolution of elongated deltas, Water Resources Research, 45(6), W06428.
Lesser, G. R., J. A. Roelvink, J. A. T. M. van Kester, and G. S. Stelling (2004), Development and validation of a three-dimensional morphological model, Coastal Engineering, 51(8-9), 883-915.
Makaske, B. (2001), Anastomosing rivers: a review of their classification, origin and sedimentary products, Earth-Science Reviews, 53(3), 149-196.
Marciano, R., Z. B. Wang, A. Hibma, H. J. de Vriend, and A. Defina (2005), Modeling of channel patterns in short tidal basins, Journal of Geophysical Research, 110(F1), 13-13.
Martin, J., B. Sheets, C. Paola, and D. Hoyal (2009), Influence of steady base-level rise on channel mobility, shoreline migration, and scaling properties of a cohesive experimental delta, Journal of Geophysical Research, 114(F3), 0-Citation F03017.
McPherson, J. G., G. Shanmugam, and R. J. Moiola (1987), Fan-deltas and braid deltas; varieties of coarse-grained deltas, Geol Soc Am Bull, 99(3), 331-340.
Milliman, J. D., and J. P. M. Syvitski (1992), Geomorphic/tectonic control of sediment discharge to the ocean: the importance of small mountainous rivers, The Journal of Geology, 525-544.
Mohrig, D., P. L. Heller, C. Paola, and W. J. Lyons (2000), Interpreting avulsion process from ancient alluvial sequences: Guadalope-Matarranya system (northern Spain) and Wasatch Formation (western Colorado), Geol Soc Am Bull, 112(12), 1787-1803.
Mulder, T., and J. P. Syvitski (1995), Turbidity currents generated at river mouths during exceptional discharges to the world oceans, The Journal of Geology, 285-299.
Nardin, W., and S. Fagherazzi (2012), The effect of wind waves on the development of river mouth bars, Geophysical Research Letters, 39(12), L12607.
Orton, G. J., and H. G. Reading (1993), Variability of Deltaic Processes in Terms of Sediment Supply, with Particular Emphasis on Grain-Size, Sedimentology, 40(3), 475-512.
62
Partheniades, E. (1965), Erosion and deposition of cohesive soils, Journal of the Hydraulics Division, ASCE, 91(1), 105-139.
Postma, G. (1990), Depositional architecture and facies of river and fan deltas; a synthesis, Special Publication of the International Association of Sedimentologists, 10, 13-27.
Rice, S. (1999), The nature and controls on downstream fining within sedimentary links, J Sediment Res, 69(1), 32-39.
Rowland, J. C., W. E. Dietrich, and M. T. Stacey (2010), Morphodynamics of subaqueous levee formation: Insights into river mouth morphologies arising from experiments, Journal of Geophysical Research, 115(F4), F04007.
Shaw, J. B., M. A. Wolinsky, C. Paola, and V. R. Voller (2008), An image-based method for shoreline mapping on complex coasts, Geophysical Research Letters, 35(12), L12405.
Slingerland, R., and N. D. Smith (2004), River avulsions and their deposits, Annu. Rev. Earth Planet. Sci., 32, 257-285.
Syvitski, J. P. M., and J. D. Milliman (2007), Geology, Geography, and Humans Battle for Dominance over the Delivery of Fluvial Sediment to the Coastal Ocean, The Journal of Geology, 115(1), 1-19.
Syvitski, J. P. M., and Y. Saito (2007), Morphodynamics of deltas under the influence of humans, Global and Planetary Change, 57(3-4), 261-282.
Taylor, J. R. (1997), An introduction to error analysis, 327 pp., Univ. Sci. Books, Sausalito, California, United States (USA).
Törnqvist, T. E., and J. S. Bridge (2002), Spatial variation of overbank aggradation rate and its influence on avulsion frequency, Sedimentology, 49(5), 891-905.
van Maren, D. S. (2007), Grain size and sediment concentration effects on channel patterns of silt-laden rivers, Sedimentary Geology, 202(1-2), 297-316.
van Maren, D. S., J. C. Winterwerp, B. S. Wu, and J. J. Zhou (2009), Modelling hyperconcentrated flow in the Yellow River, Earth Surface Processes and Landforms, 34(4), 596-612.
Van Rijn, L. C. (1993), Principles of sediment transport in rivers, estuaries and coastal seas, Aqua publications, Amsterdam.
Whipple, K. X., G. Parker, C. Paola, and D. Mohrig (1998), Channel Dynamics,
Sediment Transport, and the Slope of Alluvial Fans: Experimental Study, The Journal of Geology, 106(6), 677-694.