Embed Size (px)
Citation preview
PROCESS ANALYSIS TERMS
• Process: Is any part of an organization that takes inputs and transforms them into outputs.
• Cycle Time: Is the average successive time between completions of successive units.
• Utilization: Is the ratio of the time that a resource is actually activated relative to the time that it is available for use.
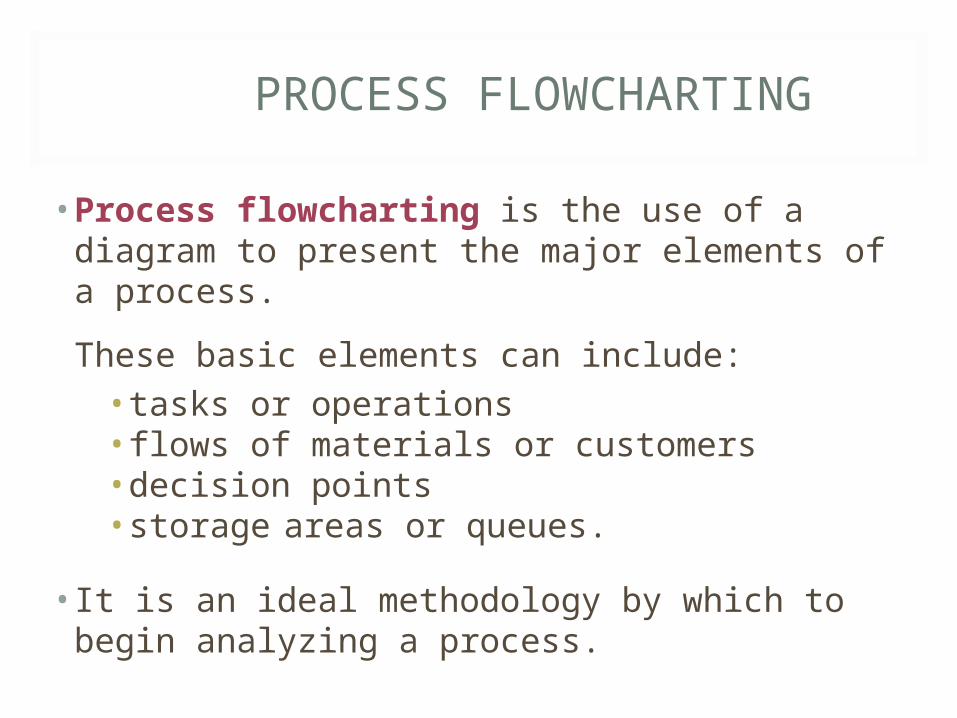
PROCESS FLOWCHARTING
• Process flowcharting is the use of a diagram to present the major elements of a process.These basic elements can include:
• tasks or operations• flows of materials or customers• decision points• storage areas or queues.
• It is an ideal methodology by which to begin analyzing a process.
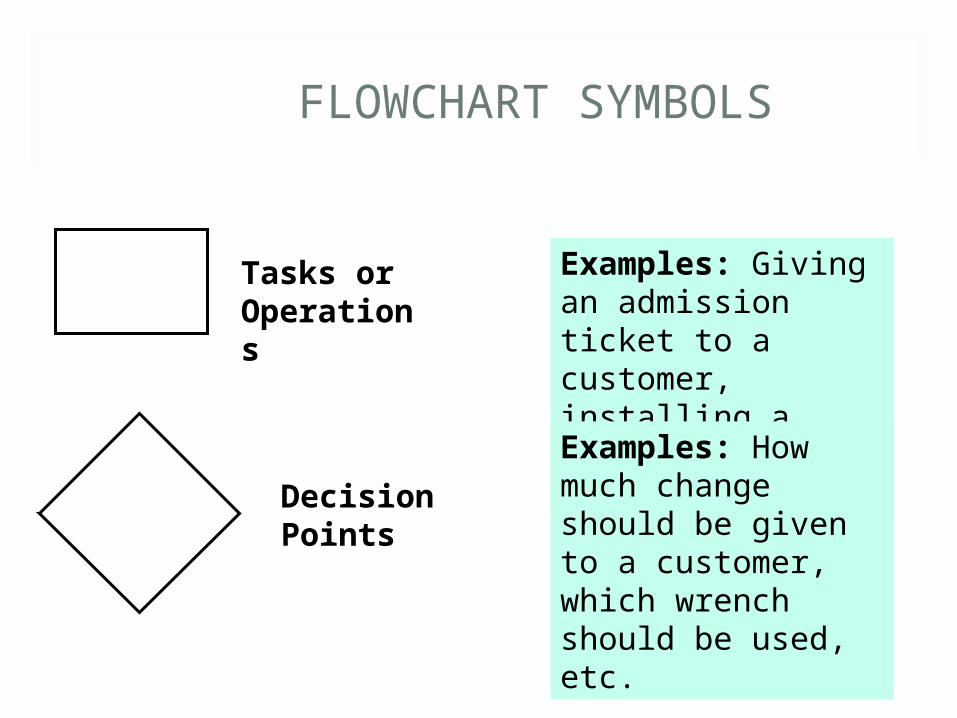
FLOWCHART SYMBOLS
Tasks or Operations
Examples: Giving an admission ticket to a customer, installing a engine in a car, etc.
Decision Points
Examples: How much change should be given to a customer, which wrench should be used, etc.
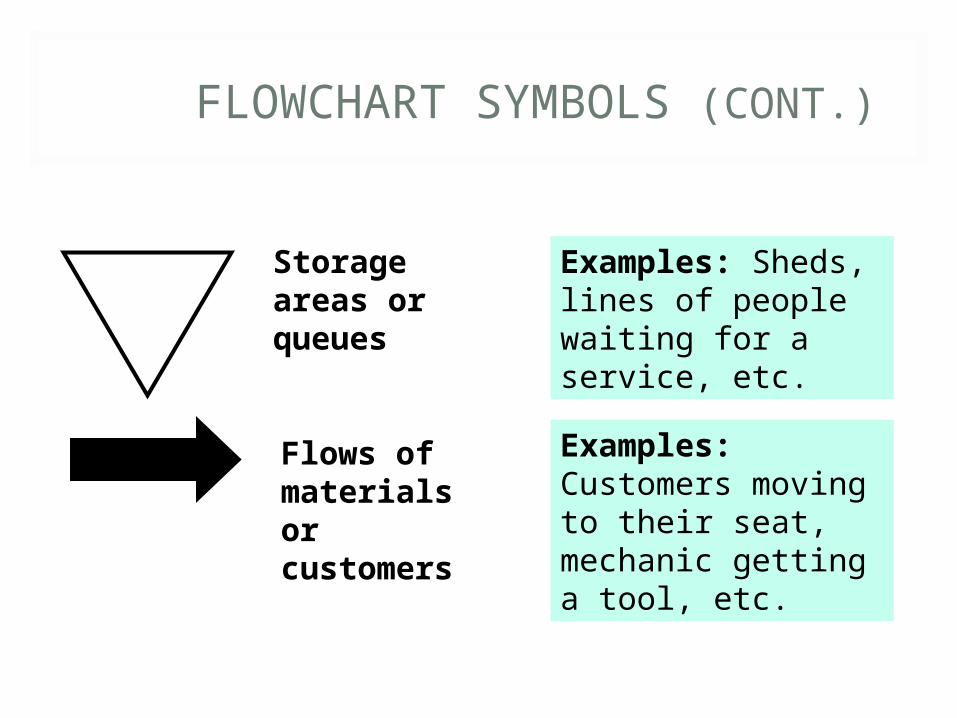
FLOWCHART SYMBOLS (CONT.)
Storage areas or queues
Examples: Sheds, lines of people waiting for a service, etc.
Flows of materials or customers
Examples: Customers moving to their seat, mechanic getting a tool, etc.
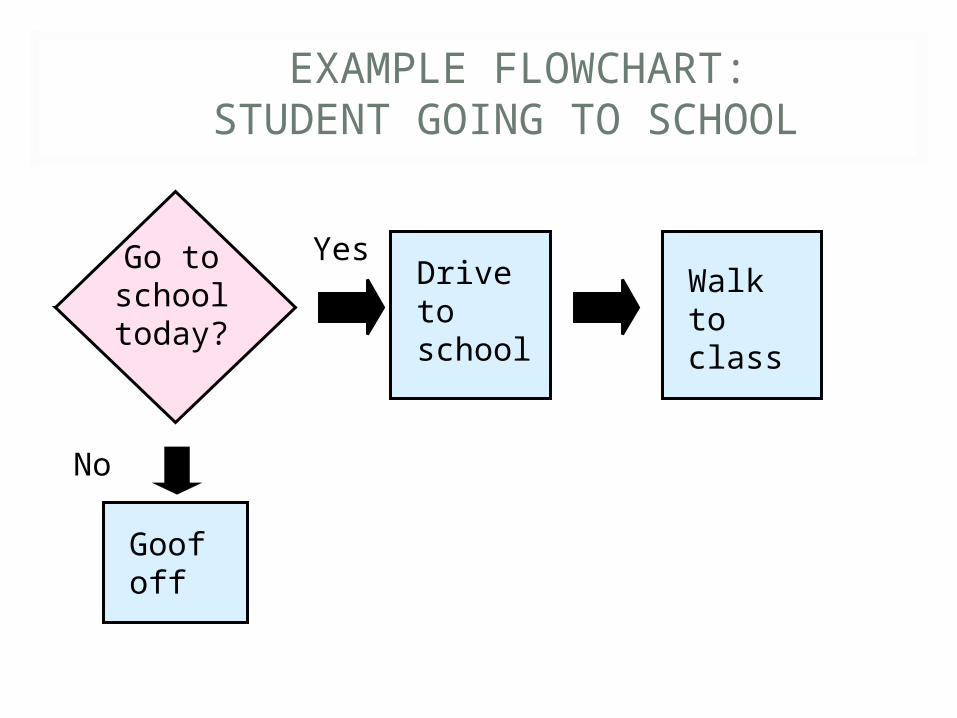
EXAMPLE FLOWCHART:STUDENT GOING TO SCHOOL
Yes
No
Goof off
Go to school today?
Walk to class
Drive to school
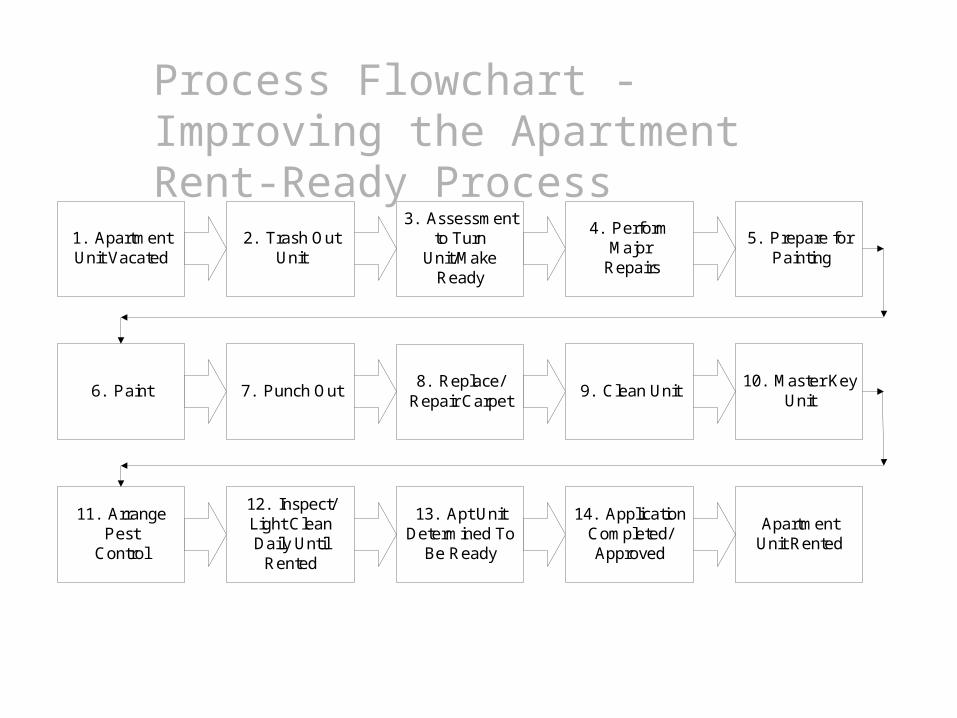
1. ApartmentUnit Vacated
2. Trash OutUnit
3. Assessmentto Turn
Unit/MakeReady
4. PerformMajor
Repairs
5. Prepare for Painting
6. Paint 7. Punch Out 8. Replace/Repair Carpet 9. Clean Unit 10. Master Key
Unit
11. ArrangePest
Control
12. Inspect/Light CleanDaily Until
Rented
13. Apt UnitDetermined To
Be Ready
14. ApplicationCompleted/Approved
ApartmentUnit Rented
Process Flowchart - Improving the Apartment Rent-Ready Process
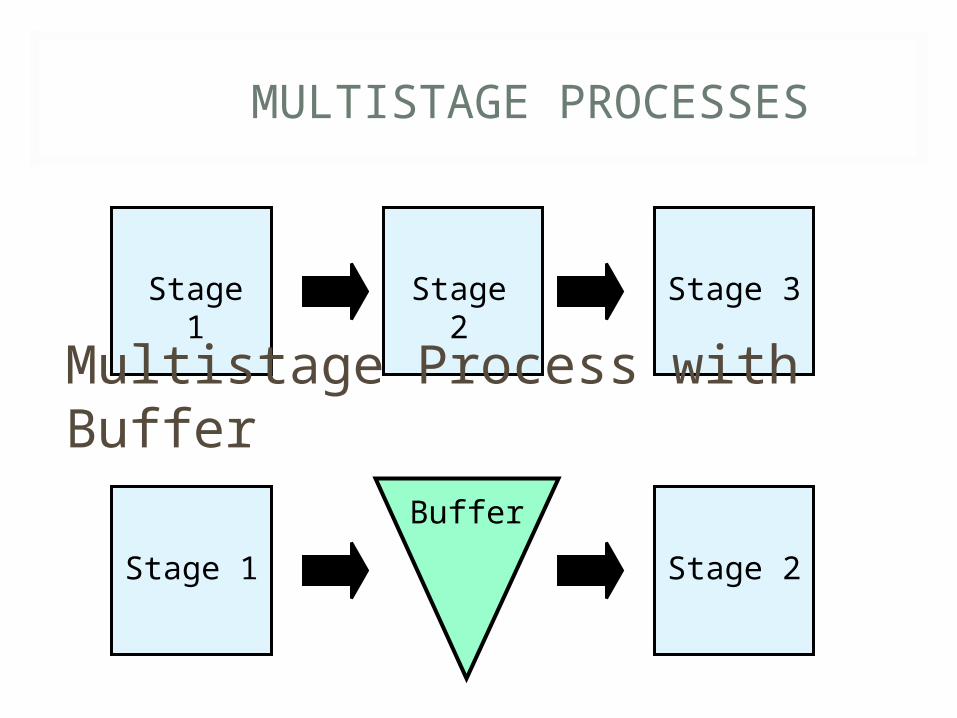
MULTISTAGE PROCESSES
Stage 1 Stage 2 Stage 3
Multistage Process with Buffer
Stage 1 Stage 2
Buffer
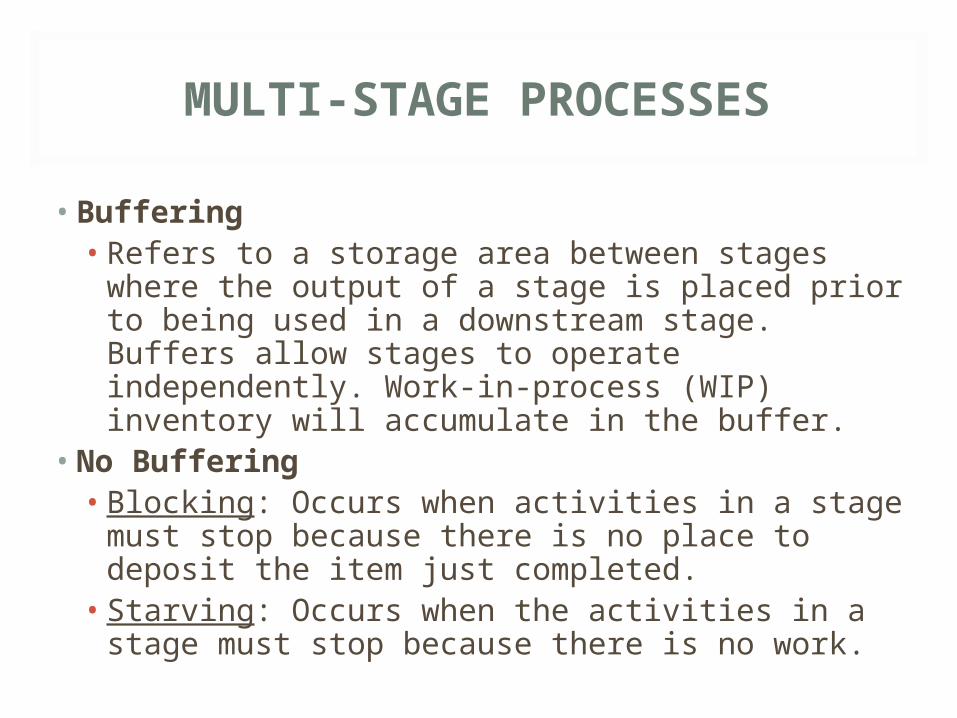
MULTI-STAGE PROCESSES
• Buffering• Refers to a storage area between stages where
the output of a stage is placed prior to being used in a downstream stage. Buffers allow stages to operate independently. Work-in-process (WIP) inventory will accumulate in the buffer.
• No Buffering• Blocking: Occurs when activities in a stage must
stop because there is no place to deposit the item just completed.
• Starving: Occurs when the activities in a stage must stop because there is no work.
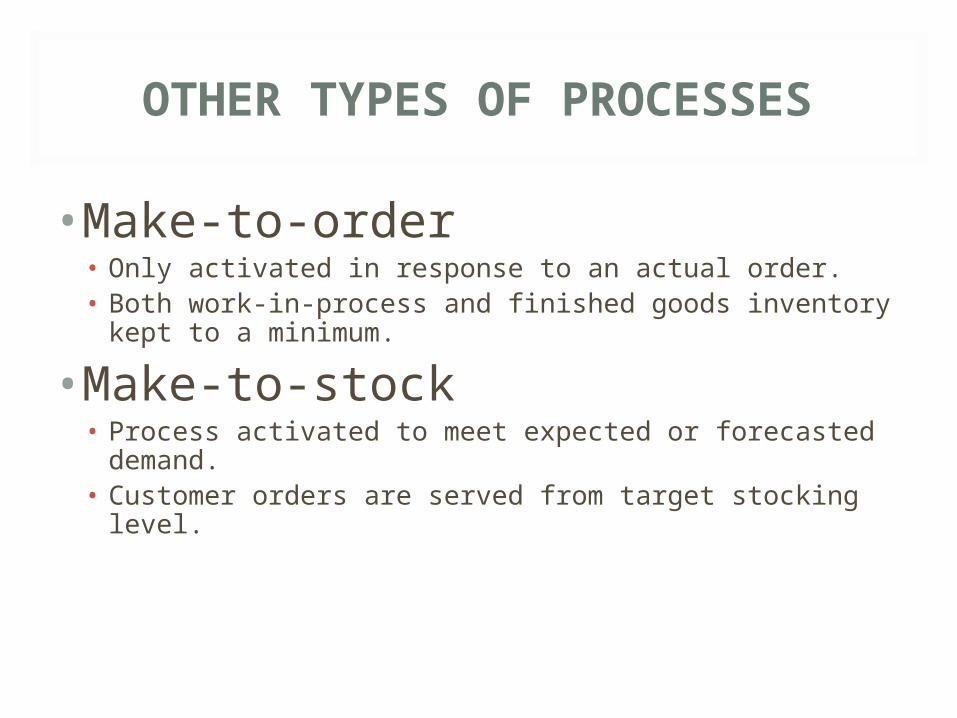
OTHER TYPES OF PROCESSES
• Make-to-order• Only activated in response to an actual order.• Both work-in-process and finished goods inventory kept to a
minimum.
• Make-to-stock• Process activated to meet expected or forecasted demand.• Customer orders are served from target stocking level.
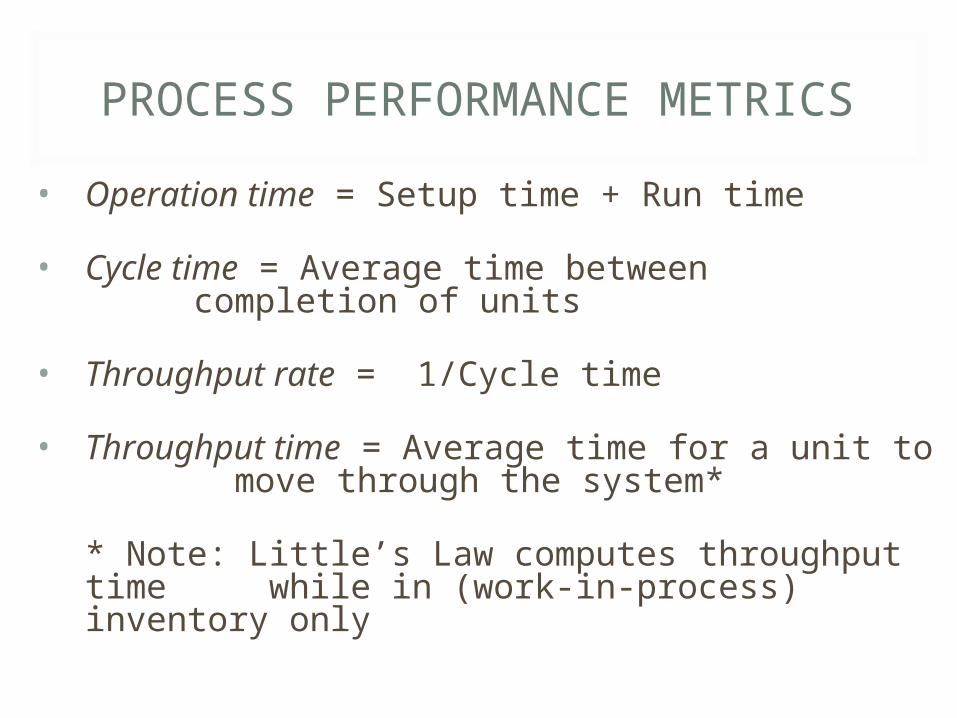
PROCESS PERFORMANCE METRICS• Operation time = Setup time + Run time• Cycle time = Average time between
completion of units• Throughput rate = 1/Cycle time• Throughput time = Average time for a unit to
move through the system*
* Note: Little’s Law computes throughput time while in (work-in-process) inventory only
CYCLE TIME EXAMPLE
Suppose you had to produce 600 units in 80 hours to meet the demand requirements of a product.
What is the cycle time to meet this demand requirement?
BREAD-MAKING OPERATION
•See pp. 113-114 (102-104 in old text). For homework, construct a table, showing the amount baked, amount packed, and WIP for each hour of the day (3 eight hour shifts).
•Calculate the Throughput Time in WIP Inventory using Little’s Law; then calculate the Total Throughput Time by adding the time in WIP inventory to the baking and packing times.