Embed Size (px)
Citation preview
Process analysis of an in store production of knitted clothing
D Buecher1, M Kemper1, B Schmenk1, Y-S Gloy1 and T Gries1
1RWTH Aachen University, Faculty of Mechanical Engineering, Institut fuer Textiltechnik,Otto-Blumenthal-Str. 1, 52074 Aachen, Germany
Email: [email protected]
Abstract In the textile and clothing industry, global value-added networks are widespread fortextile and clothing production. As a result of global networking, the value chain is fragmentedand a great deal of effort is required to coordinate the production processes [1]. In addition, theplanning effort on the quantity and design of the goods is high and risky. Today the fashionindustry is facing an increasing customer demand for individual and customizable products inaddition to short delivery times [2]. These challenges are passed down to the textile andclothing industry decreasing batch sizes and production times. Conventional clothingproduction cannot fulfill those demands especially when combined with more and moreindividual or customizable designs. Hence new production concepts have to be developed.
1. IntroductionThe target of every company is to satisfy customer demands. Especially the clothing industry has toserve individual customer requirements. Textile products always have been and still are the definingattributes of people’s appearance. Consumer’s demands towards commercial clothing companies havebeen changing rapidly during the recent years. Two global megatrends have supported this change:Individualization and digitalization. Individualization created demand for frequent collection changes,while still keeping availability high. Digitalization supported the quick distribution of new trends andforced a higher amount of request during peak periods [3].
Both developments represent a special challenge for the complexity management of global clothingcompanies. Frequent collection changes have to be managed by supply chain management (SCM).SCM needs to coordinate a growing number of products and suppliers on a global scale. Thedevelopment of automation in the textile industry has offered alternatives to the distress of growingcomplexity. Due to the increasing share of intelligent systems within the process chain, textilemanufacturers are able to reduce the impact of labor costs. In reaction to the reduced share of laborcosts new locations for production facilities have been enabled. Even a production in high-wagecountries like Germany and the United States has become imaginable.
In order to evaluate the benefit of agile and flexible production systems a comprehensive must befound and reasonably applied on new and existing production designs.This work evaluates different production systems for the textile industry regarding defined targetvalues of production. In collaboration with the adidas AG, Herzogenaurach, Germany, two productionprocesses have been defined which build the foundation for a textile process analysis method. Theresults can be used to make decisions on future production systems.
2. Concept description and requirementsAim of the STOREFACTORY project is the development of an in-store fashion production. Flatknitting is chosen as the main production process, as it offers the possibility to produce clothing
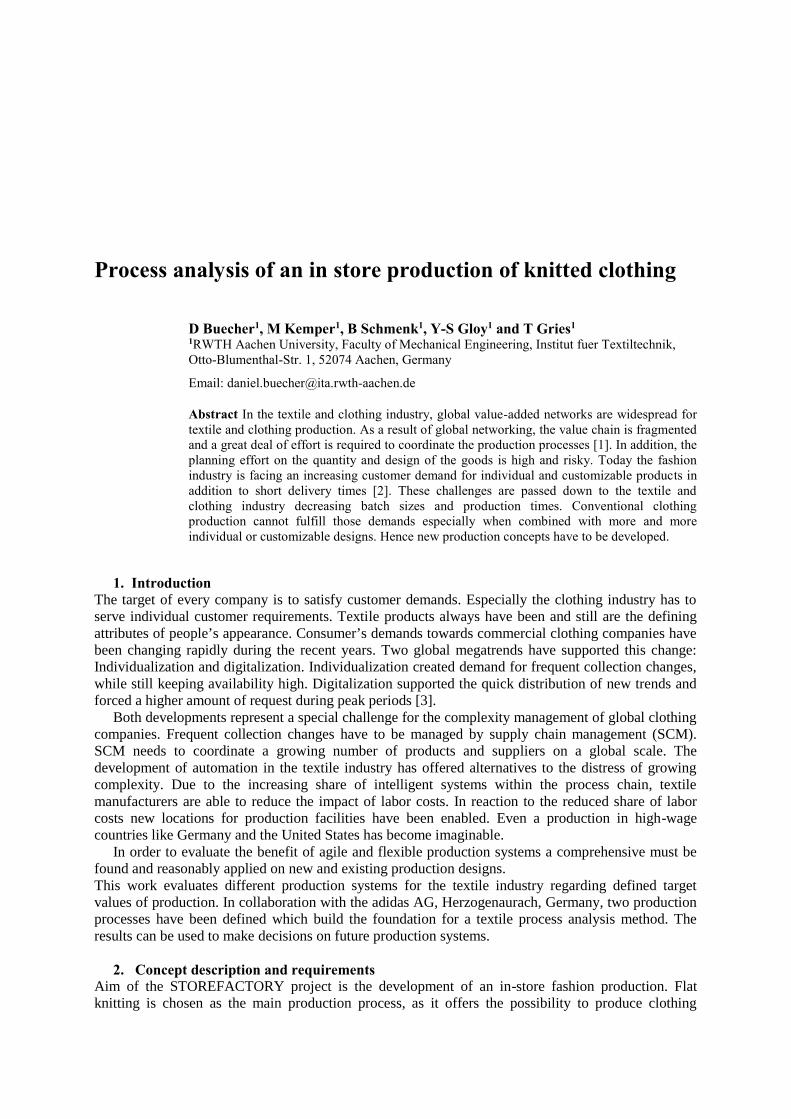
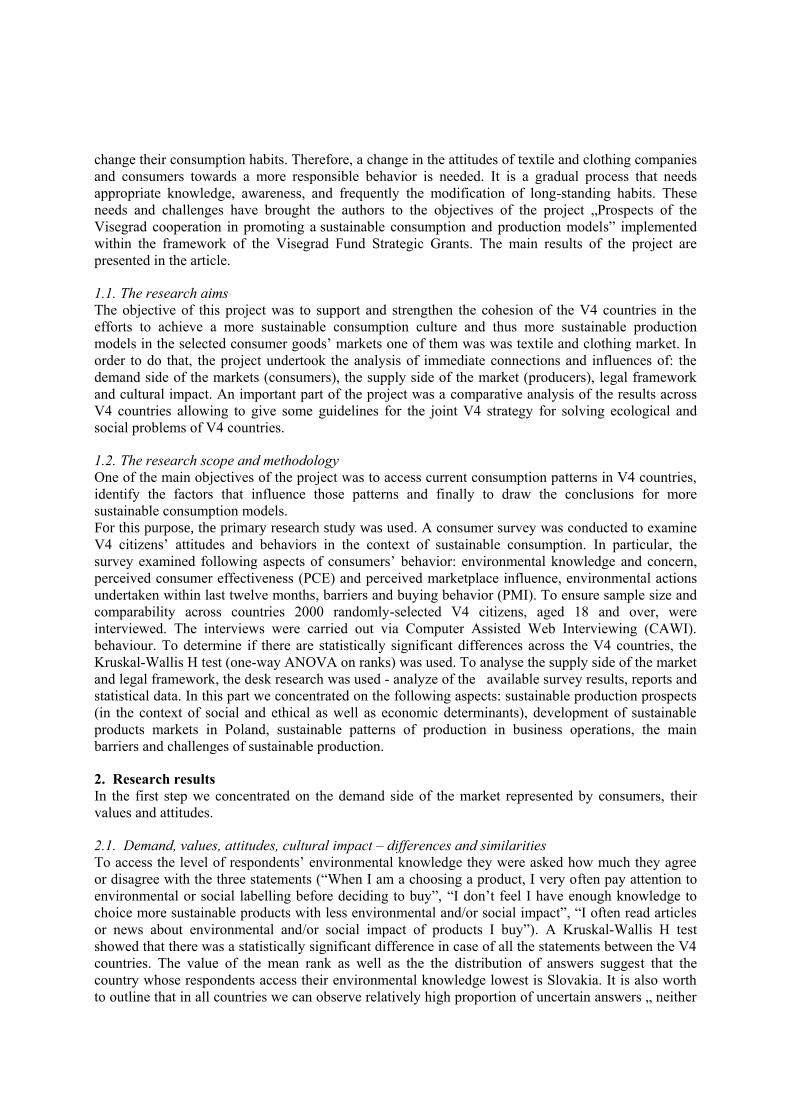
without using joining technics, which is often referred as knit2wear production. As the fashion producta knitted sweater is selected [4].The in-store user-experience consists of a body scanner and design stations, where the customercreates their individual fashion products. These processes are supported by a software-system, whichtransfers the individual body-measurements and the design into the necessary machine data. Theproduction itself takes place on three flat-knitting-machines followed by thermosetting as well asfinishing equipment for the statutory labeling. Figure 1 outlines the customer experience in thedeveloped concept.Using the body scanner, the metric data of the customer is measured. The measurements guarantee ahighly individual perfect fit. The metric data then is used in the design station, where the customer candesign the patterning and coloring of his product. The colors are limited to the equipped colors on theknitting machines available. One machine can be equipped with up to three different colors, which canbe combined in different proportions. When the customer is satisfied with his customization, thedesign is transferred to the knitting machine with help of the converter unit. The converter unit notonly takes into account the shrinkage, but also converts the metric data into machine-data.
Figure 1. Storefactory customer jorney
The methodology needs to include a range of target variables, including companies’ targets ofmaximized profit, customer satisfaction, etc. A proper evaluation method and visualizing productionprocesses is based on the principle of the value stream. This model has been designed to identifydifferent types of waste within defined production segments: transportation, inventory, motion,waiting, over-processing, over-production and defects. This method captures the comprehensiveprocess of the production and visualizes and rates processes as well as the physical flow. [5, 6]The analysis is started by detecting the value stream along the production chain. The process steps areseparated into value adding, non-value adding and information processes. Value adding means in thiscontext that the condition of the processed good is changed into a more valuable state. Value isdefined by the customer. The outcome of the process step will be valuable if the outcome provides a
benefit to the customer. Value adding processes in the textile production are for example: knitting,weaving, mercerizing, dyeing, etc. Non-value adding steps are transportation, waiting, over-production, etc. By evaluating the process steps, problems and constraints can be identified. Theidentification is supported by KPIs providing a quantitative rating on the current state of the process.The visual implementation of the value stream analysis is achieved with a graphic tool, called thevalue stream map. Value stream mapping consists of a visual qualitative and quantitative analysis. Thequalitative analysis is conducted by a value stream map. The analysis shows the structure of an entireproduction chain with flow of material, information, processes and process abilities. [7, 8]Within the project two scenarios were examined. The conventionally product produced in SoutheastAsia, is starting with the order from a marketing division, which is processed into a yarn order by thegarment producer. After the yarn has arrived the garment is produced and shipped back to the finaldestination market.The in-store production starts as described with the measurement and the design selection of thecustomer, who is then giving the final production order. The customer data on design and size istranslated by a manufacturing execution system into a machine readable code. The knitting machinesread the code and produce the textile as one piece. Afterwards it is finished during several finishingsteps.
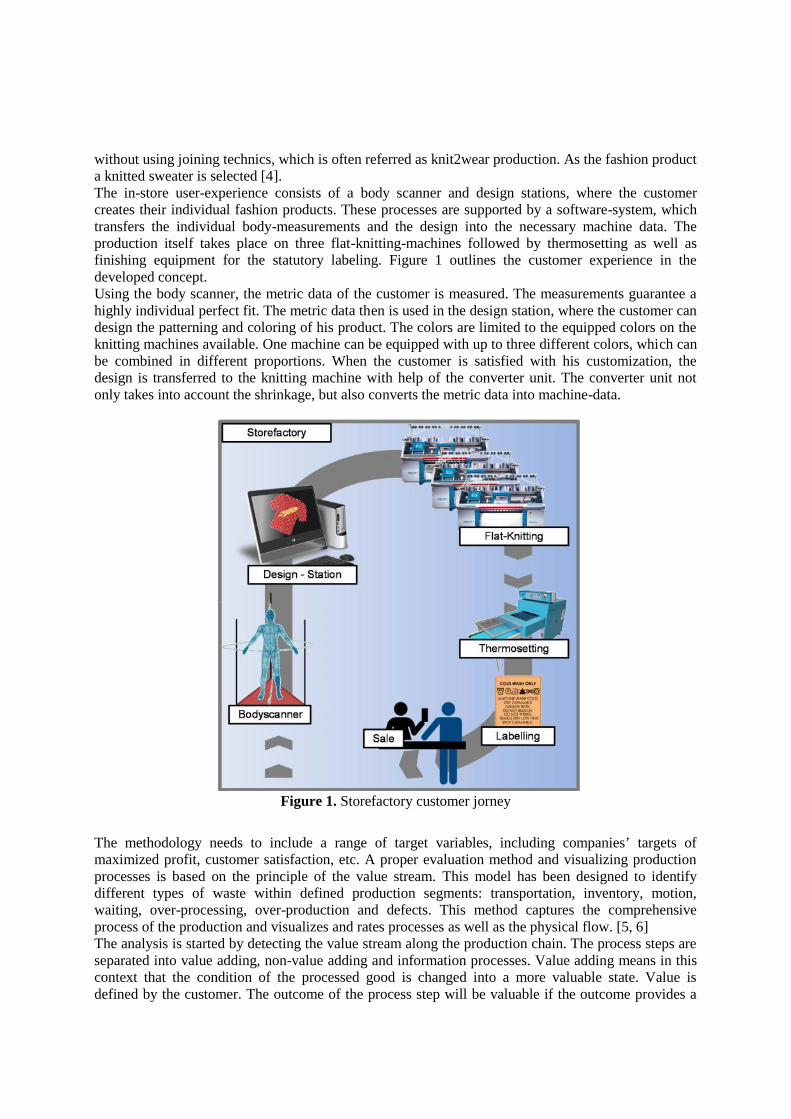
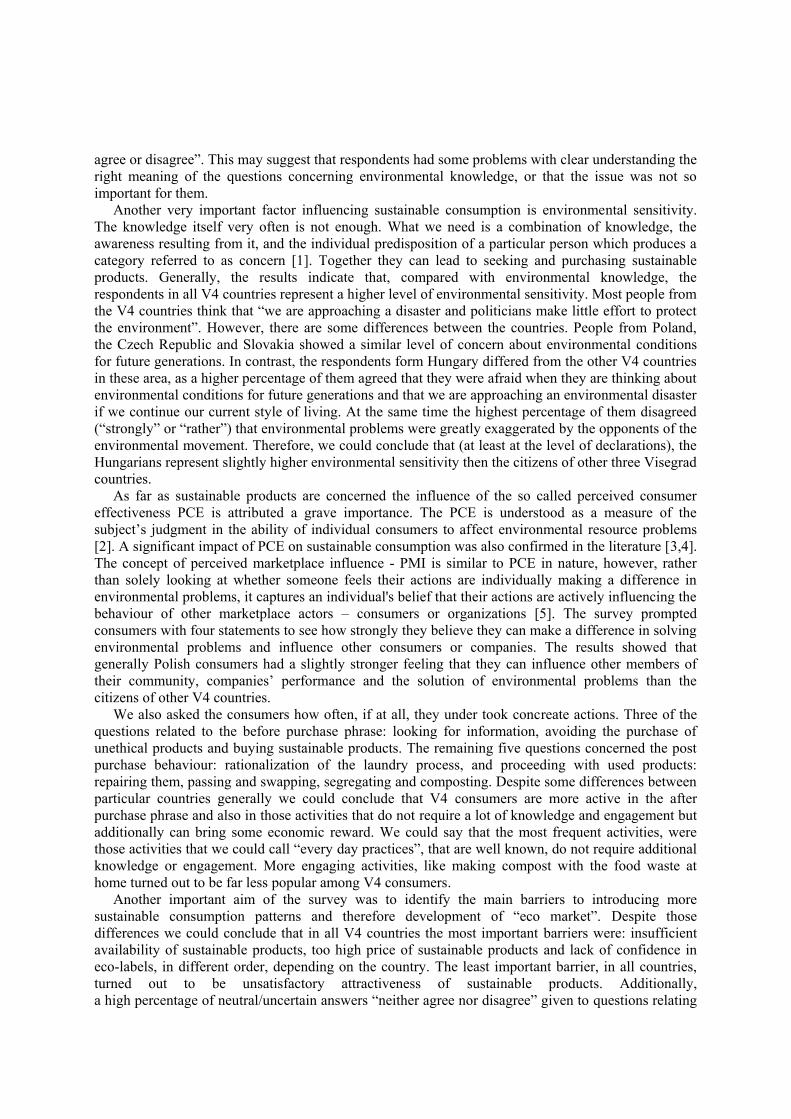
3. FindingsThe production in-store is located close to the customer. Assumptions and expert interviews indicatethat in-store production is more costly than the conventional process, so the profit is lower. Theinfluence of the customer distance of conventional and in-store production is visualized in Figure 2 onthe order penetration point (OPP). When facing different customer demands, the production structureshave to change as well. The OPP in the work process also defines the type of order processing andaffects the manufacturing form. The OPP defines the point of time the order is being processed withspecific customer relation.
Figure 2. Order penetration points for the in-store and the conventional production
In the conventional process a product is manufactured on stock and independent to the customer. Mostof the work progress is already completed. The finished work process results in delivery timestechnically close to zero minutes after the customer order because the product is instantly available.
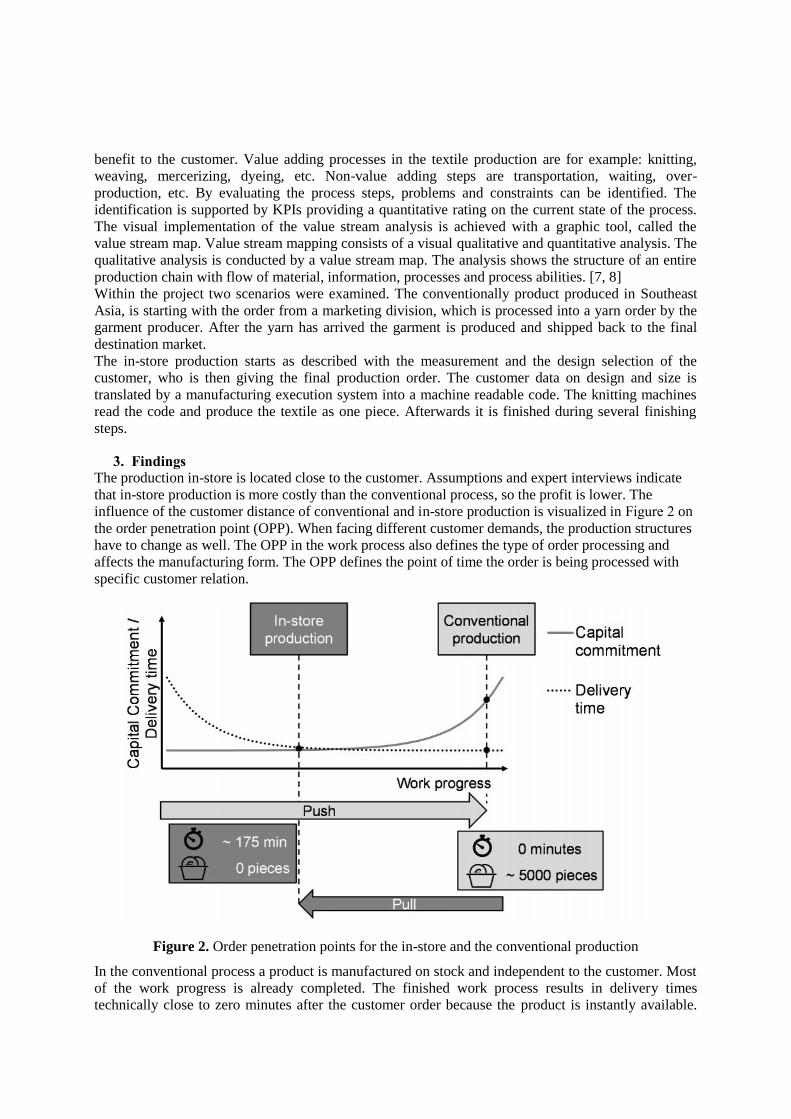
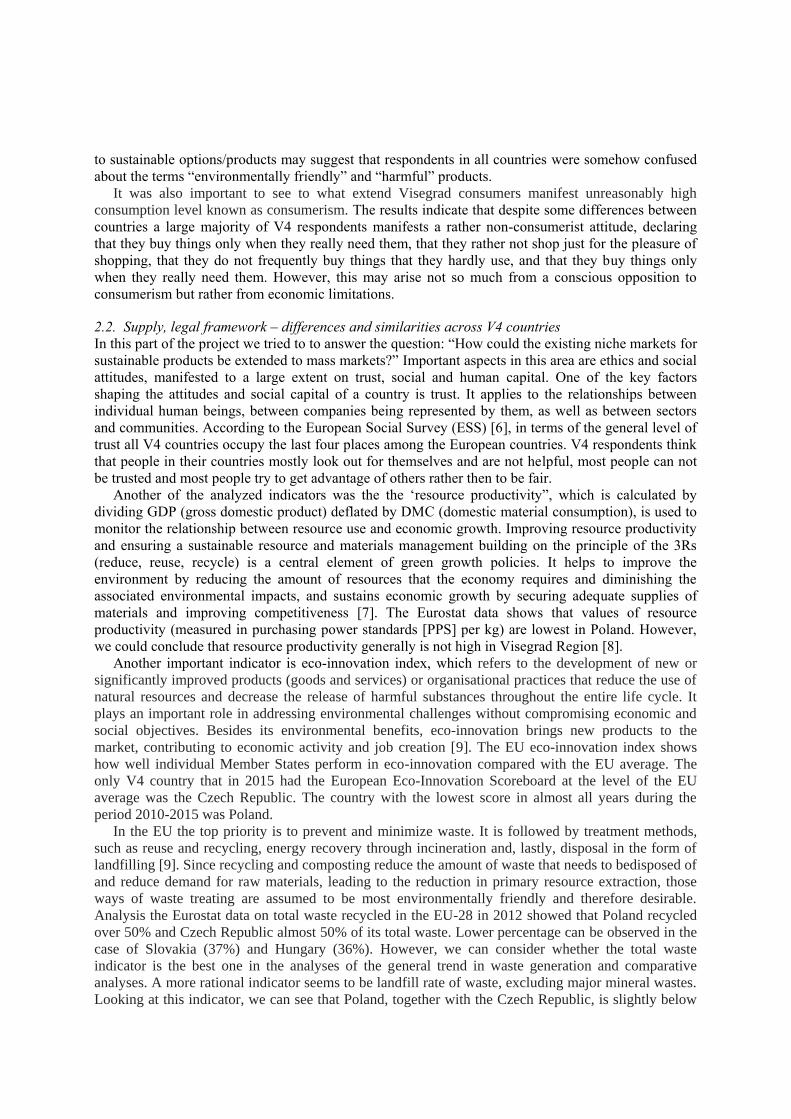
Guidelines support the build-up of capital in form of warehouse inventory. Sometimes the product isnot sold directly after arrival in the designated country. The order amount is based on forecasts. If theforecast is wrong, the product won’t be sold for the calculated price.This results in an actual risk that the product will not be sold for the originally estimated price becausethere may not be an actual demand later. In this case, the product has to be sold with a reduced price.The value stream analysis shows the differences in production lead time of two knitted products. Bothprocesses have the same starting and ending activity, beginning with the customer order and thecustomer delivery. For the conventional production, the whole process takes about 289 day. Howeverthe in-store production all in all takes about 175 minutes. Both cycle times are visualized in Figure 3.
Figure 3. Lead time comparison between conventional and storefactory production
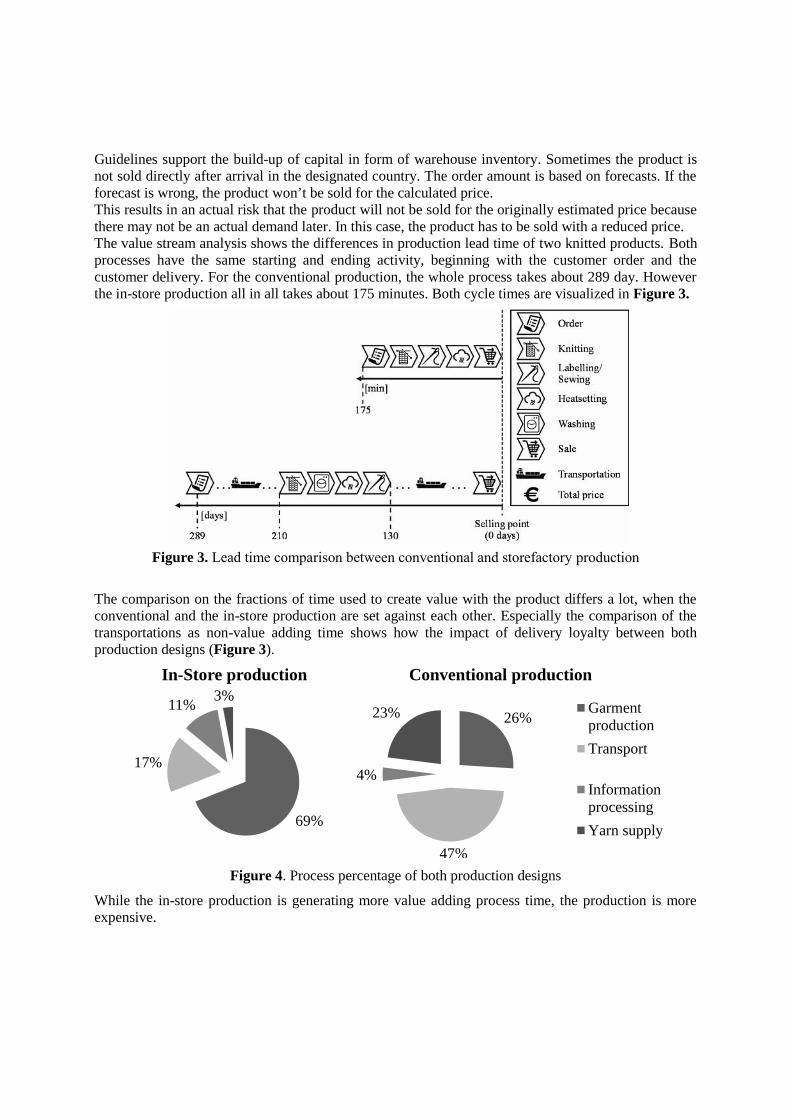
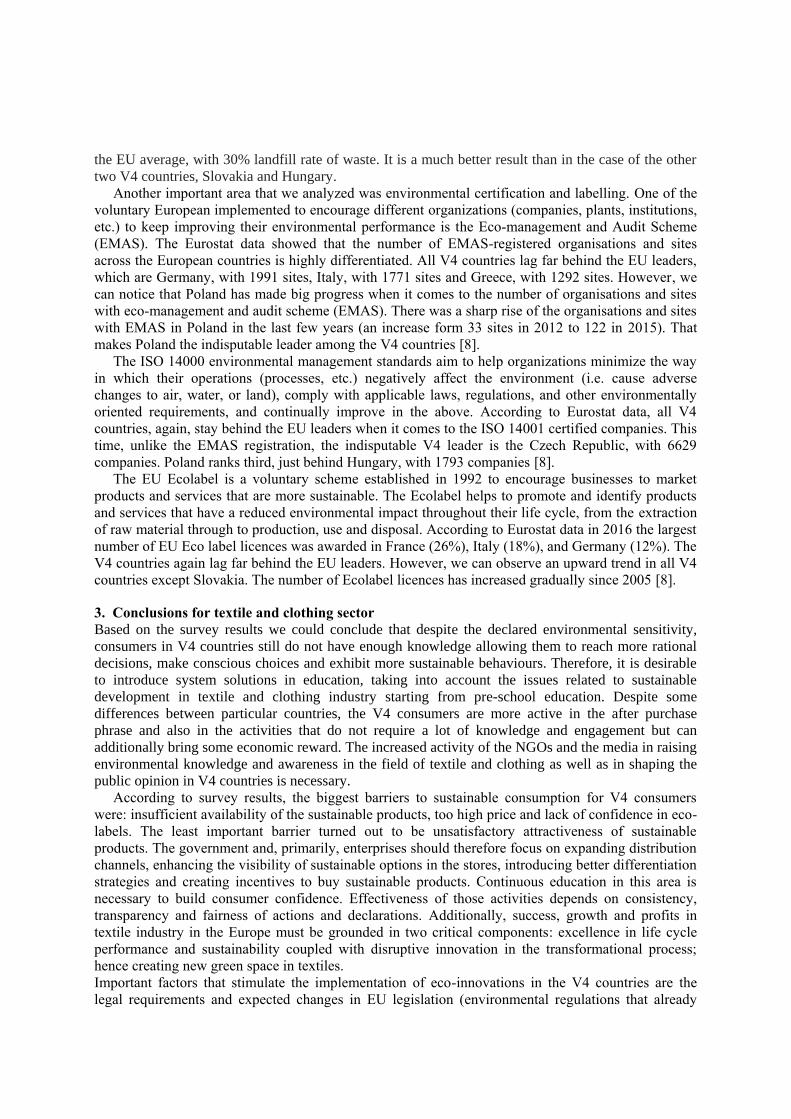
The comparison on the fractions of time used to create value with the product differs a lot, when theconventional and the in-store production are set against each other. Especially the comparison of thetransportations as non-value adding time shows how the impact of delivery loyalty between bothproduction designs (Figure 3).
Figure 4. Process percentage of both production designs
While the in-store production is generating more value adding process time, the production is moreexpensive.
69%
17%
11% 3%In-Store production
26%
47%
4%
23%
Conventional production
GarmentproductionTransport
InformationprocessingYarn supply
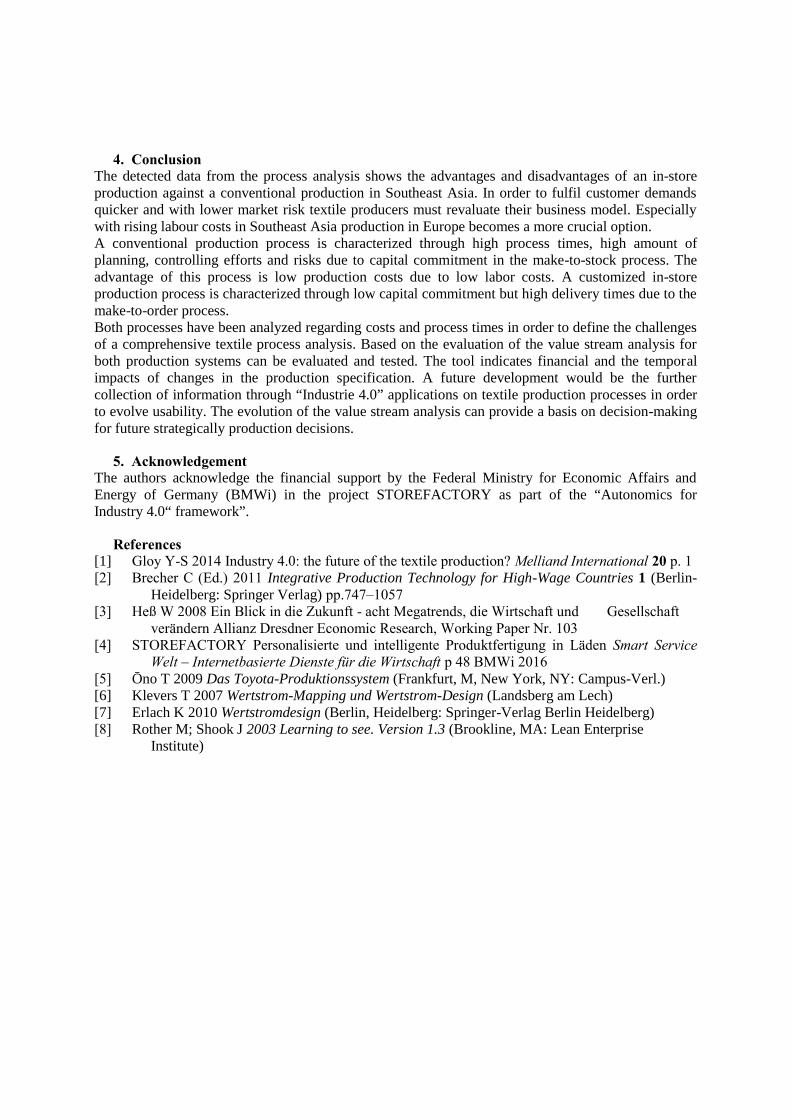
4. ConclusionThe detected data from the process analysis shows the advantages and disadvantages of an in-storeproduction against a conventional production in Southeast Asia. In order to fulfil customer demandsquicker and with lower market risk textile producers must revaluate their business model. Especiallywith rising labour costs in Southeast Asia production in Europe becomes a more crucial option.A conventional production process is characterized through high process times, high amount ofplanning, controlling efforts and risks due to capital commitment in the make-to-stock process. Theadvantage of this process is low production costs due to low labor costs. A customized in-storeproduction process is characterized through low capital commitment but high delivery times due to themake-to-order process.Both processes have been analyzed regarding costs and process times in order to define the challengesof a comprehensive textile process analysis. Based on the evaluation of the value stream analysis forboth production systems can be evaluated and tested. The tool indicates financial and the temporalimpacts of changes in the production specification. A future development would be the furthercollection of information through “Industrie 4.0” applications on textile production processes in orderto evolve usability. The evolution of the value stream analysis can provide a basis on decision-makingfor future strategically production decisions.
5. AcknowledgementThe authors acknowledge the financial support by the Federal Ministry for Economic Affairs andEnergy of Germany (BMWi) in the project STOREFACTORY as part of the “Autonomics forIndustry 4.0“ framework”.
References[1] Gloy Y-S 2014 Industry 4.0: the future of the textile production? Melliand International 20 p. 1[2] Brecher C (Ed.) 2011 Integrative Production Technology for High-Wage Countries 1 (Berlin-
Heidelberg: Springer Verlag) pp.747–1057[3] Heß W 2008 Ein Blick in die Zukunft - acht Megatrends, die Wirtschaft und Gesellschaft
verändern Allianz Dresdner Economic Research, Working Paper Nr. 103[4] STOREFACTORY Personalisierte und intelligente Produktfertigung in Läden Smart Service
Welt – Internetbasierte Dienste für die Wirtschaft p 48 BMWi 2016[5] Ōno T 2009 Das Toyota-Produktionssystem (Frankfurt, M, New York, NY: Campus-Verl.)[6] Klevers T 2007 Wertstrom-Mapping und Wertstrom-Design (Landsberg am Lech)[7] Erlach K 2010 Wertstromdesign (Berlin, Heidelberg: Springer-Verlag Berlin Heidelberg)[8] Rother M; Shook J 2003 Learning to see. Version 1.3 (Brookline, MA: Lean Enterprise
Institute)
The future of textile production in high wage countries
M Kemper1, Y-S Gloy
1 and T Gries
1
1Institut für Textiltechnik der RWTH Aachen University (ITA) Aachen,
Otto- Blumenthal-Str.1, 52074 Aachen, Germany
E-mail: [email protected]
Abstract. It is undisputed that smart production in the context of industry 4.0 offers significant
potential for industrial production in Germany. Exploiting this potential provides an
opportunity to meet the growing competitive pressure for textile production in high-wage
Germany. The complete cross-linking of textile mills towards Textile Production 4.0 means
substantial savings. However, currently there are still some challenges that have to be
overcome on the long way to Textile Production 4.0. This paper initially reflects the particular
challenges of textile production in high-wage Germany. Later, the vision of the future of smart
textile production will be outlined. In addition, first pilot solutions and current research
approaches which pave the way for Textile Production 4.0 are described.
1. Challenges of textile production in high wage countries
Because of the low production costs, the textile production has been relocated to the Asian countries,
whereas the production of high-quality and technical textiles is progressively shifted to Europe [1].
The textile industry in high-wage countries is facing numerous challenges. For example, the tendency
to small lot sizes requires shorter cycle times and aggravates the economical production of goods [2].
The use of Industry 4.0 in textile machinery and textile production has been examined at the Institute
of Textile Technology at RWTH Aachen University [3]. The study on German textile machinery
manufacturers and textile producers shows that terms such as Industry 4.0, cyber-physical system or
Smart Factory are not yet sufficiently known. The challenges regarding Industry 4.0 also include:
standardization, process and work organization, protection of know-how, availability of technology
and shortage of skilled workers. Important preconditions for the successful implementation of Industry
4.0 require information gathering, testing technologies, convincing decision-makers in the company
and, ultimately, the ability to raise capital [4].
Another challenge for textile production in high wage countries is the average return on sales of
around 2.5% [5]. The low profit margins make it difficult for textile producers to accumulate reserves
and thus indirectly force major investments. The companies are more focused on conventional
production methods and carefully invest in new technologies and developments. This way innovation
of textile machine manufacturers meets difficulties on the market, which in turn weakens the
innovative strength. Thus, textile production in high wage countries is caught in a vicious circle.
Looking at the overall industry environment in those countries, there is an increasing risk of being
superseded in terms of technological forefront.
Multi scaling and additive fabrication is a special problem of the textile process chain. The simple
way of the textile process chain is to make yarns out of fibers, yarns to surfaces, and textile surfaces to
complex textile products (see Figure 1). The whole creation of value of the process chain is rarely
done by only one company. Normally products are exchanged between companies for different
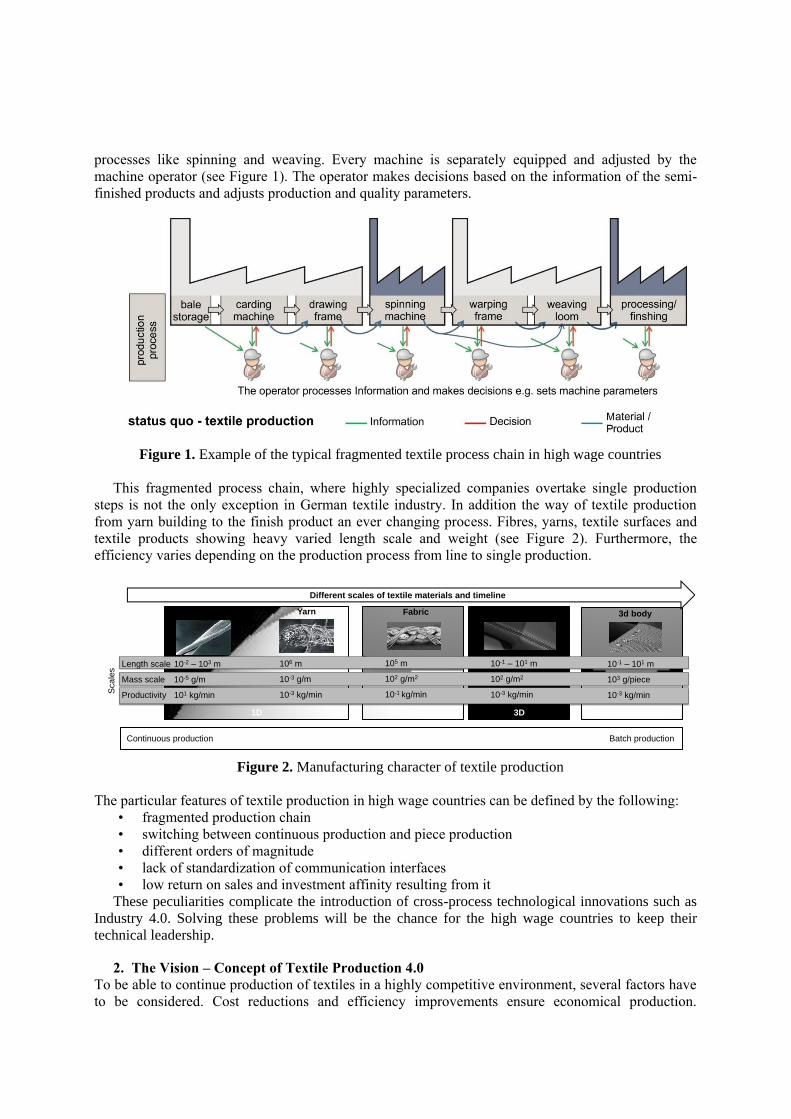
processes like spinning and weaving. Every machine is separately equipped and adjusted by the
machine operator (see Figure 1). The operator makes decisions based on the information of the semi-
finished products and adjusts production and quality parameters.
Figure 1. Example of the typical fragmented textile process chain in high wage countries
This fragmented process chain, where highly specialized companies overtake single production
steps is not the only exception in German textile industry. In addition the way of textile production
from yarn building to the finish product an ever changing process. Fibres, yarns, textile surfaces and
textile products showing heavy varied length scale and weight (see Figure 2). Furthermore, the
efficiency varies depending on the production process from line to single production.
Figure 2. Manufacturing character of textile production
The particular features of textile production in high wage countries can be defined by the following:
• fragmented production chain
• switching between continuous production and piece production
• different orders of magnitude
• lack of standardization of communication interfaces
• low return on sales and investment affinity resulting from it
These peculiarities complicate the introduction of cross-process technological innovations such as
Industry 4.0. Solving these problems will be the chance for the high wage countries to keep their
technical leadership.
2. The Vision – Concept of Textile Production 4.0
To be able to continue production of textiles in a highly competitive environment, several factors have
to be considered. Cost reductions and efficiency improvements ensure economical production.
3D with functions3D2D1D
10-2 – 103 m
10-5 g/m
101 kg/min
Fiber Yarn
106 m
10-3 g/m
10-3 kg/min
Fabric
105 m
102 g/m2
10-1 kg/min
3d body
10-1 – 101 m
102 g/m2
10-3 kg/min
Length scale
Mass scale
Productivity
Different scales of textile materials and timeline
3d body
10-1 – 101 m
103 g/piece
10-3 kg/min
Scale
s
Continuous production Batch production
However, the individual production processes are already highly automated. Hence it is pretty
expensive to archive cost reductions and higher efficiencies via technological enhancements.
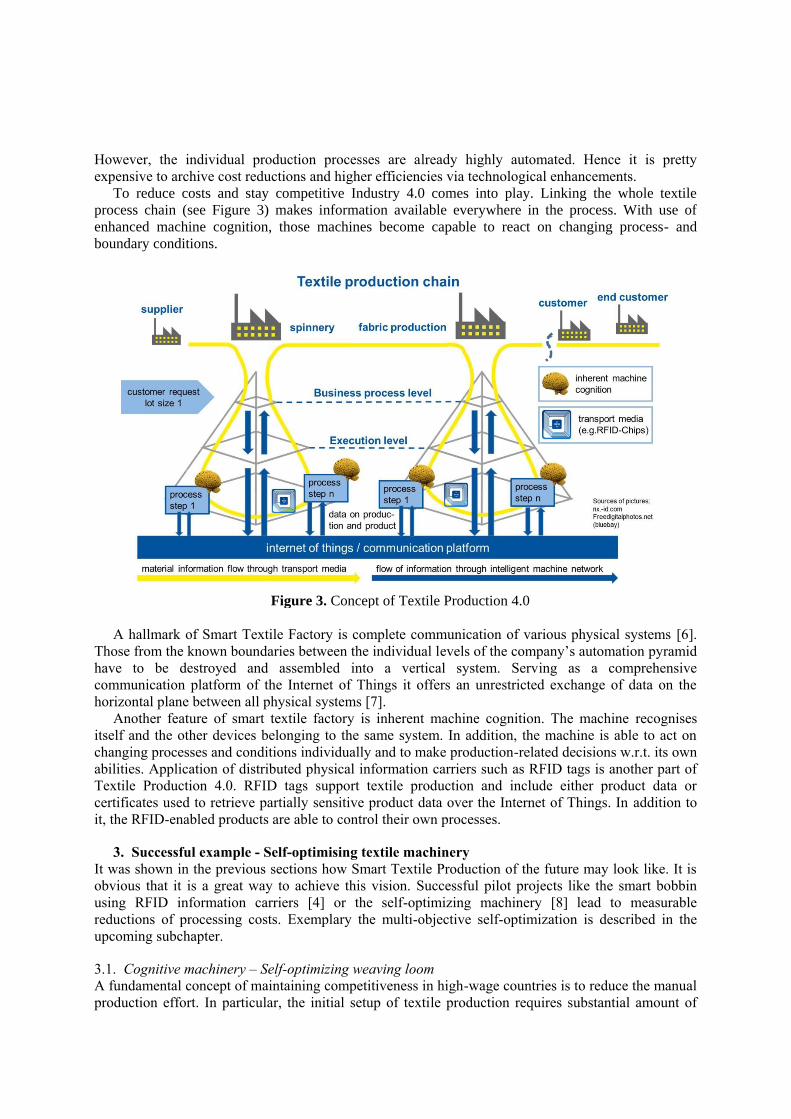
To reduce costs and stay competitive Industry 4.0 comes into play. Linking the whole textile
process chain (see Figure 3) makes information available everywhere in the process. With use of
enhanced machine cognition, those machines become capable to react on changing process- and
boundary conditions.
Figure 3. Concept of Textile Production 4.0
A hallmark of Smart Textile Factory is complete communication of various physical systems [6].
Those from the known boundaries between the individual levels of the company’s automation pyramid
have to be destroyed and assembled into a vertical system. Serving as a comprehensive
communication platform of the Internet of Things it offers an unrestricted exchange of data on the
horizontal plane between all physical systems [7].
Another feature of smart textile factory is inherent machine cognition. The machine recognises
itself and the other devices belonging to the same system. In addition, the machine is able to act on
changing processes and conditions individually and to make production-related decisions w.r.t. its own
abilities. Application of distributed physical information carriers such as RFID tags is another part of
Textile Production 4.0. RFID tags support textile production and include either product data or
certificates used to retrieve partially sensitive product data over the Internet of Things. In addition to
it, the RFID-enabled products are able to control their own processes.
3. Successful example - Self-optimising textile machinery
It was shown in the previous sections how Smart Textile Production of the future may look like. It is
obvious that it is a great way to achieve this vision. Successful pilot projects like the smart bobbin
using RFID information carriers [4] or the self-optimizing machinery [8] lead to measurable
reductions of processing costs. Exemplary the multi-objective self-optimization is described in the
upcoming subchapter.
3.1. Cognitive machinery – Self-optimizing weaving loom
A fundamental concept of maintaining competitiveness in high-wage countries is to reduce the manual
production effort. In particular, the initial setup of textile production requires substantial amount of
manual work that lead to significant production costs. It is essential to reduce the duration of the
manual setup processes in order to reduce these costs.
In addition to manual work, a significant amount of setup time is spent in search for the optimal
process parameters. Despite usage of process databases providing initial parameters based on
historical data, these parameters are determined by means of the time-consuming Trial & Error
principle. In this case, knowledge and experience of the operator play an insignificant role.
A multi-objective self-optimization of the weaving machine was developed at ITA. Self-optimizing
systems are defined as "systems [...], which are capable of making changes in their internal state or its
structure independently due to changes in input conditions or disorders" [9]. The following objective
functions are considered by the multi-objective self-optimization (MOSO) of the weaving process:
• warp tension
• energy consumption of the weaving machine (air- and active power consumption)
• quality of the fabric
The objective functions are optimized according to the following parameters:
• basic warp tension (bwt)
• revolutions per minute (n)
• vertical warp stop motion position (wsmy)
With the MOSO routine, a weaving machine is enabled to automatically find an optimal
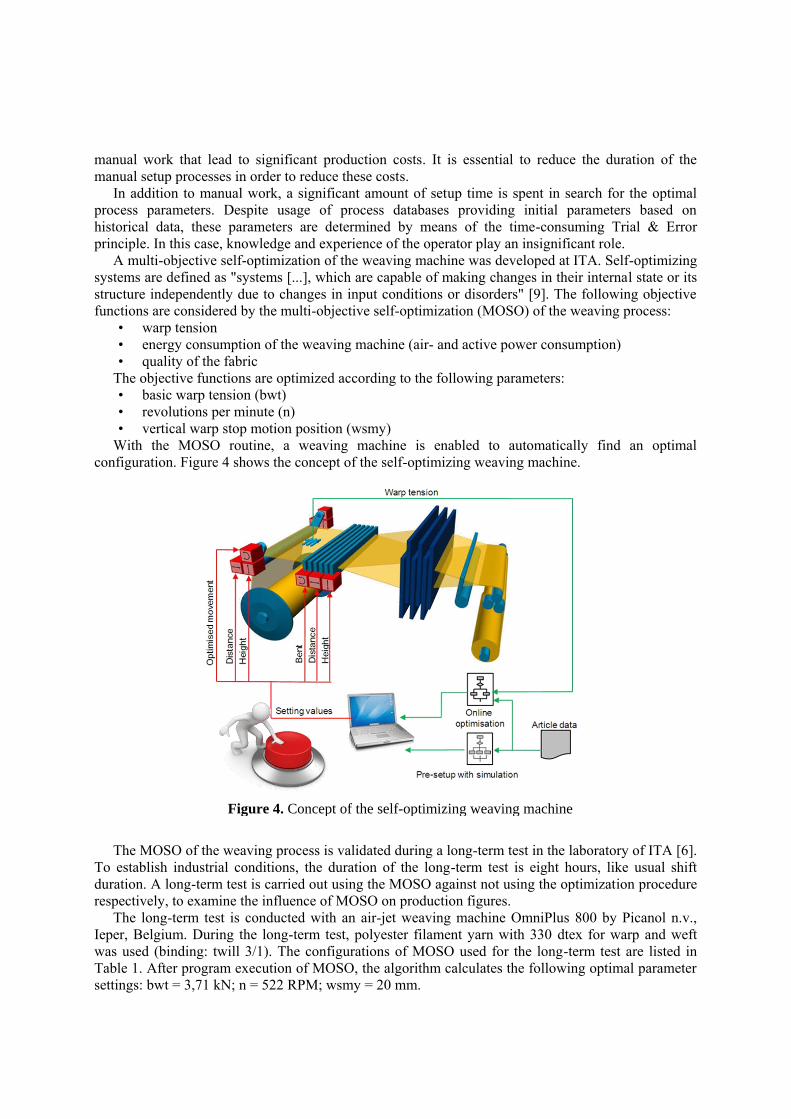
configuration. Figure 4 shows the concept of the self-optimizing weaving machine.
Figure 4. Concept of the self-optimizing weaving machine
The MOSO of the weaving process is validated during a long-term test in the laboratory of ITA [6].
To establish industrial conditions, the duration of the long-term test is eight hours, like usual shift
duration. A long-term test is carried out using the MOSO against not using the optimization procedure
respectively, to examine the influence of MOSO on production figures.
The long-term test is conducted with an air-jet weaving machine OmniPlus 800 by Picanol n.v.,
Ieper, Belgium. During the long-term test, polyester filament yarn with 330 dtex for warp and weft
was used (binding: twill 3/1). The configurations of MOSO used for the long-term test are listed in
Table 1. After program execution of MOSO, the algorithm calculates the following optimal parameter
settings: bwt = 3,71 kN; n = 522 RPM; wsmy = 20 mm.
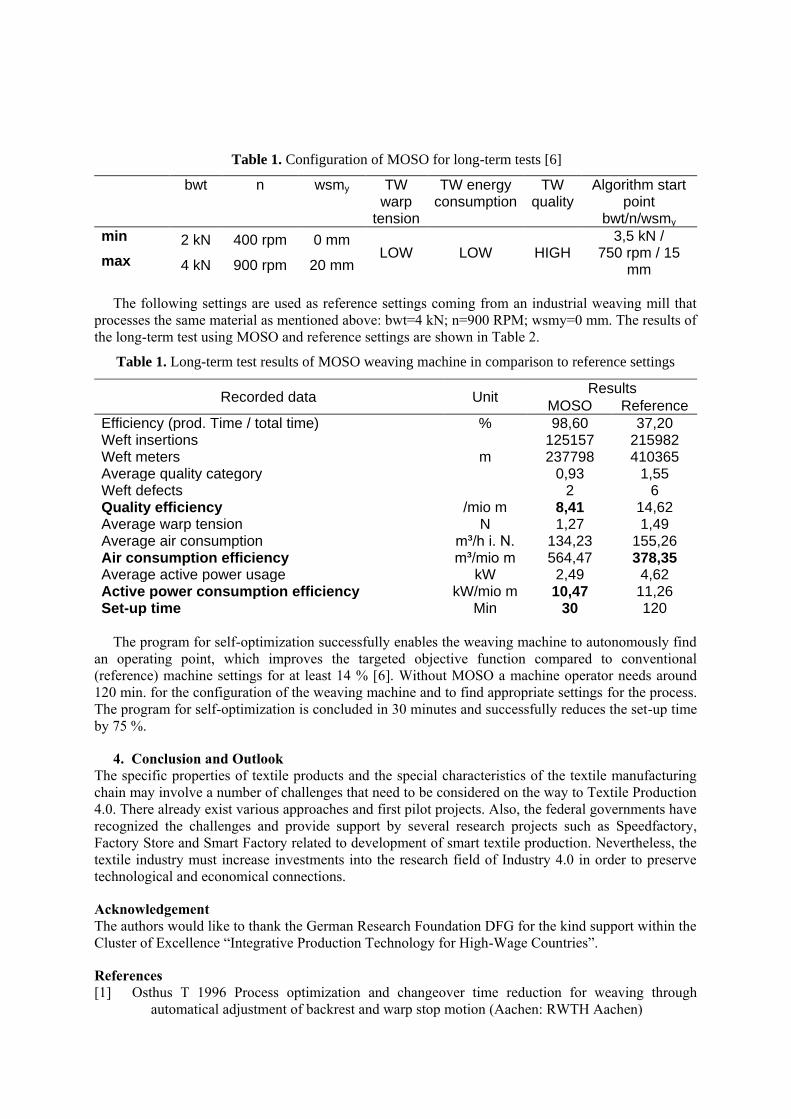
Table 1. Configuration of MOSO for long-term tests [6]
bwt n wsmy TW warp
tension
TW energy consumption
TW quality
Algorithm start point
bwt/n/wsmy
min 2 kN 400 rpm 0 mm LOW LOW HIGH
3,5 kN / 750 rpm / 15
mm max 4 kN 900 rpm 20 mm
The following settings are used as reference settings coming from an industrial weaving mill that
processes the same material as mentioned above: bwt=4 kN; n=900 RPM; wsmy=0 mm. The results of
the long-term test using MOSO and reference settings are shown in Table 2.
Table 1. Long-term test results of MOSO weaving machine in comparison to reference settings
Recorded data Unit Results
MOSO Reference
Efficiency (prod. Time / total time) % 98,60 37,20 Weft insertions 125157 215982 Weft meters m 237798 410365 Average quality category 0,93 1,55 Weft defects 2 6 Quality efficiency /mio m 8,41 14,62 Average warp tension N 1,27 1,49 Average air consumption m³/h i. N. 134,23 155,26 Air consumption efficiency m³/mio m 564,47 378,35 Average active power usage kW 2,49 4,62 Active power consumption efficiency kW/mio m 10,47 11,26 Set-up time Min 30 120
The program for self-optimization successfully enables the weaving machine to autonomously find
an operating point, which improves the targeted objective function compared to conventional
(reference) machine settings for at least 14 % [6]. Without MOSO a machine operator needs around
120 min. for the configuration of the weaving machine and to find appropriate settings for the process.
The program for self-optimization is concluded in 30 minutes and successfully reduces the set-up time
by 75 %.
4. Conclusion and Outlook
The specific properties of textile products and the special characteristics of the textile manufacturing
chain may involve a number of challenges that need to be considered on the way to Textile Production
4.0. There already exist various approaches and first pilot projects. Also, the federal governments have
recognized the challenges and provide support by several research projects such as Speedfactory,
Factory Store and Smart Factory related to development of smart textile production. Nevertheless, the
textile industry must increase investments into the research field of Industry 4.0 in order to preserve
technological and economical connections.
Acknowledgement
The authors would like to thank the German Research Foundation DFG for the kind support within the
Cluster of Excellence “Integrative Production Technology for High-Wage Countries”.
References
[1] Osthus T 1996 Process optimization and changeover time reduction for weaving through
automatical adjustment of backrest and warp stop motion (Aachen: RWTH Aachen)
[2] Brecher C (Ed.) 2011 Integrative Production Technology for High-Wage Countries 1 (Berlin-
Heidelberg: Springer Verlag) pp.747–1057
[3] Gloy Y-S 2014 Industry 4.0: the future of the textile production? Melliand International 20 p. 1
[4] Saggiomo M, Wischnowski M, Gloy Y-S and Gries T. 2015 Industrie 4.0 im
Textilmaschinenbau - Erste Schritte der Umsetzung Melliand Textilberichte 96 pp. 38-39
[5] Kruska M, Meyer J, Elsasser N, Trautman A, Weber P and Mac T 2011 Rationelle
Energienutzung in der Textilindustrie (Wiesbaden: Viewig)
[6] Gloy, Y.-S., Greb, C. & Gries, T. (2013): Industry 4.0: a (r)evolution for the textile industry? In:
Hillmer, Janine (Ed.): Proceedings of the 7th Aachen-Dresden International Textile
Conference, Aachen November 28-29, 2013. Aachen: DWI an der RWTH Aachen e.V
[7] Simonis, K., Lemm, J., Löhrer, M., Gloy, Y.-S. & Gries, T. (2014): "Industrie 4.0" und die
Arbeitswelt der Textilindustrie: epochale Umwälzung. t&m Technologie und Management
63, H. 5, S. 38-39
[8] Kemper M, Gloy Y-S and Gries T. 2015 Multi-objective self-optimization of the weaving
process 16th World Textile Conference AUTEX 2016, (Ljubljana, Slovenia) Eds Simončič
B, Tomšič B, and Gorjanc M
[9] J. Gausemeier, F. J. Rammig, W. Schäfer. Design Methodology for Intelligent Technical
Systems: Develop Intelligent Technical Systems of the Future. 2009, Springer Science and
Business Media.
Comparative analysis of sustainable consumption and production in Visegrad region -
conclusions for textile and clothing sector
M Koszewska
1, J Militki
2 P Mizsey
3 and R Benda-Prokeinova
4
1Lodz University of Technology, Faculty of Material Technologies and Textile
Design, Department of Materials and Commodity Sciences and Textile Metrology,
Zeromskiego 116, 90-924 Lodz, Poland 2Technical University of Liberec Faculty of Textile Engineering, Faculty of Textile
Engineering, Department of Material Engineering, Studentská 2, Liberec, 461 17,
Czech Republic 3Budapest University of Technology and Economics, Faculty of Chemical and
Biochemical Engineering Department of Chemical and Environmental Process
Engineering, XI. Műegyetem rkp. 3 Budapest, Hungary 4Slovak University of Agriculture, Faculty of Economics and Management,
Department of Statistics and Operations Research, Tr. A. Hlinku 2, 949 76 Nitra,
Slovak Republic
E-mail: [email protected]
Abstract. Gradual environmental degradation, shrinking of non-renewable resources, and
lower quality of life are directly or indirectly arising from snowballing consumption. These
unfavorable processes concern increasingly textile and clothing sector and are increasingly
being felt in Visegrad Region (V4). The objective of the article was to access current
consumption patterns in V4 countries, identify the factors that influence those patterns and
finally to draw the conclusions for more sustainable consumption and production models as
well as to make a comparative analysis of the results across V4 countries. A consumer survey
was conducted to examine V4 citizens’ attitudes and behaviors in the context of sustainable
consumption. To ensure sample size and comparability across countries 2000 randomly-
selected V4 citizens, aged 18 and over, were interviewed. To analyze the supply side of the
market and legal framework, the desk research was used. The results allowed to give some
guidelines for the joint V4 strategy for solving ecological and social problems of V4 countries
as well as the conclusions for textile and clothing sector.
1. Introduction
The Visegrad Group (also known as the "Visegrad Four" or "V4") reflects the efforts of the countries
of the Central European region (Czech Republic, Hungary, Poland and Slovakia) to work together in a
number of fields of common interest (such as education, culture, science, environment, regional
development, civil society development, transport, etc.) within the all-European integration. One of
this field of this cooperation is also sustainable development and more recently circular economy
model.
Gradual environmental degradation, shrinking of non-renewable resources, and lower quality of
life are directly or indirectly arising from snowballing consumption. These unfavorable processes
concern increasingly textile and clothing sector and are increasingly being felt in Visegrad (V4)
countries. They will not stop unless consumption patterns are modified [1]. Therefore, the
sustainability agenda has gradually been shifting to include consumption alongside production.
Manufacturers may use new designs and technologies to minimize the impact of a product on the
environment, but their efforts are pointless if consumers do not buy more sustainable goods and do not
change their consumption habits. Therefore, a change in the attitudes of textile and clothing companies
and consumers towards a more responsible behavior is needed. It is a gradual process that needs
appropriate knowledge, awareness, and frequently the modification of long-standing habits. These
needs and challenges have brought the authors to the objectives of the project „Prospects of the
Visegrad cooperation in promoting a sustainable consumption and production models” implemented
within the framework of the Visegrad Fund Strategic Grants. The main results of the project are
presented in the article.
1.1. The research aims
The objective of this project was to support and strengthen the cohesion of the V4 countries in the
efforts to achieve a more sustainable consumption culture and thus more sustainable production
models in the selected consumer goods’ markets one of them was was textile and clothing market. In
order to do that, the project undertook the analysis of immediate connections and influences of: the
demand side of the markets (consumers), the supply side of the market (producers), legal framework
and cultural impact. An important part of the project was a comparative analysis of the results across
V4 countries allowing to give some guidelines for the joint V4 strategy for solving ecological and
social problems of V4 countries.
1.2. The research scope and methodology
One of the main objectives of the project was to access current consumption patterns in V4 countries,
identify the factors that influence those patterns and finally to draw the conclusions for more
sustainable consumption models.
For this purpose, the primary research study was used. A consumer survey was conducted to examine
V4 citizens’ attitudes and behaviors in the context of sustainable consumption. In particular, the
survey examined following aspects of consumers’ behavior: environmental knowledge and concern,
perceived consumer effectiveness (PCE) and perceived marketplace influence, environmental actions
undertaken within last twelve months, barriers and buying behavior (PMI). To ensure sample size and
comparability across countries 2000 randomly-selected V4 citizens, aged 18 and over, were
interviewed. The interviews were carried out via Computer Assisted Web Interviewing (CAWI).
behaviour. To determine if there are statistically significant differences across the V4 countries, the
Kruskal-Wallis H test (one-way ANOVA on ranks) was used. To analyse the supply side of the market
and legal framework, the desk research was used - analyze of the available survey results, reports and
statistical data. In this part we concentrated on the following aspects: sustainable production prospects
(in the context of social and ethical as well as economic determinants), development of sustainable
products markets in Poland, sustainable patterns of production in business operations, the main
barriers and challenges of sustainable production.
2. Research results
In the first step we concentrated on the demand side of the market represented by consumers, their
values and attitudes.
2.1. Demand, values, attitudes, cultural impact – differences and similarities
To access the level of respondents’ environmental knowledge they were asked how much they agree
or disagree with the three statements (“When I am a choosing a product, I very often pay attention to
environmental or social labelling before deciding to buy”, “I don’t feel I have enough knowledge to
choice more sustainable products with less environmental and/or social impact”, “I often read articles
or news about environmental and/or social impact of products I buy”). A Kruskal-Wallis H test
showed that there was a statistically significant difference in case of all the statements between the V4
countries. The value of the mean rank as well as the the distribution of answers suggest that the
country whose respondents access their environmental knowledge lowest is Slovakia. It is also worth
to outline that in all countries we can observe relatively high proportion of uncertain answers „ neither
agree or disagree”. This may suggest that respondents had some problems with clear understanding the
right meaning of the questions concerning environmental knowledge, or that the issue was not so
important for them.
Another very important factor influencing sustainable consumption is environmental sensitivity.
The knowledge itself very often is not enough. What we need is a combination of knowledge, the
awareness resulting from it, and the individual predisposition of a particular person which produces a
category referred to as concern [1]. Together they can lead to seeking and purchasing sustainable
products. Generally, the results indicate that, compared with environmental knowledge, the
respondents in all V4 countries represent a higher level of environmental sensitivity. Most people from
the V4 countries think that “we are approaching a disaster and politicians make little effort to protect
the environment”. However, there are some differences between the countries. People from Poland,
the Czech Republic and Slovakia showed a similar level of concern about environmental conditions
for future generations. In contrast, the respondents form Hungary differed from the other V4 countries
in these area, as a higher percentage of them agreed that they were afraid when they are thinking about
environmental conditions for future generations and that we are approaching an environmental disaster
if we continue our current style of living. At the same time the highest percentage of them disagreed
(“strongly” or “rather”) that environmental problems were greatly exaggerated by the opponents of the
environmental movement. Therefore, we could conclude that (at least at the level of declarations), the
Hungarians represent slightly higher environmental sensitivity then the citizens of other three Visegrad
countries.
As far as sustainable products are concerned the influence of the so called perceived consumer
effectiveness PCE is attributed a grave importance. The PCE is understood as a measure of the
subject’s judgment in the ability of individual consumers to affect environmental resource problems
[2]. A significant impact of PCE on sustainable consumption was also confirmed in the literature [3,4].
The concept of perceived marketplace influence - PMI is similar to PCE in nature, however, rather
than solely looking at whether someone feels their actions are individually making a difference in
environmental problems, it captures an individual's belief that their actions are actively influencing the
behaviour of other marketplace actors – consumers or organizations [5]. The survey prompted
consumers with four statements to see how strongly they believe they can make a difference in solving
environmental problems and influence other consumers or companies. The results showed that
generally Polish consumers had a slightly stronger feeling that they can influence other members of
their community, companies’ performance and the solution of environmental problems than the
citizens of other V4 countries.
We also asked the consumers how often, if at all, they under took concreate actions. Three of the
questions related to the before purchase phrase: looking for information, avoiding the purchase of
unethical products and buying sustainable products. The remaining five questions concerned the post
purchase behaviour: rationalization of the laundry process, and proceeding with used products:
repairing them, passing and swapping, segregating and composting. Despite some differences between
particular countries generally we could conclude that V4 consumers are more active in the after
purchase phrase and also in those activities that do not require a lot of knowledge and engagement but
additionally can bring some economic reward. We could say that the most frequent activities, were
those activities that we could call “every day practices”, that are well known, do not require additional
knowledge or engagement. More engaging activities, like making compost with the food waste at
home turned out to be far less popular among V4 consumers.
Another important aim of the survey was to identify the main barriers to introducing more
sustainable consumption patterns and therefore development of “eco market”. Despite those
differences we could conclude that in all V4 countries the most important barriers were: insufficient
availability of sustainable products, too high price of sustainable products and lack of confidence in
eco-labels, in different order, depending on the country. The least important barrier, in all countries,
turned out to be unsatisfactory attractiveness of sustainable products. Additionally,
a high percentage of neutral/uncertain answers “neither agree nor disagree” given to questions relating
to sustainable options/products may suggest that respondents in all countries were somehow confused
about the terms “environmentally friendly” and “harmful” products.
It was also important to see to what extend Visegrad consumers manifest unreasonably high
consumption level known as consumerism. The results indicate that despite some differences between
countries a large majority of V4 respondents manifests a rather non-consumerist attitude, declaring
that they buy things only when they really need them, that they rather not shop just for the pleasure of
shopping, that they do not frequently buy things that they hardly use, and that they buy things only
when they really need them. However, this may arise not so much from a conscious opposition to
consumerism but rather from economic limitations.
2.2. Supply, legal framework – differences and similarities across V4 countries
In this part of the project we tried to to answer the question: “How could the existing niche markets for
sustainable products be extended to mass markets?” Important aspects in this area are ethics and social
attitudes, manifested to a large extent on trust, social and human capital. One of the key factors
shaping the attitudes and social capital of a country is trust. It applies to the relationships between
individual human beings, between companies being represented by them, as well as between sectors
and communities. According to the European Social Survey (ESS) [6], in terms of the general level of
trust all V4 countries occupy the last four places among the European countries. V4 respondents think
that people in their countries mostly look out for themselves and are not helpful, most people can not
be trusted and most people try to get advantage of others rather then to be fair.
Another of the analyzed indicators was the the ‘resource productivity”, which is calculated by
dividing GDP (gross domestic product) deflated by DMC (domestic material consumption), is used to
monitor the relationship between resource use and economic growth. Improving resource productivity
and ensuring a sustainable resource and materials management building on the principle of the 3Rs
(reduce, reuse, recycle) is a central element of green growth policies. It helps to improve the
environment by reducing the amount of resources that the economy requires and diminishing the
associated environmental impacts, and sustains economic growth by securing adequate supplies of
materials and improving competitiveness [7]. The Eurostat data shows that values of resource
productivity (measured in purchasing power standards [PPS] per kg) are lowest in Poland. However,
we could conclude that resource productivity generally is not high in Visegrad Region [8].
Another important indicator is eco-innovation index, which refers to the development of new or
significantly improved products (goods and services) or organisational practices that reduce the use of
natural resources and decrease the release of harmful substances throughout the entire life cycle. It
plays an important role in addressing environmental challenges without compromising economic and
social objectives. Besides its environmental benefits, eco-innovation brings new products to the
market, contributing to economic activity and job creation [9]. The EU eco-innovation index shows
how well individual Member States perform in eco-innovation compared with the EU average. The
only V4 country that in 2015 had the European Eco-Innovation Scoreboard at the level of the EU
average was the Czech Republic. The country with the lowest score in almost all years during the
period 2010-2015 was Poland.
In the EU the top priority is to prevent and minimize waste. It is followed by treatment methods,
such as reuse and recycling, energy recovery through incineration and, lastly, disposal in the form of
landfilling [9]. Since recycling and composting reduce the amount of waste that needs to bedisposed of
and reduce demand for raw materials, leading to the reduction in primary resource extraction, those
ways of waste treating are assumed to be most environmentally friendly and therefore desirable.
Analysis the Eurostat data on total waste recycled in the EU-28 in 2012 showed that Poland recycled
over 50% and Czech Republic almost 50% of its total waste. Lower percentage can be observed in the
case of Slovakia (37%) and Hungary (36%). However, we can consider whether the total waste
indicator is the best one in the analyses of the general trend in waste generation and comparative
analyses. A more rational indicator seems to be landfill rate of waste, excluding major mineral wastes.
Looking at this indicator, we can see that Poland, together with the Czech Republic, is slightly below
the EU average, with 30% landfill rate of waste. It is a much better result than in the case of the other
two V4 countries, Slovakia and Hungary.
Another important area that we analyzed was environmental certification and labelling. One of the
voluntary European implemented to encourage different organizations (companies, plants, institutions,
etc.) to keep improving their environmental performance is the Eco-management and Audit Scheme
(EMAS). The Eurostat data showed that the number of EMAS-registered organisations and sites
across the European countries is highly differentiated. All V4 countries lag far behind the EU leaders,
which are Germany, with 1991 sites, Italy, with 1771 sites and Greece, with 1292 sites. However, we
can notice that Poland has made big progress when it comes to the number of organisations and sites
with eco-management and audit scheme (EMAS). There was a sharp rise of the organisations and sites
with EMAS in Poland in the last few years (an increase form 33 sites in 2012 to 122 in 2015). That
makes Poland the indisputable leader among the V4 countries [8].
The ISO 14000 environmental management standards aim to help organizations minimize the way
in which their operations (processes, etc.) negatively affect the environment (i.e. cause adverse
changes to air, water, or land), comply with applicable laws, regulations, and other environmentally
oriented requirements, and continually improve in the above. According to Eurostat data, all V4
countries, again, stay behind the EU leaders when it comes to the ISO 14001 certified companies. This
time, unlike the EMAS registration, the indisputable V4 leader is the Czech Republic, with 6629
companies. Poland ranks third, just behind Hungary, with 1793 companies [8].
The EU Ecolabel is a voluntary scheme established in 1992 to encourage businesses to market
products and services that are more sustainable. The Ecolabel helps to promote and identify products
and services that have a reduced environmental impact throughout their life cycle, from the extraction
of raw material through to production, use and disposal. According to Eurostat data in 2016 the largest
number of EU Eco label licences was awarded in France (26%), Italy (18%), and Germany (12%). The
V4 countries again lag far behind the EU leaders. However, we can observe an upward trend in all V4
countries except Slovakia. The number of Ecolabel licences has increased gradually since 2005 [8].
3. Conclusions for textile and clothing sector
Based on the survey results we could conclude that despite the declared environmental sensitivity,
consumers in V4 countries still do not have enough knowledge allowing them to reach more rational
decisions, make conscious choices and exhibit more sustainable behaviours. Therefore, it is desirable
to introduce system solutions in education, taking into account the issues related to sustainable
development in textile and clothing industry starting from pre-school education. Despite some
differences between particular countries, the V4 consumers are more active in the after purchase
phrase and also in the activities that do not require a lot of knowledge and engagement but can
additionally bring some economic reward. The increased activity of the NGOs and the media in raising
environmental knowledge and awareness in the field of textile and clothing as well as in shaping the
public opinion in V4 countries is necessary.
According to survey results, the biggest barriers to sustainable consumption for V4 consumers
were: insufficient availability of the sustainable products, too high price and lack of confidence in eco-
labels. The least important barrier turned out to be unsatisfactory attractiveness of sustainable
products. The government and, primarily, enterprises should therefore focus on expanding distribution
channels, enhancing the visibility of sustainable options in the stores, introducing better differentiation
strategies and creating incentives to buy sustainable products. Continuous education in this area is
necessary to build consumer confidence. Effectiveness of those activities depends on consistency,
transparency and fairness of actions and declarations. Additionally, success, growth and profits in
textile industry in the Europe must be grounded in two critical components: excellence in life cycle
performance and sustainability coupled with disruptive innovation in the transformational process;
hence creating new green space in textiles.
Important factors that stimulate the implementation of eco-innovations in the V4 countries are the
legal requirements and expected changes in EU legislation (environmental regulations that already
exist, as well as these expected in the future). Furthermore, relatively low level of social trust in the
V4 companies, indicates the need for further education and training in order to build skills to
implement ethical values and attitudes. It is necessary to create space and mechanisms to increase the
exchange of practices and to build confidence and trust throughout the clothing supply chain.
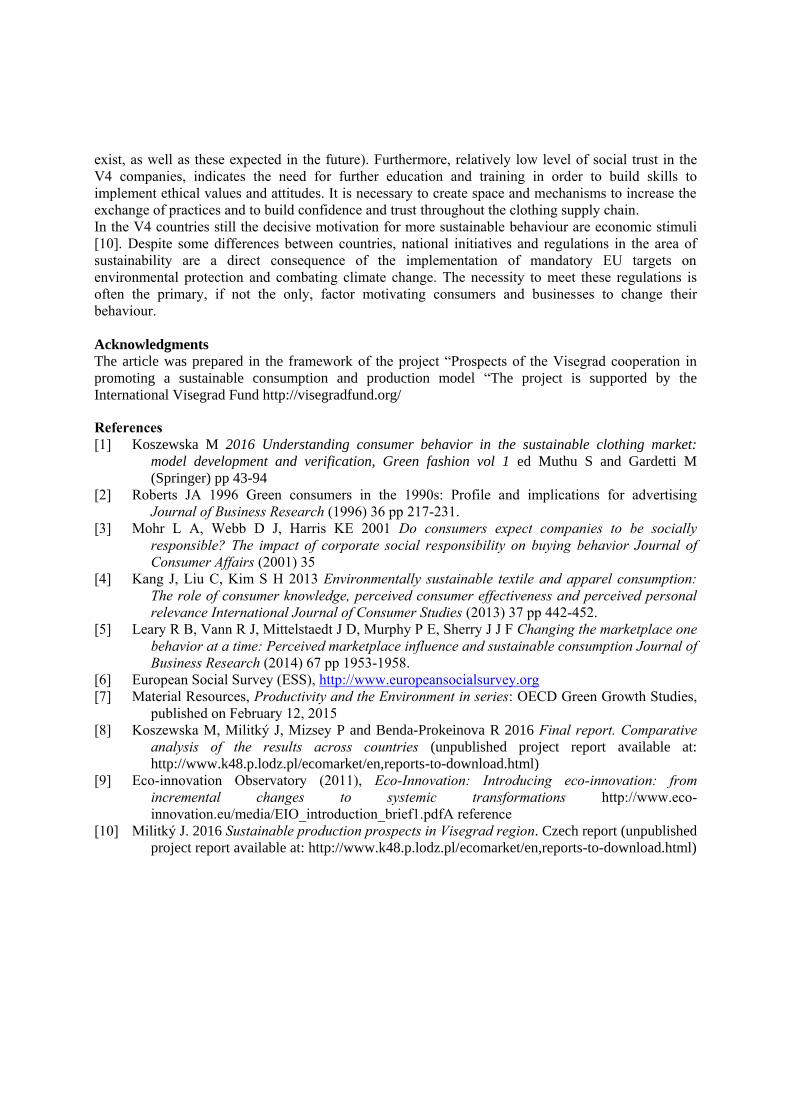
In the V4 countries still the decisive motivation for more sustainable behaviour are economic stimuli
[10]. Despite some differences between countries, national initiatives and regulations in the area of
sustainability are a direct consequence of the implementation of mandatory EU targets on
environmental protection and combating climate change. The necessity to meet these regulations is
often the primary, if not the only, factor motivating consumers and businesses to change their
behaviour.
Acknowledgments
The article was prepared in the framework of the project “Prospects of the Visegrad cooperation in
promoting a sustainable consumption and production model “The project is supported by the
International Visegrad Fund http://visegradfund.org/
References
[1] Koszewska M 2016 Understanding consumer behavior in the sustainable clothing market:
model development and verification, Green fashion vol 1 ed Muthu S and Gardetti M
(Springer) pp 43-94
[2] Roberts JA 1996 Green consumers in the 1990s: Profile and implications for advertising
Journal of Business Research (1996) 36 pp 217-231.
[3] Mohr L A, Webb D J, Harris KE 2001 Do consumers expect companies to be socially
responsible? The impact of corporate social responsibility on buying behavior Journal of
Consumer Affairs (2001) 35
[4] Kang J, Liu C, Kim S H 2013 Environmentally sustainable textile and apparel consumption:
The role of consumer knowledge, perceived consumer effectiveness and perceived personal
relevance International Journal of Consumer Studies (2013) 37 pp 442-452.
[5] Leary R B, Vann R J, Mittelstaedt J D, Murphy P E, Sherry J J F Changing the marketplace one
behavior at a time: Perceived marketplace influence and sustainable consumption Journal of
Business Research (2014) 67 pp 1953-1958.
[6] European Social Survey (ESS), http://www.europeansocialsurvey.org
[7] Material Resources, Productivity and the Environment in series: OECD Green Growth Studies,
published on February 12, 2015
[8] Koszewska M, Militký J, Mizsey P and Benda-Prokeinova R 2016 Final report. Comparative
analysis of the results across countries (unpublished project report available at:
http://www.k48.p.lodz.pl/ecomarket/en,reports-to-download.html)
[9] Eco-innovation Observatory (2011), Eco-Innovation: Introducing eco-innovation: from
incremental changes to systemic transformations http://www.eco-
innovation.eu/media/EIO_introduction_brief1.pdfA reference
[10] Militký J. 2016 Sustainable production prospects in Visegrad region. Czech report (unpublished
project report available at: http://www.k48.p.lodz.pl/ecomarket/en,reports-to-download.html)
Simulation modelling of central order processing systemunder resource sharing strategy in demand-driven garmentsupply chains
K Ma123, S Thomassey1 and X Zeng1
1ENSAIT, GEMTEX, 2 Allée Louise et Victor Champier, 59100 Roubaix, France2Soochow University, College of Textile and Clothing Engineering, GanjiangdongRoad 178, Suzhou, China3University of Borås, Department of Business Administration and TextileManagement, Allégatan 1, 50332, Borås, Sweden
Email: [email protected]
Abstract. In this paper we proposed a central order processing system under resource sharingstrategy for demand-driven garment supply chains to increase supply chain performances. Weexamined this system by using simulation technology. Simulation results showed thatsignificant improvement in various performance indicators was obtained in new collaborativemodel with proposed system.
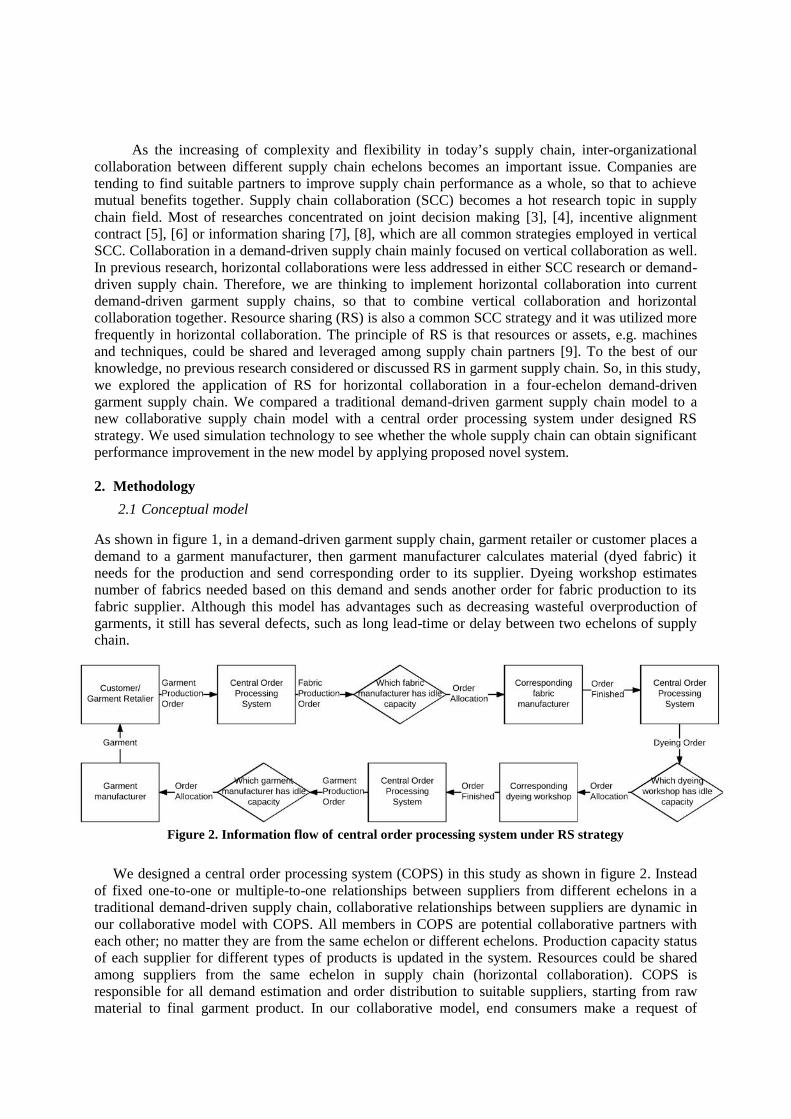
1. IntroductionIn recent years, the trend of customization and personalization is increasing tremendously in garmentindustry. Instead of traditional ready-to-wear garments, customers are seeking to wear customizedclothes fitting individual preference and body shape with distinctive materials, styles, pattern orcolours. Therefore, the demand of small-series production and quick response become more and moreimportant in today’s garment supply chain. To meet this raising trend, demand-driven supply chain(see figure 1) is developed and employed nowadays. According to Verdouw, C.N et al. [1], a demand-driven chain is defined as “a supply chain in which all actors involved are sensitive and responsive todemand information of the end customer and meet those varied and variable demands in a timely andcost-effective manner”. In demand-driven supply chains, only products and services corresponding tocustomers’ demands are produced and it forces stakeholders in the supply chain to collaborate witheach other [2]. However, there are still a lot of potentials to improve current demand-driven supplychain, e.g. long lead time and high cost.
(a)
(b)
Figure 1. (a) Information flow and (b) material flow in demand-driven garment supply chains
As the increasing of complexity and flexibility in today’s supply chain, inter-organizationalcollaboration between different supply chain echelons becomes an important issue. Companies aretending to find suitable partners to improve supply chain performance as a whole, so that to achievemutual benefits together. Supply chain collaboration (SCC) becomes a hot research topic in supplychain field. Most of researches concentrated on joint decision making [3], [4], incentive alignmentcontract [5], [6] or information sharing [7], [8], which are all common strategies employed in verticalSCC. Collaboration in a demand-driven supply chain mainly focused on vertical collaboration as well.In previous research, horizontal collaborations were less addressed in either SCC research or demand-driven supply chain. Therefore, we are thinking to implement horizontal collaboration into currentdemand-driven garment supply chains, so that to combine vertical collaboration and horizontalcollaboration together. Resource sharing (RS) is also a common SCC strategy and it was utilized morefrequently in horizontal collaboration. The principle of RS is that resources or assets, e.g. machinesand techniques, could be shared and leveraged among supply chain partners [9]. To the best of ourknowledge, no previous research considered or discussed RS in garment supply chain. So, in this study,we explored the application of RS for horizontal collaboration in a four-echelon demand-drivengarment supply chain. We compared a traditional demand-driven garment supply chain model to anew collaborative supply chain model with a central order processing system under designed RSstrategy. We used simulation technology to see whether the whole supply chain can obtain significantperformance improvement in the new model by applying proposed novel system.
2. Methodology2.1 Conceptual model
As shown in figure 1, in a demand-driven garment supply chain, garment retailer or customer places ademand to a garment manufacturer, then garment manufacturer calculates material (dyed fabric) itneeds for the production and send corresponding order to its supplier. Dyeing workshop estimatesnumber of fabrics needed based on this demand and sends another order for fabric production to itsfabric supplier. Although this model has advantages such as decreasing wasteful overproduction ofgarments, it still has several defects, such as long lead-time or delay between two echelons of supplychain.
Figure 2. Information flow of central order processing system under RS strategy
We designed a central order processing system (COPS) in this study as shown in figure 2. Insteadof fixed one-to-one or multiple-to-one relationships between suppliers from different echelons in atraditional demand-driven supply chain, collaborative relationships between suppliers are dynamic inour collaborative model with COPS. All members in COPS are potential collaborative partners witheach other; no matter they are from the same echelon or different echelons. Production capacity statusof each supplier for different types of products is updated in the system. Resources could be sharedamong suppliers from the same echelon in supply chain (horizontal collaboration). COPS isresponsible for all demand estimation and order distribution to suitable suppliers, starting from rawmaterial to final garment product. In our collaborative model, end consumers make a request of
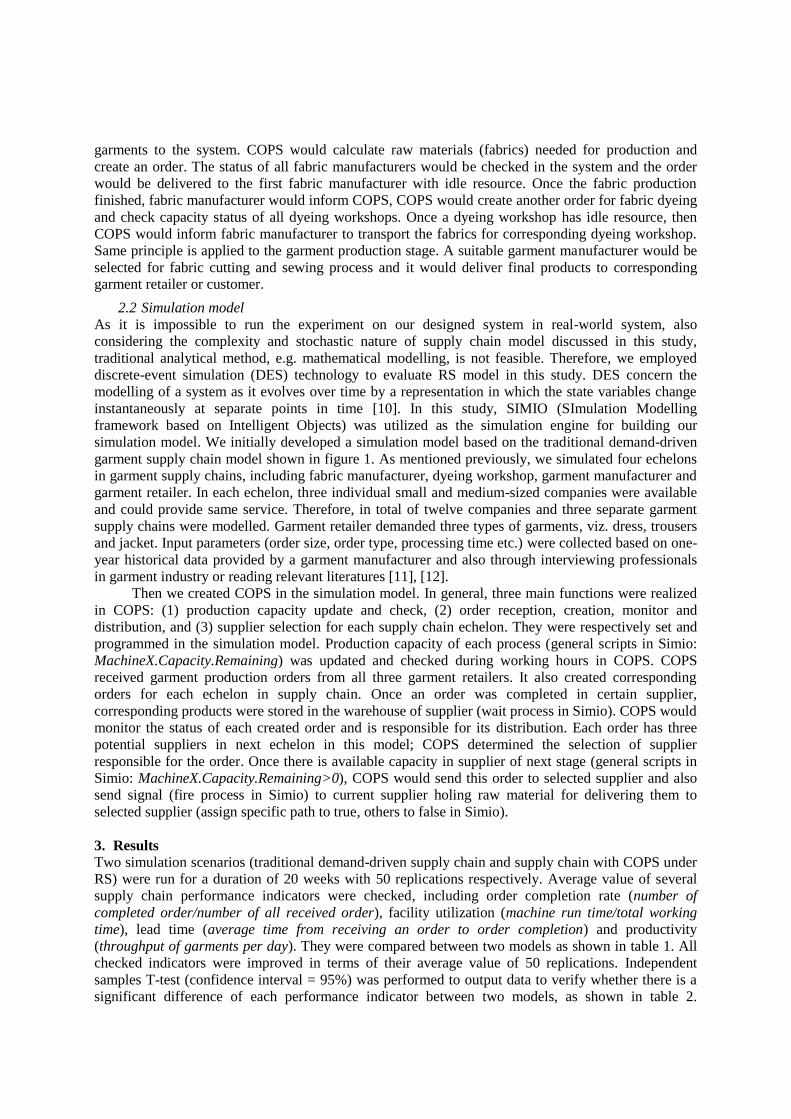
garments to the system. COPS would calculate raw materials (fabrics) needed for production andcreate an order. The status of all fabric manufacturers would be checked in the system and the orderwould be delivered to the first fabric manufacturer with idle resource. Once the fabric productionfinished, fabric manufacturer would inform COPS, COPS would create another order for fabric dyeingand check capacity status of all dyeing workshops. Once a dyeing workshop has idle resource, thenCOPS would inform fabric manufacturer to transport the fabrics for corresponding dyeing workshop.Same principle is applied to the garment production stage. A suitable garment manufacturer would beselected for fabric cutting and sewing process and it would deliver final products to correspondinggarment retailer or customer.
2.2 Simulation modelAs it is impossible to run the experiment on our designed system in real-world system, alsoconsidering the complexity and stochastic nature of supply chain model discussed in this study,traditional analytical method, e.g. mathematical modelling, is not feasible. Therefore, we employeddiscrete-event simulation (DES) technology to evaluate RS model in this study. DES concern themodelling of a system as it evolves over time by a representation in which the state variables changeinstantaneously at separate points in time [10]. In this study, SIMIO (SImulation Modellingframework based on Intelligent Objects) was utilized as the simulation engine for building oursimulation model. We initially developed a simulation model based on the traditional demand-drivengarment supply chain model shown in figure 1. As mentioned previously, we simulated four echelonsin garment supply chains, including fabric manufacturer, dyeing workshop, garment manufacturer andgarment retailer. In each echelon, three individual small and medium-sized companies were availableand could provide same service. Therefore, in total of twelve companies and three separate garmentsupply chains were modelled. Garment retailer demanded three types of garments, viz. dress, trousersand jacket. Input parameters (order size, order type, processing time etc.) were collected based on one-year historical data provided by a garment manufacturer and also through interviewing professionalsin garment industry or reading relevant literatures [11], [12].
Then we created COPS in the simulation model. In general, three main functions were realizedin COPS: (1) production capacity update and check, (2) order reception, creation, monitor anddistribution, and (3) supplier selection for each supply chain echelon. They were respectively set andprogrammed in the simulation model. Production capacity of each process (general scripts in Simio:MachineX.Capacity.Remaining) was updated and checked during working hours in COPS. COPSreceived garment production orders from all three garment retailers. It also created correspondingorders for each echelon in supply chain. Once an order was completed in certain supplier,corresponding products were stored in the warehouse of supplier (wait process in Simio). COPS wouldmonitor the status of each created order and is responsible for its distribution. Each order has threepotential suppliers in next echelon in this model; COPS determined the selection of supplierresponsible for the order. Once there is available capacity in supplier of next stage (general scripts inSimio: MachineX.Capacity.Remaining>0), COPS would send this order to selected supplier and alsosend signal (fire process in Simio) to current supplier holing raw material for delivering them toselected supplier (assign specific path to true, others to false in Simio).
3. ResultsTwo simulation scenarios (traditional demand-driven supply chain and supply chain with COPS underRS) were run for a duration of 20 weeks with 50 replications respectively. Average value of severalsupply chain performance indicators were checked, including order completion rate (number ofcompleted order/number of all received order), facility utilization (machine run time/total workingtime), lead time (average time from receiving an order to order completion) and productivity(throughput of garments per day). They were compared between two models as shown in table 1. Allchecked indicators were improved in terms of their average value of 50 replications. Independentsamples T-test (confidence interval = 95%) was performed to output data to verify whether there is asignificant difference of each performance indicator between two models, as shown in table 2.
Significant improvements were obtained in terms of productivity, order completion rate and facilityutilization respectively. Therefore, the experiment results can reflect the improvement of these threeperformance indicators of the model. COPS can bring overall benefits to companies operating in thesystem.
Table 1. Comparison of checked performance indicatorsScenario Number of replications Mean Std. Deviation
Productivity (pieces/day)Traditional 50 1195.10 27.0748
New 50 1222.52 29.7452
Lead Time (days)Traditional 50 15.29 1.4018
New 50 14.86 2.5470
Order Completion RateTraditional 50 83.38% 0.0256
New 50 87.01% 0.0318
Facility UtilizationTraditional 50 82.86% 0.0159
New 50 84.79% 0.0201
Table 2. T-test resultsT value Degree of freedom Sig. (2-tailed) Mean Difference Difference percentage
Productivity -4.821 97.145 0.000 27.4204 2.29%Lead Time 1.032 98 0.305 -0.4243 -2.78%
Order Completion Rate -6.276 93.775 0.000 0.0363 4.35%Facility Utilization -5.331 92.925 0.000 0.0193 2.33%
4. ConclusionIn this study, we proposed COPS for garment supply chains. RS strategy was employed in the system,which is a less researched but important domain in supply chain collaboration. Simulation experimentresults showed that, compared to traditional demand-driven supply chain model, the new proposedmodel with COPS got significant improvements in multiple supply chain performance indicators.COPS could help collaborative partners gain more benefits as a whole, converting so-calledcompetitors to collaborators in garment supply chains. The system provided a platform for small andmedium-sized companies in garment industry to increase their competences while facing the trend ofcustomization and small-series production. This new model also could be a potential direction forsolving current issues in small-series production, e.g. long lead-time or delay between two supplychain echelons, in other industries with similar supply chain process. It is expected to have moreresearches on this direction in future.AcknowledgmentsThis work is supported by the joint doctorate programme “Sustainable Management and Design forTextiles” which is funded by the European Commission's Erasmus Mundus programme.
References[1] C. N. Verdouw, A. J. M. Beulens, J. H. Trienekens, and J. G. A. J. van der Vorst, ‘A framework
for modelling business processes in demand-driven supply chains’, Prod. Plan. Control, vol.22, no. 4, pp. 365–388, Jun. 2011.
[2] P. Hadaya and L. Cassivi, ‘The role of joint collaboration planning actions in a demand‐drivensupply chain’, Ind. Manag. Data Syst., vol. 107, no. 7, pp. 954–978, Aug. 2007.
[3] P. Buijs and J. C. Wortmann, ‘Joint operational decision-making in collaborative transportationnetworks: the role of IT’, Supply Chain Manag. Int. J., vol. 19, no. 2, pp. 200–210, 2014.
[4] H. M. Abdelsalam and M. M. Elassal, ‘Joint economic lot sizing problem for a three-Layersupply chain with stochastic demand’, Int. J. Prod. Econ., vol. 155, pp. 272–283, 2014.
[5] H. Krishnan and R. A. Winter, ‘On the role of revenue-sharing contracts in supply chains’, Oper.Res. Lett., vol. 39, no. 1, pp. 28–31, 2011.
[6] K. Govindan and M. N. Popiuc, ‘Reverse supply chain coordination by revenue sharing contract:A case for the personal computers industry’, Eur. J. Oper. Res., vol. 233, no. 2, pp. 326–336,2014.
[7] K. Inderfurth, A. Sadrieh, and G. Voigt, ‘The Impact of Information Sharing on Supply ChainPerformance under Asymmetric Information’, Prod. Oper. Manag., vol. 22, no. 2, pp. 410–425, 2013.
[8] M. Ganesh, S. Raghunathan, and C. Rajendran, ‘The value of information sharing in a multi-product, multi-level supply chain: Impact of product substitution, demand correlation, andpartial information sharing’, Decis. Support Syst., vol. 58, pp. 79–94, 2014.
[9] M. Cao, M. A. Vonderembse, Q. Y. Zhang, and T. S. Ragu-Nathan, ‘Supply chain collaboration:conceptualisation and instrument development’, Int. J. Prod. Res., vol. 48, no. 22, pp. 6613–6635, 2010.
[10] W. Kelton and A. Law, Simulation modeling and analysis. McGraw Hill Boston, 2000.[11] A. D. Broadbent, Basic principles of textile coloration, vol. 132. Society of Dyers and Colorists
West Yorkshire, 2001.[12] A. Ormerod and W. S. Sondhelm, Weaving: Technology and operations. CRC, 1995.
Operations management tools to be applied for textile
A Maralcan1 and I Ilhan
2
1 Namık Kemal University, Cerkezkoy Meslek Yuksekokulu, Textile Technologies
Department, Velikoy Cerkezkoy Tekirdag, Turkey 2 Cukurova University, Engineering Faculty, Textile Engineering Department, Balcali Saricam
Adana, Turkey
E-mail: [email protected]
Abstract. In this paper, basic concepts of process analysis such as flow time, inventory,
bottleneck, labour cost and utilization are illustrated first. The effect of bottleneck on the
results of a business are especially emphasized. In the next section, tools on productivity
measurement; KPI (Key Performance Indicators) Tree, OEE (Overall Equipment
Effectiveness) and Takt Time are introduced and exemplified. KPI tree is a diagram on which
we can visualize all the variables of an operation which are driving financial results through
cost and profit. OEE is a tool to measure a potential extra capacity of an equipment or an
employee. Takt time is a tool to determine the process flow rate according to the customer
demand. KPI tree is studied through the whole process while OEE is exemplified for a stenter
frame machine which is the most important machine (and usually the bottleneck) and the most
expensive investment in a finishing plant. Takt time is exemplified for the quality control
department. Finally quality tools, six sigma, control charts and jidoka are introduced. Six sigma
is a tool to measure process capability and by the way probability of a defect. Control chart is
a powerful tool to monitor the process. The idea of jidoka (detect, stop and alert) is about
alerting the people that there is a problem in the process.
1. Basic concepts
Every business has the aim to maximize profits. Operations management tools are applicable for any
business and any industry in order to help to maximize profits by means of both high productivity and
high quality. In this paper, several operations management tools are introduced and applied for a
finishing plant to measure operational performance. By the way, an effective toolset, serving scientific
management, is provided for the managers of textile operations.
To start with, basic concepts of process analysis are illustrated following which operations
management tries to improve results of these:
Flow time: The time needed for a unit of product or service to be produced. By the way, this is the
time from the start to the end of the process for one unit.
Flow rate: Units to be produced per certain time. The reciprocal (1/x) of flow time.
Inventory: The total amount of units in a process. Raw, semi or final products are considered.
Bottleneck: The work station which has the least capacity. Having least capacity, the bottleneck is the
step driving the production. By the way, the capacity of the process, maybe even the capacity of the
business, is the same of the capacity of the bottleneck. In a finishing plant, the bottleneck is usually the
stenter frame machines. So in this paper, these machines would be mentioned more frequently.
Direct labor cost: The cost of directly workers’ pay for the production of one unit.
Utilization: The percentage of working time over the total time paid for.
2. Operations management tools for textiles
Strategic initiatives allows companies to shine in their respective arenas. These include (a) business
process reengineering, (b) just-in-time manufacturing and purchasing systems, (c) time-based
competition, and (d) competing quality [1].
Efficient production of goods and services requires effective applications of the concepts, tools and
techniques of operations management. Productivity and quality are two legs of a business running
together. Operations management serves many tools on productivity and quality in a process. In this
paper is exemplified six different tools, three of which is in service of productivity mostly, while the
other three is quality biased. It should never be neglected that any tool helps also the other side to go
forward. These tools are KPI (Key Performance Indicators) tree, Overall Equipment Effectiveness and
Takt Time for productivity and six sigma and process capability, control charts and jidoka for quality.
Many more are available and can be adopted textile business.
2.1. KPI tree
KPI tree, where KPI stands for “key performance indicators”, is a tool that visualizes the relationship
between operational variables and financial variables.
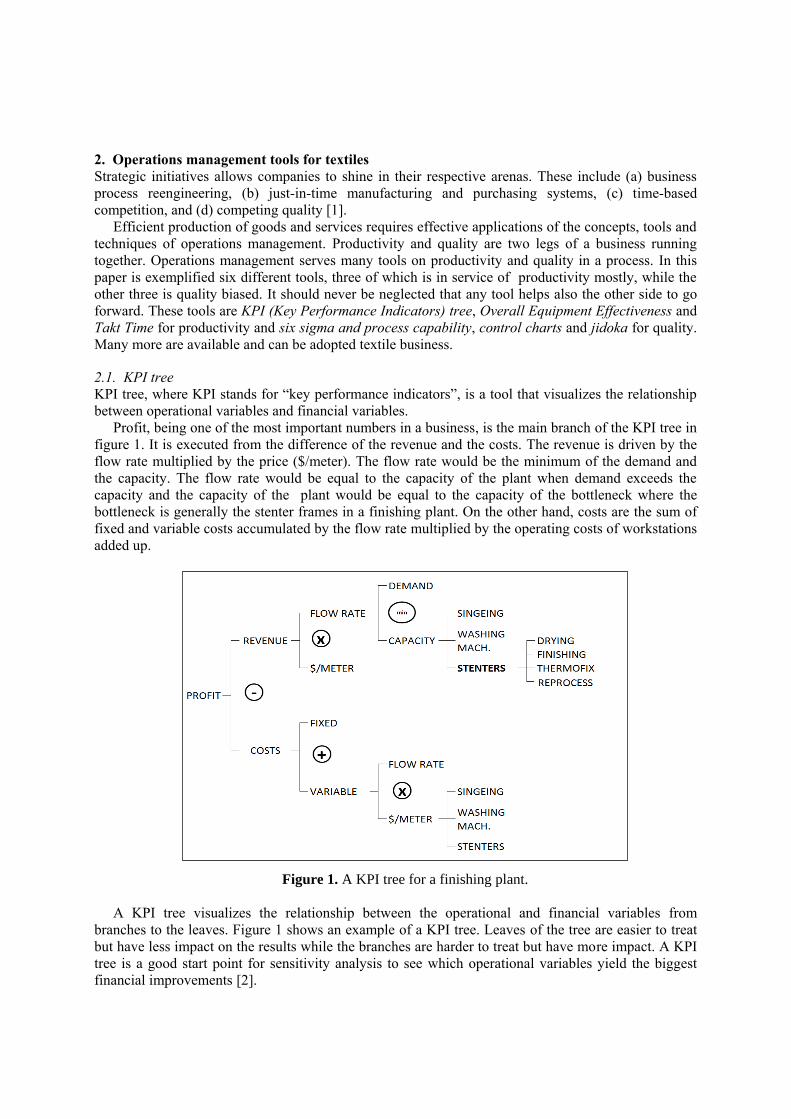
Profit, being one of the most important numbers in a business, is the main branch of the KPI tree in
figure 1. It is executed from the difference of the revenue and the costs. The revenue is driven by the
flow rate multiplied by the price ($/meter). The flow rate would be the minimum of the demand and
the capacity. The flow rate would be equal to the capacity of the plant when demand exceeds the
capacity and the capacity of the plant would be equal to the capacity of the bottleneck where the
bottleneck is generally the stenter frames in a finishing plant. On the other hand, costs are the sum of
fixed and variable costs accumulated by the flow rate multiplied by the operating costs of workstations
added up.
Figure 1. A KPI tree for a finishing plant.
A KPI tree visualizes the relationship between the operational and financial variables from
branches to the leaves. Figure 1 shows an example of a KPI tree. Leaves of the tree are easier to treat
but have less impact on the results while the branches are harder to treat but have more impact. A KPI
tree is a good start point for sensitivity analysis to see which operational variables yield the biggest
financial improvements [2].
2.2. Overall Equipment Effectiveness (OEE)
Companies purchase expensive machines for example stenter frames. Such machines should be fully
utilized in order to pay back. But unfortunately, a stenter frame machine might be utilized less than
50%. Overall Equipment Effectiveness (OEE) is a powerful tool that helps to analyze the utilization
and downtime of a machine and to see the potential for productivity improvement.
Through a ‘working hours’ spreadsheet of a machine, OEE diagram can be prepared. The diagram
shows the effective time of the machine and downtime reasons dramatically. By the diagram of a
machine, managers see where improvements can be provided faster and easier and more results are
obtained. Different machines can also be compared to set a start point.
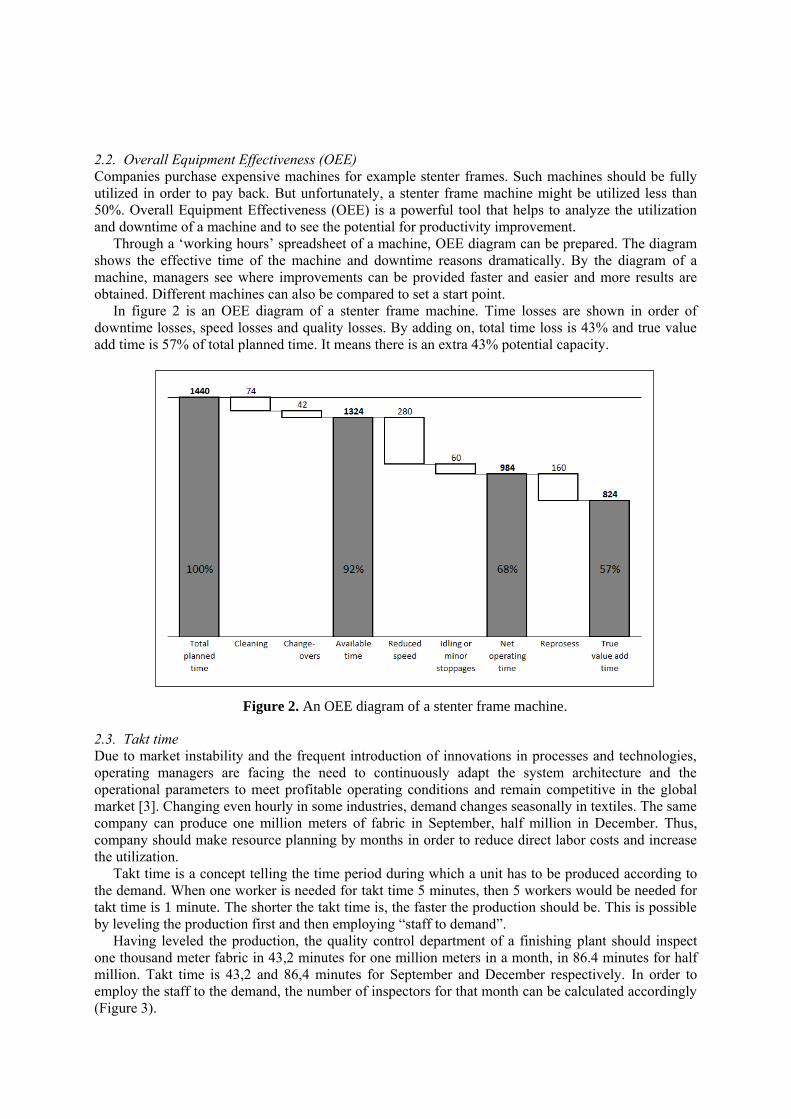
In figure 2 is an OEE diagram of a stenter frame machine. Time losses are shown in order of
downtime losses, speed losses and quality losses. By adding on, total time loss is 43% and true value
add time is 57% of total planned time. It means there is an extra 43% potential capacity.
Figure 2. An OEE diagram of a stenter frame machine.
2.3. Takt time
Due to market instability and the frequent introduction of innovations in processes and technologies,
operating managers are facing the need to continuously adapt the system architecture and the
operational parameters to meet profitable operating conditions and remain competitive in the global
market [3]. Changing even hourly in some industries, demand changes seasonally in textiles. The same
company can produce one million meters of fabric in September, half million in December. Thus,
company should make resource planning by months in order to reduce direct labor costs and increase
the utilization.
Takt time is a concept telling the time period during which a unit has to be produced according to
the demand. When one worker is needed for takt time 5 minutes, then 5 workers would be needed for
takt time is 1 minute. The shorter the takt time is, the faster the production should be. This is possible
by leveling the production first and then employing “staff to demand”.
Having leveled the production, the quality control department of a finishing plant should inspect
one thousand meter fabric in 43,2 minutes for one million meters in a month, in 86.4 minutes for half
million. Takt time is 43,2 and 86,4 minutes for September and December respectively. In order to
employ the staff to the demand, the number of inspectors for that month can be calculated accordingly
(Figure 3).
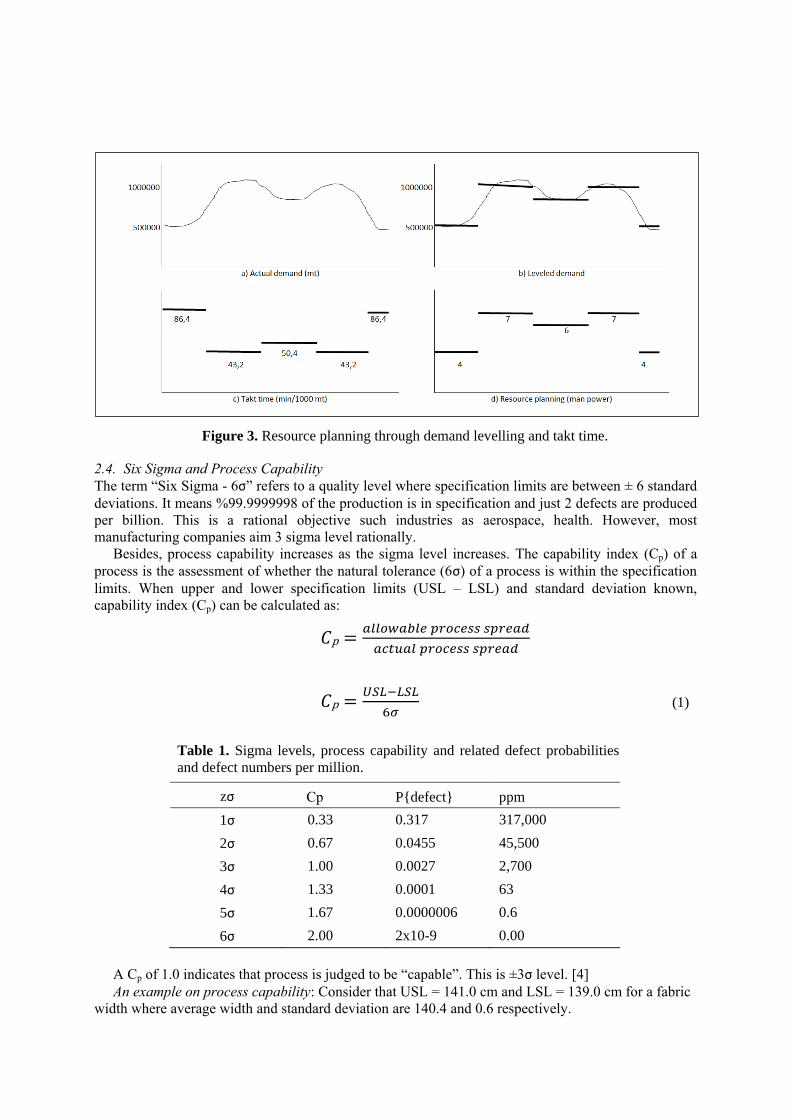
Figure 3. Resource planning through demand levelling and takt time.
2.4. Six Sigma and Process Capability
The term “Six Sigma - 6σ” refers to a quality level where specification limits are between ± 6 standard
deviations. It means %99.9999998 of the production is in specification and just 2 defects are produced
per billion. This is a rational objective such industries as aerospace, health. However, most
manufacturing companies aim 3 sigma level rationally.
Besides, process capability increases as the sigma level increases. The capability index (Cp) of a
process is the assessment of whether the natural tolerance (6σ) of a process is within the specification
limits. When upper and lower specification limits (USL – LSL) and standard deviation known,
capability index (Cp) can be calculated as:
𝐶p =𝑎𝑙𝑙𝑜𝑤𝑎𝑏𝑙𝑒 𝑝𝑟𝑜𝑐𝑒𝑠𝑠 𝑠𝑝𝑟𝑒𝑎𝑑
𝑎𝑐𝑡𝑢𝑎𝑙 𝑝𝑟𝑜𝑐𝑒𝑠𝑠 𝑠𝑝𝑟𝑒𝑎𝑑
𝐶p =𝑈𝑆𝐿−𝐿𝑆𝐿
6𝜎 (1)
Table 1. Sigma levels, process capability and related defect probabilities
and defect numbers per million.
zσ Cp P{defect} ppm
1σ 0.33 0.317 317,000
2σ 0.67 0.0455 45,500
3σ 1.00 0.0027 2,700
4σ 1.33 0.0001 63
5σ 1.67 0.0000006 0.6
6σ 2.00 2x10⁻⁹ 0.00
A Cp of 1.0 indicates that process is judged to be “capable”. This is ±3σ level. [4]
An example on process capability: Consider that USL = 141.0 cm and LSL = 139.0 cm for a fabric
width where average width and standard deviation are 140.4 and 0.6 respectively.
Cp was calculated by equation (1) and found 0.56 which is less than 2σ for this specification. Being
the average 140.4 not the middle of upper and lower specification limits, it can be calculated –thanks
Excel- that 15.9% of the production would exceed 141.0 cm and 1.0% would go below 139.0. Due to
the high defect probability, such a deal might not be profitable for marketing.
2.5. Control charts
Control charts are powerful tools for statistical process control. A finishing plant could monitor many
process and product parameters by control charts and catch any problems about machine settings and
product specifications. It is as easy as plotting measured data on a graph and add on.
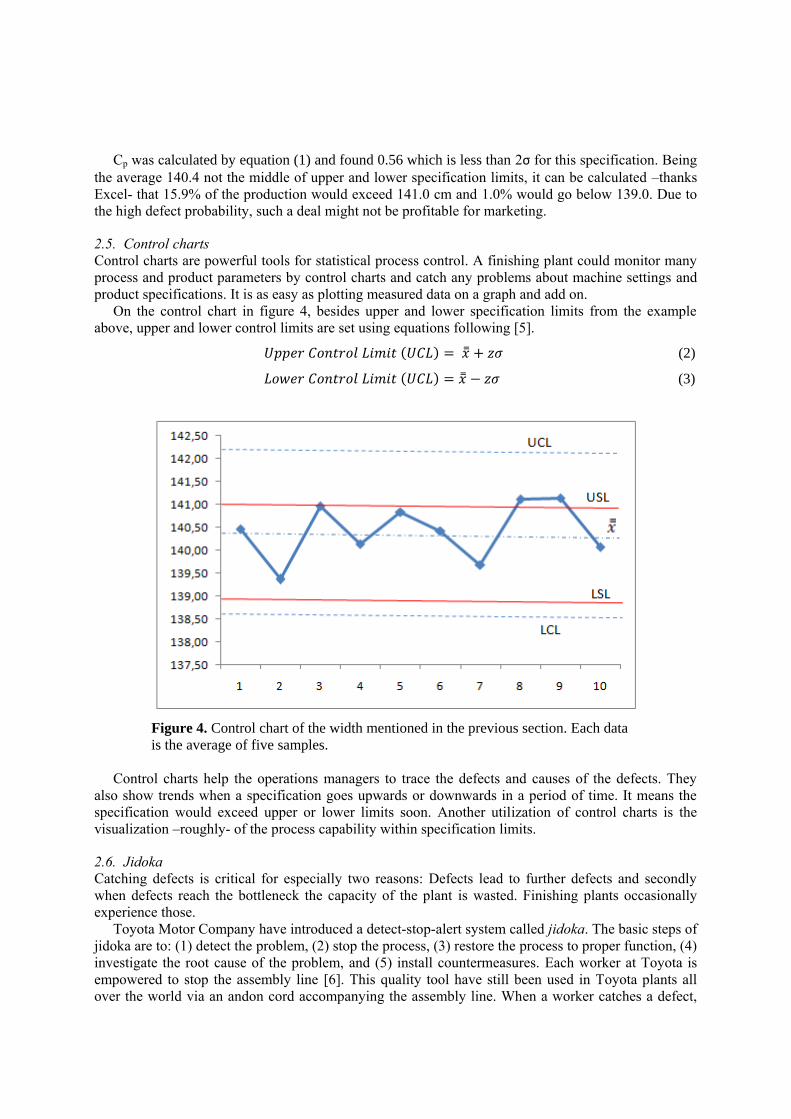
On the control chart in figure 4, besides upper and lower specification limits from the example
above, upper and lower control limits are set using equations following [5].
𝑈𝑝𝑝𝑒𝑟 𝐶𝑜𝑛𝑡𝑟𝑜𝑙 𝐿𝑖𝑚𝑖𝑡 (𝑈𝐶𝐿) = �̿� + 𝑧𝜎 (2)
𝐿𝑜𝑤𝑒𝑟 𝐶𝑜𝑛𝑡𝑟𝑜𝑙 𝐿𝑖𝑚𝑖𝑡 (𝑈𝐶𝐿) = �̿� − 𝑧𝜎 (3)
Figure 4. Control chart of the width mentioned in the previous section. Each data
is the average of five samples.
Control charts help the operations managers to trace the defects and causes of the defects. They
also show trends when a specification goes upwards or downwards in a period of time. It means the
specification would exceed upper or lower limits soon. Another utilization of control charts is the
visualization –roughly- of the process capability within specification limits.
2.6. Jidoka
Catching defects is critical for especially two reasons: Defects lead to further defects and secondly
when defects reach the bottleneck the capacity of the plant is wasted. Finishing plants occasionally
experience those.
Toyota Motor Company have introduced a detect-stop-alert system called jidoka. The basic steps of
jidoka are to: (1) detect the problem, (2) stop the process, (3) restore the process to proper function, (4)
investigate the root cause of the problem, and (5) install countermeasures. Each worker at Toyota is
empowered to stop the assembly line [6]. This quality tool have still been used in Toyota plants all
over the world via an andon cord accompanying the assembly line. When a worker catches a defect,
he/she pulls the cord to stop and alert whole plant. Plant stops. Managers, engineers and workers come
to the incidence scene –gemba in Japanese. The plant would only run after the problem is solved and
root causes are eliminated in order not to experience such a defect again.
The system had been developed initially for weaving looms of Toyota before Toyota was a motor
company. Weaving machines have still got those lights to alert people when stop due to a defect.
3. Conclusion
There is so fierce competition in textile industry as every business. The one and only way of success is
“scientific management” in a highly competitive business world.
This paper shows that a finishing plant can employ practically at least six effective tools in order to
serve scientific management and measurable operations instead of rule of thumb. These tools and
more tools alike can be applied simply and easily by textile managers. Some of them like control
charts and jidoka could even be applied by workers. Harmony, cooperation, high efficiency and
maximum output would take place by such an operations management.
References
[1] Nahmias S 2009 Production and Operations Analysis (New York: McGraw-Hill) p 1
[2] https://www.coursera.org/learn/wharton-operations/lecture/eFeyw/key-performance-indicators-
and-kpi-trees
[3] Rehab M A and Ahmed M D 2014 Dynamic Lean Assessment for Takt Time Implementation
Variety Management in Manufacturing Procedia CIRP 17(2014)577
[4] Kane V E 1986 Process Capability Indices Journal of Quality Technol 18 p 41
[5] Heizer J and Render B 2014 Operations Management: Sustainability and Supply Chain
Management (London: Pearson) pp 274-278
[6] Grout J R and Toussaint J S 2010 Process Capability Indices Business Horizons 53 p 151
Competitive strategies in fashion industries: Portuguese
footwear industry
A D Marques1, G Guedes
2 and F Ferreira
3
1,2,3 University of Minho, 2C2T, Textile Department, Campus de Azurém, Guimarães,
Portugal
Email: [email protected]
Abstract. Portugal is an important player in the European fashion industry. The Portuguese
footwear industry, “low-tech” and traditional industry, dominated by SMEs and located in two
main clusters, is a success case in the Portuguese economy. After a long period of decline until
2009, the footwear companies prepared new strategies that made big changes in the image and
performance achieved. Since 2009, exports have increased more than 55% and the Portuguese
footwear has grown in almost all the most important foreign markets. The competitive
strategies followed by the Portuguese footwear companies are different and they can be clearly
identified according Porter’s three generic competitive strategies: cost leadership,
differentiation and focus strategy. This paper had analysed seven Portuguese footwear
companies (seven cases, case study strategy) and the results obtained shows how important is
to have the right approach to the markets, according the internal and external resources that
each firm has available. The footwear clusters in Portugal and the sectorial organizations are
also very important in this competitive performance achieved by the companies. Last years the
Portuguese governments recognize this increasing importance of the fashion industries and
prepared several programs to promote these industries in Europe and other continents.
1. Introduction
Portugal is an important player in the European fashion industry, regardless of whether you are talking
about textiles, clothing, furniture or footwear. The Portuguese footwear industry, “low-tech” and
traditional industry, dominated by SMEs and located in two main clusters, is a success case in the
Portuguese economy. After a long period of decline until 2009, the footwear companies prepared new
strategies that made big changes in the image and performance achieved. This industry had in the last
six years a remarkable performance in several indicators, a reference in the Portuguese industry [1]. In
2016, Portugal exported more than 81 million pairs of shoes, an amount of more than 1 923 million
euros, a growth of 3.2% over 2015. Leather footwear are the main category of Portuguese footwear
exports, that gives the 10th position in the international context (value of 1 840 million of USD in 2015
and a World Share of 3,4% - Table 1). As a result of an unprecedented investment in international
markets, Portugal now exports more than 95% of its production to 152 countries on five continents [1].
These research fulfil the lack of empirical knowledge in the linkage between competitive strategies,
innovation and own brands in “low-tech” industries. Moreover, as fashion industry, footwear, apparel
and textile are strategic for the national authorities. The European Framework for Research and
Innovation – Horizon 2020, is assumed as a main instrument to the companies became more
competitive. But the financial resources and internal skills has to be focused in the right strategic
direction. Both footwear clusters are very committed to cooperate and to take a chance to increase his
position in news markets, mainly outside of Europe.
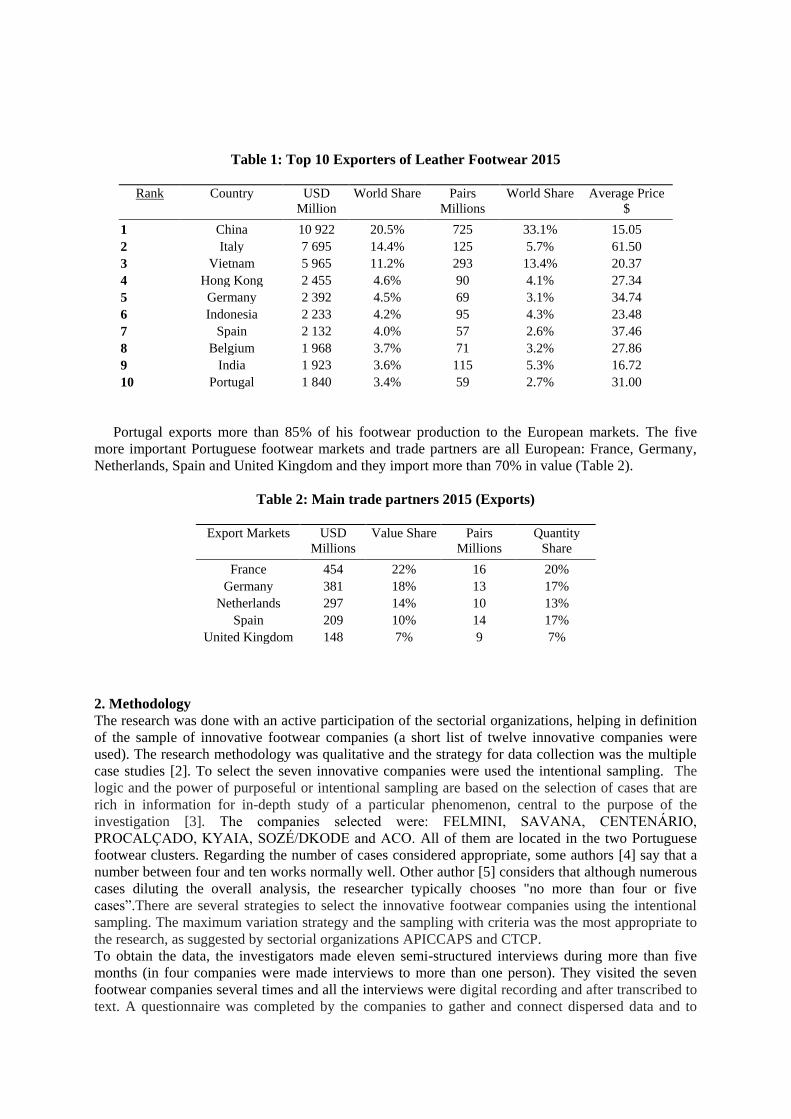
Table 1: Top 10 Exporters of Leather Footwear 2015
Rank Country USD
Million
World Share Pairs
Millions
World Share Average Price
$
1 China 10 922 20.5% 725 33.1% 15.05
2 Italy 7 695 14.4% 125 5.7% 61.50
3 Vietnam 5 965 11.2% 293 13.4% 20.37
4 Hong Kong 2 455 4.6% 90 4.1% 27.34
5 Germany 2 392 4.5% 69 3.1% 34.74
6 Indonesia 2 233 4.2% 95 4.3% 23.48
7 Spain 2 132 4.0% 57 2.6% 37.46
8 Belgium 1 968 3.7% 71 3.2% 27.86
9 India 1 923 3.6% 115 5.3% 16.72
10 Portugal 1 840 3.4% 59 2.7% 31.00
Portugal exports more than 85% of his footwear production to the European markets. The five
more important Portuguese footwear markets and trade partners are all European: France, Germany,
Netherlands, Spain and United Kingdom and they import more than 70% in value (Table 2).
Table 2: Main trade partners 2015 (Exports)
Export Markets USD
Millions
Value Share Pairs
Millions
Quantity
Share
France 454 22% 16 20%
Germany 381 18% 13 17%
Netherlands 297 14% 10 13%
Spain 209 10% 14 17%
United Kingdom 148 7% 9 7%
2. Methodology
The research was done with an active participation of the sectorial organizations, helping in definition
of the sample of innovative footwear companies (a short list of twelve innovative companies were
used). The research methodology was qualitative and the strategy for data collection was the multiple
case studies [2]. To select the seven innovative companies were used the intentional sampling. The
logic and the power of purposeful or intentional sampling are based on the selection of cases that are
rich in information for in-depth study of a particular phenomenon, central to the purpose of the
investigation [3]. The companies selected were: FELMINI, SAVANA, CENTENÁRIO,
PROCALÇADO, KYAIA, SOZÉ/DKODE and ACO. All of them are located in the two Portuguese
footwear clusters. Regarding the number of cases considered appropriate, some authors [4] say that a
number between four and ten works normally well. Other author [5] considers that although numerous
cases diluting the overall analysis, the researcher typically chooses "no more than four or five
cases”.There are several strategies to select the innovative footwear companies using the intentional
sampling. The maximum variation strategy and the sampling with criteria was the most appropriate to
the research, as suggested by sectorial organizations APICCAPS and CTCP.
To obtain the data, the investigators made eleven semi-structured interviews during more than five
months (in four companies were made interviews to more than one person). They visited the seven
footwear companies several times and all the interviews were digital recording and after transcribed to
text. A questionnaire was completed by the companies to gather and connect dispersed data and to
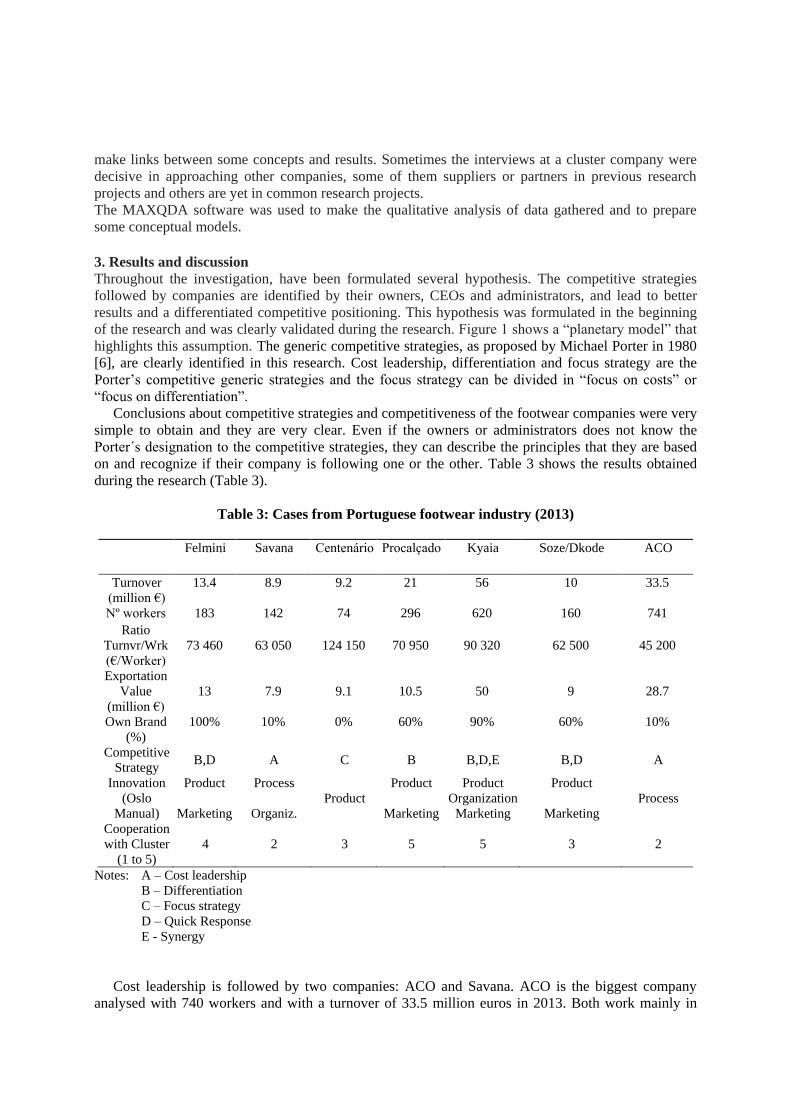
make links between some concepts and results. Sometimes the interviews at a cluster company were
decisive in approaching other companies, some of them suppliers or partners in previous research
projects and others are yet in common research projects.
The MAXQDA software was used to make the qualitative analysis of data gathered and to prepare
some conceptual models.
3. Results and discussion
Throughout the investigation, have been formulated several hypothesis. The competitive strategies
followed by companies are identified by their owners, CEOs and administrators, and lead to better
results and a differentiated competitive positioning. This hypothesis was formulated in the beginning
of the research and was clearly validated during the research. Figure 1 shows a “planetary model” that
highlights this assumption. The generic competitive strategies, as proposed by Michael Porter in 1980
[6], are clearly identified in this research. Cost leadership, differentiation and focus strategy are the
Porter’s competitive generic strategies and the focus strategy can be divided in “focus on costs” or
“focus on differentiation”.
Conclusions about competitive strategies and competitiveness of the footwear companies were very
simple to obtain and they are very clear. Even if the owners or administrators does not know the
Porter´s designation to the competitive strategies, they can describe the principles that they are based
on and recognize if their company is following one or the other. Table 3 shows the results obtained
during the research (Table 3).
Table 3: Cases from Portuguese footwear industry (2013)
Felmini Savana Centenário Procalçado Kyaia Soze/Dkode ACO
Turnover
(million €)
13.4 8.9 9.2 21 56 10 33.5
Nº workers 183 142 74 296 620 160 741
Ratio
Turnvr/Wrk
(€/Worker)
73 460 63 050 124 150 70 950 90 320 62 500 45 200
Exportation
Value
(million €)
13 7.9 9.1 10.5 50 9 28.7
Own Brand
(%)
100% 10% 0% 60% 90% 60% 10%
Competitive
Strategy B,D A C B B,D,E B,D A
Innovation
(Oslo
Manual)
Product
Marketing
Process
Organiz.
Product
Product
Marketing
Product
Organization
Marketing
Product
Marketing
Process
Cooperation
with Cluster
(1 to 5)
4 2 3 5 5 3 2
Notes: A – Cost leadership
B – Differentiation
C – Focus strategy
D – Quick Response
E - Synergy
Cost leadership is followed by two companies: ACO and Savana. ACO is the biggest company
analysed with 740 workers and with a turnover of 33.5 million euros in 2013. Both work mainly in
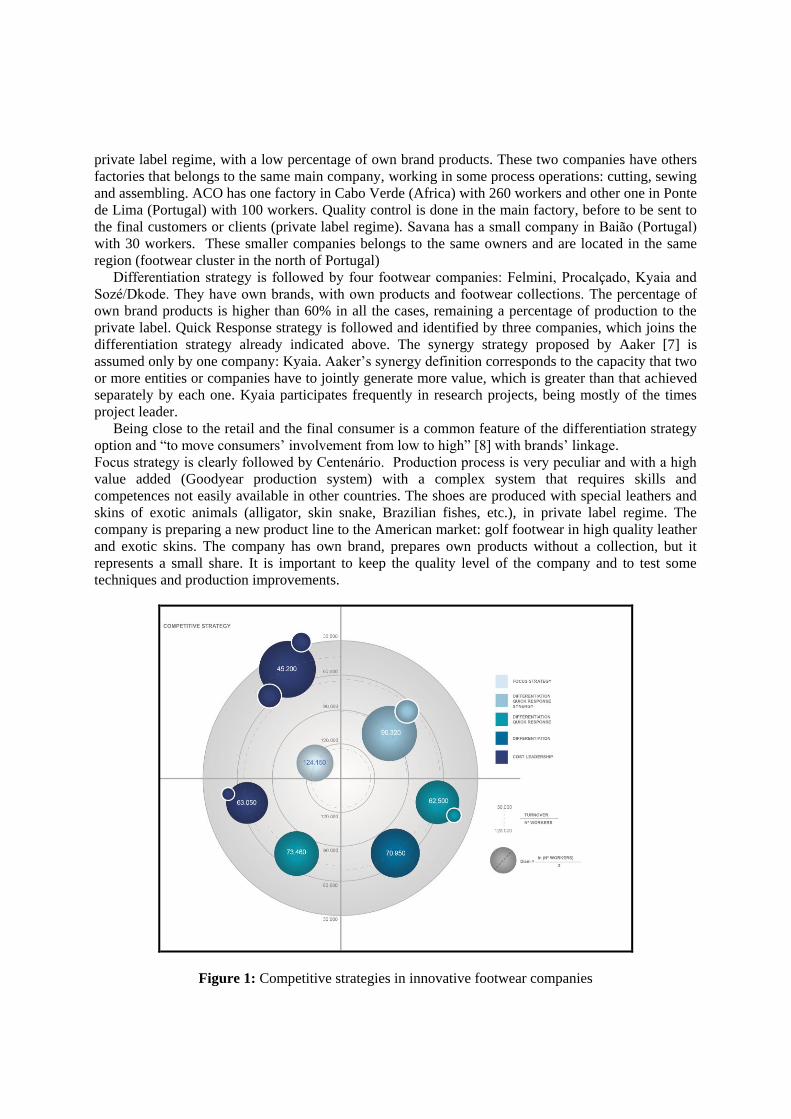
private label regime, with a low percentage of own brand products. These two companies have others
factories that belongs to the same main company, working in some process operations: cutting, sewing
and assembling. ACO has one factory in Cabo Verde (Africa) with 260 workers and other one in Ponte
de Lima (Portugal) with 100 workers. Quality control is done in the main factory, before to be sent to
the final customers or clients (private label regime). Savana has a small company in Baião (Portugal)
with 30 workers. These smaller companies belongs to the same owners and are located in the same
region (footwear cluster in the north of Portugal)
Differentiation strategy is followed by four footwear companies: Felmini, Procalçado, Kyaia and
Sozé/Dkode. They have own brands, with own products and footwear collections. The percentage of
own brand products is higher than 60% in all the cases, remaining a percentage of production to the
private label. Quick Response strategy is followed and identified by three companies, which joins the
differentiation strategy already indicated above. The synergy strategy proposed by Aaker [7] is
assumed only by one company: Kyaia. Aaker’s synergy definition corresponds to the capacity that two
or more entities or companies have to jointly generate more value, which is greater than that achieved
separately by each one. Kyaia participates frequently in research projects, being mostly of the times
project leader.
Being close to the retail and the final consumer is a common feature of the differentiation strategy
option and “to move consumers’ involvement from low to high” [8] with brands’ linkage.
Focus strategy is clearly followed by Centenário. Production process is very peculiar and with a high
value added (Goodyear production system) with a complex system that requires skills and
competences not easily available in other countries. The shoes are produced with special leathers and
skins of exotic animals (alligator, skin snake, Brazilian fishes, etc.), in private label regime. The
company is preparing a new product line to the American market: golf footwear in high quality leather
and exotic skins. The company has own brand, prepares own products without a collection, but it
represents a small share. It is important to keep the quality level of the company and to test some
techniques and production improvements.
Figure 1: Competitive strategies in innovative footwear companies
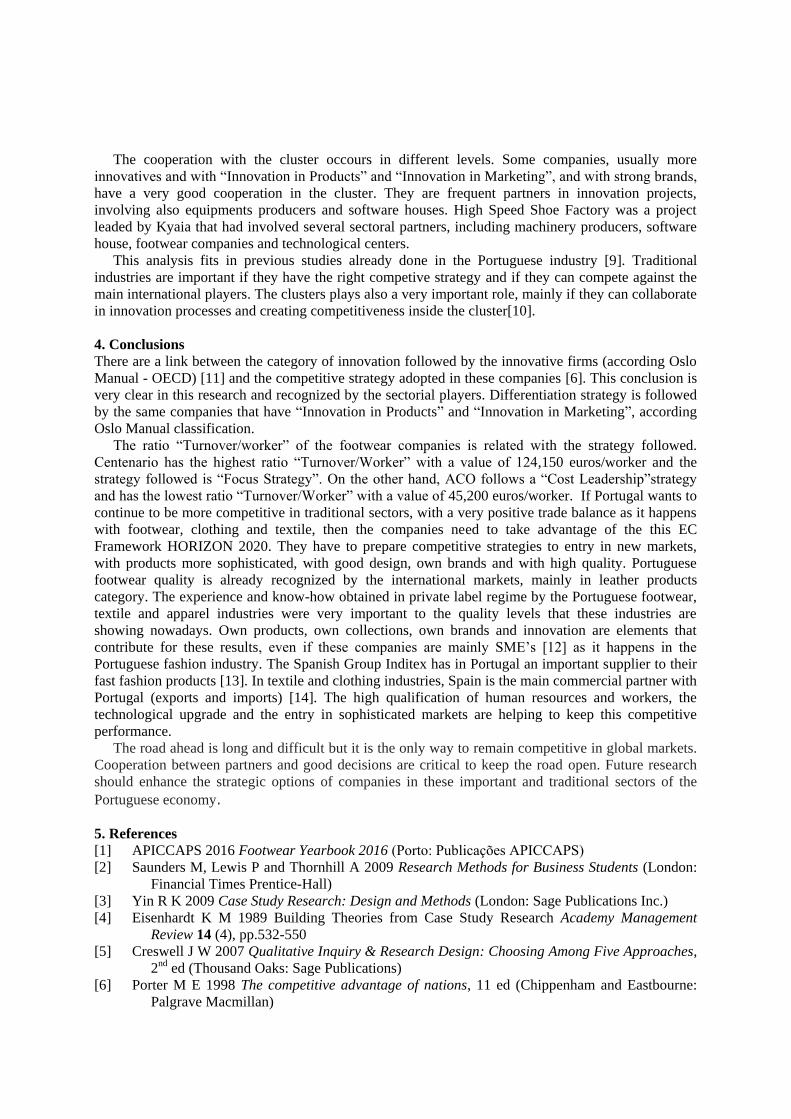
The cooperation with the cluster occours in different levels. Some companies, usually more
innovatives and with “Innovation in Products” and “Innovation in Marketing”, and with strong brands,
have a very good cooperation in the cluster. They are frequent partners in innovation projects,
involving also equipments producers and software houses. High Speed Shoe Factory was a project
leaded by Kyaia that had involved several sectoral partners, including machinery producers, software
house, footwear companies and technological centers.
This analysis fits in previous studies already done in the Portuguese industry [9]. Traditional
industries are important if they have the right competive strategy and if they can compete against the
main international players. The clusters plays also a very important role, mainly if they can collaborate
in innovation processes and creating competitiveness inside the cluster[10].
4. Conclusions
There are a link between the category of innovation followed by the innovative firms (according Oslo
Manual - OECD) [11] and the competitive strategy adopted in these companies [6]. This conclusion is
very clear in this research and recognized by the sectorial players. Differentiation strategy is followed
by the same companies that have “Innovation in Products” and “Innovation in Marketing”, according
Oslo Manual classification.
The ratio “Turnover/worker” of the footwear companies is related with the strategy followed.
Centenario has the highest ratio “Turnover/Worker” with a value of 124,150 euros/worker and the
strategy followed is “Focus Strategy”. On the other hand, ACO follows a “Cost Leadership”strategy
and has the lowest ratio “Turnover/Worker” with a value of 45,200 euros/worker. If Portugal wants to
continue to be more competitive in traditional sectors, with a very positive trade balance as it happens
with footwear, clothing and textile, then the companies need to take advantage of the this EC
Framework HORIZON 2020. They have to prepare competitive strategies to entry in new markets,
with products more sophisticated, with good design, own brands and with high quality. Portuguese
footwear quality is already recognized by the international markets, mainly in leather products
category. The experience and know-how obtained in private label regime by the Portuguese footwear,
textile and apparel industries were very important to the quality levels that these industries are
showing nowadays. Own products, own collections, own brands and innovation are elements that
contribute for these results, even if these companies are mainly SME’s [12] as it happens in the
Portuguese fashion industry. The Spanish Group Inditex has in Portugal an important supplier to their
fast fashion products [13]. In textile and clothing industries, Spain is the main commercial partner with
Portugal (exports and imports) [14]. The high qualification of human resources and workers, the
technological upgrade and the entry in sophisticated markets are helping to keep this competitive
performance.
The road ahead is long and difficult but it is the only way to remain competitive in global markets.
Cooperation between partners and good decisions are critical to keep the road open. Future research
should enhance the strategic options of companies in these important and traditional sectors of the
Portuguese economy.
5. References
[1] APICCAPS 2016 Footwear Yearbook 2016 (Porto: Publicações APICCAPS)
[2] Saunders M, Lewis P and Thornhill A 2009 Research Methods for Business Students (London:
Financial Times Prentice-Hall)
[3] Yin R K 2009 Case Study Research: Design and Methods (London: Sage Publications Inc.)
[4] Eisenhardt K M 1989 Building Theories from Case Study Research Academy Management
Review 14 (4), pp.532-550
[5] Creswell J W 2007 Qualitative Inquiry & Research Design: Choosing Among Five Approaches,
2nd ed (Thousand Oaks: Sage Publications)
[6] Porter M E 1998 The competitive advantage of nations, 11 ed (Chippenham and Eastbourne:
Palgrave Macmillan)
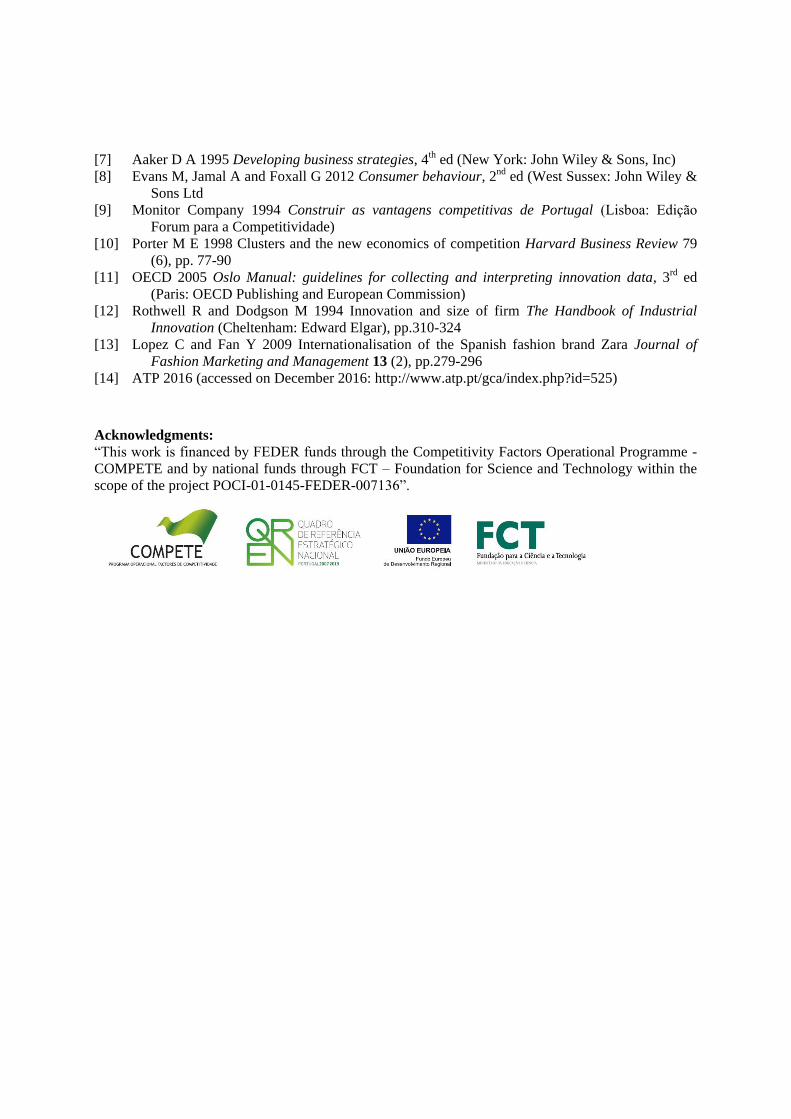
[7] Aaker D A 1995 Developing business strategies, 4th ed (New York: John Wiley & Sons, Inc)
[8] Evans M, Jamal A and Foxall G 2012 Consumer behaviour, 2nd
ed (West Sussex: John Wiley &
Sons Ltd
[9] Monitor Company 1994 Construir as vantagens competitivas de Portugal (Lisboa: Edição
Forum para a Competitividade)
[10] Porter M E 1998 Clusters and the new economics of competition Harvard Business Review 79
(6), pp. 77-90
[11] OECD 2005 Oslo Manual: guidelines for collecting and interpreting innovation data, 3rd ed
(Paris: OECD Publishing and European Commission)
[12] Rothwell R and Dodgson M 1994 Innovation and size of firm The Handbook of Industrial
Innovation (Cheltenham: Edward Elgar), pp.310-324
[13] Lopez C and Fan Y 2009 Internationalisation of the Spanish fashion brand Zara Journal of
Fashion Marketing and Management 13 (2), pp.279-296
[14] ATP 2016 (accessed on December 2016: http://www.atp.pt/gca/index.php?id=525)
Acknowledgments:
“This work is financed by FEDER funds through the Competitivity Factors Operational Programme -
COMPETE and by national funds through FCT – Foundation for Science and Technology within the
scope of the project POCI-01-0145-FEDER-007136”.
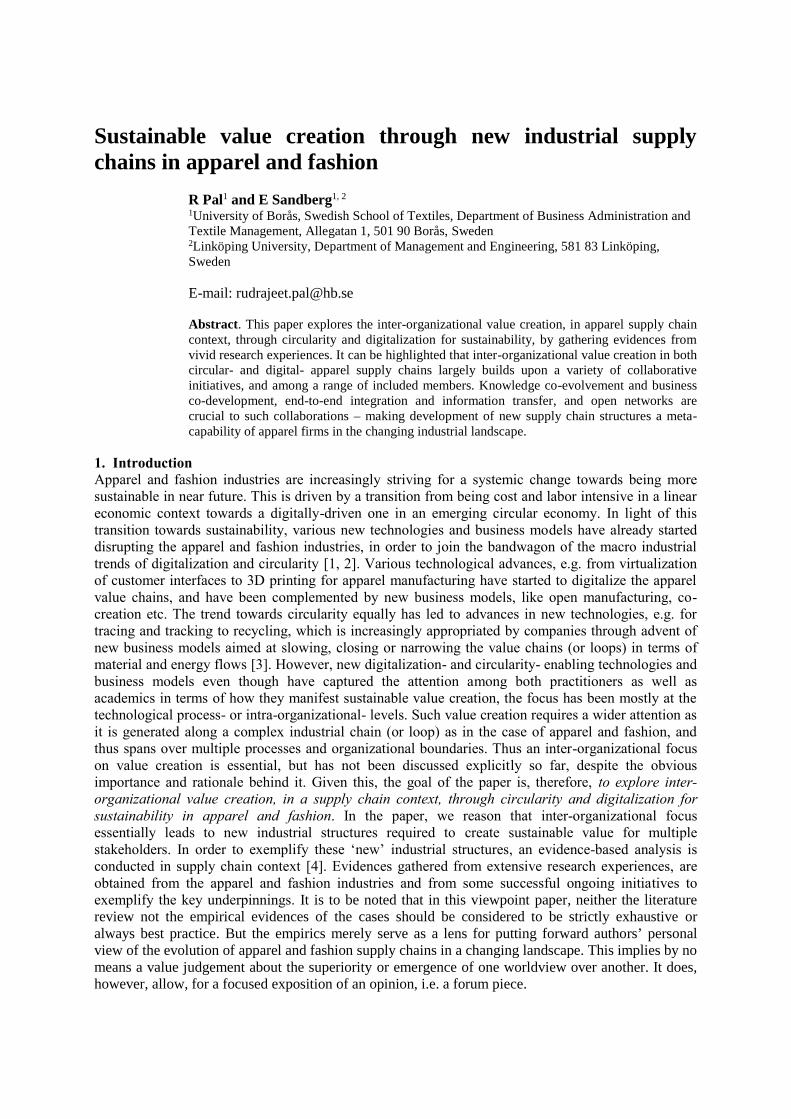
Sustainable value creation through new industrial supplychains in apparel and fashion
R Pal1 and E Sandberg1, 2
1University of Borås, Swedish School of Textiles, Department of Business Administration andTextile Management, Allegatan 1, 501 90 Borås, Sweden2Linköping University, Department of Management and Engineering, 581 83 Linköping,Sweden
E-mail: [email protected]
Abstract. This paper explores the inter-organizational value creation, in apparel supply chaincontext, through circularity and digitalization for sustainability, by gathering evidences fromvivid research experiences. It can be highlighted that inter-organizational value creation in bothcircular- and digital- apparel supply chains largely builds upon a variety of collaborativeinitiatives, and among a range of included members. Knowledge co-evolvement and businessco-development, end-to-end integration and information transfer, and open networks arecrucial to such collaborations – making development of new supply chain structures a meta-capability of apparel firms in the changing industrial landscape.
1. IntroductionApparel and fashion industries are increasingly striving for a systemic change towards being moresustainable in near future. This is driven by a transition from being cost and labor intensive in a lineareconomic context towards a digitally-driven one in an emerging circular economy. In light of thistransition towards sustainability, various new technologies and business models have already starteddisrupting the apparel and fashion industries, in order to join the bandwagon of the macro industrialtrends of digitalization and circularity [1, 2]. Various technological advances, e.g. from virtualizationof customer interfaces to 3D printing for apparel manufacturing have started to digitalize the apparelvalue chains, and have been complemented by new business models, like open manufacturing, co-creation etc. The trend towards circularity equally has led to advances in new technologies, e.g. fortracing and tracking to recycling, which is increasingly appropriated by companies through advent ofnew business models aimed at slowing, closing or narrowing the value chains (or loops) in terms ofmaterial and energy flows [3]. However, new digitalization- and circularity- enabling technologies andbusiness models even though have captured the attention among both practitioners as well asacademics in terms of how they manifest sustainable value creation, the focus has been mostly at thetechnological process- or intra-organizational- levels. Such value creation requires a wider attention asit is generated along a complex industrial chain (or loop) as in the case of apparel and fashion, andthus spans over multiple processes and organizational boundaries. Thus an inter-organizational focuson value creation is essential, but has not been discussed explicitly so far, despite the obviousimportance and rationale behind it. Given this, the goal of the paper is, therefore, to explore inter-organizational value creation, in a supply chain context, through circularity and digitalization forsustainability in apparel and fashion. In the paper, we reason that inter-organizational focusessentially leads to new industrial structures required to create sustainable value for multiplestakeholders. In order to exemplify these ‘new’ industrial structures, an evidence-based analysis isconducted in supply chain context [4]. Evidences gathered from extensive research experiences, areobtained from the apparel and fashion industries and from some successful ongoing initiatives toexemplify the key underpinnings. It is to be noted that in this viewpoint paper, neither the literaturereview not the empirical evidences of the cases should be considered to be strictly exhaustive oralways best practice. But the empirics merely serve as a lens for putting forward authors’ personalview of the evolution of apparel and fashion supply chains in a changing landscape. This implies by nomeans a value judgement about the superiority or emergence of one worldview over another. It does,however, allow, for a focused exposition of an opinion, i.e. a forum piece.
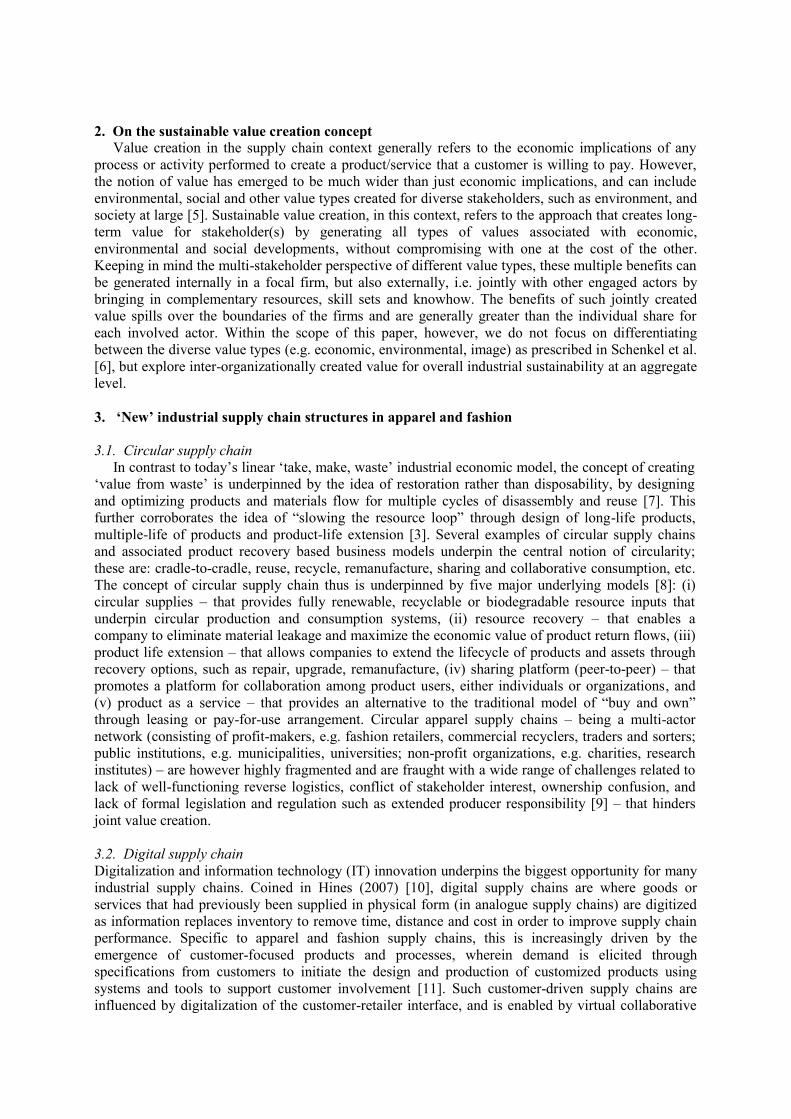
2. On the sustainable value creation conceptValue creation in the supply chain context generally refers to the economic implications of any
process or activity performed to create a product/service that a customer is willing to pay. However,the notion of value has emerged to be much wider than just economic implications, and can includeenvironmental, social and other value types created for diverse stakeholders, such as environment, andsociety at large [5]. Sustainable value creation, in this context, refers to the approach that creates long-term value for stakeholder(s) by generating all types of values associated with economic,environmental and social developments, without compromising with one at the cost of the other.Keeping in mind the multi-stakeholder perspective of different value types, these multiple benefits canbe generated internally in a focal firm, but also externally, i.e. jointly with other engaged actors bybringing in complementary resources, skill sets and knowhow. The benefits of such jointly createdvalue spills over the boundaries of the firms and are generally greater than the individual share foreach involved actor. Within the scope of this paper, however, we do not focus on differentiatingbetween the diverse value types (e.g. economic, environmental, image) as prescribed in Schenkel et al.[6], but explore inter-organizationally created value for overall industrial sustainability at an aggregatelevel.
3. ‘New’ industrial supply chain structures in apparel and fashion
3.1. Circular supply chainIn contrast to today’s linear ‘take, make, waste’ industrial economic model, the concept of creating
‘value from waste’ is underpinned by the idea of restoration rather than disposability, by designingand optimizing products and materials flow for multiple cycles of disassembly and reuse [7]. Thisfurther corroborates the idea of “slowing the resource loop” through design of long-life products,multiple-life of products and product-life extension [3]. Several examples of circular supply chainsand associated product recovery based business models underpin the central notion of circularity;these are: cradle-to-cradle, reuse, recycle, remanufacture, sharing and collaborative consumption, etc.The concept of circular supply chain thus is underpinned by five major underlying models [8]: (i)circular supplies – that provides fully renewable, recyclable or biodegradable resource inputs thatunderpin circular production and consumption systems, (ii) resource recovery – that enables acompany to eliminate material leakage and maximize the economic value of product return flows, (iii)product life extension – that allows companies to extend the lifecycle of products and assets throughrecovery options, such as repair, upgrade, remanufacture, (iv) sharing platform (peer-to-peer) – thatpromotes a platform for collaboration among product users, either individuals or organizations, and(v) product as a service – that provides an alternative to the traditional model of “buy and own”through leasing or pay-for-use arrangement. Circular apparel supply chains – being a multi-actornetwork (consisting of profit-makers, e.g. fashion retailers, commercial recyclers, traders and sorters;public institutions, e.g. municipalities, universities; non-profit organizations, e.g. charities, researchinstitutes) – are however highly fragmented and are fraught with a wide range of challenges related tolack of well-functioning reverse logistics, conflict of stakeholder interest, ownership confusion, andlack of formal legislation and regulation such as extended producer responsibility [9] – that hindersjoint value creation.
3.2. Digital supply chainDigitalization and information technology (IT) innovation underpins the biggest opportunity for manyindustrial supply chains. Coined in Hines (2007) [10], digital supply chains are where goods orservices that had previously been supplied in physical form (in analogue supply chains) are digitizedas information replaces inventory to remove time, distance and cost in order to improve supply chainperformance. Specific to apparel and fashion supply chains, this is increasingly driven by theemergence of customer-focused products and processes, wherein demand is elicited throughspecifications from customers to initiate the design and production of customized products usingsystems and tools to support customer involvement [11]. Such customer-driven supply chains areinfluenced by digitalization of the customer-retailer interface, and is enabled by virtual collaborative
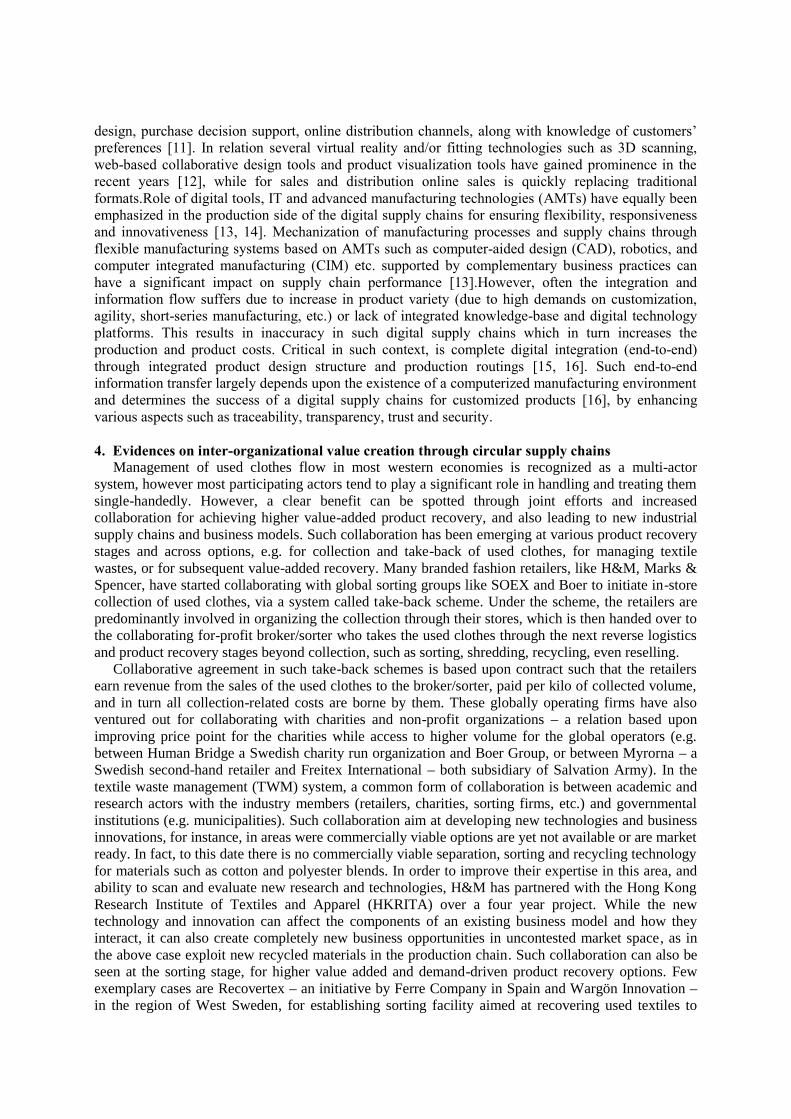
design, purchase decision support, online distribution channels, along with knowledge of customers’preferences [11]. In relation several virtual reality and/or fitting technologies such as 3D scanning,web-based collaborative design tools and product visualization tools have gained prominence in therecent years [12], while for sales and distribution online sales is quickly replacing traditionalformats.Role of digital tools, IT and advanced manufacturing technologies (AMTs) have equally beenemphasized in the production side of the digital supply chains for ensuring flexibility, responsivenessand innovativeness [13, 14]. Mechanization of manufacturing processes and supply chains throughflexible manufacturing systems based on AMTs such as computer-aided design (CAD), robotics, andcomputer integrated manufacturing (CIM) etc. supported by complementary business practices canhave a significant impact on supply chain performance [13].However, often the integration andinformation flow suffers due to increase in product variety (due to high demands on customization,agility, short-series manufacturing, etc.) or lack of integrated knowledge-base and digital technologyplatforms. This results in inaccuracy in such digital supply chains which in turn increases theproduction and product costs. Critical in such context, is complete digital integration (end-to-end)through integrated product design structure and production routings [15, 16]. Such end-to-endinformation transfer largely depends upon the existence of a computerized manufacturing environmentand determines the success of a digital supply chains for customized products [16], by enhancingvarious aspects such as traceability, transparency, trust and security.
4. Evidences on inter-organizational value creation through circular supply chainsManagement of used clothes flow in most western economies is recognized as a multi-actor
system, however most participating actors tend to play a significant role in handling and treating themsingle-handedly. However, a clear benefit can be spotted through joint efforts and increasedcollaboration for achieving higher value-added product recovery, and also leading to new industrialsupply chains and business models. Such collaboration has been emerging at various product recoverystages and across options, e.g. for collection and take-back of used clothes, for managing textilewastes, or for subsequent value-added recovery. Many branded fashion retailers, like H&M, Marks &Spencer, have started collaborating with global sorting groups like SOEX and Boer to initiate in-storecollection of used clothes, via a system called take-back scheme. Under the scheme, the retailers arepredominantly involved in organizing the collection through their stores, which is then handed over tothe collaborating for-profit broker/sorter who takes the used clothes through the next reverse logisticsand product recovery stages beyond collection, such as sorting, shredding, recycling, even reselling.
Collaborative agreement in such take-back schemes is based upon contract such that the retailersearn revenue from the sales of the used clothes to the broker/sorter, paid per kilo of collected volume,and in turn all collection-related costs are borne by them. These globally operating firms have alsoventured out for collaborating with charities and non-profit organizations – a relation based uponimproving price point for the charities while access to higher volume for the global operators (e.g.between Human Bridge a Swedish charity run organization and Boer Group, or between Myrorna – aSwedish second-hand retailer and Freitex International – both subsidiary of Salvation Army). In thetextile waste management (TWM) system, a common form of collaboration is between academic andresearch actors with the industry members (retailers, charities, sorting firms, etc.) and governmentalinstitutions (e.g. municipalities). Such collaboration aim at developing new technologies and businessinnovations, for instance, in areas were commercially viable options are yet not available or are marketready. In fact, to this date there is no commercially viable separation, sorting and recycling technologyfor materials such as cotton and polyester blends. In order to improve their expertise in this area, andability to scan and evaluate new research and technologies, H&M has partnered with the Hong KongResearch Institute of Textiles and Apparel (HKRITA) over a four year project. While the newtechnology and innovation can affect the components of an existing business model and how theyinteract, it can also create completely new business opportunities in uncontested market space, as inthe above case exploit new recycled materials in the production chain. Such collaboration can also beseen at the sorting stage, for higher value added and demand-driven product recovery options. Fewexemplary cases are Recovertex – an initiative by Ferre Company in Spain and Wargön Innovation –in the region of West Sweden, for establishing sorting facility aimed at recovering used textiles to
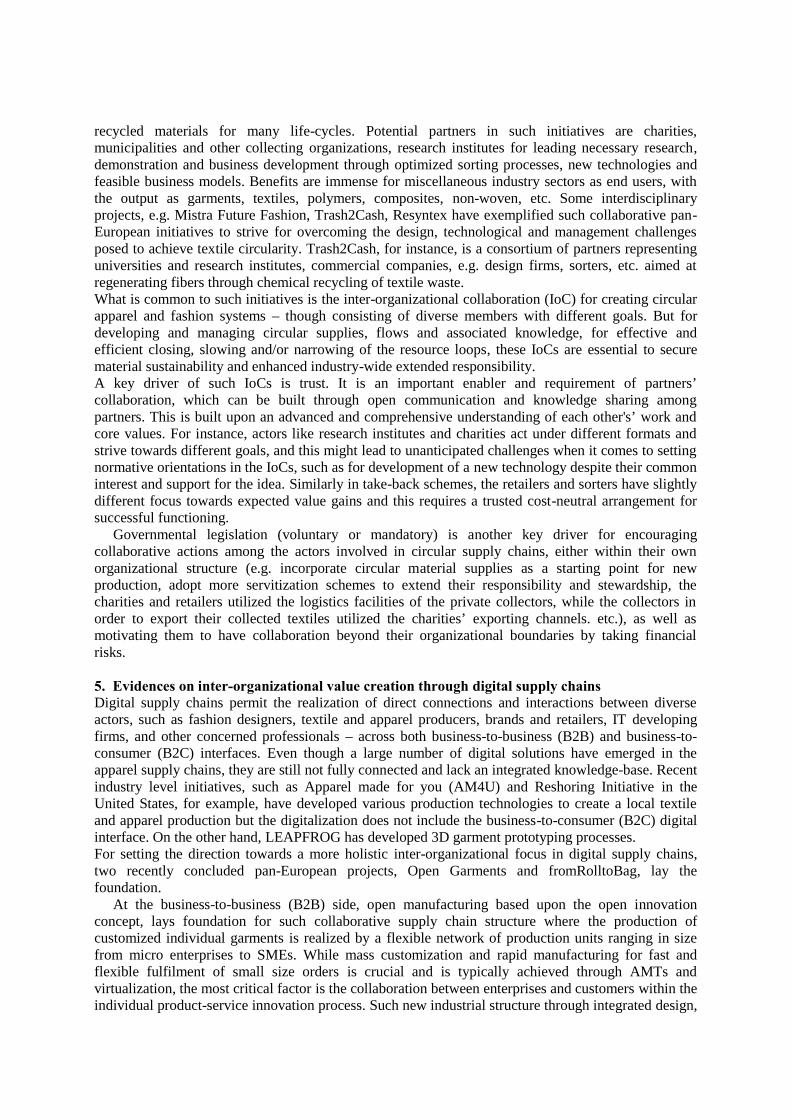
recycled materials for many life-cycles. Potential partners in such initiatives are charities,municipalities and other collecting organizations, research institutes for leading necessary research,demonstration and business development through optimized sorting processes, new technologies andfeasible business models. Benefits are immense for miscellaneous industry sectors as end users, withthe output as garments, textiles, polymers, composites, non-woven, etc. Some interdisciplinaryprojects, e.g. Mistra Future Fashion, Trash2Cash, Resyntex have exemplified such collaborative pan-European initiatives to strive for overcoming the design, technological and management challengesposed to achieve textile circularity. Trash2Cash, for instance, is a consortium of partners representinguniversities and research institutes, commercial companies, e.g. design firms, sorters, etc. aimed atregenerating fibers through chemical recycling of textile waste.What is common to such initiatives is the inter-organizational collaboration (IoC) for creating circularapparel and fashion systems – though consisting of diverse members with different goals. But fordeveloping and managing circular supplies, flows and associated knowledge, for effective andefficient closing, slowing and/or narrowing of the resource loops, these IoCs are essential to securematerial sustainability and enhanced industry-wide extended responsibility.A key driver of such IoCs is trust. It is an important enabler and requirement of partners’collaboration, which can be built through open communication and knowledge sharing amongpartners. This is built upon an advanced and comprehensive understanding of each other's’ work andcore values. For instance, actors like research institutes and charities act under different formats andstrive towards different goals, and this might lead to unanticipated challenges when it comes to settingnormative orientations in the IoCs, such as for development of a new technology despite their commoninterest and support for the idea. Similarly in take-back schemes, the retailers and sorters have slightlydifferent focus towards expected value gains and this requires a trusted cost-neutral arrangement forsuccessful functioning.
Governmental legislation (voluntary or mandatory) is another key driver for encouragingcollaborative actions among the actors involved in circular supply chains, either within their ownorganizational structure (e.g. incorporate circular material supplies as a starting point for newproduction, adopt more servitization schemes to extend their responsibility and stewardship, thecharities and retailers utilized the logistics facilities of the private collectors, while the collectors inorder to export their collected textiles utilized the charities’ exporting channels. etc.), as well asmotivating them to have collaboration beyond their organizational boundaries by taking financialrisks.
5. Evidences on inter-organizational value creation through digital supply chainsDigital supply chains permit the realization of direct connections and interactions between diverseactors, such as fashion designers, textile and apparel producers, brands and retailers, IT developingfirms, and other concerned professionals – across both business-to-business (B2B) and business-to-consumer (B2C) interfaces. Even though a large number of digital solutions have emerged in theapparel supply chains, they are still not fully connected and lack an integrated knowledge-base. Recentindustry level initiatives, such as Apparel made for you (AM4U) and Reshoring Initiative in theUnited States, for example, have developed various production technologies to create a local textileand apparel production but the digitalization does not include the business-to-consumer (B2C) digitalinterface. On the other hand, LEAPFROG has developed 3D garment prototyping processes.For setting the direction towards a more holistic inter-organizational focus in digital supply chains,two recently concluded pan-European projects, Open Garments and fromRolltoBag, lay thefoundation.
At the business-to-business (B2B) side, open manufacturing based upon the open innovationconcept, lays foundation for such collaborative supply chain structure where the production ofcustomized individual garments is realized by a flexible network of production units ranging in sizefrom micro enterprises to SMEs. While mass customization and rapid manufacturing for fast andflexible fulfilment of small size orders is crucial and is typically achieved through AMTs andvirtualization, the most critical factor is the collaboration between enterprises and customers within theindividual product-service innovation process. Such new industrial structure through integrated design,
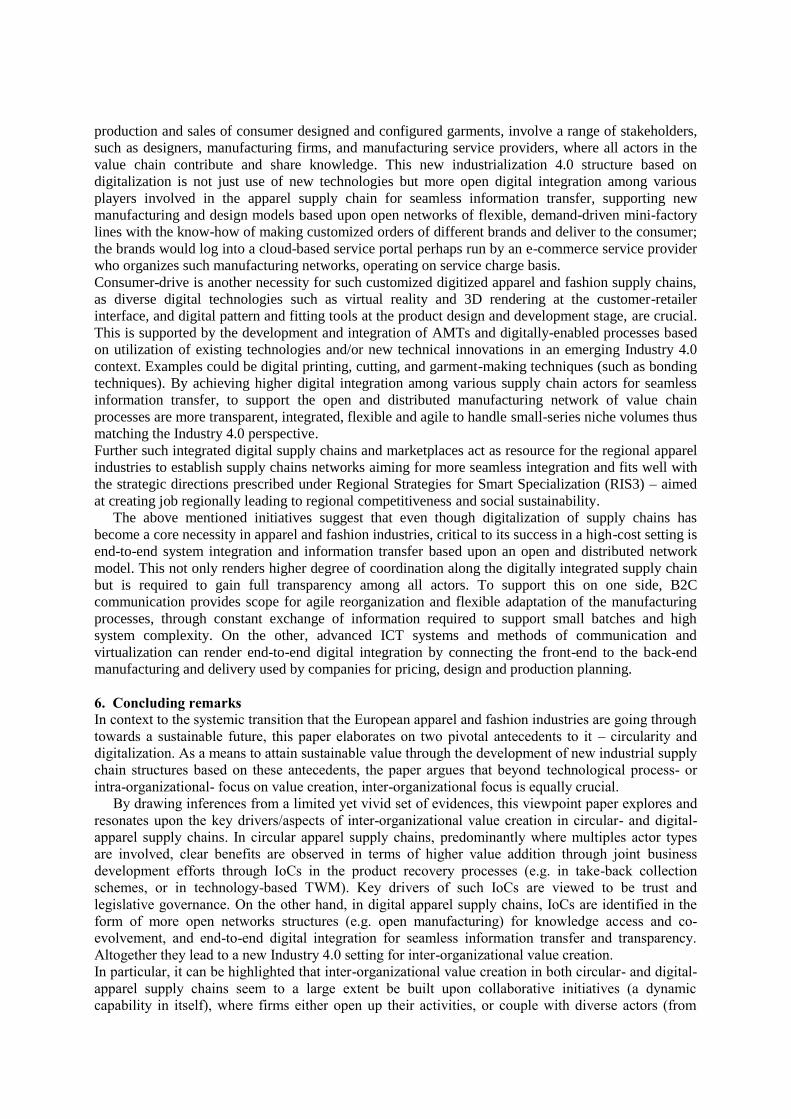
production and sales of consumer designed and configured garments, involve a range of stakeholders,such as designers, manufacturing firms, and manufacturing service providers, where all actors in thevalue chain contribute and share knowledge. This new industrialization 4.0 structure based ondigitalization is not just use of new technologies but more open digital integration among variousplayers involved in the apparel supply chain for seamless information transfer, supporting newmanufacturing and design models based upon open networks of flexible, demand-driven mini-factorylines with the know-how of making customized orders of different brands and deliver to the consumer;the brands would log into a cloud-based service portal perhaps run by an e-commerce service providerwho organizes such manufacturing networks, operating on service charge basis.Consumer-drive is another necessity for such customized digitized apparel and fashion supply chains,as diverse digital technologies such as virtual reality and 3D rendering at the customer-retailerinterface, and digital pattern and fitting tools at the product design and development stage, are crucial.This is supported by the development and integration of AMTs and digitally-enabled processes basedon utilization of existing technologies and/or new technical innovations in an emerging Industry 4.0context. Examples could be digital printing, cutting, and garment-making techniques (such as bondingtechniques). By achieving higher digital integration among various supply chain actors for seamlessinformation transfer, to support the open and distributed manufacturing network of value chainprocesses are more transparent, integrated, flexible and agile to handle small-series niche volumes thusmatching the Industry 4.0 perspective.Further such integrated digital supply chains and marketplaces act as resource for the regional apparelindustries to establish supply chains networks aiming for more seamless integration and fits well withthe strategic directions prescribed under Regional Strategies for Smart Specialization (RIS3) – aimedat creating job regionally leading to regional competitiveness and social sustainability.
The above mentioned initiatives suggest that even though digitalization of supply chains hasbecome a core necessity in apparel and fashion industries, critical to its success in a high-cost setting isend-to-end system integration and information transfer based upon an open and distributed networkmodel. This not only renders higher degree of coordination along the digitally integrated supply chainbut is required to gain full transparency among all actors. To support this on one side, B2Ccommunication provides scope for agile reorganization and flexible adaptation of the manufacturingprocesses, through constant exchange of information required to support small batches and highsystem complexity. On the other, advanced ICT systems and methods of communication andvirtualization can render end-to-end digital integration by connecting the front-end to the back-endmanufacturing and delivery used by companies for pricing, design and production planning.
6. Concluding remarksIn context to the systemic transition that the European apparel and fashion industries are going throughtowards a sustainable future, this paper elaborates on two pivotal antecedents to it – circularity anddigitalization. As a means to attain sustainable value through the development of new industrial supplychain structures based on these antecedents, the paper argues that beyond technological process- orintra-organizational- focus on value creation, inter-organizational focus is equally crucial.
By drawing inferences from a limited yet vivid set of evidences, this viewpoint paper explores andresonates upon the key drivers/aspects of inter-organizational value creation in circular- and digital-apparel supply chains. In circular apparel supply chains, predominantly where multiples actor typesare involved, clear benefits are observed in terms of higher value addition through joint businessdevelopment efforts through IoCs in the product recovery processes (e.g. in take-back collectionschemes, or in technology-based TWM). Key drivers of such IoCs are viewed to be trust andlegislative governance. On the other hand, in digital apparel supply chains, IoCs are identified in theform of more open networks structures (e.g. open manufacturing) for knowledge access and co-evolvement, and end-to-end digital integration for seamless information transfer and transparency.Altogether they lead to a new Industry 4.0 setting for inter-organizational value creation.In particular, it can be highlighted that inter-organizational value creation in both circular- and digital-apparel supply chains seem to a large extent be built upon collaborative initiatives (a dynamiccapability in itself), where firms either open up their activities, or couple with diverse actors (from
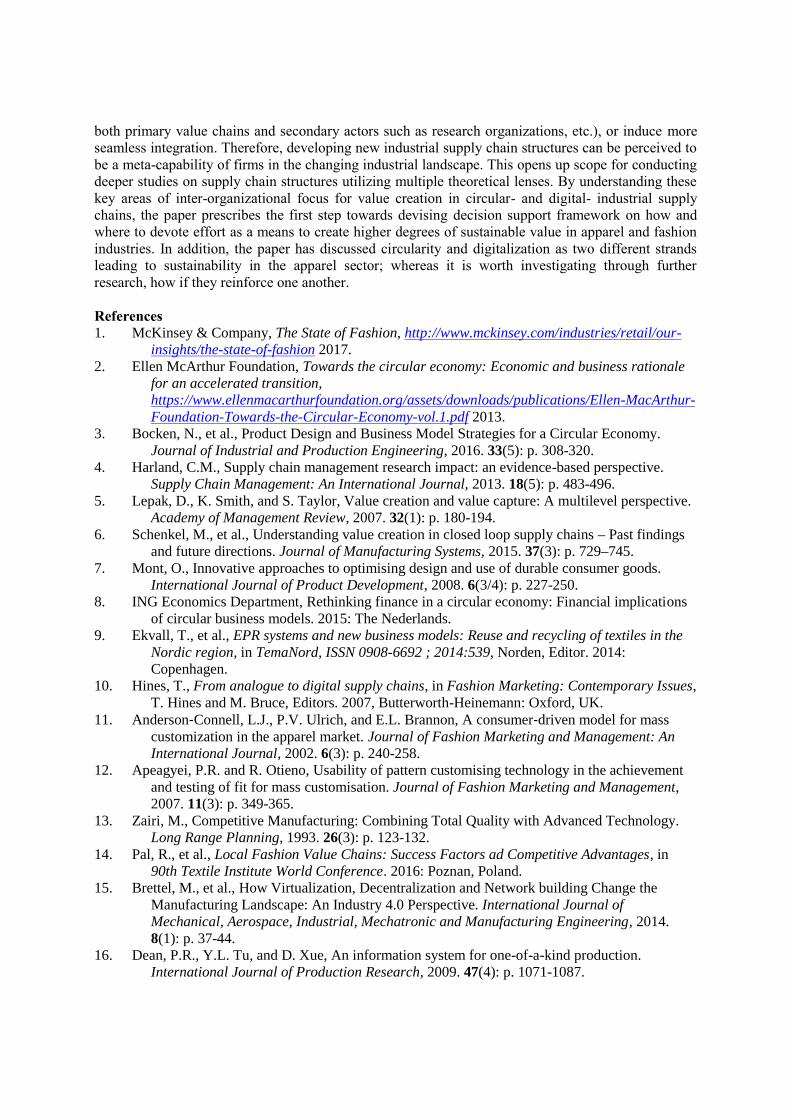
both primary value chains and secondary actors such as research organizations, etc.), or induce moreseamless integration. Therefore, developing new industrial supply chain structures can be perceived tobe a meta-capability of firms in the changing industrial landscape. This opens up scope for conductingdeeper studies on supply chain structures utilizing multiple theoretical lenses. By understanding thesekey areas of inter-organizational focus for value creation in circular- and digital- industrial supplychains, the paper prescribes the first step towards devising decision support framework on how andwhere to devote effort as a means to create higher degrees of sustainable value in apparel and fashionindustries. In addition, the paper has discussed circularity and digitalization as two different strandsleading to sustainability in the apparel sector; whereas it is worth investigating through furtherresearch, how if they reinforce one another.
References1. McKinsey & Company, The State of Fashion, http://www.mckinsey.com/industries/retail/our-
insights/the-state-of-fashion 2017.2. Ellen McArthur Foundation, Towards the circular economy: Economic and business rationale
for an accelerated transition,https://www.ellenmacarthurfoundation.org/assets/downloads/publications/Ellen-MacArthur-Foundation-Towards-the-Circular-Economy-vol.1.pdf 2013.
3. Bocken, N., et al., Product Design and Business Model Strategies for a Circular Economy.Journal of Industrial and Production Engineering, 2016. 33(5): p. 308-320.
4. Harland, C.M., Supply chain management research impact: an evidence-based perspective.Supply Chain Management: An International Journal, 2013. 18(5): p. 483-496.
5. Lepak, D., K. Smith, and S. Taylor, Value creation and value capture: A multilevel perspective.Academy of Management Review, 2007. 32(1): p. 180-194.
6. Schenkel, M., et al., Understanding value creation in closed loop supply chains – Past findingsand future directions. Journal of Manufacturing Systems, 2015. 37(3): p. 729–745.
7. Mont, O., Innovative approaches to optimising design and use of durable consumer goods.International Journal of Product Development, 2008. 6(3/4): p. 227-250.
8. ING Economics Department, Rethinking finance in a circular economy: Financial implicationsof circular business models. 2015: The Nederlands.
9. Ekvall, T., et al., EPR systems and new business models: Reuse and recycling of textiles in theNordic region, in TemaNord, ISSN 0908-6692 ; 2014:539, Norden, Editor. 2014:Copenhagen.
10. Hines, T., From analogue to digital supply chains, in Fashion Marketing: Contemporary Issues,T. Hines and M. Bruce, Editors. 2007, Butterworth-Heinemann: Oxford, UK.
11. Anderson‐Connell, L.J., P.V. Ulrich, and E.L. Brannon, A consumer‐driven model for masscustomization in the apparel market. Journal of Fashion Marketing and Management: AnInternational Journal, 2002. 6(3): p. 240-258.
12. Apeagyei, P.R. and R. Otieno, Usability of pattern customising technology in the achievementand testing of fit for mass customisation. Journal of Fashion Marketing and Management,2007. 11(3): p. 349-365.
13. Zairi, M., Competitive Manufacturing: Combining Total Quality with Advanced Technology.Long Range Planning, 1993. 26(3): p. 123-132.
14. Pal, R., et al., Local Fashion Value Chains: Success Factors ad Competitive Advantages, in90th Textile Institute World Conference. 2016: Poznan, Poland.
15. Brettel, M., et al., How Virtualization, Decentralization and Network building Change theManufacturing Landscape: An Industry 4.0 Perspective. International Journal ofMechanical, Aerospace, Industrial, Mechatronic and Manufacturing Engineering, 2014.8(1): p. 37-44.
16. Dean, P.R., Y.L. Tu, and D. Xue, An information system for one-of-a-kind production.International Journal of Production Research, 2009. 47(4): p. 1071-1087.

![[XLS]statsmauritius.govmu.orgstatsmauritius.govmu.org/English/Documents/External Trade... · Web viewBabies' garments & clothing accessory of cotton,knitted/crocheted 61113000 8451230](https://img.pdfslide.us/doc/110x75/5af75a397f8b9a744490ad40/xls-tradeweb-viewbabies-garments-clothing-accessory-of-cottonknittedcrocheted.jpg)