Embed Size (px)
Citation preview
PROCEEDINGS Open Access
A quantitative analysis of monochromaticity ingenetic interaction networksChien-Hsiang Hsu1†, Tse-Yi Wang2†, Hsueh-Ting Chu3, Cheng-Yan Kao1,4*, Kuang-Chi Chen5*
From Asia Pacific Bioinformatics Network (APBioNet) Tenth International Conference on Bioinformatics – FirstISCB Asia Joint Conference 2011 (InCoB2011/ISCB-Asia 2011)Kuala Lumpur, Malaysia. 30 November - 2 December 2011
Abstract
Background: A genetic interaction refers to the deviation of phenotypes from the expected when perturbing twogenes simultaneously. Studying genetic interactions help clarify relationships between genes, such ascompensation and masking, and identify gene groups of functional modules. Recently, several genome-scaleexperiments for measuring quantitative (positive and negative) genetic interactions have been conducted. Theresults revealed that genes in the same module usually interact with each other in a consistent way (pure positiveor negative); this phenomenon was designated as monochromaticity. Monochromaticity might be the underlyingprinciple that can be utilized to unveil the modularity of cellular networks. However, no appropriate quantitativemeasurement for this phenomenon has been proposed.
Results: In this study, we propose the monochromatic index (MCI), which is able to quantitatively evaluate themonochromaticity of potential functional modules of genes, and the MCI was used to study genetic landscapes indifferent cellular subsystems. We demonstrated that MCI not only amend the deficiencies of MP-score but alsoproperly incorporate the background effect. The results showed that not only within-complex but also between-complex connections present significant monochromatic tendency. Furthermore, we also found that significantlyhigher proportion of protein complexes are connected by negative genetic interactions in metabolic network,while transcription and translation system adopts relatively even number of positive and negative geneticinteractions to link protein complexes.
Conclusion: In summary, we demonstrate that MCI improves deficiencies suffered by MP-score, and can be usedto evaluate monochromaticity in a quantitative manner. In addition, it also helps to unveil features of geneticlandscapes in different cellular subsystems. Moreover, MCI can be easily applied to data produced by differenttypes of genetic interaction methodologies such as Synthetic Genetic Array (SGA), and epistatic miniarray profile (E-MAP).
IntroductionUnderstanding how genotypes determine phenotypes isone of the most important topics in genetics. Thematuration of whole genome sequencing techniques andother large scale genomic analysis tools has provided con-siderable genomic information of many organisms [1].
However, the relationships between genotypes andphenotypes are still far from being fully understood.Phenotypes and genotypes are not one-to-one corre-sponded; a phenotype is usually simultaneously deter-mined by several genes. Moreover, compensation andepistasis between genes can further complicate the rela-tion between phenotypes and genotypes [2]. Thus, thecomplex networks of genetic interactions governing phe-notypes cannot be understood just by studying eachinvolved gene individually; instead, a systemic manner is
* Correspondence: [email protected]; [email protected]† Contributed equally1Graduate Institute of Biomedical Electronics and Bioinformatics, NationalTaiwan University, Taipei, Taiwan5Department of Medical Informatics, Tzu Chi University, Hualien, TaiwanFull list of author information is available at the end of the article
Hsu et al. BMC Bioinformatics 2011, 12(Suppl 13):S16http://www.biomedcentral.com/1471-2105/12/S13/S16
© 2011 Hsu et al; licensee BioMed Central Ltd. This is an open access article distributed under the terms of the Creative CommonsAttribution License (http://creativecommons.org/licenses/by/2.0), which permits unrestricted use, distribution, and reproduction inany medium, provided the original work is properly cited.
required to illustrate the relationships between pheno-types and genotypes.Several tools for systematically mapping genetic inter-
actions in Saccharomyces cerevisiae have been devel-oped; experiments have been conducted to reveal thestructure and functional landscape of part of the com-plex genetic interaction network [2]. Early researchesfocused on the identification of synthetic lethal geneticinteractions, which revealed tremendous functional rela-tionships between genes, numerous compensatory pro-tein complexes, and parallel pathways [3-5]. Forexample, a systematic deletion analysis in budding yeastdemonstrated that only 20% of genes are required forviability [6], which suggests that a robust network isformed by genetic interactions. Nevertheless, the lack ofquantitative measurement of genetic interactions inthese researches limited the possibility of exploring thegenetic interaction landscape in detail.Recently, two methodologies for quantitatively screen-
ing the genetic interactions in Saccharomyces cerevisiaehave been widely adopted. One is Synthetic GeneticArray (SGA), which was developed by Tong et al. [7]. InSGA methodology, strains with single mutation of querygenes are crossed with single mutant strains of arraygenes, resulting in double mutants. With an automaticrobot system, SGA has been used to investigate geneticinteractions in a high-throughput manner. AlthoughSGA was initially used to screen synthetic lethality/sick-ness [7,8], it was later adopted to measure genetic inter-actions quantitatively [9,10]. The other methodology,called epistatic miniarray profile (E-MAP), is based onmeasuring the growth rates of single mutant strains anddouble mutants [11]. In contrast to the unbalancednumbers of query and array genes in SGA, results of E-MAP form a symmetric matrix containing strengthsmeasured by S scores of each pair of genetic interactions[12].Both SGA and E-MAP require a quantitative defini-
tion of genetic interaction. A genetic interactionbetween two genes is identified when a double mutantphenotype deviates from the empirically determinedphenotype based on the two single mutant strains[6,9,12-15]. Several mathematical models have been pro-posed to quantify the extent of the phenotype deviation[16]. Among all, the multiplicative model is the mostwidely adopted [9,10,12,13,17-19]. Under the multiplica-tive model, the deviation (ε) is calculated by:
e j j j= − ×AB A B (1)
where �AB , �A , and �B are fitness values (such asgrowth rate and colony size) relative to wild type ofdouble mutation of gene A and B, single mutation ofgene A, and single mutation of gene B, respectively.
Directly from equation (1), genetic interactions can bedivided into two categories, positive interactions andnegative interactions. Positive interactions, also knownas alleviating interactions, refer to a less severe defect ofdouble mutation than expected; they can be further clas-sified into two subgroups, suppression and masking,according to the relationship between a double mutantand the two corresponding single mutations [13,15,17].In suppression, the fitness of a double mutant is similarto the healthier one of the two single mutants, indicat-ing that deletion of the second gene rescues the defectcaused by mutation of the first genes. In contrast, mask-ing occurs when the fitness of a double mutant is equalto the less healthy one of the corresponding singlemutants. As opposed to positive interactions, negativeinteractions, or aggravating interactions, manifest amore severe-than-expected defect, with synthetic lethal-ity being the most extreme case in which the deletion oftwo nonessential genes leads to cell death.Numerous researches have suggested the biological sce-
narios of positive and negative interactions [4,8,11,13,17].Negative interactions tend to be identified between geneswith similar or compensating functions, whereas genesparticipating in the same pathway or protein complexesoften interact to each other positively. These observationssuggest that positive interactions connect genes encodingsubunits of protein complexes or engaging in the samepathways, while negative interactions indicate functionalcompensation or parallel pathways [15].In addition to types of genetic interactions, relation-
ships between two genes can also be investigated by com-paring the proximity of their genetic interaction profileswhich is the set of all genetic interactions of one gene[10,13,15,17]. It has been suggested that genes formingprotein complexes or functioning in the same pathwayswould have similar genetic interaction patterns. Severalhierarchical clustering algorithms have been proposedbased on this idea [20-22], providing effective ways topredict gene functions and illustrate the functional mod-ularity of cells.By integrating genetic interactions with protein com-
plexes and biochemical pathways, nature of genetic inter-actions has been further explored. By using a simulationframework known as the flux balance analysis [23] toinvestigate the yeast metabolic system, Segre et al. ascer-tained that genetic interaction network can be hierarchi-cally clustered into functional modules which interactmonochromatically to each other, a phenomenon hedesignated as monochromaticity [24]. This feature wasalso reported in a genome-wide study conducted byCostanzo et al [10]. Monochromaticity within proteincomplexes was also studied [9]. Baryshnikova et al.defined a measure called monochromatic purity score(MP-score) to determine whether a given protein
Hsu et al. BMC Bioinformatics 2011, 12(Suppl 13):S16http://www.biomedcentral.com/1471-2105/12/S13/S16
Page 2 of 15
complex was monochromatic. In their research, themajority of protein complexes were reported to be mono-chromatic, with 46% being pure positive and 37% beingpure negative [9]. Moreover, Michaut et al. inspectedmonochromaticity by studying biological processes [25].Only 10% of biological processes, defined by Gene Ontol-ogy (GO) annotations are monochromatic. This studyalso showed that less than 1% of interactions betweenprocesses were identified to be monochromatic. In addi-tion, they suggested that protein complexes are responsi-ble for the majority of the observed pattern [25,26].Although monochromaticity is an interesting feature of
genetic interaction networks, only few quantitative mea-sures have been proposed. Evaluation of monochromati-city using MP-score has unveiled interesting features ofgenetic interactions in protein complexes, but a closescrutiny reveals several deficiencies of this index. Firstly,MP-score is affected dramatically by the imbalanced pro-portions of positive and negative genetic interactions ofthe background. When the proportions of the two typesof genetic interactions are not comparable in a set ofgenes, MP-score can misjudge the monochromaticity ofprotein complexes. Secondly, the threshold for which aprotein complex is considered to be monochromatic is
chosen heuristically. In the work of Baryshnikova et al.,the threshold was set to be 0.5; that is, a protein complexwas classified to be monochromatic if its absolute valueof MP-score was greater than 0.5. Nevertheless, thischoice of the threshold has not been corroborated. Lastly,when applying MP-score to some genetic interactiondata, the monochromaticity of protein complexes wasnot observed.Therefore, an appropriate measure that can be used to
unbiasedly assess the monochromaticity of clusters ofgenetic interactions is desired. This study proposes anew index called monochromatic index (MCI) whichimproves the deficiencies of MP-score. MCI not onlyquantitatively is able to evaluate the monochromaticityof potential functional modules of genes but also is use-ful to study genetic landscapes in different cellular sub-systems. We believe that MCI can serve as the basis toexplore complex networks of genetic interactions.
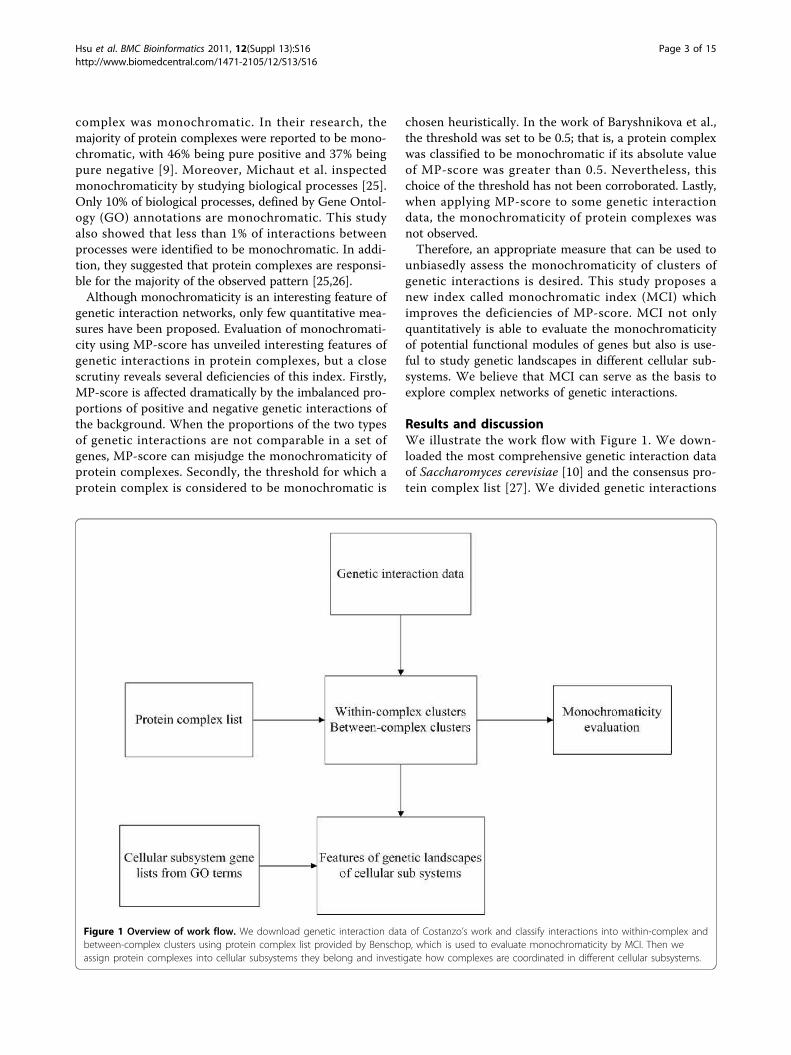
Results and discussionWe illustrate the work flow with Figure 1. We down-loaded the most comprehensive genetic interaction dataof Saccharomyces cerevisiae [10] and the consensus pro-tein complex list [27]. We divided genetic interactions
Figure 1 Overview of work flow. We download genetic interaction data of Costanzo’s work and classify interactions into within-complex andbetween-complex clusters using protein complex list provided by Benschop, which is used to evaluate monochromaticity by MCI. Then weassign protein complexes into cellular subsystems they belong and investigate how complexes are coordinated in different cellular subsystems.
Hsu et al. BMC Bioinformatics 2011, 12(Suppl 13):S16http://www.biomedcentral.com/1471-2105/12/S13/S16
Page 3 of 15
into two types – within-complex interactions andbetween-complex interactions, and applied MCI to evalu-ate the level of monochromaticity for the downloadeddata (see Materials and Methods for details). In the fol-lowing sections, we first show the deficiencies of MP-score, which misjudges the monochromaticity of proteincomplexes under highly biased background. Then, wedemonstrate that MCI incorporates the backgroundinformation properly to fairly evaluate the significance ofmonochromaticity not only within but also between pro-tein complexes in the second and the third sections. Ourresults confirmed that monochromaticity exists in bothwithin-complex and between-complex interactions.Besides, this is the first study, to our knowledge, thatshows between-complex interactions present significantdegree of monochromaticity. Lastly, with gene lists of dif-ferent cellular subsystems, MCI was applied to investigatefeatures of genetic landscapes in metabolic as well astranscription and translation systems. We found thatmetabolic system adopts more negative interactions tocoordinate protein complexes, reflecting the robustnessof this system. On the other hand, similar amounts ofpositive and negative interactions between protein com-plexes were identified in transcription and translationsystem, suggesting that this system is more vulnerable toprotein-complex-dysfunctions. Furthermore, functionalrelationships between protein complexes within andbetween modules were also unveiled by MCI-generatednetworks.
Deficiencies of MP-scoreThe goal of this session is to assess, using MP-score, theoverall monochromaticity presented by the clusters ofwithin-complex interactions, and judge the performanceof MP-score. The MP-score was tested for its applica-tions. We used currently the most comprehensive quanti-tative genetic interaction data of Saccharomycescerevisiae, generated by SGA [10], to evaluate the mono-chromaticity of genetic interactions within complexesusing MP-score. The data consists of 1,711 query genescrossed to 3,885 array strains, and three different levelsof cutoffs were applied, lenient, intermediate, and strin-gent (Materials and Methods). Yeast protein complexes
were adopted from a consensus data set which contains518 protein complexes obtained by high-throughput pre-dictions and literature curated data [27]. A genetic inter-action is classified as a within-complex interaction if thetwo interacting genes belong to the same protein com-plex. By this definition, a list of protein complexes andthe corresponding within-complex interactions can beconstructed. Only complexes containing more than twowith-complex interactions were used for further analysis.We calculated MP-scores for each protein complexes,
and the threshold was set as Baryshnikova et al.; that is,complexes with the absolute value of MP-score higherthan 0.5 were considered to be monochromatic [9].Numbers of monochromatic complexes obtained fromthe three different-cutoff datasets are listed in Table 1.In order to evaluate the significance of monochromati-city of protein complexes, a binomial test was con-ducted (Materials and Methods). The rationale was thatif monochromaticity was not a feature of genetic inter-actions within complexes, the probabilities of identifyinga monochromatic complex and a non-monochromaticcomplex will be the same, which equals to 0.5. Thus, asthe null hypothesis, we assumed that the type, mono-chromatic or not, of a protein complex follows Bernoullidistribution, with the probability being 0.5. We foundthat p-values were 2.18e-05, 2.92e-04, and 1.42e-14 forlenient, intermediate, and stringent cutoffs, respectively.The result showed that all of the three cutoffs supportthat monochromaticity is significant for genetic interac-tions within protein complexes.However, we found that the background information
was not properly incorporated by MP-score after examin-ing the proportions of positive and negative genetic inter-actions. Summary of the three different-cutoff datasets isprovided in Additional File 1: Table S1 and Additional File2: Figure S1. These results illustrated that the more strin-gent the cutoff threshold, was, the more unbalanced theproportions of positive and negative interactions were.Especially for the stringent cutoff, about 90% of inter-
actions are negative. This highly biased backgroundshould reduce the significance of monochromaticity ofgenetic interactions within protein complexes. However,it was not reflected by MP-score.
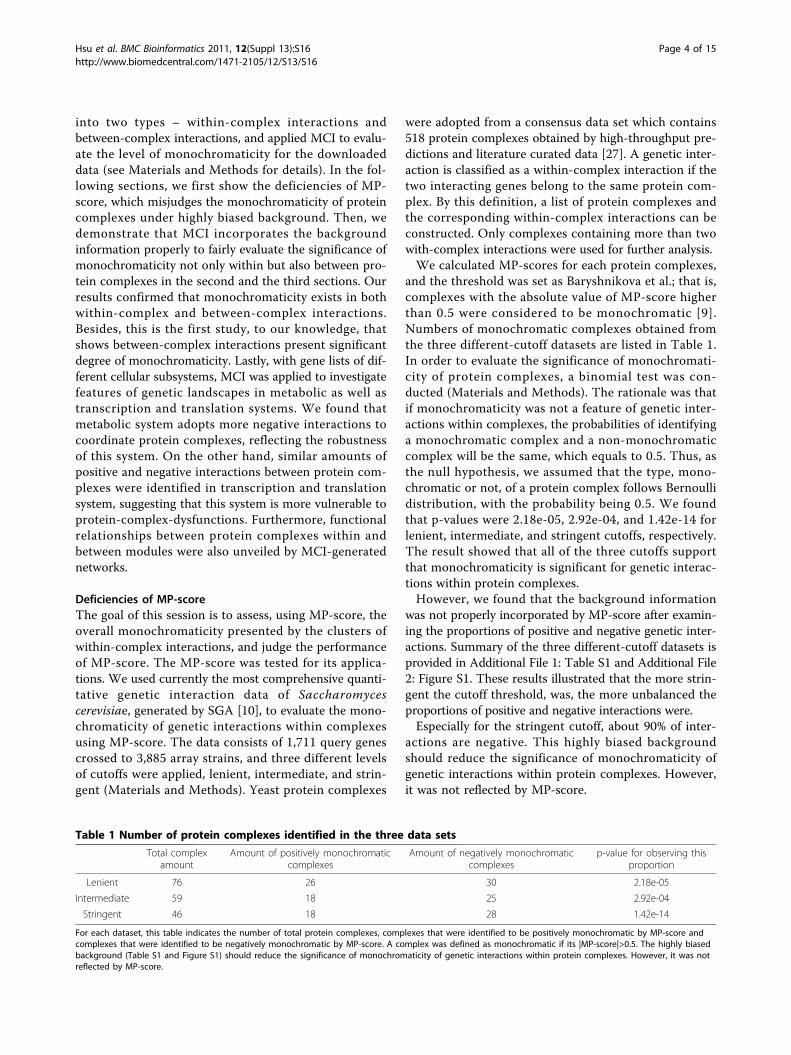
Table 1 Number of protein complexes identified in the three data sets
Total complexamount
Amount of positively monochromaticcomplexes
Amount of negatively monochromaticcomplexes
p-value for observing thisproportion
Lenient 76 26 30 2.18e-05
Intermediate 59 18 25 2.92e-04
Stringent 46 18 28 1.42e-14
For each dataset, this table indicates the number of total protein complexes, complexes that were identified to be positively monochromatic by MP-score andcomplexes that were identified to be negatively monochromatic by MP-score. A complex was defined as monochromatic if its |MP-score|>0.5. The highly biasedbackground (Table S1 and Figure S1) should reduce the significance of monochromaticity of genetic interactions within protein complexes. However, it was notreflected by MP-score.
Hsu et al. BMC Bioinformatics 2011, 12(Suppl 13):S16http://www.biomedcentral.com/1471-2105/12/S13/S16
Page 4 of 15
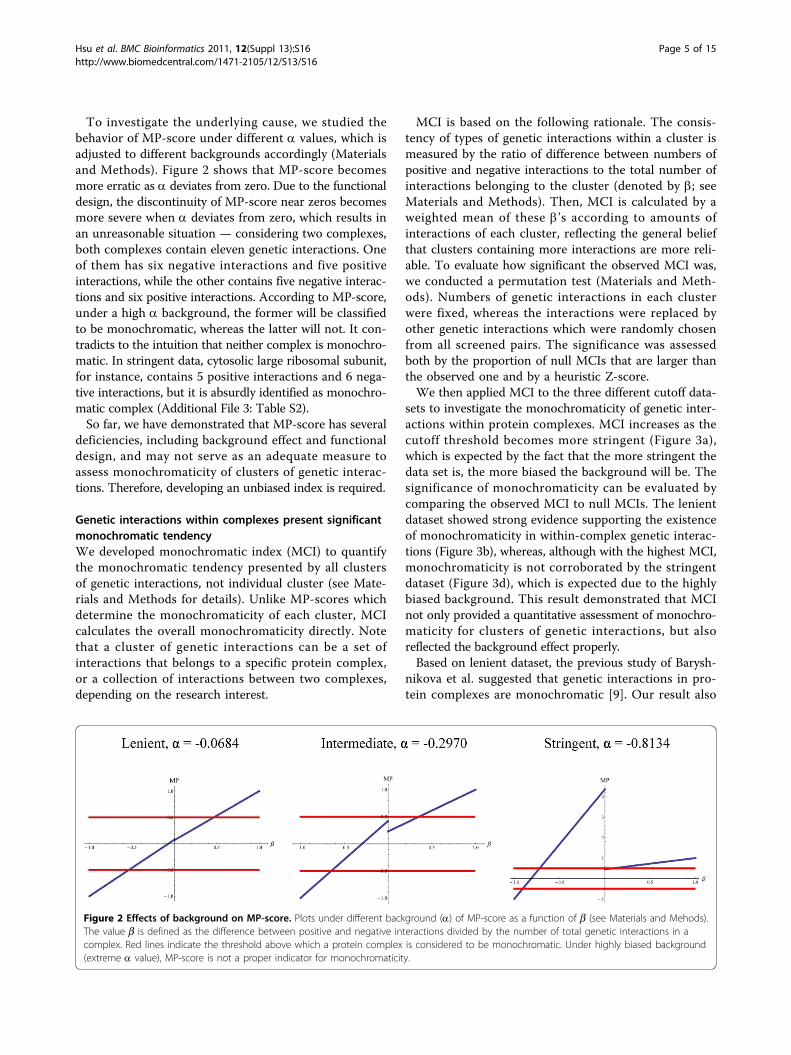
To investigate the underlying cause, we studied thebehavior of MP-score under different a values, which isadjusted to different backgrounds accordingly (Materialsand Methods). Figure 2 shows that MP-score becomesmore erratic as a deviates from zero. Due to the functionaldesign, the discontinuity of MP-score near zeros becomesmore severe when a deviates from zero, which results inan unreasonable situation — considering two complexes,both complexes contain eleven genetic interactions. Oneof them has six negative interactions and five positiveinteractions, while the other contains five negative interac-tions and six positive interactions. According to MP-score,under a high a background, the former will be classifiedto be monochromatic, whereas the latter will not. It con-tradicts to the intuition that neither complex is monochro-matic. In stringent data, cytosolic large ribosomal subunit,for instance, contains 5 positive interactions and 6 nega-tive interactions, but it is absurdly identified as monochro-matic complex (Additional File 3: Table S2).So far, we have demonstrated that MP-score has several
deficiencies, including background effect and functionaldesign, and may not serve as an adequate measure toassess monochromaticity of clusters of genetic interac-tions. Therefore, developing an unbiased index is required.
Genetic interactions within complexes present significantmonochromatic tendencyWe developed monochromatic index (MCI) to quantifythe monochromatic tendency presented by all clustersof genetic interactions, not individual cluster (see Mate-rials and Methods for details). Unlike MP-scores whichdetermine the monochromaticity of each cluster, MCIcalculates the overall monochromaticity directly. Notethat a cluster of genetic interactions can be a set ofinteractions that belongs to a specific protein complex,or a collection of interactions between two complexes,depending on the research interest.
MCI is based on the following rationale. The consis-tency of types of genetic interactions within a cluster ismeasured by the ratio of difference between numbers ofpositive and negative interactions to the total number ofinteractions belonging to the cluster (denoted by b; seeMaterials and Methods). Then, MCI is calculated by aweighted mean of these b’s according to amounts ofinteractions of each cluster, reflecting the general beliefthat clusters containing more interactions are more reli-able. To evaluate how significant the observed MCI was,we conducted a permutation test (Materials and Meth-ods). Numbers of genetic interactions in each clusterwere fixed, whereas the interactions were replaced byother genetic interactions which were randomly chosenfrom all screened pairs. The significance was assessedboth by the proportion of null MCIs that are larger thanthe observed one and by a heuristic Z-score.We then applied MCI to the three different cutoff data-
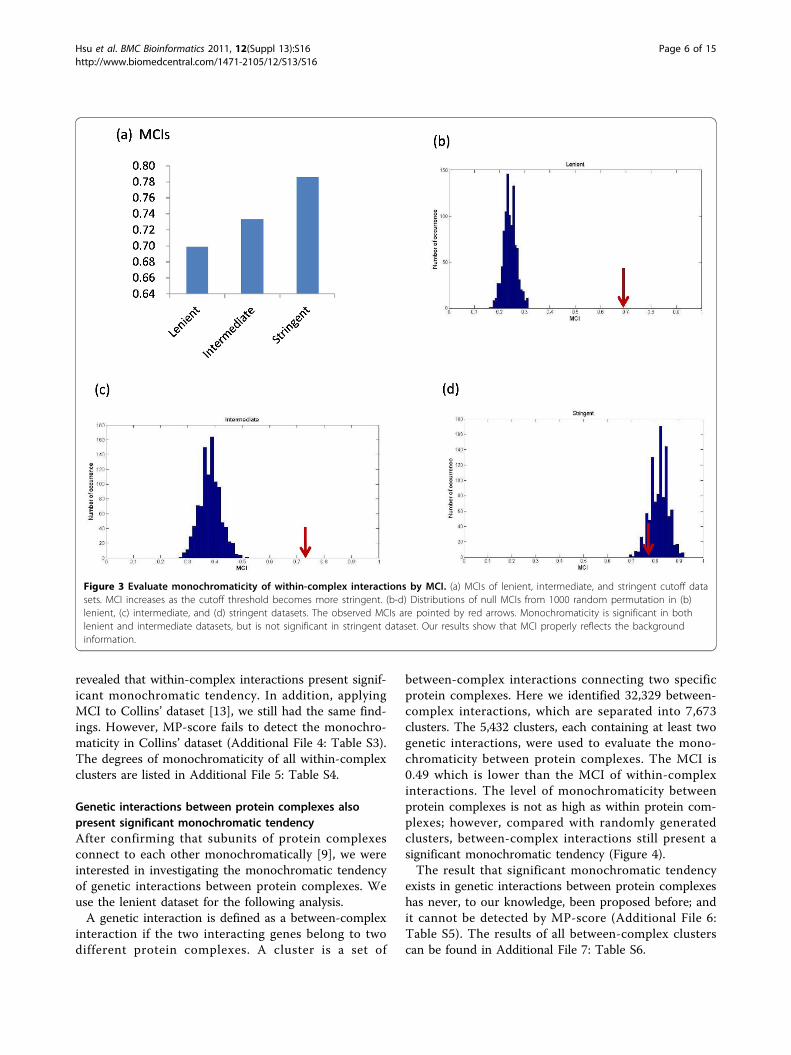
sets to investigate the monochromaticity of genetic inter-actions within protein complexes. MCI increases as thecutoff threshold becomes more stringent (Figure 3a),which is expected by the fact that the more stringent thedata set is, the more biased the background will be. Thesignificance of monochromaticity can be evaluated bycomparing the observed MCI to null MCIs. The lenientdataset showed strong evidence supporting the existenceof monochromaticity in within-complex genetic interac-tions (Figure 3b), whereas, although with the highest MCI,monochromaticity is not corroborated by the stringentdataset (Figure 3d), which is expected due to the highlybiased background. This result demonstrated that MCInot only provided a quantitative assessment of monochro-maticity for clusters of genetic interactions, but alsoreflected the background effect properly.Based on lenient dataset, the previous study of Barysh-
nikova et al. suggested that genetic interactions in pro-tein complexes are monochromatic [9]. Our result also
Figure 2 Effects of background on MP-score. Plots under different background (a) of MP-score as a function of b (see Materials and Mehods).The value b is defined as the difference between positive and negative interactions divided by the number of total genetic interactions in acomplex. Red lines indicate the threshold above which a protein complex is considered to be monochromatic. Under highly biased background(extreme a value), MP-score is not a proper indicator for monochromaticity.
Hsu et al. BMC Bioinformatics 2011, 12(Suppl 13):S16http://www.biomedcentral.com/1471-2105/12/S13/S16
Page 5 of 15
revealed that within-complex interactions present signif-icant monochromatic tendency. In addition, applyingMCI to Collins’ dataset [13], we still had the same find-ings. However, MP-score fails to detect the monochro-maticity in Collins’ dataset (Additional File 4: Table S3).The degrees of monochromaticity of all within-complexclusters are listed in Additional File 5: Table S4.
Genetic interactions between protein complexes alsopresent significant monochromatic tendencyAfter confirming that subunits of protein complexesconnect to each other monochromatically [9], we wereinterested in investigating the monochromatic tendencyof genetic interactions between protein complexes. Weuse the lenient dataset for the following analysis.A genetic interaction is defined as a between-complex
interaction if the two interacting genes belong to twodifferent protein complexes. A cluster is a set of
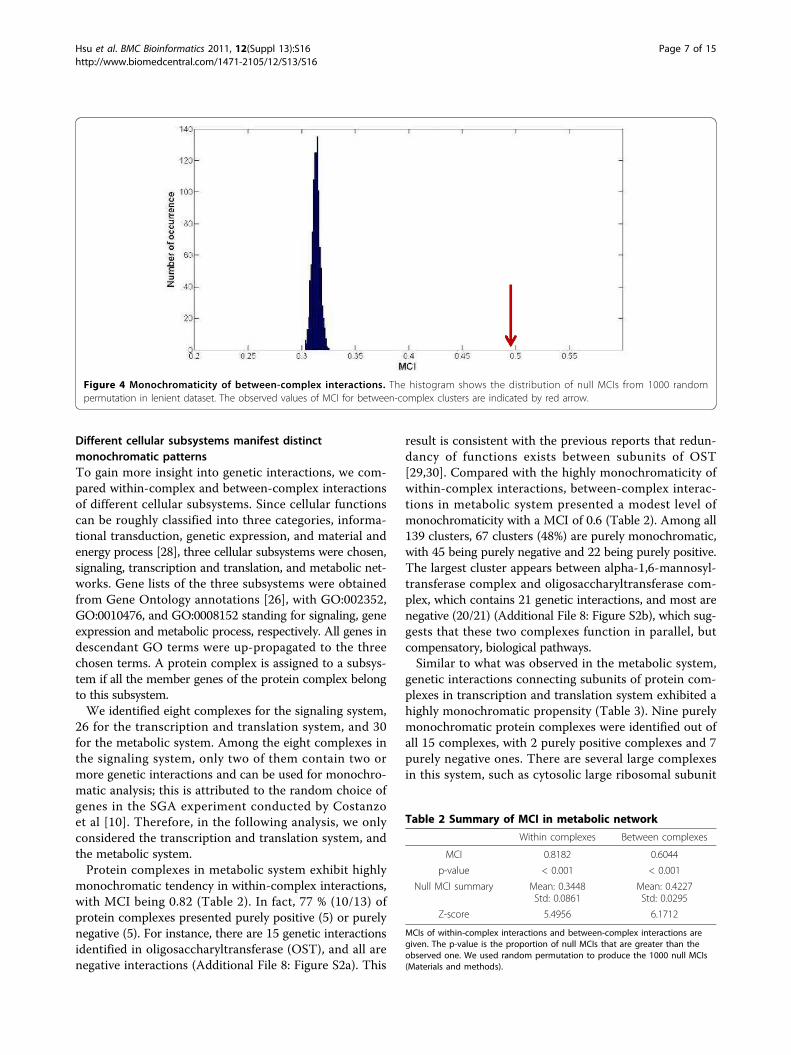
between-complex interactions connecting two specificprotein complexes. Here we identified 32,329 between-complex interactions, which are separated into 7,673clusters. The 5,432 clusters, each containing at least twogenetic interactions, were used to evaluate the mono-chromaticity between protein complexes. The MCI is0.49 which is lower than the MCI of within-complexinteractions. The level of monochromaticity betweenprotein complexes is not as high as within protein com-plexes; however, compared with randomly generatedclusters, between-complex interactions still present asignificant monochromatic tendency (Figure 4).The result that significant monochromatic tendency
exists in genetic interactions between protein complexeshas never, to our knowledge, been proposed before; andit cannot be detected by MP-score (Additional File 6:Table S5). The results of all between-complex clusterscan be found in Additional File 7: Table S6.
Figure 3 Evaluate monochromaticity of within-complex interactions by MCI. (a) MCIs of lenient, intermediate, and stringent cutoff datasets. MCI increases as the cutoff threshold becomes more stringent. (b-d) Distributions of null MCIs from 1000 random permutation in (b)lenient, (c) intermediate, and (d) stringent datasets. The observed MCIs are pointed by red arrows. Monochromaticity is significant in bothlenient and intermediate datasets, but is not significant in stringent dataset. Our results show that MCI properly reflects the backgroundinformation.
Hsu et al. BMC Bioinformatics 2011, 12(Suppl 13):S16http://www.biomedcentral.com/1471-2105/12/S13/S16
Page 6 of 15
Different cellular subsystems manifest distinctmonochromatic patternsTo gain more insight into genetic interactions, we com-pared within-complex and between-complex interactionsof different cellular subsystems. Since cellular functionscan be roughly classified into three categories, informa-tional transduction, genetic expression, and material andenergy process [28], three cellular subsystems were chosen,signaling, transcription and translation, and metabolic net-works. Gene lists of the three subsystems were obtainedfrom Gene Ontology annotations [26], with GO:002352,GO:0010476, and GO:0008152 standing for signaling, geneexpression and metabolic process, respectively. All genes indescendant GO terms were up-propagated to the threechosen terms. A protein complex is assigned to a subsys-tem if all the member genes of the protein complex belongto this subsystem.We identified eight complexes for the signaling system,
26 for the transcription and translation system, and 30for the metabolic system. Among the eight complexes inthe signaling system, only two of them contain two ormore genetic interactions and can be used for monochro-matic analysis; this is attributed to the random choice ofgenes in the SGA experiment conducted by Costanzoet al [10]. Therefore, in the following analysis, we onlyconsidered the transcription and translation system, andthe metabolic system.Protein complexes in metabolic system exhibit highly
monochromatic tendency in within-complex interactions,with MCI being 0.82 (Table 2). In fact, 77 % (10/13) ofprotein complexes presented purely positive (5) or purelynegative (5). For instance, there are 15 genetic interactionsidentified in oligosaccharyltransferase (OST), and all arenegative interactions (Additional File 8: Figure S2a). This
result is consistent with the previous reports that redun-dancy of functions exists between subunits of OST[29,30]. Compared with the highly monochromaticity ofwithin-complex interactions, between-complex interac-tions in metabolic system presented a modest level ofmonochromaticity with a MCI of 0.6 (Table 2). Among all139 clusters, 67 clusters (48%) are purely monochromatic,with 45 being purely negative and 22 being purely positive.The largest cluster appears between alpha-1,6-mannosyl-transferase complex and oligosaccharyltransferase com-plex, which contains 21 genetic interactions, and most arenegative (20/21) (Additional File 8: Figure S2b), which sug-gests that these two complexes function in parallel, butcompensatory, biological pathways.Similar to what was observed in the metabolic system,
genetic interactions connecting subunits of protein com-plexes in transcription and translation system exhibited ahighly monochromatic propensity (Table 3). Nine purelymonochromatic protein complexes were identified out ofall 15 complexes, with 2 purely positive complexes and 7purely negative ones. There are several large complexesin this system, such as cytosolic large ribosomal subunit
Figure 4 Monochromaticity of between-complex interactions. The histogram shows the distribution of null MCIs from 1000 randompermutation in lenient dataset. The observed values of MCI for between-complex clusters are indicated by red arrow.
Table 2 Summary of MCI in metabolic network
Within complexes Between complexes
MCI 0.8182 0.6044
p-value < 0.001 < 0.001
Null MCI summary Mean: 0.3448Std: 0.0861
Mean: 0.4227Std: 0.0295
Z-score 5.4956 6.1712
MCIs of within-complex interactions and between-complex interactions aregiven. The p-value is the proportion of null MCIs that are greater than theobserved one. We used random permutation to produce the 1000 null MCIs(Materials and methods).
Hsu et al. BMC Bioinformatics 2011, 12(Suppl 13):S16http://www.biomedcentral.com/1471-2105/12/S13/S16
Page 7 of 15
complex (64 members), Srb-mediator complex (24 mem-bers), and Rpd3L complex (12 members). Although theselarger complexes did not manifest purely monochromaticconnections, they exhibited high levels of monochromati-city. Cytosolic large ribosomal subunit complex, forinstance, contains 163 within-complex interactions,among which positive genetic interactions were morethan 7 times of negative ones (144 to 19) (Additional File9: Figure S3a).In contrast to the high level of monochromaticity in
within-complex interactions, protein complexes in tran-scription and translation system interacted to each otherin a relatively low-monochromaticity manner, with aMCI of 0.47 (Table 3). Only 33% (68/209) of between-complex clusters were purely monochromatic.In addition to the level of monochromaticity in meta-
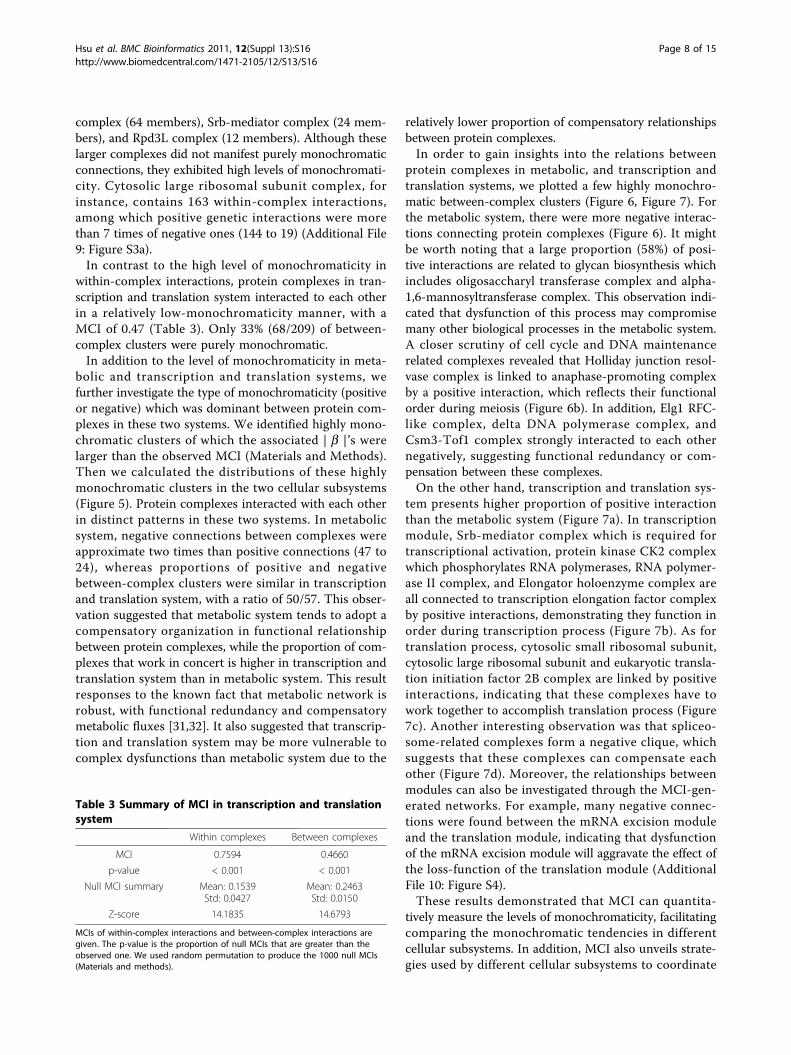
bolic and transcription and translation systems, wefurther investigate the type of monochromaticity (positiveor negative) which was dominant between protein com-plexes in these two systems. We identified highly mono-chromatic clusters of which the associated | b |’s werelarger than the observed MCI (Materials and Methods).Then we calculated the distributions of these highlymonochromatic clusters in the two cellular subsystems(Figure 5). Protein complexes interacted with each otherin distinct patterns in these two systems. In metabolicsystem, negative connections between complexes wereapproximate two times than positive connections (47 to24), whereas proportions of positive and negativebetween-complex clusters were similar in transcriptionand translation system, with a ratio of 50/57. This obser-vation suggested that metabolic system tends to adopt acompensatory organization in functional relationshipbetween protein complexes, while the proportion of com-plexes that work in concert is higher in transcription andtranslation system than in metabolic system. This resultresponses to the known fact that metabolic network isrobust, with functional redundancy and compensatorymetabolic fluxes [31,32]. It also suggested that transcrip-tion and translation system may be more vulnerable tocomplex dysfunctions than metabolic system due to the
relatively lower proportion of compensatory relationshipsbetween protein complexes.In order to gain insights into the relations between
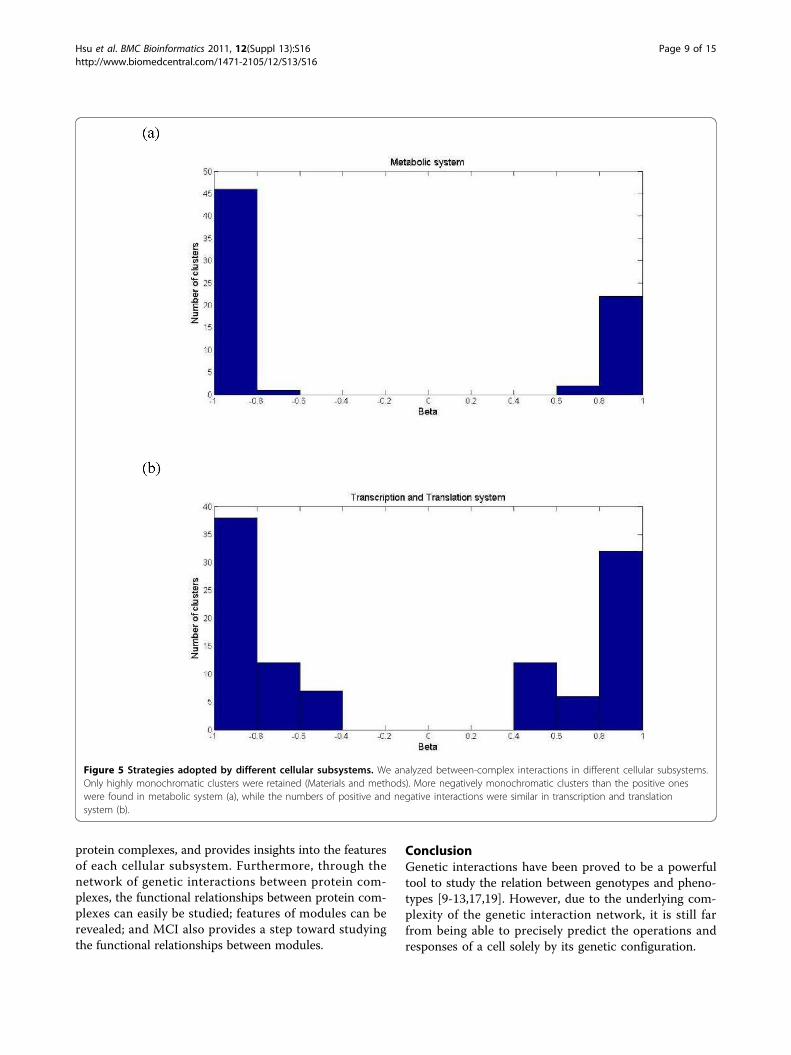
protein complexes in metabolic, and transcription andtranslation systems, we plotted a few highly monochro-matic between-complex clusters (Figure 6, Figure 7). Forthe metabolic system, there were more negative interac-tions connecting protein complexes (Figure 6). It mightbe worth noting that a large proportion (58%) of posi-tive interactions are related to glycan biosynthesis whichincludes oligosaccharyl transferase complex and alpha-1,6-mannosyltransferase complex. This observation indi-cated that dysfunction of this process may compromisemany other biological processes in the metabolic system.A closer scrutiny of cell cycle and DNA maintenancerelated complexes revealed that Holliday junction resol-vase complex is linked to anaphase-promoting complexby a positive interaction, which reflects their functionalorder during meiosis (Figure 6b). In addition, Elg1 RFC-like complex, delta DNA polymerase complex, andCsm3-Tof1 complex strongly interacted to each othernegatively, suggesting functional redundancy or com-pensation between these complexes.On the other hand, transcription and translation sys-
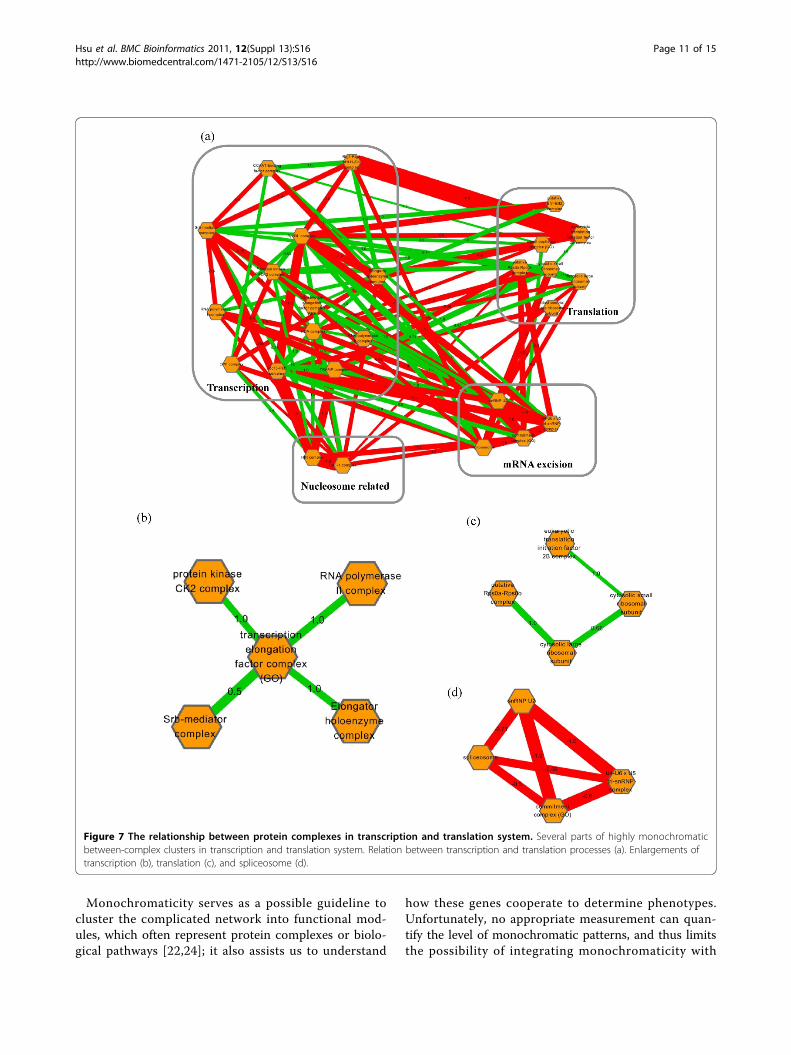
tem presents higher proportion of positive interactionthan the metabolic system (Figure 7a). In transcriptionmodule, Srb-mediator complex which is required fortranscriptional activation, protein kinase CK2 complexwhich phosphorylates RNA polymerases, RNA polymer-ase II complex, and Elongator holoenzyme complex areall connected to transcription elongation factor complexby positive interactions, demonstrating they function inorder during transcription process (Figure 7b). As fortranslation process, cytosolic small ribosomal subunit,cytosolic large ribosomal subunit and eukaryotic transla-tion initiation factor 2B complex are linked by positiveinteractions, indicating that these complexes have towork together to accomplish translation process (Figure7c). Another interesting observation was that spliceo-some-related complexes form a negative clique, whichsuggests that these complexes can compensate eachother (Figure 7d). Moreover, the relationships betweenmodules can also be investigated through the MCI-gen-erated networks. For example, many negative connec-tions were found between the mRNA excision moduleand the translation module, indicating that dysfunctionof the mRNA excision module will aggravate the effect ofthe loss-function of the translation module (AdditionalFile 10: Figure S4).These results demonstrated that MCI can quantita-
tively measure the levels of monochromaticity, facilitatingcomparing the monochromatic tendencies in differentcellular subsystems. In addition, MCI also unveils strate-gies used by different cellular subsystems to coordinate
Table 3 Summary of MCI in transcription and translationsystem
Within complexes Between complexes
MCI 0.7594 0.4660
p-value < 0.001 < 0.001
Null MCI summary Mean: 0.1539Std: 0.0427
Mean: 0.2463Std: 0.0150
Z-score 14.1835 14.6793
MCIs of within-complex interactions and between-complex interactions aregiven. The p-value is the proportion of null MCIs that are greater than theobserved one. We used random permutation to produce the 1000 null MCIs(Materials and methods).
Hsu et al. BMC Bioinformatics 2011, 12(Suppl 13):S16http://www.biomedcentral.com/1471-2105/12/S13/S16
Page 8 of 15
protein complexes, and provides insights into the featuresof each cellular subsystem. Furthermore, through thenetwork of genetic interactions between protein com-plexes, the functional relationships between protein com-plexes can easily be studied; features of modules can berevealed; and MCI also provides a step toward studyingthe functional relationships between modules.
ConclusionGenetic interactions have been proved to be a powerfultool to study the relation between genotypes and pheno-types [9-13,17,19]. However, due to the underlying com-plexity of the genetic interaction network, it is still farfrom being able to precisely predict the operations andresponses of a cell solely by its genetic configuration.
Figure 5 Strategies adopted by different cellular subsystems. We analyzed between-complex interactions in different cellular subsystems.Only highly monochromatic clusters were retained (Materials and methods). More negatively monochromatic clusters than the positive oneswere found in metabolic system (a), while the numbers of positive and negative interactions were similar in transcription and translationsystem (b).
Hsu et al. BMC Bioinformatics 2011, 12(Suppl 13):S16http://www.biomedcentral.com/1471-2105/12/S13/S16
Page 9 of 15
Figure 6 The relationship between protein complexes in metabolic system. (a) We plot several highly monochromatic between-complexclusters in metabolic system. The complexes were grouped together according to their functions. The unlabeled module includes complexesassociated to processes such as autophagy, trehalose biosynthesis, and ergosterol biosynthetic process. (b) The enlargement of cell cycle andDNA maintenance. Each node represents a protein complex. Green edges: positive interactions. Red edges: negative interactions. Each edge islabeled with its b. The edge size is proportional to the mean of the genetic interactions.
Hsu et al. BMC Bioinformatics 2011, 12(Suppl 13):S16http://www.biomedcentral.com/1471-2105/12/S13/S16
Page 10 of 15
Monochromaticity serves as a possible guideline tocluster the complicated network into functional mod-ules, which often represent protein complexes or biolo-gical pathways [22,24]; it also assists us to understand
how these genes cooperate to determine phenotypes.Unfortunately, no appropriate measurement can quan-tify the level of monochromatic patterns, and thus limitsthe possibility of integrating monochromaticity with
Figure 7 The relationship between protein complexes in transcription and translation system. Several parts of highly monochromaticbetween-complex clusters in transcription and translation system. Relation between transcription and translation processes (a). Enlargements oftranscription (b), translation (c), and spliceosome (d).
Hsu et al. BMC Bioinformatics 2011, 12(Suppl 13):S16http://www.biomedcentral.com/1471-2105/12/S13/S16
Page 11 of 15
other quantitative characteristics to further explore thegenetic landscape.This study proposes a measure called monochromatic
index (MCI) which is able to quantitatively evaluate theextent of monochromaticity of clusters of genetic inter-actions. This index not only amends the deficiencies ofthe previously proposed MP-score, but also provides asignificant level for the observed quantity. By analyzingthe genetic interaction data provided by Costanzo et al.[10] with MCI, we confirmed the previously describedmonochromatic pattern within protein complexes.Moreover, we also found that connections between pro-tein complexes also presented a significant tendency ofmonochromaticity, which has never been proposedbefore.Furthermore, MCI also reveal various genetic land-
scapes in different cellular subsystems. To be more spe-cific, levels of within-complex (between-complex)monochromaticity of different cellular subsystems canbe measured by MCI. In addition, MCI also unveilshow protein complexes are coordinated in different cel-lular subsystems. Here, we study the metabolic system,and transcription and translation system. The resultsshow that protein complexes participating in the meta-bolic system connect to each other mainly throughnegative interactions, while similar proportions of posi-tive and negative interactions are identified betweenprotein complexes in transcription and translation sys-tem. This result not only responses to previous reportsthat robustness of metabolic system can be partlyexplained by paralogue redundancy and compensatorymetabolic fluxes [31,32], but also hypothesizes transcrip-tion and translation system adopts much higher propor-tion of protein complexes that have to work in concertor in serial pathways. It helps us to gain insight intostrategies utilized to coordinate protein complexes bydifferent cellular subsystems in terms of geneticinteractions.With MCI, a genetic interaction network of protein
complexes is easily charted. It facilitates investigatingthe functional relationships between protein complexes,the features of modules, and the relationships betweenmodules. It also helps researchers to design experimentsto study protein complexes of interest, accelerating thepace toward understanding the relation between geno-types and phenotypes.MCI evaluates the level of monochromaticity from an
“edge-based” point of view. That is, only numbers ofpositive and negative genetic interactions in clusters areconsidered. Monochromaticity is interpreted as howdominant – in the sense of amount – a particular type(positive or negative) of genetic interaction is in a clus-ter. On the other hand, monochromaticity can also becomprehended by considering strengths of genetic
interactions between members in a cluster. Therefore,we also proposed strength-based monochromatic index(sMCI) to explore monochromaticity (see Materials andMethods). The results were similar to those obtained byMCI (Additional Files 11, 12, 13: Figure S5-S7). Within-complex interactions were reported to have sMCI equalto 0.71, while the value is 0.57 for between-complexinteractions. Besides, more negative connectionsbetween protein complexes were found in the metabolicsystem (25 positive and 51 negative), whereas transcrip-tion and translation system had more balanced propor-tions (40% positive and 60% negative). Theseobservations illustrated that monochromaticity can beevaluated in terms of interaction amounts or strengths.Although the most comprehensive genetic interaction
data was adopted in this work, it has to be admittedthat a large amount of interaction pairs have not beeninvestigated in the experiment [10], which may signifi-cantly affect our results. Some protein complexes werenot considered because of having no or few geneticinteractions. Even protein complexes that were consid-ered to be highly monochromatic may suffer a biascaused by incompleteness of exploration of all possiblegenetic interactions. To account for the effect of incom-pleteness on monochromaticity, we weighted each pro-tein complex according to its number of geneticinteractions that have been screened in the experimentwhen calculating MCI. In other words, we assumed thatthe more interactions a protein complex contains, themore reliable it is for evaluating monochromaticity. Inaddition, the study of cellular subsystems was alsorestricted to available genetic interactions. Only themetabolic system and the transcription and translationsystem contain enough protein complexes, and thuswere analyzed. As more genetic interactions arescreened, we expect that more solid conclusions can bedrawn and strategies adopted by different cellular sub-systems can be illustrated.Modularity has been demonstrated to be a characteris-
tic feature of cellular networks [26,28]. Hierarchicalagglomerative clustering is widely adopted when investi-gating the modularity of a given system [10,13,17]. How-ever, when facing an unknown network, the number ofclusters is hard to determine. Although unsupervisedlearning can be utilized, it is often difficult to give theresults a biological interpretation. We expect that mono-chromaticity can serve as an auxiliary guideline to defineborders between functional modules. For example, anetwork can be divided in such a way that members ineach group interact monochromatically and monochro-maticity between clusters reaches a high value. Webelieve that clearly defined functional modules can serveas the first step toward illustrating the relationshipsbetween genotypes and phenotypes.
Hsu et al. BMC Bioinformatics 2011, 12(Suppl 13):S16http://www.biomedcentral.com/1471-2105/12/S13/S16
Page 12 of 15

Materials and methodsGenetic interaction dataThe dataset used in this study comes from the mostcomprehensive genetic interaction experiment con-ducted in Saccharomyces cerevisiae[10]. The SyntheticGenetic Array technique (SGA) was adopted with 1,711query genes and 3,885 array genes spanning all biologi-cal processes, resulting in 6,651,120 interaction pairs.Single mutant fitness (SMF) of each gene and doublemutant fitness (DMF) of each gene pair are availableonline, and these two kinds of values were used forfurther analysis in this study.The genetic interaction scores (ε) are also available
online. There are three sets of genetic interaction scoreswith different cutoff strengths — that is, lenient, inter-mediate and stringent cutoffs. Lenient cutoff is definedby p-value smaller than 0.05, whereas intermediate cut-off is defined by p-value < 0.05 and |ε| > 0.08. Stringentdataset contains those genetic interaction scores whichmeet one of the conditions — that is, ε > 0.16 andp-value < 0.05 or ε < -0.12 and p-value < 0.05.
Protein complexes dataConsensus protein complex data in Benschop’s studywas adopted [27]. We obtained the gene list of 518 pro-tein complexes from the supplementary data of theirstudy. The 518 protein complexes consist of 235 com-plexes that were confirmed in literature, 174 predictedcomplexes, and 109 protein complexes defined by GOterms.
Monochromatic purity scoreIn previous work [9], the monochromaticity of interac-tions within a complex was evaluated by monochromaticpurity score (MP-score) which was defined as:
MP CN
e
SignN
ei
ij k
j k C
ij k
j k C
i
i
( )( )
,
,
,
,
=
−
− ∗
∈
∈
∑∑
1
11
a
a
where,a =∀∑1
Ne
totalj k
j k
,
,
Ni = number of screened pairs within complex i.Ntotal = number of total screened pairs.Ci = member genes of complex
i. e j k, =+1 if gene j and k have positive genetic interaction.
−−⎧⎨⎩ 1 if gene j and k have negitive genetic interaction.
For a protein complex of which the interactions are allpositive, the MP score is +1, whereas for a protein com-plex of which the interactions are all negative, the MPscore is -1. For a protein complex with a MP score ofzero, the protein complex has the same ratio of positiveinteractions to negative ones as that of background. A
protein complex is considered to be monochromatic if itsatisfies |MP(Ci)| > 0.5.
Binomial test for the monochromatic trend of complexesA binomial test was adopted to examine the hypothesisthat genetic interactions within protein complexes aremostly monochromatic. For the null hypothesis, weassumed that a protein complex has the same probabil-ity to be, or not to be, monochromatic. Hence, the num-ber of monochromatic complexes within a complexpopulation with size n could follow the binomial distri-bution: Bin(n, 0.5). The significance of monochromati-city was assessed by:
p valuen
kk
xk n k− = −
⎛
⎝⎜
⎞
⎠⎟ ∗ ∗ −
=
−−∑1 0 5 1 0 5
0
1
. ( . )
where,n = total number of complexes in the population.x = number of complexes that are identified to be
monochromatic.
Monochromatic index (MCI) and strength-basedmonochromatic index (sMCI)We developed a measure called monochromatic index(MCI) to evaluate the extent of monochromaticity ofclusters of genetic interactions. Clusters containing atleast two interactions are retained in the population forcalculating the MCI. MCI is defined as:
MCI
N
N
N Ni total i
i C
total i
i C
positive i negative i
=
∗
=
−∈
∈
∑∑| | |,
,
, ,b ||
,
i C
total i
i C
N∈
∈
∑∑
where,C is the population of genetic interaction
clusters. b ipositive i negative i
total i
N N
N=
−, ,
,
Ntotal,i is the number of total genetic interactions incluster i.Npositive,i is the number of positive genetic interactions
in cluster i.Nnegative,i is the number of negative genetic interactions
in cluster i.The quantity,
| |, ,
,
N N
Npositive i negative i
total i
−, measures the monochro-
maticity of genetic interactions in a cluster. When | bi |= 1, the cluster is purely monochromatic; when |bi | =0, the numbers of positive interactions and negativeinteractions in the cluster are the same. MCI is themean of this quantity weighted by number of interac-tions in the corresponding cluster, reflecting the faith
Hsu et al. BMC Bioinformatics 2011, 12(Suppl 13):S16http://www.biomedcentral.com/1471-2105/12/S13/S16
Page 13 of 15
that clusters with more interactions have stronger relia-bility. MCI ranges from 0, which indicates the equalnumbers of positive and negative genetic interactions, to1, which indicates pure positive or negative interactions.A cluster of which the associated | bi | is greater thanthe MCI is considered as a highly monochromaticcluster.In a similar rationale, strength-based monochromatic
index (sMCI) is defined by:
sMCI
Q N
N
i total i
i C
total i
i C
=
∗∈
∈
∑∑
,
,
where,
Qi
j
j i
j
j i
= ∈
∈
∑∑| |
| |
e
e, where εj is the strength of genetic inter-
action j.
C is the population of genetic interaction clusters.Ntotal,i is the number of total genetic interactions in
cluster i.Npositive,i is the number of positive genetic interactions
in cluster i.Nnegative,i is the numberof negative genetic interactions
in cluster i.
Evaluate the significance of MCI and sMCIWe use permutation test to assess the significance ofMCI and sMCI. In the permutation test, genetic interac-tions in each cluster are replaced by genetic interactionsrandomly chosen from all screened interactions whilekeeping the total number of interactions in each clusterfixed. A distribution of null MCI (sMCI) is thenobtained, to which the MCI (sMCI) of the population ofclusters is compared. Z-score is adopted to give a quan-titative measure of the significance:
zMCI
s= − m
where,µ is the mean of null MCIs.s is the standard deveation of null MCIs.
Additional material
Additional File 1: Table S1. Number of genetic interactionsscreened in the three data sets. Number of positive and negativegenetic interactions in the three data sets is showed. It can be seen thatthere is a bias toward negative genetic interactions as cutoff becomesmore stringent.
Additional File 2: Figure S1. Proportion of positive and negativegenetic interactions. Positive and negative genetic interactions are
showed with blue and red respectively. It can be seen that in thestringent cutoff dataset, the proportions of the positive and negativeinteractions are extremely unbalanced.
Additional File 3: Table S2. MP-score misjudges themonochromaticity of protein complexes under highly biasedbackground. In highly biased background, both golgi transport complexand cytosolic large ribosomal subunit are misjudged to be monochromaticby MP-score. Furthermore, the MP score of cytosolic large ribosomal subunitis higher than that of golgi transport complex, implicating that cytosoliclarge ribosomal subunit is more monochromatic than golgi transportcomplex. However, with the proportions of genetic interactions of thesetwo protein complexes, it is obviously an absurd conclusion.
Additional File 4: Table S3. Analysis of Collins’ dataset by MCI andMP-score. (a) MCI revealed that within-complex interactions presentsignificant monochromatic tendency. However, (b) MP-score fails todetect the monochromaticity in Collins’ dataset.
Additional File 5: Table S4. The degrees of monochromaticity ofwithin-complex clusters
Additional File 6: Table S5. MP-score fails to detect significantmonochromatic tendency in between-complex clusters. MP-scoreassigns only 2,623 out of 5,432 clusters to be monochromatic; theassociated p-value is 0.99 which does not give significance to themonochromaticity of between-complex clusters.
Additional File 7: Table S6. The degrees of monochromaticity ofbetween-complex clusters
Additional File 8: Figure S2. Examples of within-complex andbetween-complex clusters in metabolic system. The figure contains(a) the within-complex interactions of OST and (b) between-complexinteractions between OST and a-1,6-mannosyltransferase complex. Rededges indicate negative interactions. Green edges indicate positiveinteractions. The edge size is proportional to the strength of geneticinteractions which are labeled on edges.
Additional File 9: Figure S3. Examples of within-complex andbetween-complex clusters in transcription and translation system.The figure contains (a) the within-complex interactions of cytosolic largeribosomal subunit and (b) between-complex interactions betweencytosolic large ribosomal subunit and cytosolic small ribosomal subunit.Red edges indicate negative interactions. Green edges indicate positiveinteractions. The edge size is proportional to the strength of geneticinteractions which are labeled on edges.
Additional File 10: Figure S4. Examples of the functionalrelationships between modules. The figure contains present thegenetic interactions between the mRNA excision module and thetranslation module.
Additional File 11: Figure S5. Evaluate monochromaticity of within-complex interactions by sMCI. (a) sMCIs of lenient, intermediate, andstringent cutoff data sets. (b) Distribution of null sMCIs from 1000random permutation in lenient data set. The observed sMCI is pointedby red arrow. (c) Intermediate data set. (d) Stringent data set.
Additional File 12: Figure S6. Monochromaticity of between-complex interactions. The histogram shows the distribution of null sMCIsfrom 1000 random permutation in lenient dataset. The observed value ofsMCI for between-complex interactions is indicated by red arrow.
Additional File 13: Figure S7. Strategies adopted by differentcellular subsystems. We analyze between-complex interactions indifferent cellular subsystems. Only highly monochromatic clusters areremained (Materials and methods). More negatively monochromaticclusters the positive ones are found in metabolic network (a), while thesenumbers are similar in transcription and translation system (b).
AcknowledgementsThis work was supported by the National Science Council of Taiwan undergrants NSC 99-2221-E-320-006 to KC.This article has been published as part of BMC Bioinformatics Volume 12Supplement 13, 2011: Tenth International Conference on Bioinformatics –
Hsu et al. BMC Bioinformatics 2011, 12(Suppl 13):S16http://www.biomedcentral.com/1471-2105/12/S13/S16
Page 14 of 15
First ISCB Asia Joint Conference 2011 (InCoB/ISCB-Asia 2011): Bioinformatics.The full contents of the supplement are available online at http://www.biomedcentral.com/1471-2105/12?issue=S13.
Author details1Graduate Institute of Biomedical Electronics and Bioinformatics, NationalTaiwan University, Taipei, Taiwan. 2Institute of Information Science, AcademiaSinica, Taipei, Taiwan. 3Department of Computer Science and InformationEngineering, Asia University, Taichung, Taiwan. 4Department of ComputerScience and Information Engineering, National Taiwan University, Taipei,Taiwan. 5Department of Medical Informatics, Tzu Chi University, Hualien,Taiwan.
Authors’ contributionsCHH and TYW developed the statistical methods, carried out the statisticalanalysis, participated in the design of the study and drafted the manuscript.HTC participated in the design of the study. CYK and KCC conceived of thestudy, and participated in its design and coordination and helped to draftthe manuscript. All authors read and approved the final manuscript.
Competing interestsThe authors declare that they have no competing interests.
Published: 30 November 2011
References1. Mardis ER: The impact of next-generation sequencing technology on
genetics. Trends Genet 2008, 24(3):133-141.2. Boone C, Bussey H, Andrews BJ: Exploring genetic interactions and
networks with yeast. Nat Rev Genet 2007, 8(6):437-449.3. Davierwala AP, Haynes J, Li Z, Brost RL, Robinson MD, Yu L, Mnaimneh S,
Ding H, Zhu H, Chen Y, et al: The synthetic genetic interaction spectrumof essential genes. Nat Genet 2005, 37(10):1147-1152.
4. Kelley R, Ideker T: Systematic interpretation of genetic interactions usingprotein networks. Nat Biotechnol 2005, 23(5):561-566.
5. Ooi SL, Pan X, Peyser BD, Ye P, Meluh PB, Yuan DS, Irizarry RA, Bader JS,Spencer FA, Boeke JD: Global synthetic-lethality analysis and yeastfunctional profiling. Trends Genet 2006, 22(1):56-63.
6. Dixon SJ, Costanzo M, Baryshnikova A, Andrews B, Boone C: Systematicmapping of genetic interaction networks. Annu Rev Genet 2009,43(1):601-625.
7. Tong AH, Evangelista M, Parsons AB, Xu H, Bader GD, Page N, Robinson M,Raghibizadeh S, Hogue CW, Bussey H, et al: Systematic genetic analysiswith ordered arrays of yeast deletion mutants. Science 2001,294(5550):2364-2368.
8. Tong AH, Lesage G, Bader GD, Ding H, Xu H, Xin X, Young J, Berriz GF,Brost RL, Chang M, et al: Global mapping of the yeast genetic interactionnetwork. Science 2004, 303(5659):808-813.
9. Baryshnikova A, Costanzo M, Kim Y, Ding H, Koh J, Toufighi K, Youn J-Y,Ou J, San Luis B-J, Bandyopadhyay S, et al: Quantitative analysis of fitnessand genetic interactions in yeast on a genome scale. Nature Methods2010, 7(12):1017-1024.
10. Costanzo M, Baryshnikova A, Bellay J, Kim Y, Spear ED, Sevier CS, Ding H,Koh JLY, Toufighi K, Mostafavi S, et al: The genetic landscape of a cell.Science 2010, 327(5964):425-431.
11. Schuldiner M, Collins SR, Thompson NJ, Denic V, Bhamidipati A, Punna T,Ihmels J, Andrews B, Boone C, Greenblatt JF, et al: Exploration of thefunction and organization of the yeast early secretory pathway throughan epistatic miniarray profile. Cell 2005, 123(3):507-519.
12. Collins SR, Schuldiner M, Krogan NJ, Weissman JS: A strategy for extractingand analyzing large-scale quantitative epistatic interaction data. GenomeBiol 2006, 7(7):R63.
13. Collins SR, Miller KM, Maas NL, Roguev A, Fillingham J, Chu CS,Schuldiner M, Gebbia M, Recht J, Shales M, et al: Functional dissection ofprotein complexes involved in yeast chromosome biology using agenetic interaction map. Nature 2007, 446(7137):806-810.
14. Phillips PC: Epistasis — the essential role of gene interactions in thestructure and evolution of genetic systems. Nat Rev Genet 2008,9(11):855-867.
15. Costanzo M, Baryshnikova A, Myers CL, Andrews B, Boone C: Charting thegenetic interaction map of a cell. Curr Opin Biotech 2011, 22(1):66-74.
16. Mani R, St.Onge RP, Hartman JL, Giaever G, Roth FP: Defining geneticinteraction. P Natl Acad Sci USA 2008, 105(9):3461-3466.
17. Onge RPS, Mani R, Oh J, Proctor M, Fung E, Davis RW, Nislow C, Roth FP,Giaever G: Systematic pathway analysis using high-resolution fitnessprofiling of combinatorial gene deletions. Nat Genet 2007, 39(2):199-206.
18. Fiedler D, Braberg H, Mehta M, Chechik G, Cagney G, Mukherjee P, Silva AC,Shales M, Collins SR, van Wageningen S: Functional organization of the S.cerevisiae phosphorylation network. Cell 2009, 136(5):952-963.
19. Bandyopadhyay S, Mehta M, Kuo D, Sung MK, Chuang R, Jaehnig EJ,Bodenmiller B, Licon K, Copeland W, Shales M, et al: Rewiring of geneticnetworks in response to DNA damage. Science 2010, 330(6009):1385-1389.
20. Bandyopadhyay S, Kelley R, Krogan NJ, Ideker T: Functional maps ofprotein complexes from quantitative genetic interaction data. PLoSComput Biol 2008, 4(4):e1000065.
21. Song J, Singh M: How and when should interactome-derived clusters beused to predict functional modules and protein function? Bioinformatics2009, 25(23):3143-3150.
22. Jaimovich A, Rinott R, Schuldiner M, Margalit H, Friedman N: Modularityand directionality in genetic interaction maps. Bioinformatics 2010, 26(12):i228-i236.
23. Famili I, Förster J, Nielsen J, Palsson BO: Saccharomyces cerevisiaephenotypes can be predicted by using constraint-based analysis of agenome-scale reconstructed metabolic network. P Natl Acad Sci USA2003, 100(23):13134-13139.
24. Segrè D, DeLuna A, Church GM, Kishony R: Modular epistasis in yeastmetabolism. Nat Genet 2005, 37(1):77-83.
25. Michaut M, Baryshnikova A, Costanzo M, Myers CL, Andrews BJ, Boone C,Bader GD: Protein complexes are central in the yeast genetic landscape.PLoS Comput Biol 2011, 7(2):e1001092.
26. Ashburner M, Ball CA, Blake JA, Botstein D, Butler H, Cherry JM, Davis AP,Dolinski K, Dwight SS, Eppig JT, et al: Gene ontology: tool for theunification of biology. The Gene Ontology Consortium. Nat Genet 2000,25(1):25-29.
27. Benschop JJ, Brabers N, van Leenen D, Bakker LV, van Deutekom HW, vanBerkum NL, Apweiler E, Lijnzaad P, Holstege FC, Kemmeren P: A consensusof core protein complex compositions for Saccharomyces cerevisiae. MolCell 2010, 38(6):916-928.
28. Palsson BO: Systems Biology:Properties of Reconstructed Networks.Cambridge Univ. Press; 2006.
29. Knauer R, Lehle L: The oligosaccharyltransferase complex fromSaccharomyces cerevisiae. Isolation of the OST6 gene, its syntheticinteraction with OST3, and analysis of the native complex. J Biol Chem1999, 274(24):17249-17256.
30. Kelleher DJ, Gilmore R: An evolving view of the eukaryoticoligosaccharyltransferase. Glycobiology 2006, 16(4):47R-62R.
31. Caetano-Anolles G, Yafremava LS, Gee H, Caetano-Anolles D, Kim HS,Mittenthal JE: The origin and evolution of modern metabolism. Int JBiochem Cell Biol 2009, 41(2):285-297.
32. Gruning NM, Lehrach H, Ralser M: Regulatory crosstalk of the metabolicnetwork. Trends Biochem Sci 2010, 35(4):220-227.
doi:10.1186/1471-2105-12-S13-S16Cite this article as: Hsu et al.: A quantitative analysis ofmonochromaticity in genetic interaction networks. BMC Bioinformatics2011 12(Suppl 13):S16.
Submit your next manuscript to BioMed Centraland take full advantage of:
• Convenient online submission
• Thorough peer review
• No space constraints or color figure charges
• Immediate publication on acceptance
• Inclusion in PubMed, CAS, Scopus and Google Scholar
• Research which is freely available for redistribution
Submit your manuscript at www.biomedcentral.com/submit
Hsu et al. BMC Bioinformatics 2011, 12(Suppl 13):S16http://www.biomedcentral.com/1471-2105/12/S13/S16
Page 15 of 15