Embed Size (px)
Citation preview
Proceedingsof the
South Dakota Academy of Science
Volume 912012
Published by the South Dakota Academy of ScienceAcademy Founded 22 November, 1915
Academy Website: http://sdaos.org
EditorRobert Tatina
Associate EditorsMichael Barnes, SD Game, Fish and Parks, Fisheries
Dave Bergmann, Black Hills State University, MicrobiologySteve Chipps, South Dakota State University, Wildlife
Andy Detwiler, SD School of Mines and Technology, Atmospheric ScienceAndy Farke, Raymond M. Alf Museum, Paleontology
Tom Gray, Mount Marty College, ChemistryDonna Hazelwood, Dakota State University, BotanyTim Mullican, Dakota Wesleyan University, ZoologyJeffrey Palmer, Dakota State University, Mathematics
Fedora Sutton, South Dakota State University, Molecular Biology
Graphic DesignerTom Holmlund
Minuteman PressSioux Falls, SD
Copies of articles are available at EBSCO host and at http://sdaos.org

TABLE OF CONTENTS
Combined Minutes of the 97th Annual Meeting of the South Dakota Academy of Science ............................................................................................... 1
Presidential Address: Education on the Edge. Presented by Gary Larson ..................... 17
Complete Senior Research and Symposium PapersPresented at the 97th Annual Meeting of the
South Dakota Academy of Science
An Andean Domesticate Adapts to Climate Change. Matthew Sayre .......................... 25Using South Dakota Duck Eggs As a Means of Time-Travel Research
Into the Past 150 Years of Climate History. Julie R. Dejong and Kenneth F. Higgins ....................................................................................... 33
Results of Paleoflood Investigations for Spring, Rapid, Boxelder, and Elk Creeks, Black Hills, Western South Dakota. Daniel G. Driscoll, Jim E. O’Connor, and Tessa M. Harden .............................................................. 49
Permeability and Ground-Water Recharge in Black Hills Metamorphic Rocks. Perry H. Rahn .......................................................................................... 69
Monitoring Standing Herbage on Sandy Ecological Site on Nebraska and South Dakota Sand Hills. Daniel W. Uresk ......................................................... 79
Ecological Model for Seral Stage Classification and Monitoring for Sands-Choppy Sands Ecological Type in Nebraska and South Dakota. Daniel W. Uresk, Daryl E. Mergen, and Jody Javersak ......................................... 87
Performance of Commercial Starter Diets During First-Feeding of Landlocked Fall Chinook Salmon. Jeremy Kientz, Michael E. Barnes, and Dan J. Durben ............................................................................................ 101
Evaluation of Three Spawning Techniques for Yellow Perch. Matthew J. Ward, T. R. St. Sauver, D. O. Lucchesi, B. Johnson, K. Hoffman, and J. Stahl ................................................................................... 107
Inferring Introduction History and Spread of Falcaria vulgaris Bernh. (Apiaceae) in the United States Based on Herbarium Records. Sarbottam Piya, Madhav P. Nepal, Achal Neupane, Gary E. Larson and Jack L. Butler .............................................................................................. 113
Effect of Safe-Guard® Free-Choice Protein Blocks on Trichostrongyle Nematodes in Pastured Cattle from Eastern South Dakota. S. J. Smith, A. A. Eljaki, J. Acharya, R. F. Daly and M. B. Hildreth .................. 131
Expression of Two Nitrosomonas Europaea Proteins, Hydroxylamine Oxidoreductase and Ne0961, in Escherichia coli. Pankaj V. Mehrotra, Kelli Brunson, Alan Hooper, and David Bergmann ........................................... 145
Developing a <0.1 Ppb Trace Gas Impurity Sensor for Noble Liquid- Based Direct Dark Matter Detectors. Brianna J. Mount, Greg L. Serfling, Yongchen Sun, Jared D. Thompson, Dan Durben, Kara J. Keeter .............................................................................. 159
Public School Science Curriculum in Context: The Impact of Standard Reforms During the Last Two Hundred Years. Cathy Ezrailson ......................... 167
Observations of the Enigmatic Fossil Insectivore, Plesiosorex (Mammalia) in North America. James E. Martin ................................................................... 179
Abstracts of Senior Research and Symposium Papers and PostersPresented at the 97th Annual Meeting of the
South Dakota Academy of Science
Photovoltaic Devices and Systems. David W. Galipeau ............................................. 193The South Dakota Catalysis Group. James D. Hoefelmeyer,
Rajesh Shende, Alevtina Smirnova, Jan Puszynski, Hao Fong, Phil Ahrenkiel, Ranjit Koodali, Grigoriy Sereda, Dmitri Kilin, Haoran Sun, Rick Wang, and Hongshan He ..................................................... 194
The Majorana Demonstrator: a Search for Neutrinoless Double-Beta Decay. G. Perumpilly for the Majorana Collaboration ....................................... 195
Impact of Atmosphere on Hpge Crystal Growth. Guojian Wang, Gang Yang, Yongchen Sun, Wenchang Xiang, Jayesh R. Govani, Muhammad Khizar, Yutong Guan, and Dongming Mei .................................... 196
XRD Analysis of High-Purity Germanium Single Crystals Grown by the Czochralsk Method. Gang Yang, Goujian Wang, Wenchang Xiang, Muhamud Khizar, Yutong Guan, Yohgchen Sun, Dongming Mei, Jiang Chaoyang, and Bruce Gray ....................................................................... 197
Germanium Detector Response to Nuclear Recoils in Searching for Dark Matter. D. Barker and Dongming Mei .............................................................. 198
Significance of Simulation and Modeling of Growth System Geometry on the Augmentation of High Purity Germanium (Hpge) Crystals Growth Rate. Jayesh Govani, Dongming Mei, Guojian Wang, and Gang Yang .................................................................................................. 199
A Study of a Radon Gas Scrubber. Xiaoyi Yang, V. E. Guiseppe, and Dongming Mei ........................................................................................... 200
Optical and Electronic Considerations for the BHSU Cavity Ring-Down Spectroscopy System. G. L. Serfling, B. J. Mount, Y. Sun, J. D. Thompson, and K. J. Keeter ...................................................................... 201
Enhancement of NIR-To-Visible Upconversion by Silver-Nanowire Thin Films. Quoc Anh N Luu, Cuikun Lin, and P. Stanley May................................ 202
Photo-Uncaging of Coumarin from Cinnamate Coated Cdse Quantum Dots. Aravind Baride, David Hawkinson, Daniel Engebretson, and Stanley May ................................................................................................ 203
South Dakota Wind Energy: Physics, Logistics and Challenges. Jeff Rud ................. 204Review of Annual Trends of Atmospheric Thermal Inversions in South
Dakota Utilizing NWS Radiosonde and WRAN Data. Patrick R. Ealy ................................................................................................... 205
The Flexural Response of an 80 Ft Wind Turbine Subjected to Wind Loads. S. Herrod and D. Fick ............................................................................ 206
Wind Velocity Investigation at Oglala Lakota College. Phase I: Instrumentation and Data Acquisition Assessment. L. Richards and D. Fick ..................................................................................... 207
Integrated Photocatalytic and Microbial Degradation of Kraft Lignin to Form Value Added Chemicals. A. Shende, D. Harder-Heinz, and R. Shende.................................................................................................... 208
Synergistic Hydrogen Production From Water-Splitting and Aqueous Phase Biomass Reforming. V. Buddineni, A. Shende, E. Sellers, and R. Shende.................................................................................................... 209
Synthesis of 1-Butyl-3-Methylimizadolium Derivatives. Austin R. Letcher, Mathew E. Amundson, Duane E. Weisshaar, and Gary W. Earl ........................ 210
HPLC Method to Monitor Methylcarbonate/Acid Reaction Progress. Erika E. Arens, Sarah J. M. Jamison, Duane E. Weisshaar, and Gary W. Earl .............................................................................................. 211
Use of Coupled Rate Equations to Model NIR-To Visible Upconversion Kinetics in Er3+, Yb3+: NAYF4 Nanocrystals. Ge Yao, Robert B. Anderson, Quocanh N. Luu, Steve Smith, Mary T. Berry, and P. Stanley May ............................................................................................. 212
Subcritical Aqueous Phase Catalytic Liquefaction of Pine Wood for the Production of Gaseous and Liquid Fuels. R. Tungal, A. Finley, and R. V. Shende ............................................................................................... 213
Molecularly Imprinted Polymers for Dopamine Recognition. Alexander Goffeney and George Mwangi ........................................................... 214
Solar Thermochemical H2 Production Via Water-Splitting Reaction. R. R. Bhosale, S. S. Yelakanti, X. Pasala, J. A. Puszynski, and R. V. Shende ............................................................................................... 215
Analysis of Essential and Heavy Metals in Honey by Atomic Absorption Spectroscopy. Daniel Kohler and George Mwangi ............................................. 216
Exploration of Fructose 1, 6-Bisphosphate Adolase as a Potential Drug Target for Methicillin Resistant Staphylococcus aureus Infection. Emily Girard, Nichole Haag and Chun Wu ....................................................... 217
Cloning, Purification and Characterization of Acetate Kinase from Methicillin Resistant Staphylococcus aureus Mu50 Strain. Tyler Mccune and Chun Wu ............................................................................. 218
Plasma Metabolites Suggest Similar Stopover Habitat Quality for Riparian Corridor Woodlands and Anthropogenic Woodlots in the Northern Prairie Region. Ming Liu and David Swanson ................................................... 219
Short-Term Captivity Effects on Maximal Cold-Induced Metabolic Rates and Their Repeatability in American Goldfinches (Carduelis tristis). D. L. Swanson and M. O. King ......................................................................... 220
Activation of the Immune Systems Incurs Energetic Costs But No Thermogenic Tradeoffs in House Sparrows (Passer domesticus) Undergoing Cold Stress. Marisa O. King and David L. Swanson ...................... 221
Metabolic Rates in Swallows: Do Energetically Expensive Lifestyles Affect Metabolic Capacities in Birds? Yufeng Zhang and David Swanson .................... 222
Venom Proteomics of the Prairie Rattlesnake, Crotalus viridis. Mallory Ageton, Brian Smith, Eduardo Callegari, Stephen Mackessy, and Jason Nies ................................................................................................... 223
Evaluation of Cyanoacrylate as an Alternate to Skin Sutures in Dogs. N. Thakur and V .P. Chandrapuria .................................................................... 224
Stress-Induced Increases in Extracellular Serotonin in the Ventral Hippocampus is Atenuated in Rats During Amphetamine Withdrawal. H. Li, J. Hassell, J. L. Barr, J. L. Scholl, M. Watt, G. L Forster and K. J. Renner ............................................................................ 225
Reclassification of Light Harvesting Antennae Proteins Through Computational Analyses: Illuminating the Mechanism for Spectral Tuning. Joshua J. Walsh ..................................................................................... 226
Adaptive Epigenetic Effects on Drought Tolerance and Epigenetic Accommodation: Consequences for Range Expansion in Plants. Jacob Alsdurf, Tayler Ripley, Dayna Boesen, and David Siemens ....................... 227
Stoichiometry and Homeostasis of Terrestrial Fungal Isolates Acquired Near Irvine, California, and Comparison with the Redfield Ratio and Global Soil Microbial Biomass. Nicholas Kelley, Allison Moreno, Anthony Amend, Adam Martiny, and Donna Hazelwood ................................. 228
An Inventory of Native Bees (Hymenoptera: Apoidea) of the Black Hills of South Dakota and Wyoming. David J. Drons and Paul J. Johnson ............... 229
Preliminary Plague Assay Results of Fleas from Five National Parks. Erica L. Mize and Hugh B. Britten .................................................................... 230
Assessing the Effects of Grassland Management Practices on Ant Functional Groups (Hymenoptera: Formicidae). Laura B. Winkler, Diane M. Debinski, Raymond A. Moranz, James R. Miller, David M. Engle, Devan A. Mcgranahan, and James C. Trager ........................... 231
Contributions of Seed Bank and Vegetative Propagules to Vegetation Composition on Prairie Dog Colonies in Western South Dakota. Emily R. Helms, Lan Xu, Jack L. Butler ............................................................ 232
Comparing Ramp and Pitfall Traps for Capturing Wandering Spiders. L. Brian Patrick .................................................................................................. 233
Application of P-Speciation Across Land Use Gradient as an Index for Evaluating the Restoration of Soil Biogeochemical Functions During Wetland Restoration. P. V. Sundareshwar, L. Smith, B. Beas, R. Gleason, and Kurt Chowanski....................................................................... 234
Population Genetic Structure of Prairie Dogs on the Lower Brule Reservation. Jordana R. Lamb, Erica L. Mize, and Hugh B. Britten .................. 236
Conservation Genetics of the Hine’s Emerald Dragonfly. Emy M. Monroe and Hugh B. Britten .............................................................. 237
Monitoring Livestock Forage Use in the Black Hills. Thomas M. Juntti ................... 238Development of a Comprehensive Vascular Plant Database for the
Missouri Plateau. Grace Kostel, Curtis Card and Mark Gabel ........................... 239Botanical Resources: Genetic Diversity of Orchidaceae in South Dakota’s
Black Hills. R. Sprague and B. Van Ee ............................................................... 240Biogeography of the South American Major River Basins: a Preliminary
Approach U. A. Buitrago-Suarez ........................................................................ 241Possible Interactions of Kentucky Bluegrass and Western Wheatgrass
Monocultures and Mixed Populations with Fertilization and Clipping. E. M. Kanaan and J. L. Butler ........................................................... 242
Seedling Root Development of Six Alfalfa Populations. Brianna J. Gaughan, Lan Xu, Roger N. Gates, Arvid Boe, Patricia S. Johnson, and Yajun Wu ..................................................................... 243
Morphology of Smooth Bromegrass and Implications Related to Management and Potential Control. Arvid Boe and Lan Xu .............................. 244
The Impact of Blastobasis repartella (Dietz) (Lepidoptera: Coleophoridae) on Switchgrass. Veronica Calles Torrez, Paul J. Johnson, and Arvid Boe ............ 245
Screening Artemesia Extracts for Anti-Malarial Activity ................................................. . C.W. White, J. Nies, G. Geffre, and J. Dixson .................................................. 246
In Vitro and in Vivo Anthelmintic Activity of Ericameria nausoesa and Rhus aromatica from the United States Northern Great Plains with Quantification of Condensed Tannins for Both Plants. J. Acharya, M .B. Hildreth, L. D. Holler, S. Holler, A. A. Eljaki, G. Nandakafle and R. N. Reese ................................................................................................. 247
Life Cycle Assessment Modeling as a Sustainability Metric: A Case Study Investigating Antimicrobial Use Within South Dakota Swine Production. J. J. Stone ....................................................................................... 248
Fecal Egg Count Reduction Test to Evaluate the Effectiveness of Doramectin Against Trichostrongyle Nematodes in Bison from Eastern South Dakota. A. A. Eljaki, D. D. Grosz, and M. B. Hildreth .............. 249
Bovine Viral Diarrhea Virus (BVDV) Replication in Monocyte-Derived Dendritic Cells and Significance of Breed Difference in Its Generation. M. K. S. Rajput, L. J. Braun, J. F. Ridpath, W. Mwangi, A. J. Young, M. W. Darweesh, and C. C. L. Chase ................................................................ 250
Sandbar Formation Caused by The 2011 Flood on the Missouri River Near Vermillion, South Dakota. Malia Volke, W. Carter Johnson, and Bruce Millett ............................................................................................... 251
The Diversity of Undergraduate Sustainability Curricula: A Rapidly Expanding Major in Higher Education. Brennan T. Jordan ............................... 252
The Issue of Uncertainty for Hydrologic Events in the Missouri River Watershed and the Properties of the Coordinate System in Use. Boris A. Shmagin .............................................................................................. 253
Uncertainty of Hydrologic Events Under South Dakota’s Changing Conditions: A Research Agenda. Matthew Biesecker, Ralph Erion, Chris H. Hay, Geoffrey M. Henebry, Carol A. Johnston, Jeppe H. Kjaersgaard, Boris A. Shmagin, Evert Van Der Sluis, William Capehart, Andrei P. Kirilenko, Nir Y. Krakauer, Mark Sweeney, and Alexey A. Voinov ................................................................ 257
Titles Only of Senior Research Papers and Symposium Papers and Posters Presented at the 97th Annual Meeting of the South Dakota Academy of Science ................................................................................................. 261
Instructions for Authors ............................................................................................ 267

Proceedings of the South Dakota Academy of Science, Vol. 91 (2012) 1
COMBINED MINUTES EXECUTIVE COUNCIL MEETING AND BUSINESS MEETINGS
97TH ANNUAL MEETING OF SOUTH DAKOTA ACADEMY OF SCIENCE
FRIDAY AND SATURDAY 13 AND 14 APRIL 2012HOSTED BY UNIVERSITY OF SOUTH DAKOTA
MUENSTER UNIVERSITY CENTER, USDVERMILLION, SD
EXECUTIVE COMMITTEE MEETING
President Krisma DeWitt opened the meeting 11:30 am Friday 13 April 2012, welcomed members of the Executive Council to the 97th South Dakota Academy of Science Annual Meeting at the Munster University Center hosted by Univer-sity of South Dakota and noted that a quorum was present.
Reports
The Secretary’s Report, Treasurer’s Report and Proceedings Editors Report were given by Donna Hazelwood, Jeff Palmer, and Bob Tatina, respectively. Members moved and seconded acceptance of the respective reports.
Old Business
Fellows2011 SDAS Fellows: Four SDAS Fellows elected in 2010 and were honored as
2011 Fellows at the banquet; Maureen Diggins, HL Hutcheson, Gary Earl, and Waldimar “Wally” Klawiter Jr.
Science FairsJeff Palmer provided an update on the Science Fairs and the current status of
the checks awarded on behalf of the Academy. In response to requests from the regional science fairs at DWU, NSU and SDSU, Jeff provided to each location, separately, eight $25.00 checks to be distributed on behalf of the Academy.
SDAS web pageThe SDSU Website is no longer hosted by SDSU. Following up on a request by
the executive council at the September 2011 Executive Council meeting, SDAS Web Master Uriel Buitrago Suarez, has provided the Council with a draft pro-posal from the owner of Miner Solutions, Shane Miner. The Executive Council voted to accept the proposal and authorize payment of approximately six hun-dred dollars ($600.00) from the Proceedings account.

New Business
2012 FellowsFellows Elected to the South Dakota Academy of Science for 2012 and to
be honored are Nels Grandholm, SDSU, the late Audrey Gabel, BHSU, Mark Gabel, BHSU, and Robert (Bob) Tatina, DWU.
SDAS webpageFollowing up on a recommendation made at the September 2011 Executive
Council meeting, SDAS Web Master Uriel Buitrago-Suarez circulated a proposal from Miner Solutions owner Shane Miner for the SDAS website. Miles Koppang moved and George Mwangi seconded a motion to proceed, and to authorize Uriel to contact Shane Miner with the approval.
Report on the 98th Annual Meeting by Steve MatznerThe meeting will be 12 and 13 April 2012 and hosted by Augustana College
at Augustana.
Call for PapersBob Tatina will contact the appropriate individuals late Dec. or early Jan. about
the first Call for Papers.
Elections for the 2012-2013 Executive CouncilOffices open for election are Second-Vice President and one Member-at-Large
2012-2013, and four Members-at Large for 2012-2014 terms.
Committee positionsThe Nominating Committee will be Miles Koppang, and Dave Bergman.
Members of the Resolution Committee are Gary Larson and Bob Stoner. The AAAS Undergraduate Poster Judges will be Jetty Duffy-Matzner, George Mwangi and Vicki Geiser.
The 100th SDAS Annual MeetingThe first meeting of the SDAS was hosted by DWU at DWU. To celebrate the
100th Anniversary of the SDAS, the meeting will be hosted by the SDAS Execu-tive Council 10-11 April 2015 at Cedar Shore Resort, Oacoma SD.
To commemorate 100th Anniversary issue of the Proceedings, Bob Tatina sug-gested that the Proceedings contain the history of the Academy, officers, mem-bers, and history of the various disciplines. Individual sections will be authored by various authors as appropriate, and will include a history of the Academy.
Bob moved and Tom seconded adjourning the meeting at 1:00 pm.
BUSINESS MEETING SATURDAY 14 APRIL 2012.
President Krisma DeWitt opened the 7:45 am business meeting and thanked the USD local arrangements committee Miles Koppang, Chair, Chemistry, Dave Swanson, Biology, Tina Keller, Physics Yuhlong Lio, Mathematics, Stan May,
2 Proceedings of the South Dakota Academy of Science, Vol. 89 (2010)
Proceedings of the South Dakota Academy of Science, Vol. 91 (2012) 3
Chemistry, and Dong Zhang, Sanford School of Medicine, Basic Biomedical Sciences, USD, and the organizers of the symposia.
The Secretary’s report, Treasurer’s report, Auditor’s Report, and Proceedings Editor’s Report were given by Donna Hazelwood, Jeff Palmer, Tina Keller and Bob Stoner, and Bob Tatina, respectively
Old Business
The SDAS 2011 Fellows were honored at the banquet; Maureen Diggins, HL Hutcheson, Gary Earl, and Waldimar “Wally” Klawiter Jr. A call for new Fellows was announced at the business meeting. Nominations will be accepted from the floor and until the end of May for a vote by the Executive Council to occur at the September meeting.
New Business
SDAS 2012 FellowsThe SDAS 2012 Fellows were honored at the banquet were Nels Grandholm,
SDSU, the late Audrey Gabel, BHSU, Mark Gabel, BHSU, and Robert (Bob) Tatina, DWU. Nominations will be accepted from the floor and until the end of May for a vote by the Executive Council to occur at the September meeting.
Passing of the GavelThe gavel was passed from outgoing President Krisma DeWitt from Mount
Marty College passed the gavel to incoming President Gary Larson from SDSU.
ResolutionsThe Resolution Committee consisting of Gary Larson and Bob Stoner. They
thanked the USD organizing and local arrangements committee, USD local ar-rangements committee Miles Koppang, Chair, Chemistry, Dave Swanson, Biol-ogy, Tina Keller, Physics Yuhlong Lio, Mathematics, Stan May, Chemistry, and Dong Zhang, Sanford School of Medicine, Basic Biomedical Sciences, USD, the organizers of Symposium Committee on Sustainability I. Science, Jacob Kerby, Biology, Shane Nordyke, Political Science, Jordan Brennan, Earth Science, James Hoefelmeyer, Chemistry, and the Symposium Committee on Sustainability II. Science Education. Krisma DeWitt, Mount Marty College, Science Division, and Matt Miller, South Dakota State University, Chemistry Department. .They also thanked Jeff Rud for the Plenary Lecture “South Dakota Wind Energy: Physics, Logistics, and Challenges” by Jeff Rud and Science Writer and Author Sam Kean for the Keynote address “The Disappearing Spoon”. They presented special recognition for services to the Academy to Krisma DeWitt for generously volunteering to fill the unexpected vacancy for the office of President.
ElectionsThe Nominating Committee provided the following slate of nominations for
the open positions for 2012-2013.
4 Proceedings of the South Dakota Academy of Science, Vol. 91 (2012)
For the position of Second Vice President George Mwangi.For the position of Member-at-Large 2012-2013 Matt Miller SDSUFor the positions of Members-at-Large 2012-2014 Jack Butler USDA Forest Service Mark Gabel BHSU Vicki Geiser MMC Brian Patrick DWU The slate of officers as presented was elected.
Call for Nominations for FellowsKrisma initiated a call for nominations for Fellows of the SDAS. Criteria are
Service to SDAS and to science by research, teaching, service to science, and/or extension.
The Undergraduate Poster Judges Jetty Duffy-Matzner, Uriel Buitrago, and Vicki Geiser announced the AAAS Undergraduate Poster Winners:
Female UndergraduateVenom Proteomics of the Prairie Rattlesnake, Crotalus viridis. Mallory Ageton,
Brian Smith, Eduardo Callegari, Stephen Mackessy, and Jason Nies. Black Hills State University. Male undergraduate
Molecular Imprinted Polymers for Dopamine Recognition. Alexamnder Gof-feney and George Mwangi. University of Sioux Falls.
Incoming President Gary Larson gave a timely, well-researched and well-received Presidential Address on “Education on the Edge”.
Announcements98th Annual Meeting hosted by Augustana College 12 and 13 April 201399th Annual Meeting hosted by SDSM&T 2014100th Annual Meeting hosted by SDAS Executive Council, at Cedar Shore,
10 and 11 April 2015101th Annual Meeting hosted by University of Sioux Falls 2016102th Annual Meeting hosted by Dakota Wesleyan University 2017
Fall Executive Board Meeting Saturday 8 September 2012 Al’s Oasis Cham-berlain, SD
Recap of the meetingThirty-five contributed papers were presented Saturday and 58 posters were
shown at the poster presentations. A total of 176 individuals registered for the 97th SDAS Annual Meeting.
Respectfully submitted,Donna Hazelwood
Secretary SDAS
Proceedings of the South Dakota Academy of Science, Vol. 91 (2012) 5
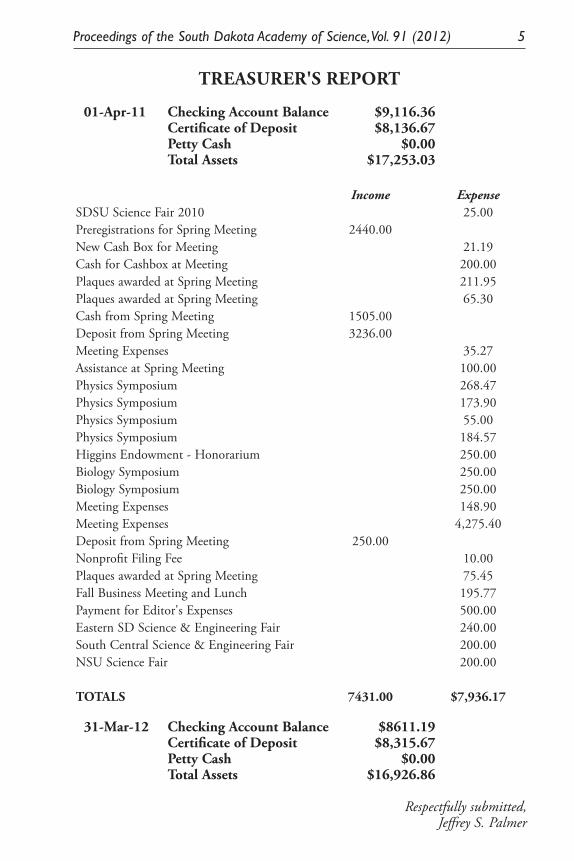
TREASURER'S REPORT
01-Apr-11 Checking Account Balance $9,116.36 Certificate of Deposit $8,136.67 Petty Cash $0.00 Total Assets $17,253.03
Income ExpenseSDSU Science Fair 2010 25.00Preregistrations for Spring Meeting 2440.00New Cash Box for Meeting 21.19 Cash for Cashbox at Meeting 200.00 Plaques awarded at Spring Meeting 211.95 Plaques awarded at Spring Meeting 65.30 Cash from Spring Meeting 1505.00Deposit from Spring Meeting 3236.00Meeting Expenses 35.27 Assistance at Spring Meeting 100.00 Physics Symposium 268.47 Physics Symposium 173.90 Physics Symposium 55.00 Physics Symposium 184.57 Higgins Endowment - Honorarium 250.00 Biology Symposium 250.00 Biology Symposium 250.00 Meeting Expenses 148.90 Meeting Expenses 4,275.40 Deposit from Spring Meeting 250.00Nonprofit Filing Fee 10.00 Plaques awarded at Spring Meeting 75.45 Fall Business Meeting and Lunch 195.77 Payment for Editor's Expenses 500.00 Eastern SD Science & Engineering Fair 240.00 South Central Science & Engineering Fair 200.00 NSU Science Fair 200.00
TOTALS 7431.00 $7,936.17
31-Mar-12 Checking Account Balance $8611.19 Certificate of Deposit $8,315.67 Petty Cash $0.00 Total Assets $16,926.86
Respectfully submitted,Jeffrey S. Palmer
6 Proceedings of the South Dakota Academy of Science, Vol. 91 (2012)
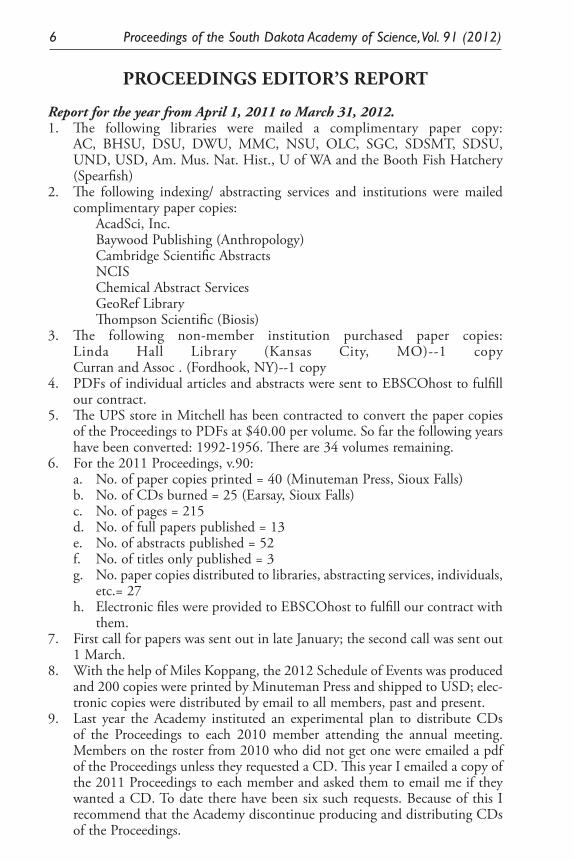
PROCEEDINGS EDITOR’S REPORT
Report for the year from April 1, 2011 to March 31, 2012.1. The following libraries were mailed a complimentary paper copy:
AC, BHSU, DSU, DWU, MMC, NSU, OLC, SGC, SDSMT, SDSU, UND, USD, Am. Mus. Nat. Hist., U of WA and the Booth Fish Hatchery (Spearfish)
2. The following indexing/ abstracting services and institutions were mailed complimentary paper copies:
AcadSci, Inc. Baywood Publishing (Anthropology) Cambridge Scientific Abstracts NCIS Chemical Abstract Services GeoRef Library Thompson Scientific (Biosis)3. The following non-member institution purchased paper copies:
Linda Hall Library (Kansas City, MO)--1 copy Curran and Assoc . (Fordhook, NY)--1 copy
4. PDFs of individual articles and abstracts were sent to EBSCOhost to fulfill our contract.
5. The UPS store in Mitchell has been contracted to convert the paper copies of the Proceedings to PDFs at $40.00 per volume. So far the following years have been converted: 1992-1956. There are 34 volumes remaining.
6. For the 2011 Proceedings, v.90: a. No. of paper copies printed = 40 (Minuteman Press, Sioux Falls) b. No. of CDs burned = 25 (Earsay, Sioux Falls) c. No. of pages = 215 d. No. of full papers published = 13 e. No. of abstracts published = 52 f. No. of titles only published = 3 g. No. paper copies distributed to libraries, abstracting services, individuals, etc.= 27 h. Electronic files were provided to EBSCOhost to fulfill our contract with them.7. First call for papers was sent out in late January; the second call was sent out
1 March.8. With the help of Miles Koppang, the 2012 Schedule of Events was produced
and 200 copies were printed by Minuteman Press and shipped to USD; elec-tronic copies were distributed by email to all members, past and present.
9. Last year the Academy instituted an experimental plan to distribute CDs of the Proceedings to each 2010 member attending the annual meeting. Members on the roster from 2010 who did not get one were emailed a pdf of the Proceedings unless they requested a CD. This year I emailed a copy of the 2011 Proceedings to each member and asked them to email me if they wanted a CD. To date there have been six such requests. Because of this I recommend that the Academy discontinue producing and distributing CDs of the Proceedings.
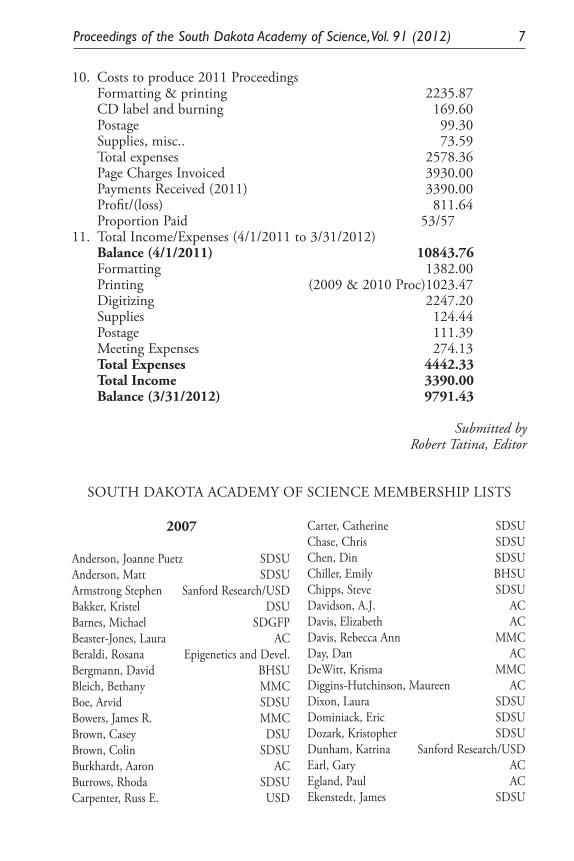
Proceedings of the South Dakota Academy of Science, Vol. 91 (2012) 7
10. Costs to produce 2011 Proceedings Formatting & printing 2235.87 CD label and burning 169.60 Postage 99.30 Supplies, misc.. 73.59 Total expenses 2578.36 Page Charges Invoiced 3930.00 Payments Received (2011) 3390.00 Profit/(loss) 811.64 Proportion Paid 53/5711. Total Income/Expenses (4/1/2011 to 3/31/2012) Balance (4/1/2011) 10843.76 Formatting 1382.00 Printing (2009 & 2010 Proc)1023.47 Digitizing 2247.20 Supplies 124.44 Postage 111.39 Meeting Expenses 274.13 Total Expenses 4442.33 Total Income 3390.00 Balance (3/31/2012) 9791.43
Submitted byRobert Tatina, Editor
SOUTH DAKOTA ACADEMY OF SCIENCE MEMBERSHIP LISTS
2007
Anderson, Joanne Puetz SDSUAnderson, Matt SDSUArmstrong Stephen Sanford Research/USDBakker, Kristel DSUBarnes, Michael SDGFPBeaster-Jones, Laura ACBeraldi, Rosana Epigenetics and Devel.Bergmann, David BHSUBleich, Bethany MMCBoe, Arvid SDSUBowers, James R. MMCBrown, Casey DSUBrown, Colin SDSUBurkhardt, Aaron ACBurrows, Rhoda SDSUCarpenter, Russ E. USD
Carter, Catherine SDSUChase, Chris SDSUChen, Din SDSUChiller, Emily BHSUChipps, Steve SDSUDavidson, A.J. ACDavis, Elizabeth ACDavis, Rebecca Ann MMCDay, Dan ACDeWitt, Krisma MMCDiggins-Hutchinson, Maureen ACDixon, Laura SDSUDominiack, Eric SDSUDozark, Kristopher SDSUDunham, Katrina Sanford Research/USDEarl, Gary ACEgland, Paul ACEkenstedt, James SDSU
8 Proceedings of the South Dakota Academy of Science, Vol. 91 (2012)
Ellis, Kevin OLCEslinger, Allison ACEstee, Charles USDFry, Christopher J. ACGabel, Audrey BHSUGabel, Mark BHSUGibbons, Joy SDSUGibson, Susan SDSUGrajczyk, Ashley SDSUGuo, Xueshui SDSUHajek, Ryan MMCHarmon, Aaron SDSUHazelwood, Donna DSUHeinemann, Kim ACHenriksen, Cody ACHesler, Louis USDA-ARSHildreth, Michael SDSUHill, Kendra SDSUHoff, Rachel MMCHubbard, Daniel SDSUHuebner, David ACHughes, Joshua Sanford Research/USDHurlburt, Abby USDHutcheson, HL SDSUIbrahim, Amir SDSUJaggi, Meena Sanford Research/USDJohnson, Gary D. SMUJohnston, Carol SDSUJones, Brooke ACKarki, David SDSUKattelman, Leslie SDSUKaushik, Radhey SDSUKelly, Kyle ACKiesow, Alyssa USDKim, Ki-In SDSUKinicki, Daniel SDSUKlein, Nick ACKnudsen, ave SDSUKobbermann, tracy BHSUKopp, Andrew SDSUKorth, Andrew SDSUKostel, Grace BHSUKunopasek, Cindy MMCLarsen, Roxanne SDSULarson, Gary E. SDSULarson, Kelly AC
Larson, Mark ACLehnert, Kelly SDSULeuking, Amy ACLiu, Yunkai USDList, Mark ACMcKenzie, Mitch SDSUMagee, Christina MMCMalecki, Marek SDSUMiller, Jake BHSUMoore, Brian ACMoorkanat, Gopakumar SDSUMullican, Tim DWUNelson, Benjamin ACNess, Jacob Michael SDSUOh, YeJin SDSUOrtmeier, Steven B. Edison Middle SchoolParris, David C. NJ State MuseumPartridge, Jessica BHSUPedersen, Scott SDSURahn, Perry H. SDSM&TRanek, Mark USDRasmussen, Eric SDSUReese, Neil SDSUReicks, Greg SDSURichards, Nathan SDGF&PRyu, Younchul USDSt. Aubin, Melissa ACSandoval, Deig OLCSatyshur, Colleen USD Schnable, Steven SDSM&TSeidel, Erin ACShmagin, Boris SDSUSnyder, Emily SDSUSorenson, James MMCStetler, Larry D. SDSM&TStoner, M. Robert USDStorlie, Eric ACSu, Huabo USDSutton, Fedora SDSUTatina, Robert DWUThomas, Ian ACTroelstrup, Jr., Nels SDSUVander Vorste, Ross SDSUViste, Arlen ACWang, Xiuqing SDSUWang, XJ USD
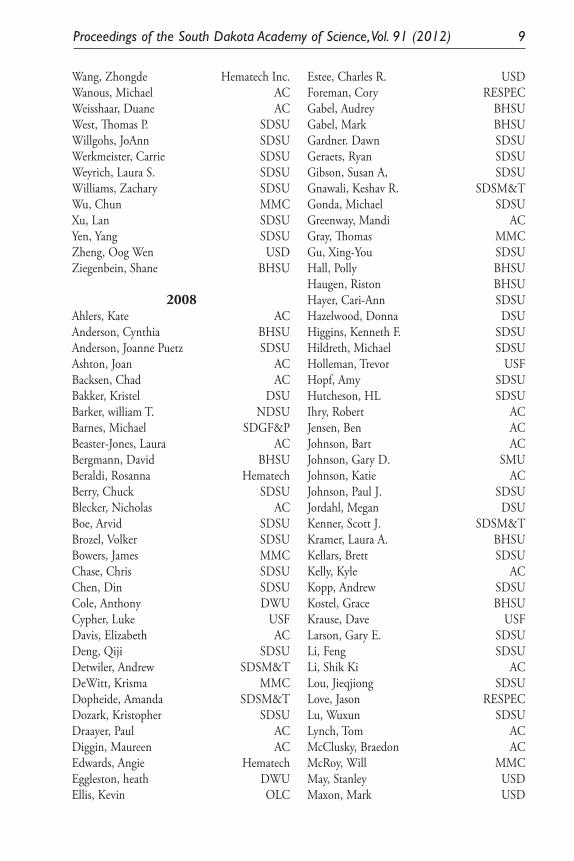
Proceedings of the South Dakota Academy of Science, Vol. 91 (2012) 9
Wang, Zhongde Hematech Inc.Wanous, Michael ACWeisshaar, Duane ACWest, Thomas P. SDSUWillgohs, JoAnn SDSUWerkmeister, Carrie SDSUWeyrich, Laura S. SDSUWilliams, Zachary SDSUWu, Chun MMCXu, Lan SDSUYen, Yang SDSUZheng, Oog Wen USDZiegenbein, Shane BHSU
2008Ahlers, Kate ACAnderson, Cynthia BHSUAnderson, Joanne Puetz SDSUAshton, Joan ACBacksen, Chad ACBakker, Kristel DSUBarker, william T. NDSUBarnes, Michael SDGF&PBeaster-Jones, Laura ACBergmann, David BHSUBeraldi, Rosanna HematechBerry, Chuck SDSUBlecker, Nicholas ACBoe, Arvid SDSUBrozel, Volker SDSUBowers, James MMCChase, Chris SDSUChen, Din SDSUCole, Anthony DWUCypher, Luke USFDavis, Elizabeth ACDeng, Qiji SDSUDetwiler, Andrew SDSM&TDeWitt, Krisma MMCDopheide, Amanda SDSM&TDozark, Kristopher SDSUDraayer, Paul ACDiggin, Maureen ACEdwards, Angie HematechEggleston, heath DWUEllis, Kevin OLC
Estee, Charles R. USDForeman, Cory RESPECGabel, Audrey BHSUGabel, Mark BHSUGardner. Dawn SDSUGeraets, Ryan SDSUGibson, Susan A, SDSUGnawali, Keshav R. SDSM&TGonda, Michael SDSUGreenway, Mandi ACGray, Thomas MMCGu, Xing-You SDSUHall, Polly BHSUHaugen, Riston BHSUHayer, Cari-Ann SDSUHazelwood, Donna DSUHiggins, Kenneth F. SDSUHildreth, Michael SDSUHolleman, Trevor USFHopf, Amy SDSUHutcheson, HL SDSU Ihry, Robert ACJensen, Ben ACJohnson, Bart ACJohnson, Gary D. SMUJohnson, Katie ACJohnson, Paul J. SDSUJordahl, Megan DSUKenner, Scott J. SDSM&TKramer, Laura A. BHSUKellars, Brett SDSUKelly, Kyle ACKopp, Andrew SDSUKostel, Grace BHSUKrause, Dave USFLarson, Gary E. SDSULi, Feng SDSULi, Shik Ki ACLou, Jieqjiong SDSULove, Jason RESPECLu, Wuxun SDSULynch, Tom ACMcClusky, Braedon ACMcRoy, Will MMCMay, Stanley USDMaxon, Mark USD
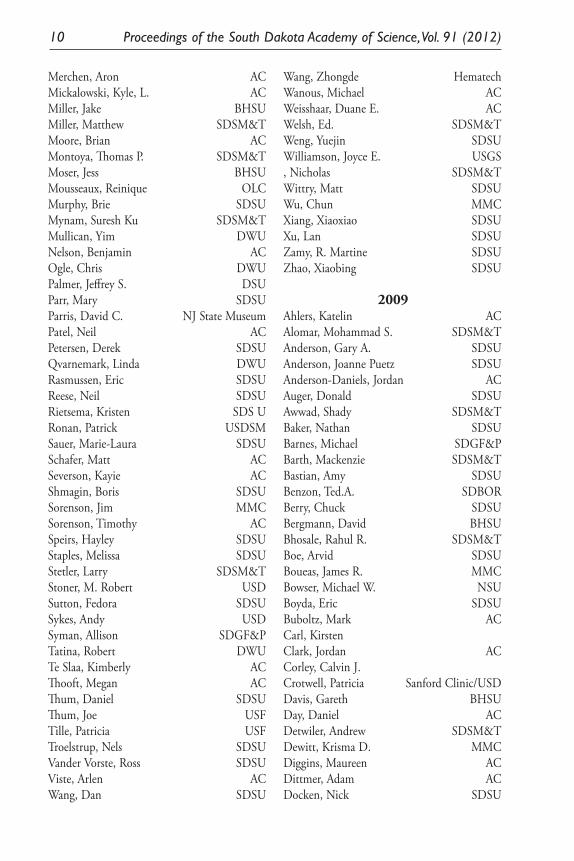
10 Proceedings of the South Dakota Academy of Science, Vol. 91 (2012)
Merchen, Aron ACMickalowski, Kyle, L. ACMiller, Jake BHSUMiller, Matthew SDSM&TMoore, Brian ACMontoya, Thomas P. SDSM&TMoser, Jess BHSUMousseaux, Reinique OLCMurphy, Brie SDSUMynam, Suresh Ku SDSM&TMullican, Yim DWUNelson, Benjamin ACOgle, Chris DWUPalmer, Jeffrey S. DSUParr, Mary SDSUParris, David C. NJ State MuseumPatel, Neil ACPetersen, Derek SDSUQvarnemark, Linda DWURasmussen, Eric SDSUReese, Neil SDSURietsema, Kristen SDS URonan, Patrick USDSMSauer, Marie-Laura SDSUSchafer, Matt ACSeverson, Kayie ACShmagin, Boris SDSUSorenson, Jim MMCSorenson, Timothy ACSpeirs, Hayley SDSUStaples, Melissa SDSUStetler, Larry SDSM&TStoner, M. Robert USDSutton, Fedora SDSUSykes, Andy USDSyman, Allison SDGF&PTatina, Robert DWUTe Slaa, Kimberly ACThooft, Megan ACThum, Daniel SDSUThum, Joe USFTille, Patricia USFTroelstrup, Nels SDSUVander Vorste, Ross SDSUViste, Arlen ACWang, Dan SDSU
Wang, Zhongde HematechWanous, Michael ACWeisshaar, Duane E. ACWelsh, Ed. SDSM&TWeng, Yuejin SDSUWilliamson, Joyce E. USGS, Nicholas SDSM&TWittry, Matt SDSUWu, Chun MMCXiang, Xiaoxiao SDSUXu, Lan SDSUZamy, R. Martine SDSUZhao, Xiaobing SDSU
2009Ahlers, Katelin ACAlomar, Mohammad S. SDSM&TAnderson, Gary A. SDSUAnderson, Joanne Puetz SDSUAnderson-Daniels, Jordan ACAuger, Donald SDSUAwwad, Shady SDSM&TBaker, Nathan SDSUBarnes, Michael SDGF&PBarth, Mackenzie SDSM&TBastian, Amy SDSUBenzon, Ted.A. SDBORBerry, Chuck SDSUBergmann, David BHSUBhosale, Rahul R. SDSM&TBoe, Arvid SDSUBoueas, James R. MMCBowser, Michael W. NSUBoyda, Eric SDSUBuboltz, Mark ACCarl, Kirsten Clark, Jordan ACCorley, Calvin J. Crotwell, Patricia Sanford Clinic/USDDavis, Gareth BHSUDay, Daniel ACDetwiler, Andrew SDSM&TDewitt, Krisma D. MMCDiggins, Maureen ACDittmer, Adam ACDocken, Nick SDSU
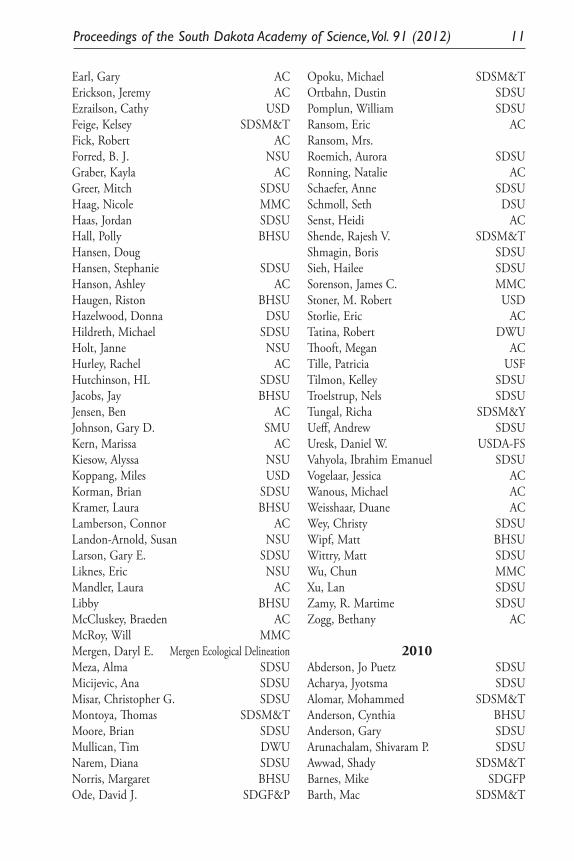
Proceedings of the South Dakota Academy of Science, Vol. 91 (2012) 11
Earl, Gary ACErickson, Jeremy ACEzrailson, Cathy USDFeige, Kelsey SDSM&TFick, Robert ACForred, B. J. NSUGraber, Kayla ACGreer, Mitch SDSUHaag, Nicole MMCHaas, Jordan SDSUHall, Polly BHSUHansen, Doug Hansen, Stephanie SDSUHanson, Ashley ACHaugen, Riston BHSUHazelwood, Donna DSUHildreth, Michael SDSUHolt, Janne NSUHurley, Rachel ACHutchinson, HL SDSUJacobs, Jay BHSUJensen, Ben ACJohnson, Gary D. SMUKern, Marissa ACKiesow, Alyssa NSUKoppang, Miles USDKorman, Brian SDSUKramer, Laura BHSULamberson, Connor ACLandon-Arnold, Susan NSULarson, Gary E. SDSULiknes, Eric NSUMandler, Laura ACLibby BHSUMcCluskey, Braeden ACMcRoy, Will MMCMergen, Daryl E. Mergen Ecological DelineationMeza, Alma SDSUMicijevic, Ana SDSUMisar, Christopher G. SDSUMontoya, Thomas SDSM&TMoore, Brian SDSUMullican, Tim DWUNarem, Diana SDSUNorris, Margaret BHSUOde, David J. SDGF&P
Opoku, Michael SDSM&TOrtbahn, Dustin SDSUPomplun, William SDSURansom, Eric ACRansom, Mrs. Roemich, Aurora SDSURonning, Natalie ACSchaefer, Anne SDSUSchmoll, Seth DSUSenst, Heidi ACShende, Rajesh V. SDSM&TShmagin, Boris SDSUSieh, Hailee SDSUSorenson, James C. MMCStoner, M. Robert USDStorlie, Eric ACTatina, Robert DWUThooft, Megan ACTille, Patricia USFTilmon, Kelley SDSUTroelstrup, Nels SDSUTungal, Richa SDSM&YUeff, Andrew SDSUUresk, Daniel W. USDA-FSVahyola, Ibrahim Emanuel SDSUVogelaar, Jessica ACWanous, Michael ACWeisshaar, Duane ACWey, Christy SDSUWipf, Matt BHSUWittry, Matt SDSUWu, Chun MMCXu, Lan SDSUZamy, R. Martime SDSUZogg, Bethany AC
2010Abderson, Jo Puetz SDSUAcharya, Jyotsma SDSUAlomar, Mohammed SDSM&TAnderson, Cynthia BHSUAnderson, Gary SDSUArunachalam, Shivaram P. SDSUAwwad, Shady SDSM&TBarnes, Mike SDGFPBarth, Mac SDSM&T
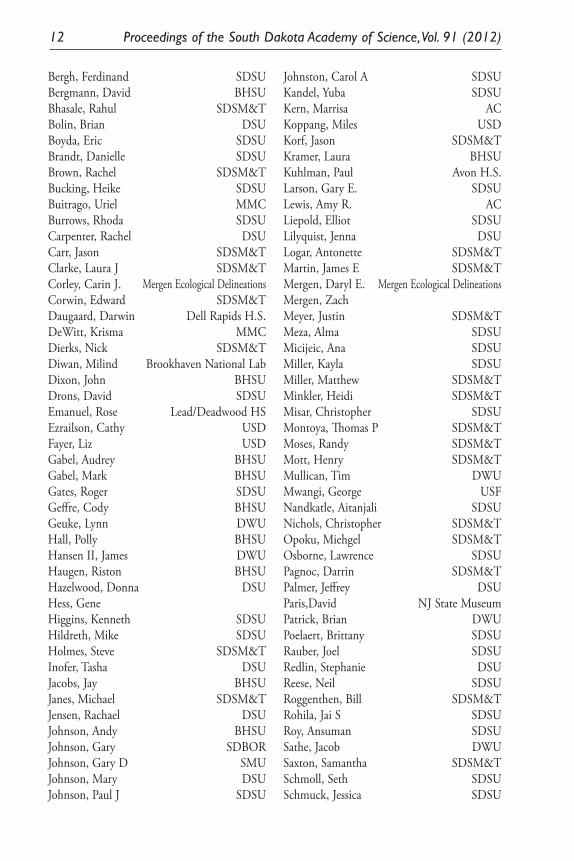
12 Proceedings of the South Dakota Academy of Science, Vol. 91 (2012)
Bergh, Ferdinand SDSUBergmann, David BHSUBhasale, Rahul SDSM&TBolin, Brian DSUBoyda, Eric SDSUBrandt, Danielle SDSUBrown, Rachel SDSM&TBucking, Heike SDSUBuitrago, Uriel MMCBurrows, Rhoda SDSUCarpenter, Rachel DSUCarr, Jason SDSM&TClarke, Laura J SDSM&TCorley, Carin J. Mergen Ecological DelineationsCorwin, Edward SDSM&TDaugaard, Darwin Dell Rapids H.S.DeWitt, Krisma MMCDierks, Nick SDSM&TDiwan, Milind Brookhaven National LabDixon, John BHSUDrons, David SDSUEmanuel, Rose Lead/Deadwood HSEzrailson, Cathy USDFayer, Liz USDGabel, Audrey BHSUGabel, Mark BHSUGates, Roger SDSUGeffre, Cody BHSUGeuke, Lynn DWUHall, Polly BHSUHansen II, James DWUHaugen, Riston BHSUHazelwood, Donna DSUHess, Gene Higgins, Kenneth SDSUHildreth, Mike SDSUHolmes, Steve SDSM&TInofer, Tasha DSUJacobs, Jay BHSUJanes, Michael SDSM&TJensen, Rachael DSUJohnson, Andy BHSUJohnson, Gary SDBORJohnson, Gary D SMUJohnson, Mary DSUJohnson, Paul J SDSU
Johnston, Carol A SDSUKandel, Yuba SDSUKern, Marrisa ACKoppang, Miles USDKorf, Jason SDSM&TKramer, Laura BHSUKuhlman, Paul Avon H.S.Larson, Gary E. SDSULewis, Amy R. ACLiepold, Elliot SDSULilyquist, Jenna DSULogar, Antonette SDSM&TMartin, James E SDSM&TMergen, Daryl E. Mergen Ecological DelineationsMergen, Zach Meyer, Justin SDSM&TMeza, Alma SDSUMicijeic, Ana SDSUMiller, Kayla SDSUMiller, Matthew SDSM&TMinkler, Heidi SDSM&TMisar, Christopher SDSUMontoya, Thomas P SDSM&TMoses, Randy SDSM&TMott, Henry SDSM&TMullican, Tim DWUMwangi, George USFNandkatle, Aitanjali SDSUNichols, Christopher SDSM&TOpoku, Miehgel SDSM&TOsborne, Lawrence SDSUPagnoc, Darrin SDSM&TPalmer, Jeffrey DSUParis,David NJ State MuseumPatrick, Brian DWUPoelaert, Brittany SDSURauber, Joel SDSURedlin, Stephanie DSUReese, Neil SDSURoggenthen, Bill SDSM&TRohila, Jai S SDSURoy, Ansuman SDSUSathe, Jacob DWUSaxton, Samantha SDSM&TSchmoll, Seth SDSUSchmuck, Jessica SDSU
Proceedings of the South Dakota Academy of Science, Vol. 91 (2012) 13
Senst, Heidi ACSheltar, Sully SDSM&TShirke, Manali Manohar SDSUSorenson, Jim MMCSoundy, Jared ACSreenivasan, Chithra SDSUStetler, Larry SDSM&TStoner, M. Robert USDSwett, Suzanne DSUSzczerbinska, Barbara DSUTatina, Robert DWUTestin, Jason SDSM&TThompson, Wayne SDSM&TTille, Patricia SDSUTraxinger, Bobbie Douglas H.S.Uresk, Daniel USDA-FS VanBeek, Jason SDSM&TWake, Carol SDSUWanous, Mike ACWeedon, Ronald R. CSCWeisshaar, Duane ACWelsch, Ed SDSM&TWerner, Jordan DWUWipf, Matt BHSUWu, Chun MMCXu, Lan SDSUYe, Heng SDSUYounes, Hammad Ali SDSM&T
2011Anderson, Cynthia M. BHSUAnderson, Gary A. SDSUBakker, Kristel DSUBarnes, Mike SDGF&PBergmann, David J. BHSUBoe, Arvid SDSUBuitrago-Suarez, Uriel A. MMCChase, Chris SDSUDeWitt, Krisma MMCDiggins, Maureen ACDixon, John BHSUDroge, Dale DSUGabel, Audrey BHSUGabel, Mark BHSUGeiser, Vicki MMCGibson, Susan A. SDSU
Guiseppe, Vincente USDHazelwood, Donna DSUHiggins, Kenneth F. SDSUHildreth, Mike SDSUHutcheson, H. L. SDSUJensen, Kent C. SDSUJohnson, Carter SDSUJohnson, Gary SDBORJohnson, Gary D RetiredJohnson, Paul J. SDSUKandel, Yuba R. SDSUKiesow, Alyssa NSUKoppang, Miles USDLarson, Gary E. SDSULarson, Mark ACMartin, James E SDSM&TMergen, Daryl E. MEDMontoya, Thomas P SDSM&TMullican, Tim DWUMwangi, George K. USFPalmer, Jeffrey DSUParris,David C. NJRahn, Perry SDSM&TRauber, Joel SDSUReese, Neil SDSURohila, Jai S. SDSURoy, Ansuman SDSUSimolien, Martine SDSUSorenson, Jim MMCStoner, M. Robert USDSwanson, David L. USDSzczerbinska, Barbara DSUTatina, Robert DWUTroelstrup Jr., Nels H. SDSUWanous, Mike ACWard, Matthew SDGF&PWeisshaar, Duane ACWilson, Robert J. CSUWu, Chun MMCXu, Lan SDSUBai, Xinhua SDSM&TGrau, Nathan ACMei, Dongmang USDWussow, Matt ACAcharya, Jyotsma SDSUBergeleen, Harlan SDSU
14 Proceedings of the South Dakota Academy of Science, Vol. 91 (2012)
Blake, Kyle NSUBrandt, Danielle SDSUByram, Dana USDCalles Torrez, Veronica SDSUClemetson, LeRoy SDSUDeJong Julie SDSUDrons, David SDSUEllis, Kevin BHSUGeffre, Cody BHSUGeffre, Gina BHSUGross, Kylie MMCGrosz, Drew SDSUHerr, Jeffrey BHSUInofer, Tosha DSUJacobs, Jay BHSUJambani, Parvathi SDSUJohnson, Emily SDSUJoseph, Jocelin SDSUKarki, Amrit SDSUKasmarik, Tara NSUKerkman, Martina MMCKuehl, Lyntawha SDSULudvik, Jessica SDSUMensah, Jerry A. SDSUMergen, Zach BHSUMiller, Kayla SDSUMoran, Christopher SDSUNandkafle, Gitanjali SDSUNeth, Cassie MMCPoelaert, Brittany SDSUPremo, Ambra NSUPuetz, Joanne SDSURabara, Roel C. SDSURedlin, Stephanie DSURigge, Matthew SDSUSabel, Shaina SDSUSreenivasan, Chithra SDSUThiele, Jason SDSUThiesse, Philip SDSUTripathi, Prateek SDSUVan Asma, Nicholas BHSUVande Kamp, Kendall SDSUVelk, Kimberly MMCVolke, Malia SDSUWalter, Ashton MMCWaughtel, Shauna SDSU
Williams, Holli DSUWilliams, Zach DSUXu, Bing SDSUDjira, Gemechis SDSU
2012Acharya, Joytsna SDSNAdrian, Seth ACAgeton, Mallory BHSUAlsdorf, Jake BHSUAmundson, Matthew ACAnderson, Cynthia BHSUAnderson, Gary SDSUAnderson, Joanne SDSUAnderson, Tasha USDAnkireddy, Krishnamraju SDSM&TArens, Erica ACBahnson, Anna ACBaird, Nancy Baride, Aravind USDBarker, Diann USDBarnes, Michael E. SDGF&PBarnett, Michael SDSUBergmann, David j. BHSUBerry, Mary USDBestul, Claire ACBlumenstock, Derek MMCBoe, Arvid SDSUBogue, Rebecka ACBritten, Hugh USDBubak, Andrew USDBuddineni, Venu SDSMTBuitrago-Suarez, Uriel A. MMCButler, Jack L. USFSCalles-Torrez, Veronica SDSUChen, Jiangchao USDConley, Adrienne ACDahl, Erika ACDeWitt, Krisma MMCDixon, Mark USDDriscoll, Daniel USGSDrons, David SDSUDuffy-Matzner, Jetty ACEaly, Patrick SDSM&TEdgington, Michael AC
Proceedings of the South Dakota Academy of Science, Vol. 91 (2012) 15
Eljaki, Abdelhakim SDSUEnsz, Nicole ACErickson, Lee SDSUEzrailson, Cathy USDFick, Damon SDSM&TGabel, Mark BHSUGaughan, Brianna SDSUGautam, Sushil SDSMTGaylor, Michael DSUGeiser, Vicki MMCGibson, Susan SDSUGoffeney, Alexander USFGong, Yajuan USDGoodman, Barb USDGoon, Tuck USDGovani, Jayesh USDGray DSUGribb, Molly SDSM&THall, Carrie ACHamblin, Courtney DSUHan, Yulun USDHassel, James USDHazelwood, Donna DSUHelms, Emily SDSUHerrod, Shane SDSM&THiggins, Kenneth F. SDSUHildreth, Mike SDSUHjelmen, Carl ACHoefelmeyer, James USDHorn, Alissa USDHoward, Daniel ACHrabe, Ashley SDSUJackson, Bailey ACJamison, Sarah ACJaswal, Rajneesh SDSM&TJiang, Chaoyang USDJoerger, Rebecca ACJohnson, Christina ACJohnson, Gary D. SMUJordan, Brennan USDJorde, Elisabeth ACJuntti, Tom Sierra ClubKanaan, Emma SDSUKeeter, Kara BHSUKeller, Christina USDKelley, Nick DSU
Keppen, Joseph ACKing, Marisa USDKoehler, Emily DeSmet HSKohler, Daniel USFKolli, Pordha USDKoppang, Miles USDKuhlman, Paul Avon HSLamb, Jordana USDLarson, Gary SDSULensing, Cody ACLetcher, Austin ACLi, Hao USDLindsey, Nicole ACLiu, Ming USDLuepke, Kristen ACLuu, Quoc Anh USDMahoney, Luther USDMatzner, Steven ACMay, Stanley USDMazzer, Paula DWUMcComas, Leah ACMei, Dongming USDMeng, Quigguo USDMergen, Daryl E. Mergen Ecological DelineationsMergen, Zach BHSUMeruga, Jeevan SDSM&TMiles, Jackie ACMiller, Matthew L. SDSUMize, Erica USDMonroe, Emy USDMoore, Courtney ACMount, Brianna J. BHSUMullican, Tim DWUMwangi, George USFNepal, Madhav SDSU Palmer, Jeffrey DSUParan, P. Krishna USDPasala, Xaviu SDSM&TPatrick, L. Brian DWUPerumpilly, Gopakumar USDPiya, Sarbottam SDSUPrussing, Kara ACPutta, Anjaneyulu USDRahn, Perry H. SDSM&TRajput, Mrigendra K. SDSURenner, Kenneth USD
16 Proceedings of the South Dakota Academy of Science, Vol. 91 (2012)
Richards, Lester SDSMTRipley, Tayler J. BHSURoggenthen, William SDSM&TSayer, Matthew P. USDSchenkel, Dillon MMCSchieffer, Rebecca ACSchmidt, Ashley ACSchmidt, Kelsey MMCSefling, Greg BHSUSellers, Evan SDSM&TSharma, Sangita SDSUShende, Anaradha SDSM&TShende, Rajesh SDSM&TShmagin, Boris SDSUSmith, Brian BHSUSmith, Stephanie SDSUSoluk, Daniel USDSorenson, Jim MMCSprague, Rylan BHSUStone, Jim SDSM&TStoner, Robert USDSundareshwar, P.V. SDSM&TSwanson, David USDSykes, Andrew USDTatina, Robert DWUThakur, Neely Tungal, Richa SDSM&T
Uresk, Daniel W. USDA-FSVastenhout, Kayla ACVolke, Malia SDSUVrblca-Olson, Marcia Vermillion HSVunnam, Swathi SDSM&TWalsh, Joshua DSUWang, Guojian USDWard, Matthew SDGF&PWassom, James Weber, Ashley ACWei, Wenzhao USDWeier, Lisa Brookings SchoolWeisshaar, Duane E. ACWhite, Chris BHSUWinkler, Laura SDSUWoelber, Brooke ACWong, Kelly ACWu, Chun MMCXu, Lan SDSUYang, Gang USDYang, Xiaoyi USDYao, Ge USDYelakarh, Sowmya SDSM&TZhang, Chao USDZhang, Yufeng USDZokaites, Sarah AC

Proceedings of the South Dakota Academy of Science, Vol. 91 (2012) 17
PRESIDENTIAL ADDRESS: EDUCATION ON THE EDGE
Address to the South Dakota Academy of ScienceUniversity of South Dakota, Vermillion, SD
April 14, 2012
Presented by Gary LarsonSouth Dakota State University
Brookings, SD 57007
As incoming president of SDAS, I elected to speak on a topic that stands to impact the health and future of science education and research in South Dakota. You might think that the recent session of the South Dakota Legislature made my choice of topics obvious and I would agree. No one in South Dakota could ignore this year’s debate over public education funding, and given the outcome of the legislative session and with the help of some research on my part, I have concluded that the K-12 system is truly jeopardized by inadequate state support. Of course, public higher education has taken serious blows recently, too, but I believe the situation in K-12 education is most dire because a continued policy of chronically underfunding public education in this state threatens the integrity of the K-12 system. Those of us in the business of postsecondary education have every reason to worry about students coming to us inadequately prepared for col-lege. We all want students who are ready to succeed in college, with the knowl-edge, skills, and aptitude that enable their success. However, as long as education funding is treated as discretionary spending by our state politicians, the outlook for universal quality education in South Dakota gets bleaker year by year.
Education is a tremendously complicated and controversial issue with many interrelated aspects, but I want to focus here and now on funding of the K-12 system in our state. Gov. Daugaard introduced HB 1234 this year to “reform” education in South Dakota, contending in his January 10, 2012 “State of the State” address that the state had spent a lot of money on K-12 education but had realized unsatisfactory results. He noted that since 1971, enrollment in South Dakota public schools has fallen by nearly 50,000 pupils (a 28.5% decline). Over the same period, more than 850 teachers (up 10%) and over 3,500 staff (up 65%) have been added due to requirements of Individuals with Disabilities Act, Title IX, and increased graduation requirements. Consequently, per student funding rose from about $4,000 per student to about $9,000 in that 40-year period. Not mentioned by the governor are the increased cost to school districts of educators’ health plans, new curricula, and the higher cost of heating and cooling buildings and running buses. Certainly those factors weigh into the per-pupil cost calculation, too.
The governor cited the ACT and NAEP scores of South Dakota students as evidence of a poor return on the increased investment in education. For example, ACT scores of South Dakota high school students were noted to be consistently

18 Proceedings of the South Dakota Academy of Science, Vol. 91 (2012)
above average in the country, but they had remained steady for many years, varying between 21 and 22. NAEP scores for 4th and 8th graders in reading and math were noted to slip relative to other states in recent years, although less so for 8th graders than 4th graders. Apparently these results indicated to the gover-nor a need to “reform” education in South Dakota, and since additional money over the years had made no difference, it was time to try a new approach. Cit-ing no evidence, Gov. Daugaard asserted that the single most important factor in student learning success is a good teacher -- class size, physical facilities, and access to technology are less important. Thus was born the governor’s “Investing in Teaching” initiative wherein it is proposed that $5,000 merit pay be awarded to the top 20% of teachers and $2,500 bonuses be given for those teaching in critical needs areas, e.g., science and math. For $15 million to be appropriated in the future, state government could thereby do its part in a very economical way to improve educational outcomes for South Dakota students.
Is it possible, however, that HB 1234, as it was amended, modified in minor ways to improve palatability among lawmakers, and then passed by just one vote in the Legislature, served to obscure the real problem faced by public school systems in South Dakota? Are there issues that make teaching in South Dakota a more challenging job than elsewhere? Consider first of all how South Dakota really invests in its teachers. The state ranks 50th among the states in average teacher salary and has for many years. Now, we are more ensconced in 50th place than ever. After last year’s 8.6% cut in state aid to schools, South Dakota saw a 9.3% drop in average teacher pay from the 2009-2010 school year (NEA Rankings & Estimates, Dec. 2010, Summary Table G, p. 92). Why such a big drop relative to the cut? Because many veteran teachers threw in the towel, either retiring or quitting to go elsewhere. Some left the profession for new opportu-nities. South Dakota’s average teacher pay of $35,201 is now just 63% of the national average (http://madvilletimes.com/2011/06/south-dakota-teacher-pay-last-again-63-of-national-average/). For a long time, North Dakota has ranked 49th in teacher pay. It still does. But with an average teacher pay of $44,266, the difference between the Dakotas is now over $9,000 per year. All of this readily accessible information is a black eye on public education in South Dakota. How can this state expect to attract dedicated, highly qualified and effective teachers given these statistics?
Recall that HB 1234 would provide $2,500 bonuses for critical needs teachers. Originally the bill specified math and science teachers but was changed to allow flexibility for districts to apply the bonuses to other difficult-to-fill positions. The list of teacher shortages posted on the South Dakota Department of Edu-cation’s web site shows why that change was made. That list has doubled since 2007-2008, with virtually all subject areas (13) listed as having teacher shortages (Teacher Shortage Areas Nationwide Listing 1990-1991 through 2012-2013. April 2012. U.S. Department of Education Office of Postsecondary Education). Surely a $2,500 bonus will fix the problem! (See average teacher pay comparisons above.)
Again, teacher pay in South Dakota is the poorest by far among the 50 states. It has been repeatedly asserted by some in the legislature that school districts set teacher wages, not the state. So, surely state aid to the districts is enough to
Proceedings of the South Dakota Academy of Science, Vol. 91 (2012) 19
support competitive salaries. Let’s see how South Dakota invests in education. Districts receive money principally from two sources: property taxes and the state general fund. Recall that in South Dakota we spend around $9,000 per pupil. Of this, the state’s share dropped from $4,805 in 2010-11 (and 2009-10) to $4,390 in 2011-12 (-8.6%). With the 2.3% inflationary increase for 2012-13, the state’s share will rise to $4,491. South Dakota reports the state’s share of education spending went from 56.1% to 52.6% between 2009-10 and 2010-11, and then will go back upward to 53.8% with the 2.3% increase in 2011-12 (State Aid to K-12 General Education Funding Formula, Revised March, 2012. S.D. Dept. of Education.)
Another way to view the state’s share of education spending is as reported by the National Education Association. They show a local (and others) share of education spending of 49.9% for 2009-10 and for 2010-11 (estimated). The remainder of spending is reported as 30.3% state and 19.7% federal in 2009-10 and 30.2% state/19.9% federal (estimated) in 2010-11 (NEA Rankings & Estimates, December 2010, Summary Tables H and I, pp. 93-94). In other words, much of the funding the state claims to spend on education, nearly 20% of the total, is federal money. At the 2010-2011 level of state spending on K-12 education, South Dakota ranks 49th in the percent of cost covered by state government (Op. cit. Table F-10, p. 42). Only Illinois provides a lower percent coverage by the state.
The question arises “How much aid should the state provide to school districts for them to sustain a quality program?” Dr. Roger DeGroot, Superintendent of Brookings Schools answered that question in response to a query from a legisla-tor. Given some time to research an answer, he responded, “The magic number is about $6,270 per student – about $1,600 more than Gov. Dennis Daugaard has proposed for the 2012-2013 school year.” (Brookings Register, ‘How Much Do Schools Need?’ Jan. 20, 2012). Of course, this estimate is only from one district, and estimates would be expected to vary among districts. One thing is obvious. An additional $15 million in state aid wouldn’t come close to covering an increase on that order statewide. Clearly, state government is abdicating its fiduciary responsibility to provide for the education of children in South Dakota.
Can South Dakota afford to pay more for education? In FY 2010, South Da-kota ranked 46th in per capita tax collection among the 50 states, and it ranked 47th in percentage of per capita income (4.2%) going to state taxes (Federation of Tax Administrators, http://www.taxadmin.org/). This amounts to $1,607 per person, one of the very lowest state tax burdens in the nation. South Dakota politicians have long described the state as one of the poorest in the country, one that could ill afford higher taxes, and especially an income tax of any kind. In 2010, South Dakota per capita income rose to 22nd in the nation, amounting to $39,593. Simultaneously median household income dropped from $51,600 in 2008 to $45,669 in 2010 (“South Dakota’s per capita Income in 2010 22nd in Nation”, Rapid City Journal, Oct. 7, 2011). This means that the income increase was highly focused and not shared generally by the state’s population.
According to the online publication ‘Who Pays?’ (Institute on Taxation and Economic Policy, http://www.itepnet.org) South Dakota has the third most regressive tax system among the 50 states. The lowest 20% income bracket pays
20 Proceedings of the South Dakota Academy of Science, Vol. 91 (2012)
around 11% of their income in state and local taxes. In contrast, the upper 1% bracket pays around 2% of their income in state and local taxes. With no income tax, the state relies principally on a 4% sales tax, a contractors excise tax, a bank franchise tax, proceeds from the state lottery, and lesser sources. A concentrated increase in income, especially in upper brackets, thus has no impact on state revenues unless and until some of that income is used to make purchases, build, start a bank, or gamble. As long as South Dakota’s tax structure remains as is, the state’s efforts to fund education and other state-sponsored enterprises will dimin-ish. Federal spending in the state is destined to decline due to the need to address the federal deficit, and South Dakota’s obligation to programs like Medicaid will climb because it is indexed to per capita income. Perhaps revenues needed to operate state government should also be linked at least partly to income. That would make South Dakota’s tax system more equitable and more stable. What-ever the source, state revenues designated for education in South Dakota must increase or a decline in the quality of education is inevitable.
My research into the facts, the statistics, and (unavoidably) the politics of K-12 education funding in South Dakota has led me to some uncomfortable conclu-sions about this issue. First, South Dakota cannot hide a poor environment for teachers. The state’s record of education funding and how teachers are treated in South Dakota is online for all to discover and leads me to conclude that unless and until teachers and school administrators are valued as professionals, we will lose top educators to other states. South Dakota must compete for good educa-tors rather than penalize the good ones it has. Rewarding just 20% of teachers with merit pay is tantamount to telling the other 80% they are not doing a good job – a demoralizing proposition at best. Secondly, the state is demanding in-creased control over education while simultaneously cutting its own investment in education. Part of HB 1234 establishes panels to oversee teacher evaluation statewide and thereby adds another layer of bureaucracy that promises to fur-ther dilute the amount of state aid getting to the local level. This is yet another modern example of how greater effort to assess an enterprise (teaching students) without additional funding simply dilutes the resources needed for actually do-ing the job (again, teaching students). It has also led to the self-defeating mantra of “Do more with less” that is so pervasive in state government. Logic demands that an insistence for increased control over school districts needs to be matched by greater, not less, state-level investment.
One encouraging outcome of this year’s discussion of education funding has been increased public awareness and action on the issue. Enough signatures were gathered on petitions to refer HB 1234 to a public vote in the November 2012 election. Additionally, an initiated referendum to impose a 1% sales tax increase with the proceeds designated for K-12 education and Medicaid will also be on the 2012 ballot. For the sake of education in South Dakota, we can hope that these efforts succeed and that voters do not allow politicians to subvert their in-tentions. The latter can’t happen if education is viewed and promoted as it should be, with a sense of pride and altruism. As a society we need to take ownership of our public school systems and not let them fall prey to budget cutting in the name of frugality in state government. We frequently hear about how much our nation’s future depends on a sound system of education, yet apathy has gotten

Proceedings of the South Dakota Academy of Science, Vol. 91 (2012) 21
us to where we are with underfunding education in this state. South Dakotans need to understand that good quality education requires more robust financial underpinnings and not simply a “carrot and stick” approach toward the teaching profession. I hope you will join in urging our politicians to increase the state-based funding for K-12 education in South Dakota. In countless ways all of our futures depend on it.


Complete Senior Research
and Symposium Papers
presented at the
The 97th Annual Meeting
of the
South Dakota Academy of Science

Proceedings of the South Dakota Academy of Science, Vol. 91 (2012) 25
AN ANDEAN DOMESTICATE ADAPTS TO CLIMATE CHANGE
Matthew SayreDepartment of AnthropologyUniversity of South Dakota
Vermillion, SD 57069Corresponding author email: [email protected]
ABSTRACT
The cultivated potato (Solanum tuberosum) is one of the staples of international agriculture. This paper presents two approaches to analyze changing cultivation practices of the potato over time. The first is a paleoethnobotanical analysis of past plant use at the pre-Inka site of Chavín de Huántar in Peru. The second is a survey of changing planting and cultivation techniques in the Parque de la Papa (Potato Park), an area of indigenous bio-cultural patrimony, located above the Peruvian town of Pisac in the Sacred Valley of the Inka. The initial survey of planting practices at the Potato Park revealed that potatoes were grown pri-marily in the upslope areas of the park not on the valley bottoms, which were primarily planted with maize. The changing climate is forcing farmers to plant further upslope in areas that were not previously cultivated. As farmers search for colder environments for their distinct varieties of potatoes they are running into the limits of cultivatable land. The successful adaptations of farmers in the pre-Hispanic past demonstrated the resilience of traditional agricultural practices, but modern farmers are facing unique new challenges. Places like the Potato Park that seek to preserve cultural and ecological diversity are of tremendous importance to a rapidly changing world.
Keywords
Potato, Climate Change, Peru, Archaeology
INTRODUCTION
The cultivated potato (Solanum tuberosum) is one of the staples of interna-tional agriculture. This plant, which is commonly associated with Ireland and other European countries, originated in the Andean region of South America. Recent research places its likely center of domestication in southern Peru (Smith 1998; Spooner et al. 2005). However, the likely high altitude origins of the po-tato have not limited its success in a wide range of environments across the globe (FAO 2008). While, the center of origin of potato exhibits a wide varietal diver-sity, much of the world only grows a limited number of varieties (FAO 2008).
26 Proceedings of the South Dakota Academy of Science, Vol. 91 (2012)
This paper presents two approaches to analyze changing cultivation practices of the potato over time. The first is a paleoethnobotanical analysis of past plant use at the site of Chavín de Huántar in Peru. The second source of analysis is a survey of changing planting and cultivation techniques in the Parque de la Papa (Potato Park) located above the Peruvian town of Pisac in the Sacred Valley of the Inka, an area of indigenous bio-cultural patrimony. This region of the world is a biodiversity hotspot whose preservation would greatly enhance global conserva-tion planning (Myers et al. 2000).
Chavín de Huántar is a ceremonial site in the Central Andean highlands, that functioned as a center from roughly 1200 BCE – 500 BCE (Sayre 2010: 46-50; Rick et al. 2011). The steep ecology of the land surrounding the site, which is located on a valley bottom at 3100 masl, means that different climate regimes are present within a short horizontal distance (Piperno and Pearsall 1998). The sur-rounding mountains of the Cordillera Blanca often reach 6000 m of elevation, thus fields from 2000-4000 masl could have been cultivated by past residents of the areas surrounding the temple.
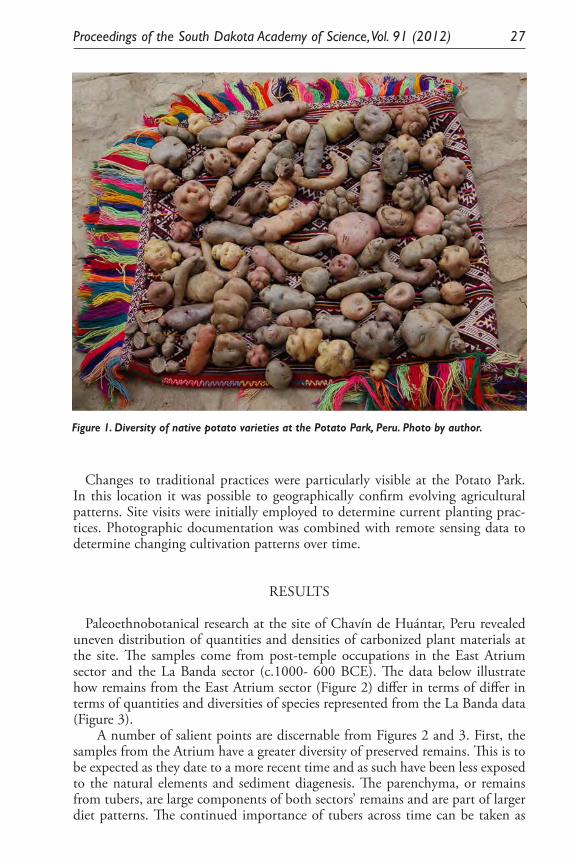
The Potato Park is a unique project in the Sacred Valley of the Inka. The park attempts to preserve not only the land and its related biodiversity but also the cultural diversity of human practices observed in the region. This park is a center of potato landrace diversity and its inhabitants preserve hundreds of varieties of potatoes (FAO 2008) as well as diverse methods of preserving and consum-ing this resilient crop (Figure 1). One method in particular, the production of freeze-dried potatoes locally known as ch’uñu or chuño, is a source of particular pride. This preservation technique was used by the Inka to maintain a five year supply of surplus food for the inhabitants of their empire (D’Altroy 2002). It is a process that relies on freezing nighttime temperatures to remove excess moisture from the potato, which makes it particularly dependent upon climatic stability. Finally, the park is one of the few sites in the world in which an indigenous community, composed of members of the villages of Sacaca, Chawaytire, Pam-pallaqta, Paru Paru and Amaru, have sent seed samples to the International Seed Bank to preserve their bio-cultural knowledge for perpetuity. The community is making an explicit connection between their customs and traditional knowledge and the scientific attempts to preserve and document genetic variety.
METHODS
This research was focused on both past and present practices. The past culti-vation practices of potato farmers are visible in the archaeological record through paleoethnobotanical analysis, which focuses on the preserved and carbonized remains of past plant material that is gathered through the flotation process (Pearsall 2010; and see Sayre 2010: 110-115 for precise details). Parenchyma, or storage cells of tubers, is preserved carbonized starch that is indicative of past consumption practices. While tubers other than potatoes were consumed in the Andes in the past these other tubers rarely dominated archaeological finds at mid-elevation sites.
Proceedings of the South Dakota Academy of Science, Vol. 91 (2012) 27
Changes to traditional practices were particularly visible at the Potato Park. In this location it was possible to geographically confirm evolving agricultural patterns. Site visits were initially employed to determine current planting prac-tices. Photographic documentation was combined with remote sensing data to determine changing cultivation patterns over time.
RESULTS
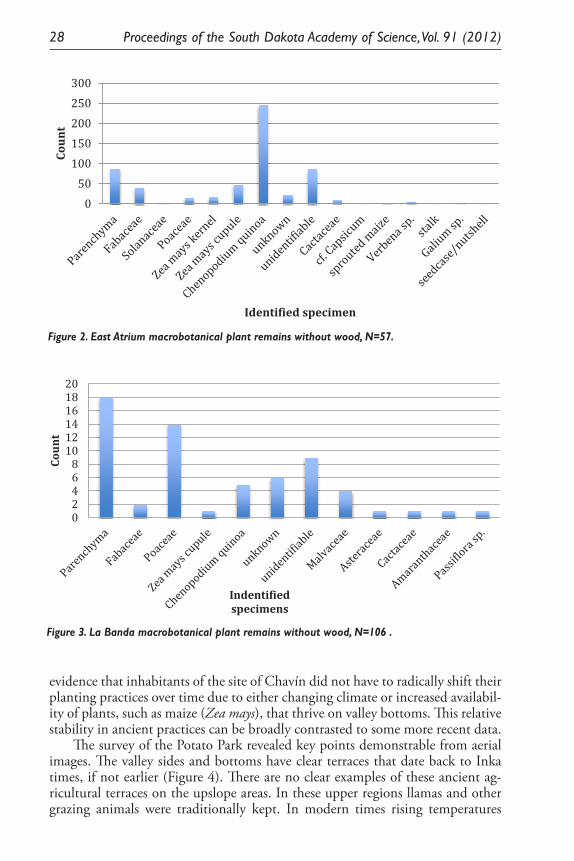
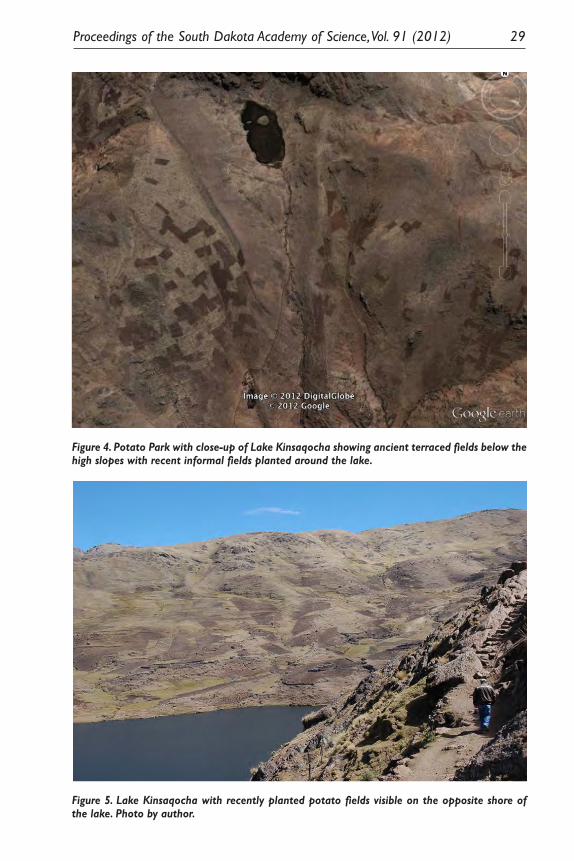
Paleoethnobotanical research at the site of Chavín de Huántar, Peru revealed uneven distribution of quantities and densities of carbonized plant materials at the site. The samples come from post-temple occupations in the East Atrium sector and the La Banda sector (c.1000- 600 BCE). The data below illustrate how remains from the East Atrium sector (Figure 2) differ in terms of differ in terms of quantities and diversities of species represented from the La Banda data (Figure 3).
A number of salient points are discernable from Figures 2 and 3. First, the samples from the Atrium have a greater diversity of preserved remains. This is to be expected as they date to a more recent time and as such have been less exposed to the natural elements and sediment diagenesis. The parenchyma, or remains from tubers, are large components of both sectors’ remains and are part of larger diet patterns. The continued importance of tubers across time can be taken as
Figure 1. Diversity of native potato varieties at the Potato Park, Peru. Photo by author.
planting and cultivation techniques in the Parque de la Papa (Potato Park) located above the Peruvian town of Pisac in the Sacred Valley of the Inka, an area of indigenous bio-cultural patrimony. This region of the world is a biodiversity hotspot whose preservation would greatly enhance global conservation planning (Myers et al. 2000). Chavín de Huántar is a ceremonial site in the Central Andean highlands, that functioned as a center from roughly 1200 BCE – 500 BCE (Sayre 2010: 46-50; Rick et al. 2011). The steep ecology of the land surrounding the site, which is located on a valley bottom at 3100 masl, means that different climate regimes are present within a short horizontal distance (Piperno and Pearsall 1998). The surrounding mountains of the Cordillera Blanca often reach 6000 m of elevation, thus fields from 2000-4000 masl could have been cultivated by past residents of the areas surrounding the temple. The Potato Park is a unique project in the Sacred Valley of the Inka. The park attempts to preserve not only the land and its related biodiversity but also the cultural diversity of human practices observed in the region. This park is a center of potato landrace diversity and its inhabitants preserve hundreds of varieties of potatoes (FAO 2008) as well as diverse methods of preserving and consuming this resilient crop (Figure 1). One method in particular, the production of freeze-dried potatoes locally known as ch'uñu or chuño, is a source of particular pride. This preservation technique was used by the Inka to maintain a five year supply of surplus food for the inhabitants of their empire (D’Altroy 2002). It is a process that relies on freezing nighttime temperatures to removeexcess moisture from the potato, which makes it particularly dependent upon climatic stability. Finally, the park is one of the few sites in the world in which an indigenous community, composed of members of the villages of Sacaca, Chawaytire, Pampallaqta, Paru Paru and Amaru, have sent seed samples to the International Seed Bank to preserve their bio-cultural knowledge for perpetuity. The community is making an explicit connection between their customs and traditional knowledge and the scientific attempts to preserve and document genetic variety.
28 Proceedings of the South Dakota Academy of Science, Vol. 91 (2012)
evidence that inhabitants of the site of Chavín did not have to radically shift their planting practices over time due to either changing climate or increased availabil-ity of plants, such as maize (Zea mays), that thrive on valley bottoms. This relative stability in ancient practices can be broadly contrasted to some more recent data.
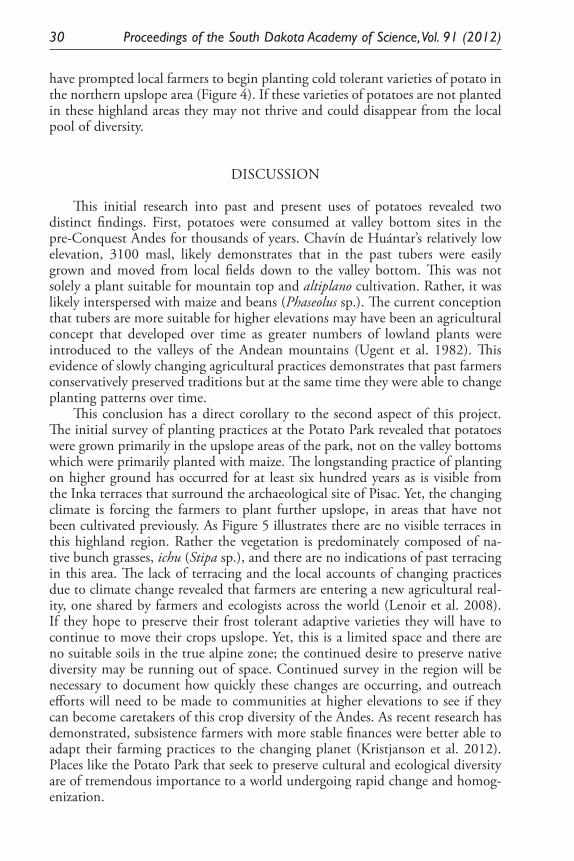
The survey of the Potato Park revealed key points demonstrable from aerial images. The valley sides and bottoms have clear terraces that date back to Inka times, if not earlier (Figure 4). There are no clear examples of these ancient ag-ricultural terraces on the upslope areas. In these upper regions llamas and other grazing animals were traditionally kept. In modern times rising temperatures
A number of salient points are discernable from Figures 2 and 3. First, the samples from the Atrium have a greater diversity of preserved remains. This is to be expected as they date to a more recent time and as such have been less exposed to the natural elements and sediment diagenesis. The parenchyma, or remains from tubers, are large components of both sectors’ remains and are part of larger diet patterns. The continued importance of tubers across time can be taken as evidence that inhabitants of the site of Chavín did not have to radically shift their planting practices over time due to
0 50
100 150 200 250 300
Cou
nt
Identified specimen
Figure 2: East Atrium macrobotanical plant remains without wood, N=57
Indentified specimens
0 2 4 6 8
10 12 14 16 18 20
Cou
nt
Figure 3: La Banda macrobotanical plant remains without wood, N=106
Figure 2. East Atrium macrobotanical plant remains without wood, N=57.
A number of salient points are discernable from Figures 2 and 3. First, the samples from the Atrium have a greater diversity of preserved remains. This is to be expected as they date to a more recent time and as such have been less exposed to the natural elements and sediment diagenesis. The parenchyma, or remains from tubers, are large components of both sectors’ remains and are part of larger diet patterns. The continued importance of tubers across time can be taken as evidence that inhabitants of the site of Chavín did not have to radically shift their planting practices over time due to
0 50
100 150 200 250 300
Cou
nt
Identified specimen
Figure 2: East Atrium macrobotanical plant remains without wood, N=57
Indentified specimens
0 2 4 6 8
10 12 14 16 18 20
Cou
nt
Figure 3: La Banda macrobotanical plant remains without wood, N=106
Figure 3. La Banda macrobotanical plant remains without wood, N=106 .
Proceedings of the South Dakota Academy of Science, Vol. 91 (2012) 29
either changing climate or increased availability of plants, such as maize (Zea mays), that thrive on valley bottoms. This relative stability in ancient practices can be broadly contrasted to some more recent data.
The survey of the Potato Park revealed key points demonstrable from aerial images. The valley sides and bottoms have clear terraces that date back to Inka times, if not earlier (Figure 4). There are no clear examples of these ancient agricultural terraces on the upslope areas. In these upper regions llamas and other grazing animals were traditionally kept. In modern times rising temperatures have prompted local farmers to begin planting cold tolerant varieties of potato in the northern upslope area (Figure 4). If these varieties of potatoes are not planted in these highland areas they may not thrive and could disappear from the local pool of diversity.
Figure 4. Potato Park with close-up of Lake Kinsaqocha showing ancient terraced fields below the high slopes with recent informal fields planted around the lake.
Figure 4. Potato Park with close-up of Lake Kinsaqocha showing ancient terraced fields below the high slopes with recent informal fields planted around the lake.
Figure 5. Lake Kinsaqocha with recently planted potato fields visible on the opposite shore of the lake. Photo by author.
DISCUSSION
This initial research into past and present uses of potatoes revealed two distinct findings. First, potatoes were consumed at valley bottom sites in the pre-Conquest Andes for thousands of years. Chavín de Huántar’s relatively low elevation, 3100 masl, likely demonstrates that in the past tubers were easily grown and moved from local fields down to the valley bottom. This was not solely a plant suitable for mountain top and altiplanocultivation. Rather, it was likely interspersed with maize and beans (Phaseolus sp.). The current conception that tubers are more suitable for higher elevations may have been an agricultural concept that developed over time as greater numbers of lowland plants were introduced to the valleys of the Andean mountains (Ugent et al. 1982). This evidence of slowly changing agricultural practices demonstrates that past farmers conservatively preserved traditions but at the same time they were able to change planting patterns over time. This conclusion has a direct corollary to the second aspect of this project. The initial survey of planting practices at the Potato Park revealed that potatoes were grown primarily in the upslope areas of the park, not on the valley bottoms which were primarily planted with maize. The longstanding practice of planting on higher ground has occurred for at least six hundred years as is visible from the Inka terraces that surround the archaeological site of Pisac. Yet, the changing climate is forcing the farmers to plant
Figure 5. Lake Kinsaqocha with recently planted potato fields visible on the opposite shore of the lake. Photo by author.
30 Proceedings of the South Dakota Academy of Science, Vol. 91 (2012)
have prompted local farmers to begin planting cold tolerant varieties of potato in the northern upslope area (Figure 4). If these varieties of potatoes are not planted in these highland areas they may not thrive and could disappear from the local pool of diversity.
DISCUSSION
This initial research into past and present uses of potatoes revealed two distinct findings. First, potatoes were consumed at valley bottom sites in the pre-Conquest Andes for thousands of years. Chavín de Huántar’s relatively low elevation, 3100 masl, likely demonstrates that in the past tubers were easily grown and moved from local fields down to the valley bottom. This was not solely a plant suitable for mountain top and altiplano cultivation. Rather, it was likely interspersed with maize and beans (Phaseolus sp.). The current conception that tubers are more suitable for higher elevations may have been an agricultural concept that developed over time as greater numbers of lowland plants were introduced to the valleys of the Andean mountains (Ugent et al. 1982). This evidence of slowly changing agricultural practices demonstrates that past farmers conservatively preserved traditions but at the same time they were able to change planting patterns over time.
This conclusion has a direct corollary to the second aspect of this project. The initial survey of planting practices at the Potato Park revealed that potatoes were grown primarily in the upslope areas of the park, not on the valley bottoms which were primarily planted with maize. The longstanding practice of planting on higher ground has occurred for at least six hundred years as is visible from the Inka terraces that surround the archaeological site of Pisac. Yet, the changing climate is forcing the farmers to plant further upslope, in areas that have not been cultivated previously. As Figure 5 illustrates there are no visible terraces in this highland region. Rather the vegetation is predominately composed of na-tive bunch grasses, ichu (Stipa sp.), and there are no indications of past terracing in this area. The lack of terracing and the local accounts of changing practices due to climate change revealed that farmers are entering a new agricultural real-ity, one shared by farmers and ecologists across the world (Lenoir et al. 2008). If they hope to preserve their frost tolerant adaptive varieties they will have to continue to move their crops upslope. Yet, this is a limited space and there are no suitable soils in the true alpine zone; the continued desire to preserve native diversity may be running out of space. Continued survey in the region will be necessary to document how quickly these changes are occurring, and outreach efforts will need to be made to communities at higher elevations to see if they can become caretakers of this crop diversity of the Andes. As recent research has demonstrated, subsistence farmers with more stable finances were better able to adapt their farming practices to the changing planet (Kristjanson et al. 2012). Places like the Potato Park that seek to preserve cultural and ecological diversity are of tremendous importance to a world undergoing rapid change and homog-enization.
Proceedings of the South Dakota Academy of Science, Vol. 91 (2012) 31
ACKNOWLEDGEMENTS
Thanks- Centro International de la Papa, Global Heritage Fund- Conserva-tion Fellow Program, the Parque de la Papa, and the South Dakota Academy of Science.
LITERATURE CITED
D’Altroy, T. 2002. The Incas. Blackwell Publishers. Malden, MA.FAO (Food and Agricultural Organization of the United Nations). 2008. In-
ternational Year of the Potato: New light on a hidden treasure. Rome, Italy.Patti Kristjanson, H. Neufeldt, A. Gassner, J. Mango, F. B. Kyazze, S. Desta, G.
Sayula, B. Thiede, W. Förch, P. K. Thornton, and R. Coe. 2012 Are food insecure smallholder households making changes in their farming practices? Evidence from East Africa. Food Security 4: 381-397.
Lenoir, J., J.C. Gegout, P.A. Marquet, P. de Ruffay, and H. Brisse. 2008. A Sig-nificant Upward shift in plant species optimum elevation during the 20th Century. Science 320: 1768-1771.
Myers, N., R. A. Mittermeier, C. G. Mittermeier, G. A. B. da Fonseca, and J. Kent. 2000. Biodiversity hotspots for conservation priorities.
Nature 403: 853-858.Piperno, D., and D. Pearsall. 1998. The Origins of Agriculture in the Neo-
tropics. Academic Press. San Diego, CA.Pearsall, D. 2010. Paleoethnobotany: A Handbook of Procedures, Second Edi-
tion. Left Coast Press. Walnut Creek, CA.Rick, J., C. Mesai, D. Contreras, S. Kembel, R. Rick, M. Sayre, and J. Wolf.
2011. La Cronologia de Chavín de Huántar y sus Implicancias para el Periodo Formativo. PUCP (13): 87-132.
Sayre, M. 2010. Life across the river: Ecology, Ritual, and Agriculture at Chavín de Huántar, Peru. Thesis. University of California at Berkeley, Berkeley, CA.
Smith, B. 1998. The Emergence of Agriculture. Scientific American Library: New York, NY.
Spooner D M., K. McLean, G. Ramsay, R. Waugh, and G. J. Bryan. 2005. A single domestication for potato based on multilocus amplified fragment length polymorphism genotyping. PNAS 102 (41): 14694–14699.
Ugent, D., S. Pozorski, and T. Pozorski. 1982. Archaeological potato tuber re-mains from the Casma Valley of Peru. Economic Botany 38: 417-432.

Proceedings of the South Dakota Academy of Science, Vol. 91 (2012) 33
USING SOUTH DAKOTA DUCK EGGS AS A MEANS OF TIME-TRAVEL RESEARCH INTO THE PAST 150 YEARS OF CLIMATE HISTORY
Julie R. DeJong* and Kenneth F. HigginsDepartment of Natural Resource Management
South Dakota State UniversityBrookings, SD 57007
*Corresponding author email: [email protected]
ABSTRACT
We collected maximum length and width (± 0.1 mm) of 4,257 duck eggs, which represent 12 different duck species nesting in South Dakota. These results were part of a larger on-going project which is analyzing the possible effects of climate changes on the size of North American duck eggs (DeJong and Higgins 2011). Hundreds of waterfowl specimens and waterfowl eggs that were collected from South Dakota during the last 150 years are currently archived in museums throughout North America. The early collection efforts of various oologists plus the foresight of others to preserve the eggs in some of North America’s private and public museums have enabled us to conduct a type of time travel research on duck eggs that were collected and preserved as early as 1859. Egg size met-rics were taken from museum egg collections of duck eggs which were collected from 1877-1922 (N = 371) and from 3,886 eggs measured during recent (2009-2010) duck nesting studies in eastern South Dakota. All of the eggs collected or measured for this research originated in 14 eastern South Dakota counties, emphasizing the scarcity of duck egg collection and duck nesting research in western South Dakota. Egg volumes from five species of ducks in South Dakota indicated a statistically significant (P < 0.05) relationship to climate conditions (Palmer Drought Severity Indices). Duck egg volume of nine species varied be-tween years when collected and/or measured.
Keywords
ducks, eggs, climate, South Dakota, museum
INTRODUCTION
Climate is not a stable condition. It changes due to large scale factors such as the periodic changes of the earth’s orbit and also due to finer scale factors such as the amount of cloud cover blocking incoming sunlight. North America has experienced many changes in climate throughout history. During the last 150 years, several droughts have occurred across the United States. One of North America’s most memorable droughts, often referred to as The Dust Bowl, oc-
34 Proceedings of the South Dakota Academy of Science, Vol. 91 (2012)
curred throughout the Great Plains during the 1930s. However, climate data also show time periods with above normal precipitation events. During the last 50 years, high annual precipitation conditions were occurring in some North American regions (Gutowski et al. 2008), while other regions were experiencing drought conditions. North American duck species often migrate long distances during the spring on their way to northern breeding locations, and may pass through both wet and dry climate extremes. Climates across North America are predicted to become more extreme (Gutowski et al. 2008). How have ducks responded to extensive periods of drought or flooding encountered during mi-gration and nesting, and what may be their response to future climate change?
Numerous types of data have been or are being used to track climate change, including studies of tree-ring growth patterns (Fritts 1991), core samples from glacial ice (Alley 2000), and temperature and precipitation measurements across years and geographic locations (Jones and Mann 2004). Collateral studies of climate change effects have also been conducted on several kinds of animals, in-cluding polar bears (Derocher et al. 2004; Schliebe 2010), butterflies (Parmesan et al. 1999), and penguins (Barbraud and Weimerskirch 2001; Cunningham and Moors 1994). Researchers have found that the timing of seasonal activities of plants and animals have changed with climate changes (Brown et al. 1999; Menzel and Estrella 2001; Walther et al. 2002). Some birds are nesting earlier than in documented history (Brown et al. 1999; Crick and Sparks 1999), while others are laying eggs which are larger than in the past (Jarvinen 1994) due to warmer spring temperatures. Scientists predict future variation in the distribu-tion of vegetation due to climate changes (US Environmental Protection Agency 2011, U.S. Forest Service 2010). Additionally, climate change will have an effect on abiotic factors such as the presence and depth of lakes and ponds, and the intensity and frequency of weather events. These factors are extremely important when considering smaller, temporary wetlands like those found in the Prairie Pothole Region of South Dakota. However, except for some recent habitat ef-fects modeling (Burkett and Kusler 2007; Johnson et al. 2005), a comparison of duck abundance variability due to agriculture and precipitation (Bethke and Nudds 1995), and reproductive performance and body condition studies of marine birds (Sydeman et al. 2001), very little other information exists relative to direct or indirect effects of climate change on ducks or their eggs relative to the past 150 years.
Drought conditions cause prairie pothole wetlands to diminish in size or to dry out completely. This in turn reduces the habitat and food resources available for hens during the nesting season. Hens rely heavily on food resources to provide them with the extra energy needed to produce eggs. If there is less food avail-able, hens may lay fewer and possibly smaller eggs. Eldridge and Krapu (1988) found that mallard hens with enhanced nutrition produced larger eggs than hens that were fed a natural diet. Our research utilized duck egg measurements from museum collections eggs and recent field studies to determine if past climate changes, such as drought, have had any effect on the size of duck eggs during the last 150 years.
Hundreds of waterfowl specimens and waterfowl eggs from South Dakota are currently archived in museum collections throughout North America (Table 1;
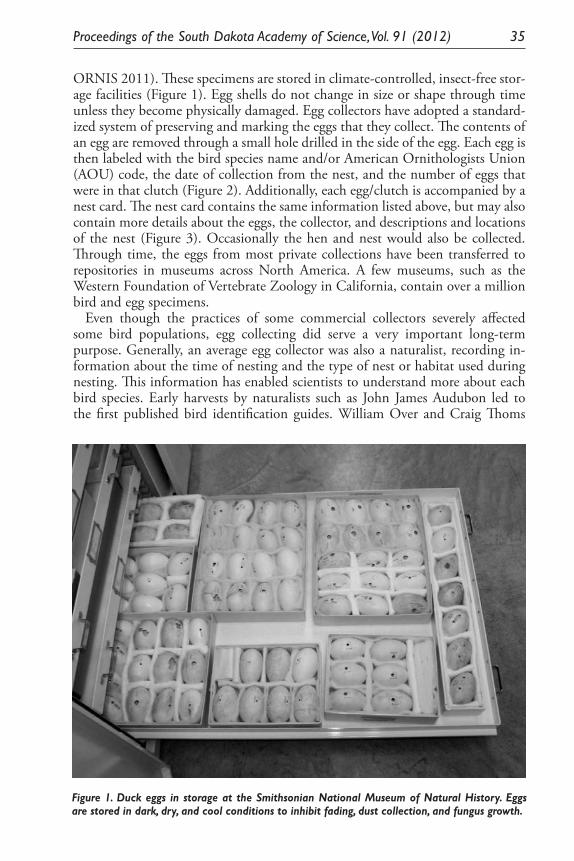
Proceedings of the South Dakota Academy of Science, Vol. 91 (2012) 35
ORNIS 2011). These specimens are stored in climate-controlled, insect-free stor-age facilities (Figure 1). Egg shells do not change in size or shape through time unless they become physically damaged. Egg collectors have adopted a standard-ized system of preserving and marking the eggs that they collect. The contents of an egg are removed through a small hole drilled in the side of the egg. Each egg is then labeled with the bird species name and/or American Ornithologists Union (AOU) code, the date of collection from the nest, and the number of eggs that were in that clutch (Figure 2). Additionally, each egg/clutch is accompanied by a nest card. The nest card contains the same information listed above, but may also contain more details about the eggs, the collector, and descriptions and locations of the nest (Figure 3). Occasionally the hen and nest would also be collected. Through time, the eggs from most private collections have been transferred to repositories in museums across North America. A few museums, such as the Western Foundation of Vertebrate Zoology in California, contain over a million bird and egg specimens.
Even though the practices of some commercial collectors severely affected some bird populations, egg collecting did serve a very important long-term purpose. Generally, an average egg collector was also a naturalist, recording in-formation about the time of nesting and the type of nest or habitat used during nesting. This information has enabled scientists to understand more about each bird species. Early harvests by naturalists such as John James Audubon led to the first published bird identification guides. William Over and Craig Thoms
Figure 1. Duck eggs in storage at the Smithsonian National Museum of Natural History. Eggs are stored in dark, dry, and cool conditions to inhibit fading, dust collection, and fungus growth.
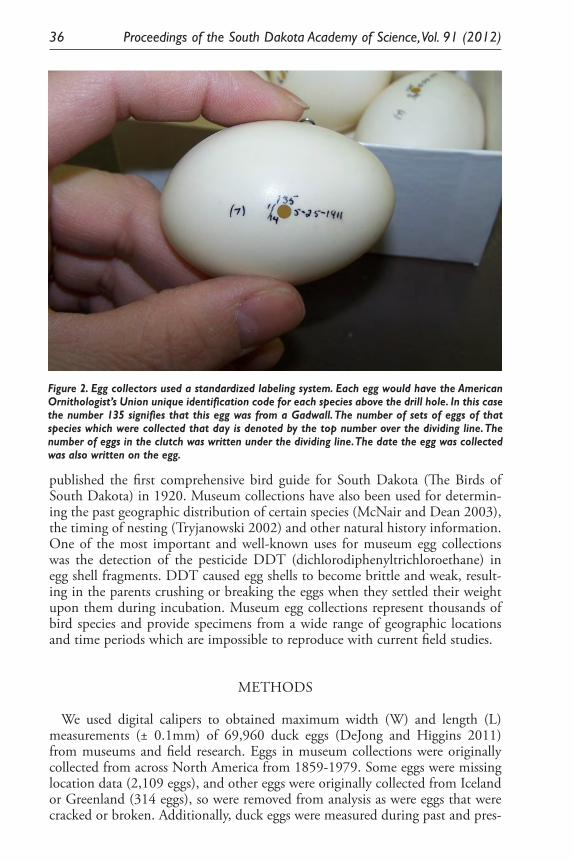
36 Proceedings of the South Dakota Academy of Science, Vol. 91 (2012)
published the first comprehensive bird guide for South Dakota (The Birds of South Dakota) in 1920. Museum collections have also been used for determin-ing the past geographic distribution of certain species (McNair and Dean 2003), the timing of nesting (Tryjanowski 2002) and other natural history information. One of the most important and well-known uses for museum egg collections was the detection of the pesticide DDT (dichlorodiphenyltrichloroethane) in egg shell fragments. DDT caused egg shells to become brittle and weak, result-ing in the parents crushing or breaking the eggs when they settled their weight upon them during incubation. Museum egg collections represent thousands of bird species and provide specimens from a wide range of geographic locations and time periods which are impossible to reproduce with current field studies.
METHODS
We used digital calipers to obtained maximum width (W) and length (L) measurements (± 0.1mm) of 69,960 duck eggs (DeJong and Higgins 2011) from museums and field research. Eggs in museum collections were originally collected from across North America from 1859-1979. Some eggs were missing location data (2,109 eggs), and other eggs were originally collected from Iceland or Greenland (314 eggs), so were removed from analysis as were eggs that were cracked or broken. Additionally, duck eggs were measured during past and pres-
15
Blue-winged Teal
-- -- -- 45.47 47.13 47.36 46.25
Redhead -- -- -- 57.73 59.22 59.35 57.90
Lesser scaup -- -- -- -- -- -- 45.41
Wood duck -- -- -- --- -- -- 36.34
Figure 1. Duck eggs in storage at the Smithsonian National Museum of Natural History. Eggs are stored in dark, dry, and cool conditions to inhibit fading, dust collection, and fungus growth.
15
Figure 2. Egg collectors used a standardized labeling system. Each egg would have the American Ornithologist’s Union unique identification code for each species above the drill hole. In this case the number 135 signifies that this egg was from a Gadwall. The number of sets of eggs of that species which were collected that day is denoted by the top number over the dividing line. The number of eggs in the clutch was written under the dividing line. The date the egg was collected was also written on the egg.
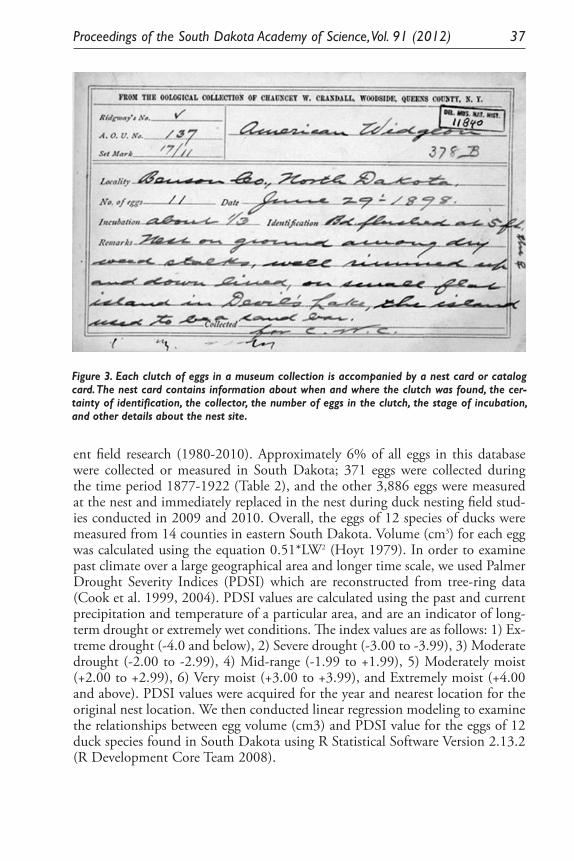
Proceedings of the South Dakota Academy of Science, Vol. 91 (2012) 37
ent field research (1980-2010). Approximately 6% of all eggs in this database were collected or measured in South Dakota; 371 eggs were collected during the time period 1877-1922 (Table 2), and the other 3,886 eggs were measured at the nest and immediately replaced in the nest during duck nesting field stud-ies conducted in 2009 and 2010. Overall, the eggs of 12 species of ducks were measured from 14 counties in eastern South Dakota. Volume (cm3) for each egg was calculated using the equation 0.51*LW2 (Hoyt 1979). In order to examine past climate over a large geographical area and longer time scale, we used Palmer Drought Severity Indices (PDSI) which are reconstructed from tree-ring data (Cook et al. 1999, 2004). PDSI values are calculated using the past and current precipitation and temperature of a particular area, and are an indicator of long-term drought or extremely wet conditions. The index values are as follows: 1) Ex-treme drought (-4.0 and below), 2) Severe drought (-3.00 to -3.99), 3) Moderate drought (-2.00 to -2.99), 4) Mid-range (-1.99 to +1.99), 5) Moderately moist (+2.00 to +2.99), 6) Very moist (+3.00 to +3.99), and Extremely moist (+4.00 and above). PDSI values were acquired for the year and nearest location for the original nest location. We then conducted linear regression modeling to examine the relationships between egg volume (cm3) and PDSI value for the eggs of 12 duck species found in South Dakota using R Statistical Software Version 2.13.2 (R Development Core Team 2008).
Figure 3. Each clutch of eggs in a museum collection is accompanied by a nest card or catalog card. The nest card contains information about when and where the clutch was found, the cer-tainty of identification, the collector, the number of eggs in the clutch, the stage of incubation, and other details about the nest site.
38 Proceedings of the South Dakota Academy of Science, Vol. 91 (2012)
RESULTS
Blue-winged teal (Anas discors), mallard (Anas platyrhynchos) and gadwall (Anas strepera) were the most commonly found duck eggs during field research in 2009 and 2010 in South Dakota. Eggs from certain species, such as ruddy duck (Oxyura jamaicensis), canvasback (Aythya valisineria) and green-winged teal (Anas crecca) were measured only from early museum collections (Table 2), while cer-tain others, such as the wood duck (Aix sponsa) and lesser scaup (Aythya affinis), were found only during field research in 2009 and 2010.
Eggs collected in South Dakota from blue-winged teal, mallard, gadwall, and canvasback (Table 3) were smaller than the previously published average size (Bellrose 1980; Baicich and Harrison1997). American wigeon (Anas americana) eggs were larger than previously published. Egg volumes from five species of ducks in South Dakota indicated a statistically significant (P < 0.05) relation-ship to climate conditions (Table 4). PDSI values were not significantly differ-ent between 2009 and 2010, but varied substantially in the years 1877-2010. Blue-winged teal and green-winged teal egg volumes were larger during periods of moderately moist conditions (+ 1.0 to + 3.49 PDSI), and were smaller dur-ing years that were either extremely drier or wetter (Table 5). Northern shoveler (Anas clypeata) eggs (N = 380) were larger during years with severe or extreme drought conditions than they were in years with moist conditions. Northern pintail (Anas acuta) egg volume was greater during mid-range conditions (- 1.24 to + 0.99 PDSI) than during extremely moist conditions (> +3.5 PDSI). Eggs of the American wigeon had the strongest response to PDSI variability (P < 0.05, R2 = 0.82), but unfortunately the number of specimens from this species was low (N = 20), and constituted only three clutches. The egg volume of nine species of ducks also varied significantly between years of collection or measurement (Table 4). Additional statistical analysis of the entire duck egg dataset is currently under-way, and will provide more information concerning the effects of past climates on duck egg sizes across North America.
DISCUSSION
Climate during the duck breeding season in South Dakota periodically alter-nates between drought and flooding and affects the occurrence and availabil-ity of wetlands. Eastern South Dakota experienced above normal precipitation during the summers of both 2009 and 2010, but is experiencing mid-range to moderate drought conditions in 2012. Our results indicate that ducks may be compensating physiologically for the fluctuation in nutritional and habitat re-sources during dynamic hydrological periods by modifying the size of their eggs. Larger eggs produce ducklings which are more capable of fending off starvation (Rhymer 1988), surviving cold temperatures, and feeding at a greater rate than ducklings from smaller eggs (Anderson and Alisauskas 2001). The lack of suit-able breeding and feeding habitats, as are predicted under future warmer climate change scenarios, could lead to a large-scale decline in overall duck recruitment and production, and hence a decline in duck populations (Johnson et al. 2005).
Proceedings of the South Dakota Academy of Science, Vol. 91 (2012) 39
Surprisingly, the response of “dabbling” feeders, those which rely on shallow wetlands during the breeding season, varied among species. There is likely an ideal climate under which each species is able to be the most productive. Small, temporary wetlands are the first to disappear during drought conditions, forcing ducks into larger wetlands for feeding. Certain species, such as the blue-winged teal, specifically target seasonal and temporary wetlands during the breeding season. Other species, such as mallards, are more adaptable in their wetland se-lection. Therefore, the loss of seasonal and temporary wetlands due to drainage and long-term drought conditions would likely have a larger effect on habitat-constrained species such as the blue-winged teal than on more adaptable species.
Other factors which may play a role in the annual variation in the size of eggs are the age of the hen, nutrition limitations or additional stressors during spring migration, and difficult wintering conditions, to name just a few. Variation in interspecific and intraspecific egg sizes has been documented in previous studies (Krapu 1979; Ankney 1980; Birkhead 1985; Rohwer 1986; Hepp et al. 1987); however, the factors which play a role in those variations are not known. Re-gional variation in egg size of individual species may also exist, due to changes in food resources and genetics. The eggs measured for certain species were often smaller in South Dakota than the average size previously published (Bellrose 1980; Baicich and Harrison 1997).
The greatest hurdles for this research project were the gaps in data both tem-porally and spatially. Long-term data (eggs and climate) in specific locations were not available. For example, our sample size of eggs from South Dakota was low - only 6% of the total eggs measured for this project. It is unfortunate that so few duck eggs were historically collected for preservation from South Dakota. As part of the Prairie Pothole Region, South Dakota contains some of the most pro-ductive habitats for duck populations in the United States. The remoteness and low human population of South Dakota are likely the prevailing factors limiting the number of eggs collected in this state. European settlement of South Dakota officially began in 1851, and was later augmented by the installation of the first railroad tracks in 1877 (Hufstetler and Bedeau 1998). In 1870, only 11,776 people resided in southern Dakota Territory (Hufstetler and Bedeau 1998), the majority of which lived in what is now eastern South Dakota. The railroad line was completed as far as Sioux City, Iowa in 1868, which could help account for the earliest eggs (blue-winged teal, mallard, redhead (Aythya americana), and northern shoveler) which were collected nearby in Clay and Lincoln Counties in 1877.
The earliest information about duck eggs acquired in South Dakota was likely not gathered by university-trained scientists, but instead by farmers, ranchers, hunters, doctors, and clergymen. These citizens had a genuine interest in the environment, and spent many hours trudging through prairies and wetlands or climbing trees to acquire eggs and bird specimens. Egg hunting was a very popu-lar hobby for the nation’s young men during the late 1800s through the early 1900s. Eggs, nests and birds that were collected either were kept in home display cabinets or were sold commercially. A large percentage of bird and egg collections occurred before binoculars were commonly available, so to get a good look at a bird and identify it, meant you had to shoot it first. Birds were often collected
40 Proceedings of the South Dakota Academy of Science, Vol. 91 (2012)
with a “naturalist shotgun” as they flew from the nest (Henderson 2007). As a hobby, egg collecting could be an arduous affair. The collector’s mode of travel was often limited to walking, riding horseback or the use of a horse drawn buggy. If they were lucky and could afford the luxury, collectors could take a train or riv-erboat on long journeys, and then hire a horse drawn buggy for the remainder of the expedition (Raine 1892). Some collectors hired native peoples to collect eggs for them (Raine 1892). Collection activity dropped off in the 1930s, presumably due to the economic depression and the Dust Bowl droughts.
Few eggs have been collected since the implementation of the Migratory Bird Treaty Act, enacted in 1918 with the goal of protecting migratory birds such as ducks and geese from the extreme overharvests which were occurring throughout North America. Collectors are now required to go through a permitting process with state and federal wildlife agencies before they can collect eggs. Technological advances such as automobiles, digital cameras, global positioning systems (GPS), binoculars, spotting scopes, and detailed guide books not only enable more people to enjoy birding, but they also enable identification of the bird without having to collect the birds or their eggs. Currently, few bird or egg specimens are purposely taken for collections. Most are acquired through accidental deaths due to collisions with vehicles or windows, natural deaths due to disease, or preda-tion by domestic pets. Researchers from The Western Foundation of Vertebrate Zoology are still collecting eggs, but at a much reduced number than in the past. Many museums are struggling to maintain funding for preserving and hous-ing the eggs that they already have (Suarez and Tsutsui 2004). Additional egg collections would require more storage space, labor and increased funding. On the other hand, the lack of further collecting of eggs will result in data gaps for future research. We believe that eggs should continue to be collected to provide future generations with a continuous data and reference source. Federal and State guidelines and permits are in place to limit the excessive or illegal overharvest of birds and eggs, not to totally limit the scientific collection and storage of future specimens. None of our research on climate change effects on duck egg size met-rics or the earlier efforts on the effects of DDT on egg shell thinning could have been possible without eggs because the samples and metrics needed for these projects could not have been obtained from photo images alone. Considerable effort is still being focused on waterfowl nesting studies in South Dakota as well as in other states and Canadian Provinces. With the advent of new technology, a well-planned coordinated effort by various public and private agencies and educational institutions could assure and sustain a continuous waterfowl egg database that would be available for many types of future research efforts.
We hope our duck egg research stimulates thought about other possible uses of egg collections and of other kinds of specimen collections in museums around the world. By making use of these collections, we pay tribute to those early naturalists for their hard work, perseverance and love of nature. The early collec-tion efforts of various oologists plus the foresight of others to preserve the eggs in some of North America’s private and public museums enabled us to conduct a type of time travel research on duck eggs that were collected and preserved as early as 1859.
Proceedings of the South Dakota Academy of Science, Vol. 91 (2012) 41
ACKNOWLEDGEMENTS
We would like to acknowledge the assistance of fellow researchers from the South Dakota Department of Game, Fish and Parks (SDGF&P), the University of Minnesota, South Dakota State University (SDSU), and the U.S. Fish and Wildlife Service (FWS) Madison Wetland Management District who generously measured eggs for us in South Dakota during their own duck nesting research activities. We would also like to thank the following museums for their hospital-ity and access to historic South Dakota duck egg collections: The Western Foun-dation of Vertebrate Zoology, The American Museum of Natural History, The Field Museum, The Bell Natural History Museum, The Smithsonian National Museum of Natural History, and the Michigan State University Natural History Museum. Dr. Robert W. Klaver and Dr. Kent C. Jensen provided earlier review of this manuscript. Financial and/or administrative and equipment support were provided by the Natural Resources Management Department at SDSU, the FWS Region 3 Office in Minneapolis, Minnesota; by Dr . Rex Johnson, HAPET Office, Fergus Falls, Minnesota, and by the S.D. Cooperative Fish and Wildlife Research Unit at SDSU with SDSU, the FWS, the SDGF&P, and the Wildlife Management Institute cooperating. We thank all involved for helping make this project possible.
LITERATURE CITED
Alley, R.B. 2000. Ice-core evidence of abrupt climate changes. Proceedings of the National Academy of Sciences of the United States of America 97(4): 1331-1334.
Anderson, V.R., and R.T. Alisauskas. 2001. Egg size, body size, locomotion, and feeding performance in captive King eider ducklings. The Condor 103:195-199.
Ankney, C.D. 1980. Egg weight, survival, and growth of Lesser Snow Goose goslings. Journal of Wildlife Management 44:174-182.
Baicich, P.J., and C.J.O. Harrison. 1997. Nests, eggs, and nestlings of North American Birds: Second Edition. Princeton University Press, Princeton, NJ. 347 pp.
Barbraud, C., and H. Weimerskirch. 2001. Emperor penguins and climate change. Nature 411:183-186.
Bellrose, F. C. 1980. Ducks, geese & swans of North America. Stackpole Books, Harrisburg PA. 540pp.
Bethke, R.W., and T.D. Nudds. 1995. Effects of Climate Change and Land Use on Duck Abundance in Canadian Prairie-Parklands. Ecological Applications 5(3):588-600.
Birkhead, M. 1985. Variation in egg quality and composition in the Mallard Anas platyrhynchos. Ibis 127:467-475.
42 Proceedings of the South Dakota Academy of Science, Vol. 91 (2012)
Brown, J.L., S. –H Li, and N. Bhagabati. 1999. Long-term trend toward earlier breeding in an American bird: A response to global warming? Proc. Natl. Acad. Sci. 96:5565-5569.
Burkett, V., and J. Kusler. 2007. Climate change: potential impacts and interac-tions in wetlands of the United States. Journal of American Water Resources Association 36(2):313-320.
Cook, E.R., D.M. Meko, D.W. Stahle, and M.K. Cleaveland. 1999. Drought reconstructions for the continental United States. Journal of Climate 12:1145-1162.
Cook, E.R., Woodhouse, C.A., Eakin, C.M., Meko, D.M., and Stahle, D.W. 2004. “Long-Term Aridity Changes in the Western United States”. Science 306(5698):1015-1018.
Crick, H.Q., and T.H. Sparks. 1999. Climate change related to egg-laying trends. Nature 399:423-424.
Cunningham, D.M., and P.J. Moors. 1994. The decline of rockhopper penguins Eudyptes chrysocome at Campbell Island, Southern Ocean and the influ-ence of rising sea temperatures. Emu 94:27-36.
DeJong, J.R., and K.F. Higgins. 2011. An Evaluation Of Climate Change Effects During The Last 150 Years On The Size Of North American Duck Eggs. Proceedings of the South Dakota Academy of Science 90:33.
Derocher, A.E., N.J. Lunn, and E. Stirling. 2004. Polar Bears in a Warming Climate. Integrative and Comparative Biology 44(2):163-176.
Eldridge, J.L., and G.L. Krapu. 1988. The Influence of Diet Quality on Clutch Size and Laying Pattern in Mallards. The Auk 105:102-110.
Fritts, H.C. 1991. Reconstructing large-scale climatic patterns from tree-ring data. The University of Arizona Press, Tucson, AZ. 340pp.
Gutowski, W.J., G.C. Hegerl, G.J. Holland, R.J. Stouffer, P.J. Webster, M.F. Wehner, F.W. Zwiers, H.E. Brooks, K.A. Emanuel, P.D. Komar, J.P. Kossin, K.E. Kunkel, R. McDonald, G.A. Meehl, and R.J. Trapp. 2008. Causes of Observed Changes in Extremes and Projections of Future Changes. Chapter 3 in Weather and Climate Extremes in a Changing Climate. Regions of Fo-cus North America: Hawaii, Caribbean. Synthesis and Assessment Product 3.3. Report by the U.S. Climate Change Science Program and the Subcom-mittee on Global Change Research. Karl, T. R., G.A. Meehl, C.D. Miller, S.J. Hassol, A.M. Waple, and W. L. Murray eds. Washington, DC. 180pp.
Henderson, C.L. 2007. Oology & Ralph’s Talking Eggs: Bird Conservation Comes Out of Its Shell. University of Texas Press, Austin, TX. 177pp.
Hepp, G.R., D.J. Stangohr, L.A. Baker, and R.A. Kennamer. 1987. Factors af-fecting variation in the egg and duckling components of Wood Ducks. Auk 104:435-443.
Hoyt, D.F. 1979. Practical Methods of Estimating Volume and Fresh Weight of Bird Eggs. The Auk 96:73-77.
Hufstetler, M., and M. Bedeau. 1998. South Dakota’s Railroads: An Historic Context. South Dakota State Historic Preservation Office. Pierre, SD. 134pp.
Jarvinen, A. 1994. Global warming and egg size of birds. Ecography 17:108-110.
Proceedings of the South Dakota Academy of Science, Vol. 91 (2012) 43
Johnson, W. C., B.V. Millett, T. Gilmanov, R.A. Voldseth, G.R. Guntenspergen, and D.E. Naugle. 2005. Vulnerability of Northern Prairie Wetlands to Cli-mate Change. BioScience 55(10): 863-872.
Jones, P., and M.E. Mann. 2004. Climate over past millennia. Reviews of Geo-physics 42 (RG2002):1-42.
Krapu, G.L. 1979. Nutrition of female dabbling ducks during reproduction. Pp. 59-70 in Waterfowl and Wetlands – An Integrated Review. T. A. Bookhout, Ed. Proc. Symp, North Central Section, The Wildl. Soc., Madison, WI.
McNair, D.B., and J.P. Dean. 2003. Distributional information on birds from egg sets collected by Henry Rogers Durkee in 1870 in southwestern Wyo-ming. Western North American Naturalist 63(3):320-332.
Menzel, A., and N. Estrella. 2001. Pp. 123-137 in “Fingerprints” of Climate Change-Adapted Behaviour and Shifting Species Ranges. Kluwer Academic, New York. Eds Walther, G. -R., Burga, C. A. and P. J. Edwards).
Ornithological Networked Information System (ORNIS). 2011. ORNIS Data Portal. Available at http://www.ornisnet.org [Cited July 2012].
Over, W.H., and C.S. Thoms. 1920. The Birds of South Dakota. The University of South Dakota, Vermillion. South Dakota Geological and Natural History Survey: Series XXI:Bulletin 9. 184pp.
Parmesan, C., N. Ryrholm, C. Stefanescu, J.K. Hill, C.D. Thomas, H. Des-cimon, B. Huntley, L. Kaila, J. Kullberg, T. Tammaru, W.J. Tennent, J.A. Thomas, and M. Warren. 1999. Poleward shifts in geographical ranges of butterfly species associated with regional warming. Nature 399: 579-583.
R Development Core Team. 2008. R: A language and environment for statistical computing. R Foundation for Statistical Computing, Vienna, Austria. ISBN 3-900051-07-0, Available at http://www.R-project.org [Cited July 2012].
Raine, W. 1892. Bird-nesting in North-west Canada. Toronto: Hunter, Rose. Rhymer, J.M. 1988. The effect of egg size variability on thermo-regulation of
Mallard (Anas platyrhynchos) offspring and its implications for survival. Oecologia 75:20-24.
Rohwer, F.C. 1986. Composition of Blue-winged Teal eggs in relation to egg size, clutch size, and timing of laying. Condor 88:513-519.
Schliebe, S. 2010. What has been happening to polar bears in recent decades? National Oceanic and Atmospheric Administration. Available at http://www.arctic.noaa.gov/essay_schliebe.html [Cited July 2012].
Suarez, A.V., and N.D. Tsutsui. 2004. The Value of Museum Collections for Research and Society. Bioscience 54:66-74.
Sydeman, W.J., M.M. Hester, J.A. Thayer, F. Gress, P. Martin, and J. Buffa. 2001. Climate change, reproductive performance and diet composition of marine birds in the southern California Current system, 1969-1997. Prog-ress in Oceanography 49:309-329.
Tryjanowski, P. 2002. A long-term comparison of laying date and clutch size in the Red-backed Shrike (Lanius collurio) in Silesia, Southern Poland. Acta Zoologica Academiae Scientiarum Hungaricae 48(2): 101-106.
U. S. Forest Service. 2010. Climate change may impact maple syrup production. USDA Forest Service News Release No. 1022. Washington, D. C.
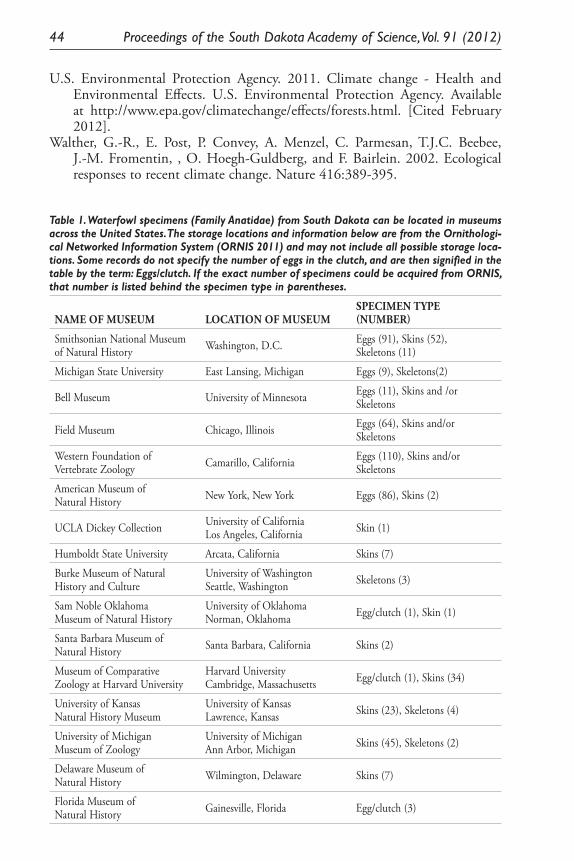
44 Proceedings of the South Dakota Academy of Science, Vol. 91 (2012)
U.S. Environmental Protection Agency. 2011. Climate change - Health and Environmental Effects. U.S. Environmental Protection Agency. Available at http://www.epa.gov/climatechange/effects/forests.html. [Cited February 2012].
Walther, G.-R., E. Post, P. Convey, A. Menzel, C. Parmesan, T.J.C. Beebee, J.-M. Fromentin, , O. Hoegh-Guldberg, and F. Bairlein. 2002. Ecological responses to recent climate change. Nature 416:389-395.
Table 1. Waterfowl specimens (Family Anatidae) from South Dakota can be located in museums across the United States. The storage locations and information below are from the Ornithologi-cal Networked Information System (ORNIS 2011) and may not include all possible storage loca-tions. Some records do not specify the number of eggs in the clutch, and are then signified in the table by the term: Eggs/clutch. If the exact number of specimens could be acquired from ORNIS, that number is listed behind the specimen type in parentheses.
NAME OF MUSEUM LOCATION OF MUSEUMSPECIMEN TYPE(NUMBER)
Smithsonian National Museum of Natural History Washington, D.C. Eggs (91), Skins (52),
Skeletons (11)
Michigan State University East Lansing, Michigan Eggs (9), Skeletons(2)
Bell Museum University of Minnesota Eggs (11), Skins and /or Skeletons
Field Museum Chicago, Illinois Eggs (64), Skins and/orSkeletons
Western Foundation ofVertebrate Zoology Camarillo, California Eggs (110), Skins and/or
Skeletons
American Museum of Natural History New York, New York Eggs (86), Skins (2)
UCLA Dickey Collection University of CaliforniaLos Angeles, California Skin (1)
Humboldt State University Arcata, California Skins (7)
Burke Museum of NaturalHistory and Culture
University of WashingtonSeattle, Washington Skeletons (3)
Sam Noble OklahomaMuseum of Natural History
University of OklahomaNorman, Oklahoma Egg/clutch (1), Skin (1)
Santa Barbara Museum ofNatural History Santa Barbara, California Skins (2)
Museum of ComparativeZoology at Harvard University
Harvard UniversityCambridge, Massachusetts Egg/clutch (1), Skins (34)
University of KansasNatural History Museum
University of KansasLawrence, Kansas Skins (23), Skeletons (4)
University of MichiganMuseum of Zoology
University of MichiganAnn Arbor, Michigan Skins (45), Skeletons (2)
Delaware Museum ofNatural History Wilmington, Delaware Skins (7)
Florida Museum of Natural History Gainesville, Florida Egg/clutch (3)
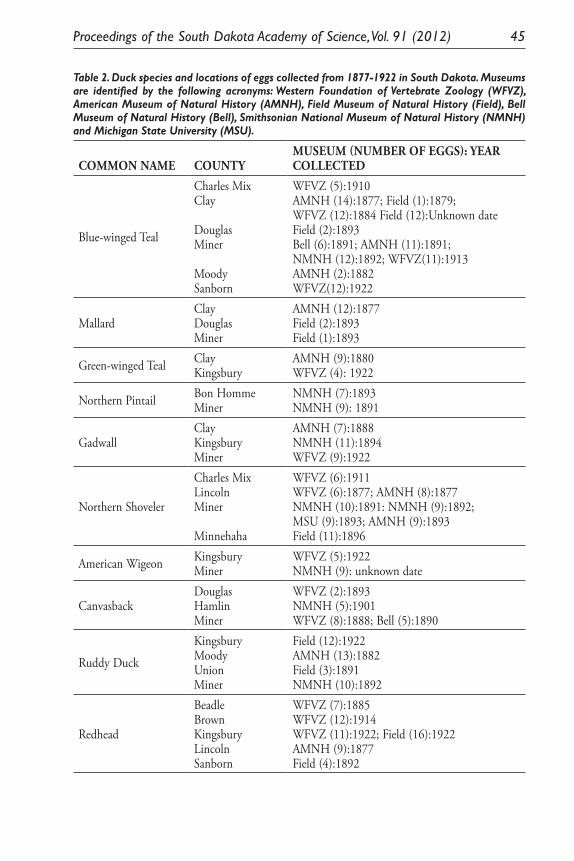
Proceedings of the South Dakota Academy of Science, Vol. 91 (2012) 45
Table 2. Duck species and locations of eggs collected from 1877-1922 in South Dakota. Museums are identified by the following acronyms: Western Foundation of Vertebrate Zoology (WFVZ), American Museum of Natural History (AMNH), Field Museum of Natural History (Field), Bell Museum of Natural History (Bell), Smithsonian National Museum of Natural History (NMNH) and Michigan State University (MSU).
COMMON NAME COUNTY MUSEUM (NUMBER OF EGGS): YEAR COLLECTED
Blue-winged Teal
Charles MixClay
DouglasMiner
MoodySanborn
WFVZ (5):1910AMNH (14):1877; Field (1):1879;WFVZ (12):1884 Field (12):Unknown dateField (2):1893Bell (6):1891; AMNH (11):1891;NMNH (12):1892; WFVZ(11):1913AMNH (2):1882WFVZ(12):1922
MallardClayDouglasMiner
AMNH (12):1877Field (2):1893Field (1):1893
Green-winged Teal ClayKingsbury
AMNH (9):1880WFVZ (4): 1922
Northern Pintail Bon Homme Miner
NMNH (7):1893NMNH (9): 1891
GadwallClayKingsburyMiner
AMNH (7):1888NMNH (11):1894WFVZ (9):1922
Northern Shoveler
Charles MixLincolnMiner
Minnehaha
WFVZ (6):1911WFVZ (6):1877; AMNH (8):1877NMNH (10):1891: NMNH (9):1892;MSU (9):1893; AMNH (9):1893Field (11):1896
American Wigeon KingsburyMiner
WFVZ (5):1922NMNH (9): unknown date
CanvasbackDouglasHamlinMiner
WFVZ (2):1893NMNH (5):1901WFVZ (8):1888; Bell (5):1890
Ruddy Duck
KingsburyMoodyUnionMiner
Field (12):1922AMNH (13):1882Field (3):1891NMNH (10):1892
Redhead
BeadleBrownKingsburyLincolnSanborn
WFVZ (7):1885WFVZ (12):1914WFVZ (11):1922; Field (16):1922AMNH (9):1877Field (4):1892
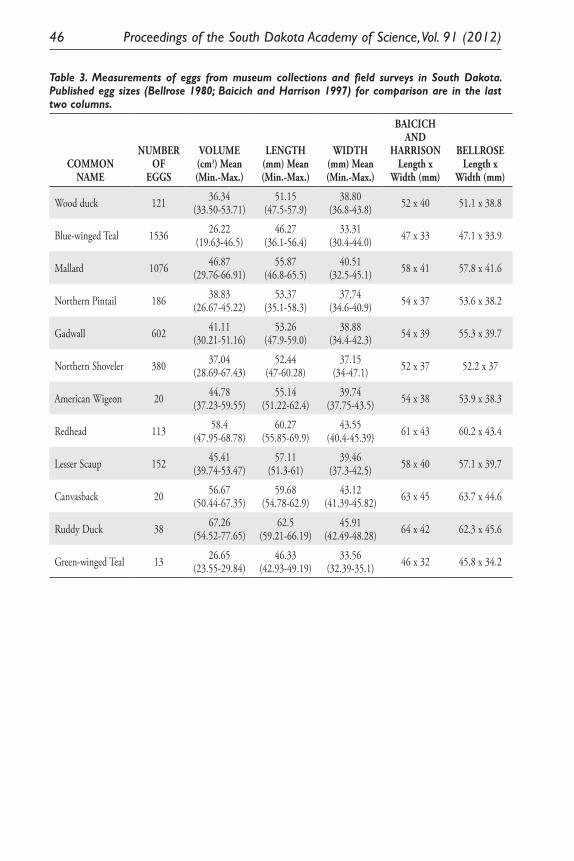
46 Proceedings of the South Dakota Academy of Science, Vol. 91 (2012)
Table 3. Measurements of eggs from museum collections and field surveys in South Dakota. Published egg sizes (Bellrose 1980; Baicich and Harrison 1997) for comparison are in the last two columns.
COMMON NAME
NUMBEROF
EGGS
VOLUME (cm3) Mean(Min.-Max.)
LENGTH (mm) Mean(Min.-Max.)
WIDTH (mm) Mean(Min.-Max.)
BAICICH AND
HARRISON Length x
Width (mm)
BELLROSE Length x
Width (mm)
Wood duck 121 36.34(33.50-53.71)
51.15(47.5-57.9)
38.80(36.8-43.8) 52 x 40 51.1 x 38.8
Blue-winged Teal 1536 26.22(19.63-46.5)
46.27(36.1-56.4)
33.31(30.4-44.0) 47 x 33 47.1 x 33.9
Mallard 1076 46.87(29.76-66.91)
55.87(46.8-65.5)
40.51(32.5-45.1) 58 x 41 57.8 x 41.6
Northern Pintail 186 38.83(26.67-45.22)
53.37(35.1-58.3)
37.74(34.6-40.9) 54 x 37 53.6 x 38.2
Gadwall 602 41.11(30.21-51.16)
53.26(47.9-59.0)
38.88(34.4-42.3) 54 x 39 55.3 x 39.7
Northern Shoveler 380 37.04(28.69-67.43)
52.44(47-60.28)
37.15(34-47.1) 52 x 37 52.2 x 37
American Wigeon 20 44.78(37.23-59.55)
55.14(51.22-62.4)
39.74(37.75-43.5) 54 x 38 53.9 x 38.3
Redhead 113 58.4(47.95-68.78)
60.27(55.85-69.9)
43.55(40.4-45.39) 61 x 43 60.2 x 43.4
Lesser Scaup 152 45.41(39.74-53.47)
57.11(51.3-61)
39.46(37.3-42.5) 58 x 40 57.1 x 39.7
Canvasback 20 56.67(50.44-67.35)
59.68(54.78-62.9)
43.12(41.39-45.82) 63 x 45 63.7 x 44.6
Ruddy Duck 38 67.26(54.52-77.65)
62.5(59.21-66.19)
45.91(42.49-48.28) 64 x 42 62.3 x 45.6
Green-winged Teal 13 26.65(23.55-29.84)
46.33(42.93-49.19)
33.56(32.39-35.1) 46 x 32 45.8 x 34.2
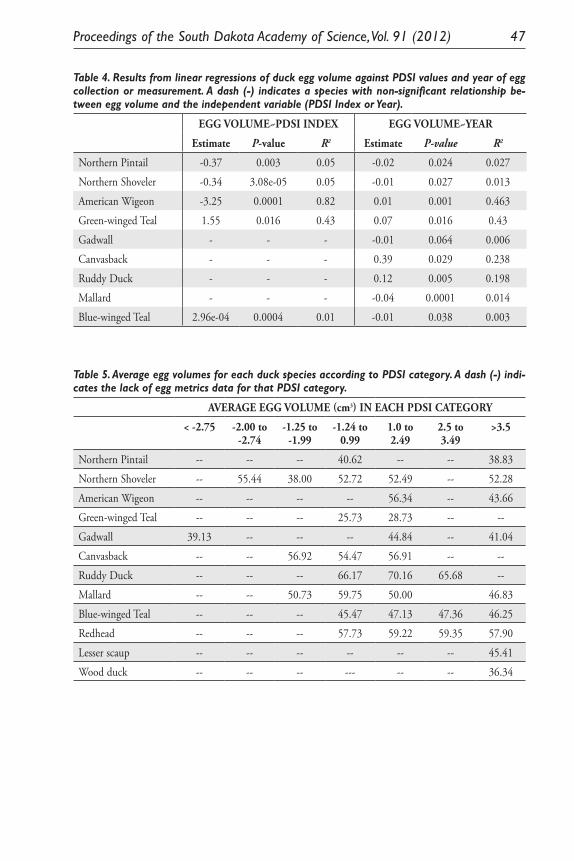
Proceedings of the South Dakota Academy of Science, Vol. 91 (2012) 47
Table 4. Results from linear regressions of duck egg volume against PDSI values and year of egg collection or measurement. A dash (-) indicates a species with non-significant relationship be-tween egg volume and the independent variable (PDSI Index or Year).
EGG VOLUME~PDSI INDEX EGG VOLUME~YEAR
Estimate P-value R2 Estimate P-value R2
Northern Pintail -0.37 0.003 0.05 -0.02 0.024 0.027
Northern Shoveler -0.34 3.08e-05 0.05 -0.01 0.027 0.013
American Wigeon -3.25 0.0001 0.82 0.01 0.001 0.463
Green-winged Teal 1.55 0.016 0.43 0.07 0.016 0.43
Gadwall - - - -0.01 0.064 0.006
Canvasback - - - 0.39 0.029 0.238
Ruddy Duck - - - 0.12 0.005 0.198
Mallard - - - -0.04 0.0001 0.014
Blue-winged Teal 2.96e-04 0.0004 0.01 -0.01 0.038 0.003
Table 5. Average egg volumes for each duck species according to PDSI category. A dash (-) indi-cates the lack of egg metrics data for that PDSI category.
AVERAGE EGG VOLUME (cm3) IN EACH PDSI CATEGORY
< -2.75 -2.00 to -2.74
-1.25 to -1.99
-1.24 to 0.99
1.0 to 2.49
2.5 to 3.49
>3.5
Northern Pintail -- -- -- 40.62 -- -- 38.83
Northern Shoveler -- 55.44 38.00 52.72 52.49 -- 52.28
American Wigeon -- -- -- -- 56.34 -- 43.66
Green-winged Teal -- -- -- 25.73 28.73 -- --
Gadwall 39.13 -- -- -- 44.84 -- 41.04
Canvasback -- -- 56.92 54.47 56.91 -- --
Ruddy Duck -- -- -- 66.17 70.16 65.68 --
Mallard -- -- 50.73 59.75 50.00 46.83
Blue-winged Teal -- -- -- 45.47 47.13 47.36 46.25
Redhead -- -- -- 57.73 59.22 59.35 57.90
Lesser scaup -- -- -- -- -- -- 45.41
Wood duck -- -- -- --- -- -- 36.34

Proceedings of the South Dakota Academy of Science, Vol. 91 (2012) 49
RESULTS OF PALEOFLOOD INVESTIGATIONS FOR SPRING, RAPID, BOXELDER, AND ELK CREEKS,
BLACK HILLS, WESTERN SOUTH DAKOTA
Daniel G. Driscoll1*, Jim E. O’Connor2, and Tessa M. Harden3
1U.S. Geological Survey1608 Mt. View Road, Rapid City, SD 57702
2U.S. Geological Survey2130 SW Fifth Avenue, Portland, OR 97201
3Bureau of ReclamationDenver Federal Center, Building 67, Denver, CO 80225
*Corresponding author email: [email protected]
ABSTRACT
Flood-frequency analyses for the Black Hills area are especially important be-cause of severe flooding of June 9–10, 1972, that was caused by a large mesoscale convective system and resulted in at least 238 deaths. This paper summarizes results of paleoflood investigations for six study reaches in the central Black Hills. Stratigraphic records and resulting long-term flood chronologies, locally extend-ing more than 2,000 years, were combined with observed and historical flood information to derive flood-frequency estimates. Results indicate that floods as large as and even substantially larger than 1972 have affected most of the study reaches. Results of the paleoflood investigations provide better physically based information on low-probability floods than has been previously available, sub-stantially improving estimates of the magnitude and frequency of large floods in the central Black Hills and reducing associated uncertainties. Collectively, the results provide insights regarding regional flood-generation processes and their spatial controls, enable approaches for extrapolation of results for hazard assess-ment beyond specific study reaches, and provide a millennial-scale perspective on the 1972 flooding.
Keywords
Paleoflood, slack-water deposits, stratigraphic records, flood-frequency analyses
INTRODUCTION
Flood-frequency analyses for the Black Hills of western South Dakota are especially important and technically challenging (Sando et al. 2008) because of severe flooding of June 9–10, 1972, along the eastern flanks of the Black Hills (Schwarz et al. 1975). Flooding was caused by a large mesoscale convective sys-tem and resulted in at least 238 deaths (Carter et al. 2002). Many 1972 peak
50 Proceedings of the South Dakota Academy of Science, Vol. 91 (2012)
flows are high outliers (by factors of 10 or more) in records that date back to the early 1900s for some streamgages.
In appropriate environments, an efficient means of reducing uncertainties re-garding probabilities of flood recurrence is to augment observed records by using paleohydrologic techniques (Stedinger and Baker 1987)—typically using strati-graphic and paleobotanical evidence to determine ages and magnitudes of previ-ous large floods predating observed records (paleofloods). This paper provides a condensation of a much lengthier report by Harden et al. (2011) on paleoflood investigations for the Black Hills area that included analyses of stratigraphic evidence, timing, and magnitudes for large floods on Spring Creek, Rapid Creek (two reaches), Boxelder Creek (two subreaches), and Elk Creek. Driscoll et al. (2011) also provided additional information regarding implementation of this study, for which the primary objective was to improve flood-frequency charac-terization of especially large (low-probability) floods for the six study reaches through paleoflood investigations. Agencies cooperating with the U.S. Geologi-cal Survey included the South Dakota Department of Transportation, Federal Emergency Management Agency, city of Rapid City, and West Dakota Water Development District. An abbreviated overview of results of paleoflood investi-gations for the Black Hills area was provided by Driscoll et al. (2012).
STUDY AREA AND METHODS
The study area (Figure 1) included the Spring Creek, Rapid Creek (two reach-es), Boxelder Creek (two subreaches), and Elk Creek drainage basins within the central Black Hills. Long-term frequency analyses were developed from paleo-flood investigations within the six study reaches and were based on multiple sites of stratigraphic analysis within each reach in conjunction with geochronology and hydraulic modeling.
The primary evidence for past large floods consists of stratigraphic records formed of fine-grained sediment deposits preserved in slack-water environments. These deposits accumulate and can record multiple floods where (1) velocities are relatively low, which can allow deposition of suspended sediment and (2) con-ditions are suitable for preservation. Numerous locations in canyons along the eastern flanks of the Black Hills provide excellent environments for (1) deposi-tion and preservation of stratigraphic sequences of late-Holocene flood deposits, primarily in overhanging ledges, alcoves, and small caves flanking the streams, and (2) hydraulic analyses for determination of associated flow magnitudes.
The formation and identification of slack-water deposits is enhanced by igne-ous and metamorphic rocks of Precambrian and Tertiary age within the head-waters of all study basins (Figure 1). These rocks weather to produce micaceous sand fine enough to be readily entrained during large floods, and thereby creating large suspended-sediment loads, but sufficiently coarse to settle rapidly in slack-water environments producing depositional sequences. Five of the study reaches (all except the reach upstream from Pactola Reservoir along Rapid Creek) are in Paleozoic sedimentary rocks (Ordovician- and Cambrian-age Deadwood Forma-tion through the Permian-age lower Spearfish Formation). Here the distinctly
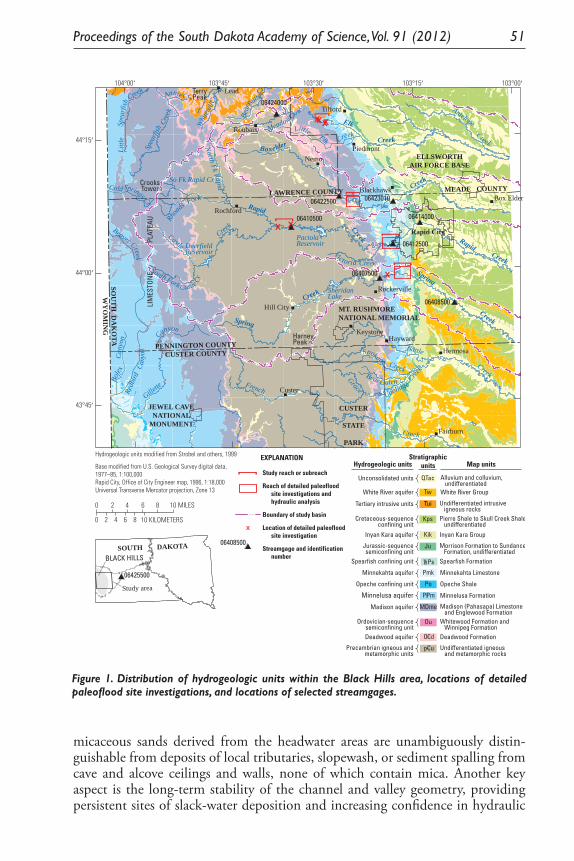
Proceedings of the South Dakota Academy of Science, Vol. 91 (2012) 51
micaceous sands derived from the headwater areas are unambiguously distin-guishable from deposits of local tributaries, slopewash, or sediment spalling from cave and alcove ceilings and walls, none of which contain mica. Another key aspect is the long-term stability of the channel and valley geometry, providing persistent sites of slack-water deposition and increasing confidence in hydraulic
Rapid City
Lead
Roubaix
Tilford
PiedmontNemo
Blackhawk
Rochford
Box Elder
Rockerville
KeystoneHayward
Hermosa
Hill City
Custer
Fairburn
MEADE COUNTYLAWRENCE COUNTY
Study area
BLACK HILLS
06425500
SOUTH DAKOTA
44°15′
43°45′
44°00′
104°00′ 103°45′ 103°30′ 103°15′ 103°00′
HarneyPeak
CUSTER
STATE
PARK
CrooksTower
TerryPeak
CreekCreek
Antelope
Creek
Creek
Creek
Creek
Creek
Battle
Spring
Spring
Creek
Rapid
Rapid
Castle
Creek
Bear
Elk
Spea
rfish
PactolaReservoirDeerfield
Reservoir
SheridanLake
Coolidge
Creek
Grace
French
Creek
NorthFk
Rapid
Rhoa
ds Fork
Castle
Cr
Littl
eSp
earfi
sh
South Fork
Whi
tetai
l
Cr
Cr
Annie
Meadow Cr
ElkLittle
CreekRe
dbird
Gillette
Boles
Can
yon
Cany
on
Canyon
ColdSprings Cr
Creek
Spokane
Victoria Creek
Bear Gulch
Creek
Creek
Cree
k
Cr
Boxelder
Butte
So Fk Rapid Cr
Beaver
QTac
Tw
Tui
Kps
Ju
MDme
Kik
Pmk
Po
Ou
EXPLANATION
Alluvium and colluvium, undifferentiated
Unconsolidated units
White River aquifer
Minnekahta aquifer
Minnelusa aquifer
Madison aquifer
Deadwood aquifer
Inyan Kara aquifer
Tertiary intrusive units
Spearfish confining unit
Opeche confining unit
Cretaceous-sequenceconfining unit
Jurassic-sequencesemiconfining unit
Ordovician-sequencesemiconfining unit
Precambrian igneous andmetamorphic units
White River Group
Undifferentiated intrusive igneous rocksPierre Shale to Skull Creek Shale, undifferentiatedInyan Kara Group
Morrison Formation to Sundance Formation, undifferentiatedSpearfish Formation
Minnekahta Limestone
Opeche Shale
Minnelusa Formation
Madison (Pahasapa) Limestone and Englewood FormationWhitewood Formation and Winnipeg FormationDeadwood Formation
Undifferentiated igneous and metamorphic rocks
Map unitsHydrogeologic unitsStratigraphic
units
X
Study reach or subreach
Reach of detailed paleoflood site investigations and hydraulic analysis
Boundary of study basin
Location of detailed paleofloodsite investigation
Streamgage and identification number
Base modified from U.S. Geological Survey digital data,1977–85, 1:100,000 Rapid City, Office of City Engineer map, 1996, 1:18,000 Universal Transverse Mercator projection, Zone 13
Hydrogeologic units modified from Strobel and others, 1999
06407500
06408500
06412500
06414000
06422500
06424000
06423010
06410500
0
0 2 4 6 8 10 KILOMETERS
10 MILES2 4 6 8
LIM
ESTO
NE
SOU
TH
DA
KO
TAW
YO
MIN
G
PENNINGTON COUNTYCUSTER COUNTY
JEWEL CAVENATIONAL
MONUMENT
MT. RUSHMORENATIONAL MEMORIAL
ELLSWORTHAIR FORCE BASE
Ps
OCd
pCu
PmP
06408500
PLAT
EAU
Figure 1. Distribution of hydrogeologic units within the Black Hills area, locations of detailed paleoflood site investigations, and locations of selected streamgages.
Figure 1. Distribution of hydrogeologic units within the Black Hills area, locations of detailed paleoflood site investigations, and locations of selected streamgages.
52 Proceedings of the South Dakota Academy of Science, Vol. 91 (2012)
computations of past floods from modern channel geometry. All study reaches are in narrow valleys laterally constrained by steep bedrock slopes where flood stages change markedly with flow, thus improving reliability of flow estimates derived from elevations of flood deposits. Additionally, bedrock formations are exposed locally in channel thalwegs for all study reaches, indicating that streams are flowing on relatively thin alluvial deposits with limited potential for channel scour. An estimated long-term regional erosion rate of 0.08 feet per thousand years (Harden et al. 2011) is consistent with the premise of overall channel stabil-ity for the last several thousand years.
The overall approach consisted of (1) interpreting individual chronologies of flood stages from stratigraphic analysis and age dating of slack-water deposits for multiple sites within a study reach; (2) estimating peak-flow magnitudes associat-ed with elevations of flood evidence; (3) interpreting an overall paleoflood chro-nology for each study reach; and (4) conducting quantitative flood-frequency analyses incorporating all relevant peak-flow information that included the pa-leoflood information, observed peak-flow records, and historical flood accounts.
Paleoflood chronologies were derived primarily from stratigraphic analysis and age dating of flood slack-water deposits, which are methods now widely used for quantifying unrecorded floods (Baker 1987; Kochel and Baker 1988). In many locations, searches for appropriate sites were guided by visible flood evidence from 1972, which commonly could be distinguished from older evidence based on knowledge of the 1972 flow rate, deposit flotsam (particularly beverage containers, milled wood, and plastic debris), and the degree of weathering of flood deposits or entrained organic material. Stratigraphy was exposed in small pits that typically were excavated through slack-water deposits to either bedrock or large and immovable rockfall. At some sites, several pits were excavated in search for the most complete record. Where possible, stratigraphic sequences were examined at multiple elevations at individual sites, as well as at multiple sites within reaches, in order to more precisely define the history of deposition at different stages.
The stratigraphy provided information on the number of floods and their rela-tive ages, with more recent flood deposits on top of, or inset against, older de-posits. Ages of individual flood deposits and the total length of record preserved in the stratigraphy were obtained by standard geochronologic techniques. The primary technique was radiocarbon analysis using carbon-14 (Stuiver and Polach 1977) of organic detritus, including charcoal, wood fragments, bark, pine cones and needles, and rodent fecal pellets that were deposited within and between individual flood deposits. Optically stimulated luminescence (Bradley 1999; Walker 2005) and cesium-137 analyses (Holmes 1998) were used occasionally for dating deposits less than about 300 years old, which cannot be precisely dated by radiocarbon analyses, and for dating deposits with insufficient organic material for radiocarbon dating. For the six study reaches, the stratigraphy and geochronology from analyzed sites were distilled into an interpreted chronology of the number, magnitude, and timing of large floods for each reach.
For computation of long-term flood-frequency analyses, the paleoflood chro-nologies derived from the stratigraphy and geochronology were combined with observed annual peak-flow records (U.S. Geological Survey 2010) for selected
Proceedings of the South Dakota Academy of Science, Vol. 91 (2012) 53
streamgages (Figure 1). These records were compiled and adjusted relative to drainage area to be directly comparable to the paleoflood chronologies deter-mined for each study reach and are referred to as gaged records within this paper. Historical flood accounts pre-dating gaged records also were incorporated in analyses for Rapid Creek and Elk Creek.
A key aspect of any paleoflood record is estimation of flow magnitudes for floods preserved in stratigraphic records. The elevation of a slack-water deposit represents a minimum value for the peak stage of the emplacing flood (Baker 1987; Kochel and Baker 1988). For purposes of hydraulic calculations, stage evidence is related to modern channel and valley geometry, which introduces an additional assumption that changes in geometry have been sufficiently small for the time represented by the stratigraphic record so as to not substantially affect calculations of flow rate. This assumption likely is satisfied in the rock-bound study reaches, where the common presence of bedrock in channels and along valley margins is indicative of overall stability, especially with respect to hydraulic controls on stages of large floods.
The primary method for estimating peak-flow magnitudes was application of the one-dimensional, steady-flow River Analysis System (HEC-RAS) model developed by the Hydrologic Engineering Center of the U.S. Army Corps of En-gineers (2008a, 2008b). Simulations using the HEC-RAS model, in conjunction with detailed topographic data, were used to estimate flows for the study reaches along Spring Creek, Boxelder Creek, and the “lower” reach of Rapid Creek, which is just west of Rapid City and downstream from Pactola Reservoir (Fig-ure1 1). The HEC-RAS model and the required reach-scale topographic datasets were not justified for Elk Creek and the “upper” reach of Rapid Creek (upstream from Pactola Reservoir), where paleoflood evidence was sparser than for other study reaches. Instead, flow estimates were derived by applying the Manning equation (Benson and Dalrymple 1967) or critical-flow equation (Grant 1997) for cross sections at sites of stratigraphic analysis.
Two analytical models with capabilities for incorporating paleoflood data in flood-frequency estimation were applied: (1) the FLDFRQ3 model (O’Connell 1999; O’Connell et al. 2002) and (2) the PeakfqSA model (Cohn et al. 1997, 2001; Griffis et al. 2004). For both models and all reaches, flood-frequency analyses were computed assuming log-Pearson Type III frequency distributions and were performed for two primary flood-record scenarios: (1) analysis of gaged records only; and (2) analysis of all available data, which may include the gaged records, historical flood accounts and associated “perception” thresholds, and paleofloods and thresholds. Analysis for scenario 1 (gaged records only) was conducted as a baseline analysis and provided a basis for comparison of incremental effects when including all available data. Analyses resulting from scenario 2, which include all available data and associated perception thresholds, were considered by Harden et al. (2011) as the best estimates of flood recurrence (flood-frequency estimates) for low-probability floods. Flood-frequency esti-mates were determined only for recurrence intervals of 25 years or larger (annual exceedance probabilities of 0.04 or smaller, which means a flow with a 4-per-cent chance of being exceeded in any given year). Results were not reported for smaller recurrence intervals because several study reaches are within “loss-zone
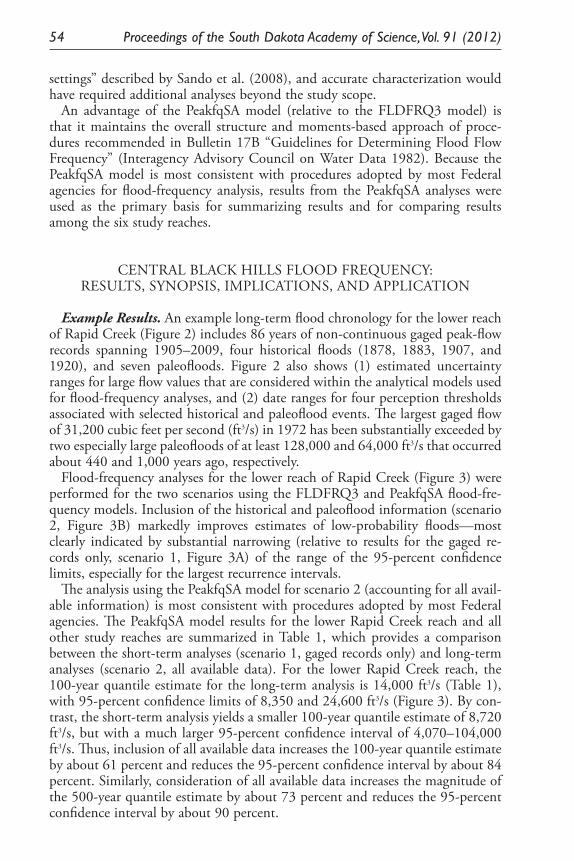
54 Proceedings of the South Dakota Academy of Science, Vol. 91 (2012)
settings” described by Sando et al. (2008), and accurate characterization would have required additional analyses beyond the study scope.
An advantage of the PeakfqSA model (relative to the FLDFRQ3 model) is that it maintains the overall structure and moments-based approach of proce-dures recommended in Bulletin 17B “Guidelines for Determining Flood Flow Frequency” (Interagency Advisory Council on Water Data 1982). Because the PeakfqSA model is most consistent with procedures adopted by most Federal agencies for flood-frequency analysis, results from the PeakfqSA analyses were used as the primary basis for summarizing results and for comparing results among the six study reaches.
CENTRAL BLACK HILLS FLOOD FREQUENCY: RESULTS, SYNOPSIS, IMPLICATIONS, AND APPLICATION
Example Results. An example long-term flood chronology for the lower reach of Rapid Creek (Figure 2) includes 86 years of non-continuous gaged peak-flow records spanning 1905–2009, four historical floods (1878, 1883, 1907, and 1920), and seven paleofloods. Figure 2 also shows (1) estimated uncertainty ranges for large flow values that are considered within the analytical models used for flood-frequency analyses, and (2) date ranges for four perception thresholds associated with selected historical and paleoflood events. The largest gaged flow of 31,200 cubic feet per second (ft3/s) in 1972 has been substantially exceeded by two especially large paleofloods of at least 128,000 and 64,000 ft3/s that occurred about 440 and 1,000 years ago, respectively.
Flood-frequency analyses for the lower reach of Rapid Creek (Figure 3) were performed for the two scenarios using the FLDFRQ3 and PeakfqSA flood-fre-quency models. Inclusion of the historical and paleoflood information (scenario 2, Figure 3B) markedly improves estimates of low-probability floods—most clearly indicated by substantial narrowing (relative to results for the gaged re-cords only, scenario 1, Figure 3A) of the range of the 95-percent confidence limits, especially for the largest recurrence intervals.
The analysis using the PeakfqSA model for scenario 2 (accounting for all avail-able information) is most consistent with procedures adopted by most Federal agencies. The PeakfqSA model results for the lower Rapid Creek reach and all other study reaches are summarized in Table 1, which provides a comparison between the short-term analyses (scenario 1, gaged records only) and long-term analyses (scenario 2, all available data). For the lower Rapid Creek reach, the 100-year quantile estimate for the long-term analysis is 14,000 ft3/s (Table 1), with 95-percent confidence limits of 8,350 and 24,600 ft3/s (Figure 3). By con-trast, the short-term analysis yields a smaller 100-year quantile estimate of 8,720 ft3/s, but with a much larger 95-percent confidence interval of 4,070–104,000 ft3/s. Thus, inclusion of all available data increases the 100-year quantile estimate by about 61 percent and reduces the 95-percent confidence interval by about 84 percent. Similarly, consideration of all available data increases the magnitude of the 500-year quantile estimate by about 73 percent and reduces the 95-percent confidence interval by about 90 percent.
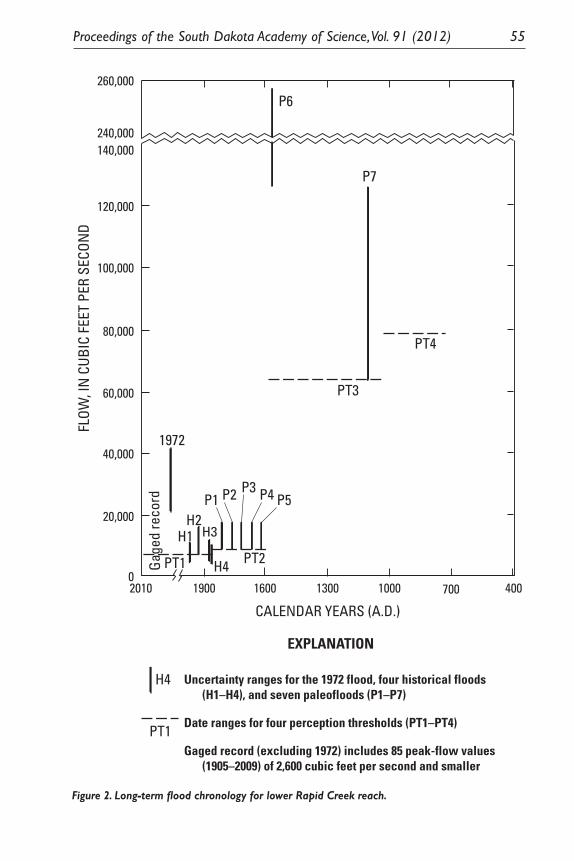
Proceedings of the South Dakota Academy of Science, Vol. 91 (2012) 55
P1 P2 P3 P4 P5
P6
P7
H1H2
H3
H41600 1300 1000 700 40019002010
CALENDAR YEARS (A.D.)
FLOW
, IN
CUB
IC F
EET
PER
SECO
ND
20,000
40,000
60,000
80,000
100,000
120,000
140,000
260,000
240,000
0
1972
PT2
PT3
PT4
H4
EXPLANATION
Uncertainty ranges for the 1972 flood, four historical floods (H1–H4), and seven paleofloods (P1–P7)
Date ranges for four perception thresholds (PT1–PT4)
Gaged record (excluding 1972) includes 85 peak-flow values (1905–2009) of 2,600 cubic feet per second and smaller
PT1
Gage
d re
cord
PT1
Figure 2. Long-term flood chronology for lower Rapid Creek reach.
Figure 2. Long-term flood chronology for lower Rapid Creek reach.
56 Proceedings of the South Dakota Academy of Science, Vol. 91 (2012)
RECURRENCE INTERVAL, IN YEARS (ANNUAL EXCEEDANCE PROBABILITY)
1,000(0.001)
200(0.005)
100(0.01)
20(0.05)
10(0.1)
5(0.2)
2(0.5)
1.01(0.99)
50(0.02)
500(0.002)
2,000(0.0005)
FLOW
, IN
CUB
IC F
EET
PER
SECO
ND
10
100
1,000
10,000
100,000
1,000,000
FLOW
, IN
CUB
IC F
EET
PER
SECO
ND
10
100
1,000
10,000
100,000
1,000,000
A
B
H1H2
H3H4
P1
P2
P3P4
P5
P6
P7
1972
1972
EXPLANATION
Large gaged value with uncertainty range
Historical value with uncertainty range
Paleoflood value with uncertainty range
Flood-frequency analyses using PeakfqSA model
95-percent confidence limits from PeakfqSA model
Estimated 95-percent confidence limits fromPeakfqSA model
Flood-frequency analyses using FLDFRQ3 model
95-percent confidence limits from FLDFRQ3 modelNote: All data plotted using Weibull (1939)
plotting positions
Gaged value
Figure 3. Flood-frequency analyses for lower Rapid Creek reach for A, gaged records only, and B, all available data that incorporate the long-term flood chronology from figure 2.
Figure 3. Flood-frequency analyses for lower Rapid Creek reach for A, gaged records only, and B, all available data that incorporate the long-term flood chronology from figure 2.
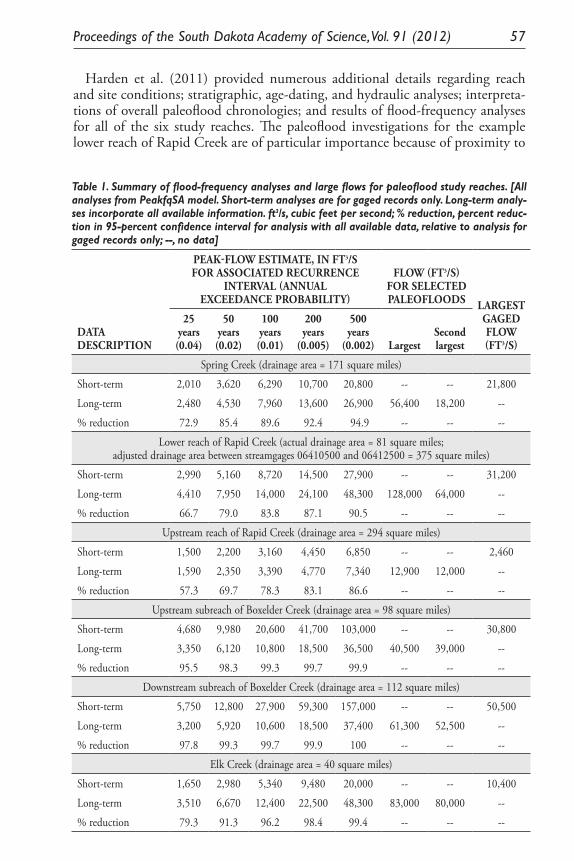
Proceedings of the South Dakota Academy of Science, Vol. 91 (2012) 57
Harden et al. (2011) provided numerous additional details regarding reach and site conditions; stratigraphic, age-dating, and hydraulic analyses; interpreta-tions of overall paleoflood chronologies; and results of flood-frequency analyses for all of the six study reaches. The paleoflood investigations for the example lower reach of Rapid Creek are of particular importance because of proximity to
Table 1. Summary of flood-frequency analyses and large flows for paleoflood study reaches. [All analyses from PeakfqSA model. Short-term analyses are for gaged records only. Long-term analy-ses incorporate all available information. ft3/s, cubic feet per second; % reduction, percent reduc-tion in 95-percent confidence interval for analysis with all available data, relative to analysis for gaged records only; --, no data]
DATADESCRIPTION
PEAK-FLOW ESTIMATE, IN FT3/S FOR ASSOCIATED RECURRENCE
INTERVAL (ANNUAL EXCEEDANCE PROBABILITY)
FLOW (FT3/S) FOR SELECTED PALEOFLOODS LARGEST
GAGED FLOW (FT3/S)
25 years(0.04)
50 years(0.02)
100 years(0.01)
200 years
(0.005)
500 years
(0.002) Largest Second largest
Spring Creek (drainage area = 171 square miles)
Short-term 2,010 3,620 6,290 10,700 20,800 -- -- 21,800
Long-term 2,480 4,530 7,960 13,600 26,900 56,400 18,200 --
% reduction 72.9 85.4 89.6 92.4 94.9 -- -- --
Lower reach of Rapid Creek (actual drainage area = 81 square miles;adjusted drainage area between streamgages 06410500 and 06412500 = 375 square miles)
Short-term 2,990 5,160 8,720 14,500 27,900 -- -- 31,200
Long-term 4,410 7,950 14,000 24,100 48,300 128,000 64,000 --
% reduction 66.7 79.0 83.8 87.1 90.5 -- -- --
Upstream reach of Rapid Creek (drainage area = 294 square miles)
Short-term 1,500 2,200 3,160 4,450 6,850 -- -- 2,460
Long-term 1,590 2,350 3,390 4,770 7,340 12,900 12,000 --
% reduction 57.3 69.7 78.3 83.1 86.6 -- -- --
Upstream subreach of Boxelder Creek (drainage area = 98 square miles)
Short-term 4,680 9,980 20,600 41,700 103,000 -- -- 30,800
Long-term 3,350 6,120 10,800 18,500 36,500 40,500 39,000 --
% reduction 95.5 98.3 99.3 99.7 99.9 -- -- --
Downstream subreach of Boxelder Creek (drainage area = 112 square miles)
Short-term 5,750 12,800 27,900 59,300 157,000 -- -- 50,500
Long-term 3,200 5,920 10,600 18,500 37,400 61,300 52,500 --
% reduction 97.8 99.3 99.7 99.9 100 -- -- --
Elk Creek (drainage area = 40 square miles)
Short-term 1,650 2,980 5,340 9,480 20,000 -- -- 10,400
Long-term 3,510 6,670 12,400 22,500 48,300 83,000 80,000 --
% reduction 79.3 91.3 96.2 98.4 99.4 -- -- --
58 Proceedings of the South Dakota Academy of Science, Vol. 91 (2012)
urban populations. However, the available paleoflood chronology for this reach pre-dates construction of Pactola Dam, which regulates most of the contributing drainage area for this reach (Figure 1). Thus, paleoflood investigations also were conducted in an upper reach of Rapid Creek (upstream from Pactola Reservoir). The paleoflood chronologies for lower and upper Rapid Creek are distinctively different, with an especially rich history of very large floods for lower Rapid Creek and a much sparser record with much smaller flows for upper Rapid Creek. The distinctive differences in chronologies and resulting flood-frequency analyses raise questions regarding (1) regional peak-flow characteristics relative to climate, geology, and physiography; and (2) the more pragmatic issue of how to apply results of flood-frequency analyses downstream from Pactola Dam. Some of the differences in chronologies may owe to less than optimum conditions along upper Rapid Creek for accumulation and preservation of slack-water sedi-ments (few alcoves and caves flank this reach), thereby resulting in incomplete records. More plausible, however, is that the physiography and climate of the upper part of Rapid Creek result in small peak flows, relative to downstream reaches, as further described within the remainder of this paper.
Synopsis and Regional Assessment. Results of the paleoflood investigations provide improved flood-frequency estimates for each of the six study reaches and facilitate comparisons among and within individual drainage basins. For simplification, only the flood-frequency analyses from the PeakfqSA model are considered herein. The overarching result of incorporating the paleoflood infor-mation is substantially narrowed confidence intervals, relative to those for the short-term flood-frequency analyses (Table 1). In all cases, 95-percent confidence intervals about the low-probability quantile estimates (100-, 200-, and 500-year recurrence-intervals) are reduced by at least 78 percent relative to similar analyses of the gaged records only. In some cases, 95-percent uncertainty limits have been reduced by 99 percent or more. This result is the logical outcome of including the much longer records of the large paleofloods provided by the stratigraphic records.
For all study reaches except the two Boxelder Creek subreaches, quantile estimates for the long-term flood-frequency analyses are larger than for the short-term analyses (Table 1), which results from incorporation of paleofloods substantially larger than the largest gaged flows. The largest differences are for lower Rapid Creek and Elk Creek. For lower Rapid Creek, the 100-year quantile estimate increased by 61 percent (from 8,720 to 14,000 ft3/s), and the 500-year quantile estimate increased by 73 percent (from 27,900 to 48,300 ft3/s). For Elk Creek, the 100- and 500-year quantile estimates increased by about 130 and 140 percent, respectively.
For both subreaches of Boxelder Creek, the long-term quantile estimates are substantially smaller than the short-term quantile estimates (Table 1) and largely reflect effects on the short-term analyses of the largest gaged flows (1972) and another relatively large flood in 1907 (Driscoll et al. 2010). The short-term quantile estimates for both subreaches are substantially larger than for the other study reaches. The long-term quantile estimates for the two subreaches are very similar and reflect paleoflood chronologies that were independently determined. Although the stratigraphic records cannot be precisely correlated between the
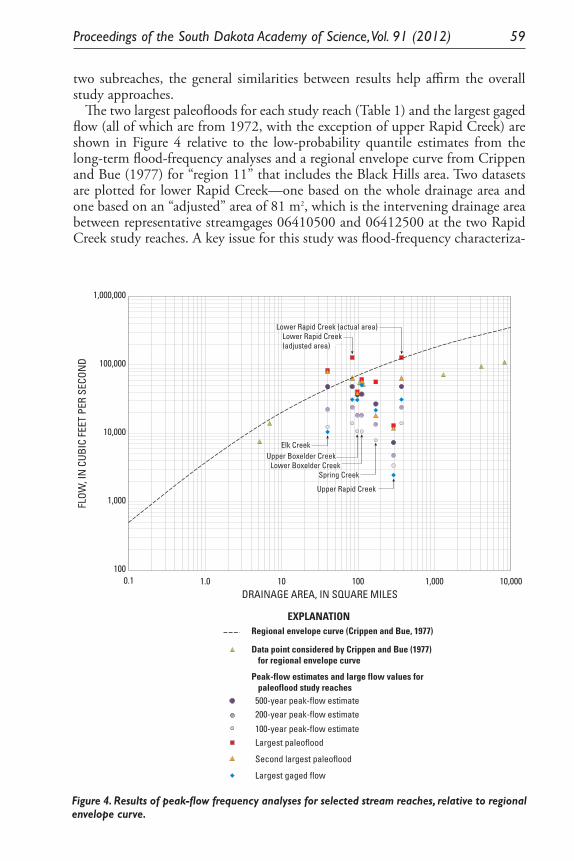
Proceedings of the South Dakota Academy of Science, Vol. 91 (2012) 59
two subreaches, the general similarities between results help affirm the overall study approaches.
The two largest paleofloods for each study reach (Table 1) and the largest gaged flow (all of which are from 1972, with the exception of upper Rapid Creek) are shown in Figure 4 relative to the low-probability quantile estimates from the long-term flood-frequency analyses and a regional envelope curve from Crippen and Bue (1977) for “region 11” that includes the Black Hills area. Two datasets are plotted for lower Rapid Creek—one based on the whole drainage area and one based on an “adjusted” area of 81 m2, which is the intervening drainage area between representative streamgages 06410500 and 06412500 at the two Rapid Creek study reaches. A key issue for this study was flood-frequency characteriza-
Regional envelope curve (Crippen and Bue, 1977)
Data point considered by Crippen and Bue (1977) for regional envelope curve
Peak-flow estimates and large flow values for paleoflood study reaches
500-year peak-flow estimate200-year peak-flow estimate
100-year peak-flow estimateLargest paleoflood
Second largest paleoflood
Largest gaged flow
100
1,000
10,000
100,000
1,000,000
0.1 1.0 10 100 1,000 10,000
FLOW
, IN
CUB
IC F
EET
PER
SECO
ND
DRAINAGE AREA, IN SQUARE MILES
Elk Creek
Upper Boxelder CreekLower Boxelder Creek
Spring Creek
Upper Rapid Creek
Lower Rapid Creek (actual area)
Lower Rapid Creek (adjusted area)
Elk CreekUpper Boxelder Creek
Lower Boxelder CreekSpring Creek
Upper Rapid Creek
Lower Rapid Creek (actual area)Lower Rapid Creek (adjusted area)
EXPLANATION
Figure 4. Results of peak-flow frequency analyses for selected stream reaches, relative to regional envelope curve.
Figure 4. Results of peak-flow frequency analyses for selected stream reaches, relative to regional envelope curve.
60 Proceedings of the South Dakota Academy of Science, Vol. 91 (2012)
tion for modern (regulated) conditions for lower Rapid Creek, and this adjusted area was postulated as the primary contributing area for low-probability floods during pre-regulation conditions. The largest paleofloods and quantile estimates for upper Rapid Creek are about an order of magnitude smaller than for lower Rapid Creek and strongly support the hypothesis of distinctly different regimes for large-flood generation for the two reaches.
The area-adjusted quantile estimates for lower Rapid Creek (Figure 4) plot close to those for the two subreaches of Boxelder Creek, which are nearly identi-cal, and magnitudes for all of these quantile estimates are similar to those for Elk Creek, for which the drainage area is less than one-half of that for all of the other study reaches (Table 1). The 500-year quantile estimate for Elk Creek plots slightly above the regional envelope curve and is exceeded by the two largest paleofloods by a factor of almost two.
Implications for Flood Generation. Driscoll et al. (2010) postulated that po-tential for heavy rain-producing thunderstorms (storm potential) and associated flooding are smallest on the relatively flat top of the Limestone Plateau (located along the Wyoming/South Dakota border, Figure 1), with storm and flood po-tential increasing in an easterly direction. The eastern Black Hills are susceptible to the most intense orographic lifting associated with convective storm systems and also have high relief, thin soils, and narrow and steep canyons—factors favoring generation of exceptionally heavy rain-producing thunderstorms and promoting runoff and rapid concentration of flow into stream channels. In contrast, storm potential in and near the Limestone Plateau area is much lower than for the steeper flanks of the Black Hills. Storm runoff is further reduced by relatively gentle topography, substantial infiltration into the limestone, and extensive flood-plain storage.
The gradient in flood-generation processes is reflected in results of this study, for which some of the most compelling evidence is the disparity between results of the paleoflood investigations for the two Rapid Creek study reaches (Figure 1). Large parts of the upper Rapid Creek drainage basin are within the Limestone Plateau and other high-elevation areas where reduced flood potential is postulat-ed (Driscoll et al. 2010; Sando et al. 2008). The upper reach composes about 78 percent of the drainage area of the lower reach (294 versus 375 mi2, respectively; Table 1). Stratigraphic records for the upper reach indicate two paleofloods dur-ing the last 1,000 to 2,000 years of at least 12,000 and 12,900 ft3/s, which sub-stantially exceed the largest gaged flow of 2,460 ft3/s (Table1). These floods are small, however, compared to the contributing drainage area and plot much lower than paleofloods recognized from stratigraphic deposits within all of the other study reaches (Figure 4). Moreover, the largest paleoflood of at least 128,000 ft3/s for lower Rapid Creek is larger by a factor of about 10, despite having a drainage area that is less than 30 percent larger than that for the upper reach.
Perhaps the most compelling evidence of enhanced flood generation in the eastern Black Hills is provided by Elk Creek, which has had two paleofloods of at least 80,000 ft3/s (Table 1) in the last 2,000 years from a drainage area of only 40 mi2. The headwaters of Elk Creek are northeast of the contiguous geologic outcrops that compose the Limestone Plateau (Figure 1), and the entire upper watershed drains the steep northeastern flanks of the Black Hills. In contrast to
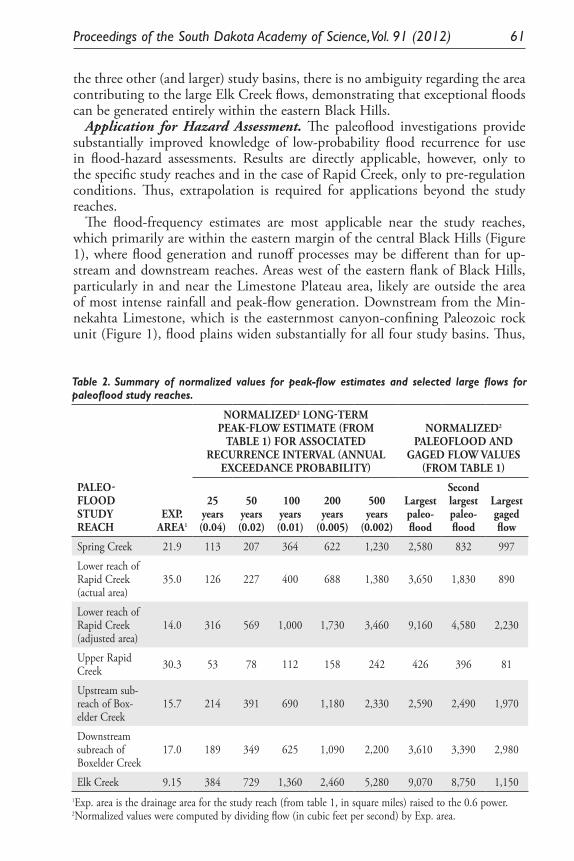
Proceedings of the South Dakota Academy of Science, Vol. 91 (2012) 61
the three other (and larger) study basins, there is no ambiguity regarding the area contributing to the large Elk Creek flows, demonstrating that exceptional floods can be generated entirely within the eastern Black Hills.
Application for Hazard Assessment. The paleoflood investigations provide substantially improved knowledge of low-probability flood recurrence for use in flood-hazard assessments. Results are directly applicable, however, only to the specific study reaches and in the case of Rapid Creek, only to pre-regulation conditions. Thus, extrapolation is required for applications beyond the study reaches.
The flood-frequency estimates are most applicable near the study reaches, which primarily are within the eastern margin of the central Black Hills (Figure 1), where flood generation and runoff processes may be different than for up-stream and downstream reaches. Areas west of the eastern flank of Black Hills, particularly in and near the Limestone Plateau area, likely are outside the area of most intense rainfall and peak-flow generation. Downstream from the Min-nekahta Limestone, which is the easternmost canyon-confining Paleozoic rock unit (Figure 1), flood plains widen substantially for all four study basins. Thus,
Table 2. Summary of normalized values for peak-flow estimates and selected large flows for paleoflood study reaches.
PALEO-FLOOD STUDY REACH
EXP. AREA1
NORMALIZED2 LONG-TERM PEAK-FLOW ESTIMATE (FROM
TABLE 1) FOR ASSOCIATED RECURRENCE INTERVAL (ANNUAL
EXCEEDANCE PROBABILITY)
NORMALIZED2 PALEOFLOOD AND
GAGED FLOW VALUES (FROM TABLE 1)
25 years(0.04)
50 years(0.02)
100 years(0.01)
200 years
(0.005)
500 years
(0.002)
Largest paleo-flood
Second largest paleo-flood
Largest gaged flow
Spring Creek 21.9 113 207 364 622 1,230 2,580 832 997
Lower reach of Rapid Creek (actual area)
35.0 126 227 400 688 1,380 3,650 1,830 890
Lower reach of Rapid Creek (adjusted area)
14.0 316 569 1,000 1,730 3,460 9,160 4,580 2,230
Upper Rapid Creek 30.3 53 78 112 158 242 426 396 81
Upstream sub-reach of Box-elder Creek
15.7 214 391 690 1,180 2,330 2,590 2,490 1,970
Downstream subreach of Boxelder Creek
17.0 189 349 625 1,090 2,200 3,610 3,390 2,980
Elk Creek 9.15 384 729 1,360 2,460 5,280 9,070 8,750 1,1501Exp. area is the drainage area for the study reach (from table 1, in square miles) raised to the 0.6 power.2Normalized values were computed by dividing flow (in cubic feet per second) by Exp. area.
62 Proceedings of the South Dakota Academy of Science, Vol. 91 (2012)
flood peaks derived from convective storm systems affecting the Black Hills typi-cally attenuate markedly once they pass into the plains east of the Black Hills (Driscoll et al. 2010).
Although the regional envelope curve (Figure 4) provides a visual approach for comparing results among study reaches, more rigorous “normalizing” with respect to drainage area allows specific comparisons among basins and provides a basis for extrapolating results beyond the specific study reaches. Table 2 shows long-term quantile estimates and large flow values from Table 1 that have been normalized by dividing by drainage area raised to the 0.6 power. This follows analyses of Sando et al. (2008), who normalized large flows in developing a “Black Hills regional mixed-population” approach to address the complexities of flood-frequency estimation for the area. Table 2 includes the actual drainage area for the lower Rapid Creek study reach as well as an “adjusted” area that represents the intervening area of 81 mi2 downstream from the upper Rapid Creek reach.
The normalized values (Table 2) further illustrate the distinct flood regime of upper Rapid Creek, for which the largest normalized paleoflood value is only 17 percent of the next smallest values (Spring Creek and the upstream subreach of Boxelder Creek) and only about 5 percent of that for Elk Creek. Similarly, normalized quantile estimates for all other study reaches are much larger than for upper Rapid Creek—approaching or exceeding by a factor of 10 for most cases. Normalized quantile estimates for Elk Creek, the two subreaches of Boxelder Creek, and the area-adjusted reach of lower Rapid Creek are relatively similar, varying by less than a factor of 2.5. The largest normalized gaged-flow value is for the downstream subreach of Boxelder Creek, which exceeds those for the upstream subreach and the area-adjusted reach of lower Rapid Creek by a factor of about 0.5.
The normalized quantile estimates allow for extrapolating low-probability flood recurrence to appropriate locations near the paleoflood study reaches. An appropriate approach is to use the normalized quantile estimates from Table 2 as index values that can be “scaled” to other locations of interest by multiplying by drainage area raised to the 0.6 power (same exponent as used for normal-izing). Examples are provided in Table 3, which shows scaled quantile estimates for selected streamgages (Figure 1) and comparisons with estimates from Sando et al. (2008), who defined a regional “high-outlier” probability distribution that was combined (using joint-probability theory) with site-specific probability dis-tributions for individual streamgages. This approach resulted in divergence from the site-specific (“ordinary peaks”) distributions to increasingly larger peak-flow estimates for recurrence intervals larger than about 50 to 100 years. Except for the upper Rapid Creek reach, the quantile estimates derived from the paleoflood studies and scaled to the streamgage areas are larger than those from Sando et al. (2008).
Extrapolation of results to streamgage locations also allows broader evaluation of recurrence intervals for the 1972 flooding and other large measured flows. For example, the 1972 flow for the Spring Creek study reach was 21,800 ft3/s (largest gaged flow; table 1), which corresponds with a recurrence interval approaching 400 years. The area for upstream streamgage 06407500 (163 mi2) is very simi-lar to that for the paleoflood study reach (171 mi2). Thus, the scaled quantile
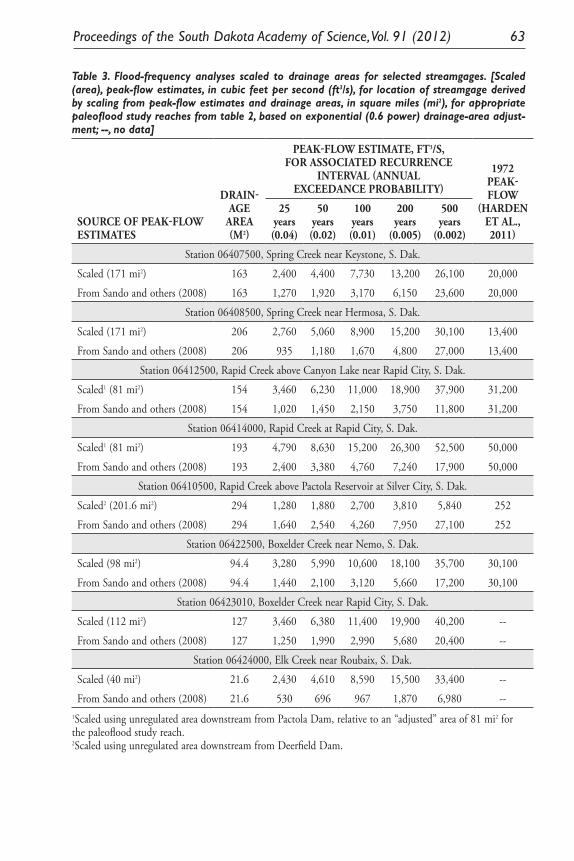
Proceedings of the South Dakota Academy of Science, Vol. 91 (2012) 63
Table 3. Flood-frequency analyses scaled to drainage areas for selected streamgages. [Scaled (area), peak-flow estimates, in cubic feet per second (ft3/s), for location of streamgage derived by scaling from peak-flow estimates and drainage areas, in square miles (mi2), for appropriate paleoflood study reaches from table 2, based on exponential (0.6 power) drainage-area adjust-ment; --, no data]
SOURCE OF PEAK-FLOW ESTIMATES
DRAIN-AGE
AREA (M2)
PEAK-FLOW ESTIMATE, FT3/S, FOR ASSOCIATED RECURRENCE
INTERVAL (ANNUAL EXCEEDANCE PROBABILITY)
1972 PEAK-FLOW
(HARDEN ET AL., 2011)
25 years(0.04)
50 years(0.02)
100 years(0.01)
200 years
(0.005)
500 years
(0.002)
Station 06407500, Spring Creek near Keystone, S. Dak.
Scaled (171 mi2) 163 2,400 4,400 7,730 13,200 26,100 20,000
From Sando and others (2008) 163 1,270 1,920 3,170 6,150 23,600 20,000
Station 06408500, Spring Creek near Hermosa, S. Dak.
Scaled (171 mi2) 206 2,760 5,060 8,900 15,200 30,100 13,400
From Sando and others (2008) 206 935 1,180 1,670 4,800 27,000 13,400
Station 06412500, Rapid Creek above Canyon Lake near Rapid City, S. Dak.
Scaled1 (81 mi2) 154 3,460 6,230 11,000 18,900 37,900 31,200
From Sando and others (2008) 154 1,020 1,450 2,150 3,750 11,800 31,200
Station 06414000, Rapid Creek at Rapid City, S. Dak.
Scaled1 (81 mi2) 193 4,790 8,630 15,200 26,300 52,500 50,000
From Sando and others (2008) 193 2,400 3,380 4,760 7,240 17,900 50,000
Station 06410500, Rapid Creek above Pactola Reservoir at Silver City, S. Dak.
Scaled2 (201.6 mi2) 294 1,280 1,880 2,700 3,810 5,840 252
From Sando and others (2008) 294 1,640 2,540 4,260 7,950 27,100 252
Station 06422500, Boxelder Creek near Nemo, S. Dak.
Scaled (98 mi2) 94.4 3,280 5,990 10,600 18,100 35,700 30,100
From Sando and others (2008) 94.4 1,440 2,100 3,120 5,660 17,200 30,100
Station 06423010, Boxelder Creek near Rapid City, S. Dak.
Scaled (112 mi2) 127 3,460 6,380 11,400 19,900 40,200 --
From Sando and others (2008) 127 1,250 1,990 2,990 5,680 20,400 --
Station 06424000, Elk Creek near Roubaix, S. Dak.
Scaled (40 mi2) 21.6 2,430 4,610 8,590 15,500 33,400 --
From Sando and others (2008) 21.6 530 696 967 1,870 6,980 --1Scaled using unregulated area downstream from Pactola Dam, relative to an “adjusted” area of 81 mi2 for the paleoflood study reach.2Scaled using unregulated area downstream from Deerfield Dam.
64 Proceedings of the South Dakota Academy of Science, Vol. 91 (2012)
estimates (Table 3) are nearly identical to the long-term estimates for the study reach (Table 1), and to an estimated 1972 flow of 20,000 ft3/s that similarly has a recurrence interval approaching 400 years. The 1972 flood peak along Spring Creek attenuated to about 13,400 ft3/s for downstream streamgage 06408500 (table 3), where another large flow of 6,910 ft3/s occurred in 1996 (U.S. Geologi-cal Survey 2010). Recurrence intervals for these 1972 and 1996 flows are slightly less than 200 and 100 years, respectively, based on the scaled quantile estimates (Table 3); whereas, recurrence intervals from Sando et al. (2008) are much larger (substantially exceeding the 200-year quantile estimate) and seemingly are less reliable. Because streamgage 06408500 is located about 8 miles downstream from the outcrop of the Minnekahta Limestone (Figure 1), extrapolation within this domain may be considered questionable. However, this example illustrates the utility of considering information from multiple sources in evaluating low-probability flood recurrence.
Scaled quantile estimates for streamgages 06412500 and 06414000 along low-er Rapid Creek (Table 3) are larger than those from Sando et al. (2008) by factors ranging from about two to five. Quantile estimates for both streamgages were scaled relative to the adjusted area of 81 mi2, which approximates the intervening drainage area between the two Rapid Creek paleoflood study reaches. Recur-rence intervals for the 1972 peak flows of 31,200 and 50,000 ft3/s are about 500 years, relative to scaled quantile estimates for these two streamgages. In contrast, recurrence intervals for the 1972 peak flows largely exceed 500 years relative to the quantile estimates by Sando et al. (2008). The importance and challenges of estimating flood recurrence are exemplified by Rapid Creek, where many of the 238 known deaths from the 1972 flooding occurred. The appropriateness of the drainage-area adjustment for resolving pre- and post-regulation conditions could not be explicitly evaluated. However, the scaled values for streamgages 06412500 and 06414000 (Table 3), with unregulated drainage areas of 54 and 93 mi2 (Harden et al. 2011), are similar to long-term quantile estimates for the Elk Creek study reach (Table 1), for which the drainage area of 40 mi2 is not affected by regulation.
Scaling for streamgage 06410500 along upper Rapid Creek (Figure 1) was per-formed relative to an unregulated area of 201.6 mi2 downstream from Deerfield Reservoir (Table 3), which is consistent with a drainage-area adjustment used by Sando et al. (2008). The scaled quantile estimates reflect the absence of evidence for large paleofloods in this study reach and are substantially smaller than those from Sando et al. (2008), who stated that the mixed-population analysis “prob-ably results in overestimation of peak flows for large recurrence intervals for sta-tions where drainage areas are primarily within the limestone-headwater setting.” The largest gaged flow for streamgage 06410500 is 2,460 ft3/s (Table 1) and has a recurrence interval of about 100 years.
Scaled quantile estimates for the upstream and downstream streamgages (06422500 and 06423010) along Boxelder Creek (table 3) are very similar and were scaled relative to results for the upstream and downstream subreaches (Table 2). The largest differential is for the 500-year recurrence interval, for which values differ by about 10 percent. For the upstream streamgage, recur-rence intervals for the large 1907 and 1972 flows (16,400 ft3/s, U.S. Geological
Proceedings of the South Dakota Academy of Science, Vol. 91 (2012) 65
Survey 2010; and 30,800 ft3/s, Table 1, respectively) are slightly less than 200 and 500 years, respectively, based on the scaled quantile estimates (Table 3). Flow estimates for 1907 and 1972 are not available for the downstream streamgage (06423010); however, the 1972 flow of 50,500 ft3/s for the downstream paleo-flood study subreach (Table 1) exceeds the 500-year quantile estimate (37,400 ft3/s) by about 35 percent.
Scaled quantile estimates for streamgage 06424000 along Elk Creek (Table 3) are about 5 to 10 times larger than those from Sando et al. (2008). However, the scaled estimates probably are more reliable than estimates by Sando et al. (2008), which were based on a short period of record (1992–2001) that did not include the large floods of 1907 and 1972. Recurrence intervals are slightly less than 100 years for large 1972 and 1907 flows for the study reach (Table 1) that were estimated by Harden et al. (2011) as 10,400 ft3/s for both years.
Summarized estimates of recurrence intervals for 1972 flooding show that the recurrence interval of nearly 100 years for the Elk Creek study reach is small rela-tive to other study reaches along the eastern margin of the Black Hills and to the two large paleofloods (80,000–83,000 ft3/s) recorded by stratigraphic deposits along Elk Creek. The 1972 flow for the Spring Creek study reach was 21,800 ft3/s, which has a recurrence interval of about 400 years. Recurrence intervals are about 500 years for the floods of 1972 along the lower Rapid Creek reach and for the upstream subreach of Boxelder Creek. For the downstream subreach of Boxelder Creek, the large 1972 flood magnitude (50,500 ft3/s) exceeds the 500-year quantile estimate by about 35 percent.
LITERATURE CITED
Baker, V.R. 1987. Paleoflood hydrology and extraordinary flood events. Journal of Hydrology 96:79–99.
Benson, M.A., and T. Dalrymple. 1967. General field and office procedures for indirect discharge measurements. U.S. Geological Survey Techniques of Water-Resources Investigations, book 3, chap. A1.
Bradley, R.S. 1999. Paleoclimatology—Reconstructing climates of the Quater-nary (2d ed.). Harcourt Academic Press, Burlington, MA.
Carter, J.M., J.E. Williamson, and R.W. Teller. 2002. The 1972 Black Hills-Rap-id City flood revisited. U.S. Geological Survey Fact Sheet FS–037–02, 6 p. Available at http://pubs.usgs.gov/fs/fs-037-02/. [Cited December 16, 2011].
Cohn, T.A., W.L. Lane, and W.G. Baier. 1997. An algorithm for computing moments-based quantile estimates when historical flood information is available. Water Resources Research 33(9):2089–2096.
Cohn, T.A., W.L. Lane, and J.R. Stedinger. 2001. Confidence intervals for expected moments algorithm flood quantile estimates. Water Resources Research 37(6):1695–1706.
Crippen, J.R., and C.D. Bue. 1977. Maximum flood flows in the conterminous United States. U.S. Geological Survey Water-Supply Paper 1887.
66 Proceedings of the South Dakota Academy of Science, Vol. 91 (2012)
Driscoll, D.G., J.E. O’Connor, and T.M. Harden. 2011. Application of paleo-flood surveys techniques in the Black Hills of South Dakota. South Dakota Department of Transportation Completion Report SD2008-01. Available at http://www.sddot.com/business/research/projects/docs/SD2008-01-F_Fi-nal_Report_07-16-12.pdf. [Cited July 16, 2012]
Driscoll, D.G., Huft, D.L., and O’Connor, J.E., 2012, Extreme floods in the Black Hills area—New insights from recent research: Pierre, S. Dak., South Dakota Department of Transportation, 4 p. Available at http://www.sddot.com/business/research/projects/docs/SD2008-01_Fact_Sheet_06-11-12.pdf [Cited June 11, 2012]
Driscoll, D.G., M.J. Bunkers, J.M. Carter, J.F. Stamm, and J.E. Williamson. 2010. Thunderstorms and flooding of August 17, 2007, with a context pro-vided by a history of other large storm and flood events in the Black Hills area of South Dakota. U.S. Geological Survey Scientific Investigations Re-port 2010–5187. Available at http://pubs.usgs.gov/sir/2010/5187/. [Cited December 16, 2011].
Grant, G.E. 1997. Critical flow constrains flow hydraulics in mobile-bed streams—A new hypothesis. Water Resources Research 33:349–358.
Griffis, V.W., J.R. Stedinger, and T.A. Cohn. 2004. Log Pearson type 3 quan-tile estimators with regional skew information and low outlier adjust-ments. Water Resources Research 40(10), 17 p., citation number W07503, doi:10.1029/2003WR002697. Available at http://www.agu.org/pubs/crossref/2004/2003WR002697.shtml. [Cited July 25, 2011].
Harden, T.M., J.E. O’Connor, D.G. Driscoll, and J.F. Stamm. 2011. Flood-fre-quency analyses from paleoflood investigations for Spring, Rapid, Boxelder, and Elk Creeks, Black Hills, western South Dakota. U.S. Geological Survey Scientific Investigations Report 2011–5131. Available at http://pubs.usgs.gov/sir/2011/5131/. [Cited December 16, 2011].
Holmes, C.W. 1998. Short lived isotopic chronometers—A means of measur-ing decadal sedimentary dynamics. U.S. Geological Survey Fact Sheet FS–073–98.
Interagency Advisory Council on Water Data. 1982. Guidelines for determining flood flow frequency. Hydrology Subcommittee, Bulletin 17B, appendixes 1–14.
Kochel, R.C., and V.R. Baker. 1988. Paleoflood analysis using slackwater de-posits. Pages 357–376 in V.R. Baker, R.C. Kochel, and P.C. Patton, editors. Flood geomorphology. John Wiley and Sons, New York, NY.
O’Connell, D.R.H. 1999. FLDFRQ3 user’s guide, release 1.1. U.S. Bureau of Reclamation.
O’Connell, D.R.H., D.A. Ostenaa, D.R. Levish, and Klinger, R.E. 2002. Bayes-ian flood frequency analysis with paleohydrologic bound data. Water Re-sources Research 35(5), doi:10.1029/2000WR000028. Available at http://www.agu.org/pubs/crossref/2002/2000WR000028.shtml. [Cited July 25, 2011].
Proceedings of the South Dakota Academy of Science, Vol. 91 (2012) 67
Sando, S.K., D.G. Driscoll, and C. Parrett. 2008. Peak-flow frequency estimates based on data through water year 2001 for selected streamflow-gaging sta-tions in South Dakota. U.S. Geological Survey Scientific Investigations Re-port 2008–5104. Available at http://pubs.usgs.gov/sir/2008/5104/. [Cited December 16, 2011].
Schwarz, F.K., L.A. Hughes, E.M. Hansen, M.S. Petersen, and D.B. Kelly. 1975. The Black Hills-Rapid City Flood of June 9–10, 1972—A description of the storm and flood. U.S. Geological Survey Professional Paper 877.
Stedinger, J.R., and V.R. Baker. 1987. Surface water hydrology—Historical and paleoflood information. Review of Geophysics 25(2):119–124.
Strobel, M.L., G.J. Jarrell, J.F. Sawyer, J.R. Schleicher, and M.D. Fahrenbach. 1999. Distribution of hydrogeologic units in the Black Hills area, South Dakota. U.S. Geological Survey Hydrologic Investigations Atlas HA–743, 3 sheets, scale 1:100,000. Available at http://pubs.usgs.gov/ha/ha743/. [Cited December 16, 2011].
Stuiver, Minze, and H.A. Polach. 1977. Discussion—Reporting of 14C data. Radiocarbon 19(3):355–363.
U.S. Army Corps of Engineers. 2008a. HEC-RAS River Analysis System user’s manual, version 4.0. U.S. Army Corps of Engineers.
U.S. Army Corps of Engineers. 2008b. HEC-RAS River Analysis System hy-draulic reference manual, version 4.0. U.S. Army Corps of Engineers.
U.S. Geological Survey. 2010. National Water Information System (NWISWeb)—Peak streamflow for South Dakota. U.S. Geological Survey database. Avail-able at http://nwis.waterdata.usgs.gov/sd/nwis/peak. [Cited December 16, 2011].
Walker, M. 2005 Quaternary dating methods. John Wiley and Sons, Ltd., Chichester, England.
Weibull, W. 1939. A statistical theory of the strength of materials. Handlingar, Ingeniors Ventenskaps Akademian 151–3:45–55.

Proceedings of the South Dakota Academy of Science, Vol. 91 (2012) 69
PERMEABILITY AND GROUND-WATER RECHARGE IN BLACK HILLS METAMORPHIC ROCKS
Perry H. RahnDepartment of Geology & Geological Engineering
South Dakota School of Mines & TechnologyRapid City, SD 57701
Corresponding author email: [email protected]
ABSTRACT
Daily precipitation data were collected from April to October, 2011, in an area underlain by Precambrian metamorphic rocks near Hill City, South Dakota. Ground water discharged from a nearby abandoned mine adit from May 20 to June 9 following two days of intense rain. The maximum discharge was 0.437 cfs (0.0124 m3/s), and the total volume of water that discharged during the 21-day interval was 425,000 ft3 (12,040 m3). The onset of discharge lagged about 12 hours following 2.15 inches (5.46 cm) of rain on May 20.
The recharge area serving the mine adit is approximately 26.4 acres (10.7 ha). The precipitation during the 21-day interval affecting the mine discharge was 5.07 inches (12.9 cm). This is equivalent to a volume of water falling on the recharge area of 486,000 ft3 (13,760 m3), slightly more than the volume of water discharged from the mine adit during this period. Because nearly all the rain re-charged the ground water, and because precipitation infiltrated the metamorphic rocks and recharged the water table within 12 hours, the metamorphic rocks demonstrate considerable permeability at shallow depths. This conclusion is supported by hydrogeologic studies of metamorphic rocks at other places in the Black Hills, such as a shallow ground-water contaminant plume at Nemo. The abundant base flow in streams draining metamorphic rocks also indicates shallow metamorphic rocks can store meteoric water for subsequent release to streams.
Data from this study site, supplemented by published permeability data, indi-cate the hydraulic conductivity of metamorphic rocks varies from approximately 1 m/d near the surface to 10-4 m/d at 1 km depth. A general formula relating this exponential decrease in hydraulic conductivity with depth was determined.
The permeable nature of the near-surface metamorphic rocks has practical ramifications. For instance, a water well that is open over the upper 100 ft (30.5 m) of saturated near-surface metamorphic rocks would probably have a greater specific capacity than if the well were drilled much deeper. The permeable nature of near-surface metamorphic rocks also helps explain the rapid transport of bac-teria from onsite wastewater systems.
Keywords
Black Hills, ground water, permeability, recharge
70 Proceedings of the South Dakota Academy of Science, Vol. 91 (2012)
INTRODUCTION
The water table in the Precambrian terrain in the Black Hills is generally shal-low, rarely more than 100 ft (30.5 m) depth. Typically the water table is connect-ed to perennial streams, and slopes gently upward under the surrounding hills.
The permeability of the Precambrian metamorphic rocks is low compared to aquifers in the sedimentary rocks such as the Madison Limestone, the Minnelusa Formation, and the Inyan Kara Group. [Note: while the permeability of meta-morphic rocks depends to some degree on the rock type, for simplification this paper considers the metamorphic rocks a single unit.] Well yields in Precambrian rocks for 561 wells were found to have a median yield of 10 gpm (37.9 l/min) (Carter et al. 2002), much lower than median values for major aquifers. Assum-ing a 100 ft saturated thickness for these wells, I estimate that the median specific capacity would be at least 0.1 gpm/ft (1.82 m3/d per m). From a conversion table (from USBR, 1995) the median transmissivity would be approximately 30 ft2/day (2.8 m2/d), and the hydraulic conductivity would be approximately 0.3 ft/d (0.091 m/d).
Few values of the hydraulic conductivity of metamorphic rocks in the Black Hills have been published. A pumping test of a 423 ft (129 m) well in slate northwest of Hill City yielded a specific capacity of 0.0086 gpm/ft (0.154 m3/d per m) (Rahn 1994). The USBR (1995) conversion table yields a transmissivity of 2.5 ft2/day (0.25 m2/d) and a hydraulic conductivity of 0.025 ft/day (0.008 m/d). The specific capacity data for ten shallow water wells in metamorphic rocks were studied near Silver City (Aurand, pers. comm. 2011). She found an average transmissivity of 75 ft2/day (7.0 m2/d). With an aquifer thickness of 50 ft (15.2 m), the hydraulic conductivity would be approximately 1.5 ft/day (0.45 m/d).
The permeability of metamorphic rocks generally decreases with depth (Davis and DeWeist 1966). Murdoch et al. (2011) studied the permeability of Black Hills metamorphic rocks in the former Homestake Mine area. Here the Precam-brian rocks are predominantly phyllite and schist. Homestake Mine is considered a “dry” mine, and the overall low permeability of the rocks is demonstrated by Whitewood Creek, which crosses over the mine workings yet loses very little wa-ter despite the fact that the mine was dewatered to approximately 2.4 km depth during years 1980 to the present, although some mine flooding occurred when the dewatering pumps were turned off from years 2003 to 2008. The overall hydraulic conductivity is low, and is largely dependent on fractures. The rocks are increasingly less permeable with depth due to increasing lithostatic stress. The hydraulic conductivity values utilized by Murdoch et al. (2011) range from approximately 10-7 m/sec (8.6 X 10⁻³ m/d) near the surface, decreasing to 10-8 m/sec (8.6 X 10⁻⁴ m/d) at 100 m depth, further decreasing to 1.8 X 10⁻⁹ m/sec (1.6 X 10⁻⁴ m/d) at 1 km depth, and ultimately decreasing to 1.5 X 10⁻⁹ m/sec (1.3 X 10⁻⁴ m/d) at 2 km depth.
Rahn and Gries (1973) noted that major streams such as Spring Creek and Boxelder Creek are perennial in the low permeability Precambrian core of the Black Hills but normally lose all their flow upon encountering the permeable sedimentary rocks surrounding the Precambrian core. Interestingly, despite the overall low permeability of the Precambrian rocks, large streams draining this
Proceedings of the South Dakota Academy of Science, Vol. 91 (2012) 71
terrain typically have a fairly high base flow. For example, Carter and Driscoll (2001, Table 2) reported the base flow for streams in crystalline core basins, in-cluding Boxelder, Elk, and Bear Butte creeks, averages approximately 0.339 cfs per square mile (0.0037 m3/s per km2), equivalent to an annual runoff from base flow of 4.59 inches (11.7 cm) over the entire basin. To some degree, surficial deposits in these basins undoubtedly contribute to this base flow; for example, a large spring supplying Mt. Rushmore National Memorial occurs where surfi-cial deposits (talus) and weathered schist overlie granite (Rahn 1990). The high discharge of base flow in the crystalline core basins indicates that abundant ground-water recharge occurs in the metamorphic rocks despite their overall low permeability.
Precambrian metamorphic rocks at Nemo were found to readily transmit con-taminants (Rahn and Johnson 2002). A surface disposal pit containing ethylene dibromide at Nemo generated a contaminant plume that migrated along the foliation approximately 1 km during 20 years. A major transmissivity tensor was found to be 0.73 m2/d; therefore, if the saturated thickness is 10 m, the hydraulic conductivity would be 0.073 m/d.
From the above discussion, there seems to be conflicting data concerning the permeability of metamorphic rocks. They have very low permeability at depths. Yet they have high permeability at shallow depths, and hence they are able to transmit contaminants and supply abundant base flow to streams.
HYDROGEOLOGIC SETTING
At this study area, there is an opportunity to determine the permeability of near-surface metamorphic rocks by examining the precipitation, infiltration, ground-water recharge, and the response time of ground water discharging from an abandoned gold mine adit. Despite many abandoned mine adits throughout the Precambrian terrain, most are dry and the hydrogeology of those that occa-sionally discharge water have rarely been studied.
The study area is 7 miles (11 km) northwest of Hill City, on land owned by the author. Figure 1 shows part of Section 32, T 1 N, R 4 E. The bedrock in Section 32 is primarily phyllite, interpreted as a metamorphosed tuff (Redden and DeWitt 2008).
Figure 1 shows that the topography above the mine adit is a gently sloping hill, with approximately 200 ft (61 m) local relief. The mine adit probably does not extend more than 100 ft (30.5 m). No water wells are within this part of Section 32; nevertheless, the water table is presumably close to the mine adit entrance and slopes gently under the hill to the southwest. The surrounding hills are forest covered, with about 10% of the area consisting of outcrops and 90% of the area covered by colluvium, duff, and pine needles.
Precipitation at Mt. Rushmore is assumed to be typical of the study area. The data (www.wrcc.dri.edu) indicate the average annual precipitation is 21.68 inches (55.07 cm). The years 2001 through 2008 were below normal, and the years 2009 through 2011 were above normal. No discharge from the mine adit was observed from 2001 through 2008, but discharge occurred in years 2009 through 2011.
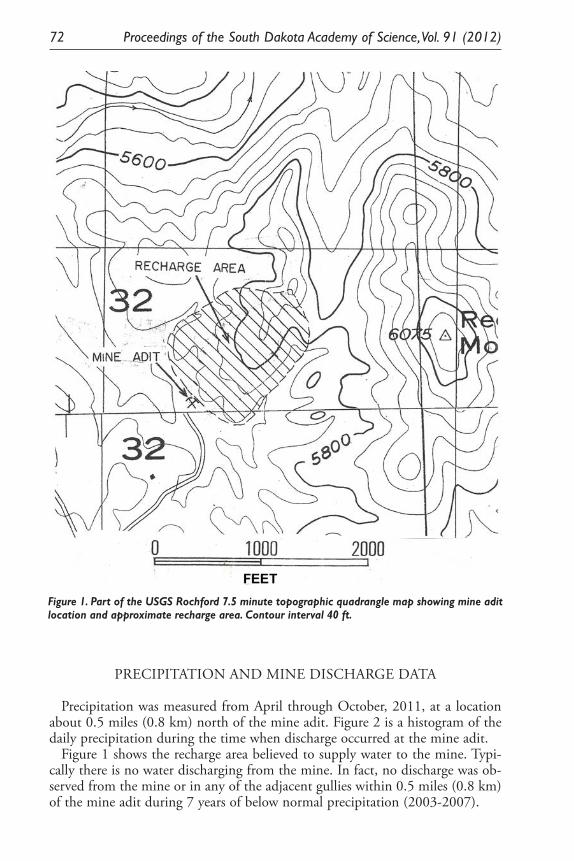
72 Proceedings of the South Dakota Academy of Science, Vol. 91 (2012)
PRECIPITATION AND MINE DISCHARGE DATA
Precipitation was measured from April through October, 2011, at a location about 0.5 miles (0.8 km) north of the mine adit. Figure 2 is a histogram of the daily precipitation during the time when discharge occurred at the mine adit.
Figure 1 shows the recharge area believed to supply water to the mine. Typi-cally there is no water discharging from the mine. In fact, no discharge was ob-served from the mine or in any of the adjacent gullies within 0.5 miles (0.8 km) of the mine adit during 7 years of below normal precipitation (2003-2007).
Figure 1. Part of the USGS Rochford 7.5 minute topographic quadrangle map showing mine adit location and approximate recharge area. Contour interval 40 ft.
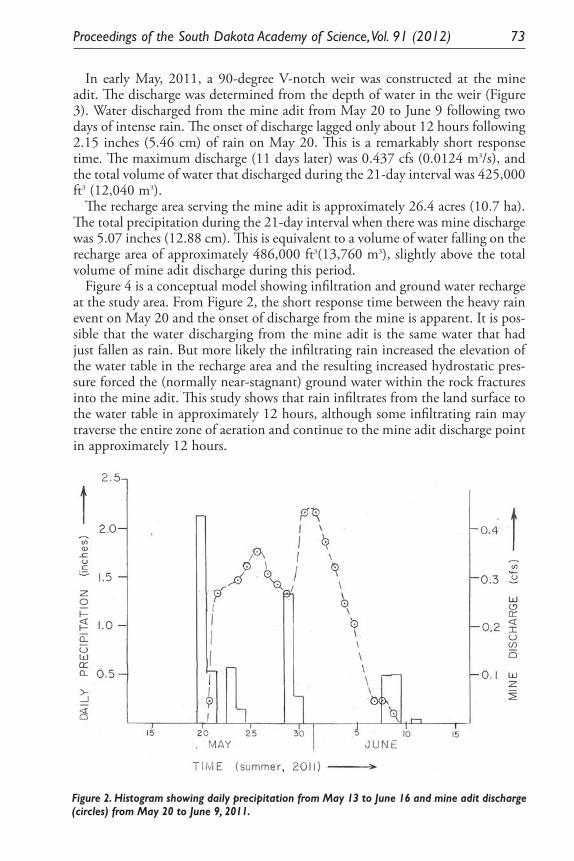
Proceedings of the South Dakota Academy of Science, Vol. 91 (2012) 73
In early May, 2011, a 90-degree V-notch weir was constructed at the mine adit. The discharge was determined from the depth of water in the weir (Figure 3). Water discharged from the mine adit from May 20 to June 9 following two days of intense rain. The onset of discharge lagged only about 12 hours following 2.15 inches (5.46 cm) of rain on May 20. This is a remarkably short response time. The maximum discharge (11 days later) was 0.437 cfs (0.0124 m3/s), and the total volume of water that discharged during the 21-day interval was 425,000 ft3 (12,040 m3).
The recharge area serving the mine adit is approximately 26.4 acres (10.7 ha). The total precipitation during the 21-day interval when there was mine discharge was 5.07 inches (12.88 cm). This is equivalent to a volume of water falling on the recharge area of approximately 486,000 ft3(13,760 m3), slightly above the total volume of mine adit discharge during this period.
Figure 4 is a conceptual model showing infiltration and ground water recharge at the study area. From Figure 2, the short response time between the heavy rain event on May 20 and the onset of discharge from the mine is apparent. It is pos-sible that the water discharging from the mine adit is the same water that had just fallen as rain. But more likely the infiltrating rain increased the elevation of the water table in the recharge area and the resulting increased hydrostatic pres-sure forced the (normally near-stagnant) ground water within the rock fractures into the mine adit. This study shows that rain infiltrates from the land surface to the water table in approximately 12 hours, although some infiltrating rain may traverse the entire zone of aeration and continue to the mine adit discharge point in approximately 12 hours.
Figure 2. Histogram showing daily precipitation from May 13 to June 16 and mine adit discharge (circles) from May 20 to June 9, 2011.
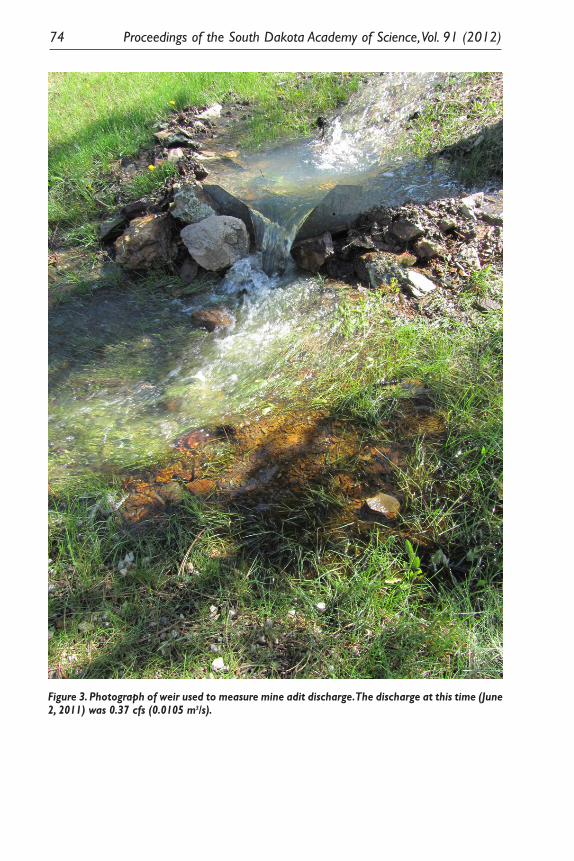
74 Proceedings of the South Dakota Academy of Science, Vol. 91 (2012)
Figure 3. Photograph of weir used to measure mine adit discharge. The discharge at this time (June 2, 2011) was 0.37 cfs (0.0105 m3/s).
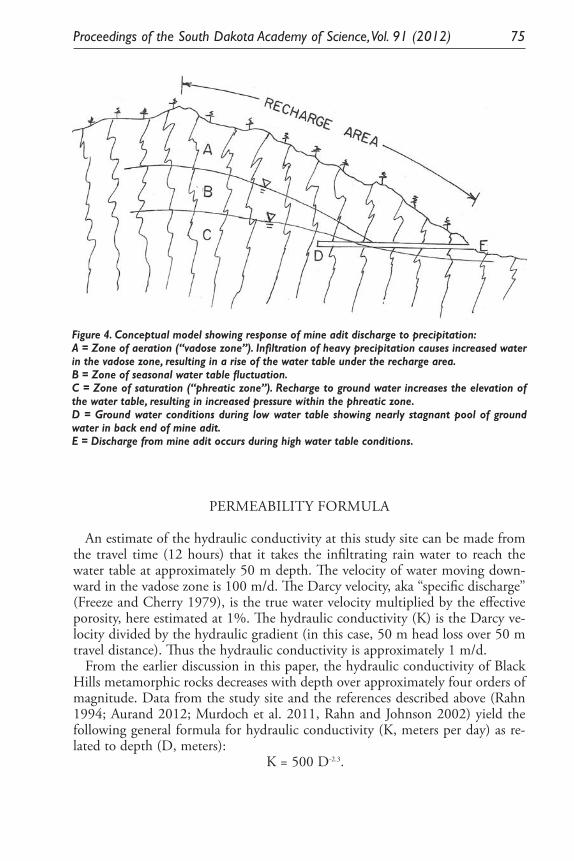
Proceedings of the South Dakota Academy of Science, Vol. 91 (2012) 75
PERMEABILITY FORMULA
An estimate of the hydraulic conductivity at this study site can be made from the travel time (12 hours) that it takes the infiltrating rain water to reach the water table at approximately 50 m depth. The velocity of water moving down-ward in the vadose zone is 100 m/d. The Darcy velocity, aka “specific discharge” (Freeze and Cherry 1979), is the true water velocity multiplied by the effective porosity, here estimated at 1%. The hydraulic conductivity (K) is the Darcy ve-locity divided by the hydraulic gradient (in this case, 50 m head loss over 50 m travel distance). Thus the hydraulic conductivity is approximately 1 m/d.
From the earlier discussion in this paper, the hydraulic conductivity of Black Hills metamorphic rocks decreases with depth over approximately four orders of magnitude. Data from the study site and the references described above (Rahn 1994; Aurand 2012; Murdoch et al. 2011, Rahn and Johnson 2002) yield the following general formula for hydraulic conductivity (K, meters per day) as re-lated to depth (D, meters):
K = 500 D-2.3.
Figure 4. Conceptual model showing response of mine adit discharge to precipitation: A = Zone of aeration (“vadose zone”). Infiltration of heavy precipitation causes increased water in the vadose zone, resulting in a rise of the water table under the recharge area.B = Zone of seasonal water table fluctuation.C = Zone of saturation (“phreatic zone”). Recharge to ground water increases the elevation of the water table, resulting in increased pressure within the phreatic zone.D = Ground water conditions during low water table showing nearly stagnant pool of ground water in back end of mine adit.E = Discharge from mine adit occurs during high water table conditions.
76 Proceedings of the South Dakota Academy of Science, Vol. 91 (2012)
PRACTICAL CONSIDERATIONS
Hydrogeologic information learned in this study is useful in other practical considerations. For example, water wells drilled in the metamorphic terrain produce most water from cracks. If saturated rock is encountered and the well can only produce a marginal yield for a domestic supply, well drillers, once set up for drilling, tend to continue drilling deeper hoping to hit a very productive crack. Due to the exponential decrease in permeability with depth, however, if a driller encounters only a marginal yield of ground water (~1 gpm (5.45 m3/d)) in the first 100 ft (30.5 m) of the phreatic zone, it would be wiser to move to a different location and drill another 100 ft (30.5 m) well rather than continue drilling where initially set up.
Another practical consideration involves onsite wastewater systems. The drain field for a septic tank, located within a few feet of the surface, relies on gravity to disperse the wastewater. In the metamorphic terrain, bedrock would most likely exist just below the drain field. The rapid infiltration and recharge in near-surface metamorphic rocks as shown in this study helps explain the rapid movement of wastewater and why sickness from onsite wastewater systems has been docu-mented only in the metamorphic terrain in the Black Hills (Rahn 2011).
CONCLUSION
This study shows that there is a rapid infiltration of rain and flow of water through the unsaturated zone down to the water table, resulting in abundant discharge from the mine adit. Practically all the precipitation from May 20 to June 9 recharged ground water.
This rapid transmission of water seems to contradict the overall low hydraulic conductivity of metamorphic rocks. A most likely explanation for this apparent contradiction is because of the weathered nature of the metamorphic rocks near the surface. This area was never glaciated, and the residual soils and outcrops of weathered phyllite have abundant open fractures that easily accept all the pre-cipitation, even in a moderate downpour. The water moves quickly through the zone of aeration, and, once the infiltrating water reaches the phreatic zone, the water table rises dramatically. The additional hydrostatic pressure in this phreatic zone then forces ground water through the weathered rocks.
The high permeability near the surface explains the rapid movement of con-taminants in near-surface metamorphic rocks, and why streams in the metamor-phic terrain have a relatively high base flow.
At depths greater than approximately 100 m, the metamorphic rocks are prac-tically unweathered. Any fracture would be nearly squeezed shut due to the great lithostatic stress, and therefore metamorphic rocks below this depth would barely transmit ground water at all.
Proceedings of the South Dakota Academy of Science, Vol. 91 (2012) 77
LITERATURE CITED
Carter, J. M., and D.G. Driscoll. 2001. Hydrologic conditions and budgets for the Black Hills of South Dakota, through water year 1998. U.S. Geological Survey, Water Resources Investigations. Report 01-4226.
Carter, J.M., D.G. Driscoll, J.E. Williamson, and V.A. Lindquist. 2002. Atlas of water resources of the Black Hills area, South Dakota. U.S. Geological Survey. Atlas HA-747.
Davis, S.N., and R.G.M. DeWeist. 1966. Hydrogeology. John Wiley & Sons, New York, 463 pp.
Freeze, R.A., and J.A. Cherry, 1979, Groundwater. Prentice-Hall, Inc., Engle-wood Cliffs, New Jersey, 604 pp.
Murdoch, L.C., L.N. Germanovich, H. Wang, T.C. Onstott, D. Elsworth, L. Stetler, and D. Boutt. 2011. Hydrogeology of the vicinity of Homestake mine, South Dakota, USA. Hydrogeology Journal, published online. 11 October, 2011. 17 pp.
Rahn, P.H. 1990. Ground-water recharge at Mount Rushmore. Proceedings, South Dakota Academy of Science. 69:129-138.
Rahn, P.H. 1994. Hydraulic fracturing of a water well in the Precambrian rocks of the Black Hills. Proceedings, South Dakota Academy of Science. 73:205-210.
Rahn, P.H. 2011. Sickness caused by septic disposal systems in the Black Hills. Proceedings, South Dakota Academy of Science. 90:3-70.
Rahn. P.H., and J.P. Gries. 1973. Large springs in the Black Hills, South Dakota and Wyoming. South Dakota Geological Survey. Report of Invest. No. 107. 46 pp.
Rahn, P.H., and C.S. Johnson. 2002. Effects of anisotropic transmissivity on a contaminant plume at Nemo, South Dakota. Environmental and Engineer-ing Geoscience. VIII(1):11-18.

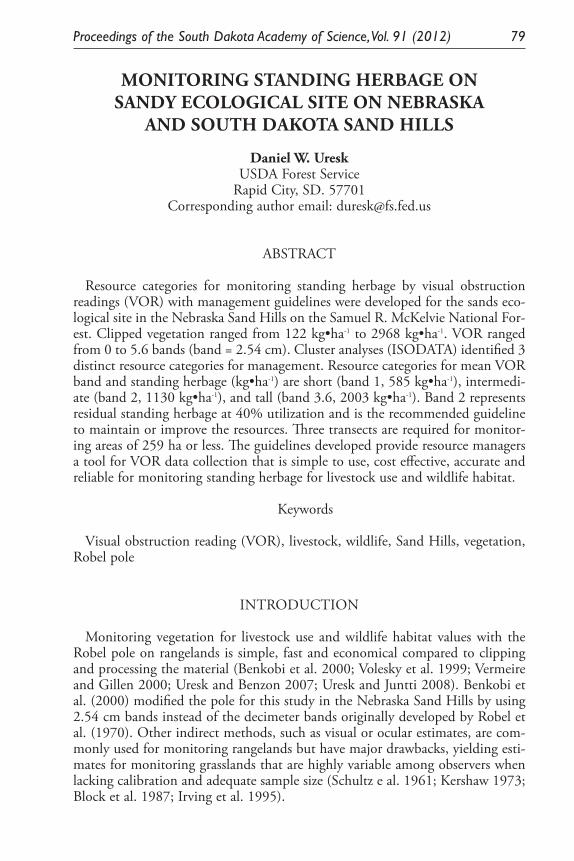
Proceedings of the South Dakota Academy of Science, Vol. 91 (2012) 79
MONITORING STANDING HERBAGE ON SANDY ECOLOGICAL SITE ON NEBRASKA
AND SOUTH DAKOTA SAND HILLS
Daniel W. UreskUSDA Forest Service
Rapid City, SD. 57701Corresponding author email: [email protected]
ABSTRACT
Resource categories for monitoring standing herbage by visual obstruction readings (VOR) with management guidelines were developed for the sands eco-logical site in the Nebraska Sand Hills on the Samuel R. McKelvie National For-est. Clipped vegetation ranged from 122 kg•ha-1 to 2968 kg•ha-1. VOR ranged from 0 to 5.6 bands (band = 2.54 cm). Cluster analyses (ISODATA) identified 3 distinct resource categories for management. Resource categories for mean VOR band and standing herbage (kg•ha-1) are short (band 1, 585 kg•ha-1), intermedi-ate (band 2, 1130 kg•ha-1), and tall (band 3.6, 2003 kg•ha-1). Band 2 represents residual standing herbage at 40% utilization and is the recommended guideline to maintain or improve the resources. Three transects are required for monitor-ing areas of 259 ha or less. The guidelines developed provide resource managers a tool for VOR data collection that is simple to use, cost effective, accurate and reliable for monitoring standing herbage for livestock use and wildlife habitat.
Keywords
Visual obstruction reading (VOR), livestock, wildlife, Sand Hills, vegetation, Robel pole
INTRODUCTION
Monitoring vegetation for livestock use and wildlife habitat values with the Robel pole on rangelands is simple, fast and economical compared to clipping and processing the material (Benkobi et al. 2000; Volesky et al. 1999; Vermeire and Gillen 2000; Uresk and Benzon 2007; Uresk and Juntti 2008). Benkobi et al. (2000) modified the pole for this study in the Nebraska Sand Hills by using 2.54 cm bands instead of the decimeter bands originally developed by Robel et al. (1970). Other indirect methods, such as visual or ocular estimates, are com-monly used for monitoring rangelands but have major drawbacks, yielding esti-mates for monitoring grasslands that are highly variable among observers when lacking calibration and adequate sample size (Schultz e al. 1961; Kershaw 1973; Block et al. 1987; Irving et al. 1995).
80 Proceedings of the South Dakota Academy of Science, Vol. 91 (2012)
Information for the Sand Hills rangeland and wildlife habitat has been well documented (Frolik and Keim 1933; Gilbert et al. 1979; Potvin and Harrison 1984; Stubbendieck and Reece 1992; Volesky et al. 1999; Reece et al. 2001; Volesky et al. 2005; Volesky et al. 2007). Bleed and Flowerday (1990) and Stub-bendieck et al. (1989) present overviews and literature reviews of the area. The calibration of the Robel pole for this study (visual obstruction with standing herbage (kg•ha-1)) was completed by Benkobi et al. (2000) on sandy lowlands (Sands Ecological site); however resource guidelines for monitoring were not provided. Objectives of this study were to 1) develop guidelines for monitoring herbage, and 2) provide management guidelines for livestock grazing and wildlife habitat.
STUDY AREA
The study was conducted on the Samuel R. McKelvie National Forest located southwest of Valentine, Nebraska, and is approximately 47,301 ha (Benkobi et al. 2000) within the sandy ecological type (Bleed and Flowerday 1990; USDA NRCS 2001). The sandy ecological site in the past has been described as the val-leys or lowland range site (Burslaff 1962, Barnes et al. 1984). Common plants include sand bluestem (Andropogon hallii Hack.), little bluestem (Schizachyrium scoparium (Michx.) Nash), prairie sandreed (Calamovilfa longifolia (Hook.) Scribn., and needle-and-thread (Stipa comata Trin. & Rupr.). Plant nomencla-ture follows Great Plains Flora Association (1986). Elevation ranges from 1,219 to 1,310 m above sea level. Precipitation recorded at Halsey, NE, (87-year aver-age) is 541 mm, with most precipitation occurring as rain from April through August (High Plains Regional Climate Center 2011). Snow is commonly present from November through March. Average maximum and minimum temperatures are 16.9 oC and 1.4 oC, respectively. The frost-free period is 150 days.
METHODS
Data used for these analyses are from Benkobi et al. (2000) collected with a modified Robel pole and clipped vegetation. The pole had alternating white and grey bands (2.54 cm bands) with the bottom band numbered with 1and placed at the soil surface. If the first band was visible, the reading was 0, and a reading of 1 meant the first band was totally obscured. When bands were totally obscured, the lowest non-visible VOR band was recorded. Transects were 200 m in length with 20 stations spaced 10 m apart. Four VOR’s were recorded in the cardinal directions at a distance of 4 m from each station with the reader’s eye at a height of 1m. At stations (50, 100, 150, and 200 m), all herbaceous vegetation was clipped at ground level within a 0.25 m2 hoop, bagged and oven dried.
Cluster analysis with ISODATA (Ball and Hall 1967; del Morel 1975) was used to develop resource categories with visual obstruction readings (VOR) and standing herbage (kg•ha-1) (Benkobi et al. 2000) for 173 transects. VOR (2.54 cm bands) and kg•ha-1 were standardized (individual data subtracted from the
Proceedings of the South Dakota Academy of Science, Vol. 91 (2012) 81
sample mean/standard deviation) to give equal weight for analyses. Data were also analyzed by SPSS (2003) for descriptives, means analyses, regression and other exploratory analyses. All data were collected in the fall after first frost (Benkobi et al. 2000).
RESULTS
Visual obstruction readings (VOR) of standing herbage for 173 transects ranged on grazed and ungrazed pastures from 0 to 5.6 bands (2.54 cm) with a mean of 1.9 bands. Clipped vegetation varied from 122 to 2968 kg•ha-1, a mean of 1055 kg•ha-1. Cluster analysis (ISODATA) based on bands (VOR) and kg•ha-1 resulted in 3 distinct resource categories (Table 1). Resource categories are short (0-1.5 bands), intermediate (1.6-2.7 bands) and tall (2.8-3.9+ bands). We calcu-late that 40% use by herbivores based on 2003 kg•ha-1 is 1202 kg•ha-1 at band 2.1. The estimated number of transects is 3 per 259 ha to be within 20% of the mean with an 80% confidence (Benkobi et al. 2000).
DISCUSSION
The Robel pole is an excellent tool for monitoring rangelands with VOR and standing herbage. Resource categories define the range from short to tall vegeta-tion based on data from Benkobi et al. (2000). The short category would be considered heavily grazed; intermediate category, moderately grazed; and the tall category lightly grazed or ungrazed. These categories may be useful with various grazing systems and provide the heterogeneity and diversity required by wildlife (Stubbendieck and Reece 1992; Holechek et al. 1998; Vodehnal et al. 2009). On the sandy ecological site, USDA-NRCS (2001) estimated average high potential vegetation over four communities at 2380 kg•ha-1. At 2003 kg•ha-1, data from
Table 1. Resource categories for short, intermediate, and tall vegetation by band number (2.54 cm, 1-inch) on a Robel pole (VOR) with corresponding standing herbage (kg•ha-1) value. Catego-ries were defined by cluster analysis for 173 transects.
CATEGORY ATTRIBUTE MINIMUM MEAN MAXIMUM
Short (n = 73)†Band number‡ 0 1.0 1.5Standing herbage§ 39 595 858
Intermediate (n = 72)Band number 1.6 2.0 2.7Standing herbage 912 1130 1512
Tall (n = 28)Band number 2.8 3.6 3.9+Standing herbage 1567 2003 2167
†Number of transects.‡Visual obstruction reading (VOR).§Based on the corrected misprint band-weight equation in Benkobi et al. (2000); corrected mis-print is: SCDW (kg•ha-1) = 39.10 + 214.81 VOR (cm); [kg•ha-1 = 39.1 + 545.6*Band (2.54 cm)].
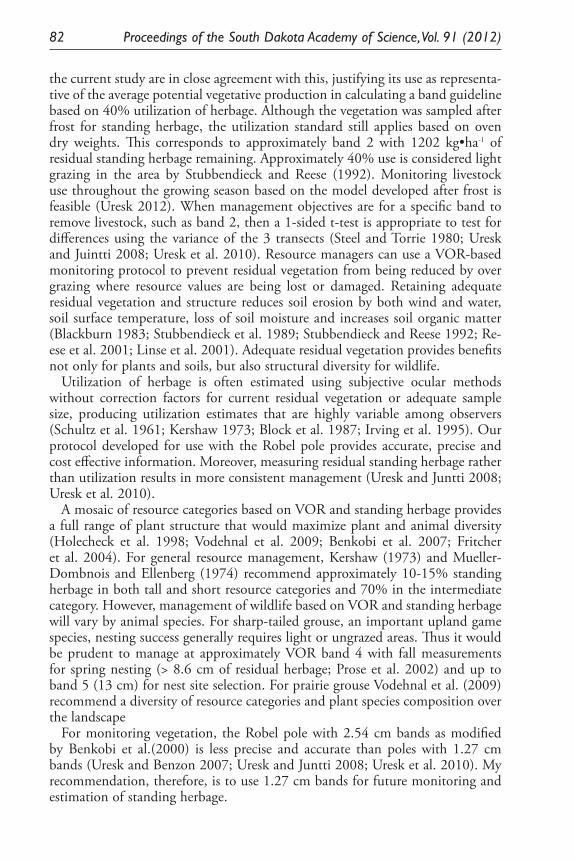
82 Proceedings of the South Dakota Academy of Science, Vol. 91 (2012)
the current study are in close agreement with this, justifying its use as representa-tive of the average potential vegetative production in calculating a band guideline based on 40% utilization of herbage. Although the vegetation was sampled after frost for standing herbage, the utilization standard still applies based on oven dry weights. This corresponds to approximately band 2 with 1202 kg•ha-1 of residual standing herbage remaining. Approximately 40% use is considered light grazing in the area by Stubbendieck and Reese (1992). Monitoring livestock use throughout the growing season based on the model developed after frost is feasible (Uresk 2012). When management objectives are for a specific band to remove livestock, such as band 2, then a 1-sided t-test is appropriate to test for differences using the variance of the 3 transects (Steel and Torrie 1980; Uresk and Juintti 2008; Uresk et al. 2010). Resource managers can use a VOR-based monitoring protocol to prevent residual vegetation from being reduced by over grazing where resource values are being lost or damaged. Retaining adequate residual vegetation and structure reduces soil erosion by both wind and water, soil surface temperature, loss of soil moisture and increases soil organic matter (Blackburn 1983; Stubbendieck et al. 1989; Stubbendieck and Reese 1992; Re-ese et al. 2001; Linse et al. 2001). Adequate residual vegetation provides benefits not only for plants and soils, but also structural diversity for wildlife.
Utilization of herbage is often estimated using subjective ocular methods without correction factors for current residual vegetation or adequate sample size, producing utilization estimates that are highly variable among observers (Schultz et al. 1961; Kershaw 1973; Block et al. 1987; Irving et al. 1995). Our protocol developed for use with the Robel pole provides accurate, precise and cost effective information. Moreover, measuring residual standing herbage rather than utilization results in more consistent management (Uresk and Juntti 2008; Uresk et al. 2010).
A mosaic of resource categories based on VOR and standing herbage provides a full range of plant structure that would maximize plant and animal diversity (Holecheck et al. 1998; Vodehnal et al. 2009; Benkobi et al. 2007; Fritcher et al. 2004). For general resource management, Kershaw (1973) and Mueller-Dombnois and Ellenberg (1974) recommend approximately 10-15% standing herbage in both tall and short resource categories and 70% in the intermediate category. However, management of wildlife based on VOR and standing herbage will vary by animal species. For sharp-tailed grouse, an important upland game species, nesting success generally requires light or ungrazed areas. Thus it would be prudent to manage at approximately VOR band 4 with fall measurements for spring nesting (> 8.6 cm of residual herbage; Prose et al. 2002) and up to band 5 (13 cm) for nest site selection. For prairie grouse Vodehnal et al. (2009) recommend a diversity of resource categories and plant species composition over the landscape
For monitoring vegetation, the Robel pole with 2.54 cm bands as modified by Benkobi et al.(2000) is less precise and accurate than poles with 1.27 cm bands (Uresk and Benzon 2007; Uresk and Juntti 2008; Uresk et al. 2010). My recommendation, therefore, is to use 1.27 cm bands for future monitoring and estimation of standing herbage.
Proceedings of the South Dakota Academy of Science, Vol. 91 (2012) 83
ACKNOWLEDGEMENTS
Thanks are extended to Nebraska National Forest for providing partial fund-ing for the original research (Benkobi et al. 2000) under cooperative agreement number 28-A3-746.
LITERATURE CITED
Ball, G.H., and D.J. Hall. 1967. A clustering technique for summarizing multi-variate data. Behavioral Science 12:153-155.
Barnes, P. W., and A. T. Harrison. 1982. Species distribution and community organization in a Nebraska Sandhills mixed prairie as influenced by plant/soilwater relations. Oecologia 52:192-201.
Benkobi, L., D.W. Uresk, G. Schenbeck and R.M. King. 2000. Protocol for monitoring standing crop in grasslands using visual obstruction. Journal of Range Management 53:627-633.
Benkobi, L., D.W. Uresk and R.D. Child2007. Ecological classification and monitoring model for the Wyoming Big Sagebrush shrubsteppe habitat type of northeastern Wyoming. Western North American Naturalist 67:347-358.
Blackburn, W.H. 1983. Livestock grazing impacts on watersheds. Rangelands 5:123-125.
Bleed, A., and C. Flowerday. 1990. An atlas of the Sand Hills. Conservation and Survey Division Institute of Agriculture and Natural Resources University of Nebraska-Lincoln. Resource Atlas No. 5a.
Block, W.M., K.A. With and M.L. Morrison. 1987. On measuring bird habitat: influence of observer variability and sample size. The Condor 89:241-251.
Burzlaff, D.F. 1962. A soil and vegetation inventory and analysis of three Ne-braska sandhills range sites. Nebraska Agriculture Experiment Station Research Bulletin 206. Lincoln, Nebraska.
del Morel, R. 1975. Vegetation clustering by means of ISODATA: Revision by multiple discriminant analysis. Vegetatio 29:179-190.
Frolik, A.L., and F.D. Keim. 1933. Native vegetation in the prairie hay district of north central Nebraska. Ecology 14:298-305.
Fritcher, S.C., M.A. Rumble and L.D. Flake. 2004. Grassland bird densities in seral stages of mixed-grass prairie. Journal of Range Management 57:351-357.
Gilbert, W.L., L.J. Perry, Jr. and J. Stubbendieck. 1979. Dry matter accumula-tion of four warm season grasses in the Nebraska Sandhills. Journal of Range Management 32:52-58.
Great Plains Flora Association. 1986. Flora of the Great Plains. University Press of Kansas, Lawrence, Kansas. 1392 pp.
High Plains Regional Climate Center. 2011. Halsey 2W, Nebraska (253540). Available at http://www.hprcc.unl.edu/data/historical/ [Cited 20 July 2011].
Holechek J.L., H. Gomes, F. Molinar, and D. Galt. 1998. Grazing intensity: Critique and Approach. Rangelands 20:15-18.

84 Proceedings of the South Dakota Academy of Science, Vol. 91 (2012)
Irving, B.D., P.L. Ruthledge, A.W. Bailey, M.A. Neath and D.S. Chanasyk. 1995. Grass utilization and grazing distribution within intensively managed fields in Central Alberta. Journal of Range Management 48:358-361.
Kershaw, K.A. 1973. Quantitative and dynamic plant ecology, second edition. American Elsevier Publishing Company, Incorporated. New York.308 pp.
Linse, S.J., D.E. Mergen, J.L. Smith and M.J. Trlica. 2001. Upland erosion under a simulated most damaging storm. Journal of Range Management 54:356-361.
Mueller-Dombois, D. and H. Ellenberg. 1974. Aims and methods of vegetation ecology. John Wiley & Sons., New York. 547 pp.
Potvin, M.A., and A.T. Harrison. 1984. Vegetation and litter changes of a Ne-braska sandhills prairie protected from grazing. Journal of Range Manage-ment 37:55-58
Prose, B.L., B.S. Cade and D. Hein. 2002. Selection of nesting habitat by sharp-tailed grouse in the Nebraska Sandhills. Prairie Naturalist 34:85-105.
Reece, P.E, J.D. Volesky and W.H. Schact. 2001. Cover for wildlife after summer grazing on Sandhills rangeland. Journal of Range Management: 54:126-131.
Robel, R.J., J.N. Briggs, A.D. Dayton and L.C. Hulbert. 1970. Relationships between visual obstruction measurements and weight of grassland vegeta-tion. Journal of Range Management 23:295-297.
Schultz, A.M., R.P. Gibbens and L. Debano. 1961. Artificial populations for teaching and testing range techniques. Journal of Range Management 14:236-242.
SPSS. 2003. SPSS Base 12.0 for Windows User Guide. SPSS Inc. Chicago, Il-linois.
Steel, R.G., and J.H. Torrie. 1980. Principles and procedures of statistics, 2nd ed.
McGraw-Hill, New York, New York. 633 pp.Stubbendieck, J.L.,T.R. Flessner and R.R. Weedon. 1989. Blowouts in the Ne-
braska sandhills: The habitat of Penstemon haydenii. Pages 223-225 in: Pro-ceedings of the Eleventh North American Prairie Conference. Ed. T.B.Bragg and J. Stubbendieck, Lincoln Nebraska: University of Nebraska-Lincoln.
Stubbendieck, J.L., and P.E. Reece. 1992. Nebraska handbook of range manage-ment. Historical materials from University of Nebraska-Lincoln ex-tension. EC92-124. 66 pp.
Uresk, D.W. 2012. Monitoring standing herbage of mid-grass prairie on the Fort Pierre National Grassland, South Dakota. Prairie Naturalist 44: 39-46.
Uresk, D.W., and T.A. Benzon. 2007. Monitoring with a modified Robel pole on meadows in the central Black Hills of South Dakota. Western North American Naturalist 67:46-50.
Uresk, D.W., and T.M. Juntti. 2008. Monitoring Idaho fescue grasslands in the Big HornMountains, Wyoming, with a modified Robel pole. Western North American Naturalist 68:1-7.
Uresk, D.W., T. Juntti and J. Javersak. 2010. Monitoring standing herbage on granitic soils in the Big Horn Mountains, Wyoming, USA. Grassland Sci-ence 56: 189-193.
Proceedings of the South Dakota Academy of Science, Vol. 91 (2012) 85
USDA-NRCS. 2001. Ecological site description. R065XY032NE. Nebraska Sand Hills Technical Guide Section IIE, MRLA 65-Sandy. USDA NRCS.
Vermeire,L.T., and R.L. Gillen. 2000. Estimating herbage standing crop with visual obstruction in tall grass prairie. Journal of Range Management 54:57-60.
Vodehnal, W.L., J.B. Haufler, and R.K. Baydack. 2009. A grassland conservation plan for praire grouse in North America. Pages 31-43. in: Transactions of the seventy-third North American wildlife and natural resources conference. J. Rahmn editor. Wildlife Management Institute. Washington DC. 264 pp.
Volesky, J.D., W.H. Schacht, and P.E. Reece. 1999. Leaf area, visual obstruction, and standing crop relationships on Sandhills Rangeland. Journal of Range Management 52:494-499.
Volesky, J.D., W.H. Schact, P.E. Reece, and T.J. Vaughn. 2005. Spring growth and use of cool-season graminoids in the Nebraska Sandhills. Rangeland Ecology Management 58:385-392.
Volesky, J.D., W.H. Schact, P.E. Reece, and T.J. Vaughn. 2007. Diet composi-tion of cattle grazing sandhills range during spring. Rangeland Ecology Management 60:65-70.

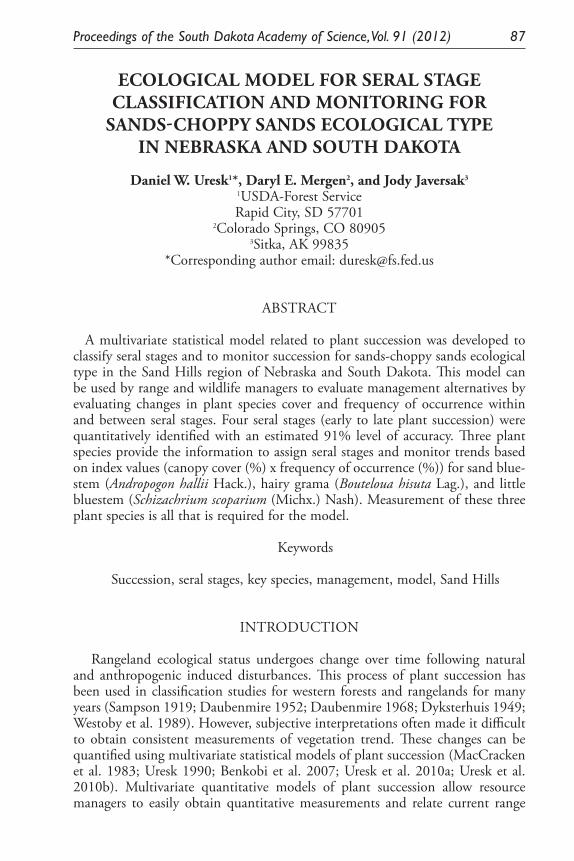
Proceedings of the South Dakota Academy of Science, Vol. 91 (2012) 87
ECOLOGICAL MODEL FOR SERAL STAGE CLASSIFICATION AND MONITORING FOR
SANDS-CHOPPY SANDS ECOLOGICAL TYPE IN NEBRASKA AND SOUTH DAKOTA
Daniel W. Uresk1*, Daryl E. Mergen2, and Jody Javersak3
1USDA-Forest ServiceRapid City, SD 57701
2Colorado Springs, CO 809053Sitka, AK 99835
*Corresponding author email: [email protected]
ABSTRACT
A multivariate statistical model related to plant succession was developed to classify seral stages and to monitor succession for sands-choppy sands ecological type in the Sand Hills region of Nebraska and South Dakota. This model can be used by range and wildlife managers to evaluate management alternatives by evaluating changes in plant species cover and frequency of occurrence within and between seral stages. Four seral stages (early to late plant succession) were quantitatively identified with an estimated 91% level of accuracy. Three plant species provide the information to assign seral stages and monitor trends based on index values (canopy cover (%) x frequency of occurrence (%)) for sand blue-stem (Andropogon hallii Hack.), hairy grama (Bouteloua hisuta Lag.), and little bluestem (Schizachrium scoparium (Michx.) Nash). Measurement of these three plant species is all that is required for the model.
Keywords
Succession, seral stages, key species, management, model, Sand Hills
INTRODUCTION
Rangeland ecological status undergoes change over time following natural and anthropogenic induced disturbances. This process of plant succession has been used in classification studies for western forests and rangelands for many years (Sampson 1919; Daubenmire 1952; Daubenmire 1968; Dyksterhuis 1949; Westoby et al. 1989). However, subjective interpretations often made it difficult to obtain consistent measurements of vegetation trend. These changes can be quantified using multivariate statistical models of plant succession (MacCracken et al. 1983; Uresk 1990; Benkobi et al. 2007; Uresk et al. 2010a; Uresk et al. 2010b). Multivariate quantitative models of plant succession allow resource managers to easily obtain quantitative measurements and relate current range
88 Proceedings of the South Dakota Academy of Science, Vol. 91 (2012)
status to management effects at one point in time and trends over a long-term period on a repeatable basis.
Over the last few decades, rangeland classification concepts have provided resource managers a framework for evaluating vegetation changes in response to natural events and to management activities (USDA-SCS 1976; Westoby et al. 1989; Holechek et al. 1989). Other multivariate and ordination techniques (Kershaw 1973; Mueller-Dombois and Ellenberg 1974; del Moral 1975) refined vegetation classification, but generally lacked practical tools such as quantitative models for range managers to quantify succession. Our quantitative model can be used by managers to determine seral stage classification and to determine suc-cession and retrogression trends within and among seral stages.
State and transition models for plant succession have received much attention in recent years, primarily as an approach in ecological processes for plants (Frie-del 1991; Samuel and Hart 1994; Bestelmyer et al. 2003; Briske et al. 2005). State and transition models are conceptual models that can include vegetation changes as a result of fire, grazing, climate, and management activities. The multivariate model we have developed is similar in concept but quantitatively defines discrete categories for community phases within a state and transition model of plant succession (Uresk 1990; Benkobi et al. 2007; Uresk et al. 2010a; Uresk et al. 2010b). These models are not linear and do not require a linear pro-gression of plant succession from early to late by going through all seral stages. Plant succession may go from early to late bypassing middle seral stages. The current study provides discrete categories based upon a few fundamental eco-logical processes and relationships of key plant indicators for transition or plant succession (Stringham, et al. 2003; Bestelmyer et al. 2003). The objectives of the present study were to (1) develop a model for monitoring the sands-choppy sands ecological type, (2) define seral stages, and (3) provide a sampling and monitoring protocol. Common grasses that define sands-choppy sands ecological type include sand bluestem (Andropogon hallii Hack.), little bluestem (Schizachy-rium scoparium (Michx.) Nash), prairie sandreed (Calamovilfa longifolia (Hook.) Scribn., needle-and-thread grass (Heterostipa comata Trin. & Rupr.) Barkworth), hairy grama (Bouteloua hirsuta Lag.), and blue grama (Bouteloua gracilis (Kunth) Lag. ex Griffiths).
STUDY AREA
The study was conducted on the Nebraska National Forest in the Sand Hills of central Nebraska. The Sand Hills in Nebraska include sand dune hills to sandy basins and valleys. This study focused on vegetation in the sands and choppy sands ecological sites. A map and detailed site descriptions of both ecological sites are presented in USDA-NRCS (2000, 2001). The Sand Hill region covers approximately 5 million hectares (19,300 mi2) in southern South Dakota and Central Nebraska (Bleed and Flowerday 1990). The specific study site is located in the north-central part of Nebraska, on the Samuel R. McKelvie District, and encompasses about 46,280 hectares (115,700 acres). The Bessey District has an additional 36,183 hectares (90,456 acres).
Proceedings of the South Dakota Academy of Science, Vol. 91 (2012) 89
The climate is described as semi-arid (Burzlaf 1962) with a mean annual precipitation average of 53 cm (21 in) from three weather stations at Valentine, Halsey, and Nenzel from 1903-2006 (HPRCC 2007). Annual precipitation is 41 cm (16 inches) in the western Sand Hills to near 61 cm (24 inches) in the south-east part of the area. Seventy to 85% percent of the precipitation falls during the growing season (April-September) as short duration, intense thunderstorms. Average monthly temperature ranges from a low of -13 °C (9 °F) in the winter to a high of 32 °C (89 °F) during the summer.
Vegetation—Sand Hills flora has been described numerous times over the last century. An overall review of the ecology for plants and animals, soils, livestock grazing, climate, geology, hydrology, streams and lakes in the Sand Hills is pre-sented by Bleed and Flowerday (1990). Stubbendieck et al. (1989) provided an additional review of the literature. Burzlaff (1962) divided into range sites the vegetation ground cover as a measure of forage production. Three range sites (dry valley, rolling sands, and choppy sands) describe much of the vegetation complex within the Sandhills uplands.
This study focused on vegetation in the sands and choppy sands ecological sites (USDA-NRCS 2000, 2001). Dominant plants include sand bluestem, little bluestem prairie sandreed, needle-and-thread grass, hairy grama, blue grama and sedge (Carex spp). Common forbs are green sagewort (Artemisia spp.), lemon scurfpea (Psoraidium lanceolata (Pursh) Rydb.) and cuman ragweed (Ambrosia psilostachya DC.). Plant nomenclature follows USDA-NRCS (2012).
METHODS
Data collection for canopy cover and frequency of occurrence followed Daubenmire (1959), and statistical analyses followed procedures developed by Uresk (1990). Data were collected on 61 macroplots (sites) during the summer of 1990. About half the plots were collected throughout the sands and the other half collected throughout the choppy sands ecological sites on Nebraska Na-tional Forest lands. Each macroplot was randomly selected within one of three perceived strata of early, mid, or late seral stages (Cochran 1977; Thompson et al 1998; Levy and Lemeshow 1999). At each macroplot, two parallel transects 30 m (99 ft.) long were spaced 20 m (66 ft.) apart. Canopy cover and frequency of occurrence were obtained for individual plant species and other variables (total cover, bare ground, and litter) sampled at 1-m intervals along each 30 m transect. All macroplot data for canopy cover and frequency of occurrence were averaged by site. An index was created based on the product of the mean site cover and the mean site frequency. Index = ((transect 1 cover + transect 2 cover)/2) * (transect 1 frequency + transect 2 frequency )/2)) (Uresk 1990). Data were analyzed with SPSS (1992) and SPSS (2003).
Chi-square analysis was applied to plant index data and evaluated for differ-ences between sands and choppy sands ecological types. Because reduction of variables is useful when applying clustering techniques, we used stepwise dis-criminant analyses to reduce the number of variables derived from the perceived three seral satges (Uresk 1990). This procedure was used to obtain the number
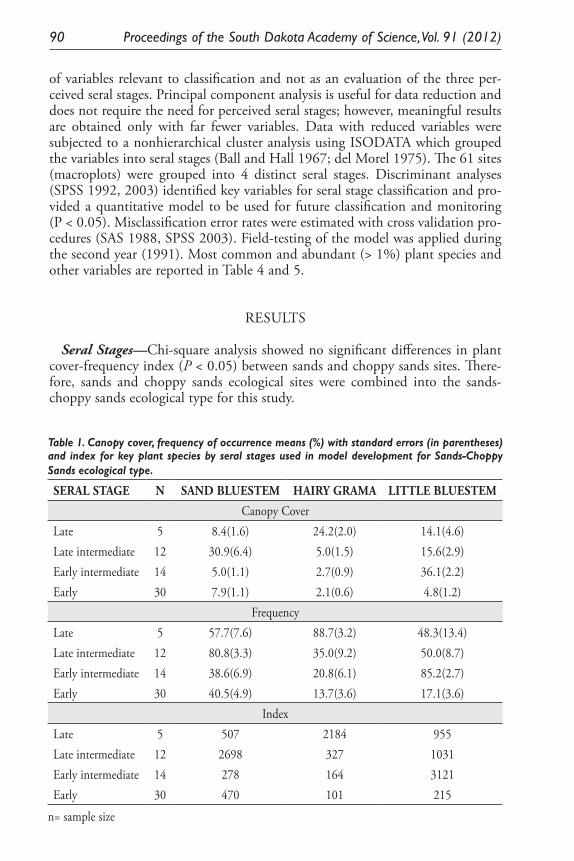
90 Proceedings of the South Dakota Academy of Science, Vol. 91 (2012)
of variables relevant to classification and not as an evaluation of the three per-ceived seral stages. Principal component analysis is useful for data reduction and does not require the need for perceived seral stages; however, meaningful results are obtained only with far fewer variables. Data with reduced variables were subjected to a nonhierarchical cluster analysis using ISODATA which grouped the variables into seral stages (Ball and Hall 1967; del Morel 1975). The 61 sites (macroplots) were grouped into 4 distinct seral stages. Discriminant analyses (SPSS 1992, 2003) identified key variables for seral stage classification and pro-vided a quantitative model to be used for future classification and monitoring (P < 0.05). Misclassification error rates were estimated with cross validation pro-cedures (SAS 1988, SPSS 2003). Field-testing of the model was applied during the second year (1991). Most common and abundant (> 1%) plant species and other variables are reported in Table 4 and 5.
RESULTS
Seral Stages—Chi-square analysis showed no significant differences in plant cover-frequency index (P < 0.05) between sands and choppy sands sites. There-fore, sands and choppy sands ecological sites were combined into the sands-choppy sands ecological type for this study.
Table 1. Canopy cover, frequency of occurrence means (%) with standard errors (in parentheses) and index for key plant species by seral stages used in model development for Sands-Choppy Sands ecological type.
SERAL STAGE N SAND BLUESTEM HAIRY GRAMA LITTLE BLUESTEM
Canopy CoverLate 5 8.4(1.6) 24.2(2.0) 14.1(4.6)Late intermediate 12 30.9(6.4) 5.0(1.5) 15.6(2.9)Early intermediate 14 5.0(1.1) 2.7(0.9) 36.1(2.2)Early 30 7.9(1.1) 2.1(0.6) 4.8(1.2)
FrequencyLate 5 57.7(7.6) 88.7(3.2) 48.3(13.4)Late intermediate 12 80.8(3.3) 35.0(9.2) 50.0(8.7)Early intermediate 14 38.6(6.9) 20.8(6.1) 85.2(2.7)Early 30 40.5(4.9) 13.7(3.6) 17.1(3.6)
IndexLate 5 507 2184 955Late intermediate 12 2698 327 1031Early intermediate 14 278 164 3121Early 30 470 101 215
n= sample size
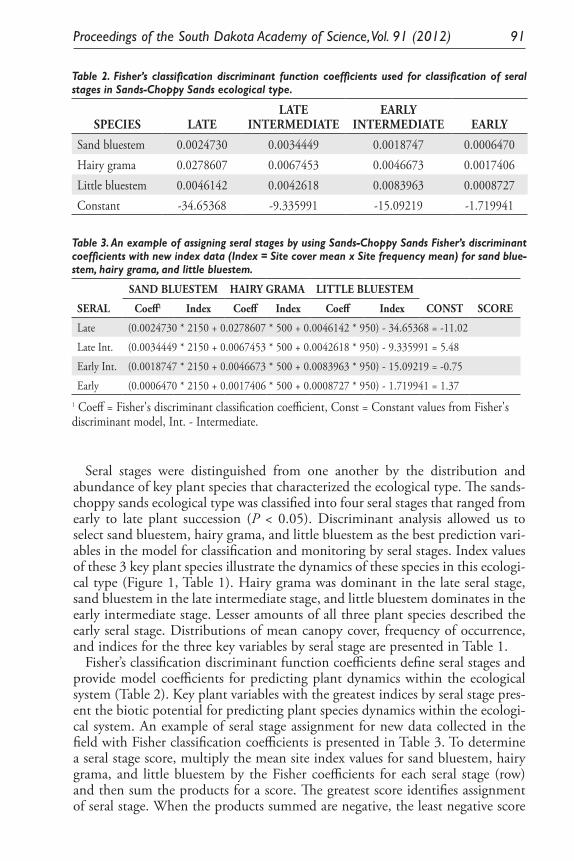
Proceedings of the South Dakota Academy of Science, Vol. 91 (2012) 91
Seral stages were distinguished from one another by the distribution and abundance of key plant species that characterized the ecological type. The sands-choppy sands ecological type was classified into four seral stages that ranged from early to late plant succession (P < 0.05). Discriminant analysis allowed us to select sand bluestem, hairy grama, and little bluestem as the best prediction vari-ables in the model for classification and monitoring by seral stages. Index values of these 3 key plant species illustrate the dynamics of these species in this ecologi-cal type (Figure 1, Table 1). Hairy grama was dominant in the late seral stage, sand bluestem in the late intermediate stage, and little bluestem dominates in the early intermediate stage. Lesser amounts of all three plant species described the early seral stage. Distributions of mean canopy cover, frequency of occurrence, and indices for the three key variables by seral stage are presented in Table 1.
Fisher’s classification discriminant function coefficients define seral stages and provide model coefficients for predicting plant dynamics within the ecological system (Table 2). Key plant variables with the greatest indices by seral stage pres-ent the biotic potential for predicting plant species dynamics within the ecologi-cal system. An example of seral stage assignment for new data collected in the field with Fisher classification coefficients is presented in Table 3. To determine a seral stage score, multiply the mean site index values for sand bluestem, hairy grama, and little bluestem by the Fisher coefficients for each seral stage (row) and then sum the products for a score. The greatest score identifies assignment of seral stage. When the products summed are negative, the least negative score
Table 2. Fisher’s classification discriminant function coefficients used for classification of seral stages in Sands-Choppy Sands ecological type.
SPECIES LATE LATE
INTERMEDIATEEARLY
INTERMEDIATE EARLY
Sand bluestem 0.0024730 0.0034449 0.0018747 0.0006470Hairy grama 0.0278607 0.0067453 0.0046673 0.0017406Little bluestem 0.0046142 0.0042618 0.0083963 0.0008727Constant -34.65368 -9.335991 -15.09219 -1.719941
Table 3. An example of assigning seral stages by using Sands-Choppy Sands Fisher’s discriminant coefficients with new index data (Index = Site cover mean x Site frequency mean) for sand blue-stem, hairy grama, and little bluestem.
SERAL
SAND BLUESTEM HAIRY GRAMA LITTLE BLUESTEM
CONST SCORECoeff1 Index Coeff Index Coeff Index
Late (0.0024730 * 2150 + 0.0278607 * 500 + 0.0046142 * 950) - 34.65368 = -11.02
Late Int. (0.0034449 * 2150 + 0.0067453 * 500 + 0.0042618 * 950) - 9.335991 = 5.48
Early Int. (0.0018747 * 2150 + 0.0046673 * 500 + 0.0083963 * 950) - 15.09219 = -0.75
Early (0.0006470 * 2150 + 0.0017406 * 500 + 0.0008727 * 950) - 1.719941 = 1.371 Coeff = Fisher's discriminant classification coefficient, Const = Constant values from Fisher's discriminant model, Int. - Intermediate.
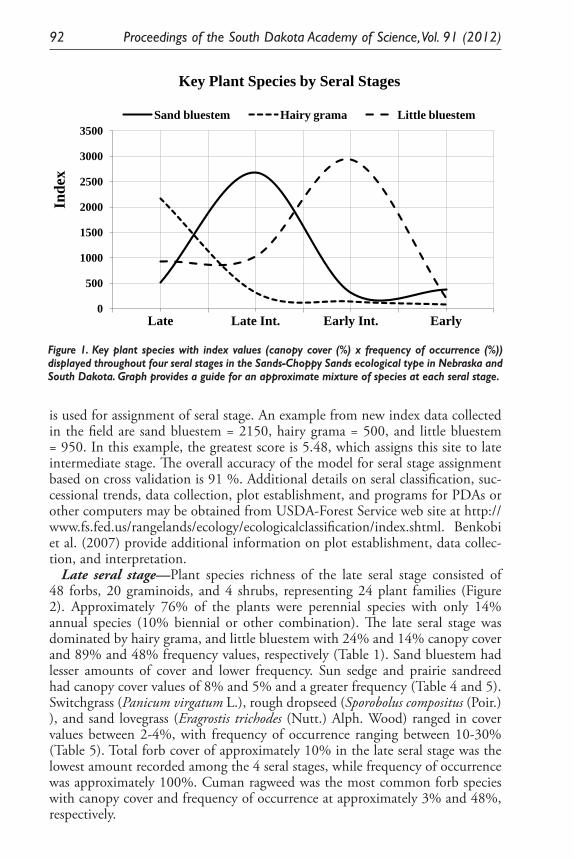
92 Proceedings of the South Dakota Academy of Science, Vol. 91 (2012)
is used for assignment of seral stage. An example from new index data collected in the field are sand bluestem = 2150, hairy grama = 500, and little bluestem = 950. In this example, the greatest score is 5.48, which assigns this site to late intermediate stage. The overall accuracy of the model for seral stage assignment based on cross validation is 91 %. Additional details on seral classification, suc-cessional trends, data collection, plot establishment, and programs for PDAs or other computers may be obtained from USDA-Forest Service web site at http://www.fs.fed.us/rangelands/ecology/ecologicalclassification/index.shtml. Benkobi et al. (2007) provide additional information on plot establishment, data collec-tion, and interpretation.
Late seral stage—Plant species richness of the late seral stage consisted of 48 forbs, 20 graminoids, and 4 shrubs, representing 24 plant families (Figure 2). Approximately 76% of the plants were perennial species with only 14% annual species (10% biennial or other combination). The late seral stage was dominated by hairy grama, and little bluestem with 24% and 14% canopy cover and 89% and 48% frequency values, respectively (Table 1). Sand bluestem had lesser amounts of cover and lower frequency. Sun sedge and prairie sandreed had canopy cover values of 8% and 5% and a greater frequency (Table 4 and 5). Switchgrass (Panicum virgatum L.), rough dropseed (Sporobolus compositus (Poir.) ), and sand lovegrass (Eragrostis trichodes (Nutt.) Alph. Wood) ranged in cover values between 2-4%, with frequency of occurrence ranging between 10-30% (Table 5). Total forb cover of approximately 10% in the late seral stage was the lowest amount recorded among the 4 seral stages, while frequency of occurrence was approximately 100%. Cuman ragweed was the most common forb species with canopy cover and frequency of occurrence at approximately 3% and 48%, respectively.
Figure 1. Key plant species with index values (canopy cover (%) x frequency of occurrence (%)) displayed throughout four seral stages in the Sands-Choppy Sands ecological type in Nebraska and South Dakota. Graph provides a guide for an approximate mixture of species at each seral stage.
0
500
1000
1500
2000
2500
3000
3500
Late Late Int. Early Int. Early
Inde
x
Key Plant Species by Seral Stages
Sand bluestem Hairy grama Little bluestem
Figure 1. Key plant species with index values (canopy cover (%) x frequency of occurrence (%)) displayed throughout four seral stages in the Sands-Choppy Sands ecological type in Nebraska and South Dakota. Graph provides a guide for an approximate mixture of species at each seral stage.
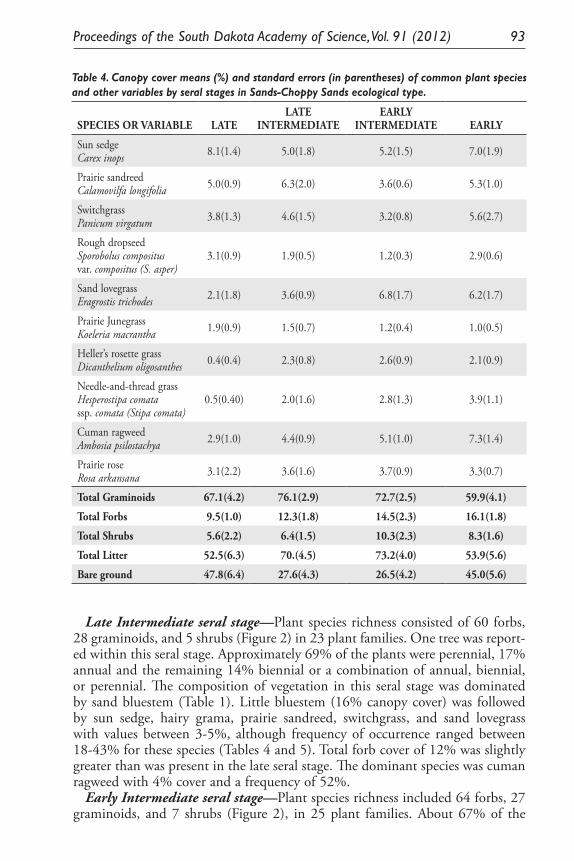
Proceedings of the South Dakota Academy of Science, Vol. 91 (2012) 93
Late Intermediate seral stage—Plant species richness consisted of 60 forbs, 28 graminoids, and 5 shrubs (Figure 2) in 23 plant families. One tree was report-ed within this seral stage. Approximately 69% of the plants were perennial, 17% annual and the remaining 14% biennial or a combination of annual, biennial, or perennial. The composition of vegetation in this seral stage was dominated by sand bluestem (Table 1). Little bluestem (16% canopy cover) was followed by sun sedge, hairy grama, prairie sandreed, switchgrass, and sand lovegrass with values between 3-5%, although frequency of occurrence ranged between 18-43% for these species (Tables 4 and 5). Total forb cover of 12% was slightly greater than was present in the late seral stage. The dominant species was cuman ragweed with 4% cover and a frequency of 52%.
Early Intermediate seral stage —Plant species richness included 64 forbs, 27 graminoids, and 7 shrubs (Figure 2), in 25 plant families. About 67% of the
Table 4. Canopy cover means (%) and standard errors (in parentheses) of common plant species and other variables by seral stages in Sands-Choppy Sands ecological type.
SPECIES OR VARIABLE LATE LATE
INTERMEDIATE EARLY
INTERMEDIATE EARLY
Sun sedgeCarex inops 8.1(1.4) 5.0(1.8) 5.2(1.5) 7.0(1.9)
Prairie sandreedCalamovilfa longifolia 5.0(0.9) 6.3(2.0) 3.6(0.6) 5.3(1.0)
SwitchgrassPanicum virgatum 3.8(1.3) 4.6(1.5) 3.2(0.8) 5.6(2.7)
Rough dropseedSporobolus compositusvar. compositus (S. asper)
3.1(0.9) 1.9(0.5) 1.2(0.3) 2.9(0.6)
Sand lovegrassEragrostis trichodes 2.1(1.8) 3.6(0.9) 6.8(1.7) 6.2(1.7)
Prairie JunegrassKoeleria macrantha 1.9(0.9) 1.5(0.7) 1.2(0.4) 1.0(0.5)
Heller’s rosette grassDicanthelium oligosanthes 0.4(0.4) 2.3(0.8) 2.6(0.9) 2.1(0.9)
Needle-and-thread grassHesperostipa comatassp. comata (Stipa comata)
0.5(0.40) 2.0(1.6) 2.8(1.3) 3.9(1.1)
Cuman ragweedAmbosia psilostachya 2.9(1.0) 4.4(0.9) 5.1(1.0) 7.3(1.4)
Prairie roseRosa arkansana 3.1(2.2) 3.6(1.6) 3.7(0.9) 3.3(0.7)
Total Graminoids 67.1(4.2) 76.1(2.9) 72.7(2.5) 59.9(4.1)
Total Forbs 9.5(1.0) 12.3(1.8) 14.5(2.3) 16.1(1.8)
Total Shrubs 5.6(2.2) 6.4(1.5) 10.3(2.3) 8.3(1.6)
Total Litter 52.5(6.3) 70.(4.5) 73.2(4.0) 53.9(5.6)
Bare ground 47.8(6.4) 27.6(4.3) 26.5(4.2) 45.0(5.6)
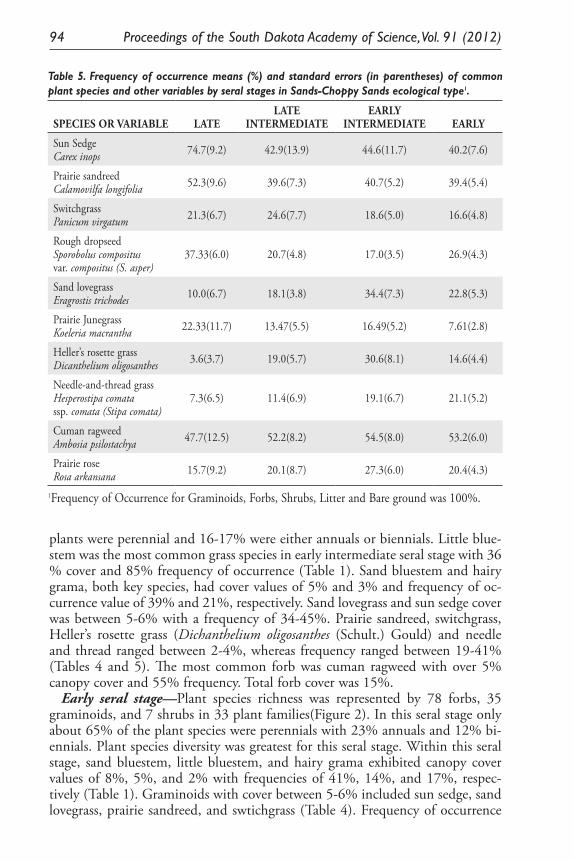
94 Proceedings of the South Dakota Academy of Science, Vol. 91 (2012)
plants were perennial and 16-17% were either annuals or biennials. Little blue-stem was the most common grass species in early intermediate seral stage with 36 % cover and 85% frequency of occurrence (Table 1). Sand bluestem and hairy grama, both key species, had cover values of 5% and 3% and frequency of oc-currence value of 39% and 21%, respectively. Sand lovegrass and sun sedge cover was between 5-6% with a frequency of 34-45%. Prairie sandreed, switchgrass, Heller’s rosette grass (Dichanthelium oligosanthes (Schult.) Gould) and needle and thread ranged between 2-4%, whereas frequency ranged between 19-41% (Tables 4 and 5). The most common forb was cuman ragweed with over 5% canopy cover and 55% frequency. Total forb cover was 15%.
Early seral stage—Plant species richness was represented by 78 forbs, 35 graminoids, and 7 shrubs in 33 plant families(Figure 2). In this seral stage only about 65% of the plant species were perennials with 23% annuals and 12% bi-ennials. Plant species diversity was greatest for this seral stage. Within this seral stage, sand bluestem, little bluestem, and hairy grama exhibited canopy cover values of 8%, 5%, and 2% with frequencies of 41%, 14%, and 17%, respec-tively (Table 1). Graminoids with cover between 5-6% included sun sedge, sand lovegrass, prairie sandreed, and swtichgrass (Table 4). Frequency of occurrence
Table 5. Frequency of occurrence means (%) and standard errors (in parentheses) of common plant species and other variables by seral stages in Sands-Choppy Sands ecological type1.
SPECIES OR VARIABLE LATE LATE
INTERMEDIATE EARLY
INTERMEDIATE EARLY
Sun SedgeCarex inops 74.7(9.2) 42.9(13.9) 44.6(11.7) 40.2(7.6)
Prairie sandreedCalamovilfa longifolia 52.3(9.6) 39.6(7.3) 40.7(5.2) 39.4(5.4)
SwitchgrassPanicum virgatum 21.3(6.7) 24.6(7.7) 18.6(5.0) 16.6(4.8)
Rough dropseedSporobolus compositus var. compositus (S. asper)
37.33(6.0) 20.7(4.8) 17.0(3.5) 26.9(4.3)
Sand lovegrassEragrostis trichodes 10.0(6.7) 18.1(3.8) 34.4(7.3) 22.8(5.3)
Prairie JunegrassKoeleria macrantha 22.33(11.7) 13.47(5.5) 16.49(5.2) 7.61(2.8)
Heller’s rosette grassDicanthelium oligosanthes 3.6(3.7) 19.0(5.7) 30.6(8.1) 14.6(4.4)
Needle-and-thread grassHesperostipa comata ssp. comata (Stipa comata)
7.3(6.5) 11.4(6.9) 19.1(6.7) 21.1(5.2)
Cuman ragweedAmbosia psilostachya 47.7(12.5) 52.2(8.2) 54.5(8.0) 53.2(6.0)
Prairie roseRosa arkansana 15.7(9.2) 20.1(8.7) 27.3(6.0) 20.4(4.3)
1Frequency of Occurrence for Graminoids, Forbs, Shrubs, Litter and Bare ground was 100%.
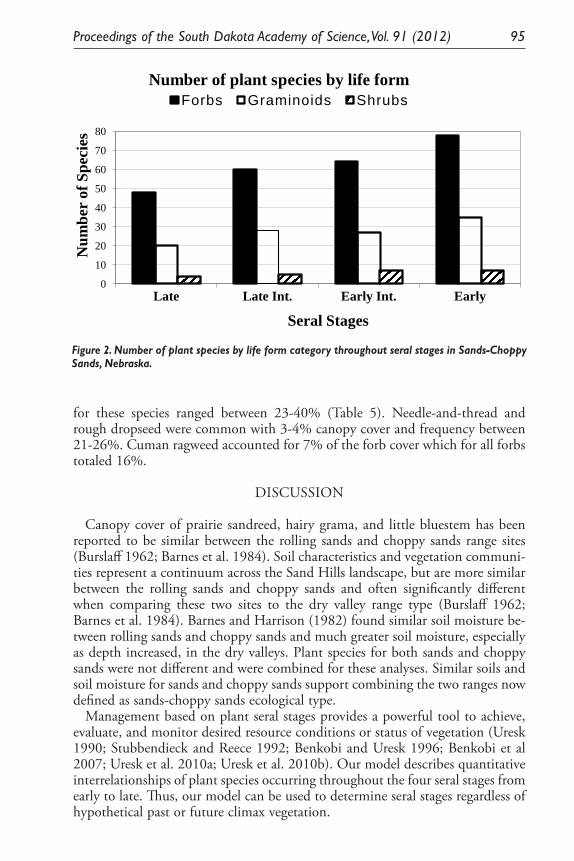
Proceedings of the South Dakota Academy of Science, Vol. 91 (2012) 95
for these species ranged between 23-40% (Table 5). Needle-and-thread and rough dropseed were common with 3-4% canopy cover and frequency between 21-26%. Cuman ragweed accounted for 7% of the forb cover which for all forbs totaled 16%.
DISCUSSION
Canopy cover of prairie sandreed, hairy grama, and little bluestem has been reported to be similar between the rolling sands and choppy sands range sites (Burslaff 1962; Barnes et al. 1984). Soil characteristics and vegetation communi-ties represent a continuum across the Sand Hills landscape, but are more similar between the rolling sands and choppy sands and often significantly different when comparing these two sites to the dry valley range type (Burslaff 1962; Barnes et al. 1984). Barnes and Harrison (1982) found similar soil moisture be-tween rolling sands and choppy sands and much greater soil moisture, especially as depth increased, in the dry valleys. Plant species for both sands and choppy sands were not different and were combined for these analyses. Similar soils and soil moisture for sands and choppy sands support combining the two ranges now defined as sands-choppy sands ecological type.
Management based on plant seral stages provides a powerful tool to achieve, evaluate, and monitor desired resource conditions or status of vegetation (Uresk 1990; Stubbendieck and Reece 1992; Benkobi and Uresk 1996; Benkobi et al 2007; Uresk et al. 2010a; Uresk et al. 2010b). Our model describes quantitative interrelationships of plant species occurring throughout the four seral stages from early to late. Thus, our model can be used to determine seral stages regardless of hypothetical past or future climax vegetation.
Figure 2. Number of plant species by life form category throughout seral stages in Sands-Choppy Sands, Nebraska.
0
10
20
30
40
50
60
70
80
Late Late Int. Early Int. Early
Num
ber
of S
peci
es
Seral Stages
Number of plant species by life form Forbs Graminoids Shrubs
Figure 2. Number of plant species by life form category throughout seral stages in Sands-Choppy Sands, Nebraska.
96 Proceedings of the South Dakota Academy of Science, Vol. 91 (2012)
Managing for all four seral stages can be viewed as a management alternative. Inclusion of multiple seral stages is known to increase plant and animal diversity over the landscape (Rumble and Gobeille 1995; Benkobi et al. 2007; Fritcher et al. 2004). Because one seral stage is not practical for multiple-use management, the entire range of seral stages (from early to late) is desirable to accommodate the greatest plant species diversity, wildlife habitat and diversity, livestock pro-duction, and recreation. In the sands-choppy sands ecological type, late and intermediate stages of succession may be best for livestock production due to the greater availability of forage species. The early seral stage may be more important for specific wildlife species and rare plant species such as blowout penstemon (Penstemon haydenii S.Watson) (Stubbendieck et al. 1989).
Wildlife managers have recognized that wildlife densities, diversity, and plant succession are related and important for wildlife management. In addition, management of sands-choppy sands rangelands with seral stages provides a man-agement tool that can be used across the landscape. The landscape scale could be the best level for managers to determine their management objectives. Ap-proximately 10-15% of the landscape is recommended to be maintained in the early and late stages with the remainder of the area in the intermediate categories (Kershaw 1973; Mueller-Dombois and Ellenberg 1974). This would provide a mixture of habitats on the landscape to maintain plant and animal diversity (Uresk 1990; Benkobi et al. 2007; Fritcher et al. 2004; Rumble and Gobeille 1995; Vodehnal et al. 2009).
Bird species diversity was significantly greater in early seral stage compared to late-intermediate seral stage on Ft. Pierre National Grasslands in South Dakota (Fritcher et al. 2004). Birds with tall vegetation or residual vegetation (litter) habitat requirements were more abundant in later seral stages while birds that required sparse vegetation cover were common in the early seral stage. Therefore, all seral stages are necessary to maximize grassland bird species diversity and abundance across the landscape (Fritcher et al. 2004).
Perennial plants are generally considered more stable and fluctuate less on an annual basis compared to annuals and biennials. Land managers may consider management for later seral stages on soils more susceptible to wind erosion. Management for rare species that require specific seral stages, such as blowout penstemon which requires severe wind erosion areas (early seral), may require special management to create more habitat near known population centers to increase species abundance and viability.
Livestock grazing can be a tool to regulate changes in seral condition or status. Adjustments in timing, density, and rate of livestock grazing might result in a change to the preferred management alternative (desired seral stage) (Stubbendi-eck and Reese 1992). However, when early seral communities are the desired objective, additional management strategies or problems such as soil erosion must also be considered (Mergen et al. 2001). Although greater perennial plant cover is generally accepted as an effective method for reducing soil erosion, ef-fective management practices for controlling erosion have not been established.
The classification and monitoring model developed in this paper can be used to quantify the relationship between various grazing intensities and plant succes-sion to determine grazing levels necessary to maintain or restore a desired succes-
Proceedings of the South Dakota Academy of Science, Vol. 91 (2012) 97
sional status (management objectives) of the vegetation. In addition, information about rare plant species and wildlife activities, soil erosion and their relationships to seral stages in plant communities need to be included in a management plan (Rumble and Gobeille 1995; Fritcher et al. 2004; Vodehnal et al. 2009).
ACKNOWLEDGEMENTS
This study was completed with cooperation and partial support of the Nebras-ka National Forest System and Colorado State University, Department of Forest, Rangeland and Watershed Stewardship (28-CR3-752 and 03-JV-1221609-272). Daryl Mergen was research associate, Colorado State University, working under these agreements and was located in Colorado Springs, CO. Rudy King, Rocky Mountain Research Station statistician (retired), provided invaluable advice throughout the study. Thanks are extended to Tony Hoag for help with data collection and analyses.
LITERATURE CITED
Ball, G.H., and D.J. Hall. 1967. A clustering technique for summarizing multi-variate data. Behavioral Science 12:153-155.
Barnes, P.W., and A.T. Harrison. 1982. Species distribution and community organization in a Nebraska Sandhills mixed prairie as influenced by plant/
soilwater relations. Oecologia 52:192-201.Barnes, P.W., A.T. Harrison, and S.P. Heinisch. 1984. Vegetation patterns in
relation to topography and edaphic variation in Nebraska Sandhills prairie. Prairie Naturalist 16:145-158.
Benkobi, L., and D.W. Uresk. 1996. Seral stage classification and monitor-ing model for big sagebrush/prairie sandreed/blue grama.in: Barrow, J.R.; Durant, M.E.; Sosebe, R.E.; Tausch, R.J., editors. Shrubland ecosystem dynamics in a changing environment; Proceedings of the symposium; 1995 May 23-25; Las Cruces, NM. Gen. Tech. Rep. INT-338. Ogden, UT: U.S. Department of Agriculture, Forest Service, Intermountain Research Sta-tion.
Benkobi, L., D.W. Uresk, and R.D. Child. 2007. Ecological Classification and monitoring model for the Wyoming big sagebrush shrub-steppe habitat type of northeastern Wyoming. Western North American Naturalist 67:347-358.
Bestelmyer, B.T., J.R. Brown, K.M. Havstad, R.Alexander, G.Chavez, and J.E. Herrick.2003. Development and use of state-and-transition models for rangelands. Journal of Range Management 56:114-126.
Bleed, A. and C. Flowerday. 1990. An atlas of the Sand Hills. Conservation and Survey Division Institute of Agriculture and Natural Resources University of Nebraska-Lincoln. Resource Atlas No. 5a.
Briske, D.D., S.D. Fuhlendorf, and F.E. Smeins. 2005. State-and-transition models, thresholds, and rangeland health: a synthesis of ecological concepts and perspectives. Journal of Range Management 58:1-10.
98 Proceedings of the South Dakota Academy of Science, Vol. 91 (2012)
Burzlaff, D.F. 1962. A soil and vegetation inventory and analysis of three Nebras-ka sandhills range sites. Nebraska Agricultural Experiment Station Research Bulletin 206. Lincoln, NE.
Cochran, W.G. 1977. Sampling techniques, 3rd ed. John Wiley and Sons, New York.
Daubenmire, R, 1952. Forest vegetation of northern Idaho and adjacent Wash-ington, and its bearing on concepts of vegetation classification. Ecological Monographs 22:301-306.
Daubenmire, R. 1959. A canopy-coverage method of vegetational analysis. Northwest Science 33(1):43-64.
Daubenmire, R. 1968. Plant communities: a textbook of plant synecology. New York, Evanston and London: Harper & Row. 300 p.
del Moral, R. 1975. Vegetation clustering by means of ISODATA: revision by multiple discriminant analysis. Vegetation 29(3):179-190.
Dyksterhuis, E.J. 1949. Condition and management of range land based on quantitative ecology. Journal of Range Management 2(1):104-115.
Friedel, M.H. 1991. Range condition assessment and the concept of thresholds: A viewpoint. Journal of Range Management 44:422-433.
Fritcher, S.C., M.A. Rumble, and L.D. Flake. 2004. Grassland bird densities in seral stages of mixed-grass prairie. Journal of Range Management 57:351-357.
Holechek, J.L., R.D. Pieper,, and C.H. Herbel. 1989. Range management prin-ciples and practices. Prentice-Hall Inc. Englewood Cliffs, NJ. 501 p.
HPRCC. 2007. High Plains Regional Climate Center. Available at http://www.hprcc.unl.edu/data/historical. [Cited 28 April, 2007].
Kershaw, K.A. 1973. Quantitative and dynamic plant ecology, second edition. American Elsevier Publishing Company, Incorporated. New York. 308 pp.
Levy, P.S., and S. Lemeshow. 1999. Sampling of populations: methods and ap-plications, third edition. John Wiley and Sons Incorporated Publication, New York, New York.
MacCracken, J.G., D.W. Uresk,., and R.M. Hanson. 1983. Plant community variability on a small area in southeastern Montana. Great Basin Naturalist 43: 660-668.
Mergen, D.E., M.J. Trilica, J.L. Smith, and W.H. Blackburn. 2001. Stratification of variability in runoff and sediment yield based on vegetation characteris-tics. Journal of American Water Resource Association 37:617-628.
Mueller-Dombois, D. and H. Ellenberg. 1974. Aims and methods of vegetation ecology. John Wiley and Sons Inc., New York, NY. 547 p.
Rumble, M.A., and J.E. Gobeille. 1995. Wildlife associations in Rocky Mountain juniper in the Northern Great Plains, South Dakota. in: D.W. Shaw; E.F. Aldon; C. LoSapio, Ed. Desired future conditions for piñon-juniper eco-systems; proceedings of the symposium; 1994 August 8-12; Flagstaff,AZ. General Technical Report RM-258. Fort Collins, CO: U.S. Department of Agriculture, Forest Service, Rocky Mountain Forest and Range Experiment Station. pp.80-90.
Sampson, A.W. 1919. Plant succession in relation to range management. U.S. Department of Agriculture Bulletin No. 791. 76 p.
Proceedings of the South Dakota Academy of Science, Vol. 91 (2012) 99
Samuel, M.J., and R.H. Hart. 1994. Sixty-one years of secondary succession on rangelands of the Wyoming High Plains. Journal of Range Management 47:184-191.
SAS Institute Inc. 1988. SAS/STAT user’s guide, 6.04 ed. SAS Institute Inc., Cary, NC. 1,028 p.
SPSS 1992. SPSS/PC+ professional statistics version 5.0. Norusis, M.J./SPSS Inc. Chicago, IL.
SPSS. 2003. SPSS Base 12.0 for Windows User Guide. SPSS Inc. Chicago, Il-linois.
Stringham, T.K., W.C. Krueger, and P.L. Shaver. 2003. State and transition modeling: An ecological process approach. Journal of Range Management 56:106-113.
Stubbendieck, J.L.,T.R. Flessner and R.R. Weedon. 1989. Blowouts in the Ne-braska sandhills: The habitat of Penstemon haydenii. Pages 223-225 in: Pro-ceedings of the Eleventh North American Prairie Conference. Ed. T.B.Bragg and J. Stubbendieck, Lincoln Nebraska: University of Nebraska-Lincoln.
Stubbendieck, J.L., and P.E. Reece. 1992. Nebraska handbook of range manage-ment. Historical materials from University of Nebraska-Lincoln extension. EC92-124. 66 pp.
Thompson, W.L., G.C. White, and C. Gowan. 1998. Monitoring vertebrate populations. Academic Press Incorporated, San Diego, San Diego, Califor-nia, USA.
Uresk, D.W. 1990. Using multivariate techniques to quantitatively estimate ecological stages in a mixed-grass prairie. Journal of Range Management 43: 282-285.
Uresk, D.W., D. Mergen, and J. Javersak. 2010a. Model for classifying and mon-itoring hackberry (Celtis occidentalis L.)-shrub ecological type in sand hills prairie ecosystem. Proceedings of the SD Academy of Science 89:105-119.
Uresk, D.W., D. Mergen, and J. Javersak. 2010b. Ecological model for classify-ing and monitoring boxelder in northwestern Nebraska. Proceedings of the SD Academy of Science 89:121-128.
USDA-SCS 1976. U.S. Department of Agriculture, Soil Conservation Service. National range handbook. NRH-1. Washington, DC.
USDA-NRCS. 2000. Ecological site description. R065XY034NE. Nebraska Sand Hills Technical Guide Section IIE, MRLA 65 Choppy Sands. USDA NRCS.
USDA-NRCS. 2001. Ecological site description. R065XY033NE. Nebraska Sand Hills Technical Guide Section IIE, MRLA 65-Sands. USDA NRCS.
USDA-NRCS. 2012. The PLANTS Database. Available at http://plants.usda.gov. National Plant Data Center, Baton Rouge, LA 70874-4490 USA. [Cit-ed 21 June 2012].
Vodehnal, W.L., J.B. Haufler, and R.K. Baydack. 2009. A grassland conservation plan for prairie grouse in North America. Pages 31-43. in: Transactions of the seventy-third North American wildlife and natural resources conference. J. Rahmn editor. Wildlife Management Institute. Washington, DC. 264 pp.
Westoby, M.; Walker, B.; Noy-Meir, I. 1989. Opportunistic management for rangelands not at equilibrium. Journal of Range Management 42(4):266-274.

100 Proceedings of the South Dakota Academy of Science, Vol. 91 (2012)
Proceedings of the South Dakota Academy of Science, Vol. 91 (2012) 101
PERFORMANCE OF COMMERCIAL STARTER DIETS DURING FIRST-FEEDING OF
LANDLOCKED FALL CHINOOK SALMON
Jeremy Kientz1, Michael E. Barnes2*, and Dan J. Durben1
1Black Hills State UniversitySpearfish, SD 57799
2McNenny State Fish Hatchery2South Dakota Department of Game, Fish, and Parks
Spearfish, SD 57783*Corresponding Author email: [email protected]
ABSTRACT Changes in the availability of starter diets traditionally used during landlocked
fall Chinook salmon Oncorhynchus tshawytscha rearing necessitated the testing of potential alternatives. Three diets, Silvercup® salmon starter, Silvercup 0.7 mm extruded micro-pellet, and BioVita® #0 starter, were compared during a 28-day trial. Weight gain was significantly greater in the tanks of salmon receiving Bio-vita compared to 0.7 mm Silvercup. Feed conversion ratio was also improved with the feeding of Biovita versus 0.7 mm Silvercup, with Silvercup starter producing results not significantly different from the other two diets. Mortality was 50% lower in Biovita and 37% lower in 0.7 mm Silvercup in comparison to Silvercup starter, although none of these three means were significantly different. Individual fish weights and lengths were significantly lower in the fish fed the 0.7 mm Silvercup in comparison to the other two diets. Based on these results, Bio-vita #0 is recommended for initial feeding of landlocked fall Chinook salmon fry.
Key Words
Chinook salmon, Oncorhynchus tshawytscha, starter diet, Silvercup, Biovita,
INTRODUCTION
Landlocked fall Chinook salmon Oncorhynchus tshawytscha in Lake Oahe are an important fisheries resource in South Dakota. This population is sustained entirely by artificial propagation, with no natural reproduction ever documented and extremely unlikely (Marrone and Stout 1997). During hatchery rearing, Lake Oahe Chinook salmon typically experience considerable mortality prior to hatch and present a number of rearing challenges (Barnes et al. 2000). Sub-stantial mortality has also been observed during initial feeding, possibly due to dietary issues (Barnes et al. 2002).
There have been few evaluations of commercially-available Chinook salmon starter diets. Fletcher and Barnes (2008) compared the performance of BioVita
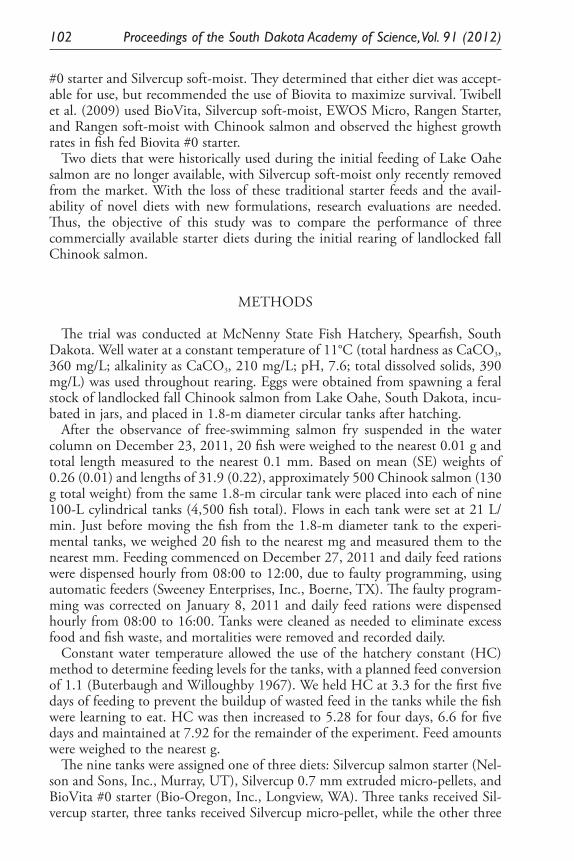
102 Proceedings of the South Dakota Academy of Science, Vol. 91 (2012)
#0 starter and Silvercup soft-moist. They determined that either diet was accept-able for use, but recommended the use of Biovita to maximize survival. Twibell et al. (2009) used BioVita, Silvercup soft-moist, EWOS Micro, Rangen Starter, and Rangen soft-moist with Chinook salmon and observed the highest growth rates in fish fed Biovita #0 starter.
Two diets that were historically used during the initial feeding of Lake Oahe salmon are no longer available, with Silvercup soft-moist only recently removed from the market. With the loss of these traditional starter feeds and the avail-ability of novel diets with new formulations, research evaluations are needed. Thus, the objective of this study was to compare the performance of three commercially available starter diets during the initial rearing of landlocked fall Chinook salmon.
METHODS The trial was conducted at McNenny State Fish Hatchery, Spearfish, South
Dakota. Well water at a constant temperature of 11°C (total hardness as CaCO3, 360 mg/L; alkalinity as CaCO3, 210 mg/L; pH, 7.6; total dissolved solids, 390 mg/L) was used throughout rearing. Eggs were obtained from spawning a feral stock of landlocked fall Chinook salmon from Lake Oahe, South Dakota, incu-bated in jars, and placed in 1.8-m diameter circular tanks after hatching.
After the observance of free-swimming salmon fry suspended in the water column on December 23, 2011, 20 fish were weighed to the nearest 0.01 g and total length measured to the nearest 0.1 mm. Based on mean (SE) weights of 0.26 (0.01) and lengths of 31.9 (0.22), approximately 500 Chinook salmon (130 g total weight) from the same 1.8-m circular tank were placed into each of nine 100-L cylindrical tanks (4,500 fish total). Flows in each tank were set at 21 L/min. Just before moving the fish from the 1.8-m diameter tank to the experi-mental tanks, we weighed 20 fish to the nearest mg and measured them to the nearest mm. Feeding commenced on December 27, 2011 and daily feed rations were dispensed hourly from 08:00 to 12:00, due to faulty programming, using automatic feeders (Sweeney Enterprises, Inc., Boerne, TX). The faulty program-ming was corrected on January 8, 2011 and daily feed rations were dispensed hourly from 08:00 to 16:00. Tanks were cleaned as needed to eliminate excess food and fish waste, and mortalities were removed and recorded daily.
Constant water temperature allowed the use of the hatchery constant (HC) method to determine feeding levels for the tanks, with a planned feed conversion of 1.1 (Buterbaugh and Willoughby 1967). We held HC at 3.3 for the first five days of feeding to prevent the buildup of wasted feed in the tanks while the fish were learning to eat. HC was then increased to 5.28 for four days, 6.6 for five days and maintained at 7.92 for the remainder of the experiment. Feed amounts were weighed to the nearest g.
The nine tanks were assigned one of three diets: Silvercup salmon starter (Nel-son and Sons, Inc., Murray, UT), Silvercup 0.7 mm extruded micro-pellets, and BioVita #0 starter (Bio-Oregon, Inc., Longview, WA). Three tanks received Sil-vercup starter, three tanks received Silvercup micro-pellet, while the other three
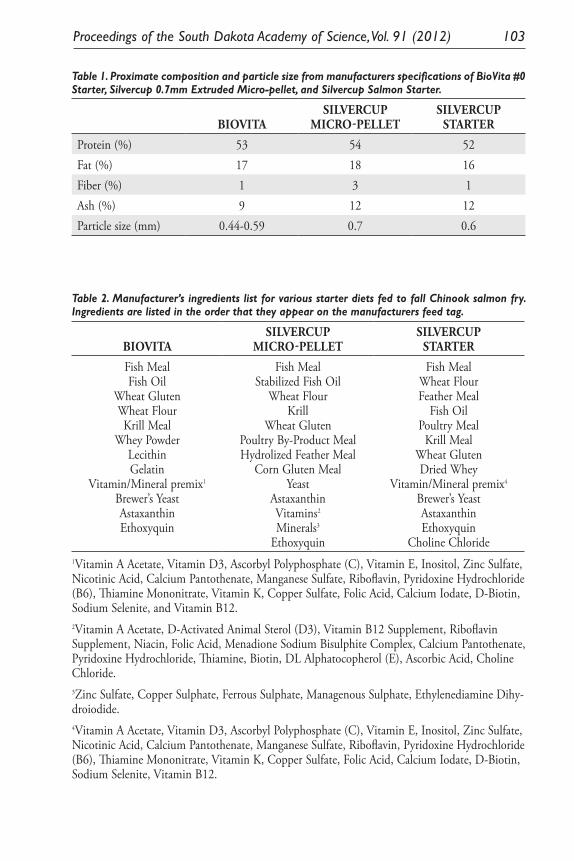
Proceedings of the South Dakota Academy of Science, Vol. 91 (2012) 103
Table 1. Proximate composition and particle size from manufacturers specifications of BioVita #0 Starter, Silvercup 0.7mm Extruded Micro-pellet, and Silvercup Salmon Starter.
BIOVITASILVERCUP
MICRO-PELLETSILVERCUP
STARTER
Protein (%) 53 54 52Fat (%) 17 18 16Fiber (%) 1 3 1Ash (%) 9 12 12Particle size (mm) 0.44-0.59 0.7 0.6
Table 2. Manufacturer’s ingredients list for various starter diets fed to fall Chinook salmon fry. Ingredients are listed in the order that they appear on the manufacturers feed tag.
BIOVITASILVERCUP
MICRO-PELLETSILVERCUP
STARTER
Fish MealFish Oil
Wheat GlutenWheat FlourKrill Meal
Whey PowderLecithinGelatin
Vitamin/Mineral premix1 Brewer’s YeastAstaxanthinEthoxyquin
Fish MealStabilized Fish Oil
Wheat FlourKrill
Wheat GlutenPoultry By-Product MealHydrolized Feather Meal
Corn Gluten MealYeast
AstaxanthinVitamins2
Minerals3
Ethoxyquin
Fish MealWheat FlourFeather Meal
Fish OilPoultry Meal
Krill MealWheat GlutenDried Whey
Vitamin/Mineral premix4
Brewer’s YeastAstaxanthinEthoxyquin
Choline Chloride1Vitamin A Acetate, Vitamin D3, Ascorbyl Polyphosphate (C), Vitamin E, Inositol, Zinc Sulfate, Nicotinic Acid, Calcium Pantothenate, Manganese Sulfate, Riboflavin, Pyridoxine Hydrochloride (B6), Thiamine Mononitrate, Vitamin K, Copper Sulfate, Folic Acid, Calcium Iodate, D-Biotin, Sodium Selenite, and Vitamin B12.2Vitamin A Acetate, D-Activated Animal Sterol (D3), Vitamin B12 Supplement, Riboflavin Supplement, Niacin, Folic Acid, Menadione Sodium Bisulphite Complex, Calcium Pantothenate, Pyridoxine Hydrochloride, Thiamine, Biotin, DL Alphatocopherol (E), Ascorbic Acid, Choline Chloride.3Zinc Sulfate, Copper Sulphate, Ferrous Sulphate, Managenous Sulphate, Ethylenediamine Dihy-droiodide.4Vitamin A Acetate, Vitamin D3, Ascorbyl Polyphosphate (C), Vitamin E, Inositol, Zinc Sulfate, Nicotinic Acid, Calcium Pantothenate, Manganese Sulfate, Riboflavin, Pyridoxine Hydrochloride (B6), Thiamine Mononitrate, Vitamin K, Copper Sulfate, Folic Acid, Calcium Iodate, D-Biotin, Sodium Selenite, Vitamin B12.
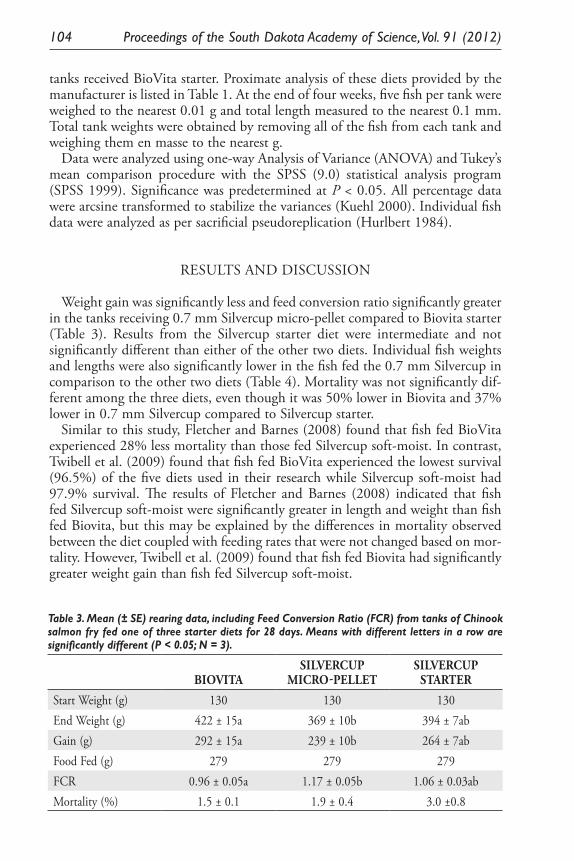
104 Proceedings of the South Dakota Academy of Science, Vol. 91 (2012)
tanks received BioVita starter. Proximate analysis of these diets provided by the manufacturer is listed in Table 1. At the end of four weeks, five fish per tank were weighed to the nearest 0.01 g and total length measured to the nearest 0.1 mm. Total tank weights were obtained by removing all of the fish from each tank and weighing them en masse to the nearest g.
Data were analyzed using one-way Analysis of Variance (ANOVA) and Tukey’s mean comparison procedure with the SPSS (9.0) statistical analysis program (SPSS 1999). Significance was predetermined at P < 0.05. All percentage data were arcsine transformed to stabilize the variances (Kuehl 2000). Individual fish data were analyzed as per sacrificial pseudoreplication (Hurlbert 1984).
RESULTS AND DISCUSSION
Weight gain was significantly less and feed conversion ratio significantly greater in the tanks receiving 0.7 mm Silvercup micro-pellet compared to Biovita starter (Table 3). Results from the Silvercup starter diet were intermediate and not significantly different than either of the other two diets. Individual fish weights and lengths were also significantly lower in the fish fed the 0.7 mm Silvercup in comparison to the other two diets (Table 4). Mortality was not significantly dif-ferent among the three diets, even though it was 50% lower in Biovita and 37% lower in 0.7 mm Silvercup compared to Silvercup starter.
Similar to this study, Fletcher and Barnes (2008) found that fish fed BioVita experienced 28% less mortality than those fed Silvercup soft-moist. In contrast, Twibell et al. (2009) found that fish fed BioVita experienced the lowest survival (96.5%) of the five diets used in their research while Silvercup soft-moist had 97.9% survival. The results of Fletcher and Barnes (2008) indicated that fish fed Silvercup soft-moist were significantly greater in length and weight than fish fed Biovita, but this may be explained by the differences in mortality observed between the diet coupled with feeding rates that were not changed based on mor-tality. However, Twibell et al. (2009) found that fish fed Biovita had significantly greater weight gain than fish fed Silvercup soft-moist.
Table 3. Mean (± SE) rearing data, including Feed Conversion Ratio (FCR) from tanks of Chinook salmon fry fed one of three starter diets for 28 days. Means with different letters in a row are significantly different (P < 0.05; N = 3).
BIOVITASILVERCUP
MICRO-PELLETSILVERCUP
STARTER
Start Weight (g) 130 130 130End Weight (g) 422 ± 15a 369 ± 10b 394 ± 7abGain (g) 292 ± 15a 239 ± 10b 264 ± 7abFood Fed (g) 279 279 279FCR 0.96 ± 0.05a 1.17 ± 0.05b 1.06 ± 0.03abMortality (%) 1.5 ± 0.1 1.9 ± 0.4 3.0 ±0.8
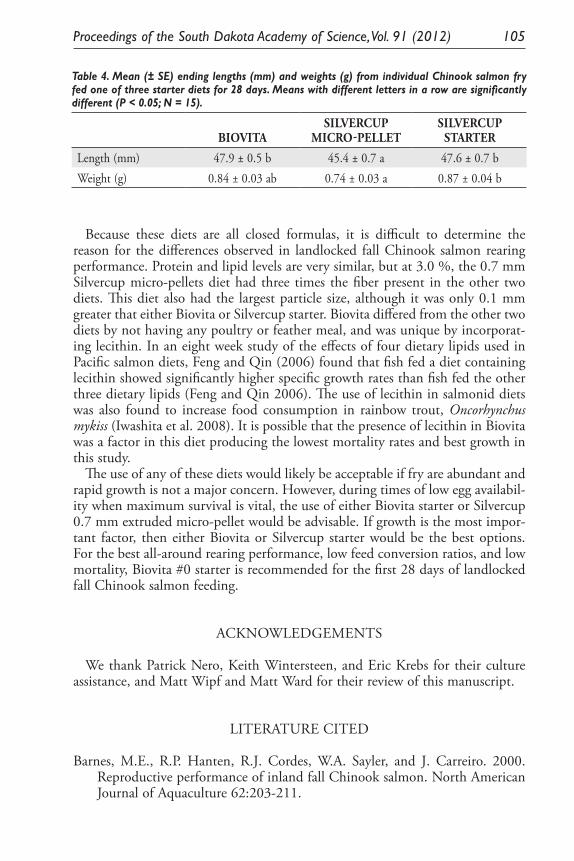
Proceedings of the South Dakota Academy of Science, Vol. 91 (2012) 105
Because these diets are all closed formulas, it is difficult to determine the reason for the differences observed in landlocked fall Chinook salmon rearing performance. Protein and lipid levels are very similar, but at 3.0 %, the 0.7 mm Silvercup micro-pellets diet had three times the fiber present in the other two diets. This diet also had the largest particle size, although it was only 0.1 mm greater that either Biovita or Silvercup starter. Biovita differed from the other two diets by not having any poultry or feather meal, and was unique by incorporat-ing lecithin. In an eight week study of the effects of four dietary lipids used in Pacific salmon diets, Feng and Qin (2006) found that fish fed a diet containing lecithin showed significantly higher specific growth rates than fish fed the other three dietary lipids (Feng and Qin 2006). The use of lecithin in salmonid diets was also found to increase food consumption in rainbow trout, Oncorhynchus mykiss (Iwashita et al. 2008). It is possible that the presence of lecithin in Biovita was a factor in this diet producing the lowest mortality rates and best growth in this study.
The use of any of these diets would likely be acceptable if fry are abundant and rapid growth is not a major concern. However, during times of low egg availabil-ity when maximum survival is vital, the use of either Biovita starter or Silvercup 0.7 mm extruded micro-pellet would be advisable. If growth is the most impor-tant factor, then either Biovita or Silvercup starter would be the best options. For the best all-around rearing performance, low feed conversion ratios, and low mortality, Biovita #0 starter is recommended for the first 28 days of landlocked fall Chinook salmon feeding.
ACKNOWLEDGEMENTS
We thank Patrick Nero, Keith Wintersteen, and Eric Krebs for their culture assistance, and Matt Wipf and Matt Ward for their review of this manuscript.
LITERATURE CITED
Barnes, M.E., R.P. Hanten, R.J. Cordes, W.A. Sayler, and J. Carreiro. 2000. Reproductive performance of inland fall Chinook salmon. North American Journal of Aquaculture 62:203-211.
Table 4. Mean (± SE) ending lengths (mm) and weights (g) from individual Chinook salmon fry fed one of three starter diets for 28 days. Means with different letters in a row are significantly different (P < 0.05; N = 15).
BIOVITASILVERCUP
MICRO-PELLETSILVERCUP
STARTER
Length (mm) 47.9 ± 0.5 b 45.4 ± 0.7 a 47.6 ± 0.7 bWeight (g) 0.84 ± 0.03 ab 0.74 ± 0.03 a 0.87 ± 0.04 b
106 Proceedings of the South Dakota Academy of Science, Vol. 91 (2012)
Barnes, M.E., W.A. Sayler, R.J. Cordes. 2002. Initiation of feeding during hatchery rearing of Landlocked Fall Chinook Salmon fry. Proceedings of the South Dakota Academy of Science 81:137-141.
Buterbaugh, G.L., and H. Willoughby. 1967. A feeding guide for brook, brown and rainbow trout. Progressive Fish-Culturist 29:210-215.
Feng, J. and Z. Qin. 2006. Effects of four dietary lipids on the performance of growth and body composition in Pacific salmon, Onchorhynchus. Acta Hy-drobiologica Sinica 30:256-261.
Fletcher, B. and M.E. Barnes. 2008. Performance of two starter diets during landlocked fall Chinook salmon initial feeding. Proceedings of the South Dakota Academy of Science 87:179-184.
Hurlbert, S.H. 1984. Pseudoreplication and the design of ecological field experi-ments. Ecological Monographs 54:187-211.
Iwashita, Y., N. Suzuki, T. Yamamoto, J. Shibata, A.H. Soon, Y. Ikehata, H. Furuita, T. Sugita, and T. Goto. 2008. Supplemental effect of cholyltaurine and soybean lecithin to a soybean meal-based fish meal-free diet on hepatic and intestinal morphology of rainbow trout Oncorhynchus mykiss. Fisheries Science 74:1083-1095.
Kuehl, R.O. 2000. Design of Experiments: Statistical Principles of Research De-sign and Analysis, 2nd edition. Brookes/Cole, Pacific Grove, CA.
Marrone, G.M., and D.A. Stout. 1997. 1997 Whitlocks Bay Spawning Station Annual Report. South Dakota Department of Game, Fish and Parks Annual Report Number 97-19. Pierre, SD.
Twibell, R.G., A.L. Gannam, S.L. Ostrand, John S.A. Holmes, and J.B. Poole. 2009. Evaluation of commercial diets for first-feeding spring Chinook salmon. North American Journal of Aquaculture 71: 116-121.
Proceedings of the South Dakota Academy of Science, Vol. 91 (2012) 107
EVALUATION OF THREE SPAWNING TECHNIQUES FOR YELLOW PERCH
Matthew J. Ward1*, T. R. St. Sauver2, D. O. Lucchesi2, B. Johnson2, K. Hoffman2, J. Stahl2
1South Dakota Department of Game, Fish and Parks44437 139A Street
Waubay, South Dakota 57273, USA2South Dakota Department of Game, Fish and Parks
4500 South Oxbow AvenueSioux Falls, South Dakota 57106, USA
*Corresponding author email: [email protected]
ABSTRACT
Yellow perch Perca flavescens stocking requests have increased in South Dakota, necessitating increased hatchery production. This study compared the effect of three different spawning methods – hand (manual spawning), cage (naturally-deposited and fertilized in cages), net (naturally-deposited and fertilized in modified fyke nets) – on embryo survival to the eyed-egg stage. Egg survival was significantly different among each of the three techniques, with hand spawning yielding the highest median egg survival (69%), followed by cage (50%) and net (29%) spawning. Based on these results, we recommend hand spawning to maximize survival of yellow perch eggs. Cage spawning produced eggs with moderate survival making this a viable spawning method when low numbers of ripe females are available for hand spawning. Collecting eggs via net spawning should be done only if time, manpower, and incubation constraints do not exist.
Keywords
spawning, yellow perch, egg procurement
INTRODUCTION
Yellow perch Perca flavescens can be a highly targeted sportfish in South Da-kota during both winter and summer months (Blackwell et al. 2007; Lucchesi 2010). High angler preference and inconsistent natural recruitment of yellow perch in many eastern South Dakota lakes have initiated efforts to increase their abundance through supplemental stocking efforts (Brown and St. Sauver 2002). Developing propagation techniques are necessary to consistently meet these stocking demands.
Yellow perch have a unique reproductive strategy in which females expel their eggs in a protective matrix (1.2 to 2.4 m long) upon submergent structure, such as vegetation, woody debris, or gravel (Carlander 1997). Following spawning,
108 Proceedings of the South Dakota Academy of Science, Vol. 91 (2012)
parental care is not provided by either gender. As the incubation interval pro-gresses (multiple days later), the connective tissue of the matrix will deteriorate. Because yellow perch eggs are initially connected, multiple methods of procure-ment are available. For example, eggs can be collected by allowing broodstock to spawn naturally in impoundments (Jansen et al. 2009) or in net pens stocked with prespawn males and females (Hart et al. 2006). In other instances, adults can be spawned in tanks under appropriate water temperatures (Kayes and Cal-bert 1979). All of these strategies require male yellow perch to naturally fertilize the eggs. Hand spawning is an alternative strategy. Dabrowski et al. (1994) syn-chronized ovulation in perch through hormone injection. This has implications for collecting a large number of eggs from a captive broodstock during a short timeframe. These eggs could be manually stripped into a dry pan and then semen could be added directly from a male or by using semen that had been preserved (Ciereszko et al. 1993). Addition of water and stirring with a feather will result in fertilization within 30 seconds (Hart et al. 2006). Although there is documenta-tion on how to collect yellow perch eggs using a variety of methods, no studies have compared egg survival among these techniques. Therefore, the objective of this study was to evaluate the effects of different spawning techniques on yellow perch egg survival to the eyed-stage of development.
METHODS
Yellow perch eggs were collected daily from April 21 through May 1, 2009 from Lake Madison (surface area = 1,070 ha), Lake County, South Dakota when water temperatures were between 8.8 and 16.1 ºC. A total of 30 modified-fyke nets (0.95- or 1.9-cm bar mesh) were used to collect adult yellow perch. Each net fished for an approximate 24-h period before being emptied and reset during morning hours. Eggs were collected using three techniques, and the sequence of egg collection was the same each day.
Net Spawning—Upon arriving at a modified-fyke net, we collected egg masses which had been deposited in the pocket of or on the outside of the modified-fyke net and placed them in buckets that contained lake water.
Cage Spawning—After the egg masses had been removed from the fyke net (net spawning), all yellow perch were also removed and the females were exam-ined. Females that were determined to be unripe (green) and some males were transferred to holding cages (cage dimensions: 1.83 m high x 1.22 m wide x 1.22 m long) within Lake Madison. A total of eight cages were used. Male to female ratio in the cages varied from 2 to 3 males per 1 female. The overall density of yellow perch per cage was approximately150 fish/m3. Egg masses that had been deposited were removed daily and then placed into buckets filled with lake wa-ter. Following egg collection from the cages, we examined all yellow perch from each cage, and perch that exhibited obvious signs of stress (e.g., abrasions) were released. Spent females were also released while green females were returned to that cage. No record was kept of the number of days green females were returned to the cages. New males and unripe females that had been collected from the overnight modified-fyke net sets were added daily to replace adult perch that had
Proceedings of the South Dakota Academy of Science, Vol. 91 (2012) 109
been released, but overall density and male to female ratio were maintained as previously described.
Hand Spawning—Females that were determined to be ripe both from the cages and from the modified fyke-nets were placed in separate tanks until hand stripping and fertilization using the dry method commenced. Thus, eggs were stripped from females that had been collected that day in nets and from females that had ripened over time in the cages. Individual females were stripped, and one egg mass was spread out in a pan. A minimum of 5 mL of semen was added from two males. Lake water was added, and the pan was gently agitated for ap-proximately 2 min. The skein was rinsed and place in a bucket with lake water.
Methods in Common —Eggs were kept separated by technique, transferred into bags filled with lake water within 1-hr of being collected and then placed in insulated styrofoam boxes. The ratio of egg weight to volume of water in buckets or transport bags never exceeded 120 g/L. The boxes were transported and arrived at Blue Dog Hatchery (rural Waubay) within 5 h of being collected. This evaluation included eggs that were collected only between April 23 and 28, 2009, as April 23 was the first day eggs were collected by all three techniques and April 28 was the last day eggs were collected by all three techniques.
At the hatchery, the eggs were weighed to the nearest gram, placed into Mc-Donald Jars and incubated separately by date and collection technique. Overall mean (± SD) egg weight (g) per jar was 975 (± 150) for hand spawn, 1,029 (± 203) for cage spawn, and 984 (± 168) for net spawn To estimate the number of eggs/g, all the eggs in four, 1-g subsamples were counted, and an average value of 234 eggs/g (SD = 52) was calculated, which was very similar to the estimate of 230 used during 2008 (Broughton et al. 2009). Therefore, 230 eggs/g was applied to the total known weight of eggs in each jar. The average number of eggs/g was multiplied by the weight (g) of the eggs in each jar to determine the total number. Water flows varied but were maintained at a minimum of 2.4 L/min for each jar. All eggs were subjected to a daily flow-through prophylactic treatment of formalin (1,667 mg/L for 15 m) to prevent egg mortality due to fungal infestation (e.g., Saprolegnia spp.). Following ten days of incubation in 9.4 ºC filtered well water, there was a considerable difference in the color of eyed eggs (grey) compared to dead eggs (yellow). To estimate the percent of eyed eggs within a jar, we used a transparent grid wrapped around each McDonald Jar. The grid contained 12 squares with each square being 100-cm2. The percent of eyed eggs (grey color) in each square was visually estimated to the nearest 10%. The percent survival for each jar was then determined by calculating an average from those 12 values.
Experimental Design and Statistics—A McDonald Jar was considered an experimental unit and the sample size (n) represents the number of jars contain-ing one of the collection techniques. Replication was highest for cage (n = 51), moderate for net (n = 47) and lowest for hand spawning (n = 21). Plots of mean egg survival were examined daily to determine if techniques performed similarly over the egg collection interval. The pattern in egg survival was the same each day, so pooling data across days for each technique was considered appropriate. Percent egg survival among the three techniques was compared using a non-parametric Kruskal-Wallis test, as the assumption of homogeneity of variance
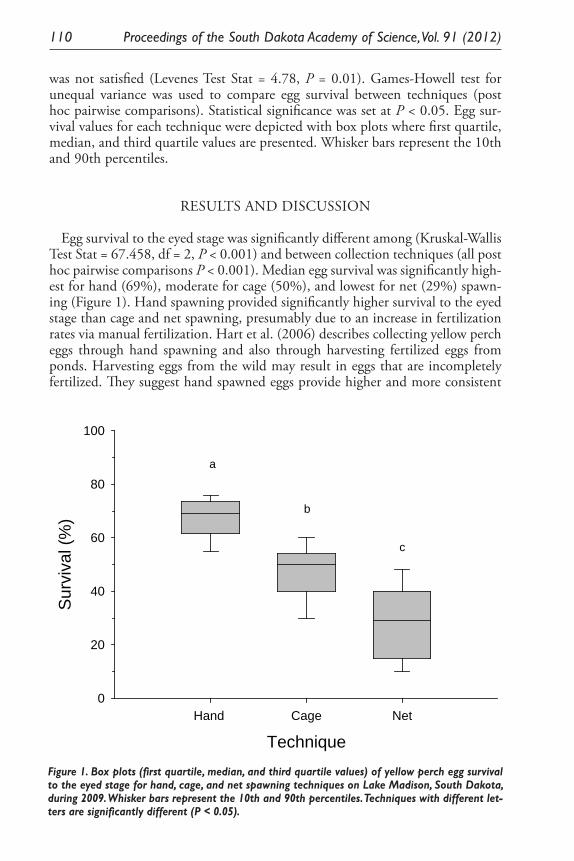
110 Proceedings of the South Dakota Academy of Science, Vol. 91 (2012)
was not satisfied (Levenes Test Stat = 4.78, P = 0.01). Games-Howell test for unequal variance was used to compare egg survival between techniques (post hoc pairwise comparisons). Statistical significance was set at P < 0.05. Egg sur-vival values for each technique were depicted with box plots where first quartile, median, and third quartile values are presented. Whisker bars represent the 10th and 90th percentiles.
RESULTS AND DISCUSSION
Egg survival to the eyed stage was significantly different among (Kruskal-Wallis Test Stat = 67.458, df = 2, P < 0.001) and between collection techniques (all post hoc pairwise comparisons P < 0.001). Median egg survival was significantly high-est for hand (69%), moderate for cage (50%), and lowest for net (29%) spawn-ing (Figure 1). Hand spawning provided significantly higher survival to the eyed stage than cage and net spawning, presumably due to an increase in fertilization rates via manual fertilization. Hart et al. (2006) describes collecting yellow perch eggs through hand spawning and also through harvesting fertilized eggs from ponds. Harvesting eggs from the wild may result in eggs that are incompletely fertilized. They suggest hand spawned eggs provide higher and more consistent
TechniqueHand Cage Net
Sur
viva
l (%
)
0
20
40
60
80
100
a
b
c
Figure 1. Box plots (first quartile, median, and third quartile values) of yellow perch egg survival to the eyed stage for hand, cage, and net spawning techniques on Lake Madison, South Dakota, during 2009. Whisker bars represent the 10th and 90th percentiles. Techniques with different letters are significantly different (P < 0.05).
6
Figure 1. Box plots (first quartile, median, and third quartile values) of yellow perch egg survival to the eyed stage for hand, cage, and net spawning techniques on Lake Madison, South Dakota, during 2009. Whisker bars represent the 10th and 90th percentiles. Techniques with different let-ters are significantly different (P < 0.05).
Proceedings of the South Dakota Academy of Science, Vol. 91 (2012) 111
fertilization rates. The results of this study support the recommendations of Hart et al. (2006). Eggs collected via cage spawning provided significantly greater sur-vival than net spawning. The exact cause for this is unknown, but is likely a result of higher fertilization rates for eggs collected in the cage spawning technique.
In instances when incubation space is limited, emphasis should be placed on collecting eggs using hand spawning as this technique will yield more fry for a given number of eggs compared to the other two techniques. The number of eggs collected via hand spawning is going to be directly dependent on the number of ripe females that can be collected. Perhaps an additional number of hand spawned eggs could be collected by maintaining a yellow perch broodstock in a hatchery pond. This may serve as a consistent source of females to be hand spawned provided overwinter temperatures are suitable in the pond to allow for normal sexual maturation (Hokanson 1977).
Although the survival of the cage spawn eggs was lower than that of hand spawned eggs, the cage spawn technique produced reasonable egg survival. Thus, this technique may prove to be necessary when limited numbers of ripe females can be obtained for hand spawning. Future studies should attempt to manipulate male to female ratios and overall density of prespawn perch in the cages. Hart et al. (2006) suggest maintaining adult prespawn yellow perch at low densities in cages (< 10 perch /m3). The density used in the cages of this study was over 10X greater than that suggested by Hart et al. (2006). Perhaps egg survival may be increased in cages that are stocked with different overall densities or increased numbers of male yellow perch. Eggs collected via net spawning yielded the lowest survival and should be given the least priority. However, if incubation space is available, this technique will produce a low number of fry relative to the number of eggs collected.
ACKNOWLEDGEMENTS
Special thanks to Jerry Broughton, Randy Smidt, Ryan Rasmus, and Eugene Holm who provided the necessary effort for egg incubation during this study.
LITERATURE CITED
Blackwell, B.G., R.J. Braun, S.J. Kennedy, T.M. Kaufman, and M.J. Ermer. 2007. Waubay Lake, South Dakota Angler Use and Harvest Surveys Decem-ber 2004- December 2006. South Dakota Department of Game, Fish and Parks, Progress Report,Job Number 2109, Pierre, SD.
Broughton, J., R. Smidt, M. Ward, E. Holm, and R. Rasmus. 2009. 2008 Blue Dog Lake Fish Hatchery Annual Production Report. South Dakota Depart-ment of Game, Fish and Parks, Annual Report 09-08, Pierre, SD.
Brown, M.L., and T.R. St. Sauver. 2002. An assessment of yellow perch, Perca flavescens, stocking contributions in eastern South Dakota lakes. Fisheries Management and Ecology 9:225-234.
112 Proceedings of the South Dakota Academy of Science, Vol. 91 (2012)
Carlander, K.D. 1997. Yellow perch. Pages 125-179 in Handbook of Freshwater Fishery Biology, Volume 3, Life History Data on Ichthyopercid and Percid Fishes of the United States and Canada. Iowa State University Press, Ames, IA.
Ciereszko, A., L. Ramseyer, and K. Dabrowski. 1993. Cryopreservation of yellow perch semen. The Progressive Fish Culturist 55:261-264.
Dabrowski, K., A. Ciereszko, L. Ramseyer, D. Culver, and P. Kestemont. 1994. Effects of hormonal treatment on induced spermiation and ovulation in the yellow perch (Perca flavescens). Aquaculture 120:171-180.
Hart, S.D., D.L. Garling, and J.A. Malison, editors. 2006. Yellow perch culture guide. NCRAC Culture Series 103. North Central Regional Aquaculture Center Publications Office, Iowa State University, Ames, IA.
Hokanson, K.E.F. 1977. Temperature requirements of some percids and adapta-tions to the seasonal temperature cycle. Journal of the Fisheries Research Board of Canada 34: 1524-1550.
Jansen, A. C., B.D.S. Graeb, and D.W. Willis. 2009. Effects of a simulated cold-front on hatching success of yellow perch eggs. Journal of Freshwater Ecology 24:651-655.
Kayes, T.B., and H.E. Calbert. 1979. Effects of photoperiod and temperature on the spawning of yellow perch (Perca flavescens), Proceedings of the World Mariculture Society 10:306-316.
Lucchesi, D.O. 2010. Angler Use and Harvest Surveys on Brant Lake, Lake County, South Dakota May 1998-August 2008. South Dakota Department of Game, Fish and Parks, Completion Report Number 11-12, Pierre, SD.
Proceedings of the South Dakota Academy of Science, Vol. 91 (2012) 113
INFERRING INTRODUCTION HISTORY AND SPREAD OF FALCARIA VULGARIS BERNH.
(APIACEAE) IN THE UNITED STATES BASED ON HERBARIUM RECORDS
Sarbottam Piya1, Madhav P. Nepal1*, Achal Neupane1, Gary E. Larson2 and Jack L. Butler3
1Department of Biology and MicrobiologySouth Dakota State University
Brookings, South Dakota, 570072Department of Natural Resource Management
South Dakota State UniversityBrookings, South Dakota, 57007
3Rocky Mountain Research Station, USDA Forest ServiceRapid City, SD 57702
*Corresponding author email: [email protected]
ABSTRACT
Herbarium records were studied to infer the introduction history and spread of the exotic Eurasian sickleweed (Falcaria vulgaris Bernh.) in the United States. The spread of the plant was reconstructed using the location of early collections as the possible sites of primary introduction, and the location of subsequent collections as potential pathways along which this species spread. Herbarium records indicate that sickleweed was first introduced no later than 1922, and independent introduction of this plant took place in the East Coast and in the Midwest of the United States. The species has spread to 37 counties of 15 states of the United States. No recent sickleweed record has been reported for the last 17 years in the U.S. except Iowa, Nebraska and South Dakota. The plant has been characterized as an aggressive weed by experts in the latter two states, where it is already well established and has infested the Fort Pierre National Grassland and Buffalo Gap National Grassland in South Dakota, and is reported from sev-eral sites along Nebraska roadsides. It is essential to verify the existence of sickle-weed in the areas from where the herbarium specimens were previously collected to help identify the areas at risk. Control strategies need to be implemented and policy should be developed to establish the participation of public lands manag-ers, transportation departments and private land-owners to control and manage this species before it becomes a more widespread invader.
Keywords
Falcaria vulgaris, herbarium specimen, introduced plant, sickleweed.
114 Proceedings of the South Dakota Academy of Science, Vol. 91 (2012)
INTRODUCTION
A tremendous exchange of biotas has occurred since the exploration age began in the early 15th century (Mooney and Cleland 2001). Some introduced plant species were advertently introduced for their medicinal, ornamental and forage values and some were introduced for the production of fiber, timber and fuel wood (Cox 2004). In many cases, exotic plants were accidentally introduced as crop seed contaminants or animal fodder, with domesticated animals and ship ballast, and as hitchhikers with military movements (Mack 1991; Sakai et al. 2001; Cox 2004; Chauvel et al. 2006). Theoretically, very few introduced plants become invasive; however, recently the number of introduced invasive plant species has reached more than 1000 in the United States alone (Mooney and Cleland 2001; USDA, ARS 2012). With the increase in the number of invasive plant species and their range expansion, the urgency to study the biological pro-cess of plant introduction, establishment, spread and invasion in novel habitats is being realized (Pimentel et al. 2000).
Herbarium records are the most reliable primary source of information to reconstruct introduction and colonization history of a species when detailed his-toric data are not available (Strother and Smith 1970; Mack 1991; Barney 2006). Herbarium specimen labels provide valuable information that can be used to document the time of introduction of non-native plants (Wester 1992; Woods et al. 2005; Valliant et al. 2007), the number of independent introductions (Barney 2006), the early invasion pathways in the introduced range (Lavoie et al. 2007; Stuckey 1980) and distributional changes of plants over time as in Ambrosia artemisiifolia (Chauvel et al. 2006; Lavoie et al. 2007), Bouteloua curtipendula (Laughlin 2003), Bromus tectorum (Novak and Mack 2001; Valliant et al. 2007), Cortaderia selloana and C. jubata (Lambrinos 2001), Oenothera spp.(Mihulka and Pysek 2001), Solidago spp. (Weber 1998), Vincetoxicum spp.(Sheeley and Raynal 1996) and many other species (Woods et al. 2005). However, herbarium specimen based information can sometimes be misleading because of errors asso-ciated with incorrect identification and geographic and temporal biases (Delisle et al. 2003; Chauvel et al. 2006; Crawford and Hoagland 2009). In addition, results tend to be spurious if a long history of specimen collections is not con-sidered (Pysek and Prach 1993). Therefore, herbarium data need knowledgeable and cautious interpretation.
Falcaria vulgaris Bernh. (Syn. F. rivini, F. sioides; family Apiaceae; 2n = 22 [Go-ralski et al. 2009]), commonly known as sickleweed, is native to the European part of the former Soviet Union, the Caucasus, Western Siberia and Central Asia. It is also distributed in the central and southern parts of Western Europe, the Mediterranean, Asia Minor, and Iran. It is an introduced species in Africa, and North and South America (Larina 2008). It has been reported in sixteen states in the United States (USDA, NRCS 2011) and exhibits disjunct distribution in the Midwestern and Eastern USA. In the Midwest, its range includes the states of Illinois, Iowa, Kansas, Louisiana, Missouri, Nebraska, Oklahoma, South Dakota, Wisconsin and Wyoming; and in the East Coast, it includes Maryland, Massa-chusetts, New York, Pennsylvania, Virginia and West Virginia. In South Dakota, it occurs in the Fort Pierre National Grassland (FPNG; ca. 3200 ha infested in
Proceedings of the South Dakota Academy of Science, Vol. 91 (2012) 115
2005), Buffalo Gap National Grassland (BGNG; ca. 40 ha), and locally on the campus of South Dakota State University (Korman 2011). Several large popula-tions of sickleweed occur in six counties in Nebraska (our field observation; R. Kaul and K. Decker, University of Nebraska) where this species has been labeled a Category II invasive plant (invasive species whose eradication is still feasible; NISC 2011). No literature suggests invasiveness of this plant in any states other than South Dakota and Nebraska.
The sickleweed plant body is usually 30-60 cm tall with upright solid stems and a fleshy tap root; leaves are pinnately divided into 3-5 leaflets that are linear or linear-lanceolate and often curved to give the leaflets a sickle shape; leaflet margins have denticles. The inflorescence is a compound umbel with white flowers (Larina 2008). The flowers are andromonoecious and protandrous (See Knuth and Muller 1908). Phenotypic plasticity of its growth habit [annual or biennial (Clapham et al. 1989) or even perennial (Bojnansky and Fargasova 2007; Korman 2011)] and reproductive system [monoecism (See Knuth and Muller 1908) and vegetative propagation through rootstocks (Gress 1923; Larina 2008; Korman 2011)] help make this plant aggressive. Korman (2011) showed that this plant is negatively impacting species diversity and forage production of native grassland at FPNG.
Information on the introduction and distribution of sickleweed in the United States is fragmented and scant. Gress (1923) first reported this species in the United States (Pennsylvania). There are also short notes on the detection of this species in other states (Gates 1940, Kansas; Fernald 1942, Missouri; Thomas and Raymond 1987 Louisiana). Additionally, this species has been included in the annotated checklists of some state floras, e.g., Steyermark 1963, Missouri; Eilers and Roosa 1994, Iowa; Woods et al. 2005, Kansas; MacRoberts and MacRob-erts 2006, Louisiana; Magee and Ahles 2007, Massachusetts; Rhoads and Block 2007, Pennsylvania. Except for these reports of this species at the regional level, there is no in-depth study on its introduction and distribution at the national level. Information for species introduction and spread in a new habitat can help predict the invasiveness of introduced species and may also be useful for control (Ricciardi et al. 2000; Kolar and Lodge 2001; Lambrinos 2001; Lavoie et al. 2003; Dybas 2004; Lerdau and Wickham 2011). In addition, this informa-tion can give clues on probable sites of invasion (Weber 1998). We are using herbarium records and relevant literature to study the introduction history and spread of sickleweed and to determine current distribution in the USA. The objectives of this study are to assess and infer 1) when and where this species was introduced, 2) current temporal spread of the species and 3) the number of independent introductions.
METHODS
Specimens from herbaria in the sixteen states, where the USDA Plants Data-base has reported the occurrence of sickleweed, were examined. The list of the herbaria (Appendix 1) was obtained from Index Herbariorum (http://sciweb.nybg.org/science2/IndexHerbariorum .asp), a directory of public herbaria of the
116 Proceedings of the South Dakota Academy of Science, Vol. 91 (2012)
world. Herbarium curators/collection managers of these herbaria were contacted for information on their holdings of sickleweed. The information requested for each specimen included voucher/accession number, date collected, collector(s) and collection locality. As the collections of many introduced species can be un-mounted or unprocessed in herbaria, we requested information on unmounted sickelweed specimens (if any) as well. The small number of specimens and the monotypic nature of the genus led to fast communication of data from herbaria and experts. Information was also obtained from online specimen databases (BKL, HUH, ISM, KANU, KSC, LSU, Oklahoma Vascular Plant Database, RM, TROPICOS). Abbreviations for these herbaria follow those of Holmgren et al. (1990). Most sickleweed specimens were housed in the major agricultural herbaria in the Midwest (ISC, NEB, SDC); these were visited to examine the sickleweed specimens. Vouchers that had been collected by the same collector from the same locality on the same date (duplicates) were regarded as one speci-men following Chauvel et al. (2006). Specimens collected from countries other than the United States were not included in this study. The sites of earliest col-lections of herbarium specimens were considered to be the possible sites of early introduction, whereas the sites of subsequent collections were interpreted to be the possible pathways along which this species spread. Following Barney (2006), we assumed that the species is always present once it was collected from a county. Based on this assumption, a temporal distribution map of the species (at county level) was constructed using ArcGIS 9.3 (ESRI 2008).
RESULTS
Falcaria vulgaris specimens in herbaria—Among the 178 herbaria contact-ed, we received responses from 76 herbaria. Among these, 42 herbaria (BALT, BDWR, BTJW, BUPL, CAMU, CORT, DEK, DWC, DWU, ECH, EMNH, FWVA, ILL, ISU, KEN, KNOX, KSTC, LAF, LSUS, LYN, MCN, MOAR, MOR, MVSC, MWI, NWOSU, NYS, ORU, PHIL, PLAT, RMS, RUHV, SDU, SEMO, SMS, TAWES, URV, VAS, WARM, WILLI, WVW and YELLO) had no sickleweed specimens. At the remaining 34 herbaria (BH, BHSC, BKL, CM, CSCN, DUR, F, FARM, GH, ISC, ISM, KANU, KSC, LSU, MASS, MO, NEB, NEBC, NLU, NO, ODU, OKL, OKLA, OMA, PA, PH, RM, SDC, UMO, UWM, UWSP, VPI, WIS and WVA), we found 195 sickleweed specimens collected from the United States. After excluding the duplicate speci-mens, we examined a total of 143 sickleweed specimens. These specimens were collected from 1922 to 2011 from 32 counties of 15 states. We noted 5 more counties where sickleweed has been reported (J. T. Kartesz, Biota of North America) but for which we found no specimen evidence. Among the 16 states from which USDA Plants Database reported the occurrence of sickleweed, we were unable to locate sickleweed specimens from Maryland in any of the herbaria we contacted. To our knowledge, sickleweed has been reported from 37 counties in 15 states in the United States. The majority of specimens examined were from Iowa, Nebraska, and South Dakota, and there were no collections from any other state made during the last 17 years (Table 1). GH houses the highest number of
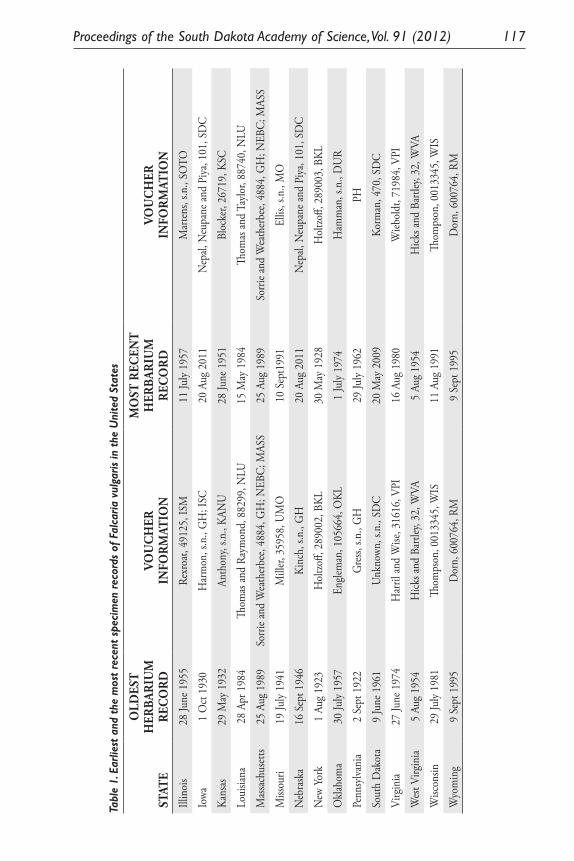
Proceedings of the South Dakota Academy of Science, Vol. 91 (2012) 117
Tabl
e 1.
Ear
liest
and
the
mos
t re
cent
spe
cim
en r
ecor
ds o
f Fal
caria
vul
garis
in t
he U
nite
d St
ates
STAT
E
OLD
EST
HER
BAR
IUM
REC
OR
DVO
UC
HER
INFO
RM
ATIO
N
MO
ST R
ECEN
TH
ERBA
RIU
MR
ECO
RD
VOU
CH
ERIN
FOR
MAT
ION
Illin
ois
28 Ju
ne 1
955
Rexr
oat,
4912
5, IS
M11
July
1957
Mar
tens,
s.n.,
SOTO
Iowa
1
Oct
193
0H
arm
on, s
.n.,
GH
; ISC
20 A
ug 2
011
Nep
al, N
eupa
ne an
d Pi
ya, 1
01, S
DC
Kans
as29
May
193
2An
thon
y, s.n
., KA
NU
28 Ju
ne 1
951
Bloc
ker,
2671
9, K
SC
Loui
siana
28
Apr
198
4Th
omas
and
Raym
ond,
882
99, N
LU15
May
198
4Th
omas
and
Taylo
r, 88
740,
NLU
Mas
sach
usett
s25
Aug
198
9So
rrie a
nd W
eath
erbe
e, 48
84, G
H; N
EBC;
MAS
S25
Aug
198
9So
rrie a
nd W
eath
erbe
e, 48
84, G
H; N
EBC;
MAS
S
Miss
ouri
19 Ju
ly 19
41M
iller,
359
58, U
MO
10 S
ept1
991
Ellis
, s.n
., M
O
Neb
rask
a 16
Sep
t 194
6Ki
nch,
s.n.
, GH
20 A
ug 2
011
Nep
al, N
eupa
ne an
d Pi
ya, 1
01, S
DC
New
Yor
k1
Aug
1923
Hol
tzoff,
289
002,
BKL
30 M
ay 1
928
Hol
tzoff,
289
003,
BKL
Okl
ahom
a30
July
1957
Engle
man
, 105
664,
OKL
1 Ju
ly 19
74H
amm
an, s
.n.,
DU
R
Penn
sylva
nia
2 Se
pt 1
922
Gre
ss, s.
n., G
H29
July
1962
PH
Sout
h D
akot
a9
June
196
1U
nkno
wn, s
.n.,
SDC
20 M
ay 2
009
Korm
an, 4
70, S
DC
Virg
inia
27 Ju
ne 1
974
Har
ril an
d W
ise, 3
1616
, VPI
16 A
ug 1
980
Wieb
oldt
, 719
84, V
PI
Wes
t Virg
inia
5 Au
g 19
54H
icks a
nd B
artle
y, 32
, WVA
5 Au
g 19
54H
icks a
nd B
artle
y, 32
, WVA
Wisc
onsin
29 Ju
ly 19
81Th
omps
on, 0
0133
45, W
IS11
Aug
199
1Th
omps
on, 0
0133
45, W
IS
Wyo
min
g9
Sept
199
5 D
orn,
600
764,
RM
9 Se
pt 1
995
Dor
n, 6
0076
4, R
M
118 Proceedings of the South Dakota Academy of Science, Vol. 91 (2012)
specimens collected from different states, including the oldest collections from Iowa, Oklahoma, Massachusetts, Nebraska, Pennsylvania, and Wisconsin. SDC houses the highest number of recently collected specimens.
Information from Herbarium Records
Collection history of Falcaria vulgaris—Sickleweed was first reported by Gress (1923) as a new species to the United States. He was the collector of the oldest specimen of sickleweed, which was collected from the agricultural field at Mercersberg, Franklin County, Pennsylvania, on September 2, 1922 (Figure 1). This specimen is housed at Gray Herbarium (Gress, s.n., GH) with a duplicate at Carnegie Museum of Natural History (Gress, s.n., CM). Sickleweed was sub-sequently reported in New York (August 1923; Holtzoff, 289002, BKL), West Virginia (August 1954; Hicks and Bartley, 32, WVA), Virginia (June 1974; Har-ril and Wise, 31616, VPI), and Massachusetts (August 1989; Sorrie and Weath-erbee, 4884, GH; NEBC; MASS). The specimen collected from Massachusetts in August 1989 (Sorrie and Weatherbee, 4884, GH; NEBC; MASS) represents the most recent collection from the East Coast.
The oldest specimen from the Midwest is from Sioux County, Iowa, collected on October 1, 1930 (Harmon, s.n., GH, ISC). The next report was from Atchi-son County, Kansas, in 1932. The species was then reported from Missouri (July 1941; Miller, 35958, UMO), Nebraska (September 1946; Kinch, s.n., GH), Illinois (June 1955; Rexroat, 49125, ISM), Oklahoma (July 1957; Engleman, 105664, OKL), South Dakota (June 1961; Unknown, s.n., SDC), Wisconsin (July 1981; Thompson, 0013345, WIS), Louisiana (April 1984; Thomas and Raymond, 88299, NLU) and Wyoming (September 1995; Dorn, 600764, RM). After 1995, specimens were collected only from the states of Iowa, Nebraska and South Dakota. The oldest and latest herbarium specimens collected from differ-ent states in the United States are presented in Table 1.
Collection site—The first herbarium specimens from the East Coast (Penn-sylvania) and the Midwest (Iowa) were both collected from agricultural fields. In Pennsylvania, the first sickleweed specimen was collected from a field where clover (Trifolium spp.) and timothy grass (Phleum pratense) were being cultivated. Similarly, the oldest herbarium specimen from South Dakota was collected from an agricultural field, but most of the recent specimens are from grasslands (FPNG and BGNG, South Dakota). In Nebraska, most specimens were col-lected from the roadsides with the specific locality not provided. Table 2 shows the number of sickleweed specimens collected from different habitats at different time periods.
Introduction, spread and naturalization—On most of the sickleweed her-barium labels, the species is noted to be introduced and native to Europe and Asia, but without a mention of the actual country of origin of the accession. The status of the plant was given as “naturalized”, “adventive” or “common” in most of the counties at the time of collection, but in few cases the plant was described as “rare”. There is no information on how this species was introduced to the United States. There exists, however, some literature about collector’s observation of the species in the field that provides some valuable clues. Gress (1923) report-
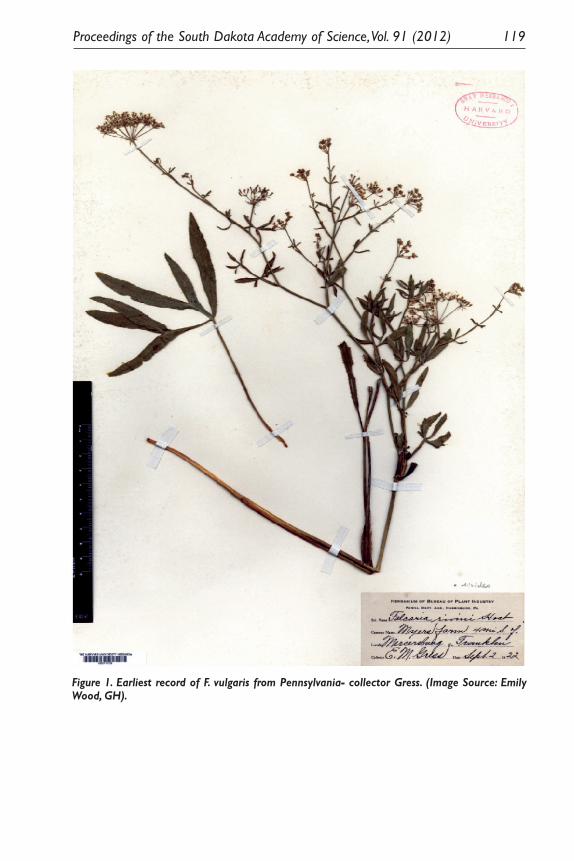
Proceedings of the South Dakota Academy of Science, Vol. 91 (2012) 119
Figure 1. Earliest record of F. vulgaris from Pennsylvania- collector Gress. (Image Source: Emily Wood, GH).
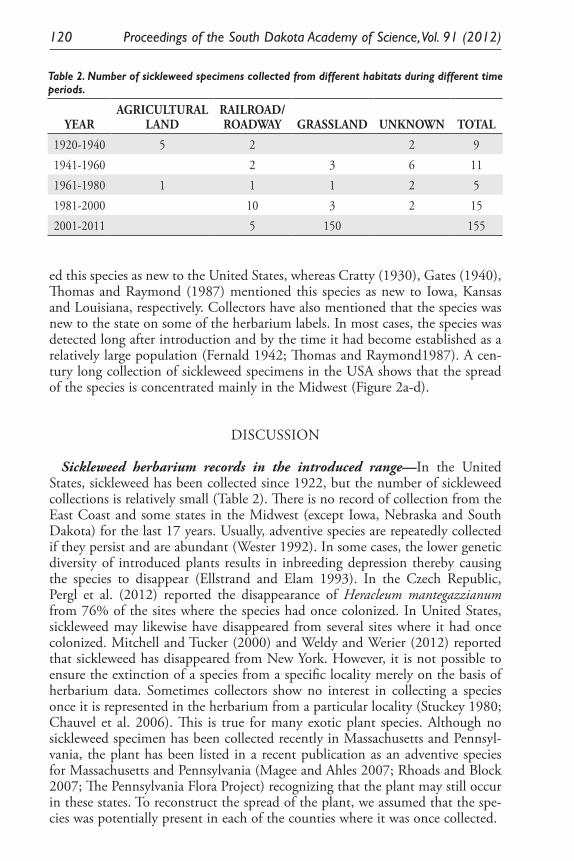
120 Proceedings of the South Dakota Academy of Science, Vol. 91 (2012)
ed this species as new to the United States, whereas Cratty (1930), Gates (1940), Thomas and Raymond (1987) mentioned this species as new to Iowa, Kansas and Louisiana, respectively. Collectors have also mentioned that the species was new to the state on some of the herbarium labels. In most cases, the species was detected long after introduction and by the time it had become established as a relatively large population (Fernald 1942; Thomas and Raymond1987). A cen-tury long collection of sickleweed specimens in the USA shows that the spread of the species is concentrated mainly in the Midwest (Figure 2a-d).
DISCUSSION
Sickleweed herbarium records in the introduced range—In the United States, sickleweed has been collected since 1922, but the number of sickleweed collections is relatively small (Table 2). There is no record of collection from the East Coast and some states in the Midwest (except Iowa, Nebraska and South Dakota) for the last 17 years. Usually, adventive species are repeatedly collected if they persist and are abundant (Wester 1992). In some cases, the lower genetic diversity of introduced plants results in inbreeding depression thereby causing the species to disappear (Ellstrand and Elam 1993). In the Czech Republic, Pergl et al. (2012) reported the disappearance of Heracleum mantegazzianum from 76% of the sites where the species had once colonized. In United States, sickleweed may likewise have disappeared from several sites where it had once colonized. Mitchell and Tucker (2000) and Weldy and Werier (2012) reported that sickleweed has disappeared from New York. However, it is not possible to ensure the extinction of a species from a specific locality merely on the basis of herbarium data. Sometimes collectors show no interest in collecting a species once it is represented in the herbarium from a particular locality (Stuckey 1980; Chauvel et al. 2006). This is true for many exotic plant species. Although no sickleweed specimen has been collected recently in Massachusetts and Pennsyl-vania, the plant has been listed in a recent publication as an adventive species for Massachusetts and Pennsylvania (Magee and Ahles 2007; Rhoads and Block 2007; The Pennsylvania Flora Project) recognizing that the plant may still occur in these states. To reconstruct the spread of the plant, we assumed that the spe-cies was potentially present in each of the counties where it was once collected.
Table 2. Number of sickleweed specimens collected from different habitats during different time periods.
YEARAGRICULTURAL
LANDRAILROAD/ROADWAY GRASSLAND UNKNOWN TOTAL
1920-1940 5 2 2 91941-1960 2 3 6 111961-1980 1 1 1 2 51981-2000 10 3 2 152001-2011 5 150 155
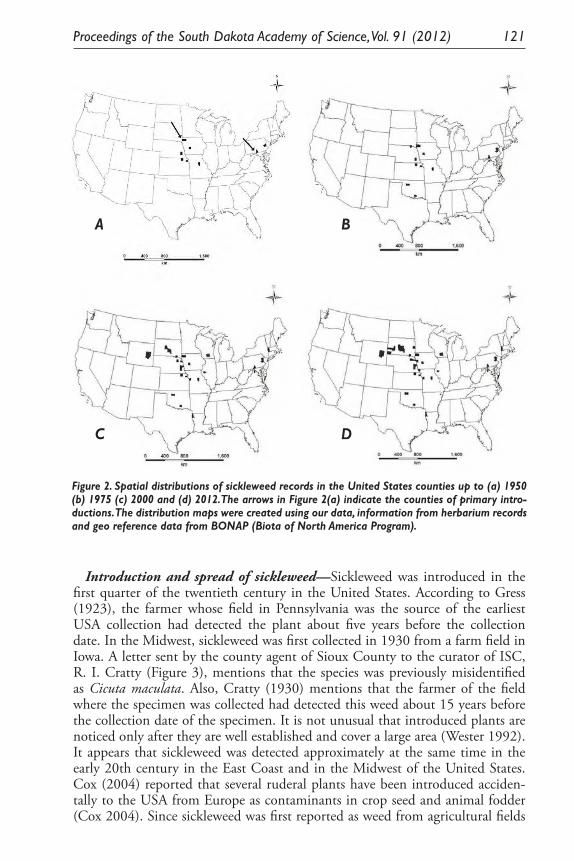
Proceedings of the South Dakota Academy of Science, Vol. 91 (2012) 121
Introduction and spread of sickleweed—Sickleweed was introduced in the first quarter of the twentieth century in the United States. According to Gress (1923), the farmer whose field in Pennsylvania was the source of the earliest USA collection had detected the plant about five years before the collection date. In the Midwest, sickleweed was first collected in 1930 from a farm field in Iowa. A letter sent by the county agent of Sioux County to the curator of ISC, R. I. Cratty (Figure 3), mentions that the species was previously misidentified as Cicuta maculata. Also, Cratty (1930) mentions that the farmer of the field where the specimen was collected had detected this weed about 15 years before the collection date of the specimen. It is not unusual that introduced plants are noticed only after they are well established and cover a large area (Wester 1992). It appears that sickleweed was detected approximately at the same time in the early 20th century in the East Coast and in the Midwest of the United States. Cox (2004) reported that several ruderal plants have been introduced acciden-tally to the USA from Europe as contaminants in crop seed and animal fodder (Cox 2004). Since sickleweed was first reported as weed from agricultural fields
15
Figure 2 (a)
Figure 2 (b)
15
Figure 2 (a)
Figure 2 (b)
16
Figure 2 (c)
Figure 2 (d)
Figure 2
16
Figure 2 (c)
Figure 2 (d)
Figure 2
Figure 2. Spatial distributions of sickleweed records in the United States counties up to (a) 1950 (b) 1975 (c) 2000 and (d) 2012.The arrows in Figure 2(a) indicate the counties of primary intro-ductions. The distribution maps were created using our data, information from herbarium records and geo reference data from BONAP (Biota of North America Program).
A B
C D
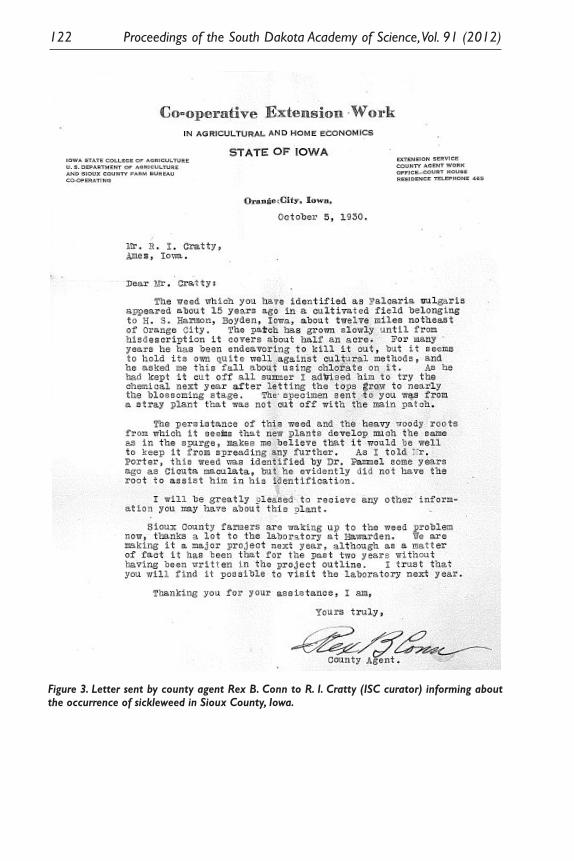
122 Proceedings of the South Dakota Academy of Science, Vol. 91 (2012) 17
Figure 3
Figure 3. Letter sent by county agent Rex B. Conn to R. I. Cratty (ISC curator) informing about the occurrence of sickleweed in Sioux County, Iowa.
Proceedings of the South Dakota Academy of Science, Vol. 91 (2012) 123
in both the East Coast and the Midwest states, we assume that this species was introduced accidentally, and perhaps as a seed contaminant.
If introduced species have commercial value, then they could have been purposely introduced; otherwise they could be assumed to be accidentally in-troduced (Wester 1992). In some parts of its native range, sickleweed has been traditionally used as a medicinal herb to treat skin ulcers, stomach disorders, liver diseases, and kidney and bladder stones, and has also been eaten as a vegetable (See Khazaei and Salehi 2006). Fernald (1942) reported the occurrence of a sickleweed population in Missouri near a community with a large number of German immigrants, suggesting the population could have been intentionally introduced from central Europe.
Based on the distribution map constructed using herbarium specimens (Figure 2), we see two disjunct distributions with earliest detections on both the East Coast and in the Midwest being nearly simultaneous. We therefore propose two primary introductions of sickleweed in the United States. The sickleweed popula-tion in Franklin County, Pennsylvania, is possibly the source population for the East Coast and the population in Sioux County, Iowa for the Midwest. Propa-gules then may have been dispersed from these primary sites to the other sites (Figure 2a) through various mechanisms. Transportation of plant propagules occur through the attachment of seeds to muddy vehicles or tires used for hu-man and freight transportation (Kowarik and von der Lippe 2007). Additionally, the cutting and transporting of hay that included sickleweed with mature seed could account for the spread. Furthermore, when the sickleweed plant senesces, it breaks at the nodes, and plant segments tumble in the wind to disperse the seed (See Limpert et al. 2004; Korman 2011). Also, the seeds might have been transported from the primary sites by mammals and birds. For example, there is some evidence of sickleweed seeds being transported from the plant’s native range to other countries within Europe by ducks and other water birds (Brochet et al. 2009). If molecular data derived from analysis of herbarium specimens and extant populations were combined with the herbarium data, which is a com-monly used approach (see Novak and Mack 2001; Valliant et al. 2007), better insight into the entry and spread of sickleweed in the USA could be had.
Current control effort and future prospects—Attempts to control sickleweed at FPNG in South Dakota have shown how difficult this weed can be once it becomes established. It was first detected at FPNG in 1992, and at that time this species had infested only 65 hectares of land. But attempts to manage the outbreak began only after a decade had passed and the plant was spreading ag-gressively and overtaking the grassland vegetation. An attempt to control the species spread by using prescribed fire proved ineffective. Herbicide treatment with Dupont Telar XP® has been practiced since 2004 to control spread of the weed and has proven effective with repeat applications, although not all of the area infested has been treated and new patches are being found outside of treated areas (Korman 2011) with current infestation now an estimated 6,000 acres. This example illustrates the need to eradicate exotic plant infestations as soon as they are detected. Eradication of invasive species can be easy when a few plants are found early by appropriate survey, or the population size is small and confined to
124 Proceedings of the South Dakota Academy of Science, Vol. 91 (2012)
a small area (Wester 1992), but when the area of infestation increases, the cost of control and management increases exponentially (Rejmanek and Pitcairn 2002).
In Nebraska, we observed the occurrence of several large populations of sick-leweed along roadsides. According to Pysek and Prach (1993), if invasive species occur along roadsides or railroad tracks, these sites not only harbor the plant, but also serve as corridors for their spread. Plants growing along roadsides are more likely to be transported by vehicles and may also spread to nearby pastures and hay fields by means of wind or other agents. In Nebraska, sickleweed is listed as a Category II invasive plant by the Nebraska Invasive Species Council (2011). Thus far, no major program has been launched for its control and management (K. Decker, University of Nebraska - Lincoln), but recently the large popula-tion in Lancaster County, Nebraska, has been herbicided and all plants appear to be dead (R Kaul, University of Nebraska- Lincoln). Infestations at FPNG and BGNG in South Dakota and along roadsides in Nebraska that represent diverse habitats make it necessary that control strategies involve cooperation among public land managers, transportation departments, and private landown-ers to hope for effective long term control and management. This study on the distribution and spread of sickleweed is pursued for purposes of realizing better control strategies and management practices in the region. In this paper, we present information compiled to interpret the status of recent sickleweed popula-tions relative to those of the past. The absence of recent sickleweed records from states other than Iowa, Nebraska, and South Dakota suggests that this species is growing undetected or not currently present in those states. However, should it become established over a period of time, it may become invasive elsewhere when a sufficient number of propagules are transported to congenial environments as discussed by Kolar and Lodge (2001). In this study we used herbarium data to reconstruct the introduction history of sickleweed and its subsequent dispersal in the United States. Additionally, knowing the environmental limits of this plant along with the dispersal pathways will help us predict the areas that are vulner-able to future invasion.
ACKNOWLEDGEMENTS
We gratefully acknowledge the curators/collection managers/university per-sonnel of the herbaria cited in this paper for providing information about their sickleweed holdings. We thank Emily Wood from Harvard University Her-barium (GH) and Dr. Deborah Lewis from Iowa State University Herbarium (ISC) for granting permission to use images of the oldest USA specimen and a descriptive note by one collector, respectively. Dr. Robert Kaul (NEB), Karie Decker from the University of Nebraska Lincoln (UNL) and Misako Nishino (Biota of North America Program) are gratefully acknowledged for providing us information on sickleweed distribution records. We would also like to thank Drs. Robert Kaul (NEB), Robert Tatina (Dakota Wesleyan University), Dave Ode (South Dakota Game Fish and Parks) and Grace Kostel (Black Hill State University) for reviewing the manuscript. This project was partly supported by startup fund to Dr. M. Nepal through Department of Biology and Microbiology,
Proceedings of the South Dakota Academy of Science, Vol. 91 (2012) 125
South Dakota Agricultural Experiment Station and partly by Rocky Mountain Research Station (USDA Forest Service).
LITERATURE CITED
Barney, J.N. 2006. North American history of two invasive plant species: phy-togeographic distribution, dispersal vectors, and multiple introdutions. Biological Invasions 8:703-717.
Bojnansky, V., and A. Fargasova. 2007. Atlas of seeds and fruits of Central and East European flora. Springer, The Netherlands.
Brochet, A., M. Guillemain, H. Fritz, M. Gauthier-Clerc, and A.J. Green. 2009. The role of migratory ducks in the long-distance dispersal of native plants and the spread of exotic plants in Europe. Ecography 32:919-928.
Chauvel, B., F. Dessaint, C. Cardinal-Legrand, and F. Bretagnolle. 2006. The historical spread of Ambrosia artemisiifolia L. in France from herbarium records. Journal of Biogeography 33:665-673.
Clapham, R., T.G. Tutin, and D.M. Moore.1989. Flora of the British Isles. Cambridge University Press, NY.
Cox, G.W. 2004. Alien species and evolution. Island press, Washington DC.Cratty, R.I. New weed is given name of sicklewort. Des Moines Register, 23
November, 1930.Crawford, H.C., and B.W. Hoagland. 2009. Can herbarium records be used to
map alien species invasion and native species expansion over the past 100 years? Journal of Biogeography 36:651-661.
Delisle, F., C. Lavoie, M. Jean, and D. Lachance. 2003. Reconstructing the spread of invasive plants: taking into account biases associated with her-barium specimens. Journal of Biogeography 30:1033-1042.
Dybas, C.L. 2004. Invasive species: The search for solutions. Bioscience 54:615-621.
Eilers, L.J., and D.M. Roosa. 1994. The vascular plants of Iowa: an annotated checklist and natural history. University of Iowa Press, Iowa City, IA.
Ellstrand, N.C., and D.R. Elam. 1993. Population genetic consequences of small population size: implications for plant conservation. Annual Review of Ecol-ogy and Systematics 24:217–42.
ESRI. 2008. ArcGIS, version 9.3. Environmental Systems Research Institute, Redlands, CA.
Fernald, M.L. 1942. Misinterpretation of Atlantic coastal plain species. Rhodora 44:238-246.
Gates, F.C. 1940. Recent migrational trends in the distribution of weeds in Kan-sas. Transactions of the Kansas Academy of Science 43:99-117.
Goralski, G., P. Lubczyńska, and A.J. Joachimiak. 2009. Chromosome Num-ber Database. Available at http://www.binoz.uj.edu.pl:8080/chromosomes/ [Cited April 06, 2011].
Gress, E.M.1923. Falcaria rivini a plant new to the United States. Rhodora 25:13-14.
126 Proceedings of the South Dakota Academy of Science, Vol. 91 (2012)
Holmgren, P.K., N.H. Holmgren, and L.C. Barnett. 1990. Index Herbariorum. Part I, The herbaria of the world, 8th ed. IAPT and the New York Botanical Garden, NY.
Khazaei, M., and H. Salehi. 2006. Protective effect of Falcaria vulgaris extract on ethanol induced gastric ulcer in rat. Iranian Journal of Pharmacology and Therapeutics 5:43-46.
Knuth, P., and H. Muller. 1908. Handbook of flower pollination. Clarendon Press, Oxford.
Kolar, C.S., and D.M. Lodge. 2001. Progress in invasion biology: predicting invaders. Trends in Ecology and Evolution 16:199-204.
Korman, B.L. 2011. Biology and ecology of Sickleweed (Falcaria vulgaris) in the Fort Pierre National Grassland of South Dakota. Thesis. South Dakota State University, Brookings, SD.
Kowarik, I., and M. von der Lippe. 2007. Pathways in plant invasions. Pages 29-47 in W. Nentwig, editor. Ecological Studies. Springer, Berlin.
Lambrinos, J.G. 2001. The expansion history of a sexual and asexual species of Cortaderia in California, USA. Journal of Ecology 89:88-98.
Larina, S.Y. 2008. Falcaria vulgaris Bernh. Interactive agricultural ecological at-las of Russia and neighboring countries. In A.N. Afonin, S.L. Greene, N.I. Dzyubenko and A.N. Frolov, editors. Economic plants and their diseases, pests and weeds. Available at http://www.agroatlas.ru/en/content/weeds/Falcaria_vulgaris/ [Cited June 04, 2011.]
Laughlin, D.C. 2003. Geographic distribution and dispersal mechanisms of Bouteloua curtipendula in the Appalachian Mountains. American Midland Naturalist 149:268-281.
Lavoie, C., M. Jean, F. Delisle, and G. Letourneau. 2003. Exotic plant species of the St Lawrence River wetlands: a spatial and historical analysis. Journal of Biogeography 30:537-549.
Lavoie, C., Y. Jodoin, and A.G. de Merlis. 2007. How did common ragweed (Ambrosia artemisiifolia L.) spread in Quebec? A historical analysis using herbarium records. Journal of Biogeography 34:1751-1761.
Lerdau, M., and J.D. Wickham. 2011. Non-natives: four risk factors. Nature 475:36-37.
Limpert, E., K. Ammann, P. Bartos, W.K. Graber, G. Kost, and J.G. Fuchs. 2004. Airborne migration of obligate nomads demonstrates gene flow across Eurasia. Pages 339-352 in D. Werner, editor. Biological Resources and Mi-gration. Springer, NY.
Mack, R.N. 1991. The commercial seed trade: An early disperser of weeds in the United States. Economic Botany 45:257-273.
MacRoberts, B.R., and M.H. MacRoberts. 2006. An updated, annotated vascu-lar flora of Caddo Parish, Louisiana, with notes on regional phytogeography and ecology. SIDA Contributions to Botany 22:1191-1219.
Magee, D.W., and H.E. Ahles. 2007. Flora of the Northeast: a manual of the vascular flora of New Enlgand and adjacent New York, 2nd ed. University of Massachusetts Press, Amherst, MA.
Proceedings of the South Dakota Academy of Science, Vol. 91 (2012) 127
Mihulka, S., and P. Pysek. 2001. Invasion history of Oenothera congeners in Europe: a comparative study of spreading rates in the last 200 years. Journal of Biogeography 28:597-609.
Mitchell, R.S., and G.C. Tucker. 2000. Revised checklist of New York state plants. New York State Museum, Albany.
Mooney, H.A., and E.E. Cleland. 2001. The evolutionary impact of invasive species. Proceedings of the National Academy of Sciences 98:5446-5451.
NISC (2011) Invasive plants of Nebraska. Available at http://snr5.unl.edu/invasives/pdfs/Invasive%20Plant%20Lists/NE%20Invasive%20Plants%20List%20Only%204-14-11.pdf [Cited 5 November, 2011].
Novak, S.J., and R.N. Mack. 2001. Tracing plant introduction and spread: Ge-netic evidence from Bromus tectorum (Cheatgrass). Bioscience 51:114-122.
Pergl, J., P. Pysek, I. Perglova, and V. Jarosik. 2012. Low persistence of a monocarpic invasive plant in historical sites biases our perception of its actual distribution. Journal of Biogeography, Published online before print doi:10.1111/j.1365-2699.2011.02677.x.
Pimentel, D., L. Lach, R. Zuniga, and D. Morrison. 2000. Environmental and economic costs of nonindigenous species in the United States. Bioscience 50:53-65.
Pysek, P., and K. Prach. 1993. Plant invasion and the role of riparian habitats: a comparison of four species alien to central Europe. Journal of Biogeography 20:413-420.
Rejmanek, M., and M.J. Pitcairn. 2002. When is eradication of exotic pest plants a realistic goal? Pages 249-253 in C.R. Veitch and M.N. Clout, edi-tors. Turning the tide: the eradication of invasive species. IUCN SSC Inva-sive Specialist Group, Gland, Switzerland and Cambridge, UK.
Rhoads, A.F., and T.A. Block. 2007. The plants of Pennsylvania: an illustrated manual, 2nd ed. University of Pennsylvania Press, Philadelphia.
Ricciardi, A., W.W.M. Steiner, R.N. Mack, and D. Simberloff. 2000. Toward a global information system for invasive species. Bioscience 50:239-244.
Sakai, A.K., F.W. Allendorf, J.S. Holt, D.M. Lodge, J. Molofsky, K.A. With, S. Baughman, R.J. Cabin, J.E. Cohen, N.C. Ellstrand, D.E. Mncauley, P. O’Neil, I.M. Parker, J.N. Thomson, and S.G. Weller. 2001. The popula-tion biology of invasive species. Annual Review of Ecology and Systematics 32:305-332.
Sheeley, S.E., and D.J. Raynal. 1996. The distribution and status of species of Vincetoxicum in eastern North America. Bulletin of the Torrey Botanical Club 123:148-156.
Steyermark, J.A. 1963. Flora of Missouri. Iowa State University Press, Ames, Iowa.
Strother, J.L., and A.R. Smith. 1970. Chorology, collection dates, and taxonomic responsibility. Taxon 19:871-874.
Stuckey, R.L. 1980. Distributional history of Lythrum salicaria (Purple loose-strife) in North America. Bartonia. Proceedings of the Philadelphia Botani-cal Club 47:18.
Thomas, R.D., and L.R. Raymond. 1987. Falcaria vulgaris Bernh. (Apiaceae): New to Louisiana. The Southwestern Naturalist 32:279.
128 Proceedings of the South Dakota Academy of Science, Vol. 91 (2012)
USDA, ARS. 2012. National Genetic Resources Program. Germplasm resources information network (Online Database). National germplasm resources laboratory, Beltsville, Maryland. Available at http://www.ars-grin.gov/cgi-bin/npgs/html/noxweed.pl [Cited 14 March 2012].
USDA, NRCS. 2011. The Plants Database. National Plant Data Center, Baton Rouge, LA 70874-4490 USA. Available at http://plants.usda.gov [Cited 16 April 2011].
Valliant, M.T., R.N. Mack, and S.J. Novak. 2007. Introduction history and pop-ulation genetics of the invasive grass Bromus tectorum (Poaceae) in Canada. American Journal of Botany 94:1156-1169.
Weber, E. 1998. The dynamics of plant invasions: a case study of three exotic goldenrod species (Solidago L.) in Europe. Journal of Biogeography 25:147-154.
Weldy, T., and D. Werier. 2012. New York flora atlas. Available at http://newy-ork.plantatlas.usf.edu/ [Cited 2 february, 2012].
Wester, L. 1992. Origin and distribution of adventive alien flowering plants in Hawaii. Pages 99-154 in C.P. Stone, C.W. Smith and J.T. Tunison, editors. Alien plant invasions in native ecosystems of Hawaii: Management and re-search. University of Hawaii, Manoa.
Woods, T.M., S.C. Strakosh, M.P. Nepal, S. Chakrabati, N.B. Simpson, M.H. Mayfield, and C.J. Ferguson. 2005. Introduced species in Kansas: floristic changes and patterns of collection based on an historical herbarium. SIDA Contributions to Botany 21:1695-1725.
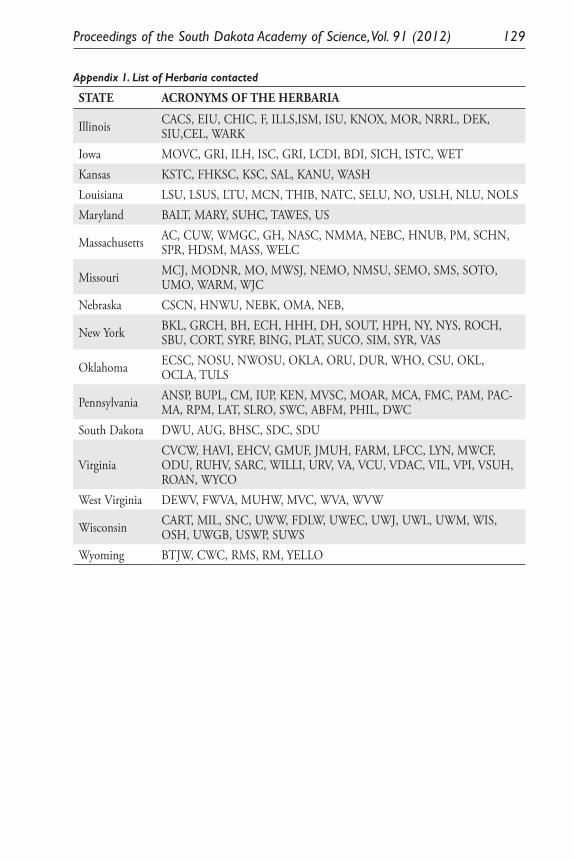
Proceedings of the South Dakota Academy of Science, Vol. 91 (2012) 129
Appendix 1. List of Herbaria contacted
STATE ACRONYMS OF THE HERBARIA
Illinois CACS, EIU, CHIC, F, ILLS,ISM, ISU, KNOX, MOR, NRRL, DEK, SIU,CEL, WARK
Iowa MOVC, GRI, ILH, ISC, GRI, LCDI, BDI, SICH, ISTC, WETKansas KSTC, FHKSC, KSC, SAL, KANU, WASHLouisiana LSU, LSUS, LTU, MCN, THIB, NATC, SELU, NO, USLH, NLU, NOLSMaryland BALT, MARY, SUHC, TAWES, US
Massachusetts AC, CUW, WMGC, GH, NASC, NMMA, NEBC, HNUB, PM, SCHN, SPR, HDSM, MASS, WELC
Missouri MCJ, MODNR, MO, MWSJ, NEMO, NMSU, SEMO, SMS, SOTO, UMO, WARM, WJC
Nebraska CSCN, HNWU, NEBK, OMA, NEB,
New York BKL, GRCH, BH, ECH, HHH, DH, SOUT, HPH, NY, NYS, ROCH, SBU, CORT, SYRF, BING, PLAT, SUCO, SIM, SYR, VAS
Oklahoma ECSC, NOSU, NWOSU, OKLA, ORU, DUR, WHO, CSU, OKL, OCLA, TULS
Pennsylvania ANSP, BUPL, CM, IUP, KEN, MVSC, MOAR, MCA, FMC, PAM, PAC-MA, RPM, LAT, SLRO, SWC, ABFM, PHIL, DWC
South Dakota DWU, AUG, BHSC, SDC, SDU
VirginiaCVCW, HAVI, EHCV, GMUF, JMUH, FARM, LFCC, LYN, MWCF, ODU, RUHV, SARC, WILLI, URV, VA, VCU, VDAC, VIL, VPI, VSUH, ROAN, WYCO
West Virginia DEWV, FWVA, MUHW, MVC, WVA, WVW
Wisconsin CART, MIL, SNC, UWW, FDLW, UWEC, UWJ, UWL, UWM, WIS, OSH, UWGB, USWP, SUWS
Wyoming BTJW, CWC, RMS, RM, YELLO

Proceedings of the South Dakota Academy of Science, Vol. 91 (2012) 131
EFFECT OF SAFE-GUARD® FREE-CHOICE PROTEIN BLOCKS ON TRICHOSTRONGYLE
NEMATODES IN PASTURED CATTLE FROM EASTERN SOUTH DAKOTA
S. J. Smith1, A. A. Eljaki2, J. Acharya2, R. F. Daly1 and M. B. Hildreth1,2*Departments of Veterinary Sciences1 and Biology & Microbiology2
South Dakota State University Brookings, SD 57007
*Corresponding author email: [email protected]
ABSTRACT
Parasitic nematodes have significant detrimental effects on the profitability of beef production in South Dakota. Administering anthelmintics can be in-convenient and expensive when treating cattle on pasture. Free-choice anthel-mintics were developed to improve the ability of beef producers to effectively deworm cattle without passing them through a cattle chute. The convenience of free-choice anthelmintics outweighs those of traditional deworming practices; however, the efficacy of the free-choice anthelmintics has not been tested under pasture conditions in the United States Northern Great Plains. The purpose of this study was to determine the efficacy of Safe-Guard® (fenbendazole) Free-choice Protein Blocks in pastures from eastern South Dakota. Two adjacent cattle herds were used for this study. A group of 42 heifers (treatment) were given one free-choice SafeGuard® Protein block for four days. A similar group of 22 steers (controls) were given similar, but non-medicated protein blocks. Both groups were parasitized with trichostrongyle nematodes; PCR results indicated the pres-ence of Haemonchus spp., Cooperia spp., Ostertagia spp. and Trichostrongylus spp. in the heifer herd. Prior to treatment, the arithmetic mean trichostrongyle egg output was numerically higher in the untreated steers (35.82 eggs/gram) than the treated heifers (22.63 eggs/gram), but not statistically different. After treatment with the Safe-Guard® blocks, egg output dropped significantly to 1.50 eggs/gram (greater than 93% reduction) in the treatment group, but increased significantly in the untreated group to an average of 69.03 eggs/gram (greater than 92% in-crease). Based upon the calculated consumption rate of the SafeGuard® Protein Block by the treatment group, the average dosage consumed was lower than that recommended by the manufacturer. In spite of the lower intake, access to the medicated blocks significantly decreased trichostrongyle nematode loads in the treated cattle during the study period.
Keywords
bovine, trichostrongyle, anthelmintic, fenbendazole, free-choice
132 Proceedings of the South Dakota Academy of Science, Vol. 91 (2012)
INTRODUCTION
Trichostrongyle nematodes have a detrimental impact on the profitability of cattle production even in herds from the United States Northern Plains (Mertz et al. 2005). Administration of anthelmintics for controlling these internal nematodes in cattle has changed over the last several decades from the use of oral liquids and pastes to the more convenient injectables, pour-ons, sustained-released-boluses and free-choice ingestibles. Free-choice anthelmintics have been developed to minimize the costs and problems associated with handling indi-vidual animals. At the present time in the United States, morantel tartrate and fenbendazole (FBZ) are the only anthelmintic active ingredients that are avail-able in any free-choice formulation. Fenbendazole (brand name Safe-Guard®) is available in several free-choice (i.e. non-handling) formulations including: flaked meal and minipellets (Safe-Guard® Mini-pellets, and Safe-Guard® Flakes), 0.5% alfalfa-based pellets/crumbles (Safe-Guard® Pellets ), mineral/salt (Safe-Guard® 20% or 35% Free-choice Mineral), a molasses-based block (Safe-Guard® En-Pro-AL® Molasses Block) and a 20% protein-based block (Safe-Guard® Protein Block).
Safe-Guard® free-choice formulations were first marketed in the late 1980s, and yet, surprisingly few studies have been conducted on the efficacy of these products in North America. Most of the available studies have been performed in southern (Blagburn et al. 1986; 1987; Bransby et al. 1992; Miller et al. 1992; Williams et al. 1995) and western states (Kvasnicka et al. 1996; Smith et al. 2000; Taylor et al. 2000), or in central Canada (Garossino et al. 2001; Garossino et al. 2005), but no published studies have come from the United States Northern Great Plains. The vast majority of fenbendazole free-choice studies utilized the mineral-based formulation (Williams et al. 1995; Kvasnicka et al. 1996; Smith et al. 2000; Taylor et al. 2000; Garossino et al. 2001; Garossino et al. 2005). Two studies utilized a free-grade premix and/or pellet formulation (Blagburn et al. 1986; Keith 1992), and two other studies utilized a block formulation (Blagburn et al. 1987; Bransby et al. 1992; Miller et al. 1992).
Fenbedazole is in the benzimidazole class of anthelmintic drugs which binds to helminth β-tubulin, further inhibiting the polymerization and formation of microtubules necessary for cell division, nutrient absorption and intracellular transport (Lubega and Prichard 1990, 1991; Prichard et al. 2003; Robinson et al. 2004). It is a broad spectrum anthelmintic that has shown a high capability of removing both immature and adult internal parasites in cattle (Keith 1992). First released as a 10% oral suspension, administration at 5 mg/kg FBZ controls immature nematodes located in the gastrointestinal tract of cattle, while admin-istration at 10 mg/kg will also control adult tapeworms (Crowley et al. 1977; Blagburn et al. 1987; Keith 1992).
The benefits of free-choice anthelmintics include: 1) a reduced amount of time handling cattle for oral deworming; 2) reduced handling which results in less stress on livestock; and 3) ability to administer the anthelmintic at strategic times to disrupt the parasitic life cycle and minimize pasture contamination (Garossino et al. 2001). In addition to demonstrating a decrease in the average number of nematodes present in a herd, studies have found an association between cattle
Proceedings of the South Dakota Academy of Science, Vol. 91 (2012) 133
strategically dewormed with FBZ and increased calf weaning weights and cow pregnancy rates (Myers 1988; Keith 1992). Deworming with FBZ free-choice mineral in steers on pasture or in feedlots correlates with increased daily gain, improved feed/gain ratio, increased carcass quality resulting in decreased feed costs and increased profitability (Smith et al. 2000; Taylor et al. 2000).
A major disadvantage to free-choice anthelmintics is the inability to control consumption (dosage) rates, particularly when given to a large herd on pasture (Garossino et al. 2001). This inability to guarantee adequate drug consumption is the major disadvantage of using free-choice anthelmintics. Another downside to free-choice anthelmintics, in particular the mineral salt block by Safe-Guard®, is the higher treatment cost per head, although some of these increased costs are offset by lower labor costs when using free-choice anthelmintics because cattle do not have to be processed through a handling system. An additional cost with the free-choice system is that cattle must be acclimated to a mineral block before the medicated protein block is administered (Blagburn et al. 1987). Thus, the cost per animal is increased while the assurance of an adequate anthelmintic dosage is diminished with this approach to treating cattle. Providing a subtherapeutic dos-age through the use of free-choice anthelmintics can accelerate the development of anthelmintic resistance in the cattle parasites (Lanusse 2010).
The present trial was implemented to study this Safe-Guard® product in a typi-cal stocker beef production setting on a pasture in eastern South Dakota. The outcomes from this study should provide cattle producers in this region needed information about the efficacy of this free-choice option under normal produc-tion conditions. This study was designed to compare the fecal egg counts (FECs) in a treated herd before and after treatment in a manner similar to a standard fecal egg count reduction test (FECRT).
METHODS
Pastures and Stocking Density—This anthelmintic trial took place from Sep-tember 7th through October 13th 2011, and the treatment group was comprised of 42 crossbred yearling heifers (approx. 800 lb, 363 kg) located on a 51.6 acre pasture comprised primarily of cool season grasses, generally Kentucky blue grass and green needle grass. Stocking rate for this treated group was 1.229 acres/hd, and the heifers were supplemented with cornstalks and grass hay bales. Due to the extended length of the study, an adjacent untreated herd was used to serve as a temporal control to ensure that any observed decreases in egg production in the post-treated herd were not the result of natural FEC decreases. Twenty-two cross-bred yearling steers (approx. 850 lb, 386 kg) were used for this temporal control group; this group was grazed on a 30.3 acre separate but similar non-adjoining pasture. Stocking rate for this control group was 1.375 acres/hd, but they were not supplemented with cornstalks or hay. These two pastures are located in east-central South Dakota, roughly latitude 44.26 - longitude -96.50.
Treatment—All cattle were on salt and mineral blocks free choice prior to starting the trial. The treatment group (heifers) was given a nonmedicated 20% protein block for seven days prior to treatment for adaptation to the medicated
134 Proceedings of the South Dakota Academy of Science, Vol. 91 (2012)
block (salt and mineral blocks were removed during the study). All mineral, protein and medicated blocks were placed on the ground in the same location, which was toward the center of the pasture. The control group (steers) had continuous access to salt and mineral blocks throughout the entire trial. One Safe-Guard® Protein Block (FBZ 11.34 kg 20% protein block) was given to the treatment group on September 19, 2011 (day 0) and was completely consumed by day 4. This would provide an average dosage of 446 mg FBZ/hd when com-pletely consumed over the four days. This is 25% of the dosage recommended by the manufacturer. Three additional FBZ blocks were placed in the treatment group pasture on day 9 (September 28) to ensure that adequate consumption of FBZ eventually occurred in the study. These blocks were removed on day 14 (October 3) and weighed. The total consumption for these last 3 blocks was 26.4 kg, resulting in an average consumed dose of 1,039 mg/hd; this is 57% of the recommended dosage. One heifer from treatment group became injured during the trial but was not removed. It is possible that she did not access the medicated blocks. Temperatures during the trial averaged 14.8 °C with a high of 30.6 °C and low of -2.2 °C.
Sample Collection and Analysis—For each collection day, attempts were made to collect 20 samples from each herd because this sample size was found to be representative of herd parasite loads (Gasbarre et al. 1996), but because it was not possible to collect paired samples before and after treatment, samples from multiple days were collected before and after treatment in order to im-prove the statistical power of the study. Fecal samples were collected on days -12, -7, -6, -5, -3, 0, 7, 16, 18, 22, and 24 from both groups. The number of fecal samples collected each day is reported in Figure 2, and attempts were made to collect samples from the freshest fecal pats found in each pasture during the sampling time. Three-gram samples were analyzed using the Modified Wisconsin Sugar Flotation Technique to establish trichostrongyle egg counts (Cox and Todd 1962). Results are reported as eggs/g (EPG) of feces, and summarized as arith-metic means and geometric means. Statistical comparisons were made using the Kruskal-Wallis (Nonparametric ANOVA) Test in Graphpad InStat® (version 3.05 for Windows 95/NT, GraphPad Software, San Diego California USA, www.graphpad.com). FECs were analyzed as raw data. Comparisons with P-values greater than 0.05 were not considered statistically different.
A polymerase chain reaction (PCR) assay was performed on DNA isolated from trichostrongyle eggs from 16 heifer fecal samples (containing the highest number of trichostrongyle eggs) prior to treatment to determine which tricho-strongyle species were present. The method for isolating DNA was as described by Harmon et al. (2006, 2009). The PCR assay was a simplex assay based upon a multiplex assay first described by Zarlenga et al. (2001), and refined by Harmon et. al. (2009). This gel-based assay was able to identify the following trichostron-gyle genera: Haemonchus, Ostertagia, Trichostrongylus, and Cooperia. Two separate primer pairs were used for detecting Haemonchus eggs. The ITS2 (2nd internal transcribed spacer) primers were as listed by Harmon et al. (2006); the ETS (ex-ternal transcribed spacer) primers were as listed by Zarlenga et al. (2001). The intensity of each PCR product band was visually scored from 1 to 3.
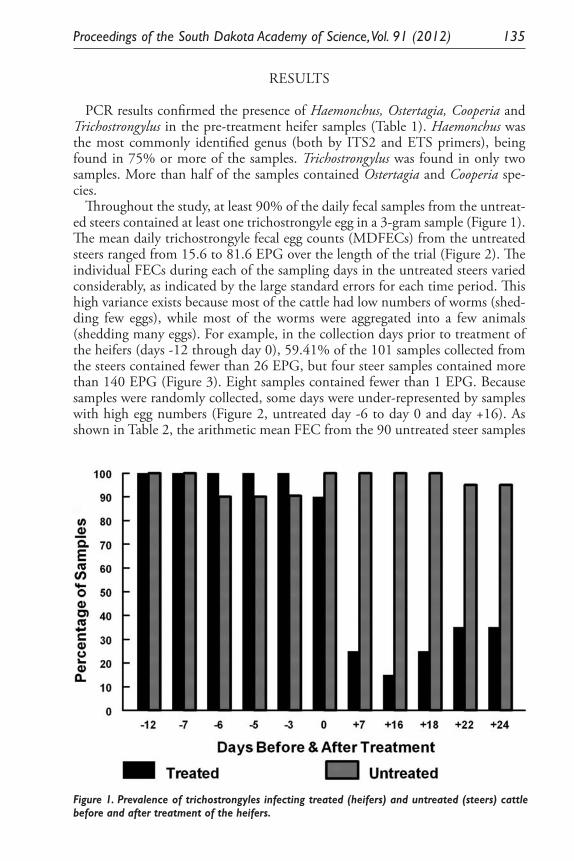
Proceedings of the South Dakota Academy of Science, Vol. 91 (2012) 135
RESULTS
PCR results confirmed the presence of Haemonchus, Ostertagia, Cooperia and Trichostrongylus in the pre-treatment heifer samples (Table 1). Haemonchus was the most commonly identified genus (both by ITS2 and ETS primers), being found in 75% or more of the samples. Trichostrongylus was found in only two samples. More than half of the samples contained Ostertagia and Cooperia spe-cies.
Throughout the study, at least 90% of the daily fecal samples from the untreat-ed steers contained at least one trichostrongyle egg in a 3-gram sample (Figure 1). The mean daily trichostrongyle fecal egg counts (MDFECs) from the untreated steers ranged from 15.6 to 81.6 EPG over the length of the trial (Figure 2). The individual FECs during each of the sampling days in the untreated steers varied considerably, as indicated by the large standard errors for each time period. This high variance exists because most of the cattle had low numbers of worms (shed-ding few eggs), while most of the worms were aggregated into a few animals (shedding many eggs). For example, in the collection days prior to treatment of the heifers (days -12 through day 0), 59.41% of the 101 samples collected from the steers contained fewer than 26 EPG, but four steer samples contained more than 140 EPG (Figure 3). Eight samples contained fewer than 1 EPG. Because samples were randomly collected, some days were under-represented by samples with high egg numbers (Figure 2, untreated day -6 to day 0 and day +16). As shown in Table 2, the arithmetic mean FEC from the 90 untreated steer samples
Figure 1. Prevalence of trichostrongyles infecting treated (heifers) and untreated (steers) cattle before and after treatment of the heifers.
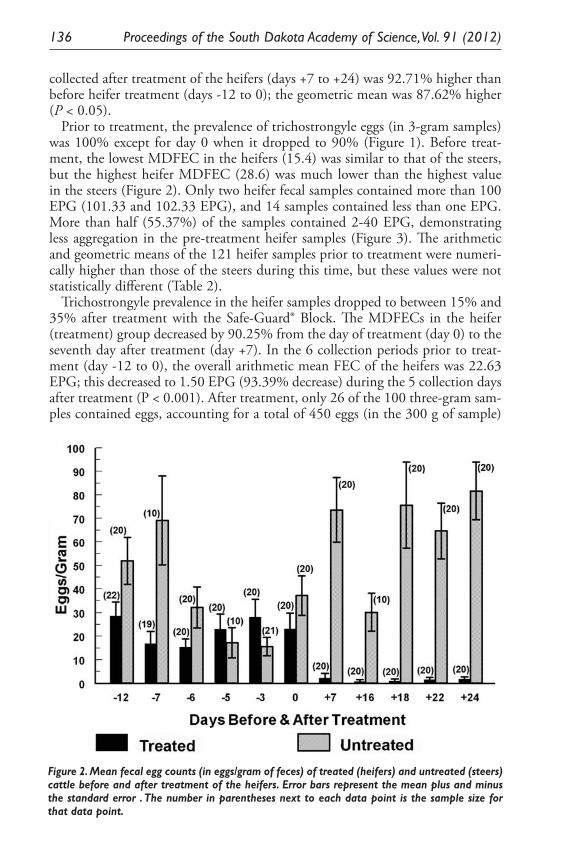
136 Proceedings of the South Dakota Academy of Science, Vol. 91 (2012)
collected after treatment of the heifers (days +7 to +24) was 92.71% higher than before heifer treatment (days -12 to 0); the geometric mean was 87.62% higher (P < 0.05).
Prior to treatment, the prevalence of trichostrongyle eggs (in 3-gram samples) was 100% except for day 0 when it dropped to 90% (Figure 1). Before treat-ment, the lowest MDFEC in the heifers (15.4) was similar to that of the steers, but the highest heifer MDFEC (28.6) was much lower than the highest value in the steers (Figure 2). Only two heifer fecal samples contained more than 100 EPG (101.33 and 102.33 EPG), and 14 samples contained less than one EPG. More than half (55.37%) of the samples contained 2-40 EPG, demonstrating less aggregation in the pre-treatment heifer samples (Figure 3). The arithmetic and geometric means of the 121 heifer samples prior to treatment were numeri-cally higher than those of the steers during this time, but these values were not statistically different (Table 2).
Trichostrongyle prevalence in the heifer samples dropped to between 15% and 35% after treatment with the Safe-Guard® Block. The MDFECs in the heifer (treatment) group decreased by 90.25% from the day of treatment (day 0) to the seventh day after treatment (day +7). In the 6 collection periods prior to treat-ment (day -12 to 0), the overall arithmetic mean FEC of the heifers was 22.63 EPG; this decreased to 1.50 EPG (93.39% decrease) during the 5 collection days after treatment (P < 0.001). After treatment, only 26 of the 100 three-gram sam-ples contained eggs, accounting for a total of 450 eggs (in the 300 g of sample)
Figure 2. Mean fecal egg counts (in eggs/gram of feces) of treated (heifers) and untreated (steers) cattle before and after treatment of the heifers. Error bars represent the mean plus and minus the standard error . The number in parentheses next to each data point is the sample size for that data point.
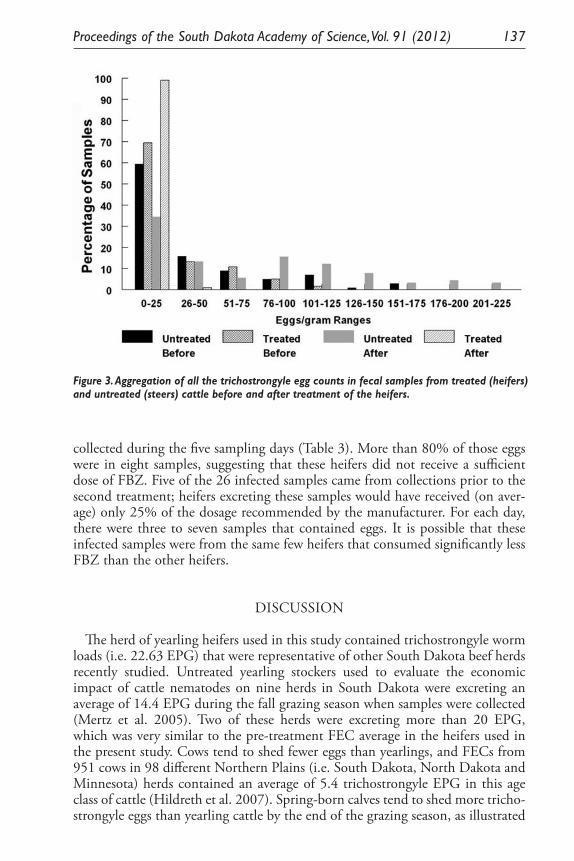
Proceedings of the South Dakota Academy of Science, Vol. 91 (2012) 137
collected during the five sampling days (Table 3). More than 80% of those eggs were in eight samples, suggesting that these heifers did not receive a sufficient dose of FBZ. Five of the 26 infected samples came from collections prior to the second treatment; heifers excreting these samples would have received (on aver-age) only 25% of the dosage recommended by the manufacturer. For each day, there were three to seven samples that contained eggs. It is possible that these infected samples were from the same few heifers that consumed significantly less FBZ than the other heifers.
DISCUSSION
The herd of yearling heifers used in this study contained trichostrongyle worm loads (i.e. 22.63 EPG) that were representative of other South Dakota beef herds recently studied. Untreated yearling stockers used to evaluate the economic impact of cattle nematodes on nine herds in South Dakota were excreting an average of 14.4 EPG during the fall grazing season when samples were collected (Mertz et al. 2005). Two of these herds were excreting more than 20 EPG, which was very similar to the pre-treatment FEC average in the heifers used in the present study. Cows tend to shed fewer eggs than yearlings, and FECs from 951 cows in 98 different Northern Plains (i.e. South Dakota, North Dakota and Minnesota) herds contained an average of 5.4 trichostrongyle EPG in this age class of cattle (Hildreth et al. 2007). Spring-born calves tend to shed more tricho-strongyle eggs than yearling cattle by the end of the grazing season, as illustrated
Figure 3. Aggregation of all the trichostrongyle egg counts in fecal samples from treated (heifers) and untreated (steers) cattle before and after treatment of the heifers.
138 Proceedings of the South Dakota Academy of Science, Vol. 91 (2012)
in the results from 483 calves from the same 98 Northern Plains herds; these calves were shedding an average of 33.79 EPG by September through November (Hildreth et al. 2007).
The genera of trichostrongyles identified in the heifers from this present study were similar to those identified in calves from 13 cow-calf herds in eastern South Dakota (Harmon et al. 2009). In the present study, Haemonchus was the genus most commonly identified (75% of all samples) in the heifer herd; whereas, only 26.8% of the calves from the 13 herds were infected with Haemonchus. The steer herd (in a pasture very close to the heifer pasture) was simply used as temporal control to ensure that any observed decreases in egg production in the post-treated herd were not the result of natural FEC decreases. Stromberg and Corwin (1993) have shown that FECs in cattle will eventually begin to decrease during the fall season, especially during October and November. The MDFECs within the control steer herd actually increased during the experimental time pe-riod, suggesting that no natural decreases would be expected within the adjacent heifer herd.
At the initial treatment period (day 0), the treatment (heifer) group was in-advertently under-dosed and received only one-fourth the recommended dosage of Safe-Guard® block material, and yet, the MDFECs in this group showed a 90.25% decrease 7 days after treatment. Many of the eggs still being shed after the first treatment were likely in heifers that did not receive an adequate dose of FBZ. After 3 additional Safeguard® blocks were given to the treatment herd at day +9, only 3 out of the 20 heifer samples were shedding eggs during the next collection period (day +16) even though the combined FBZ consumption level was only slightly over half the recommended dosage. By the end of the study, the number of fecal samples with eggs had increased slightly to 7 out of the 20 samples, but after the second treatment, the MDFEC stayed below 2 EPG. In-corporating all of the pre- and post-treatment data from the multiple collection days into the FECRT evaluation clearly showed that the addition of Safeguard® blocks to the heifer pasture very significantly decreased both the prevalence (by more than 65%) and the trichostrongyle FECs intensity (by more than 93%) in the treated herd. Utilization of the recommended dosage may have slightly im-proved the outcome of this study, but only by a small amount. The low number of infected fecal samples suggests that the vast majority of heifers consumed a sufficient quantity of FBZ. Results from this South Dakota study are consistent with findings involving Safe-Guard® Blocks in post-weanling calves from Ala-bama and Louisiana (Blagburn et al. 1987; Miller et al. 1992). The 50 calves from the Alabama study were first grazed on a contaminated pasture and then housed individually in dirt pens during the evaluation period. Block consump-tion rates were monitored and adjusted to enable each calf in the treatment groups to consume a total of 5 mg/kg FBZ. Under these conditions adult and immature trichostrongyles numbers decreased by more than 99%, and the FEC dropped from a mean of 1,620 EPG in the untreated controls down to 0 in the treated groups (Blagburn et al. 1987). Calves were kept on pasture throughout the Louisiana study, and the effectiveness of the block treatment in this study was significantly less than in the Alabama study (Miller et al. 1992). The 93% FEC reduction measured in the present South Dakota study was slightly less effective
Proceedings of the South Dakota Academy of Science, Vol. 91 (2012) 139
than in the Alabama study. This may be due to the fact that this study was con-ducted under pasture conditions, but it is more likely that this lower deworming efficacy was due to the suboptimal dosing with FBZ in the South Dakota study.
Cost is a very important factor for cattle producers when considering anthel-mintic approaches for use in their herd. A simple comparison of web-based prices for various anthelmintic products demonstrates that free-choice anthelmintics are generally not the least expensive approach; however, these products don’t require the labor costs needed for working cattle in the chutes during the treat-ment process. Working pastured cattle through a chute also adds stress to these animals which can also risk injuries and negatively impact production factors. Therefore, with free-choice anthelmintics it is possible to treat cattle multiple times when necessary. Free-choice anthelmintics could be particularly useful in bison production.
In summary, this study has found that there are both benefits and challenges to using free-choice anthelmintics. The Safe-Guard® Mineral Block showed signifi-cant reduction in fecal egg count numbers; however egg reduction was not seen in the entire herd, indicating that there may be consumption issues in providing a proper dosage for each animal. When inadequate dosages of anthelmintics are used, there is a risk for increased anthelmintic resistance. Use of free-choice anthelmintics not only decreases labor costs, but also reduces the amount of stress put on animals at times of processing. Future studies should monitor the development of anthelmintic resistance in a herd treated with free-choice anthel-mintics during extended time periods.
ACKNOWLEDGEMENTS
This work was supported in part by the South Dakota State University Ag-ricultural Experiment Station. Special thanks to Alex Hegerfeld for technical support. This project also utilized the South Dakota State University Functional Genomics Core Facility supported in part by the National Science Foundation/EPSCoR Grant No. 0091948 and by the State of South Dakota.
LITERATURE CITED
Blagburn, B. L., D. S. Lindsay, C. M. Hendrix, and L. A. Hanrahan. 1986. Evaluation of three formulations of fenbendazole (10 per cent suspension, 0.5 per cent pellets, and 20 per cent premix) against nematode infections in cattle. American Journal of Veterinary Research 47: 534-536.
Blagburn, B. L., D. S. Lindsay, C. M. Hendrix, and L. A. Hanrahan. 1987. Efficacy of fenbendazole-medicated feed blocks against gastrointestinal nematode infections in calves. American Journal of Veterinary Research 48: 1017-1019.
Bransby, D. I., D. E. Snyder, and W. B. Webster. 1992. Medicated supplement blocks effective for deworming beef cattle. Highlights of Agricultural Re-search at the Alabama Agriculture Experiment Station 39: 6.
140 Proceedings of the South Dakota Academy of Science, Vol. 91 (2012)
Cox, D. D., and A. C. Todd. 1962. Survey of gastrointestinal parasitism in Wis-consin dairy cattle. Journal of the American Veterinary Medical Association 141: 706-709.
Crowley, J. W., Jr., A. C. Todd, D. H. Bliss, and W. J. Foreyt. 1977. Further controlled evaluations of fenbendazole as a bovine anthelmintic. American Journal of Veterinary Research 38: 689-692.
Garossino, K. C., G. Royan, M. E. Olson, D. N. Milligan, B. J. Ralston, and T. A. McAllister. 2001. Individual intake and antiparasitic efficacy of free choice mineral and fenbendazole in range calves. Veterinary Parasitology 94: 151-162.
Garossino, K. C., B. J. Ralston, M. E. Olson, T. A. McAllister, D. N. Milligan, and B. M. A. Genswein. 2005. Individual intake and antiparasitic efficacy of free choice mineral containing fenbendazole for grazing steers. Veterinary Parasitology 129: 35-41.
Gasbarre, L. C., E. A. Leighton, and D. Bryant. 1996. Reliability of a single fe-cal egg per gram determination as a measure of individual and herd values for trichostrongyle nematodes of cattle. American Journal of Veterinary Research 57: 168-171.
Harmon, A. F., D. S. Zarlenga, and M. B. Hildreth. 2006. Improved methods for isolating DNA from Ostertagia ostertagi eggs in cattle feces. Veterinary Parasitology 135: 297-302.
Harmon, A. F., B. C. Lucas, and M. B. Hildreth. 2009. PCR comparison of trichostrongyle genera present in South Dakota cattle with and without springtime deworming Proceedings of the South Dakota Academy of Sci-ence 88: 147-154.
Hildreth, M. B., W. B. Epperson, and K. J. Mertz. 2007. Effect of longitude and latitude on fecal egg and oocyst counts in cow-calf beef herds from the United States Northern Great Plains. Veterinary Parasitology 149: 207-212.
Keith, E. A. 1992. Utilizing feed-grade formulations of fenbendazole for cattle. Agri-Practice 13: 7-17.
Kvasnicka, W. G., L. J. Krysl, R. C. Torell, and D. H. Bliss. 1996. Fenbendazole in a strategic deworming program. Compendium on Continuing Education for the Practicing Veterinarian April: S113-S117.
Lanusse, C. 2010. Anthelmintic Therapy in Ruminant Species: Understanding of the Host-Drug-Parasite Interaction. Anti-Infective Agents in Medicinal Chemistry 9: 130-138.
Lubega, G. W., and R. K. Prichard. 1990. Specific interaction of benzimidazole anthelmintics with tubulin: high affinity binding and benzimidazole resis-tance in Haemonchus contortus. Molecular and Biochemical Parasitology 38: 221-232.
Lubega, G. W., and R. K. Prichard. 1991. Interaction of benzimidazole anthel-mintics with Haemonchus contortus tubulin: binding affinity and anthelmin-tic efficacy. Experimental Parasitology 73: 203-213.
Mertz, K. J., M. B. Hildreth, and W. B. Epperson. 2005. Assessment of the effect of gastrointestinal nematode infestation on weight gain in grazing beef cat-tle, pp. 779-783, Journal of the American Veterinary Medical Association.
Proceedings of the South Dakota Academy of Science, Vol. 91 (2012) 141
Miller, J. E., T. A. Olson, M. T. Kearney, G. H. Myers, and J. C. Williams. 1992. Effect of fenbendazole molasses supplement block treatment on nematode infection and subsequent weight gain of weanling beef calves. Veterinary Parasitology 44: 329-337.
Myers, G. H. 1988. Strategies to control internal parasites in cattle and swine. Journal of Animal Science 66: 1555-1564.
Prichard, R. K., S. G. Forrester, A. Njue, Z. Feng, J. Liu, and R. N. Beech. 2003. Receptor mechanisms of antiparasitics. Journal of Veterinary Pharmacology & Therapeutics 26: 3.
Robinson, M. W., N. McFerran, A. Trudgett, L. Hoey, and I. Fairweather. 2004. A possible model of benzimidazole binding to β-tubulin disclosed by invok-ing an inter-domain movement. Journal of Molecular Graphics & Model-ling 23: 275-284.
Smith, R. A., K. C. Rogers, S. Husae, M. I. Wray, R. T. Brandt Jr, J. P. Hutcheson, W. T. Nichols, R. F. Taylor, J. R. Rains, and C. T. McCauley. 2000. Pasture deworming and (or) subsequent feedlot deworming with fenbendazole. I. Effects on grazing performance, feedlot performance and carcass traits of yearling steers. The Bovine Practitioner 34: 104-114.
Stromberg, B. E., and R. M. Corwin. 1993. Epizootiology of Ostertagia ostertagi in cow-calf production systems in the American midwest. Veterinary Parasi-tology 46: 297-302.
Taylor, R. F., D. H. Bliss, R. T. Brandt, W. T. Nichols, J. R. Rains, J. P. Hutcheson, and R. A. Smith. 2000. Pasture deworming and (or) subsequent feedlot deworming with fenbendazole. II. Effects on abomasal worm counts and abomasal pathology of yearling steers. The Bovine Practitioner 34: 115-123.
Williams, J. C., A. F. Loyacano, S. D. Broussard, D. F. Coombs, A. DeRosa, and D. H. Bliss. 1995. Efficacy of a spring strategic fenbendazole treatment program to reduce numbers of Ostertagia ostertagi inhibited larvae in beef stocker cattle. Veterinary Parasitology 59: 127-137.
Zarlenga, D. S., M. B. Chute, L. C. Gasbarre, and P. C. Boyd. 2001. A multi-plex PCR assay for differentiating economically important gastrointestinal nematodes of cattle. Veterinary Parasitology 97: 199-209.
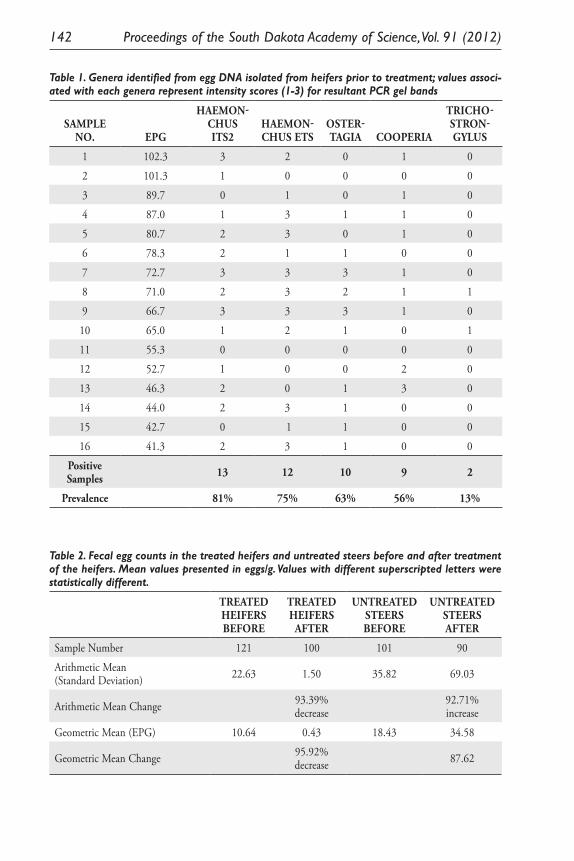
142 Proceedings of the South Dakota Academy of Science, Vol. 91 (2012)
Table 1. Genera identified from egg DNA isolated from heifers prior to treatment; values associ-ated with each genera represent intensity scores (1-3) for resultant PCR gel bands
SAMPLE NO. EPG
HAEMON-CHUS ITS2
HAEMON-CHUS ETS
OSTER-TAGIA COOPERIA
TRICHO-STRON-GYLUS
1 102.3 3 2 0 1 0
2 101.3 1 0 0 0 0
3 89.7 0 1 0 1 0
4 87.0 1 3 1 1 0
5 80.7 2 3 0 1 0
6 78.3 2 1 1 0 0
7 72.7 3 3 3 1 0
8 71.0 2 3 2 1 1
9 66.7 3 3 3 1 0
10 65.0 1 2 1 0 1
11 55.3 0 0 0 0 0
12 52.7 1 0 0 2 0
13 46.3 2 0 1 3 0
14 44.0 2 3 1 0 0
15 42.7 0 1 1 0 0
16 41.3 2 3 1 0 0
Positive Samples 13 12 10 9 2
Prevalence 81% 75% 63% 56% 13%
Table 2. Fecal egg counts in the treated heifers and untreated steers before and after treatment of the heifers. Mean values presented in eggs/g. Values with different superscripted letters were statistically different.
TREATED HEIFERS BEFORE
TREATED HEIFERS
AFTER
UNTREATED STEERSBEFORE
UNTREATED STEERSAFTER
Sample Number 121 100 101 90
Arithmetic Mean(Standard Deviation) 22.63 1.50 35.82 69.03
Arithmetic Mean Change 93.39%decrease
92.71%increase
Geometric Mean (EPG) 10.64 0.43 18.43 34.58
Geometric Mean Change 95.92%decrease 87.62
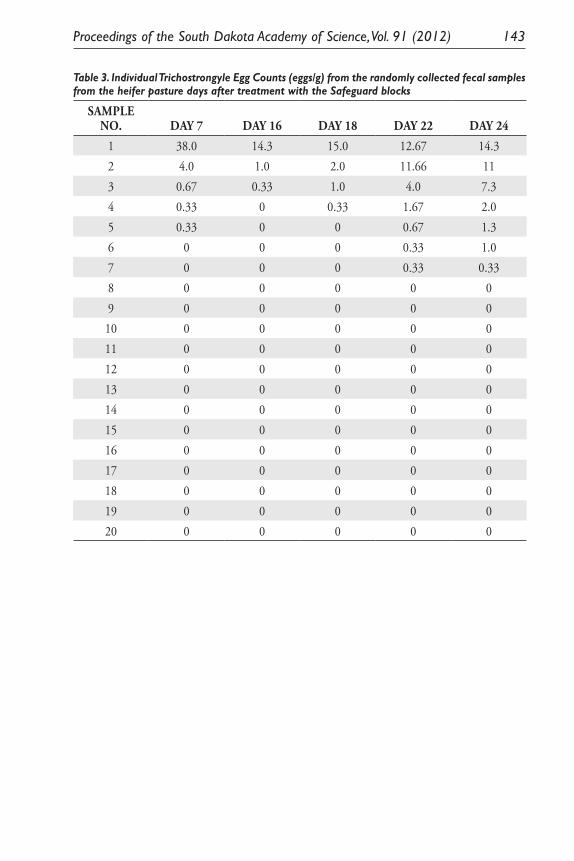
Proceedings of the South Dakota Academy of Science, Vol. 91 (2012) 143
Table 3. Individual Trichostrongyle Egg Counts (eggs/g) from the randomly collected fecal samples from the heifer pasture days after treatment with the Safeguard blocks
SAMPLE NO. DAY 7 DAY 16 DAY 18 DAY 22 DAY 24
1 38.0 14.3 15.0 12.67 14.32 4.0 1.0 2.0 11.66 113 0.67 0.33 1.0 4.0 7.34 0.33 0 0.33 1.67 2.05 0.33 0 0 0.67 1.36 0 0 0 0.33 1.07 0 0 0 0.33 0.338 0 0 0 0 09 0 0 0 0 010 0 0 0 0 011 0 0 0 0 012 0 0 0 0 013 0 0 0 0 014 0 0 0 0 015 0 0 0 0 016 0 0 0 0 017 0 0 0 0 018 0 0 0 0 019 0 0 0 0 020 0 0 0 0 0

Proceedings of the South Dakota Academy of Science, Vol. 91 (2012) 145
EXPRESSION OF TWO NITROSOMONAS EUROPAEA PROTEINS, HYDROXYLAMINE OXIDOREDUCTASE
AND NE0961, IN ESCHERICHIA COLI
Pankaj V. Mehrotra1, Kelli Brunson2, Alan Hooper3, and David Bergmann2*1University of Aberdeen
Aberdeen, UK 2Black Hills State University Spearfish, SD 57699, USA
3University of MinnesotaSt. Paul, MN 55104 USA
*Corresponding Author Email: [email protected]
ABSTRACT
We describe the heterologous expression of the Nitrosomonas europaea genes for hydroxylamine oxidoreductase (HAO) and a membrane protein, NE0961, in Escherichia coli strain BL21(de3), which also constitutively expressed the E. coli ccmA-H genes for c-cytochrome maturation and transport. Both HAO and NE0961 were expressed only in the membrane fraction of cells; only slight inser-tion of heme into HAO was observed. Co-expression of the genes for HAO and NE0961 was not sufficient for HAO transport to the periplasm or for complete heme insertion.
INTRODUCTION
Nitrosomonas europea is a well-studied, obligatory, chemoautotrophic, am-monia oxidizing bacterium (AOB) (Wood 1986). Because of the presence of such enzymes as ammonia monooxygenase (AMO), it has been proposed for use in bioremediation of a variety of halogenated organic compounds, such as trichloroethylene (Arciero et al. 1989). N. europaea and other AOB play a vi-tal role in the nitrogen cycle by oxidizing ammonia (NH3) to nitrite (HNO2), through which they obtain energy for growth and survival. However, in some aerobic environments, chemoautotrophic, ammonia-oxidizing Archaea are the predominant organisms oxidizing ammonia to nitrite (Francis et al. 2007). AOB are found in two phylogenetic lineages of the Proteobacteria: the closely related genera Nitrosomonas and Nitrosospira within the Betaproteobacteria and several strains in the gammaproteobacterial genus Nitrosococcus, including Nitrosococcus oceani (Head et al. 1993; Teske et al. 1994; Purkhold et al. 2000).
Ammonia oxidation to nitrite by AOB occurs in two enzyme-catalyzed steps. Ammonia is first oxidized to hydroxylamine (NH2OH) by a membrane bound, hetero-trimeric copper enzyme, ammonia monooxygenase (AMO) (Arp et al. 2002; Norton et al. 2002; Hooper et al. 2005). The resulting hydroxylamine is
146 Proceedings of the South Dakota Academy of Science, Vol. 91 (2012)
further oxidized to nitrite by a periplasmic enzyme, hydroxylamine oxidoreduc-tase (HAO) (Hooper et al. 1978; Whittaker et al. 2000). HAO contains seven c-type hemes and an active-site heme, known as heme P460, which contains a novel, covalent link between the heme and Tyr 467 (Arciero et al. 1993). A periplasmic, monoheme enzyme, cytochrome P460, may oxidize some of the hydroxylamine not oxidized by HAO, and has a unique active site c-heme which is connected covalently to a lysine side-chain (Erickson et al. 1972; Numata et al. 1990). The four electrons produced by hydroxylamine oxidation are accepted by a periplasmic, tetraheme, protein, cytochrome c554, in two-electron steps. These electrons are thought to be transferred to a membrane-associated, tetra-heme protein, cytochrome cm552, before the electrons are accepted by membrane ubiquinone (Hooper et al. 2005; Hooper et al. 1978). Two electrons are used in the AMO reaction and the other two are designated for an oxidative electron transfer chain and the cytochrome aa3 terminal oxidase (DiSpirito et al. 1986).
The gene encoding HAO (hao) is part of a cluster of three or four genes pres-ent in three copies in N. europaea genome: the gene cluster hao- ORF2- cycA-cycB, present in two identical copies, and the cluster hao-ORF2-cycA, present in a single copy (Bergmann et al. 1994; Sayavedra-Soto et al. 1994; Chain et al. 2003). The genes cycA and cycB gene code for cytochrome c554 and cytochrome cm552, respectively, which transfer electrons from HAO into the electron transport chain. ORF2 of the hao gene cluster encodes a putative integral membrane protein (NE2338 or NE0961) (Bergmann et al. 2005). NE0961 of N. europaea has sequence homology with no other proteins, except for those in the hao gene cluster of other Bacteria and Archaea.
Apart from AOB, a number of other Bacteria and some Archaea are known to have genes encoding HAO in their genome (Bergmann et al. 2005). In all cases, the gene encoding HAO was present as a tandem with the gene encoding NE0961. This suggests possible roles for NE0961, either as an HAO export/processing protein, or perhaps mediating interactions between HAO and the cytoplasmic membrane.
In most gram-negative bacteria, the polypeptides for periplasmic c-cytochromes are transported from the cytoplasm through the cytoplasmic membrane into the periplasm via the SecYEG export system, and hemes are covalently inserted onto cysteine side-chains of the polypeptide through the action of the CcmA-H gene products (Thoeny-Meyer 2002). Despite the modification of its c-heme with an additional heme-polypeptide crosslink, cytochrome P460 of N. europaea does not require any unique heme processing system, and can be readily expressed in Pseudomonas aeruginosa (Bergmann et al. 2003) and in an E. coli strain which constitutively expressed the ccmA-H genes (Elmore et al. 2006). While it is likely that the SecYEG export system and the CcmA-H heme insertion system are in-volved in HAO export and heme insertion, it is not known if additional proteins are required for this process.
In this study we attempted the co-expression of the genes for HAO and NE0961, alone and together, in the Escherichia coli strain BL21(de3). We dem-onstrate that the NE0961 polypeptide can be expressed in the membrane frac-tion of E. coli, although at low levels. HAO apoprotein can be produced at high levels in the membrane (insoluble) fraction of E. coli cells expressing the HAO
Proceedings of the South Dakota Academy of Science, Vol. 91 (2012) 147
gene and constitutively expressing the ccmA-H cytochrome processing genes; however, little heme insertion and no transport to the periplasm was observed, even if the gene for NE0961 is co-expressed. This indicates that the transport and processing of HAO may require proteins in addition to the SecYEG transporter, the Ccm heme processing system, and NE0961.
METHODS
Source of N. europaea DNA, DNA purification, and DNA modifying enzyme—Genomic DNA from Nitrosomonas europaea (Schmidt strain) was prepared as described by McTavish et al. (1993) and was provided by Dr. Alan B. Hooper at University of Minnesota. Restriction endonuclease digestions and ligation with T4 DNA ligase were performed as recommended by the manu-facturer (Promega). Purification of plasmid DNA from E. coli cells, restriction fragments from agarose gels, and PCR products were performed using Qiaprep Spin Miniprep, Qiaquick Gel Extraction, and Qiaquick PCR Cleanup kits, re-spectively, as recommended by the manufacturer (Qiagen).
Construction of E. coli Expression Host Strain—Expression studies were conducted in E. coli strain BL21(de3) (Novagen, Inc.). Plasmid pEC86 (Arslan et al. 1998), a gift of Dr. Linda Thoeny-Meyer, constitutively expresses the E. coli ccm genes for cytochrome processing. pEC86 was transformed to E. coli BL21(de3) competent cells by heat-shock as recommended by the manufacturer (Novagen), and the transformed colonies were grown on LB agar with 30mg/mL chloroamphenicol. Additional plasmids containing the hao and/or ORF2 genes were also introduced by heat-shock transformation and the transformants were cultured on LB agar with the appropriate antibiotics (30mg/mL chloroampheni-col with 50 mg/mL ampicillin or 30mg/mL chloroamphenicol with 50 mg/mL ampicillin and 30 mg/mL kanamycin).
Cloning of hao and ORF2 into an IPTG-Inducible, Dual-Promoter Plas-mid Vector—The gene hao was amplified by PCR from the genomic DNA by using forward primer HAOFA (5’-GCT-AAC-ATA-TGA-GAA-TAG-GGG-AGT-GGA-3’) and reverse primer HAOR1 (5’-CAA-CAA-CTC-GAG-TCA-AGC-TCG-GGT-CTG-CTT-3’. The gene (ORF2) for NE0961 was amplified by PCR using forward primer ORF2F1 (5’-GAA-GAA-CCA-TGG-CCG-CAC-TGA-CAA-CCG-ACC-GG-3’) and reverse primer ORF2R1 (5’-CAA-CAA-GTC-GAC-TCA-TTG-TAC-CTG-ATC-GAC-C-3’). The total volumes of the PCR reactions were 50mL and used the Phusion High-Fidelity PCR Kit (Finnzymes, Inc., MA, USA) containing 500 nmoles of primer, 2 ng of tem-plate, 0.2 mM dNTPs, 5X Phusion HF buffer, and 1.5 mM MgCl2. The PCR program used an initial denaturation at 9 oC for 30s; 30 cycles of denaturation at 98 oC for 10 s, annealing at 58.1 oC for (for hao) or 59.1 oC (for ORF2) for 30 s, and extension at 72 oC for 60 s; and a final extension at 72 oC for 10 min. The purified PCR products of the HAO gene and ORF2 gene and also the ex-pression vector pETDuet-1(Novagen®, Madison, WA, USA) were digested with restriction enzymes NdeI/Xho1 and NcoI/SalI overnight at 35 oC. The NcoI/SalI digested ORF2 PCR product and NcoI/SalI digested pETDuet-1 vector
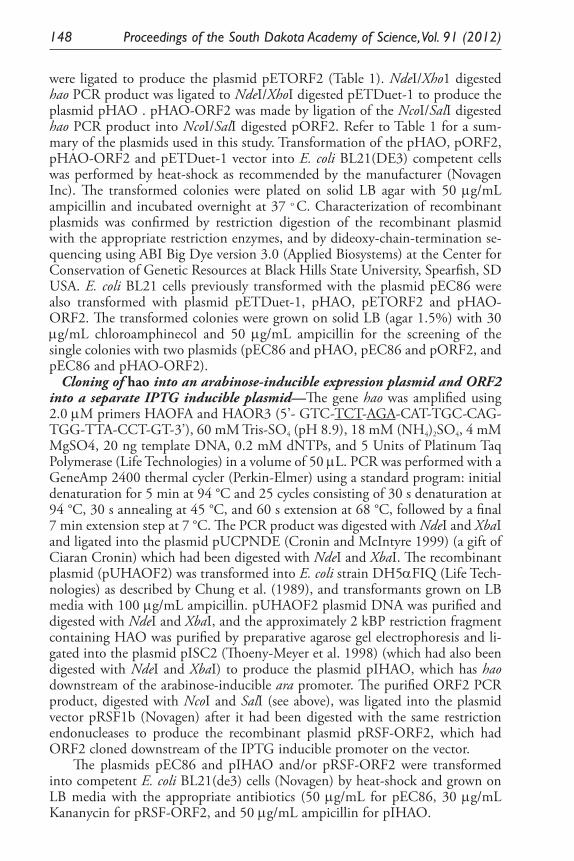
148 Proceedings of the South Dakota Academy of Science, Vol. 91 (2012)
were ligated to produce the plasmid pETORF2 (Table 1). NdeI/Xho1 digested hao PCR product was ligated to NdeI/XhoI digested pETDuet-1 to produce the plasmid pHAO . pHAO-ORF2 was made by ligation of the NcoI/SalI digested hao PCR product into NcoI/SalI digested pORF2. Refer to Table 1 for a sum-mary of the plasmids used in this study. Transformation of the pHAO, pORF2, pHAO-ORF2 and pETDuet-1 vector into E. coli BL21(DE3) competent cells was performed by heat-shock as recommended by the manufacturer (Novagen Inc). The transformed colonies were plated on solid LB agar with 50 mg/mL ampicillin and incubated overnight at 37 o C. Characterization of recombinant plasmids was confirmed by restriction digestion of the recombinant plasmid with the appropriate restriction enzymes, and by dideoxy-chain-termination se-quencing using ABI Big Dye version 3.0 (Applied Biosystems) at the Center for Conservation of Genetic Resources at Black Hills State University, Spearfish, SD USA. E. coli BL21 cells previously transformed with the plasmid pEC86 were also transformed with plasmid pETDuet-1, pHAO, pETORF2 and pHAO-ORF2. The transformed colonies were grown on solid LB (agar 1.5%) with 30 mg/mL chloroamphinecol and 50 mg/mL ampicillin for the screening of the single colonies with two plasmids (pEC86 and pHAO, pEC86 and pORF2, and pEC86 and pHAO-ORF2).
Cloning of hao into an arabinose-inducible expression plasmid and ORF2 into a separate IPTG inducible plasmid—The gene hao was amplified using 2.0 mM primers HAOFA and HAOR3 (5’- GTC-TCT-AGA-CAT-TGC-CAG-TGG-TTA-CCT-GT-3’), 60 mM Tris-SO4 (pH 8.9), 18 mM (NH4)2SO4, 4 mM MgSO4, 20 ng template DNA, 0.2 mM dNTPs, and 5 Units of Platinum Taq Polymerase (Life Technologies) in a volume of 50 mL. PCR was performed with a GeneAmp 2400 thermal cycler (Perkin-Elmer) using a standard program: initial denaturation for 5 min at 94 °C and 25 cycles consisting of 30 s denaturation at 94 °C, 30 s annealing at 45 °C, and 60 s extension at 68 °C, followed by a final 7 min extension step at 7 °C. The PCR product was digested with NdeI and XbaI and ligated into the plasmid pUCPNDE (Cronin and McIntyre 1999) (a gift of Ciaran Cronin) which had been digested with NdeI and XbaI. The recombinant plasmid (pUHAOF2) was transformed into E. coli strain DH5aFIQ (Life Tech-nologies) as described by Chung et al. (1989), and transformants grown on LB media with 100 mg/mL ampicillin. pUHAOF2 plasmid DNA was purified and digested with NdeI and XbaI, and the approximately 2 kBP restriction fragment containing HAO was purified by preparative agarose gel electrophoresis and li-gated into the plasmid pISC2 (Thoeny-Meyer et al. 1998) (which had also been digested with NdeI and XbaI) to produce the plasmid pIHAO, which has hao downstream of the arabinose-inducible ara promoter. The purified ORF2 PCR product, digested with NcoI and SalI (see above), was ligated into the plasmid vector pRSF1b (Novagen) after it had been digested with the same restriction endonucleases to produce the recombinant plasmid pRSF-ORF2, which had ORF2 cloned downstream of the IPTG inducible promoter on the vector.
The plasmids pEC86 and pIHAO and/or pRSF-ORF2 were transformed into competent E. coli BL21(de3) cells (Novagen) by heat-shock and grown on LB media with the appropriate antibiotics (50 mg/mL for pEC86, 30 mg/mL Kananycin for pRSF-ORF2, and 50 mg/mL ampicillin for pIHAO.
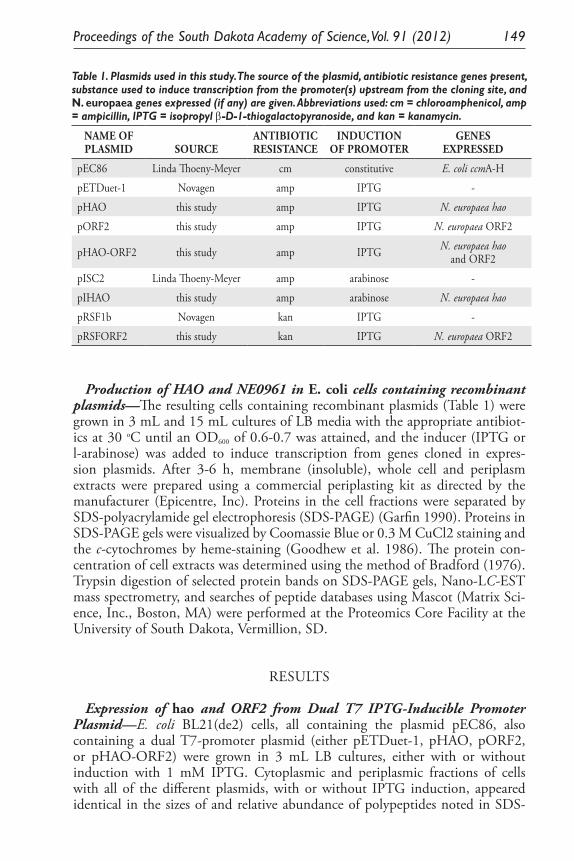
Proceedings of the South Dakota Academy of Science, Vol. 91 (2012) 149
Production of HAO and NE0961 in E. coli cells containing recombinant plasmids—The resulting cells containing recombinant plasmids (Table 1) were grown in 3 mL and 15 mL cultures of LB media with the appropriate antibiot-ics at 30 oC until an OD600 of 0.6-0.7 was attained, and the inducer (IPTG or l-arabinose) was added to induce transcription from genes cloned in expres-sion plasmids. After 3-6 h, membrane (insoluble), whole cell and periplasm extracts were prepared using a commercial periplasting kit as directed by the manufacturer (Epicentre, Inc). Proteins in the cell fractions were separated by SDS-polyacrylamide gel electrophoresis (SDS-PAGE) (Garfin 1990). Proteins in SDS-PAGE gels were visualized by Coomassie Blue or 0.3 M CuCl2 staining and the c-cytochromes by heme-staining (Goodhew et al. 1986). The protein con-centration of cell extracts was determined using the method of Bradford (1976). Trypsin digestion of selected protein bands on SDS-PAGE gels, Nano-LC-EST mass spectrometry, and searches of peptide databases using Mascot (Matrix Sci-ence, Inc., Boston, MA) were performed at the Proteomics Core Facility at the University of South Dakota, Vermillion, SD.
RESULTS
Expression of hao and ORF2 from Dual T7 IPTG-Inducible Promoter Plasmid—E. coli BL21(de2) cells, all containing the plasmid pEC86, also containing a dual T7-promoter plasmid (either pETDuet-1, pHAO, pORF2, or pHAO-ORF2) were grown in 3 mL LB cultures, either with or without induction with 1 mM IPTG. Cytoplasmic and periplasmic fractions of cells with all of the different plasmids, with or without IPTG induction, appeared identical in the sizes of and relative abundance of polypeptides noted in SDS-
Table 1. Plasmids used in this study. The source of the plasmid, antibiotic resistance genes present, substance used to induce transcription from the promoter(s) upstream from the cloning site, and N. europaea genes expressed (if any) are given. Abbreviations used: cm = chloroamphenicol, amp = ampicillin, IPTG = isopropyl β-D-1-thiogalactopyranoside, and kan = kanamycin.
NAME OF PLASMID SOURCE
ANTIBIOTIC RESISTANCE
INDUCTION OF PROMOTER
GENESEXPRESSED
pEC86 Linda Thoeny-Meyer cm constitutive E. coli ccmA-H
pETDuet-1 Novagen amp IPTG -
pHAO this study amp IPTG N. europaea hao
pORF2 this study amp IPTG N. europaea ORF2
pHAO-ORF2 this study amp IPTG N. europaea haoand ORF2
pISC2 Linda Thoeny-Meyer amp arabinose -
pIHAO this study amp arabinose N. europaea hao
pRSF1b Novagen kan IPTG -
pRSFORF2 this study kan IPTG N. europaea ORF2
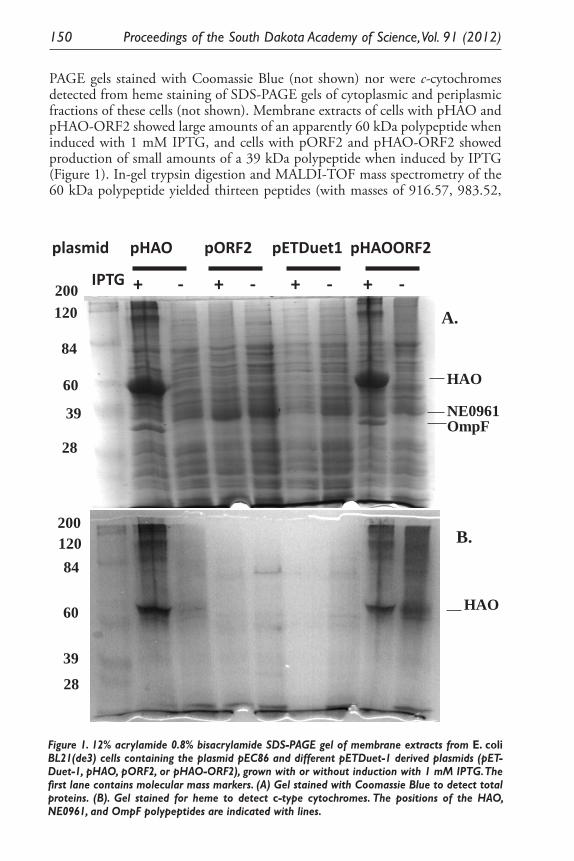
150 Proceedings of the South Dakota Academy of Science, Vol. 91 (2012)
PAGE gels stained with Coomassie Blue (not shown) nor were c-cytochromes detected from heme staining of SDS-PAGE gels of cytoplasmic and periplasmic fractions of these cells (not shown). Membrane extracts of cells with pHAO and pHAO-ORF2 showed large amounts of an apparently 60 kDa polypeptide when induced with 1 mM IPTG, and cells with pORF2 and pHAO-ORF2 showed production of small amounts of a 39 kDa polypeptide when induced by IPTG (Figure 1). In-gel trypsin digestion and MALDI-TOF mass spectrometry of the 60 kDa polypeptide yielded thirteen peptides (with masses of 916.57, 983.52,
HAO
HAO
200120
84
60
39
28
120200
84
60
39
28
pHAO pORF2 pETDuet1 pHAOORF2
+ - + - + - + -
plasmid
IPTG
A.
B.
NE0961OmpF
Figure 1. 12% acrylamide 0.8% bisacrylamide SDS-PAGE gel of membrane extracts from E. coli BL21(de3) cells containing the plasmid pEC86 and different pETDuet-1 derived plasmids (pET-Duet-1, pHAO, pORF2, or pHAO-ORF2), grown with or without induction with 1 mM IPTG. The first lane contains molecular mass markers. (A) Gel stained with Coomassie Blue to detect total proteins. (B). Gel stained for heme to detect c-type cytochromes. The positions of the HAO, NE0961, and OmpF polypeptides are indicated with lines.

Proceedings of the South Dakota Academy of Science, Vol. 91 (2012) 151
1131.61, 1145.65, 1230.69, 1299.76, 1357.71, 1388.83, 1753.02, 1890.95, 2016.03, 2522.33, and 3348.73 Da) which were identified as fragments of HAO. The 39 kDa polypeptide yielded nine tryptic fragments (with masses of 870.52, 1025.57, 1258.67, 1309.71, 1469.78, 1815.91, 1826.90, 1920.93, and 2422.05 Da) and was identified as NE0961. IPTG-induced cells with pHAO and pHAO-ORF2 also overproduced an apparently 36 kDa polypeptide; mass spectrometry of tryptic digests of this polypeptide yielded 21 peptides (with masses of 2593.60, 2437.48, 2851.70, 1107.57, 1020.57, 1762.75, 1764.77, 3692.64, 1248.57, 2202.22, 1368.76, 1497.85, 1130.64, 1002.55, 1846.89, 1085.57, 2772.53, 2925.48, 2132.04, 2148.03, and 1738.95 Da) identified as the E. coli outer membrane porin 1a (OmpF, NP_415449). The sizes of the HAO, NE0961, and OmpF polypeptides predicted by SDS-PAGE (60, 39, and 36 kDa, respectively) are somewhat smaller than their sizes predicted from gene sequences (62.52, 41.84, and 39.31 kDa). Westerhuis et al. (2000) noted that SDS-PAGE tends to underestimate the size of integral membrane proteins, which may bind excessive amounts of SDS. The Heme-staining of SDS-PAGE gels of membrane proteins indicated that a small portion of membrane-bound HAO had heme attached (Figure 1).
Expression of hao on an ara Promoter Arabinose Indicible Promoter Plas-mid and ORF2 on a T7 IPTG-Inducible Promoter Plasmid—To indepen-dently regulate the amount of HAO and NE0961 produced, hao and ORF2 were cloned into separate expression vector plasmids, inducible by arabinose (hao) and IPTG (ORF2) and then transformed into cells of E. coli BL21(de3) along with the plasmid pEC86. E. coli BL21(de3) cells with pEC86 and either pISC2 and pRSFORF2 (negative control), pRSFORF2, pIHAO, or pIHAO and pRSF-ORF2 together were grown in 3 ml cultures and left uninduced, induced with 0.05% arabinose, induced with 1 mM IPTG, or induced with 0.05% arabinose and 1 mM IPTG at mid-log phase. Coomassie Blue stained SDS-PAGE gels of the cytoplasmic and periplasmic fractions of cells with all plasmids, induced and uninduced, showed an identical distribution of polypeptides (data not shown). Also, heme staining indicated no c-cytochromes were present in the cytoplasmic or periplasmic fractions of these cells (not shown). SDS-PAGE gels of the membrane fraction of cells (Figure 2) indicated that cells with the pRSF-ORF2 plasmid produced a 36 kDa polypeptide when induced with 1 mM IPTG, while those with the pIHAO plasmid produced a 63 kDa polypeptide when induced with 0.05% arabinose. In-gel trypsin digestion and MALDI-TOF mass spectrometry confirmed that the 63 kDa polypeptide was HAO and the 36 kDa polypeptide was NE0961. Heme-staining of the SDS-PAGE gel of membrane proteins indicated that a small amount of the HAO polypeptide had attached heme (Figure 2). Membrane (insoluble) extracts of these cells with the three plasmids pEC86, pRSF-ORF2, and pIHAO, induced with both arabinose and IPTG, contained 3.7 mg protein per ml. Twenty microliters of the mem-brane extracts, containing 74 mg of protein, was loaded on an SDS-PAGE gel along with dilutions of known quantities of horse-heart cytochrome c, and the gel stained to detect heme (not shown). The intensity of heme-staining of HAO in the membrane extracts was equivalent to 5.0 x 10⁻¹² moles of heme c. If one assumes that approximately half of the protein in the membrane extracts was
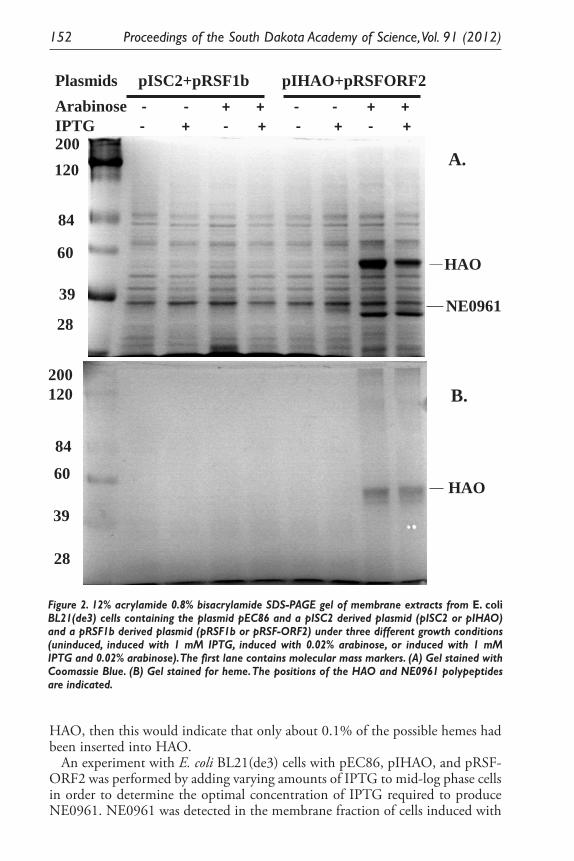
152 Proceedings of the South Dakota Academy of Science, Vol. 91 (2012)
HAO, then this would indicate that only about 0.1% of the possible hemes had been inserted into HAO.
An experiment with E. coli BL21(de3) cells with pEC86, pIHAO, and pRSF-ORF2 was performed by adding varying amounts of IPTG to mid-log phase cells in order to determine the optimal concentration of IPTG required to produce NE0961. NE0961 was detected in the membrane fraction of cells induced with
60
84
120200
39
28
60
39
84
200120
28
HAO
NE0961
HAO
Plasmids pISC2+pRSF1b pIHAO+pRSFORF2Arabinose - - + + - - + + IPTG - + - + - + - +
A.
B.
Figure 2. 12% acrylamide 0.8% bisacrylamide SDS-PAGE gel of membrane extracts from E. coli BL21(de3) cells containing the plasmid pEC86 and a pISC2 derived plasmid (pISC2 or pIHAO) and a pRSF1b derived plasmid (pRSF1b or pRSF-ORF2) under three different growth conditions (uninduced, induced with 1 mM IPTG, induced with 0.02% arabinose, or induced with 1 mM IPTG and 0.02% arabinose). The first lane contains molecular mass markers. (A) Gel stained with Coomassie Blue. (B) Gel stained for heme. The positions of the HAO and NE0961 polypeptides are indicated.
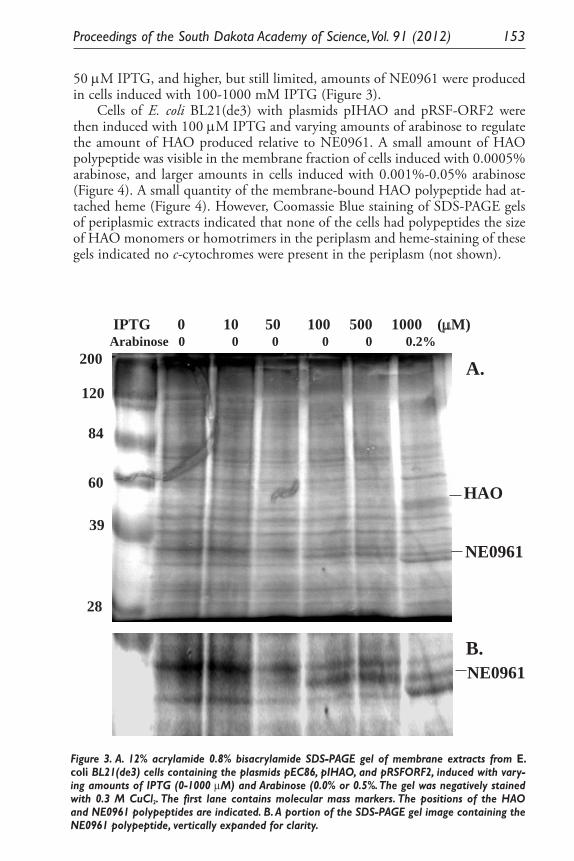
Proceedings of the South Dakota Academy of Science, Vol. 91 (2012) 153
50 mM IPTG, and higher, but still limited, amounts of NE0961 were produced in cells induced with 100-1000 mM IPTG (Figure 3).
Cells of E. coli BL21(de3) with plasmids pIHAO and pRSF-ORF2 were then induced with 100 mM IPTG and varying amounts of arabinose to regulate the amount of HAO produced relative to NE0961. A small amount of HAO polypeptide was visible in the membrane fraction of cells induced with 0.0005% arabinose, and larger amounts in cells induced with 0.001%-0.05% arabinose (Figure 4). A small quantity of the membrane-bound HAO polypeptide had at-tached heme (Figure 4). However, Coomassie Blue staining of SDS-PAGE gels of periplasmic extracts indicated that none of the cells had polypeptides the size of HAO monomers or homotrimers in the periplasm and heme-staining of these gels indicated no c-cytochromes were present in the periplasm (not shown).
200
120
60
84
39
28
NE0961
IPTG 0 10 50 100 500 1000 (µM)Arabinose 0 0 0 0 0 0.2%
HAO
NE0961
A.
B.
Figure 3. A. 12% acrylamide 0.8% bisacrylamide SDS-PAGE gel of membrane extracts from E. coli BL21(de3) cells containing the plasmids pEC86, pIHAO, and pRSFORF2, induced with vary-ing amounts of IPTG (0-1000 mM) and Arabinose (0.0% or 0.5%. The gel was negatively stained with 0.3 M CuCl2. The first lane contains molecular mass markers. The positions of the HAO and NE0961 polypeptides are indicated. B. A portion of the SDS-PAGE gel image containing the NE0961 polypeptide, vertically expanded for clarity.
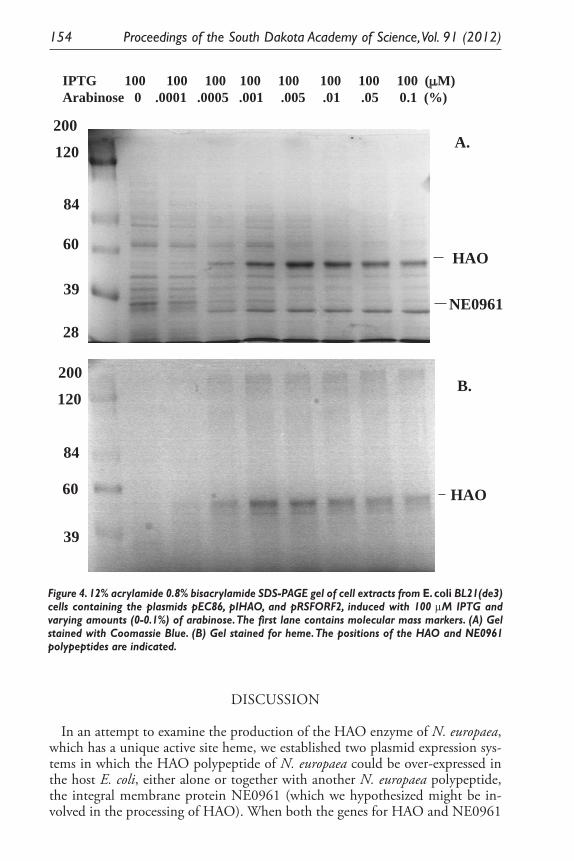
154 Proceedings of the South Dakota Academy of Science, Vol. 91 (2012)
DISCUSSION
In an attempt to examine the production of the HAO enzyme of N. europaea, which has a unique active site heme, we established two plasmid expression sys-tems in which the HAO polypeptide of N. europaea could be over-expressed in the host E. coli, either alone or together with another N. europaea polypeptide, the integral membrane protein NE0961 (which we hypothesized might be in-volved in the processing of HAO). When both the genes for HAO and NE0961
60
84
120
200
39
28
HAO
HAO
120
84
60
39
IPTG 100 100 100 100 100 100 100 100 (µM)Arabinose 0 .0001 .0005 .001 .005 .01 .05 0.1 (%)
200
A.
B.
NE0961
Figure 4. 12% acrylamide 0.8% bisacrylamide SDS-PAGE gel of cell extracts from E. coli BL21(de3) cells containing the plasmids pEC86, pIHAO, and pRSFORF2, induced with 100 mM IPTG and varying amounts (0-0.1%) of arabinose. The first lane contains molecular mass markers. (A) Gel stained with Coomassie Blue. (B) Gel stained for heme. The positions of the HAO and NE0961 polypeptides are indicated.
Proceedings of the South Dakota Academy of Science, Vol. 91 (2012) 155
were expressed from the T7 promoter, production of HAO was much greater than that of NE0961. HAO was found entirely in the insoluble (membrane) fraction of cells, not in the periplasmic fraction where the correctly exported HAO holoenzyme should be located. It appears that the HAO polypeptide, rather than being correctly exported through the SecYEG export system into the periplasm, instead accumulated as insoluble cytoplasmic inclusion bodies. Although they are usually found in the cytoplasm of bacteria, inclusion bodies, which consist of overproduced, miss-folded polypeptides, are not soluble, and often contain membrane proteins, such as OmpA and OmpF, as well as the elon-gation factor protein EF-Tu (Hart et al. 1990). OmpF was especially abundant in the insoluble fraction of cells expressing HAO. Because heme is inserted into the polypeptides of gram-negative bacteria during export of cytochromes into the periplasm, it is not surprising that little heme insertion into HAO occurred.
Expression of NE0961along with HAO did not result in periplasmic export of HAO, even when expression of HAO relative to NE0961 was varied to make the amounts of HAO and NE0961 produced closer to equivalence. If NE0961 is involved in the processing and/or transport of the HAO polypeptide, it, along with the usual systems for periplasmic export and heme insertion in gram-negative bacteria, is not sufficient for production of the HAO holoenzyme in the periplasm. Other gene products, specific to microbes producing HAO, may also be required.
ACKNOWLEDGEMENTS
We would like to thank Dr. Eduardo Calligeri at the University of South Dakota Proteomics Facility for his help with mass spectrometry. We also thank Carolyn Ferrell at the Western South Dakota DNA Core Facility (WestCore) for DNA sequencing, and Dr. Chun Wu and Michael Zehfus for reviewing this manuscript. This publication was made possible by NIH Grant Number 2 P20 RR016479 from the INBRE Program of the National Center for Research Resources. Its contents are solely the responsibility of the authors and does not necessarily represent the initial views of NIH.
LITERATURE CITED
Arciero D, T. Vannelli, M. Logan , and A.B. Hooper. 1989. Degradation of tri-chloroethylene by the ammonia-oxidizing bacterium Nitrosomonas europaea. Biochem. Biophys. Res. Commun. 1989 Mar 15; 159(2):640-3.
Arciero, D.M., Hooper, A.B., Cai, M., and R. Timkovitch. 1993. Evidence for the structure of the active site heme P460 in hydroxylamine oxidoreductase of Nitrosomonas. Biochemistry 32: 9370-9378.
Arp, D. J., L.A. Sayavedra-Soto, and N.G. Hommes. 2002. Molecular biology and biochemistry of ammonia oxidation by Nitrosomonas europaea. Arch. Microbiol. 178:250–255.
156 Proceedings of the South Dakota Academy of Science, Vol. 91 (2012)
Arslan, E,H. Schulz, R. Zufferey, P. Kunzler, and L. Thoeny-Meyer. 1998. Overproduction of Bradyrhizobium japonicum c-type cytochrome subunits of the cbb3 oxidase in Escherichia coli. Biochem. Biophys. Res. Comm. 251: 744-747.
Bergmann, D.J., D.A. Arciero, and A.B. Hooper. 1994. Organization of the hao gene cluster of Nitrosomonas europaea: genes for two tetraheme c cyto-chromes. J. Bacteriol. 176:3148–3153.
Bergmann, D.J., and A.B. Hooper. 2003. Cytochrome P460 of Nitrosomonas europae: Formation of the heme-lysine cross-link in a heterologous host and mutagenic conversion to a non-cross-linked cytochrome c. Eur. J. Biochem. 270:1935–1941.
Bergmann, D.J., Hooper, A.B., and M.G. Klotz. 2005. Structure and sequence conservation of hao cluster genes of autotrophic ammonia-oxidizing bacte-ria: evidence for their evolutionary history. Appl. Environ. Microbiol. 71: p. 5371–5382.
Bradford, M.M. 1976. Rapid and sensitive method for the quantitation of mi-crogram quantities of protein utilizing the principle of protein-dye binding, Anal. Biochem. 72: 248–254.
Chain, P., J. Lamerdin, F. Larimer, W. Regala, V. Lao, M. Land, L. Hauser, A. Hooper, M. Klotz, J. Norton, L. Sayavedra-Soto, D. Arciero, N. Hommes, M. Whittaker, and D. Arp. 2003. Complete genome sequence of the am-monia- oxidizing bacterium and obligate chemolithoautotroph Nitrosomonas europaea. J. Bacteriol. 185:2759–2773.
Chung, C.T., S.L. Niemela, and R.H. Miller. 1989. One-step preparation of competent Escherichia coli: transformation and storage of bacterial cells in the same solution. Proc. Nat. Acad. Sci. USA 86: 2172-2175.
Cronin, C.N. and W.S. McIntire. 1999. pUCP-Nco and pUCPNde: Escherich-ia-Pseudomonas shuttle vectors for recombinant protein expression in Pseu-domonas. Anal. Biochem. 272: 112-115.
DiSpirito, A.A., J.D. Lipscomb, and A.B. Hooper. 1986. Cytochrome aa3 from Nitrosomonas europaea. J. Biol. Chem. 261:17048-17056.
Elmore, B.O., Pearson, A.R., Wilmot, C.M., and A.B. Hooper. 2006. Expres-sion, purification, crystallization and preliminary X-ray diffraction of a novel Nitrosomonas europaea cytochrome, cytochrome P460. Acta Cryst. F62, 395-398.
Erickson, R.H., and A.B. Hooper. 1972. Preliminary characterization of a vari-ant C-binding heme protein from Nitrosomonas. Biochim. Biophys. Acta 275:231–244.
Francis, C.A., M.J Bemon, and M.M.M. Kuypers. 2007. New Processes and Players in the nitrogen cycle: the microbial ecology of anaerobic and archaeal ammonia oxidation. ISME Jour. 1: 19-27.
Garfin, D.E. 1990. One-dimensional gel electrophoresis. In M.P. Deutscher (ed.) Guide to Protein Purification. Methods in Enzymology vol. 182. Aca-demic Press, Inc., San Diego, CA.
Goodhew, C.F., K.R. Brown, and G.W. Pettigrew. 1986. Haem staining in gels, a useful tool in the study of bacterial c-type cytochromes. Biochim Biphys Acta 852: 288-294.
Proceedings of the South Dakota Academy of Science, Vol. 91 (2012) 157
Hart, R.A., U. Rinas, and J.E. Bailey. 1990. Protein composition of Vitreoscilla hemoglobin inclusion bodies produced in Escherichia coli. J. Biol. Chem. 265: 12728-12733.
Head, I. M., W. Hiorns, T. Embley, A. McCarthy, and J. Saunders. 1993. The phylogeny of autotrophic ammonia-oxidizing bacteria as determined by analysis of 16S ribosomal RNA gene sequences. J. Gen. Microbiol. 13:1147–1153.
Hooper, A.B., P.C. Maxwell, and K.R. Terry. 1978. Hydroxylamine oxidoreduc-tase from Nitrosomonas: absorption spectra and content of heme and metal. Biochemistry 17:2984-2989.
Hooper, A.B., D.M. Arciero, D. Bergmann, and M.P. Hendrich. 2005. The oxidation of ammonia as an energy source in bacteria in respiration, vol. 2. Springer, Dordrecht, the Netherlands.
McTavish, H, J.A. Fuchs, and A.B. Hooper. 1993. Sequence of the gene coding for ammonia monooxygenase in Nitrosomonas europaea. J. Bacteriol. 175: 2436-2444.
Norton, J.M., J.J. Alzerreca, Y. Suwa, and M.G. Klotz. 2002. Diversity of am-monia monooxygenase operon in autotrophic ammonia-oxidizing bacteria. Arch. Microbiol. 177:139–149.
Numata, M., T. Saito, T. Yamazaki, Y. Dukumori, and T. Yamanaka. 1990. Cy-tochrome P-460 of Nitrosomonas europaea: further purification and further characterization. J. Biochem. 108:1016–1023.
Purkhold, U., A. Pommerening-Roser, S. Juretschko, M.C. Schmid, H.-P. Koops, and M. Wagner. 2000. Phylogeny of all recognized species of ammo-nia oxidizers based on comparative 16S rRNA and amoA sequence analysis: implications for molecular diversity surveys. Appl. Environ. Microbiol. 66: 5368–5382.
Sayavedra-Soto, L.A., N.G. Hommes, and D.J. Arp. 1994. Characterization of the gene encoding hydroxylamine oxidoreductase in Nitrosomonas europaea. J Bacteriol. 176: 504-510.
Teske, A., E. Alm, J. Regan, S. Toze, B. Rittmann, and D. Stahl. 1994. Evolu-tionary relationships among ammonia- and nitrite-oxidizing bacteria. J.
Bacteriol. 176:6623–6630.Thoeny-Meyer L, P. Kuenzler , and H. Hennecke. 1998. Requirements for matu-
ration of Bradyrhizobium japonicum cytochrome c550 in Escherichia coli. Eur. J. Biochem. 235:754–761.
Thoeny-Meyer, L. 2002. Cytochrome c maturation: a complex pathway for a simple task? Biochemical Society Transactions 30(4):633-638.
Westerhuis, W.H.J., J.N. Sturgis, and R.A. Niederman. 2000. Reevaluation of the electrophoretic migration behavior of soluble globular proteins in the na-tive and detergent-denatured states in polyacrylamide gels. Anal. Biochem. 284:143-152.
Whittaker, M., D. Bergmann, D. Arciero, and A.B. Hooper. 2000. Electron transfer during the oxidation of ammonia by the chemolithotrophic bacte-rium Nitrosomonas europaea. Biochim. Biophys. Acta 1459:346–355.
Wood, P.M. 1986. Nitrification as a bacterial energy source. Nitrification, Spe-cial Publications of the Society for General Microbiology Oxford: IRL Press, J.I. Prosser (editor) 20:39-62.

Proceedings of the South Dakota Academy of Science, Vol. 91 (2012) 159
DEVELOPING A <0.1 PPB TRACE GAS IMPURITY SENSOR FOR NOBLE LIQUID-BASED
DIRECT DARK MATTER DETECTORS
Brianna J. Mount1*, Greg L. Serfling1, Yongchen Sun2, Jared D. Thompson1, Dan Durben1, Kara J. Keeter1
1School of Natural SciencesBlack Hills State University
Spearfish, SD 577992Department of Physics
University of South DakotaVermillion, SD 57069
*Corresponding author email: [email protected]
ABSTRACT
The Black Hills State University (BHSU) particle astrophysics group is in-volved in several ultra-low background neutrino and dark matter experiments at the Sanford Underground Research Facility (SURF) in Lead, SD. Collaborations such as DARKSIDE are designing dark matter detectors based on liquid argon and xenon time projection chambers. These detectors are extremely sensitive to impurities of O2, N2, and H2O. To detect the extremely elusive dark matter signal, we must monitor and control impurities. Currently, there are no com-mercially available sensors which can reach the required sensitivity. BHSU is building a custom Cavity Ring-Down Spectroscopy (CRDS) system which is projected to detect less than 0.1 ppb of these impurities in noble gases. The CRDS is currently being tested and is expected to be operational by the begin-ning of 2013.
Keywords
Laser, Spectroscopy, Sensor, Water, Cavity
INTRODUCTION
Large-scale liquid noble gas scintillation detectors are the basis for many current and proposed particle astrophysics experiments including dark matter searches, neutrinoless double beta decay experiments, and long baseline neutrino experiments (Lopes 2003; Aprile 2010). One such project is the DARKSIDE (Depleted Argon Cryogenic Scintillation and Ionization Detector) experiment. DARKSIDE is a program of progressively larger-volume liquid argon-based two-phase (liquid and gas) time projection chambers which will search for dark matter in the form of WIMPs (Weakly Interacting Massive Particles). The DARKSIDE-10 prototype detector (incorporating 10 kg of Ar) is currently op-
160 Proceedings of the South Dakota Academy of Science, Vol. 91 (2012)
erating underground at Gran Sasso National Laboratory in Italy (Akimov 2012) to test the shielding, the data acquisition system, and other system parameters. The next generation DARKSIDE-50 prototype detector (50 kg of Ar) will be commissioned in the fall of 2012 (Akimov 2012). Future detectors capable of detecting dark matter are expected to be scaled up to ton-level.
When an ionizing particle interacts with a detector filled with liquid argon, free electrons form an ionization signal and excited molecular argon (Ar2*) is formed which then radiatively de-excites through scintillation light at 128 nm (Acciarri 2010a,b; Mavrokoridis 2011). Singlet and triplet states of the excited molecular argon are formed, each with a different lifetime. These ionization signals and scintillation photons can be independently detected and spatially resolved in the detector to identify a WIMP event and distinguish it from background events.
If impurities are present, a non-radiative de-excitation of Ar2* can occur, re-ducing the number of excited argon molecules and effectively quenching the scintillation light. In the DARKSIDE-10 prototype detector, Akimov (2012) observed a measurable increase in the light yield when purifying the argon to sub-ppb levels. Impurities not only reduce the overall light yield, they effectively reduce the lifetime of the long-lived (triplet) scintillation light without affecting the short-lived (singlet) component, thus changing the pulse shape of the scintil-lation signal that is used to reject background events.
In the case of electro-negative molecules like O2, impurities disrupt the ion-ization signal from the WIMP-Ar collision. The ionization signal is used to determine the position of the interaction and is crucial for background rejection of neutron events (which would mimic a WIMP signal). Neutron background events due to radioactivity in surrounding material are rejected by selecting a fiducial region in the detector which excludes the outer regions where neutron events are most likely to occur. However, the pathlength of the free electrons is strongly dependent on the concentration of the electro-negative O2. A decrease in pathlength due to impurities effectively limits the size of the detector and the performance that can be achieved. Detectors with pathlengths on the scale of meters will require argon purified to sub ppb ranges (Mavrokoridis 2011). In fact, the large ICARUS detector already requires <0.1 ppb [O2] equivalent (Amerio 2004).
To test the impurity levels in these liquid noble gases, we are developing at Black Hills State University (BHSU) a Cavity Ring-Down Spectroscopy (CRDS) system that will be an order of magnitude more sensitive than commercially available products is being developed. This paper will present development work accomplished in 2011-2012.
CAVITY RING-DOWN SPECTROSCOPY (CRDS)
The CRDS technique for laser spectroscopy has grown rapidly in the past decade. As there is much in the literature on this subject (Berden 2009; Busch 1999), only a brief introduction will be given here. CRDS is an absorption spectroscopy technique for determining trace amounts of impurities. Laser light enters the absorption cell (or cavity) and reflects back and forth multiple times
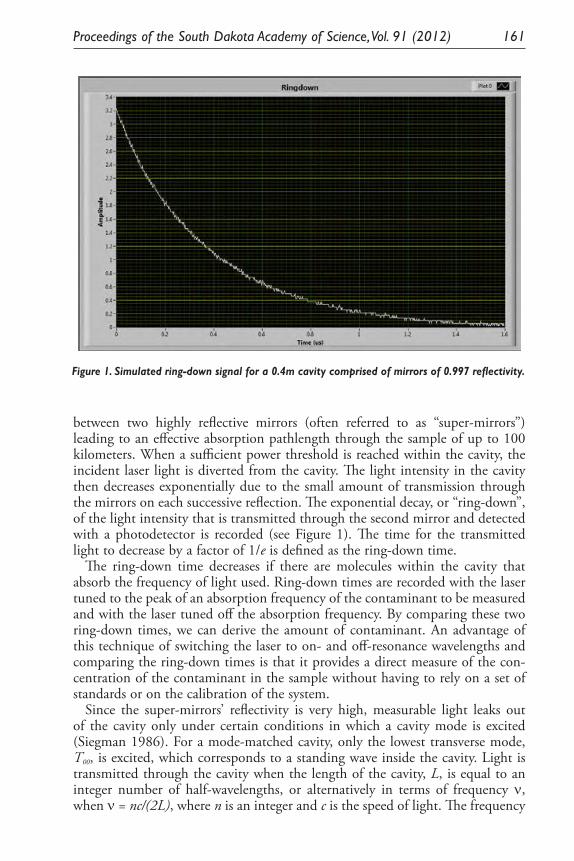
Proceedings of the South Dakota Academy of Science, Vol. 91 (2012) 161
between two highly reflective mirrors (often referred to as “super-mirrors”) leading to an effective absorption pathlength through the sample of up to 100 kilometers. When a sufficient power threshold is reached within the cavity, the incident laser light is diverted from the cavity. The light intensity in the cavity then decreases exponentially due to the small amount of transmission through the mirrors on each successive reflection. The exponential decay, or “ring-down”, of the light intensity that is transmitted through the second mirror and detected with a photodetector is recorded (see Figure 1). The time for the transmitted light to decrease by a factor of 1/e is defined as the ring-down time.
The ring-down time decreases if there are molecules within the cavity that absorb the frequency of light used. Ring-down times are recorded with the laser tuned to the peak of an absorption frequency of the contaminant to be measured and with the laser tuned off the absorption frequency. By comparing these two ring-down times, we can derive the amount of contaminant. An advantage of this technique of switching the laser to on- and off-resonance wavelengths and comparing the ring-down times is that it provides a direct measure of the con-centration of the contaminant in the sample without having to rely on a set of standards or on the calibration of the system.
Since the super-mirrors’ reflectivity is very high, measurable light leaks out of the cavity only under certain conditions in which a cavity mode is excited (Siegman 1986). For a mode-matched cavity, only the lowest transverse mode, T00, is excited, which corresponds to a standing wave inside the cavity. Light is transmitted through the cavity when the length of the cavity, L, is equal to an integer number of half-wavelengths, or alternatively in terms of frequency ν, when ν = nc/(2L), where n is an integer and c is the speed of light. The frequency
3
Figure 1. Simulated ring-down signal for a 0.4m cavity comprised of mirrors of 0.997reflectivity.
The ring-down time decreases if there are molecules within the cavity that absorb the frequency of light used. Ring-down times are recorded with the laser tuned to the peak of an absorption frequency of the contaminant to be measured and with the laser tuned off the absorption frequency. By comparing these two ring-down times, we can derive the amount of contaminant. An advantage of this technique of switching the laser to on- and off-resonance wavelengths and comparing the ring-down times is that it provides a direct measure of the concentration of the contaminant in the sample without having to rely on a set of standards or on the calibration of the system.
Since the super-mirrors’ reflectivity is very high, measurable light leaks out of the cavity only under certain conditions in which a cavity mode is excited (Siegman 1986). For a mode-matched cavity, only the lowest transverse mode, T00, is excited, which corresponds to a standing wave inside the cavity. Light is transmitted through the cavity when the length of the cavity, L, is equal to an integer number of half-wavelengths, or alternatively in terms of frequency ν, when ν = nc/(2L), where n is an integer and c is the speed of light. The frequency difference between two modes is called the free spectral range and is given by ∆νFSR=c/(2L). The finesse of the cavity is the free spectral range of the cavity divided by the linewidth of the cavity resonances and is a function of the reflectivity of the super-mirrors. When we scan either the wavelength of the laser or the length of the cavity, the transmission through the second mirror of the mode-matched cavity (before the laser is diverted) will be a series of resonance peaks separated by the free spectral range. The higher the finesse of the cavity, the sharper will be the linewidth of the peaks (see Figure 2).
Figure 1. Simulated ring-down signal for a 0.4m cavity comprised of mirrors of 0.997 reflectivity.
162 Proceedings of the South Dakota Academy of Science, Vol. 91 (2012)
difference between two modes is called the free spectral range and is given by ∆νFSR=c/(2L). The finesse of the cavity is the free spectral range of the cavity divided by the linewidth of the cavity resonances and is a function of the re-flectivity of the super-mirrors. When we scan either the wavelength of the laser or the length of the cavity, the transmission through the second mirror of the mode-matched cavity (before the laser is diverted) will be a series of resonance peaks separated by the free spectral range. The higher the finesse of the cavity, the sharper will be the linewidth of the peaks (see Figure 2).
THE BHSU CRDS SYSTEM
A schematic diagram of the BHSU CRDS system is shown in Figure 3. A distributed feedback laser of wavelength 1392 nm is coupled into a cavity com-prised of two super-mirrors of reflectivity 0.999983 for light at 1392 nm. The light transmitted through the second super-mirror is detected using a Hama-matsu G10899-003K InGaAs detector. A wave-function generator ramps the piezo-electric transducer (PZT) voltage which stretches the length of the stainless steel cavity, until the signal from the detector reaches a preset threshold. Once this threshold is reached, a Stanford Research Systems DG645 pulse generator shuts off the power to the AOM driver, which then diverts the beam from the cavity. The pulse generator also signals the Data Acquisition (DAQ) card to start taking data for a ring-down.
The optics, electronics and vacuum systems are currently in place. Addition-ally, computer controls of various components such as the pulse generator and laser driver have been written in LabVIEW and are functional. Data in the form of analog voltage levels at specified time intervals are sampled by LabVIEW through the DAQ unit and stored as an array. Once a data array from a ring-down is stored in LabVIEW, the program creates a least-square fit to the expo-nential decay and calculates the ring-down time from the fit. Several ring-downs will be averaged, and goodness-of-fit tests carried out. Ring-down signals from the detector have been simulated and a LabVIEW program has been written to
Figure 2. Simulated cavity transmission for a mode-matched cavity with finesse of 100.
Proceedings of the South Dakota Academy of Science, Vol. 91 (2012) 163
fit and average these exponential decays and return a value for the ring-down time.
The BHSU CRDS system will make several improvements over commercially available systems, bringing the available sensitivity to water vapor and oxygen down to the 0.01 ppb range (from 0.1 ppb (Tiger, 2012)). A factor of four in sensitivity is expected from increasing the length of the cavity from 0.5 m to 2 m, as sensitivity increases linearly with pathlength. To increase the sample rate (and thus lower statistical error), we will use an acousto-optic modulator to divert the beam from the cavity instead of turning off the current to the laser. Additionally, two lasers will be used to sample the ring-downs on- and off-resonance with the absorption line of the contaminant.
DISCUSSION
A small scale prototype cavity 0.4 m long has been developed to test a variety of design challenges. This prototype cavity will eventually be replaced by one two meters in length, to reach the sensitivity goal of the system. The extreme reflectivity of the mirrors used in the BHSU system produces a cavity finesse of approximately 180,000. Thus, the cavity modes produced are expected to have a very small linewidth (400 Hz) for the 2 m cavity. This leads to the challenge of being able to detect these sharp modes.
One method of scanning across the cavity modes is by changing the wavelength of the laser. This is accomplished by linearly varying the temperature of the laser
4
Figure 2. Simulated cavity transmission for a mode-matched cavity with finesse of 100.
THE BHSU CRDS SYSTEM
A schematic diagram of the BHSU CRDS system is shown in Figure 3. A distributed feedback laser of wavelength 1392 nm is coupled into a cavity comprised of two super-mirrors of reflectivity 0.999983 for light at 1392 nm. The light transmitted through the second super-mirror is detected using a Hamamatsu G10899-003K InGaAs detector. A wave-function generator ramps the piezo-electric transducer (PZT) voltage which stretches the length of the stainless steel cavity, until the signal from the detector reaches a preset threshold. Once this threshold is reached, a Stanford Research Systems DG645 pulse generator shuts off the power to the AOM driver, which then diverts the beam from the cavity. The pulse generator also signals the Data Acquisition (DAQ) card to start taking data for a ring-down.
Figure 3. Schematic diagram of the BHSU CRDS system. C= Computer; DAQ = Data Acquisition Unit; LD = Laser Driver; I/C= Isolator/Collimator; AOM = Acousto-Optic Modulator; AOMD= Acousto-Optic Modulator Driver; MML = Mode Matching Lenses; M = Super-mirrors; PZT = Piezo-electric Transducers; PZTC = PZT Controller; D = Photodetector; DE = Detector Electronics; PG/T = Pulse Generator; PG = Pressure Gauge; RG=Ramp Generator; TP = Turbo-molecular Pump; RP = Rough Pump; MFC = Mass Flow Controller.
The optics, electronics and vacuum systems are currently in place. Additionally, computer controls of various components such as the pulse generator and laser driver have been
Figure 3. Schematic diagram of the BHSU CRDS system. C = Computer; DAQ = Data Acquisition Unit; LD = Laser Driver; I/C = Isolator/Collimator; AOM = Acousto-Optic Modulator; AOMD = Acousto-Optic Modulator Driver; MML = Mode Matching Lenses; M = Super-mirrors; PZT = Piezo-electric Transducers; PZTC = PZT Controller; D = Photodetector; DE = Detector Electronics; PG/T = Pulse Generator; PG = Pressure Gauge; RG=Ramp Generator; TP = Turbo-molecular Pump; RP = Rough Pump; MFC = Mass Flow Controller.
164 Proceedings of the South Dakota Academy of Science, Vol. 91 (2012)
diode. However, we found that this technique would not scan in fine enough steps to detect the sharp modes. An alternative method of scanning across the cavity modes is to change the length of the cavity. The commercial method of changing cavity length is based on PZTs attached to one of the cavity’s super-mirrors that adjust the location of the mirror relative to the stainless steel cell.
However, in a recently published novel method, the PZTs are used to stretch the stainless steel cavity cell itself (Tang 2012). Since the scan only needs to change the length of the cavity by ∆L=λ/2, (where λ is the wavelength of the laser) and the cavity cell is relatively thinly walled, this can be accomplished us-ing PZTs.
The BHSU small scale prototype cavity cell with mounted PZTs is shown in Figure 4. Each PZT is encased within a stainless steel casing that is manufac-tured with a female thread on its base and a male thread on its translating end. A stainless steel bolt runs through the conflat flanges containing the super-mirror on one end of the cavity and into the threaded base of the PZT. At the cavity end that is opposite the PZT, a stainless steel bolt runs through the super-mirror conflat flanges and fixes the adjustable rod assembly in place. We have success-fully observed modes with this new scanning technique.
Another issue being addressed is optimizing the entry of the 1392 nm infrared (IR) laser light into the cavity. Because of the very high finesse (F = 185,000) of the system when using 1392 nm light through the super-mirrors, initial de-tection of the very sharp modes during alignment procedures is quite difficult. Alignment procedures are being tested on the 0.4 m prototype cavity. Align-ment of the laser through the optics of the system was attempted using a visible Helium-Neon laser (HeNe) sent through a beam splitter so that the HeNe beam traveled along the same path through the optics system as the 1392 nm IR diode laser beam. The super-mirrors are not highly reflective at the HeNe wavelength, leading to a low finesse (F~1) and broad linewidth cavity modes. While these broad HeNe modes could be detected, the HeNe proved to be not very effective for assisting with alignment of the 1392 nm IR diode laser. This could be due to several reasons including the lasers having differing beam profiles as well as the increased refraction of the HeNe beam through the optics.
In the short term, plans include the procurement of a 1550 nm IR laser. At this wavelength our current super-mirrors have a reflectivity of 0.997. (Our super-mirrors are highly reflective only for wavelength around 1392 nm). This would
6
Figure 4. BHSU CRDS 0.4 m prototype cavity with novel PZT technique to stretch the cavity.
Another issue being addressed is optimizing the entry of the 1392 nm infrared (IR) laser light into the cavity. Because of the very high finesse (F = 185,000) of the system when using 1392 nm light through the super-mirrors, initial detection of the very sharp modes during alignment procedures is quite difficult. Alignment procedures are being tested on the 0.4 m prototype cavity. Alignment of the laser through the optics of the system was attempted using a visible Helium-Neon laser (HeNe) sent through a beam splitter so that the HeNe beam traveled along the same path through the optics system as the 1392 nm IR diode laser beam. The super-mirrors are not highly reflective at the HeNe wavelength, leading to a low finesse (F~1) and broad linewidth cavity modes. While these broad HeNe modes could be detected, the HeNe proved to be not very effective for assisting with alignment of the 1392 nm IR diode laser. This could be due to several reasons including the lasers having differing beam profiles as well as the increased refraction of the HeNe beam through the optics.
In the short term, plans include the procurement of a 1550 nm IR laser. At this wavelength our current super-mirrors have a reflectivity of 0.997. (Our super-mirrors are highly reflective only for wavelength around 1392 nm). This would provide a cavity finesse of about 1,000 which while lower than the final cavity (F~185,000), would be of a much higher finesse than the cavity with the HeNe (F~1). This laser would be used to aid in the alignment of the current laser.
Long term plans include the development of in-house custom electronics systems. These systems would replace the current bulky electronics such as the laser driver and pulse generator. Once the BHSU CRDS is operational for the detection of water, the system will be optimized for oxygen. This would be a straightforward project involving adding a laser to the system which is tuned to an absorption band of oxygen. All electronics and data acquisition/analysis systems would remain in place. While high precision CRDS sensors for H2O and O2 exist, a sensor for N2 does not. The detection of nitrogen would require a novel system possibly using a plasma to reach an excited state with an infrared transition. At the same time the nitrogen system is being designed and tested, water and oxygen CRDS sensors may be built for use in other liquid noble gas based detectors in neutrino and dark matter experiments.
Figure 4. BHSU CRDS 0.4 m prototype cavity with novel PZT technique to stretch the cavity.
Proceedings of the South Dakota Academy of Science, Vol. 91 (2012) 165
provide a cavity finesse of about 1,000 which while lower than the final cavity (F~185,000), would be of a much higher finesse than the cavity with the HeNe (F~1). This laser would be used to aid in the alignment of the current laser.
Long term plans include the development of in-house custom electronics systems. These systems would replace the current bulky electronics such as the laser driver and pulse generator. Once the BHSU CRDS is operational for the detection of water, the system will be optimized for oxygen. This would be a straightforward project involving adding a laser to the system which is tuned to an absorption band of oxygen. All electronics and data acquisition/analysis systems would remain in place.
While high precision CRDS sensors for H2O and O2 exist, a sensor for N2
does not. The detection of nitrogen would require a novel system possibly using a plasma to reach an excited state with an infrared transition. At the same time the nitrogen system is being designed and tested, water and oxygen CRDS sensors may be built for use in other liquid noble gas based detectors in neutrino and dark matter experiments.
ACKNOWLEDGEMENTS
The authors would like to thank Kevin Lehmann for his many useful com-ments and discussions. This work was funded in part by the South Dakota 2010 Center for Ultra-low Background Experiments at DUSEL (CUBED) and the National Science Foundation NSF grant 0903335, NSF MRI grant 0923557.
LITERATURE CITED
Acciarri,R., et al. [WARP Collaboration]. 2010a. Oxygen Contamination in Liquid Argon: Combined Effect on Ionization Electron Charge and Scintil-lation Light. Journal of Instrumentation 5:P05003.
Acciarri, R., et al. [WARP Collaboration]. 2010b. Effects of Nitrogen Contami-nation in Liquid Argon. Journal of Instrumentation 5:P06003.
Akimov, D., et al. [DARKSIDE Collaboration]. 2012. Arxiv:1204.6218v1.Amerio, S., et al. [ICARUS Collaboration]. 2004. Nuclear Instruments and
Methods in Physics Research A 527:329.Aprile, E., and T. Doke. 2010. Liquid Xenon Detectors for Particle Physics and
Astrophysics. Review of Modern Physics 82:2053.Berden, G., and R. Engeln. 2009. Cavity Ring-down Spectroscopy: Techniques
and Applications. Wiley. Chichester, West Sussex, United Kingdom. 344 pp.Busch, K.W., and M.A. Busch. 1999. Cavity Ring-down Spectroscopy. Oxford
University Press. Danvers, MA. 288 pp.Lopes, M.I, and V. Chepel. 2003. Liquid Rare Gas Detectors: Recent Develop-
ments and Applications. IEEE Transactions on Dielectrics and Electrical Insulation 10:994.
Mavrokoridis, K., et al. 2011. Argon Purification Studies and a Novel Liquid Argon Re-circulation System. Journal of Instrumentation 6:P08003.

166 Proceedings of the South Dakota Academy of Science, Vol. 91 (2012)
Siegmanm A.E. 1986. Lasers. University Science Books. Sausalito, CA.Tang, Y., S.L. Yang, and K.K. Lehmann. 2012. A Rigid, Monolithic but Still
Scannable Cavity Ring-down Spectroscopy Cell. Review of Scientific Instru-ments 83:043115.
Tiger Optics Webstite: tigeroptics.com. [Cited: October 8, 2012].
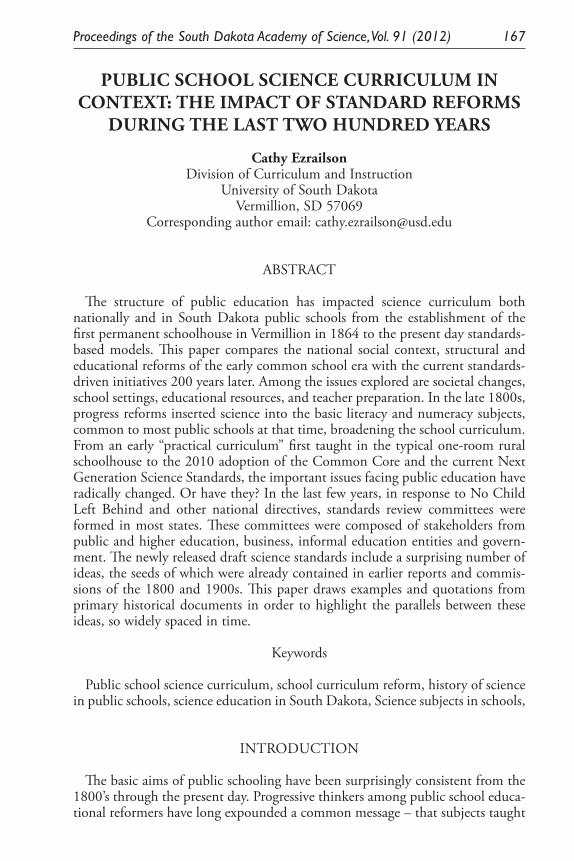
Proceedings of the South Dakota Academy of Science, Vol. 91 (2012) 167
PUBLIC SCHOOL SCIENCE CURRICULUM IN CONTEXT: THE IMPACT OF STANDARD REFORMS
DURING THE LAST TWO HUNDRED YEARS
Cathy EzrailsonDivision of Curriculum and Instruction
University of South DakotaVermillion, SD 57069
Corresponding author email: [email protected]
ABSTRACT
The structure of public education has impacted science curriculum both nationally and in South Dakota public schools from the establishment of the first permanent schoolhouse in Vermillion in 1864 to the present day standards-based models. This paper compares the national social context, structural and educational reforms of the early common school era with the current standards-driven initiatives 200 years later. Among the issues explored are societal changes, school settings, educational resources, and teacher preparation. In the late 1800s, progress reforms inserted science into the basic literacy and numeracy subjects, common to most public schools at that time, broadening the school curriculum. From an early “practical curriculum” first taught in the typical one-room rural schoolhouse to the 2010 adoption of the Common Core and the current Next Generation Science Standards, the important issues facing public education have radically changed. Or have they? In the last few years, in response to No Child Left Behind and other national directives, standards review committees were formed in most states. These committees were composed of stakeholders from public and higher education, business, informal education entities and govern-ment. The newly released draft science standards include a surprising number of ideas, the seeds of which were already contained in earlier reports and commis-sions of the 1800 and 1900s. This paper draws examples and quotations from primary historical documents in order to highlight the parallels between these ideas, so widely spaced in time.
Keywords
Public school science curriculum, school curriculum reform, history of science in public schools, science education in South Dakota, Science subjects in schools,
INTRODUCTION
The basic aims of public schooling have been surprisingly consistent from the 1800’s through the present day. Progressive thinkers among public school educa-tional reformers have long expounded a common message – that subjects taught

168 Proceedings of the South Dakota Academy of Science, Vol. 91 (2012)
also must be presented from a concrete and applied point of view rather than only from an abstract or general position. Further, school curricula must be con-nected to other learning and the experiences of students. The purpose of this pa-per is to explore and compare the context into which science education appeared in schools in the United States, rooted in the Common School Era—refined and “reformed” over time. Specifically this paper will trace the curricula, including the science curricula, in American public schools over the last two hundred years.
HISTORY OF PUBLIC EDUCATION IN THE UNITED STATES The European Model of Education had emphasized history, classical languages,
philosophy, classical mathematics and science. Early American models changed this model in order to include more practical subjects for educating the masses like reading, bible study, and character education. Early curriculum tended to be infused with religious doctrine with rote learning methods such as oral recitation and repetition.
In early nineteenth century America, public schools were supported by towns in the northern British colonies. School was held for approximately ten to twelve weeks per year and enrolled more boys than girls. Often organized by town coun-cils, these schools also charged parents a fee. Prior to this period, families had assumed most of the responsibility for educating children in partnership with churches. At that time, schooling was not free, not governmental, and not secu-lar. This meant that family wealth, race, and student gender had an enormous impact on how much formal education was received (Kaestle 1983).
In 1837, social reformer, Horace Mann and others established a Massachusetts state board of education. Mann saw public schools as a way to improve the lives of common people by equalizing educational opportunities. The main purpose of early public education was to create a literate society in which reading, writ-ing, and arithmetic were typically considered the most important topics. And, although science was known and incorporated into reading and mathematics ex-amples, the emphasis was on practical applications of knowledge so that citizens could provide for their families. Science in the school curriculum appeared later and generally in the high school, where students were prepared for the profes-sions and for college experiences.
At this time, institutes for teachers were established along with an increase in the length of the school year to six months. Taxes were raised to establish school furnishings, books, and supplies. Not all children, however, could attend public schools with Native Americans sent to special government schools and African Americans forced to create their own separate schools (Levin et al. 2000).
Another societal factor that impacted the distribution of the U.S. student population before and after the Civil War was the immigration to America that reached an all-time high. Due to harsh working conditions and hardship in the big cities of the northeast, many children were abandoned or orphaned with few resources. Between 1854 and 1929, upwards of 250,000 children were sent by train from cities in the East to towns in the Midwest (Katz 1987). Families interested in the orphans arrived at local train stations to look them over upon
Proceedings of the South Dakota Academy of Science, Vol. 91 (2012) 169
their arrival. Many orphans ended up on farms as laborers. The fortunate few were adopted by humane families who treated them kindly (Cremin 1980). The influx of these children into the center of the country influenced the need for more schools and support of schools in communities already stressed financially. At the same time, the first versions of public schools similar to the schools we have today were loosely organized in cities and rural communities alike. These schools were known as “common schools,” and were the first to be funded by local property taxes, charging no tuition.
Common schools were open to all white children, run by local school boards and began to be subject to some state regulation, an early precursor to state in-tervention in local school operations and curriculum standards. First found in the Northeast and Midwest states in the twenty years prior to the Civil War, the common school movement spread to both the South and the West by the begin-ning of the 20th century (Levin et al. 2000).
In the U.S. and Canada, the boarding school era began in the late 1800s and continued through the 1920s. Separated from their families, many Indian chil-dren, some as young as three years old, were “Americanized” in schools where “affection was rare” and “punishment often severe.” Indian dress, language and beliefs were forbidden. Many children were abused, and tried to run away; un-known numbers died (Elliot and Dirr 1998).
CURRICULUM AND TEACHER PREPARATION BEFORE THE 20TH CENTURY
The common school curriculum in the mid-1800s consisted mainly of the basics—reading, penmanship, arithmetic, and “good manners.” A typical one-room schoolhouse housed students of all ages and abilities with learning methods that included oral recitation, drilling, and quizzes. Supplies included a slate, chalk, and a few books. Schools were sparsely supplied as families’ resources were focused on the farm and issues of survival. In sparsely populated areas of the U.S, school might be open only for a few weeks or months in a year, when students were not needed to work on the farm. In 1913, educational progressive, George H. Betts suggested several reform measures for the rural school curriculum that have parallels in the newly emerging national standards and which still have relevance today. Betts ideas included:
“If the rural school is to meet its problem[s], it must extend the scope of its curriculum. It was formerly thought by many that education, ex-cept in its simplest elements, was only for those planning to enter the “learned professions.” But this idea has given way before the onward sweep of the spirit of democracy, and we now conceive education as the right and duty of all. Nor by education do we mean the simple ability to read, write, and number.” (Betts 1913)
Common schools had meager resources and inadequate or non-existent teacher training. They had rejected the “European-style” curriculum as it was
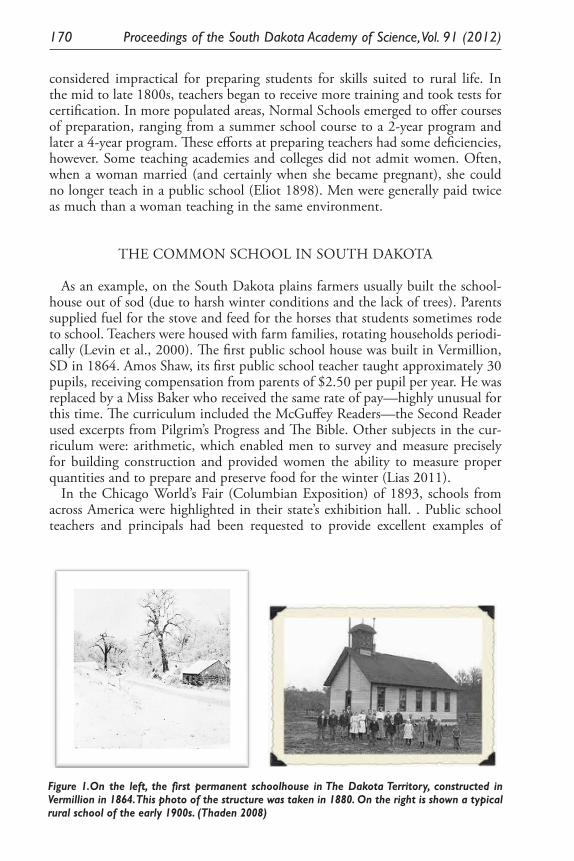
170 Proceedings of the South Dakota Academy of Science, Vol. 91 (2012)
considered impractical for preparing students for skills suited to rural life. In the mid to late 1800s, teachers began to receive more training and took tests for certification. In more populated areas, Normal Schools emerged to offer courses of preparation, ranging from a summer school course to a 2-year program and later a 4-year program. These efforts at preparing teachers had some deficiencies, however. Some teaching academies and colleges did not admit women. Often, when a woman married (and certainly when she became pregnant), she could no longer teach in a public school (Eliot 1898). Men were generally paid twice as much than a woman teaching in the same environment.
THE COMMON SCHOOL IN SOUTH DAKOTA As an example, on the South Dakota plains farmers usually built the school-
house out of sod (due to harsh winter conditions and the lack of trees). Parents supplied fuel for the stove and feed for the horses that students sometimes rode to school. Teachers were housed with farm families, rotating households periodi-cally (Levin et al., 2000). The first public school house was built in Vermillion, SD in 1864. Amos Shaw, its first public school teacher taught approximately 30 pupils, receiving compensation from parents of $2.50 per pupil per year. He was replaced by a Miss Baker who received the same rate of pay—highly unusual for this time. The curriculum included the McGuffey Readers—the Second Reader used excerpts from Pilgrim’s Progress and The Bible. Other subjects in the cur-riculum were: arithmetic, which enabled men to survey and measure precisely for building construction and provided women the ability to measure proper quantities and to prepare and preserve food for the winter (Lias 2011).
In the Chicago World’s Fair (Columbian Exposition) of 1893, schools from across America were highlighted in their state’s exhibition hall. . Public school teachers and principals had been requested to provide excellent examples of
4
THE COMMON SCHOOL IN SOUTH DAKOTA
As an example, on the South Dakota plains farmers usually built the schoolhouse out of sod (due to harsh winter conditions and the lack of trees). Parents supplied fuel for the stove and feed for the horses that students sometimes rode to school. Teachers were housed with farm families, rotating households periodically (Levin et al., 2000).The first public school house was built in Vermillion, SD in 1864. Amos Shaw, its firstpublic school teacher taught approximately 30 pupils, receiving compensation from parents of $2.50 per pupil per year. He was replaced by a Miss Baker who received the same rate of pay -- highly unusual for this time. The curriculum included the McGuffey Readers -- the Second Reader used excerpts from Pilgrim’s Progress and The Bible.Other subjects in the curriculum were: arithmetic, which enabled men to survey and measure precisely for building construction and provided women the ability to measure proper quantities and to prepare and preserve food for the winter (Lias 2011).
Figure 1.On the left, the first permanent schoolhouse in The Dakota Territory, constructed in Vermillion in 1864. This photo of the structure was taken in 1880. On the right is shown a typical rural school of the early 1900s. (Thaden 2008)
In the Chicago World’s Fair (Columbian Exposition) of 1893, schools from across America were highlighted in their state’s exhibition hall. . Public school teachers and principals had been requested to provide excellent examples of scholarship. During a lecture at the Fair, Fredrick Jackson Turner announced that “the United States’ Western Frontier had been tamed.” Although South Dakota had become a state only four yearspreviously, its exhibitions sought to show a prosperous state with resources to attract industry and investment. They extolled the “efficiency of the state’s educational system, quality of work produced by its mining industry, and magnitude of the crops yielded by its farmers on display at the Fair” (The World’s Columbian Exhibition 1893).
RESULTS OF BROADENING THE CURRICULUM
Figure 1.On the left, the first permanent schoolhouse in The Dakota Territory, constructed in Vermillion in 1864. This photo of the structure was taken in 1880. On the right is shown a typical rural school of the early 1900s. (Thaden 2008)

Proceedings of the South Dakota Academy of Science, Vol. 91 (2012) 171
scholarship. During a lecture at the Fair, Fredrick Jackson Turner announced that “the United States’ Western Frontier had been tamed.” Although South Dakota had become a state only four years previously, its exhibitions sought to show a prosperous state with resources to attract industry and investment. They extolled the “efficiency of the state’s educational system, quality of work produced by its mining industry, and magnitude of the crops yielded by its farmers on display at the Fair” (The World’s Columbian Exhibition 1893).
RESULTS OF BROADENING THE CURRICULUM
With the advent of textbooks, the teacher could teach more easily in a class-room in which students were at different levels (Klopfer and Cooley 1963). The first school textbook recorded was the New England Primer, used between 1760 and 1843. The McGuffy Readers, first used in 1836, were based on examples of world literature. They were the basis for teaching reading and basic values such as honesty and charity.
During the late 19th century several national educational reform initiatives emerged. With the establishment of the National Educational Association (NEA) in 1857, a systematic study of schooling in America was undertaken. Interestingly enough, women were not allowed to join until 1866, even though the majority of the Nation’s teachers were women (Cremin 1980). According to the NEA in 1893, only about one-third of the pupils who entered the first year of the elementary school reached a four-year high school, and only about one in nine graduated. To address that problem, a commission instituted by the NEA met and defined a new curriculum called the Cardinal Principles of Secondary Education which included: “1) Health, 2) Command of fundamental processes, 3) Worthy home-membership, 4) Vocation, 5) Citizenship, 6) Worthy use of lei-sure, and 7) Ethical character.” Changes were also made to the structure of post-elementary education dividing the 6 secondary years into three junior and three senior segments and to broadening and deepening the curriculum. Students were divided into groups by ability, marking the beginning of what was later called “tracking.” Public schools had begun to change in response to the identified curricular deficiencies. A new concept of curriculum structure was emerging. By definition the term “curriculum” was used by the NEA commission:
…to designate a systematic arrangement of subjects, and courses in those subjects, both required and elective, extending through two or more years and designed for a group of pupils whose common aims and probable careers may properly differentiate a considerable part of their work from that of other groups in the school (NEA 1918).
DISCUSSION: SCIENCE IN THE CURRICULUM
In the U.S., science education originated as a scatter of disparate subjects prior to its standardization in the 1890s. In the early 1900s, formal science subjects be-
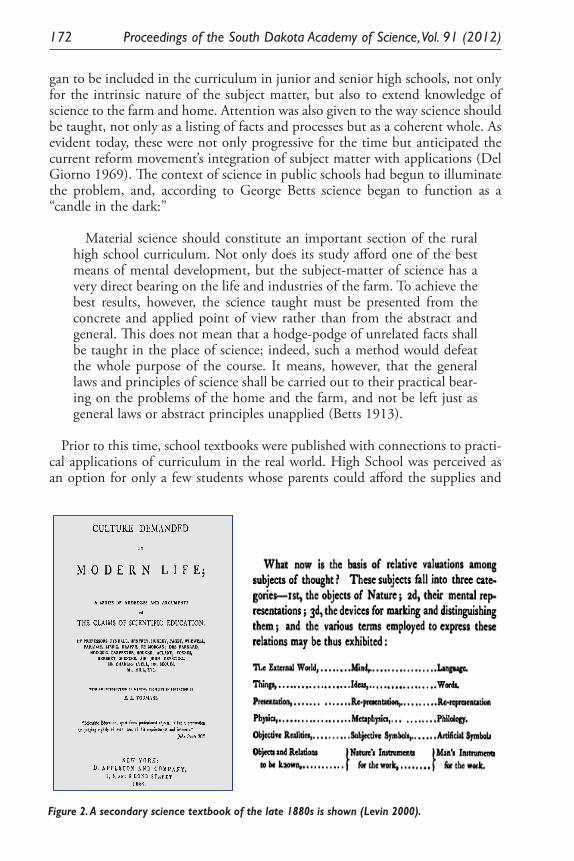
172 Proceedings of the South Dakota Academy of Science, Vol. 91 (2012)
gan to be included in the curriculum in junior and senior high schools, not only for the intrinsic nature of the subject matter, but also to extend knowledge of science to the farm and home. Attention was also given to the way science should be taught, not only as a listing of facts and processes but as a coherent whole. As evident today, these were not only progressive for the time but anticipated the current reform movement’s integration of subject matter with applications (Del Giorno 1969). The context of science in public schools had begun to illuminate the problem, and, according to George Betts science began to function as a “candle in the dark:”
Material science should constitute an important section of the rural high school curriculum. Not only does its study afford one of the best means of mental development, but the subject-matter of science has a very direct bearing on the life and industries of the farm. To achieve the best results, however, the science taught must be presented from the concrete and applied point of view rather than from the abstract and general. This does not mean that a hodge-podge of unrelated facts shall be taught in the place of science; indeed, such a method would defeat the whole purpose of the course. It means, however, that the general laws and principles of science shall be carried out to their practical bear-ing on the problems of the home and the farm, and not be left just as general laws or abstract principles unapplied (Betts 1913).
Prior to this time, school textbooks were published with connections to practi-cal applications of curriculum in the real world. High School was perceived as an option for only a few students whose parents could afford the supplies and
6
however, the science taught must be presented from the concrete and applied point of view rather than from the abstract and general. This does not mean that a hodge-podge of unrelated facts shall be taught in the place of science; indeed, such a method would defeat the whole purpose of the course. It means, however, that the general laws and principles of science shall be carried out to their practical bearing on the problems of the home and the farm, and not be left just as general laws or abstract principles unapplied (Betts 1913).
Prior to this time, school textbooks were published with connections to practical applications of curriculum in the real world. High School was perceived as an option for only a few students whose parents could afford the supplies and books. Students who attended high school were thought “bound for the professions” such as medicine, law and politics with aspirations for college matriculation. Figure 2 shows an example of a common public school textbook.Highlighted are the “relative variations among the subjects of thought.”
Figure 2. A secondary science textbook of the late 1880s is shown (Levin 2000).
John Dewey and other school reformers began to change teaching and learning in America. In Dewey’s The School and Society (1900), he maintained that learningshould be grounded in experience. As an alternative to the drill-and-recitation methods of the nineteenth century, in Experience and Education (Dewey 1938), he posited that education should be based on the child’s psychological and physical development, as well as the world outside the schoolroom (Levin et al. 2000). Experiences in the classroom at all levels (now referred to as “hands-on” or experiential learning) have always been very suited as a method for teaching science.
Daniel Alexander Payne, Past President of Wilberforce University in Ohio and the first African-American college president in the United States born to free parents,
Figure 2. A secondary science textbook of the late 1880s is shown (Levin 2000).
Proceedings of the South Dakota Academy of Science, Vol. 91 (2012) 173
books. Students who attended high school were thought “bound for the profes-sions” such as medicine, law and politics with aspirations for college matricula-tion. Figure 2 shows an example of a common public school textbook. High-lighted are the “relative variations among the subjects of thought.”
John Dewey and other school reformers began to change teaching and learn-ing in America. In Dewey’s The School and Society (1900), he maintained that learning should be grounded in experience. As an alternative to the drill-and-recitation methods of the nineteenth century, in Experience and Education (Dewey 1938), he posited that education should be based on the child’s psycho-logical and physical development, as well as the world outside the schoolroom (Levin et al. 2000). Experiences in the classroom at all levels (now referred to as “hands-on” or experiential learning) have always been very suited as a method for teaching science.
Daniel Alexander Payne, Past President of Wilberforce University in Ohio and the first African-American college president in the United States born to free parents, opened his own school at the age of 19. He wrote about educating him-self and his students in his autobiography the Recollections of Seventy Years. The following 1830’s excerpt reveals the societal context in which “black schools” op-erated at that time and something about how the curriculum sometimes evolved in those schools (Payne 1888).
My first school consisted of three children, for each of whom I was paid fifty cents a month. I also taught three adult slaves at night, thus making my monthly income from teaching only three dollars...The next thing which arrested my attention was botany… Descriptive chemistry, natural philosophy, and descriptive astronomy followed in rapid suc-cession... My researches in botany gave me a relish for zoology; but as I could never get hold of any work on this science I had to make books for myself. This I did by killing such insects, toads, snakes, young alliga-tors, fishes, and young sharks as I could catch. I then cleaned and stuffed those that I could, and hung them upon the walls of my school-room.
Laboratories were first introduced into the science courses in public high schools during the late 1800s. High school science laboratories have been defined as laboratory experiences that allow for students to interact directly with the material world (or with data drawn from the material world), using the neces-sary tools, data collection techniques, models, and theories of science (Singer et al. 2005).
Today, high school science education includes some appreciation of the na-ture of science in order to provide scientific literacy for all. As part of a liberal education and to prepare students for further study, work, and citizenship, the scientific methods of observing, investigating and discerning fact from myth has earned science a much needed place in the American public school curriculum. There is agreement that hands-on study of science is imperative.
Science and its methods of applying critical thinking, questioning, and orga-nization of ideas from observation, deriving meaning from evidence, applying these to explanation, argumentation and prediction all stand solidly on the
174 Proceedings of the South Dakota Academy of Science, Vol. 91 (2012)
ground of a well-articulated subject. These are the underpinnings of any long-lasting and deep learning. New standards have begun to be set for public school curriculum. The process continues today.
DISCUSSION: EDUCATIONAL STANDARDS: THEN AND NOW
The Cardinal Principles of Secondary Education prescribed changes to the structure and direction public education needed to take in the future. These and subsequent implemented reforms have led public schools to the current standard-based reform movement. Further, the NEA charged the Commission on the Reorganization of Secondary Education with the task of modifying sec-ondary education so that it became more in line with the character of society, students and educational theory (NEA 1918).
A similar call for reform seventy-five years later and published in 1989 by the American Association for the Advancement of Science (AAAS), Project 2061’s Science for All Americans was a clarion call response to the urgent need for stan-dards-based reform in the sciences. The purpose of the report was to re-clarify the goals of science education so that educators could begin to make scientific literacy attainable by all students (DeBoer 1991).
Since 2001, schools have operated under No Child Left Behind (NCLB) and a separate set of state and local statutes (in an atmosphere of ‘high stakes testing) citing new assessment-based curricula. The impact of the NCLB movement on funding has been enormous. School districts have been swamped with additional reporting measures designed to close loopholes for the non-reporting of student test scores (Jorgenson and Hoffman 2003). The result has been a giant “leap backward” for curriculum reform and student-centered instructional measures.
Following the NCLB Act and in response to the need for a more balanced view of a curriculum based on expert recommendations, the Common Core State Standards Initiative was spawned. Additionally, in 2010, the Science Frameworks were released followed in 2012 by a draft of the Next Generation Science Stan-dards (NGSS) (based on the Frameworks). The NGSS (and Frameworks) were developed collaboratively by 20 states by representatives from science, science education, higher education and industry. These Frameworks (and the NGSS constructed from them) will seek to integrate concepts, skills and ideas while de-scribing inquiry-based settings in which science learning is most effective (BOSE 2011. The new Science Frameworks consist of a limited number of elements in three dimensions:
(1) Scientific and engineering practices, (2) Crosscutting concepts, and (3) Disciplinary core ideas in science.
They describe how these should be developed (progress) across grades K-12. It is designed so that students continually build on and revise their science knowledge and abilities throughout their school years.
Proceedings of the South Dakota Academy of Science, Vol. 91 (2012) 175
To support this learning, all three dimensions are to be integrated into standards, curricula, instruction, and assessment (Singer et al. 2005).
In South Dakota, Secretary of Education Melody Schopp along with Science Education Specialist and Primary Point of Contact Sam Shaw are directing a large statewide group of standards reviewers. These new science standards are slated for release in early 2013 (Shaw 2012).
FUTURE IMPLICATIONS
In the previous sections of this paper, the evolution of American public schools was discussed including the inclusion of science subjects and reforms which remarkably contain several common elements. Although, U.S. public education eventually broadened to include all citizens, it didn’t begin that way. In the com-mon school, prevalent in the Midwest including South Dakota, school curricula were designed based on physical necessity and financial expediency.
Over the last two centuries, the social context has changed in rural schools, the “small city” schools in urban and suburban areas. Since change is always inevi-table, the context in which students learn and teachers teach has had to adapt to the swinging pendulum of social evolution and educational reform.
Students should be better educated in schools by teachers who receive appro-priate, practical and more diverse educational preparation. All teachers should be supported with methods and curricula that tap a well-defined body of knowledge and framed in decades of educational research in order to effectively prepare them for the classroom. Further, science education should be the adding of rich new threads integrated into the “whole cloth” of any student’s rudimentary sci-ence knowledge base and not added as a “peripheral fringe” around its edges.
CONCLUSION
At a hearing early in 2007, Senator Edward Kennedy suggested that the way forward in science education lies in our knowledge of the past. He reminded us of events that have been forgotten in the present push for standards reform, “We did it after the Sputnik launch, [in 1957] when we trained a new generation of Americans in math and science. And we inspired millions more to greater and greater innovation when President Kennedy challenged us to send a man to the moon” (Abramson 2007). In 1958, Congress had passed the National Defense Education Act that gave a new science curriculum an infusion of more than a billion dollars when it passed.
The work is not complete, however. As long as society changes (and it must) and curriculum standards are again refined; as long as students must be edu-cated and teachers must be prepared to teach, reforms will by their very nature continue. If the roots of today’s initiatives are framed in an historical context, with a deeper understanding and appreciation of how knowledge of past reforms can inform the present, future reformers may be able to instill a fuller and more responsive science education design in American public schools.

176 Proceedings of the South Dakota Academy of Science, Vol. 91 (2012)
LITERATURE CITED
Abramson, L. 2007. Sputnik left legacy for U.S. science education. NPR. Avail-able at http://www.npr.org/templates/story/story.php?storyId=14829195. [Cited 7/27/12].
Board on Science Education (BOSE). 2011. A Framework for K-12 science edu-cation: practices, crosscutting concepts, and core ideas. National Academies Press, Washington, D.C. 386 pp.
Betts, G. H. 1913. New ideals in rural schools. Houghton Mifflin, Boston. 127 pp.
Cremin, L. 1980. American education: The national experience. Harper Collins, New York.
DeBoer, G. 1991. A history of ideas in science education: Implications for prac-tice. Teachers College Press, NewYork. 271 pp.
Del Giorno, B.J. 1969. The impact of changing scientific knowledge on science education in the United States since 1850. Science Education 53: 191-195.
Dewey, J. 1900. The school and society. University of Chicago Press, Chicago. 129 pp..
Dewey, J. 1938. Experience and Education. Kappa Delta Pi, Indianapolis. 181 pp.
Eliot, C. 1898. Educational reform. Century, New York. 418 pp.Elliot, M., and M. Dirr. 1998. Schools in South Dakota: An educational de-
velopment. South Dakota State Historic Preservation Office, Pierre. 41 pp.Jorgenson, M.A., and J. Hoffman. 2003. History of the No Child Left Behind
Act of 2001 (NCLB). Pearson, San Antonio. 7 pp.Kaestle, Carl. 1983. Pillars of the republic: Common schools and American
society, 1780-1860. Hill and Wang, New York.Katz, Michael. 1987. Reconstructing American education. Harvard University
Press, Cambridge. Pp. 24-57.Klopfer, L. E., and W.W. Cooley. 1963. History of science cases for high schools.
Report on the HOSG Journal of Research in Science Teaching 1: 33-47.Levin, C., S. Harris, D. Neiman, M. Pinto, S. McCarthy, A. Moore, and C.
Scott. 2000: Only a teacher. Public Broadcasting Service eBook. Available at http://www.pbs.org/onlyateacher/. [Cited 3/3/2012]
Lias, D. 2011. . Early settlers in Vermillion construct Dakota Territory’s first permanent school. October 28, 2011 Available from www.plaintalk.net. [Cited 3/6/12]
NEA (National Education Association). 1918. Cardinal principles of secondary education: A report of the commission on the reorganization of secondary education. Bulletin No.35. U.S. Govt. Printing Office, Washington, D.C. Available at http://www.archive.org/stream/cardinalprincipl00natiuoft/car-dinalprincipl00natiuoft_djvu.txt. [Cited 5/30/2012]
Payne, D. 1888 .Recollections of seventy years. Ayer, New York (reprint 1991), pp. 27–28.
Shaw, S. 2012. July 9. Personal communication.

Proceedings of the South Dakota Academy of Science, Vol. 91 (2012) 177
Singer, S.R., M.L. Hilton, and H. Schweingruber. 2005. America’s lab report: Investigations in high school science. National Academies Press, Washing-ton, D.C.
Thaden, T. R. 2008. From the river valleys to the rising bluff, a pictorial history of Vermillion, South Dakota 1859-2009. Clay County Historical Society. Donning Company Publishers,Virginia Beach.
The World’s Columbian Exhibition: South Dakota Educational Exposition. 1893. (uncataloged) Richardson Collection, Archives and Special Collec-tions. The University of South Dakota, [Accessed April 3, 2012 and May 25, 2012].

Proceedings of the South Dakota Academy of Science, Vol. 91 (2012) 179
OBSERVATIONS OF THE ENIGMATIC FOSSIL INSECTIVORE, PLESIOSOREX
(MAMMALIA) IN NORTH AMERICA
James E. MartinJ.E. Martin Geoscientific Consultation
21051 Doral CourtSturgis, SD 57785
Corresponding author email: [email protected]
ABSTRACT
In North America, Plesiosorex existed during the Neogene, appearing in the early Hemingfordian North American Land Mammal Age (NALMA) and per-sisting to the late Hemphillian NALMA. Records from older rocks in Europe indicate that Plesiosorex dispersed to North America as part of a major paleofau-nal interchange in the early Miocene that included other insectivores, rodents, carnivores, and ungulates. Based on known specimens, Plesiosorex is widely distributed during the Hemingfordian NALMA from the East Coast to Idaho, is relatively abundant from the Great Plains to the Great Basin during the Bar-stovian and Clarendonian NALMAs, but appears restricted to the Great Plains (Nebraska) during the Hemphillian NALMA. The persistence of Plesiosorex for approximately 15 million years in both the New and Old World suggests a well-adapted insectivore whose upper incisors are unusual compared to those of most insectivores, resembling more closely those of some rodents, but the upper incisors wear to a point and the cheek teeth are typically insectivoran; therefore, the specialized incisors must have been utilized in prey procurement. Insights supporting this hypothesis are provided by newly described crania and dentaries.
Keywords
Plesiosorex, Insectivore, Fossil, Neogene, Specialization
INTRODUCTION
The relatively large, enigmatic fossil insectivore, Plesiosorex, appeared in North America during the early Miocene Hemingfordian North American Land Mam-mal Age (NALMA) and persisted into the late Hemphillian NALMA. R.W. Wil-son (1960) first recognized the immigrant, originally described from Europe, in North America and named Plesiosorex coloradensis from specimens derived from the Martin Canyon, Quarry A Local Fauna in northeastern Colorado. Later, J.E. Martin (1976) recognized the species from the equivalent Batesland Formation in southwestern South Dakota: the Flint Hill North Locality (SDSM locality V811) and the Black Bear Quarry I (SDSM V672). In 1998, Tedrow and Martin
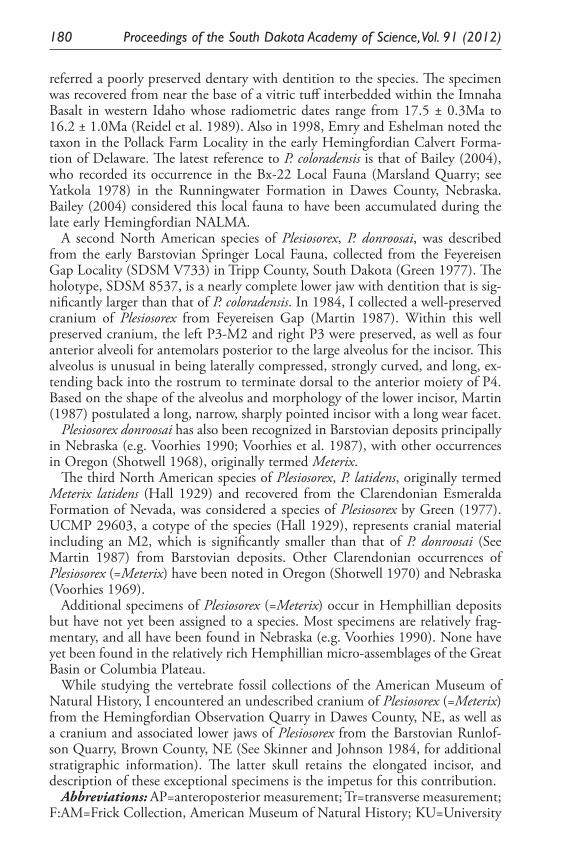
180 Proceedings of the South Dakota Academy of Science, Vol. 91 (2012)
referred a poorly preserved dentary with dentition to the species. The specimen was recovered from near the base of a vitric tuff interbedded within the Imnaha Basalt in western Idaho whose radiometric dates range from 17.5 ± 0.3Ma to 16.2 ± 1.0Ma (Reidel et al. 1989). Also in 1998, Emry and Eshelman noted the taxon in the Pollack Farm Locality in the early Hemingfordian Calvert Forma-tion of Delaware. The latest reference to P. coloradensis is that of Bailey (2004), who recorded its occurrence in the Bx-22 Local Fauna (Marsland Quarry; see Yatkola 1978) in the Runningwater Formation in Dawes County, Nebraska. Bailey (2004) considered this local fauna to have been accumulated during the late early Hemingfordian NALMA.
A second North American species of Plesiosorex, P. donroosai, was described from the early Barstovian Springer Local Fauna, collected from the Feyereisen Gap Locality (SDSM V733) in Tripp County, South Dakota (Green 1977). The holotype, SDSM 8537, is a nearly complete lower jaw with dentition that is sig-nificantly larger than that of P. coloradensis. In 1984, I collected a well-preserved cranium of Plesiosorex from Feyereisen Gap (Martin 1987). Within this well preserved cranium, the left P3-M2 and right P3 were preserved, as well as four anterior alveoli for antemolars posterior to the large alveolus for the incisor. This alveolus is unusual in being laterally compressed, strongly curved, and long, ex-tending back into the rostrum to terminate dorsal to the anterior moiety of P4. Based on the shape of the alveolus and morphology of the lower incisor, Martin (1987) postulated a long, narrow, sharply pointed incisor with a long wear facet.
Plesiosorex donroosai has also been recognized in Barstovian deposits principally in Nebraska (e.g. Voorhies 1990; Voorhies et al. 1987), with other occurrences in Oregon (Shotwell 1968), originally termed Meterix.
The third North American species of Plesiosorex, P. latidens, originally termed Meterix latidens (Hall 1929) and recovered from the Clarendonian Esmeralda Formation of Nevada, was considered a species of Plesiosorex by Green (1977). UCMP 29603, a cotype of the species (Hall 1929), represents cranial material including an M2, which is significantly smaller than that of P. donroosai (See Martin 1987) from Barstovian deposits. Other Clarendonian occurrences of Plesiosorex (=Meterix) have been noted in Oregon (Shotwell 1970) and Nebraska (Voorhies 1969).
Additional specimens of Plesiosorex (=Meterix) occur in Hemphillian deposits but have not yet been assigned to a species. Most specimens are relatively frag-mentary, and all have been found in Nebraska (e.g. Voorhies 1990). None have yet been found in the relatively rich Hemphillian micro-assemblages of the Great Basin or Columbia Plateau.
While studying the vertebrate fossil collections of the American Museum of Natural History, I encountered an undescribed cranium of Plesiosorex (=Meterix) from the Hemingfordian Observation Quarry in Dawes County, NE, as well as a cranium and associated lower jaws of Plesiosorex from the Barstovian Runlof-son Quarry, Brown County, NE (See Skinner and Johnson 1984, for additional stratigraphic information). The latter skull retains the elongated incisor, and description of these exceptional specimens is the impetus for this contribution.
Abbreviations: AP=anteroposterior measurement; Tr=transverse measurement; F:AM=Frick Collection, American Museum of Natural History; KU=University
Proceedings of the South Dakota Academy of Science, Vol. 91 (2012) 181
of Kansas Museum of Natural History; SDSM, Museum of Geology, SD School of Mines; UCMP=University of California, Museum of Paleontology. Tooth abbreviations follow normal terminology, except antemolar is utilized when pre-molar designation is uncertain.
LIPOTYPHLA Haeckel, 1866PLESIOSORICIDAE Winge, 1917
Plesiosorex Pomel, 1848Plesiosorex coloradensis Wilson, 1960
Holotype: KU 9989, left dentary with p4-m1, right dentary with i2, p4 from Martin Canyon Local Fauna, Quarry A, CO.
Referred Comparative Specimens: KU 9990, cranium with right P4-M1, left P3-P4 from Martin Canyon, Quarry A. SDSM 5794, left dentary with p3-m2 from Flint Hill North, V511. F:AM 74903, cranium with left and right P3-P4 from the Observation Quarry, Dawes County, NE.
Description: The cranium of F:AM 74903 is relatively well preserved (Fig-ure 1A-C), but is broken away posteriorly to the alveoli for M1 and anterior to P3. The rostrum is dorsoventrally deep, and complexly folded turbinals can be observed anteriorly (Figure 1B). Posteriorly, the right anterior margin of the braincase flares greatly laterally over the temporal opening, restricting its size dorsoventrally and restricting the size of the orbit. Also from the posterior, the cribiform plate may be observed at the anterior end of the cranial opening and the separation of the braincase from the hard palate at the posterior end. An exceedingly large infraorbital canal lies above the P4 (Figure 1C) and is closed posteriorly by a high, thin bar similar to that described for KU 9990 (Wilson, 1960) but thinner than that of P. donroosai (SDSM 13666, Martin 1987). A foramen lies dorsomedially above the round anterior canal opening (Figure 1C) on F:AM 74903 and KU 9990; another lies within the canal. Unfortunately, the anterior root of the zygomatic is broken away, so it cannot be determined if it was abbreviated like that of P. donroosai (Martin 1987). The palate is dorsally curved, and numerous holes occur where molar roots may have perforated the palate and been enlarged by postmortem deterioration (Figure 1A). Damage also occurs between the P4s, so the palatine foramina noted by Wilson (1960) for KU 9990 cannot be observed, but the lateral margins of the palate do appear pitted.
The preserved dentition of F:AM 74903 (Figure 1D-E) is very similar to that of KU 9990. The P3 is a diminutive version of P4 (Table 1). Both have a very high, pointed paracone, but the metastyle of the P4 is much larger, forming a conspicuous paracone-metastyle blade. Both premolars have small parastyles and large protocones, as well as a broad shelf sloping posteriorly. However, the P4 exhibits a hypocone posterior to the protocone, whereas the posterior shelf slopes directly from the protocone on P3.
Discussion: The orbital area of F:AM 74903 can be observed on the left side for the first time. The lateral expansion of the braincase coupled with the thin bar over the infraorbital canal greatly restricts the size of the orbit. Therefore, sight does not appear to have been a major sense for Plesiosorex coloradensis. Alterna-
182 Proceedings of the South Dakota Academy of Science, Vol. 91 (2012)
Figure 1. F:AM 74903, Plesiosorex coloradensis: A) Cranium, Ventral view; B) Cranium, Anterior view; C) Cranium, Lateral view, anterior to left; arrow indicates infraorbital canal; D) Left P3-P4; E) Right P3-P4. F:AM 74929, Plesiosorex donroosai: F) Right P2; G) Cranium, Ventral view; H) Right upper incisor, Lateral view; I) Upper incisors, Occlusal view.
Proceedings of the South Dakota Academy of Science, Vol. 91 (2012) 183
tively, the very large nasal passages with complex turbinals and the extremely large infraorbital canals indicate smell and tactile sensation at the end of the rostrum were more dominant senses, probably being utilized principally in the detection of prey.
Plesiosorex donroosai Green, 1977
Holotype: SDSM 8537 left dentary with i2, p4-m2 from SDSM locality V733.Referred Comparative Specimens: SDSM 13666, partial anterior cranium
with left P3-M2 and right P3 from SDSM locality V733; F:AM 74929, skull with right and left I, P4-M1, right dentary with p4-m2, left dentary with i1-i2, p1, p4-m2, and isolated right P2 and M3 from eight miles north of Lone Pine, Runlofson Quarry, Brown County, NE.
Description: SDSM 8537 and 13666 have been described by Green (1977) and Martin (1987), respectively. Therefore, this descriptive/comparative section concerns F:AM 74929, whose cranium is poorly preserved (Figure 1G), resulting from dorsoventral crushing, but the upper incisors and dentaries survived well. The palatal area of the cranium is best preserved, and the palate is dorsally con-cave similar to that of P. coloradensis, although crushing and the museum number painted on the palate obscures salient features. Laterally, the excavation above the P4 indicates the large anterior end of the infraorbital canal like that of SDSM 13666 (Martin 1987). Above and opposite the M2, the dorsoventrally deep but thin anterior root of the zygomatic arch flares distinctly laterally but ends in a rounded projection first noted on SDSM 13666 (Martin 1987).
The dentition includes the first known upper incisors of North American Ple-siosorex. These incisors (Figure 1H-I) are strongly curved, laterally compressed, and have a long wear facet similar to those of some rodents. However, they are thinner and more pointed than are those of most rodents, and are not of constant thickness, being slightly thicker medially and thinning to a sharp crest ventrally and dorsally. The right incisor is complete and measures 17.7 mm along the outside curvature and 12.5 mm in diameter from the anterior tip directly to the posterior termination but is only 1.4 mm wide transversely. Anteriorly, both incisors are closely appressed, and, owing to their wear facets (4 mm long), form a sharp point. The facets are formed by wear on the ventral crest and the medially thickened area. Posteriorly, they flare laterally and are housed in the laterally compressed, curved alveoli described for SDSM 13666 (Martin 1987, Figure 1B,C).
The isolated P2 (Figure 1F) is broken and too small to be a P3 (Table 1), rep-resenting the only known second upper premolar of North American Plesiosorex. The premolar is dominated by a high paracone with a short anterior parastyle at its base. The metastyle is a subdued blade that descends posteriorly from the paracone. Lingually, a small protocone lies internal to the parastyle, and a nar-row cingulum slopes posteriorly from the protocone and ends in a long rounded posterior process.
The P4 of F:AM 74929 (Figure 2A) and SDSM 13666 are very similar, with the latter being slightly less worn. As a result, the tips of the cusps of SDSM 13666 are very high and pointed, and even considering wear, are higher and
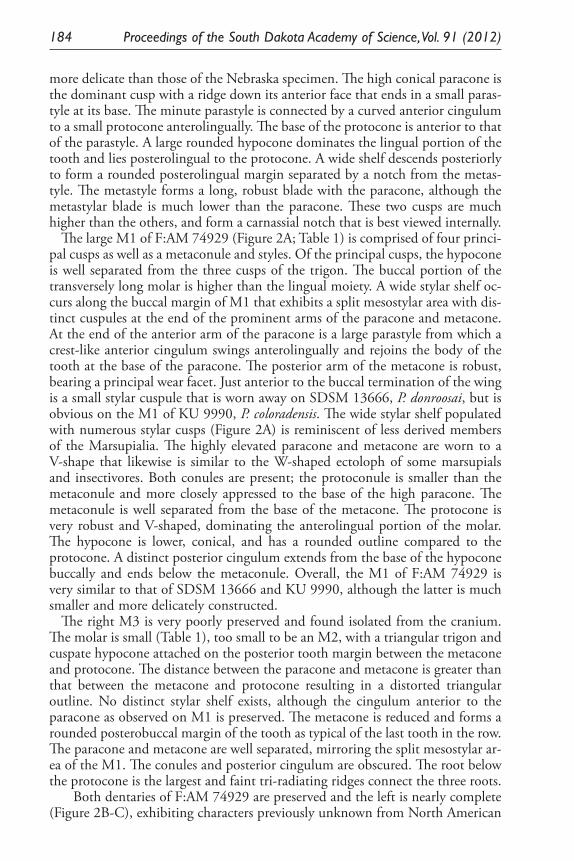
184 Proceedings of the South Dakota Academy of Science, Vol. 91 (2012)
more delicate than those of the Nebraska specimen. The high conical paracone is the dominant cusp with a ridge down its anterior face that ends in a small paras-tyle at its base. The minute parastyle is connected by a curved anterior cingulum to a small protocone anterolingually. The base of the protocone is anterior to that of the parastyle. A large rounded hypocone dominates the lingual portion of the tooth and lies posterolingual to the protocone. A wide shelf descends posteriorly to form a rounded posterolingual margin separated by a notch from the metas-tyle. The metastyle forms a long, robust blade with the paracone, although the metastylar blade is much lower than the paracone. These two cusps are much higher than the others, and form a carnassial notch that is best viewed internally.
The large M1 of F:AM 74929 (Figure 2A; Table 1) is comprised of four princi-pal cusps as well as a metaconule and styles. Of the principal cusps, the hypocone is well separated from the three cusps of the trigon. The buccal portion of the transversely long molar is higher than the lingual moiety. A wide stylar shelf oc-curs along the buccal margin of M1 that exhibits a split mesostylar area with dis-tinct cuspules at the end of the prominent arms of the paracone and metacone. At the end of the anterior arm of the paracone is a large parastyle from which a crest-like anterior cingulum swings anterolingually and rejoins the body of the tooth at the base of the paracone. The posterior arm of the metacone is robust, bearing a principal wear facet. Just anterior to the buccal termination of the wing is a small stylar cuspule that is worn away on SDSM 13666, P. donroosai, but is obvious on the M1 of KU 9990, P. coloradensis. The wide stylar shelf populated with numerous stylar cusps (Figure 2A) is reminiscent of less derived members of the Marsupialia. The highly elevated paracone and metacone are worn to a V-shape that likewise is similar to the W-shaped ectoloph of some marsupials and insectivores. Both conules are present; the protoconule is smaller than the metaconule and more closely appressed to the base of the high paracone. The metaconule is well separated from the base of the metacone. The protocone is very robust and V-shaped, dominating the anterolingual portion of the molar. The hypocone is lower, conical, and has a rounded outline compared to the protocone. A distinct posterior cingulum extends from the base of the hypocone buccally and ends below the metaconule. Overall, the M1 of F:AM 74929 is very similar to that of SDSM 13666 and KU 9990, although the latter is much smaller and more delicately constructed.
The right M3 is very poorly preserved and found isolated from the cranium. The molar is small (Table 1), too small to be an M2, with a triangular trigon and cuspate hypocone attached on the posterior tooth margin between the metacone and protocone. The distance between the paracone and metacone is greater than that between the metacone and protocone resulting in a distorted triangular outline. No distinct stylar shelf exists, although the cingulum anterior to the paracone as observed on M1 is preserved. The metacone is reduced and forms a rounded posterobuccal margin of the tooth as typical of the last tooth in the row. The paracone and metacone are well separated, mirroring the split mesostylar ar-ea of the M1. The conules and posterior cingulum are obscured. The root below the protocone is the largest and faint tri-radiating ridges connect the three roots.
Both dentaries of F:AM 74929 are preserved and the left is nearly complete (Figure 2B-C), exhibiting characters previously unknown from North American
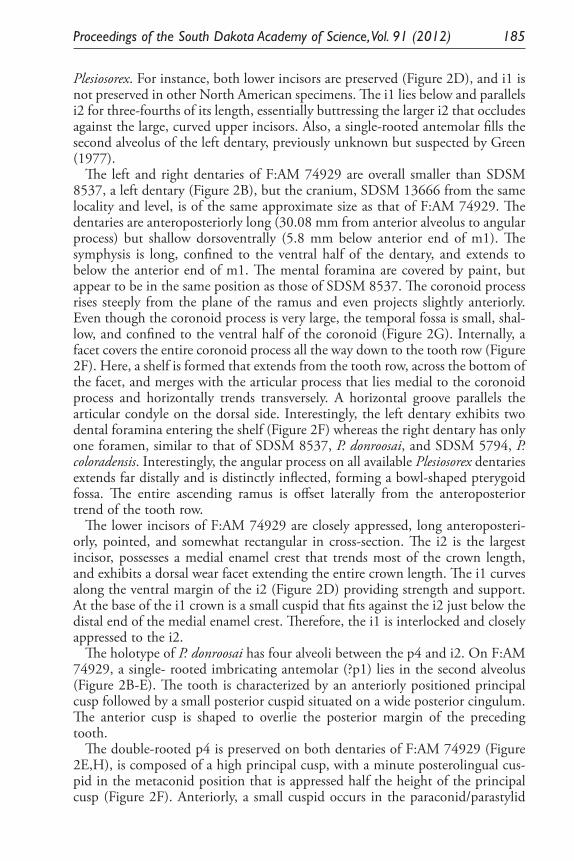
Proceedings of the South Dakota Academy of Science, Vol. 91 (2012) 185
Plesiosorex. For instance, both lower incisors are preserved (Figure 2D), and i1 is not preserved in other North American specimens. The i1 lies below and parallels i2 for three-fourths of its length, essentially buttressing the larger i2 that occludes against the large, curved upper incisors. Also, a single-rooted antemolar fills the second alveolus of the left dentary, previously unknown but suspected by Green (1977).
The left and right dentaries of F:AM 74929 are overall smaller than SDSM 8537, a left dentary (Figure 2B), but the cranium, SDSM 13666 from the same locality and level, is of the same approximate size as that of F:AM 74929. The dentaries are anteroposteriorly long (30.08 mm from anterior alveolus to angular process) but shallow dorsoventrally (5.8 mm below anterior end of m1). The symphysis is long, confined to the ventral half of the dentary, and extends to below the anterior end of m1. The mental foramina are covered by paint, but appear to be in the same position as those of SDSM 8537. The coronoid process rises steeply from the plane of the ramus and even projects slightly anteriorly. Even though the coronoid process is very large, the temporal fossa is small, shal-low, and confined to the ventral half of the coronoid (Figure 2G). Internally, a facet covers the entire coronoid process all the way down to the tooth row (Figure 2F). Here, a shelf is formed that extends from the tooth row, across the bottom of the facet, and merges with the articular process that lies medial to the coronoid process and horizontally trends transversely. A horizontal groove parallels the articular condyle on the dorsal side. Interestingly, the left dentary exhibits two dental foramina entering the shelf (Figure 2F) whereas the right dentary has only one foramen, similar to that of SDSM 8537, P. donroosai, and SDSM 5794, P. coloradensis. Interestingly, the angular process on all available Plesiosorex dentaries extends far distally and is distinctly inflected, forming a bowl-shaped pterygoid fossa. The entire ascending ramus is offset laterally from the anteroposterior trend of the tooth row.
The lower incisors of F:AM 74929 are closely appressed, long anteroposteri-orly, pointed, and somewhat rectangular in cross-section. The i2 is the largest incisor, possesses a medial enamel crest that trends most of the crown length, and exhibits a dorsal wear facet extending the entire crown length. The i1 curves along the ventral margin of the i2 (Figure 2D) providing strength and support. At the base of the i1 crown is a small cuspid that fits against the i2 just below the distal end of the medial enamel crest. Therefore, the i1 is interlocked and closely appressed to the i2.
The holotype of P. donroosai has four alveoli between the p4 and i2. On F:AM 74929, a single- rooted imbricating antemolar (?p1) lies in the second alveolus (Figure 2B-E). The tooth is characterized by an anteriorly positioned principal cusp followed by a small posterior cuspid situated on a wide posterior cingulum. The anterior cusp is shaped to overlie the posterior margin of the preceding tooth.
The double-rooted p4 is preserved on both dentaries of F:AM 74929 (Figure 2E,H), is composed of a high principal cusp, with a minute posterolingual cus-pid in the metaconid position that is appressed half the height of the principal cusp (Figure 2F). Anteriorly, a small cuspid occurs in the paraconid/parastylid
186 Proceedings of the South Dakota Academy of Science, Vol. 91 (2012)
Figure 2. F:AM 74929, Plesiosorex donroosai: A) Right P4-M1; B) Left dentaries, Lateral views, upper specimen, holotype, Plesiosorex donroosai, SDSM 8537, lower specimen, F:AM 74929; C) F:AM 74929, Left dentary, External view, D) Left i1-i2, p1, Internal view; E) Left p1, p4-m2, Internal view, F) Left ascending ramus, Internal view; if=internal facet; G) Left ascending ramus, External view; tf=temporal fossa; H) Left p1, p4-m2, Occlusal view.
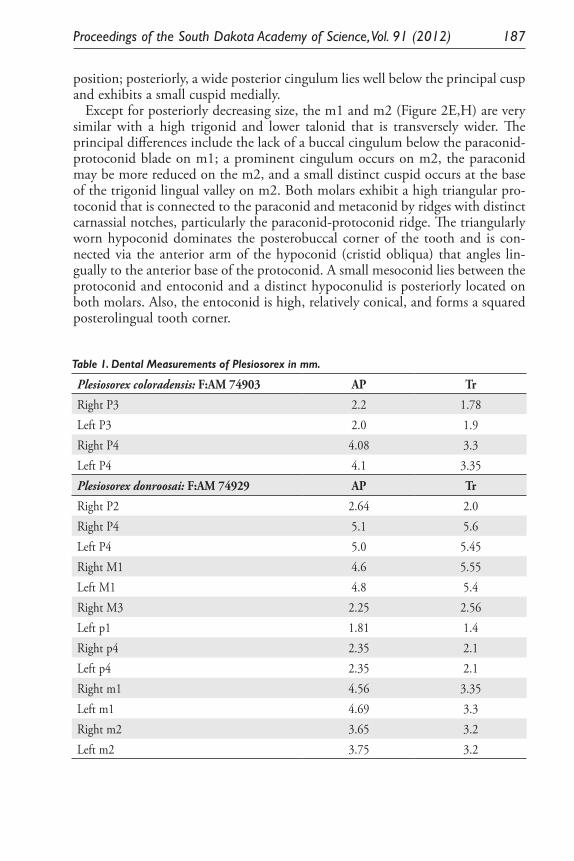
Proceedings of the South Dakota Academy of Science, Vol. 91 (2012) 187
position; posteriorly, a wide posterior cingulum lies well below the principal cusp and exhibits a small cuspid medially.
Except for posteriorly decreasing size, the m1 and m2 (Figure 2E,H) are very similar with a high trigonid and lower talonid that is transversely wider. The principal differences include the lack of a buccal cingulum below the paraconid-protoconid blade on m1; a prominent cingulum occurs on m2, the paraconid may be more reduced on the m2, and a small distinct cuspid occurs at the base of the trigonid lingual valley on m2. Both molars exhibit a high triangular pro-toconid that is connected to the paraconid and metaconid by ridges with distinct carnassial notches, particularly the paraconid-protoconid ridge. The triangularly worn hypoconid dominates the posterobuccal corner of the tooth and is con-nected via the anterior arm of the hypoconid (cristid obliqua) that angles lin-gually to the anterior base of the protoconid. A small mesoconid lies between the protoconid and entoconid and a distinct hypoconulid is posteriorly located on both molars. Also, the entoconid is high, relatively conical, and forms a squared posterolingual tooth corner.
Table 1. Dental Measurements of Plesiosorex in mm.
Plesiosorex coloradensis: F:AM 74903 AP Tr
Right P3 2.2 1.78Left P3 2.0 1.9Right P4 4.08 3.3Left P4 4.1 3.35Plesiosorex donroosai: F:AM 74929 AP Tr
Right P2 2.64 2.0Right P4 5.1 5.6Left P4 5.0 5.45Right M1 4.6 5.55Left M1 4.8 5.4Right M3 2.25 2.56Left p1 1.81 1.4Right p4 2.35 2.1Left p4 2.35 2.1Right m1 4.56 3.35Left m1 4.69 3.3Right m2 3.65 3.2Left m2 3.75 3.2
188 Proceedings of the South Dakota Academy of Science, Vol. 91 (2012)
DISCUSSION
The two Nebraska specimens described herein add to our knowledge of North American species of Plesiosorex. First, some question has concerned the tooth count of the lower dentition (Green 1977). Wilson (1960) indicated that an i3 existed in Plesiosorex, whereas Green (1977) indicated a dental formula of 2,1,4,3. The holotype of Plesiosorex donroosai possesses a double-rooted p4 with four anterior alveoli. The dentary of SDSM 5794 of P. coloradensis has a double-rooted p4 and p3 (Martin 1976), with four alveoli anteriorly, indicating specific difference. The p3 does have an imbricating antemolar morphology. F:AM 74929, P. donroosai, has a single-rooted antemolar in the second alveolus. Because P. donroosai has one less alveolus than P. coloradensis, a likely interpreta-tion is that the p3 is single rooted in the former species and all four alveoli pos-sess single-rooted antemolars. Therefore, p1-p3 are single-rooted in P. donroosai, and the tooth in the second alveolus would be p1. Another single-rooted alveolus lies anteriorly which would correspond to Green’s canine or Wilson’s i3.
The cranium from the Hemingfordian of Nebraska, F:AM 74903, indicates an expanded braincase, with consequent reduction in orbit size and temporal opening. Therefore, visual acuity was not great (a character coupled with abbre-viated zygomatic arches may indicate a fossorial habit, but postcranial elements must be secured for substantiation) and compensation came through other more developed senses. The greatly enlarged infraorbital foramen that is as large as the orbit indicates great tactile sense of the snout. Moreover, the deep, large nasal opening with complex turbinals indicates an enhanced sense of smell. Therefore, olfactory and tactile senses appear to dominate the optic senses. The expanded braincase also impacts the temporal musculature, which is reflected in the small, shallow temporal fossa on the coronoid process. Alternatively, the facet on the medial coronoid face and angular fossa for pterygoid musculature are greatly expanded, indicating pterygoid compensation for temporal musculature. The angular process of the dentary is strongly inflected, distinct upper molar styles, and posteriorly placed hypconulids on lower molars are similar to features found among insectivorous Marsupialia.
F:AM 74929 possesses upper incisors that are laterally compressed, long, strongly curved, and pointed, owing to long occlusal wear facets. These incisors were predicted for P. donroosai by Martin (1987). Moreover, the lower jaw with i1 and i2 indicate that the large i2 was braced ventrally by the i1. The large i2 also exhibits a long wear facet. Moreover, the dentary symphysis is large and extends far posteriorly. Therefore, a great amount of force was exerted between the upper and lower incisors. The long facets resemble those of rodents, and many, particu-larly those with expanded braincases, exhibit enhanced pterygoid musculature. The result of incisor occlusion suggests that the pointed incisors must have been essential for prey acquisition.
Proceedings of the South Dakota Academy of Science, Vol. 91 (2012) 189
ACKNOWLEDGMENTS
I sincerely thank the American Museum of Natural History personnel for al-lowing me to study Nebraska specimens of Plesiosorex; in particular, Ms. Ruth O’Leary kindly provided important contextual information. Drs. R.W. Wilson and Morton Green guided me in earlier studies of the taxon. Dr. Brian Lock, University of Louisiana, Lafayette, kindly allowed use of his equipment for figure preparation. Mr. Matt Weiler, University of North Dakota, undertook preliminary descriptions of the specimens as part of a special studies project. The contribution was greatly enhanced by the reviews of Dr. Allen Kihm, Minot State University, ND, Dr. Gary Johnson, Dallas, TX, and David C. Parris, New Jersey State Museum, and by the critique of Dr. Robert Tatina, editor of these proceedings.
LITERATURE CITED
Bailey, B.E. 2004. Biostratigraphy and biochronology of early Arikareean through late Hemingfordian small mammal faunas from the Nebraska pan-handle and adjacent areas. Paludicola 4:81-113.
Emry, R.J., and R.E. Eshelman. 1998. The Early Hemingfordian (Early Mio-cene) Pollack Farm Local Fauna: first Tertiary land mammals described from Delaware. Delaware Geol. Surv. Spec. Publ. 21:153-173.
Green, M. 1977. A new species of Plesiosorex (Mammalia, Insectivora) from South Dakota. N. Jb. Geol. Palaont. Mh., H.4:189-198.
Hall, E.R. 1929. A second new genus of hedgehog from the Pliocene of Nevada. Univ. Calif. Publ., Bull. Dept. Geol. Sci. 18:227-231.
Martin, J.E. 1976. Small mammals from the Miocene Batesland Formation of South Dakota. Contr. Geol., Univ. Wyoming 14:69-98.
Martin, J.E. 1987. The cranium of Plesiosorex donroosai Green (Insectivora) from the Miocene of South Dakota. IN Martin, J.E. and G.E. Ostrander (eds.) Papers in Vertebrate Paleontology in Honor of Morton Green, Mus. Geol., S.D. School Mines, Dakoterra 3:63-67.
Reidel, S.P., T.L. Tolan, P.R. Hooper, M.H. Beeson, K.R. Fecht, R.D. Bentley and J.L. Anderson. 1989. The Grand Rhonde Basalt, Columbia River Basalt Group: stratigraphic descriptions and correlations in Washington, Oregon, and Idaho. IN Reidel, S.P. and P.R. Hooper (eds.) Volcanism and Tectonism in the Columbia River Flood Basalt Province. Geol. Soc. Amer., Spec. Paper 239:21-54.
Shotwell, J.A. 1968. Miocene mammals of southeast Oregon. Bull. Mus. Nat. Hist., Univ. Oregon 14:1-67.
Shotwell, J.A. 1970. Pliocene mammals of southeast Oregon and adjacent Idaho. Bull. Mus. Nat. Hist., Univ. Oregon 17:1-103.
Skinner, M.F., and F.W. Johnson. 1984. Tertiary stratigraphy and the Frick Col-lection of fossil vertebrates from north-central Nebraska. Bull. Amer. Mus. Nat. Hist. 178(3):215-368.
190 Proceedings of the South Dakota Academy of Science, Vol. 91 (2012)
Tedrow, A.R., and J.E. Martin. 1998. Plesiosorex (Mammalia:Insectivora) from the Miocene Imnaha Basalts of western Idaho: IN Akersten, W.A., et al. (eds.) And Whereas … Papers on the Vertebrate Paleontology of Idaho honoring John A White. Volume 1. Idaho Mus. Nat. Hist., Occas. Paper 36:21-24.
Voorhies, M.R. 1969. Taphonomy and population dynamics of an Early Plio-cene vertebrate fauna, Knox County, Nebraska. Contr. Geol., Univ. Wyo-ming, Spec. Paper 1:1-69.
Voorhies, M.R. 1990. Vertebrate biostratigraphy of the Ogallala Group in Nebraska. IN Gustavson, T.C. (ed.) Geologic framework and regional hy-drology: Upper Cenozoic Blackwater Draw and Ogallala Formation, Great Plains. Bur. Econ. Geol., Univ. Texas pp. 115-151.
Voorhies, M.R., J.A. Holman and X. Xiang-xu. 1987. The Hottell Ranch rhino quarries (basal Ogallala: medial Barstovian), Banner County, Nebraska. Part 1: Geologic setting, faunal lists, lower vertebrates. Contr. Geol., Univ. Wyo-ming 25:55-69.
Wilson, R.W. 1960. Early Miocene rodents and insectivores from northeastern Colorado. Univ. Kansas Paleont. Contr., Vertebrata 7:1-92.
Yatkola, D.A. 1978. Tertiary stratigraphy of the Niobrara River valley, Marsland Quadrangle, western Nebraska. Nebraska Geol. Surv. Paper 19:1-66.

Abstracts of
Senior Research and Symposium
Papers and Posters
presented at
The 97th Annual Meeting
of the
South Dakota Academy of Science


Proceedings of the South Dakota Academy of Science, Vol. 91 (2012) 193
PHOTOVOLTAIC DEVICES AND SYSTEMS
David W. GalipeauDepartment of Electrical Engineering and Computer Science
South Dakota State University Brookings, SD 57007
Corresponding author email: [email protected]
ABSTRACT
This presentation includes a description of solar energy basics, photovoltaic devices and systems, the economics of photovoltaic systems, and a discussion of current research directions. Current research is focused on the development of broadband organic-inorganic solar cells that include novel polymer materials and organic dyes, and nanostructured inorganic thin films fabricated with novel plasma processing.
194 Proceedings of the South Dakota Academy of Science, Vol. 91 (2012)
THE SOUTH DAKOTA CATALYSIS GROUP
James D. Hoefelmeyer1*, Rajesh Shende2, Alevtina Smirnova2, Jan Puszynski2, Hao Fong2, Phil Ahrenkiel2, Ranjit Koodali1,
Grigoriy Sereda1, Dmitri Kilin1, Haoran Sun1, Rick Wang2, and Hongshan He3
1Department of Chemistry University of South Dakota
Vermillion, SD 570692Department of Chemical and Biological Engineering
South Dakota School of Mines and Technology Rapid City, SD 57701
3Department of Electrical Engineering and Computer Science South Dakota State University
Brookings, SD 57007*Corresponding author email: [email protected]
ABSTRACT
The South Dakota Catalysis Group (SDCG) is a collaboration among scien-tists at South Dakota universities, in partnership with the Department of Energy, to conduct research on advanced catalytic materials for solar energy utilization, specifically, hydrogen production and hydrogen fuel cells. The long-term vision of this project is to enable solar energy utilization on large scales in a process that is economically attractive. Requisite to this goal are photocatalyst materials for high-efficiency solar-to-chemical energy conversion, materials for robust fuel cell catalysis, and industrial engineering that produces devices through hierarchical assembly of nanostructures in a rapid and low-cost process. The principle foci of the current SDCG efforts are: 1) the development, through the application of nanotechnology, of a reactor in which a photocatalyst uses sunlight to split water to hydrogen and oxygen, and 2) development of improved supports and catalysts for fuel cells. The two foci represent complimentary approaches to solar energy utilization. The end products of the two research thrusts, photocatalyst and fuel cell, when used in conjunction, allow production of electricity from sunlight, storage of solar energy as chemical fuel, and zero net consumption of resources or production of atmospheric emissions.
Proceedings of the South Dakota Academy of Science, Vol. 91 (2012) 195
THE MAJORANA DEMONSTRATOR: A SEARCH FOR NEUTRINOLESS DOUBLE-BETA DECAY
G. Perumpilly for the Majorana CollaborationDepartment of Physics
University of South DakotaVermillion, SD 57069
Corresponding author email: [email protected]
ABSTRACT
The MAJORANA Collaboration is constructing an ultra-low background ex-periment to search for neutrinoless double-beta decay, located deep underground at the Sanford Underground Research Facility in Lead, SD. This DEMON-STRATOR is array of germanium detectors intended to perform research and development towards a tonne-scale germanium-based experiment. The observa-tion of neutrinoless double-beta decay would determine whether the neutrino is a Majorana particle and provide information on the absolute scale of neutrino mass. The DEMONSTRATOR can also perform a competitive direct dark mat-ter search for light WIMPs. This talk will review its motivation, the principle and status.
196 Proceedings of the South Dakota Academy of Science, Vol. 91 (2012)
IMPACT OF ATMOSPHERE ON HPGE CRYSTAL GROWTH
Guojian Wang*, Gang Yang, Yongchen Sun, Wenchang Xiang, Jayesh R. Govani, Muhammad Khizar, Yutong Guan, and Dongming Mei
Department of Physics University of South Dakota
Vermillion, SD, 57069*Corresponding author email: [email protected]
Abstract
The growth of high-purity germanium crystals for radiation detectors is being developed at the University of South Dakota. High-purity germanium crystals were grown in argon and in hydrogen atmospheres. The growth parameters were compared and analyzed. The relationship between thermal field and crystal qual-ity was discussed. Based on the thermal properties of argon and hydrogen gases, we designed different thermal fields to grow high-purity germanium crystals of lower dislocation density.
This work is supported by DOE grant DE-FG02-10ER46709 and the state of South Dakota.
Proceedings of the South Dakota Academy of Science, Vol. 91 (2012) 197
XRD ANALYSIS OF HIGH-PURITY GERMANIUM SINGLE CRYSTALS GROWN
BY THE CZOCHRALSK METHOD
Gang Yang1, Goujian Wang1, Wenchang Xiang1, Muhamud Khizar1, Yutong Guan1, Yohgchen Sun1,
Dongming Mei1, Jiang Chaoyang2, and Bruce Gray2
1Department of PhysicsUniversity of South Dakota 2Department of ChemistryUniversity of South Dakota
Vermillion, SD 57069Corresponding author’s email: [email protected]
ABSTRACT
A high purity germanium (HPGe) crystal was grown in a hydrogen atmo-sphere by the Czochralsk method. XRD 2θ scanning was used to determine the orientation of the grown crystal. XRD 2θ scanning results show that an extremely strong (400) peak at 2θ of 66.15o was observed in three samples cut from the grown crystal, indicating that the crystals had <100> orientation. How-ever, there is a very weak (200) peak at 2θ of 31.56o for the sample cut from the middle part of the crystal. According to the reflection and extinction law of germanium crystals with face-centered cubic lattice, the reflection of 200 should be forbidden. The presence of (200) peak at 31.56o could have resulted from XRD multiple-beam scattering. Additionally, the ω-scanning technique was used to obtain the rocking curves at the fixed 2θ of 66.15o, which have shown the quality of the crystal.
This work is supported by DOE grant DE-FG02-10ER46709 and the state of South Dakota.

198 Proceedings of the South Dakota Academy of Science, Vol. 91 (2012)
GERMANIUM DETECTOR RESPONSE TO NUCLEAR RECOILS IN SEARCHING FOR DARK MATTER
D. Barker and Dongming Mei*Department of Physics
The University of South Dakota Vermillion SD, 57069
*Corresponding author email: [email protected]
ABSTRACT
The discrepancies in claims from the experiments that are searching for weakly interacting massive particle (WIMP) dark matter necessitate a model for ioniza-tion efficiency at energies below 10 keV. The focus of this work is on the con-struction of a model for the ionization efficiency in germanium by analyzing the components of stopping power, specifically that of nuclear stopping power, at low energies. To determine the validity of the proposed model, we will compare it to previous measurements of ionization efficiency in germanium as well as to those of other theoretical models. The thresholds of both CDMS and CoGeNT will be analyzed and compared in terms of the nuclear recoil energy.

Proceedings of the South Dakota Academy of Science, Vol. 91 (2012) 199
SIGNIFICANCE OF SIMULATION AND MODELING OF GROWTH SYSTEM GEOMETRY
ON THE AUGMENTATION OF HIGH PURITY GERMANIUM (HPGe) CRYSTALS GROWTH RATE
Jayesh Govani*, Dongming Mei, Guojian Wang, and Gang YangPhysics Department
University of South Dakota Vermillion, SD 57069 U.S.A
*Corresponding author e-mail: [email protected]
ABSTRACT
High-purity germanium (HPGe) single crystals are required for the fabrication of radiation detectors. HPGe crystals growth rate and crystal quality depend largely on the control of the thermal field. The control parameters of the thermal field can be regulated only outwardly through the growth system geometry, hy-drogen and argon gas pressure, flow rate, pulling rate, and power and frequency of an RF heater. Computer modeling and simulation of Czochralski growth processes play a vital role in the development of pioneering pulling procedures and augmentation of Ge crystal quality because quantitative determination of the control parameters is extremely challenging and expensive. We performed a detailed modeling and simulation study for diverse crystal positions and various growth system geometries. We also virtually studied the consequences of targeted growth rate on temperature gradient and induction heating. A comparative analysis of simulated and available experimental results is also presented. In the present study we have successfully demonstrated that the simulation and mod-eling help in reducing considerably the number of growth experiments for the enhancement of crystal quality and targeted growth rate.
This work is supported by DOE grant DE-FG02-10ER46709 and the State of South Dakota.
200 Proceedings of the South Dakota Academy of Science, Vol. 91 (2012)
A STUDY OF A RADON GAS SCRUBBER
Xiaoyi Yang*and V. E. Guiseppe, and Dongming MeiDepartment of Physics
University of South Dakota Vermillion, SD 57069
*Corresponding author email: [email protected]
ABSTRACT
Radon gas and its progeny are critical sources of background for low back-ground experimental devices. The required reduction of radon levels in the air of an experimental area can typically be achieved with a radon scrubbing system. For testing purposes, a single column system has been built at USD to study the radon-adsorption properties of activated charcoal under different conditions. In this paper, we will demonstrate the working principle and test results.
This program is supported by DOE grant DE-FG02-10ER46709, NSF PHYS 0919261, and NSF PHYS-0758120
Proceedings of the South Dakota Academy of Science, Vol. 91 (2012) 201
OPTICAL AND ELECTRONIC CONSIDERATIONS FOR THE BHSU
CAVITY RING-DOWN SPECTROSCOPY SYSTEM
G. L. Serfling*, B. J. Mount, Y. Sun, J. D. Thompson, and K. J. KeeterBlack Hills State University
Spearfish, SD 57799*Corresponding author email: [email protected]
ABSTRACT
The DARKSIDE and MAX collaborations are developing instruments that use noble liquids (such as liquid argon and xenon) to detect dark matter particles. Impurities in these noble liquids will decrease the detector’s sensitivity. The BHSU physics group is building a system based on Cavity Ring-down Spectros-copy (CRDS), which will be used at the Sanford Underground Research Facility (SURF) to measure the amount of impurities in the liquids in the DARKSIDE/MAX detectors. Light from an infrared laser is directed into a cavity that is com-prised of two “super-mirrors” (reflectivity is approximately 99.9983%). The light builds up to a preset intensity level and then is diverted and a detection circuit on the far side of the cavity records the amount of time it takes for the light to decay within the cavity. The topics discussed on the poster will include optical properties of the system, design considerations of the cavity, and acquiring and analyzing the optical signal.
This work was funded in part by the South Dakota 2010 Center for Ultra-low Background Experiments at DUSEL (CUBED) and the National Science Foun-dation NSF grant 0903335 and NSF MRI grant 0923557.
202 Proceedings of the South Dakota Academy of Science, Vol. 91 (2012)
ENHANCEMENT OF NIR-TO-VISIBLE UPCONVERSION
BY SILVER-NANOWIRE THIN FILMS
Quoc Anh N Luu, Cuikun Lin, and P. Stanley May*Department of Chemistry
University of South Dakota Vermillion, SD 57069
*Corresponding author email: [email protected]
ABSTRACT
NIR-to-visible upconversion luminescence from lanthanide doped nanopar-ticles has many potential applications in the field of security, biological labels, and solar concentrators. Thus, enhancing the luminescence of upconversion nanoparticles (UCNP) will allow UCNPs to be more efficient and also extend its adoption to other applications, such as display technology. Noble metal nano-structures are well known to enhance the luminescent intensity of fluorophores (i.e., luminescent materials) through the coupling of the fluorophore with the surface plasmon polaritons of the metal nanostructure and through the modifica-tion of the electric field. Understanding the mechanism of upconversion lumi-nescence enhancement from metal nanostructures is an important step toward optimal design and utilization of UCNPs.
NIR-to-visible upconversion luminescence of NaYF4:17% Yb3+, 3% Er3+ up-conversion nanoparticles in a poly(methyl methylacrylate) (PMMA) film was enhanced by an underlying silver-nanowire thin film. Silver-nanowires of 70 nm diameter and 4 µm length were synthesized by a solvothermal method and then spin-coated onto glass slides. A 110 nm thin film of the upconversion matrix was spin-coated onto the silver-nanowire thin film. The resulting samples were characterized by TEM, steady state and time-resolved luminescence. Under 980 nm excitation, the UCNP PMMA/Ag-enhanced film showed much stronger upconversion luminescence than a simple UCNP PMMA film, with a factor of 2-4 times enhancement. The photoluminescence kinetics of the UCNP PMMA/Ag-enhanced and UCNP PMMA films confirm the surface plasmon effects of silver-nanowire thin films on the enhancement of upconversion emission of NaYF4:17% Yb3+, 3% Er3+
Proceedings of the South Dakota Academy of Science, Vol. 91 (2012) 203
PHOTO-UNCAGING OF COUMARIN FROM CINNAMATE COATED CdSe QUANTUM DOTS
Aravind Baride1, David Hawkinson1, |Daniel Engebretson2, and Stanley May1*
1Department of Chemistry2Department of Biomedical Engineering
University of South Dakota Vermillion, SD-57069
*Corresponding author email: [email protected]
ABSTRACT
A photodynamic drug delivery model was built that consists of CdSe quantum dots (QD) functionalized with cinnamate ligands. The cinnamate, upon UV light exposure, undergoes E-Z isomerization followed by ring closure to form coumarin. Similar uncaging of coumarin was demonstrated by photo excita-tion of cinnamate coated CdSe QDs at energy much lower than the absorbance window of cinnamate (> 440 nm). The single photon visible light (532 nm) or two-photon NIR light (1064 nm) excitation of QDs resulted in charge transfer from the QDs to the cinnamate and thereby facilitates the radical ion induced E-Z isomerization and uncaging of coumarin. The release of coumarin was char-acterized by absorbance and luminescence spectroscopy. Luminescent coumarin showed an increase in the emission intensity during photo exposure. The electron transfer mechanism was confirmed using the cinnamate functionalized core-shell CdSe QDs. The shell present on QDs blocked the charge-transfer process. Our experimental model helps to understand the photo-uncaging process using quan-tum dots and to design near infrared light induced drug delivery models for a targeted drug delivery system.

204 Proceedings of the South Dakota Academy of Science, Vol. 91 (2012)
SOUTH DAKOTA WIND ENERGY: PHYSICS, LOGISTICS AND CHALLENGES
Jeff RudEast River Power Electric Cooperative, Inc.
Madison, SD 57042Corresponding author email: [email protected]
ABSTRACT
This presentation will provide an overview of South Dakota’s wind industry and how South Dakota ranks nationally in wind energy. It will highlight some of the physics involved in converting wind to electrical energy and also review how the wind industry technology is evolving. A number of challenges facing wind energy will be identified, including the underlying economics of wind as compared to other generation resources, as well as the need for transmission expansion. Finally, the presentation will provide photos of a recent major wind project in South Dakota and demonstrate some of the logistics involved in build-ing wind turbines that are almost 400 feet high and weigh hundreds of tons.
Proceedings of the South Dakota Academy of Science, Vol. 91 (2012) 205
REVIEW OF ANNUAL TRENDS OF ATMOSPHERIC THERMAL INVERSIONS IN SOUTH DAKOTA
UTILIZING NWS RADIOSONDE AND WRAN DATA
Patrick R. EalyDepartment of Atmospheric and Environmental Sciences
South Dakota School of Mines and TechnologyRapid City, SD 57701
Corresponding author email: [email protected]
ABSTRACT
Utilizing a combination of National Weather Service (NWS) radiosonde mea-surements and data collected through the Wind Research Assessment Network (WRAN), I present a review of atmospheric thermal inversions in Rapid City and Aberdeen, SD, between August 1, 2011 and March 31, 2012. Inversions were quantified by frequency (number of days with inversions), height (altitude above ground level of the maximum temperature layer) and intensity (rate of temperature change with height). At both locations, inversion intensity and frequency are greatest in those winter months characterized by longer nights and steeper gradients between the ground surface temperature and the temperature at the top of the boundary layer. However, inversion heights are generally highest in summer and fall months.
The present work is focused on understanding the differences in data inter-pretation from NWS soundings verses WRAN data. Discrepancies between the intensity of inversions reported by the WRAN and the NWS radiosondes sug-gest a greater amount of error than has been previously assessed when evaluating the ability of radiosondes to accurately represent inversion properties. Analyzing WRAN data suggests that the occurrence and intensity of the inversions happen-ing in Rapid City and Aberdeen, SD, is much higher than previously thought based on NWS radiosonde analysis alone.

206 Proceedings of the South Dakota Academy of Science, Vol. 91 (2012)
THE FLEXURAL RESPONSE OF AN 80 FT WIND TURBINE SUBJECTED TO WIND LOADS
S. Herrod and D. Fick*Civil and Environmental Engineering Department
South Dakota School of Mines and TechnologyRapid City, SD 57701
*Corresponding author email: [email protected]
ABSTRACT
The purpose of this research was to examine the flexural response of an 80 foot wind turbine, located at the Renewable Energy Research Facility on the campus of South Dakota School of Mines and Technology (SDSMT). Five strain gauges were installed at the same height around the base of the turbine tower. The gauges were located in a criss-cross pattern to allow for maximum strain measure-ments when winds are from the northwest, northeast, southwest and southeast directions. Strain data were collected during 30 mph wind speed events and were used to determine the bending stresses at the base of the turbine tower. These bending stresses were used to calculate the magnitudes of forces acting on the wind turbine components. Design approaches for applying loads to wind turbine structures were investigated to determine a simplified procedure for obtaining bending stresses at the base of the tower. Results have shown that for a wind speed of 30 mph, a 5 psf distributed load applied over 75% of the wind turbine cross-sectional area closely approximates the measured bending strains. A com-parison of the effective area percentage for other wind speeds is also presented.
Proceedings of the South Dakota Academy of Science, Vol. 91 (2012) 207
WIND VELOCITY INVESTIGATION AT OGLALA LAKOTA COLLEGE.PHASE I: INSTRUMENTATION
AND DATA ACQUISITION ASSESSMENT
L. Richards1 and D. Fick2*1Math and Science Department
Oglala Lakota College Kyle, SD 57752
2Civil and Environmental Engineering DepartmentSouth Dakota School of Mines
Rapid City, SD 57701*Corresponding author email: [email protected]
Abstract
A 50 meter meteorological tower was installed at Oglala Lakota College cam-pus in 2004 for a 13 month wind energy assessment. Data were collected during the 13 months and used to price out a 225 kW turbine. The tower was unused and has received no maintenance to the present day.
Phase I of this research project included assessing the condition and func-tionality of all instruments and how they contribute to collecting accurate wind energy data. An anemometer was used for wind speed data, wind vanes collected wind direction, a barometer collected air pressure, and pyranometer collected solar radiation data. Sample data were collected using a Nomad 2 data logger. Data collected from 2004 – 2007 show that average wind speeds were largest in March and November and smallest in January, May, and July.
Phase II of this research project will include replacing the 3 anemometers that were found to be inoperative in Phase I. This will bring the tower back to work-ing conditions and will allow us to continue gathering wind data at shorter time intervals than in the previous study. These shorter time intervals will provide information on daily wind fluctuations and will include assessing different wind turbine structures that are compatible with future green housing projects and technology.
208 Proceedings of the South Dakota Academy of Science, Vol. 91 (2012)
INTEGRATED PHOTOCATALYTIC AND MICROBIAL DEGRADATION OF KRAFT LIGNIN
TO FORM VALUE ADDED CHEMICALS
A. Shende*, D. Harder-Heinz, and R. ShendeChemical and Biological Engineering
South Dakota School of Mines and Technology Rapid City, South Dakota 57701
*Corresponding author: [email protected]
ABSTRACT
Kraft lignin (KL), a waste product of paper and pulp industry, is recalcitrant to chemical and biochemical degradation. However, its complex polyphenolic substructure could serve as a renewable source of valuable aromatic compounds and their derivatives. In our attempt to overcome KL recalcitrance, we coupled photoreforming of KL with microbial degradation. It was observed that titania mediated photocatalytic pretreatment of KL induces depolymerization of the KL chains and cleavage of aromatic rings to form products amenable to microbial degradation. Soil collected from underneath decaying wooden logs lying dor-mant at 4950 feet level was inoculated into minimal media containing either photocatalytically treated or untreated KL as the sole source of carbon. A KL degrading, Gram negative anaerobic diplococcus was isolated from the enrich-ment culture. The growth curve and biochemical characteristics of this bacterial species were studied in detail. Kraft lignin degradation products were analyzed by gas chromatography. Results on characterization of the KL degrading microbe and the KL degradation products will be presented.
Proceedings of the South Dakota Academy of Science, Vol. 91 (2012) 209
SYNERGISTIC HYDROGEN PRODUCTION FROM WATER-SPLITTING AND AQUEOUS
PHASE BIOMASS REFORMING
V. Buddineni, A. Shende, E. Sellers, and R. Shende*Chemical and Biological Engineering
South Dakota School of Mines and Technology Rapid City, South Dakota 57701
*Corresponding author: [email protected]
ABSTRACT
Nanoparticles and nanotube arrays of photocatalytic materials are of great interest to investigators of hydrogen generation from water-splitting reaction. In this approach, however, the recombination reactions that occur between excitons often limit the hydrogen yield. To minimize the recombination reactions and to achieve synergistic hydrogen production from water and a sacrificial agent such as some biomass, we present a unique approach in which a nanostructured pho-tocatalytic material was contacted with an aqueous sugar solution in the presence of potassium iodide. Catalytic materials such as TiO2, NiFe2O4 and combinations of TiO2/NiFe2O4 nanoparticles were synthesized by sol-gel approach and sputter coated with platinum. In addition, 1D TiO2 nanotube arrays were prepared using an electrochemical anodization method and platinized. These catalytic materials were characterized by X-ray diffraction, scanning and transmission electron mi-croscopy and BET surface area analyzer. About 6.0 ml aqueous biomass solutions containing different sugars such as glucose, arabinose, sucrose, mannose and galactose and potassium iodide were placed in a quartz reactor in contact with a photocatalyst. The solution was irradiated with 100 mW/cm2 light intensity from a solar simulator fitted with AM1.5G. The photoreactor head space gas was sampled and analyzed for H2 and CO2 using gas chromatography. In a separate set of experiments, synthesized photocatalytic materials were also utilized to in-vestigate H2 and hydrocarbon generation from the aqueous slurry obtained from thermochemical processing of cellulose. The results obtained from the synthesis of photocatalytic materials and the effectiveness of nanoparticles and nanotube arrays on synergistic H2 generation from water-splitting and biomass reforming will be presented.
210 Proceedings of the South Dakota Academy of Science, Vol. 91 (2012)
SYNTHESIS OF 1-BUTYL-3-METHYLIMIZADOLIUM
DERIVATIVES
Austin R. Letcher, Mathew E. Amundson, Duane E. Weisshaar*, and Gary W. Earl
Department of ChemistryAugustana College
Sioux Falls, SD 57197*Corresponding author email: [email protected]
ABSTRACT
Prompted by a request from a colleague, we sought to develop a reliable method of quaternizing butylimidazole using dimethyl carbonate (DMC) and converting the resulting methylcarbonate salt to the citrate. Butylimidazole was reacted with DMC at 130 oC in a pressure reactor for 20 hours. The reaction mixture was slowly added to enough citric acid to produce an equal mixture of the bis and tris product. The new mixture was maintained at 40 °C for 2 hours with continuous N2 sparging to remove CO2. The product was isolated by roto-evaporation at 100 °C. NMR and cation HPLC showed quaternization produced a mixture of 1-butyl-3-methylimidazolium methylcarbonate and the 2- or 4-carboxylate zwitterions. The citric acid reaction converted all products to the desired 1-butyl-3-methylimidazolium citrate. Integration of proton NMR spectra indicated the product was essentially the bis-citrate.
Proceedings of the South Dakota Academy of Science, Vol. 91 (2012) 211
HPLC METHOD TO MONITOR METHYLCARBONATE/ACID REACTION PROGRESS
Erika E. Arens, Sarah J. M. Jamison, Duane E. Weisshaar*, and Gary W. Earl
Department of ChemistryAugustana College
Sioux Falls, South Dakota 57197*Corresponding Author Email: [email protected]
ABSTRACT
Methylcarbonate quaternary ammonium compounds are produced by a green reaction and that anion is cleanly exchanged by reacting methylcarbonate with an acid. In aqueous solution, methylcarbonate is converted to bicarbonate which reacts similarly with acids. An anion-exchange HPLC method employing indirect detection was developed to separate methylcarbonate/bicarbonate from exchanged anions to follow the exchange reaction. Two unidentified interfering peaks were observed when 0.5 mM sodium naphthalene disulfonate (NDS) in 20% methanol/water was used as the mobile phase. The pH of the mobile phase was increased to avoid the interference, but the pH was difficult to reproduce and did not circumvent the interference. The interfering peaks disappeared when the NDS concentration was lowered to 0.25 mM. Samples dissolved in methanol produced a split peak for bicarbonate. A bicarbonate calibration curve was linear for 25 to 750 µM.
212 Proceedings of the South Dakota Academy of Science, Vol. 91 (2012)
USE OF COUPLED RATE EQUATIONS TO MODEL NIR-TO VISIBLE UPCONVERSION KINETICS IN
ER3+, YB3+: NAYF4 NANOCRYSTALS
Ge Yao*1, Robert B. Anderson2, QuocAnh N. Luu1, Steve Smith2, Mary T. Berry1, and P. Stanley May1
1Department of ChemistryUniversity of South Dakota
Vermillion, SD 57069 2Nanoscience and Nanoengineering Program
South Dakota School of Mines and TechnologyRapid City, SD 57701
*Corresponding author email: [email protected]
ABSTRACT
Previously, our laboratory had been successful in the syntheses of Er3+, Yb3+:NaYF4, nanocrystals. Currently we are focusing on using coupled rate equa-tions to model NIR-to-visible upconversion (UC) kinetics in Er3+, Yb3+: NaYF4 nanocrystals. The results of this model were compared with the experimental results. Spectroscopic characterization done by our research group provides the data with which to study the kinetics of UC processes. The data include the time evolution of green, red, 1.0 µm, and 1.5 µm emission following pulsed excita-tion, and the relative intensity ratios of green, red, 1.0 µm, and 1.5 µm emission as a function of excitation power. The curve-fitting routine of the simulative model was optimized using a Nelder-Meade simplex search method, in which the parameters were chosen to minimize the sum of the squares of the differ-ences between measured intensity values (normalized) and the population values predicted by the model.
Proceedings of the South Dakota Academy of Science, Vol. 91 (2012) 213
SUBCRITICAL AQUEOUS PHASE CATALYTIC LIQUEFACTION OF PINE WOOD FOR THE
PRODUCTION OF GASEOUS AND LIQUID FUELS
R. Tungal, A. Finley, and R. V. Shende*Department of Chemical and Biological Engineering
South Dakota School of Mines & Technology Rapid City, SD 57701
*Corresponding author: [email protected]
ABSTRACT
Subcritical water for the liquefaction of lignocellulosic biomass is receiving greater attention for the production of H2 and hydrocarbon fuels. In this study subcritical aqueous phase liquefaction of pine wood was investigated in the pres-ence of homogeneous catalysts such as Ni and Cu salt. During liquefaction the gases produced were collected and analyzed. In addition, the catalytic materials, such as metal supported mesoporous metal oxide/zeolite, were synthesized us-ing wet-impregnation, solid state and sol-gel synthesis approaches. The product slurry obtained after liquefaction of pine wood was treated with these metal supported metal oxide/zeolite catalytic materials for biodiesel production. In the case of the sol-gel approach, Ni-salt was dispersed in an ethanol/water solution containing surfactants such as Brij-76/pluronic 123, and gelation was achieved using propylene oxide. This material was aged, dried, calcined at 400-600oC and immobilized with Ni by a wet-incipient method followed by reduction in an H2 environment. The zeolite powder was impregnated with Ni/Cu salt solu-tion and reduced with H2 to form the metal supported zeolite catalyst. A solid state synthesis was also undertaken to prepare NiO nanoparticles. The catalytic materials were characterized using X-ray diffraction, FTIR, SEM, and TEM. The processed slurry obtained was analyzed by TOC analyzer, GC-MS and HPLC. The results obtained on subcritical aqueous phase liquefaction of pine wood and production of gaseous and liquid fuels will be presented.
214 Proceedings of the South Dakota Academy of Science, Vol. 91 (2012)
MOLECULARLY IMPRINTED POLYMERS FOR DOPAMINE RECOGNITION
Alexander Goffeney and George Mwangi*University of Sioux FallsSioux Falls, SD 57105
*Corresponding author email: [email protected]
ABSTRACT
Molecularly imprinted polymers designed for selective binding and specific recognition of dopamine were prepared by dispersion polymerization. The bind-ing properties of dopamine for imprinted polymers were evaluated through equilibrium binding studies. Out of the monomers tested, methacrylic acid demonstrated the highest level of rebinding, with a ratio of 3.0 mmol of func-tional monomer to 7.0 mmol of cross-linker, to 1.0 mmol of the template. This was nearly three times more dopamine being extracted from the system, when compared to itaconic acid. Analog studies were performed with dopamine im-printed polymers that were synthesized with itaconic acid functional monomer and TRIM cross-linker. Isoproterenol, epinephrine, and norepinephrine showed less rebinding than the template molecule in all the tests. Norepinephrine did not appear to have a binding affinity with itaconic polymers.

Proceedings of the South Dakota Academy of Science, Vol. 91 (2012) 215
SOLAR THERMOCHEMICAL H2 PRODUCTION VIA WATER-SPLITTING REACTION
R. R. Bhosale, S. S. Yelakanti, X. Pasala, J. A. Puszynski, and R. V. Shende*Chemical and Biological Engineering Department
South Dakota School of Mines and TechnologyRapid City, SD 57701
*Corresponding author: [email protected]
ABSTRACT
H2 has emerged as an attractive cleaner and sustainable fuel and considered as the most promising future energy carrier. Harnessing solar radiation and its ef-fective conversion to an H2 energy carrier from an abundant source such as water will be extremely beneficial. One of the green ways of producing H2 is by a ther-mochemical water-splitting reaction, which utilizes redox materials (e.g. ferrites) for the H2 generation. This process constitutes a two-step approach. In the first step the ferrite material reacts with water and produces H2 at lower temperatures (exothermic reaction) and in the second step the reacted ferrite material is regen-erated at higher temperatures (endothermic reaction). This investigation reports the synthesis of several ferrite materials with nanoparticle porous morphology using a sol-gel technique and their characterization using powdered x-ray diffrac-tion, BET specific surface area analyzer, and scanning and transmission electron microscopy. The H2 generation ability of these synthesized ferrites was examined by performing multiple thermochemical cycles using a high temperature ther-mochemical water-splitting tubular reactor set-up at various experimental condi-tions. The synthesis of ferrites using the sol-gel method, characterization of the sol-gel derived ferrites, and the transient H2 generation profiles obtained during multiple thermochemical cycles will be presented in detail.
216 Proceedings of the South Dakota Academy of Science, Vol. 91 (2012)
ANALYSIS OF ESSENTIAL AND HEAVY METALS IN HONEY BY ATOMIC ABSORPTION SPECTROSCOPY
Daniel Kohler and George Mwangi*University of Sioux FallsSioux Falls, SD 57105
*Corresponding author email: [email protected]
ABSTRACT
Honey is one of the most important human foods. It has medicinal, nutritive and disease preventive capabilities due to its chemical composition. It is therefore desirable to perform the analysis of honey to ensure that it is free of pollutants such as heavy metals. In this study the trace metals in honey samples collected from Kenyan markets were determined by atomic absorption spectroscopy after acid digestion. The contents of trace metals in honey samples were found to be in the range of 1.0~2.14 µg/g, 0.25~2.37 µg/g, 0 ~0.06 µg/g, and 0 ~1.2 µg/kg for Fe, Cu, Pb and Cd, respectively.
Proceedings of the South Dakota Academy of Science, Vol. 91 (2012) 217
EXPLORATION OF FRUCTOSE 1, 6-BISPHOSPHATE ADOLASE AS A POTENTIAL DRUG TARGET FOR METHICILLIN RESISTANT
STAPHYLOCOCCUS AUREUS INFECTION
Emily Girard, Nichole Haag and Chun Wu*Mount Marty CollegeYankton, SD 57078
*Corresponding author email: [email protected]
ABSTRACT
Methicillin resistant Staphylococcus aureus (MRSA) are antibiotic resistant strains of bacteria which cause life-threatening infections in immunocompro-mised patients. Through our previously reported in silico approach, a class of potential drug targets essential to the survival of MRSA and absent in the human genome were identified, among which putative fructose 1, 6 bisphosphate aldol-ase (FBPA) was investigated. The gene encoding FBPA was cloned into plasmid pRSET A. The recombinant plasmid was transformed into competent E. coli. DH5a then expressed in E. coli BL21(DE3)pLysS. Western blot confirmed the presence of his-tagged FPBA in IPTG induced whole cells and cell lysate, which is contradictory to the incompetence of 6×His/Ni-NTA system to purify the protein. Conventional ionic exchange chromatography and size exclusion chro-matography were employed consecutively. MS analysis revealed that the purified protein was glyceraldehydes 3-phosphate dehydrogenase (G3PD) from E. coli, as opposed to MRSA FBPA, which may be imputed to the preferential interaction between FBPA and glyceraldehyde-3-phosphate dehydrogenase in a mixture of cytosolic proteins. Future work includes MS detection of MRSA FBPA in cell lysates and development of an alternative purification system to separate FBPA from the FBPA-G3PD mixture.
218 Proceedings of the South Dakota Academy of Science, Vol. 91 (2012)
CLONING, PURIFICATION AND CHARACTERIZATION OF ACETATE KINASE
FROM METHICILLIN RESISTANT STAPHYLOCOCCUS AUREUS Mu50 STRAIN
Tyler McCune and Chun Wu*Mount Marty CollegeYankton, SD 57078
*Corresponding author email: [email protected]
ABSTRACT
Methicillin Resistant Staphylococcus aureus (MRSA) refers to the various strains of the gram-positive, coccal bacteria that are resistant to one or multiple antibiotics. Our previous study revealed that the development of a new class of antibiotics targeting bacterial central metabolism to combat MRSA and its ever-increasing list of resistances is promising. MRSA acetate kinase was one of such targets due to its involvement in central metabolism, its in silico essentiality to the survival of MRSA, and its absence in humans. In this study, the gene encod-ing MRSA acetate kinase (sav1711) was PCR amplified, ligated into pRSET plasmid A and transformed into E. coli Dh5a; DNA sequencing confirmed 100 % fidelity. The recombinant plasmid was transformed into E. coli BL21(DE3)pLysS for IPTG induced overexpression. The protein was purified by Ni-NTA system (Qiagen). MALDI-MS analysis and kinetic assay confirmed its acetate ki-nase nature. Future work includes validation of the essentiality of MRSA acetate kinase, crystal structure development of both the apo acetate kinase and acetate kinase-adenosine 5-[γ-thio]triphosphate complex, and the rational inhibitor design.
Proceedings of the South Dakota Academy of Science, Vol. 91 (2012) 219
PLASMA METABOLITES SUGGEST SIMILAR STOPOVER HABITAT QUALITY
FOR RIPARIAN CORRIDOR WOODLANDS AND ANTHROPOGENIC WOODLOTS IN
THE NORTHERN PRAIRIE REGION
Ming Liu* and David SwansonDepartment of Biology
University of South DakotaVermillion SD 57069
*Corresponding author email: [email protected]
ABSTRACT
Riparian corridor woodlands (hereafter corridors) are the principal historical woodland habitat in the Northern Prairie region, but have been greatly reduced and degraded since Euro-American settlement. Simultaneously, anthropogenic woodlots (hereafter woodlots) have appeared. Landbird migrants use both types of habitats for stopover, but the relative quality of these two types of stopover habitat for migrating landbirds is unknown. We assessed relative habitat quality by comparing plasma triglycerides, ß-hydroxybutyrate, and glycerol in migrating birds. We compared plasma metabolites for individual species and for foraging guilds with sample sizes >12 individuals in each habitat type and hypothesized that higher levels of triglycerides and lower levels of ß-hydroxybutyrate and glyc-erol would occur in migrants from high quality stopover sites. We used ANOVA to compare body masses (Mb) and ANCOVA (controlling for year, date, time of day, and body size) to test for differences in plasma metabolite levels between habitat types. The only significant difference between habitats for Mb occurred for fall Yellow-rumped Warblers (Setophaga coronata), where Mb was greater in corridors than in woodlots (P < 0.001). For plasma metabolites, the only signifi-cant between-habitat differences occurred for plasma triglycerides of fall warblers (higher in corridors; P = 0.04), and for plasma glycerol of fall vireos (lower in corridor; P = 0.048) and Nashville Warblers (Oreothlypis ruficapilla) (lower in corridor; P = 0.02). The few significant differences and absence of a consistent direction of variation in Mb and plasma metabolites between corridors and woodlots suggest similar stopover habitat quality in these two woodland habitat types. Thus anthropogenic woodlots can, at least partially, substitute as stopover habitat for lost and degraded native riparian habitats for landbird migrants dur-ing migration through the Northern Prairie Region.
220 Proceedings of the South Dakota Academy of Science, Vol. 91 (2012)
SHORT-TERM CAPTIVITY EFFECTS ON MAXIMAL COLD-INDUCED METABOLIC
RATES AND THEIR REPEATABILITY IN AMERICAN GOLDFINCHES (CARDUELIS TRISTIS)
D. L. Swanson* and M. O. KingDepartment of Biology
University of South DakotaVermillion, SD 57069
*Corresponding author email: [email protected]
ABSTRACT
Studies of metabolic variation in birds have involved both wild and captive individuals, but few studies have investigated whether captivity directly influ-ences metabolic rates, despite such variation potentially confounding conclu-sions regarding how metabolic rates respond to the conditions under study. Metabolic rates in birds are generally considered to have genetic underpinnings and, therefore, are thought to confer fitness consequences that are subject to natural selection, but again, few studies have addressed whether metabolic rates are repeatable traits among individual birds, which is a necessary requirement for the action of natural selection. The few bird studies conducted to date sug-gest that basal (BMR) and maximal cold-induced (summit metabolism, Msum) metabolic rates are generally repeatable over the short-term (days to weeks), but longer-term repeatability (months to years) is lower. In this study, we measured Msum in summer acclimatized American goldfinches (Spinus tristis) directly after capture from wild populations and after two weeks of indoor captivity at 23 °C and a photoperiod of 12L:12D. Msum at capture averaged (± SD) 4.179 ± 0.463 ml O2 min-1 (n = 22), which is similar to previous values for summer-acclimatized goldfinches. After two weeks of captivity, Msum increased significantly (16.9%; P < 0.001) in the same individuals to 4.886 ± 0.530 ml O2 min-1 (n = 22). Body mass also increased significantly (9.2%; P < 0.001) during captivity, suggest-ing that muscle growth and/or remodeling of body composition produced the observed metabolic variation. Mass-independent residuals from log Msum vs. log mass regressions at capture and after captivity were not correlated, indicating that individuals with high metabolic rates at capture were not necessarily the same individuals with high metabolic rates after the captive period. These data suggest that metabolic repeatability may disappear after acclimation to conditions pro-moting phenotypically flexible metabolic responses. These results bring up the interesting possibility that the capacity for phenotypic flexibility varies among individual birds, and such variation could also have fitness consequences.
Proceedings of the South Dakota Academy of Science, Vol. 91 (2012) 221
ACTIVATION OF THE IMMUNE SYSTEMS INCURS ENERGETIC COSTS BUT NO THERMOGENIC TRADEOFFS IN HOUSE SPARROWS (PASSER
DOMESTICUS) UNDERGOING COLD STRESS
Marisa O. King* and David L. SwansonDepartment of Biology
University of South Dakota Vermillion, SD 57069
*Corresponding author email: [email protected]
ABSTRACT
Trade-offs between the immune system and other condition dependent life-history traits (reproduction, predator avoidance, and somatic growth) have been well documented in both avian and mammalian studies. However, to best of our knowledge, no work has been done examining trade-offs between immune activation and thermoregulation during cold exposure. Because of their high surface area-to-volume ratios, small birds incur high energetic costs associated with thermoregulation during cold exposure. Consequently, we predicted that the immune system and the thermoregulatory system would compete for ener-getic resources. To test this, we immunologically challenged adult House Spar-rows (Passer domesticus) with 5 mg/kg of lipopolysaccharide (LPS) to induce an acute phase response (APR) and measured both the basal metabolic rate (BMR = Minimum metabolic rate required for maintenance; measured as the meta-bolic rate at thermoneutrality in resting, postabsorptive, nongrowing birds in the resting phase of the daily cycle) and summit metabolic rate (MSUM = maximal metabolic rate achieved during cold exposure). We found that birds injected with LPS had significantly higher BMR and MSUM rates than birds injected with phosphate buffered saline (PBS), indicating that LPS treated birds were able to support both the cost of immune activation and that of thermoregulation. These results suggest that, in the absence of a pathogen, birds that experience short-term activation of the immune system have higher energetic costs during cold exposure, but they do not experience trade-offs between immune activation and cold tolerance performance.
222 Proceedings of the South Dakota Academy of Science, Vol. 91 (2012)
METABOLIC RATES IN SWALLOWS: DO ENERGETICALLY EXPENSIVE LIFESTYLES AFFECT METABOLIC CAPACITIES IN BIRDS?
Yufeng Zhang and David Swanson*Department of Biology
University of South DakotaVermillion, SD 57069
*Corresponding author email: [email protected]
ABSTRACT
Because both summit (Msum = maximum thermoregulatory metabolic rate) and maximum (MMR = maximum exercise metabolic rate) metabolic rates are functions of skeletal muscle metabolism, correlations between these measures of maximal metabolic output could occur, but this has been little studied in birds. Moreover, because energetically expensive lifestyles are often correlated with high metabolic rates, cross-training effects of a high-energy lifestyle (i.e., high exer-cise) on thermogenesis, and vice versa, may exist. We tested this cross-training hypothesis with swallows, a family with an energetically expensive aerial insec-tivore lifestyle. We measured basal and summit metabolic rates in three species of temperate-zone breeding swallows and combined these data with literature data to address the hypothesis that swallows have higher BMR and Msum than non-aerial insectivore birds. BMR for temperate-zone swallows was higher than for tropical swallows, similar to results for other bird taxa. In addition, our pre-liminary data suggest that BMR in swallows shows a tendency to be higher than BMR for other birds. In contrast, Msum values in the six species of swallows that we measured were consistent with Msum values for other swallow species, includ-ing tropical species, and the Msum-body mass regression for swallows was almost coincident with the Msum-body mass regression for other birds. These data tenta-tively suggest that swallow Msum is similar to that for other birds, so cross-training effects of an energetically expensive lifestyle on thermogenesis are not apparent.
Proceedings of the South Dakota Academy of Science, Vol. 91 (2012) 223
VENOM PROTEOMICS OF THE PRAIRIE RATTLESNAKE, CROTALUS VIRIDIS
Mallory Ageton1, Brian Smith1*, Eduardo Callegari2, Stephen Mackessy3, and Jason Nies4
1Biology DepartmentBlack Hills State University
Spearfish, SD 57799 2SD BRIN Proteomics Core Facility
Vermillion, SD 57069 3School of Biological Sciences
University of Northern Colorado Greely, CO 80639
4Chemistry DepartmentBlack Hills State University
Spearfish, SD 57799*Corresponding author email: [email protected]
ABSTRACT
Crotalus viridis, the prairie rattlesnake, is the most widely-ranging rattlesnake in North America. It ranges from Alberta, Canada, to north-ern Mexico along the eastern flank of the Rocky Mountains, extending out onto the western half of the Great Plains. Throughout this range, the habitat and the community of small mammals that make up the majority of the diet of the species vary considerably. The prairie rattlesnake also has a broader diet than most other rattlesnakes, and eats birds, bird eggs, and reptiles, these prey varying geographically as well. Variation in diet may exist due to the wide geographic range of the snake, and this has possibly led to variation in venom components. Rattlesnake venoms are mixtures of proteins, metals, enzymes, and other components designed to immo-bilize, kill, and digest prey. Presently, all crotalid envenomations in North America are treated with one specific antivenin, but this treatment comes with risks. Studying snake venoms is important to biomedical research be-cause through their neurotoxic, hemmorhagic, and proteolytic activities, specific antivenins can be designed. In this study, we examined variation in venom proteins among two populations in the Black Hills region. One population came from the plains of western South Dakota and another from the interior of the Black Hills. Prairie populations came from prairie grasslands with an elevation of about 900–950 m; “highland” snakes came from ponderosa pine habitats exceeding 1524 m. The aim of this study is to understand variation in venom components, which can ultimately lead to improved management of rattlesnake bites through consideration of the geographic location of the bites.
224 Proceedings of the South Dakota Academy of Science, Vol. 91 (2012)
EVALUATION OF CYANOACRYLATE AS AN ALTERNATE TO SKIN SUTURES IN DOGS
N. Thakur* and V .P. ChandrapuriaDepartment of Veterinary Surgery & Radiology
College of Veterinary Science & A.H. M.P.P.C.V.V.
Jabalpur, (MP) India*Corresponding author email: [email protected]
ABSTRACT
Wound closing and healing depends upon sutures and suture materials. Gen-erally sutures cause discomfort to an animal and leave scar formation. Tissue adhesive has been used as an alternate to traditional sutures in lab animals. The current study was done to evaluate the efficacy of n- butyl cyanoacrylate tissue adhesive as an alternate to silk sutures in skin wound closing.
Twenty-four male and female dogs were used in this study. Six of each gender were treated with silk sutures or cyanoacrylate tissue adhesive to close a ventral midline laparotomy incision in females and a prescrotal incision in males. Ani-mals treated with silk sutures showed mild signs of inflammation (e.g., redness, pain, swelling) while none of the animals treated with n- butyl cyanoacrylate tissue adhesive showed any sign of inflammation during the course of study. Wounds treated with tissue adhesive had higher amounts of collagen and elastin fibers when examined histologically on the 14th postoperative day as compared to the wounds treated with silk sutures. This indicated that the tissue adhesive caused less scar formation at the site of surgery. Thus we conclude that n- butyl cyanoacrylate tissue adhesive provides better healing and is economical and less time consuming than conventional silk sutures.
Proceedings of the South Dakota Academy of Science, Vol. 91 (2012) 225
STRESS-INDUCED INCREASES IN EXTRACELLULAR SEROTONIN IN THE
VENTRAL HIPPOCAMPUS IS ATENUATED IN RATS DURING AMPHETAMINE WITHDRAWAL
H. Li, J. Hassell, J. L. Barr, J. L. Scholl, M. Watt, G. L Forster and K. J. Renner*
Department of Biology, University of South Dakota
Division of Basic Biomedical Sciences and Neuroscience Group Sanford School of Medicine
Vermillion, SD 57069*Corresponding author email: [email protected]
ABSTRACT
Amphetamine withdrawal is characterized by heightened anxiety states, and serotonin (5-HT) in the ventral hippocampus (vH) is associated reduced anxiety. Therefore, we tested the hypothesis that rats subjected to amphetamine with-drawal would exhibit attenuated stress-induced 5-HT overflow in the vH using in vivo microdialysis. Male Sprague-Dawley rats were treated with 2.5 mg/kg amphetamine or saline for 14 consecutive days. Within two weeks of the last amphetamine treatment, a microdialysis probe was inserted into the vH and perfused with artificial cerebral spinal fluid overnight. The following day, a 5-HT baseline was established and the rats were subjected to 20 min of restraint stress. Preliminary results suggest that the stress-induced release of 5HT in the am-phetamine-treated group was attenuated in response to the stressor. This result is consistent with our earlier studies in anesthetized rats which showed that chronic amphetamine (2.5 mg/kg; 14 days) decreased KCl- and corticosterone-induced 5-HT increases in vH. Interestingly, the blockade of the corticosterone-sensitive organic cation transporter 3 using intra-vH decynium-22 dose-dependently increased extracellular 5-HT in saline pretreated rats but had no effect in rats chronically pretreated with amphetamine. Furthermore, western immunoblot analysis indicated that OCT3 expression in the vH increased in rats treated with chronic amphetamine. These results suggest that chronic amphetamine alters both the release of 5-HT in response to stress and decreases the availability of extracellular 5-HT in the vH through increased OCT3-mediated 5-HT clear-ance. The persistence of attenuated serotonergic responses to stress in the vH during amphetamine withdrawal may contribute to drug relapse. Supported by NIH RO2 DA019921 (GLF) and NSF 0921874 (KJR).
226 Proceedings of the South Dakota Academy of Science, Vol. 91 (2012)
RECLASSIFICATION OF LIGHT HARVESTING ANTENNAE PROTEINS THROUGH
COMPUTATIONAL ANALYSES: ILLUMINATING THE MECHANISM FOR SPECTRAL TUNING
Joshua J. WalshCollege of Arts and Sciences
Dakota State University Madison, SD [email protected]
ABSTRACT
Light harvesting is a critical component of photosynthesis, the process by which plants synthesize complex organic materials from carbon dioxide, water, and in-organic salts, using chlorophyll and carotenoids to harvest sunlight as an energy source. The photosynthetic antennas are made of a family of light harvesting complex proteins (LHCs), and are responsible for both light harvesting and photo-quenching from high intensity light via spectral tuning. The structure and pigment binding sites of LHCs are well defined. LHCs physically reshape themselves to best complement the light provided by the environment, although the exact mechanism and evolution of this process in diverse photosynthetic lineages remains unclear. The structure of LHCs, including minor antennae pro-teins (CP24, CP26, and CP29) and the major antennae proteins (LHC-I and LHC-II), from Arabidopsis thaliana, Cyanidoschyzon merloae, and Thalassiosira pseudonona were determined using comparative homology modeling, based on the known crystal structure of Spinach LHC. Upon interrogating the models of each protein, I have extrapolated a table of similar and divergent LHC structures including conserved pigment binding sites and amino acid residues critical for quenching of excess energy. Characterizing conserved and divergent functional sites in LHC antenna from diverse algae will enhance current research efforts in a variety of industries such as bioengineering for hydrogen gas production and nanoscaled photovoltaics.
Proceedings of the South Dakota Academy of Science, Vol. 91 (2012) 227
ADAPTIVE EPIGENETIC EFFECTS ON DROUGHT TOLERANCE AND EPIGENETIC ACCOMMODATION: CONSEQUENCES FOR
RANGE EXPANSION IN PLANTS
Jacob Alsdurf*, Tayler Ripley, Dayna Boesen, and David SiemensBiology Department
Black Hills State University Spearfish, SD 57799
*Corresponding author email: [email protected]
ABSTRACT
Areas outside species range boundaries are often stressful, but even with ample genetic variation within and among marginal populations, adaptation across range limits often does not occur. Adaptive epigenetics may allow organisms to circumvent these problems for range expansion, at least temporarily. Epigenetic effects are environmental effects on the phenotype that are inherited with no changes to DNA sequence. To test this hypothesis, we drought stressed a parental generation of Boechera stricta (Graham) Al-Shehbaz, a perennial wild relative of arabidopsis, representing genetic variation among and within several range mar-gin populations. We then measured offspring performance and defense across a drought stress gradient in two growth chamber experiments. Boechera stricta is restricted to higher, moister elevations in temperate regions where generalist herbivores are often less common. The drought stress in the parental generation resulted in smaller plant size, delayed flowering time, lower reproduction and a genetic tradeoff between glucosinolate (GS) toxin allocation and stress toler-ance, but no differences in seed provisioning. These adaptive, drought-induced, epigenetic effects were characterized by increased shoot and root growth, higher root:shoot ratio, and higher water use efficiency as measured by lower water con-tent per dry mass. Both drought and drought-induced epigenetic effects lowered GS levels. Some of these characteristics were also expressed under controlled watering conditions, indicating epigenetic canalization. The adaptive, drought-induced, epigenetic effects on drought tolerance should allow plants to begin range expansion into drier environments, the maladaptive effects on defense and the genetic tradeoff would otherwise impede range expansion.
228 Proceedings of the South Dakota Academy of Science, Vol. 91 (2012)
STOICHIOMETRY AND HOMEOSTASIS OF TERRESTRIAL FUNGAL ISOLATES
ACQUIRED NEAR IRVINE, CALIFORNIA, AND COMPARISON WITH THE REDFIELD RATIO
AND GLOBAL SOIL MICROBIAL BIOMASS
Nicholas Kelley1, Allison Moreno2, Anthony Amend3, Adam Martiny3,4*, and Donna Hazelwood1
1College of Art and SciencesDakota State University
Madison, SD 57042 2California State University – Monterey Bay
Seaside, CA 939553Department of Ecology and Evolutionary Biology
4Department of Earth Systems ScienceUniversity of California – Irvine
Irvine, CA 92697 Corresponding author e-mail; [email protected]
ABSTRACT
The carbon, nitrogen, and phosphorus (C:N:P) ratios of 42 terrestrial fungal isolates acquired near Irvine, California, were analyzed and compared to the Redfield ratio (106:16:1) and global soil microbial biomass (60:7:1). To evaluate level of homeostasis or plasticity (non-homeostasis), we grew three of the isolates (Davidiella, Mucor flavus, Helotiales) in liquid malt-yeast extract treatments with modified nutrient ratios. Carbon and nitrogen levels were measured using com-bustion analysis. Soluble organic phosphorus was extracted using heated HCl and analyzed with a molybdenum reagent indicator using a photospectrometer. The average C:N:P of the 42 fungal strains was 153:31:1. The three isolates grown in nutrient-modified liquid media exhibited weak homeostasis with respect to C:N, weak plasticity with respect to N:P, and strong plasticity with respect to C:P. These results suggest that these local terrestrial fungi around Irvine are controlled by environmental conditions, and their growth is both nitrogen- and phosphorus-limited. Possible future research includes continued gathering of nutrient ratios and homeostasis data for terrestrial heterotrophs, and compar-ing data between agricultural and non-agricultural soils.
Proceedings of the South Dakota Academy of Science, Vol. 91 (2012) 229
AN INVENTORY OF NATIVE BEES (HYMENOPTERA: APOIDEA) OF THE
BLACK HILLS OF SOUTH DAKOTA AND WYOMING
David J. Drons* and Paul J. JohnsonPlant Science Department
South Dakota State UniversityBrookings, SD 57007
*Corresponding author email: [email protected]
ABSTRACT
Bees are an extremely important component of virtually every ecosystem but have been poorly studied in most of the United States including South Dakota. This is the first biodiversity inventory of native bees in the Black Hills, with objectives of providing occurrence records, new state species records, accurate identification of all native bees, and of documenting floral visitation. Sampling sites were representative of ecological communities with a focus on flower-rich meadows and habitat diversity over elevation gradients. In 2010 and 2011 ap-proximately 22,000 bees were collected from over 120 sites by a combination of pan trap (105,600 trap-hours), hand netting and volunteer collecting. Thirty pan-traps per site were placed approximately every five meters on each transect and left for 24 hours to passively collect bees. Hand netting took place for one hour per site with a focus on flowers in bloom to provide host plant data. To date 176 species representing 36 genera have been identified with expected final species numbers to be near 250. Based on a species list compiled from published records and available databases, this inventory has already provided over 40 new species occurrence records for South Dakota, and numerous new county species occurrence records. Analyses will be conducted to calculate and compare total and between-site species richness, species diversity as well as to determine cor-relation of species with habitat conditions. Results will support implementation of a monitoring protocol for native pollinators using this inventory as a baseline data set.
230 Proceedings of the South Dakota Academy of Science, Vol. 91 (2012)
PRELIMINARY PLAGUE ASSAY RESULTS OF FLEAS FROM FIVE NATIONAL PARKS
Erica L. Mize* and Hugh B. BrittenDepartment of Biology
The University of South Dakota Vermillion, SD 57069
*Corresponding author email: [email protected]
ABSTRACT
Sylvatic plague, the wildlife form of bubonic plague, is enzootic in black-tailed prairie dog colonies across the western Northern Plains and has become prevalent in South Dakota colonies in the last three years. The loss of prairie dog colonies due to plague can drive the loss of other species that have close ecological ties to the colonies, including the federally endangered black-footed ferret. Fleas were collected from burrows on prairie dog colonies across national parks in the Northern Plains region during the summers of 2009 - 2011. Whole genomic DNA was extracted from fleas after they were identified to species. Flea DNA was tested using a highly sensitive nested polymerase chain reaction (PCR) protocol to detect the pla gene in the plague-causing bacterium, Yersinia pestis. An active outbreak of plague began on one of the colonies at Badlands National Park concurrently with our flea collections there and Y. pestis – positive fleas were detected from these samples for the first time in Badlands National Park. These findings may trigger management actions including ferret immunization against plague and dusting of prairie dog colonies with deltamethrine.
Proceedings of the South Dakota Academy of Science, Vol. 91 (2012) 231
ASSESSING THE EFFECTS OF GRASSLAND MANAGEMENT PRACTICES ON ANT FUNCTIONAL
GROUPS (HYMENOPTERA: FORMICIDAE)
Laura B. Winkler*, Diane M. Debinski, Raymond A. Moranz, James R. Miller, David M. Engle,
Devan A. McGranahan, and James C. TragerInsect Research Collection,
South Dakota State UniversityBrookings, SD, 57007
*Corresponding author email: [email protected]
ABSTRACT
As habitat loss and degradation increase across native grasslands, much of the local flora and fauna associated with this ecosystem are becoming rare or are in decline. Insects play an important role in ecological systems across the globe, and ants (Hymenoptera: Formicidae) in particular play essential roles in moving soil, dispersing seeds, and decomposition. Here, we report a test of insect responses to three grassland management treatments, focusing on ants. These treatments are: (1) patch-burn and graze (burning of spatially distinct patches and free access by cattle), (2) graze and burn (burning of entire tract with free access by cattle), and (3) burn only. We predicted that land-use legacies would affect insect abundance and diversity, effects of time since fire, grazing history, remnant history (remnant or reconstructed grassland) and pre-treatment vegetation characteristics, so each were evaluated. Butterflies (Lepidoptera), ants, and leaf beetles (Coleoptera: Chrysomelidae) were surveyed for three years to compare their responses to each treatment as measured by abundance, richness and species diversity. Approxi-mately 5,794 ants were captured and identified; 14 species were determined. Ant species richness was positively associated with pre-treatment time since fire and vegetation height, and negatively associated with pre-treatment proportion of native plant cover. Our results indicate that land-use legacy can exert greater influence on grassland insect community composition than current manage-ment, but the particular aspects of land-use legacy type vary across insect taxa. The next step is to compare the effects of other management treatments used on the abundance of ant functional groups.
232 Proceedings of the South Dakota Academy of Science, Vol. 91 (2012)
CONTRIBUTIONS OF SEED BANK AND VEGETATIVE PROPAGULES TO VEGETATION COMPOSITION ON PRAIRIE DOG COLONIES
IN WESTERN SOUTH DAKOTA
Emily R. Helms1, Lan Xu1*, Jack L. Butler2
1Department of Natural Resource ManagementSouth Dakota State University
Brookings, SD 570072U.S. Forest Service Rocky Mountain Research Station
Rapid City, SD 57002*Corresponding author email: [email protected]
ABSTRACT
Characterizing the contributions of the seed bank and vegetative propagules will enhance our understanding of community resiliency associated with prai-rie dog disturbances. Our objective was to determine the effects of ecological condition (EC) and distance from burrows on the soil seed bank and vegetative propagules. Two active burrows were randomly selected on each of 2 prairie dog colonies (Low EC vs High EC). Two soil cores were taken at 0.5 m, 1.0 m, and 1.5 m distances from the center of each burrow on 3 transects. Cores used to evaluate the seed bank were sifted and spread within standard seed flats, while cores used to determine vegetative propagules were placed intact into plastic pots. Both were maintained in a greenhouse for daily monitoring. A total 446 seedlings representing 16 species emerged from the Low EC seed flats, while 549 seedlings comprising 26 species emerged from the High EC seed flats. Sixty-three percent of the Low EC and 58% of the High EC species emerged from the seed flats were annuals. On the Low EC colony, 43 plants/tillers were gener-ated from vegetative propagules representing 7 species, three of which were also found in the seed flats. On the High EC colony, 431 plants/tillers sprouted from vegetative propagules representing 5 species that were not present in the seed flats. Four of the 5 species that emerged from vegetative propagules on High EC were perennial native grasses, and only one of the 7 species that emerged from vegetative propagules on the Low EC was a perennial native grass. Distance from burrows had no impact on species richness within each EC. Both colonies dem-onstrated considerable revegetation potential but differed with respect to relative contributions from the soil seed bank and vegetative propagules.
Proceedings of the South Dakota Academy of Science, Vol. 91 (2012) 233
COMPARING RAMP AND PITFALL TRAPS FOR CAPTURING WANDERING SPIDERS
L. Brian PatrickDepartment of Biological Sciences
Dakota Wesleyan UniversityMitchell, SD 57301
Corresponding author email: [email protected]
ABSTRACT
Pitfall traps are a common sampling method used to collect wandering spiders in a variety of habitats, and these traps require soil disturbance to properly set the trap with the top of the trap at the level of the soil surface. However, not all sampling locations are amenable to soil disturbance, either because there is no soil in which to dig (e.g., rock surfaces), or because soil disturbance is not allowed or it is very difficult to obtain permits for soil disturbance (e.g., US na-tional parks). I tested the efficacy of a new trap design (ramp traps), developed by researchers in Canada, against traditional pitfall traps. In two fields of the Fort Pierre National Grasslands, SD, I ran parallel transects of pitfall and ramp traps for three sampling periods of two weeks each, then counted the number of species and the number of individuals of each species in each trap. Ramp traps captured approximately twice as many individuals, and, on average, 1.1 additional species per trap. However, the species composition caught in ramp and pitfall traps varied, with a small number of species captured only in pitfall traps, and a small number of species captured only in ramp traps. Despite these subtle differences, ramp traps generally outperformed pitfall traps and may be easily moved to different locations with little or no soil disturbance. My results indicate that ramp traps would be a viable trapping method, particularly in areas where soil disturbance is not allowed.
234 Proceedings of the South Dakota Academy of Science, Vol. 91 (2012)
APPLICATION OF P-SPECIATION ACROSS LAND USE GRADIENT AS AN INDEX FOR EVALUATING
THE RESTORATION OF SOIL BIOGEOCHEMICAL FUNCTIONS DURING WETLAND RESTORATION
P. V. Sundareshwar1*, L. Smith2, B. Beas2, R. Gleason3, and Kurt Chowanski1
1Department of Atmospheric Sciences South Dakota School of Mines and Technology
Rapid City, SD 577022Department of Zoology
Oklahoma State University Stillwater, OK
3USGS Northern Prairie Wildlife Research Center
Jamestown, ND*Corresponding author email: [email protected]
ABSTRACT
Land-use change has altered the ability of wetlands to provide vital services such as nutrient retention. While compensatory practices attempt to restore degraded wetlands and their functions, it is difficult to evaluate the recovery of soil biogeochemical functions that are critical for restoration of ecosystem ser-vices. 31P Nuclear Magnetic Resonance Spectroscopy provides an excellent tool to evaluate the changes in soil biogeochemical functions as a result of manage-ment actions. By examining the chemical forms of phosphorus (P) in soils from wetlands located across a land-use gradient, we found that in prairie potholes and Carolina Bay wetlands the soil P diversity, a functional attribute, declined upon conversion to agriculture, but recovered following restoration. We further evalu-ated the application of this method to examine the changes in soil biogeochemi-cal functions across a land use gradient in a network of rainwater basin and playa wetlands. For Rainwater Basin (RWB) wetlands we sampled replicate wetlands under agriculture, restoration, and reference conditions. For Playa wetlands, the land use categories were agriculture, CRP, and reference conditions. Since environmental conditions can vary across a wetland, multiple locations in each of these wetlands were also sampled to evaluate the effect of sample position on P-speciation. Our results indicate that P-species diversity and soil total P differed significantly in the reference wetlands among the two wetland types. Within each wetland type, P-species diversity differed as a function of land use in Playa wet-lands, but not in Rainwater Basin. Soil moisture also differed significantly among sample position and wetland type. For Playa wetlands there were significant dif-ferences between AG and CRP with AG being the wettest and CRP being the driest. There was also a significant difference between edge and middle positions. For RWB wetlands there was a significant difference in location but not among

Proceedings of the South Dakota Academy of Science, Vol. 91 (2012) 235
land uses. Given that similar land use managements have different connotations among different wetland types (e.g. the prairie pothole, the Carolina Bay, the Rainwater Basin, and the Playas), our results caution against direct comparison of P-speciation across wetland types (for the purpose of evaluating the impact of land use activities) even though they may be subject to similar land use. We emphasize the application of reference conditions within each class of wetland for evaluating the efficacy of restoration efforts while using P-species diversity as an index of soil biogeochemical function restoration.
236 Proceedings of the South Dakota Academy of Science, Vol. 91 (2012)
POPULATION GENETIC STRUCTURE OF PRAIRIE DOGS ON THE LOWER BRULE RESERVATION
Jordana R. Lamb*, Erica L. Mize, and Hugh B. BrittenDepartment of Biology
The University of South DakotaVermillion, SD 57069
*Corresponding author email: [email protected]
ABSTRACT
The World Health Organization reports plague to be a bacterial infection which is serious and occasionally lethal. One form of plague which is com-monly seen, bubonic, affects the lymph nodes. Bubonic plague is a zoonotic disease, meaning it can be passed between humans and other animals. In wildlife bubonic plague is called sylvatic plague. Since plague can overtake the lives of humans and animals alike, it is of utmost importance that further research into this topic be conducted. Sylvatic plague, as well as all other plague forms, is caused by the bacterium Yersinia pestis and is transmitted by infected fleas biting their hosts, including black-tailed prairie dogs, Cynomys ludovicianus. Sylvatic plague is becoming increasingly important in South Dakota; in 2004, the first outbreak of sylvatic plague occurred in black-tailed prairie dogs at the Pine Ridge Oglala Sioux Reservation. The objective of my research was to examine variation in 4 microsatellites, small repeated sequences in DNA, in 120 black-tailed prairie dog samples taken from 2 separate colonies in the Fort Hale Bottom Prairie Dog Complex on the Lower Brule Sioux Reservation in central South Dakota. Mi-crosatellite data were used to estimate gene flow which helped determine the movement of prairie dogs across the landscape and ultimately, determined how sylvatic plague might have moved between colonies. I found an Analysis of Mo-lecular Variance (AMOVA) value of 99% within the 2 colonies studied. Also, the number of black-tailed prairie dog migrants between the colonies per generation (Nm) was calculated to be 13. These two values illustrate that black-tailed prairie dogs are moving between these colonies, and for all practical purposes should be considered one, large population.
Proceedings of the South Dakota Academy of Science, Vol. 91 (2012) 237
CONSERVATION GENETICS OF THE HINE’S EMERALD DRAGONFLY
Emy M. Monroe and Hugh B. Britten*Department of Biology
University of South DakotaVermillion, SD 57069
*Corresponding author email: [email protected]
ABSTRACT
We investigated population genetic structure and estimated genetic variability in the federally endangered Hine’s emerald dragonfly (Somatochlora hineana) us-ing 10 variable microsatellite markers. The goal of the study was to determine levels of genetic connectivity among dragonflies occupying remnant fen habitats in Illinois and to use this information to inform management of the dragonfly’s habitat and potential re-introduction efforts. Larval and adult Hine’s emerald dragonflies were nondestructively sampled from habitat patches along the heavily urbanized Des Plaines River near Chicago, IL, and from more pristine areas on the Door Peninsula, WI, and other locations in Wisconsin. Hine’s emerald drag-onfly is apparently in decline in the Des Plaines River valley but is functioning as a single genetic population in the remaining occupied habitats. The dragonfly shows a similar genetic structure on the Door Peninsula Valley with fairly high levels of gene flow among occupied habitat patches. Dragonfly populations in Illinois have unique genetic diversity compared to those in Wisconsin, suggestive of post-Pleistocene dispersal events. Overall, Hine’s emerald dragonfly has less genetic variability than other dragonfly species.
238 Proceedings of the South Dakota Academy of Science, Vol. 91 (2012)
MONITORING LIVESTOCK FORAGE USE IN THE BLACK HILLS
Thomas M. JunttiBlack Hills Group—Sierra Club
Rapid City, SD 57701Corresponding author email: [email protected]
ABSTRACT
The land management plan for the Black Hills National Forest provides an annual use guideline for forage consumption by livestock of approxi-mately 50%. The US Forest Service is required to monitor forage use for compliance with the plan. The monitoring method employed by the For-est Service, known as “ocular by plot,” is subjective and claims of overgraz-ing have, in the past, been lodged by both citizen and government groups.
In 2010, we measured residual vegetation following grazing using a modified Robel pole on a random sample of 24 pastures on the Northern Hills Ranger District. Comparing these measurements with those taken on four ungrazed pastures, we found all the grazed pastures were grazed in excess of the guideline. The Forest Service’s own measurements indicated all pastures were in compliance with guidelines.
The Forest Service disputed these findings, claiming that the Robel pole could not be used to measure utilization. Therefore, in 2011 on a sub-sample of the original 24 pastures, we clipped vegetation along our Robel pole transects both before and after grazing. By direct measurement, four of seven of the pastures were significantly overgrazed and the group dif-fered significantly from the forest plan guideline (P < 0.05). Twenty-two of the 24 pastures had been grazed. Of these, seven met a Robel pole guideline 10 half-inch bands based on 60% of the long-term productivity of the area.
We conclude overgrazing is widespread on the Northern Hills Ranger District of the Black Hills National Forest and that the method employed by the Forest Service to monitor annual use of forage by livestock vastly underestimates consumption.
Proceedings of the South Dakota Academy of Science, Vol. 91 (2012) 239
DEVELOPMENT OF A COMPREHENSIVE VASCULAR PLANT DATABASE FOR
THE MISSOURI PLATEAU
Grace Kostel1, Curtis Card2 and Mark Gabel1*1Herbarium, Department of Biology
2College of Liberal Arts Black Hills State University
Spearfish, SD 57799*Corresponding author email: [email protected]
ASTRACT
The land area of the Missouri Plateau includes most of the Dakotas, the majority of Montana, eastern Wyoming and northern Nebraska. The pur-pose of our study is to record and make available label data of all vascular plant specimens collected from this region. Data are being collated from 26 herbaria. Approximately 200,000 plant specimens will be included in the database, which will result in the first comprehensive flora of this region. Data are being “cleaned” and georeferenced, allowing most speci-mens to be mapped. Eighteen fields in the database include data about plant names, localities, habitat, collector and holding herbarium. The soft-ware currently being used is Specify 6.4. The database is currently running in a virtual environment using multiple Vmware ESX hosts connected to SAN storage. The database will be made available online to the public and many combinations of data fields, including date of collection and locality of collection, will be accessible for research. We anticipate being able to use the database to learn about the arrival and spread of invasive species as well as the presence and distribution of rare plant species. Given the rapid expansion of energy resource extraction currently developing in this area, we anticipate the database will become a significant resource for information.
240 Proceedings of the South Dakota Academy of Science, Vol. 91 (2012)
BOTANICAL RESOURCES: GENETIC DIVERSITY OF ORCHIDACEAE
IN SOUTH DAKOTA’S BLACK HILLS
R. Sprague*and B. van EeBlack Hills State University
Spearfish, SD 57783Corresponding author email: [email protected]
ABSTRACT
In an effort to determine the genetic diversity of orchid (Orchidaceae) popula-tions in the Black Hills, we have made collections of twelve orchid species from multiple locations in the Black Hills for DNA extraction and genotyping. The nearest orchid populations outside of the Black Hills are in the Rocky Mountains 300 miles to the west, and deciduous forest localities 300 miles to the east. The results of this study (yet to be determined) should indicate from which popula-tion (west or east) the orchids of the Black Hills were derived. Study results will also be useful for Black Hills National Forest management practices by determin-ing the levels of diversity within the Black Hills orchid populations. An assess-ment of the genetic diversity among different populations of the same species of orchids in the Black Hills will determine the effects of disturbance on the popu-lation. Results are also expected to resolve some taxonomic questions concerning Orchidaceae in the Black Hills, including identification of species varieties.
Proceedings of the South Dakota Academy of Science, Vol. 91 (2012) 241
BIOGEOGRAPHY OF THE SOUTH AMERICAN MAJOR RIVER BASINS: A PRELIMINARY APPROACH
U. A. Buitrago-SuarezDepartment of Biology Mount Marty CollegeYankton, SD 57078
Corresponding author email: [email protected]
ABSTRACT
The history of South American rivers was influenced by changes in direction of the proto-Amazon basin. During the Campanian to middle Maastrichtian (late Mesozoic), the proto-Amazon started flowing westward to the Pacific Ocean. The western and eastern Amazonia were in separate drainage systems, a situation that extended until the late Miocene (~8 Ma). These changes have shaped not only the present river basins but also their fish fauna. In the past some authors have searched for common biogeographic patterns in South America by combin-ing different individual area cladograms. Four phylogenetically disparate taxa, such as the callichthyid genus Hoplosternum, the characiform genus Boulengerella and the genera Gilbertolus and Rosetes, have been used in the past to explain the evolution of river basins in South America. The result of this analysis was a pattern demonstrated by the relationship ((Atrato River + Magdalena River)(cis-Andean Rivers)). The cis-Andean Rivers’ branch includes a high diversity of river basins, such as the Amazon, Orinoco, Parana and Sao Francisco, and rivers from the Guyana region. Biogeographic relationships of these rivers were unresolved in a previous analysis.
Using standard geographic methods such as Component and PAE (Parsimony Analysis of Endemisms) in a more comprehensive study, I included several indi-vidual area cladograms intending to resolved known patterns for the cis-Andean River Basins’ branch.
242 Proceedings of the South Dakota Academy of Science, Vol. 91 (2012)
POSSIBLE INTERACTIONS OF KENTUCKY BLUEGRASS AND WESTERN WHEATGRASS
MONOCULTURES AND MIXED POPULATIONS WITH FERTILIZATION AND CLIPPING
E. M. Kanaan* and J. L. ButlerDepartment of Natural Resource Management
South Dakota State University Northern Plains Biostress Laboratory (SNP)
Brookings, SD 57007US Forest Service, Rocky Mountain Research Station
Forest & Grassland Research LaboratoryRapid City, SD 57702
*Corresponding author email: [email protected]
ABSTRACT
Potential interactions were examined between western wheatgrass (Pascopyrum smithii), a dominant native species, and Kentucky bluegrass (Poa pratensis), a dominant introduced species, in response to fertilization and clipping. Seedlings of both species were transplanted into pots as monocultures and mixed spe-cies (50/50 mix) and placed in a growth chamber. Pots were watered regularly with one-half of the pots receiving Miracle-Gro®. Individual plant heights were measured weekly. After 4 weeks, plants were clipped and allowed to re-grow for another 3 weeks. All clipped biomass was oven dried and weighed. Prior to clipping, relative increases in height of western wheatgrass in fertilized pots were similar between monoculture and mixed species pots. In non-fertilized pots, relative increases in height for western wheatgrass were higher in monoculture pots compared to mixed species pots for the first 12 days. After day 25, patterns of growth in height for western wheatgrass in fertilized and unfertilized pots were similar. Relative increases in height for Kentucky bluegrass were higher in monoculture pots (fertilized and unfertilized) compared to mixed species pots. Following clipping, patterns of increases in height were similar for both spe-cies under all treatments. Total biomass was similar between the two species in fertilized, monoculture pots. In mixed species pots, total biomass of Kentucky bluegrass was 9X greater than western wheatgrass in unfertilized pots and 1.4X greater in fertilized pots. These findings suggest that Kentucky bluegrass can supplant a dominant native species of similar growth form during early stages of establishment under a variety of conditions.
Proceedings of the South Dakota Academy of Science, Vol. 91 (2012) 243
SEEDLING ROOT DEVELOPMENT OF SIX ALFALFA POPULATIONS
Brianna J. Gaughan1, Lan Xu1*, Roger N. Gates1, Arvid Boe2, Patricia S. Johnson1, and Yajun Wu3
1Department of Natural Resources Management2Department of Plant Sciences
3Department of Biology and MicrobiologySouth Dakota State University
Brookings, SD 57007*Corresponding author email: [email protected]
ABSTRACT
Seedling root development plays a crucial role in seedling survival and stand establishment. Naturalized yellow-flowered alfalfa (YFA) (Medicago sativa subsp. falcata) has demonstrated adaptation to semiarid conditions of the Northern Great Plains and tolerance to grazing. Seedling stage root development is poorly defined. Our objective was to compare morphological traits of seedling roots for six alfalfa populations. Six entries were evaluated: one M. sativa population as control, two M. falcata entries with reported have “spreading characteristics” and three naturalized YFA populations. Uniform seeds of each entry were scari-fied with 320 grade sand paper and inoculated with Rhizobium before planting. A V-shaped Plexiglas rootview growth box (48 cm X 27 cm X 40 cm deep) was divided into six compartments, each filled with Miracle-Gro potting soil. Ten seeds per population were planted (1.5 cm deep) at 1.5 cm intervals against the Plexiglas wall. The rootview box was maintained in a growth chamber (24 ± 3 °C; 16h light/8h dark). Soil moisture was maintained with daily misting for 26 days. M. sativa and YFA populations had faster primary root emergence (2-3 d) than M. falcata (8 d). Primary root elongation rate was greater for M. sativa (3-4 cm/d) than M. falcata and YFA populations (1.8-2.6 cm/d) for the first 7 days. The first lateral root emerged when primary root length reached 10-14 cm for all populations. The first lateral root emerged 2-3 cm below the root-stem junction with the exception of one of the M. falcata populations (5 cm).
244 Proceedings of the South Dakota Academy of Science, Vol. 91 (2012)
MORPHOLOGY OF SMOOTH BROMEGRASS AND IMPLICATIONS RELATED TO
MANAGEMENT AND POTENTIAL CONTROL
Arvid Boe* and Lan XuDepartments of Plant Science and Natural Resource Management
South Dakota State UniversityBrookings, SD 57007
*Corresponding author email: [email protected]
ABSTRACT
Smooth bromegrass (Bromus inermis Leyss.) is a sod-forming cool-season grass native to Europe and Asia. It was introduced to North America in the 1880s and occurs in all 50 contiguous states other than Florida and Alabama and all prov-inces of Canada. It is widely used for forage, conservation, and erosion control in temperate climates worldwide. Although its value as a forage crop is undispu-table, it also may be invasive in native grasslands in the northern Great Plains. The objective of this study was to describe the proaxis of smooth bromegrass in terms of tiller origins from axillary buds at proaxial nodes, number of buds per proaxis, and frequency of buds that produce intravaginal and extravaginal tillers and compare these traits with the same in meadow bromegrass (Bromus riparius), a bunchgrass that is receiving considerable attention as a forage crop in the northern Great Plains. Post-anthesis reproductive tillers of each species were collected from replicated plots at Brookings, SD, during August and September. Proaxes of both species contained from <5 to >10 nodes per proaxis. In general, the frequency of proaxial buds that produced tillers was between 25 and 50% for both species. Harvesting the two species seven times over a period of 5 years resulted in a reduction in vigor for both species, but tiller density and biomass more negatively impacted for smooth bromegrass compared with meadow bromegrass.
Proceedings of the South Dakota Academy of Science, Vol. 91 (2012) 245
THE IMPACT OF BLASTOBASIS REPARTELLA (DIETZ) (LEPIDOPTERA: COLEOPHORIDAE)
ON SWITCHGRASS
Veronica Calles Torrez*, Paul J. Johnson, and Arvid BoeInsect Biodiversity LaboratoryDepartment of Plant Science
South Dakota State UniversityBrookings, SD 57007
*Corresponding author email: [email protected]
ABSTRACT
Switchgrass (Panicum virgatum L.) is a potential biomass production crop and is important as a model for biofuel synthesis. A potential pest, the Switchgrass moth (Blastobasis repartella (Dietz)) larva feeds in the rhizome, proaxis, and basal internodes of the tillers, causing premature tiller death which directly affects biomass accumulation. The focus of this study was to determine among cultivars the frequency of tiller infestation, the differences in biomass production, and biomass loss. Two experimental areas established in 2004 and 2008 in Brookings County, South Dakota, were used in 2011. Sampling plots were arranged in a Randomized Complete Block design with six replications and six cultivars. A frame of 1 ft2 was placed in the plot and all tillers within were cut at ground level. Tillers were categorized as infested and uninfested tillers, counted, dried at room temperature, weight, and recorded. Analysis of variance for differences was used and the least significant difference to compare means. Statistical output showed no significant difference among cultivars in frequency of infestation in both areas. There was a significant difference in production and loss of biomass in the newer area as well as for biomass production in the older area, but not for biomass loss. Infestation rate was statistically identical in all of the cultivars. Sub-sequently, we found that early instar larvae feed on new tiller buds on subterra-nean rhizomes from late summer through winter, indicating a potentially greater impact on biomass production than that measured by the tiller assessment.
246 Proceedings of the South Dakota Academy of Science, Vol. 91 (2012)
SCREENING ARTEMESIA EXTRACTS FOR ANTI-MALARIAL ACTIVITY
C.W. White*, J. Nies, G. Geffre, and J. DixsonBlack Hills State University
Spearfish, SD 57783Corresponding author email: [email protected]
ABSTRACT
An estimated 300-500 million new cases of malaria are reported annually, resulting in up to 2.7 million deaths each year. As a result of the development of resistance to traditional anti-malaria compounds, such as artemisinin and chloroquine, by the malaria-causing parasite, Plasmodium falciparum, a world-wide effort in the search for a new novel anti-malarial compound is under way. Working with Dr. Dixson’s group, we explored the anti-malarial properties of four different species of plants belonging to the genus Artemisia. These plants are not only sisters to the plant that artemisinin was derived from, but are also found in western South Dakota. Anti-malarial activity was confirmed in six out of 12 crude extracts in a morphological assay. Because this assay was tedious, time consuming, and subjective, we have recently transitioned to a 96 well micro-titer plate-based biochemical assay. The findings from the morphological assay were confirmed in the biochemical assay, with complete inhibition at lower than therapeutic doses in two extracts. These results indicate that the extracts po-tentially contain compounds that differ from artemisinin and perhaps are more potent. Future work will focus on the purification and structural determination of active compounds.
Proceedings of the South Dakota Academy of Science, Vol. 91 (2012) 247
IN VITRO AND IN VIVO ANTHELMINTIC ACTIVITY OF ERICAMERIA NAUSOESA
AND RHUS AROMATICA FROM THE UNITED STATES NORTHERN GREAT PLAINS WITH QUANTIFICATION OF CONDENSED
TANNINS FOR BOTH PLANTS
J. Acharya1, M .B. Hildreth1,2*, L. D. Holler2, S. Holler2, A. A. Eljaki1, G. NandaKafle1 and R. N. Reese1
1Department of Biology & Microbiology2Department of Veterinary & Biomedical Sciences
South Dakota State UniversityBrookings, SD 57007
*Corresponding author email: [email protected]
ABSTRACT
The anthelmintic activities of methanol extracts from Ericameria nauseosa and Rhus aromatica were evaluated using an in vitro larval development assay involv-ing juveniles of the sheep gastrointestinal nematode, Haemonchus contortus. Both extracts showed complete inhibition of larval development at 3.12 mg/ml and dose-dependent effects were observed when screened at different concentrations. The effective dosages (ED50) for E. nauseosa and R. aromatica extracts were 1.05 mg/ml and 0.92 mg/ml against the first and the second stage juveniles (L1, L2) respectively. Condensed tannins were purified from the crude phenolic extract of each plant using Sephadex LH-20. Spectrometric analysis detected condensed tannins only in R. aromatica. In vivo anthelmintic activity was also evaluated only for R. aromatica using sheep and a fecal egg count reduction test. Egg counts from the treated ewes were numerically lower than from the control animals, but this decrease was not statistically significant during the 5 days of this trial. Feeding fresh leaves of R. aromatica had no obvious adverse effect in any ewes throughout the experimental period. When polyvinyl polypyrrolidone (PVPP), an inhibitor of tannin, was used to verify the anthelmintic activity of tannin, the activity was not removed. This indicates that tannins might not be the only source of anthelmintic activity in this plant. Further studies are needed that evaluated higher amounts of plant material (increased daily dosage or longer dos-age periods) or the effectiveness of crude alcoholic extracts given to the animals.
248 Proceedings of the South Dakota Academy of Science, Vol. 91 (2012)
LIFE CYCLE ASSESSMENT MODELING AS A SUSTAINABILITY METRIC: A CASE STUDY
INVESTIGATING ANTIMICROBIAL USE WITHIN SOUTH DAKOTA SWINE PRODUCTION
J. J. StoneDepartment of Civil and Environmental Engineering
South Dakota School of Mines and Technology Rapid City, SD 57701
Corresponding author email: [email protected]
ABSTRACT
A life cycle assessment (LCA) model was developed to estimate the environ-mental effects associated with tylosin and chlortetracycline (CTC) antimicrobial sub-therapeutic use within South Dakota swine production facilities. Environ-mental LCA-associated impacts were modeled using SimaPro and assessed using EcoIndicator 99 for antimicrobial manufacturing, feed blending and transport, metabolic and manure emissions, and facility operations for starter, grower, and finishing swine operations. LCA results suggest current high energy demands associated with manufacturing, fermentation processes and large transport dis-tances to producers of CTC and tylosin impact climate change compared to no antimicrobial use. Feeding CTC resulted in several local positive changes including increased feed utilization and reduced manure greenhouse gas emis-sions. However, these positive changes in the local environment did not offset negative global impacts associated with material manufacturing and transport. Using renewable energy sources for production and transport would result in net environmental enhancement.
Proceedings of the South Dakota Academy of Science, Vol. 91 (2012) 249
FECAL EGG COUNT REDUCTION TEST TO EVALUATE THE EFFECTIVENESS OF DORAMECTIN
AGAINST TRICHOSTRONGYLE NEMATODES IN BISON FROM EASTERN SOUTH DAKOTA
A. A. Eljaki1, D. D. Grosz2, and M. B. Hildreth1,2*1Department of Biology and Microbiology
2Department of Veterinary and Biomedical Sciences South Dakota State University
Brookings, SD 57007*Corresponding author email: [email protected]
ABSTRACT
During the 2010 summer, a commercial bison herd in eastern South Dakota was selected for this study because some of its members showed signs of clini-cal parasitism, and needed to be dewormed. Freshly excreted fecal samples were collected from bison cows, yearlings and calves. These samples were evaluated for the presence of nematode eggs. On August 12th, mean trichostrongyle egg output for 33 cow samples was 10.5 eggs/gram (epg), for yearlings (N = 21) it was124.7 epg, and for calves (N = 15) it was186.1 epg. Some samples were fur-ther assessed with PCR analysis (involving the ITS2 region of rDNA) to identify genera/species of trichostronglye nematodes present. Five trichostrongyles were identified within the bison (Haemonchus contortus 29%, H. placei 26%, Cooperia spp. 26%, Ostertagia spp. 17%, Trichostrongylus spp. 2%). Very little is known about the effectiveness of cattle anthelmintics for controlling trichostrongyle nematodes in bison. The purpose of this study was to measure the effectiveness of doramectin (Dectomax® injectable at the recommended dosage for cattle) for eliminating adult trichostrongyles from bison. Yearlings were treated on Septem-ber 2, and there was a 100% elimination of egg shedding when 34 samples were evaluated again on October 1. Just prior to treatment in October, egg output in the calves was 70.5 epg, but dropped to 0.056 epg (99.9% reduction) after treat-ment. Dectomax® treatment of cows during the fall of 2011 decreased tricho-strongyle egg output from 6.28 epg to 0.017 epg. These results demonstrate the effectiveness of doramectin as a treatment for adult trichostrongyles in bison.
250 Proceedings of the South Dakota Academy of Science, Vol. 91 (2012)
BOVINE VIRAL DIARRHEA VIRUS (BVDV) REPLICATION IN MONOCYTE-DERIVED
DENDRITIC CELLS AND SIGNIFICANCE OF BREED DIFFERENCE IN ITS GENERATION
M. K. S. Rajput1, L. J. Braun1, J. F. Ridpath2, W. Mwangi3, A. J. Young1, M. W. Darweesh1, and C. C. L. Chase1*
1Department of Veterinary and Biomedical Sciences South Dakota State University Brookings, SD, 57007, USA
2Ruminant Diseases and Immunology Research Unit National Animal Disease Center, Agricultural Research Service
United States Department of Agriculture Ames, IA, 50010, USA
3Department of Veterinary PathobiologyTexas A&M University
College Station, TX, 77843, USA*Corresponding author email: [email protected]
ABSTRACT
The dendritic cell (DC) is an important antigen presenting cell. DCs are the most potent naive T cell activator and immune regulator. Viruses that infect DC can have a devastating impact on the immune system. In this study we evaluated breed differences in generation of bovine MDDCs (monocyte derived dendritic cells) and the ability of BVDV to replicate in bovine MDDCs.
Monocytes were isolated from Holstein Friesians (H.F.) and Brown Swiss (B. Swiss) calves that were 8 months to 1 year of age. Monocytes were differentiated into MDDCs using bovine recombinant IL-4 and GMCSF and confirmed mor-phologically and phenotypically to be MDDC. The MDDCs had long dendrites and were 5-7 times larger size then monocytes. The cell surface phenotype was CD14-, CD21-, MHCI+, MHCII+, CD86+,DEC205+. We found that100% of the B. Swiss calves produced MDDCs while only 5.5% of the H.F. were able to generate MDDCs.
For MDDCs infection, 4 strains of BVDV were used including the most virulent (1373), least virulent (28508), and a virus pair, cytopathic TGAC and noncytopathic TGAN recovered from an animal that died of mucosal disease. MDDCs remained viable 72 hrs post-infection against all viruses. No infectious virus production by MDDCs occurred. Interestingly, viral RNA increased in MDDCs through 144 hr after infection. The kinetics of viral RNA produc-tion along with the amount of viral RNA was significantly different between viral stains. The study revealed that BVDV replicates in MDDCs but does not produce infectious particles. Accumulation of viral RNA may have significant ef-fects on immune response mounted by MDDCs. Future studies will be done to evaluate the effect of viral RNA accumulation in MDDCs on immune response mounted by MDDC.
Proceedings of the South Dakota Academy of Science, Vol. 91 (2012) 251
SANDBAR FORMATION CAUSED BY THE 2011 FLOOD ON THE MISSOURI RIVER
NEAR VERMILLION, SOUTH DAKOTA
Malia Volke*1, W. Carter Johnson1, and Bruce Millett2
1Department of Natural Resources Management2Department of Geography
South Dakota State UniversityBrookings, SD 57007
*Corresponding author email: [email protected]
ABSTRACT
Missouri River flows have been highly regulated by dams since the 1950s, resulting in reduced peak flows, increased minimum flows, and disruption of sediment supply and transport regimes. Consequently, dams have greatly limited the formation of sandbar surfaces necessary for native cottonwood recruitment along the Missouri River. During the summer of 2011, record precipitation in the upper Missouri River basin resulted in unprecedented dam releases and prolonged high summer flows throughout the Missouri River system, creating favorable conditions for erosion and sandbar formation. The effects of the 2011 flood on sandbar formation were assessed for an approximately 28-kilometer reach of the Missouri River downstream of Gavins Point Dam near Vermillion, South Dakota. Landsat images of the study reach from 2010 and 2011 were clas-sified using “heads-up” digitizing in ArcGIS 10 to calculate changes in the aerial extent of water, sand, and vegetation following the flood. An 1892 Missouri River Commission map of the study reach was similarly classified to provide a predam point of comparison. Sandbar area increased by nearly 500 percent between 2010 and 2011. Overlays of the digitized channel images indicated that channel movement was minimal between 2010 and 2011. Total sandbar area following the 2011 flood (1168 hectares) was similar to the amount of sandbar area in 1892 (1668 hectares), although there were major differences in the loca-tion and size distribution of sandbars between the two periods. The long-term benefits of the 2011 flood to cottonwood recruitment cannot be known without field studies in 2012 and beyond.
252 Proceedings of the South Dakota Academy of Science, Vol. 91 (2012)
THE DIVERSITY OF UNDERGRADUATE SUSTAINABILITY CURRICULA: A RAPIDLY
EXPANDING MAJOR IN HIGHER EDUCATION
Brennan T. JordanDepartment of Earth SciencesUniversity of South Dakota
Vermillion, SD 57069Corresponding author email: [email protected]
ABSTRACT
The term “sustainability” means different things to different people. On college campuses it is increasingly the title, or part the title, of an undergraduate major or minor, or graduate degree. The first school to offer a degree in sustainability was Arizona State University, which began graduate programs in 2007 and first offered an undergraduate degree in 2008. In the next two years the degree was developed at an eclectic set of mostly small colleges ranging from liberal arts col-leges like Baldwin-Wallace College (Ohio) to small state institutions like Lyndon State University (Vermont). The last two years have seen many more programs come on line (some even online), including many at major state institutions (e.g., University of Oklahoma, University of Illinois, and San Diego State Uni-versity). The University of South Dakota will begin offering a B.A., B.S., and minor in Sustainability beginning in fall 2012.
The curricula for undergraduate majors in sustainability vary significantly. Arizona State University has a School of Sustainability, and because of this investment they were able to develop a major that relies heavily on sustainabil-ity-specific courses. Other institutions have typically created the degree relying largely or entirely on courses already taught at the schools in support of other majors. The University of South Dakota took a balanced approach to developing its major, developing new courses under a sustainability course prefix (SUST) and adding new relevant courses in some fields (e.g., anthropology and Earth sciences), but relying heavily on existing courses and faculty expertise to deliver the major.
Proceedings of the South Dakota Academy of Science, Vol. 91 (2012) 253
THE ISSUE OF UNCERTAINTY FOR HYDROLOGIC EVENTS IN THE MISSOURI
RIVER WATERSHED AND THE PROPERTIES OF THE COORDINATE SYSTEM IN USE
Boris A. Shmagin* Water Resources Institute
South Dakota State UniversityBrookings, SD 57007-3510, USA
*Corresponding author email: [email protected]
ABSTRACT
To study, describe, assess and communicate the risk associated with hydro-logic events (HE) such as flooding or drought, one must clarify the concept of uncertainty. The uncertainty in hydrological and environmental modeling has been considered for some time (Beven 1993; 2002; Walker et al. 2003; Brown 2004; 2010) and the need for a general theory of uncertainty was introduced by Lofty Zadeh (2005). To move from uncertainty as a property for informational exchange in engineering (Zadeh 2005), decision support systems (Walker et al. 2003) and mathematical theories (Dubois and Prade 2010) to the uncertainty for HE, one must consider that uncertainty has to be part of scientific knowledge and communication. Keith Beven lifted the consideration from errors in data and model generalization (Beven 1993) to a learning process (Beven 2007); I agree with him and see this learning as part of a more general process of commu-nication. To consider learning in a wider approach, I define the system that oper-ates with and communicates information in hydrology as: researcher – models maker – stakeholder (scholar). To understand the system’s functions, I trace the change of our knowledge through every interaction of that system. (See Table 1).
The Upper Missouri River basin (UMRB) has become the subject for examin-ing uncertainty when applied to HE in a river watershed. The time-spatial vari-ability of river runoff for UMRB was completed within the central contiguous U. S. (CCUS). The statistical learning (SL) approach was used to analyze the empirical data (Vapnik 1998) of stream runoff for both CCUS and UMRB. SL produces quantitative results in the broader context of artificial intelligence. For UMRB, the SL, based on mathematical models (e.g., empirical principal com-ponents, linear multi-regressions, simplified Fourier, shifts) and applied to a 46 time-series, allows the following: (1) the multidimensional time-spatial UMRB river discharge structure reflecting 30% - 78% of the variability in empirical data, (2) this structure is a “recovered” regional and seasonal discharge in the UMRB, (3) the variability of time-spatial structure defined by interannual and seasonal structures of a typical time-series for the units of regionalization, (4) the typical time series of river discharge presented as a three- of four-dimensional seasonal structures which reflects (explains) 79% - 83% of the variability in empirical data, and (5) oscillations extracted in the same time series which allow better
254 Proceedings of the South Dakota Academy of Science, Vol. 91 (2012)
characterization and forecasting of time variability. The time-spatial hydrological structure obtained for UMRB fits fairly well within a similar structure for the larger area of CCUS (a 103 time-series). This fit allows one to use a 100-year time series of river discharge (USGS gauging station #06591500) to study sea-sonal and interannual variability as typical for matching units of regionalization between both UMRB and CCUS. The time series has three seasons containing unequal numbers of months (winter: October – March; spring: April – May, and summer: June – September), and reflecting 38%, 12% and 34% of the annual variability respectively for the interval of analysis. The interannual variability for every season differs in trends and shifts; only the summer season (June – Sep-tember correlated well with annual discharge (r = 92%). Two different analyses (simplified Fourier and Wavelets), when applied to the annual values of this time series, showed good agreement with oscillations, having periods of 14, 17 and 24-25 years. Although the oscillations reflect a very small part of the variability in the time series, the composition of those oscillations in the model characterize the main shifts in the time series.
The variability of regional river runoff at two different scales for two areas (UMRB is included as a part of CCUS) has been studied and presented in two matching time-spatial hydrological structures (fuzzy structures). The results of the analysis for both regions and time series must be considered in the SL ap-proach as partial knowledge of system behavior. The knowledge of structures is incomplete because of variability, even though the variability is captured by dif-ferent mathematical models and time spatial scales. The ability of mathematical models to demonstrate the variability in empirical observations is considered to be the extraction of knowledge from a natural system, the watershed in this case. The conceptual model plays a primary role in communication as pre-knowledge for formulating the research tasks and choosing the analytical tools. The proper-ties of this model are strictly formal (mathematical), however, to quantify the model, we must use SL with partial explanation of variability.
Uncertainty in this case is the un-reflected by the model part of variability contained in the initial matrix of empirical data for the watershed. Uncertainty is the property of our interaction with natural systems (watershed) and the com-munication of the obtained results. The definition of uncertainty will extend the views of David Bohm (1982) on the reality and properties of the universe (hidden dimensions, consciousness, and wholeness) to objects of study (water-shed) in scales of 104-109 m. The properties of the human mind to reflect reality [hologram of Bohm (1982) and cognitive fuzzy structures of Tenenbaum et. al. (2011)] are the basis for knowledge and communication. To deal with the un-certainty of HE in a given river watershed, one must consider the definition and properties of the systems of coordinate being used. (See Figure 1).
LITERATURE CITED
Beven, K.J. 1993. Prophecy, reality and uncertainty in distributed hydrological modeling. Advances in Water Resources 16:41-51.
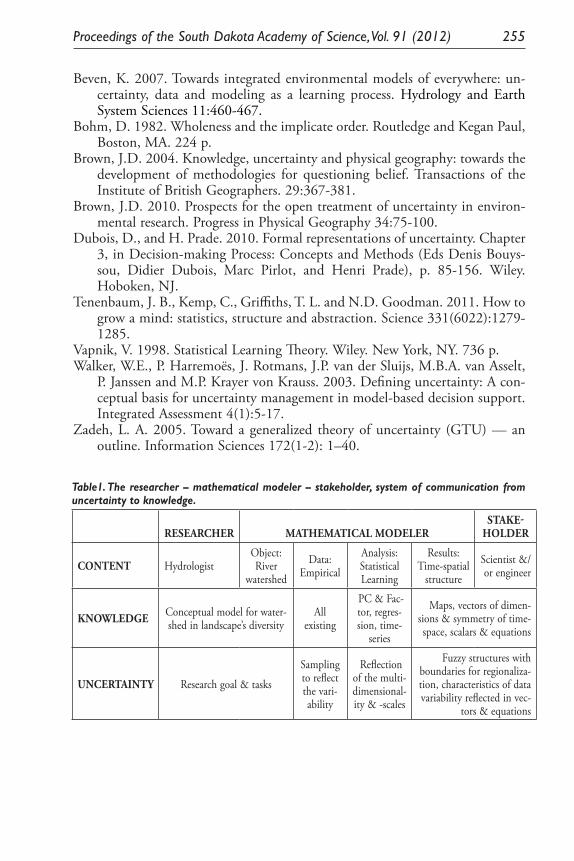
Proceedings of the South Dakota Academy of Science, Vol. 91 (2012) 255
Beven, K. 2007. Towards integrated environmental models of everywhere: un-certainty, data and modeling as a learning process. Hydrology and Earth System Sciences 11:460-467.
Bohm, D. 1982. Wholeness and the implicate order. Routledge and Kegan Paul, Boston, MA. 224 p.
Brown, J.D. 2004. Knowledge, uncertainty and physical geography: towards the development of methodologies for questioning belief. Transactions of the Institute of British Geographers. 29:367-381.
Brown, J.D. 2010. Prospects for the open treatment of uncertainty in environ-mental research. Progress in Physical Geography 34:75-100.
Dubois, D., and H. Prade. 2010. Formal representations of uncertainty. Chapter 3, in Decision-making Process: Concepts and Methods (Eds Denis Bouys-sou, Didier Dubois, Marc Pirlot, and Henri Prade), p. 85-156. Wiley. Hoboken, NJ.
Tenenbaum, J. B., Kemp, C., Griffiths, T. L. and N.D. Goodman. 2011. How to grow a mind: statistics, structure and abstraction. Science 331(6022):1279-1285.
Vapnik, V. 1998. Statistical Learning Theory. Wiley. New York, NY. 736 p.Walker, W.E., P. Harremoës, J. Rotmans, J.P. van der Sluijs, M.B.A. van Asselt,
P. Janssen and M.P. Krayer von Krauss. 2003. Defining uncertainty: A con-ceptual basis for uncertainty management in model-based decision support. Integrated Assessment 4(1):5-17.
Zadeh, L. A. 2005. Toward a generalized theory of uncertainty (GTU) –– an outline. Information Sciences 172(1-2): 1–40.
Table1. The researcher – mathematical modeler – stakeholder, system of communication from uncertainty to knowledge.
RESEARCHER MATHEMATICAL MODELERSTAKE-
HOLDER
CONTENT HydrologistObject: River
watershed
Data:Empirical
Analysis: Statistical Learning
Results: Time-spatial
structure
Scientist &/or engineer
KNOWLEDGE Conceptual model for water-shed in landscape’s diversity
Allexisting
PC & Fac-tor, regres-sion, time-
series
Maps, vectors of dimen-sions & symmetry of time-space, scalars & equations
UNCERTAINTY Research goal & tasks
Sampling to reflect the vari-ability
Reflection of the multi- dimensional-ity & -scales
Fuzzy structures with boundaries for regionaliza-tion, characteristics of data variability reflected in vec-
tors & equations
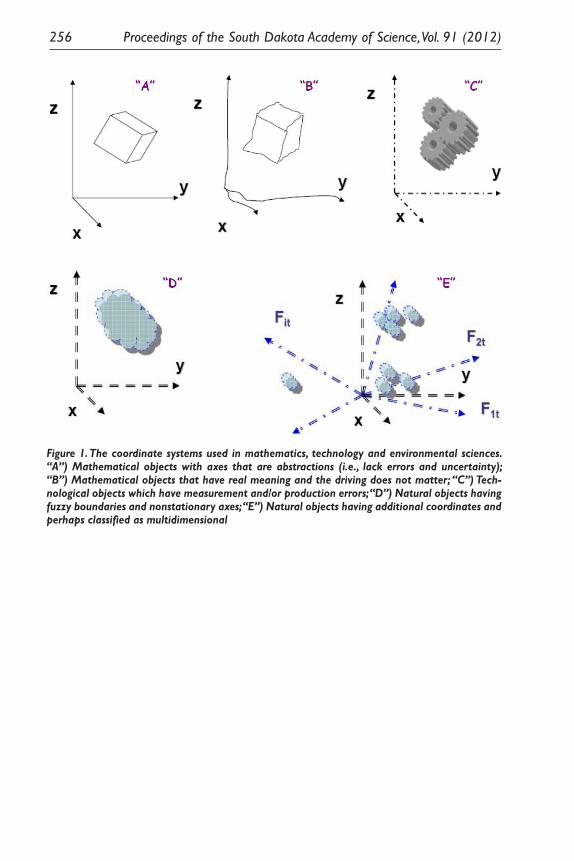
256 Proceedings of the South Dakota Academy of Science, Vol. 91 (2012)
Figure 1. The coordinate systems used in mathematics, technology and environmental sciences. “A”) Mathematical objects with axes that are abstractions (i.e., lack errors and uncertainty); “B”) Mathematical objects that have real meaning and the driving does not matter; “C”) Tech-nological objects which have measurement and/or production errors; “D”) Natural objects having fuzzy boundaries and nonstationary axes; “E”) Natural objects having additional coordinates and perhaps classified as multidimensional
Figure 1. The coordinate systems used in mathematics, technology and environmental sciences. “A”) Mathematical objects with axes that are abstractions (i.e., lack errors and uncertainty); “B”) Mathematical objects that have real meaning and the driving does not matter; “C”) Technological objects which have measurement and/or production errors; “D”) Natural objects having fuzzy boundaries and nonstationary axes; “E”) Natural objects having additional coordinates and perhaps classified as multidimensional
Proceedings of the South Dakota Academy of Science, Vol. 91 (2012) 257
UNCERTAINTY OF HYDROLOGIC EVENTS UNDER SOUTH DAKOTA’S CHANGING CONDITIONS: A RESEARCH AGENDA
Matthew Biesecker1, Ralph Erion2, Chris H. Hay3, Geoffrey M. Henebry4, Carol A. Johnston5, Jeppe H. Kjaersgaard6,
Boris A. Shmagin6*, Evert Van Der Sluis7, William Capehart8, Andrei P. Kirilenko9, Nir Y. Krakauer10, Mark Sweeney11, and Alexey A. Voinov12
1Department of Mathematics and Statistics 2Department of Teaching, Learning and Leadership
3Department of Agricultural and Biosystems Engineering 4Geographic Information Science Center of Excellence
5Department of Natural Resource Management 6Water Resources Institute
7Department of EconomicsSouth Dakota State University
Brookings, SD 57007-3510 8Department of Atmospheric Sciences
South Dakota School of Mines and TechnologyRapid City, SD 57701
University of North Dakota9Department of Earth Systems Science and Policy
University of North DakotaGrand Forks, ND 58202-90111
10Department of Civil EngineeringCity College of New York
New York, NY 1003111Department of Earth Sciences
University of South Dakota Vermilion, SD 57069
12Faculty of Geo-Information Science and Earth ObservationUniversity of Twente
P.O. Box 217, 7500 AE Enschede The Netherlands
*Corresponding author email: [email protected]
ABSTRACT
Widespread flooding across South Dakota in 2011 has spurred a new look at the institutional, regulatory, and mathematical models used to manage the Upper Missouri River Basin as it affects all aspects of life in South Dakota. An SD EPSCoR planning grant was awarded to a team of local, national and inter-national researchers, who produced a strategy to create a research infrastructure with the goal of developing conceptual and mathematical models to understand and describe the uncertainty of hydrological events (HE) across South Dakota.
258 Proceedings of the South Dakota Academy of Science, Vol. 91 (2012)
The strategy involves two main tasks: 1) planning for study of the uncertainty of HE in the Upper Missouri Basin (Shmagin, B. 2011. Missouri River watershed: the object for hydrological study and uncertainty of models. Available from Na-ture Precedings at <http://precedings.nature.com/documents/6537/version/1>. [Accessed Oct 3, 2012].)
and 2) developing concepts for communicating uncertainty of HE for wider use outside the professional community. The plan brings together a variety of disciplines, and outlines the development of an artificial intelligence approach to analyzing the interaction of HE, engineering installations and social systems in South Dakota.
The focus of study is the system hydrological researcher – mathematical mod-eler – stakeholder, and the process considered is the interaction of knowledge with uncertainty in application to HE. Uncertainty in HE will be defined using concepts broader than hydrology (such as statistical learning) and linked to the concerns of all social, cultural and economic sectors in South Dakota.
Considering this system of interacting participants allows focusing on the principal stages in tackling uncertainty, from developing the research task and obtaining the hydrological results to communication between researcher and stakeholder. Mathematical models are the universal language in scientific re-search and will be adapted to bring the results to stakeholders. Three mathemati-cal approaches to modeling HE and impacts to South Dakota will be considered: 1) distributed system interactions, 2) statistical learning and 3) cellular automata.
Specific concepts of uncertainty for modeling watersheds and describing the time-space variability of water cycles and budget for regional hydrologic study were developed. These concepts include remotely sensed data use, scale and influence of drainage and irrigation on the groundwater regime and hydrology of wetlands and lakes in the Missouri River Valley and Prairie Pothole Region. Additional necessary concepts concern risk assessment and HE interaction with the sociology and economy (e.g., types and scales of regionalization of the physical and human environment), and the design of interactive simulation models (e.g., cartographic presentation and simplified educational modeling after A. Voinov [Voinov, A. 2008. Systems Science and Modeling for Ecological Economics. Academic Press, NY. 432 pages.]) of HE in the natural landscapes and industrial/changed condi-tions in South Dakota.
South Dakota’s economy and the wellbeing of its citizens depends greatly on natural conditions and events, thus South Dakota will benefit from a program working for improved evaluation and visualization of the risk associated with HE and improved reliability of information pertaining to irrigation and drainage, water management, and crop insurance. The first results obtained in dealing with uncertainty for HE via the planned research infrastructure will be expanded to fully include socio-economic research.
Given the developed regional, sub-regional and site specific information and specification, we propose that South Dakota create a research infrastructure inte-grating the intellectual potential dispersed in the state’s academic institutions: 1) to seek out and apply new developments from federal agencies and from interna-tional bodies, adopting these methods to natural and socio-economic conditions and industries specific for the state; 2) to trace the effect of HE on the history

Proceedings of the South Dakota Academy of Science, Vol. 91 (2012) 259
of socio-economic relations and changes and present the scale of those changes; and 3) to develop new media to visualize HE and their associated dangers and then to bring those developments to communities, K12 educational institutions and USDA Extension Service to explain the effect of HE and the concept of risk in dealing with them.


Titles Only of
Senior Research Papers and
Symposium Papers and Posters
presented at
The 97th Annual Meeting
of the
South Dakota Academy of Science

Proceedings of the South Dakota Academy of Science, Vol. 91 (2012) 263
A Framework for Sustainability in Science Education. Matthew L. Miller. South Dakota State University
Service Learning to Support Sustainability. Panelists – Paul Fokken, Mary Moeller, Brooke Sydow, and Elizabeth Tolman. South Dakota State University
Sustaining Success – Setting up Students to Succeed in College. Krisma D. DeWitt and Paul Kuhlman. Mount Marty College and Avon High School
Photofragmentation Pathway of Tris(trimethylsilyl)amide Lanthanide Pre-cursors during the Laser-assisted MOCVD Process. Qingguo Meng, Jiangchao Chen, Andrew M. Hochstatter, P. Stanley May, Mary T. Berry. University of South Dakota.
Latest News on Neutrino Properties. J. TM. Goon et al. University of South Dakota
Geant4 Applications in Experimental Physics. Wenzhao Wei. University of South Dakota.
Security Printing Using Upconverting Nanoparticle Inks. Jeevan Manikyarao Meruga, William Cross, P. Stanley May, QuocAnh Luu, Tyler Blumenthal, and Jon J. Kellar. South Dakota School of Mines & Technology and University of South Dakota.
Synthesis and Thermal Characterization of Carboxylic Acid Encapsulated Silver Nanoparticles for Direct Write Technology Applications. Krish-namraju Ankireddy, Swathi Vunnam, Jon Kellar, and William Cross. South Dakota School of Mines and Technology.
Surface Chemistry in Nanoparticulate Ink Direct Write Systems. Swathi Vun-nam, Krishnamraju Ankireddy, Jon Kellar, and William Cross. South Dakota School of Mines and Technology.
Sensitization of Eu3+ Luminescence in 5% Eu:YPO4 Nanocrystals. Jiangchao Chen, Qingguo Meng, P. Stanley May, Mary T. Berry, and Cuikun Lin. University of South Dakota.
Does Sound Matter? The Influence of Stridulation in Competition for Car-rion Resources in Burying Beetles. A.L. Conley, C.L. Hall, D.R. Howard, and A.C. Mason. Augustana College.
The Effect of Wind Turbine-induced Vibration on the Reproductive Behavior of the Endangered American Burying Beetle (Nicrophorus americanus). Christina H. Johnson, Courtney L. Moore, Carrie L. Hall, and Daniel R. Howard. Augustana College.
Reproductive Trade-Offs in the Burying Beetle Nicrophorus marginatus: Does Parental Competitive Environment Influence Offspring Sex Ratio or Brood Size Dynamics? Brooke K. Woelber, Anna B. Bahnson, Carrie L. Hall, and Daniel R. Howard. Augustana College.
Vibrational Signaling in the Cook Strait Giant Weta (Deinacrida rugosa). Courtney L. Moore, Rebecca K. Schieffer, Ashley P. Schmidt, Claire E. Bestul, Andrew C. Mason, Carrie L. Hall, and Daniel R. Howard. Augustana College.
Male Acoustic Advertisement Patterns and Female Mate Choice in the Lek-mating Prairie Mole Cricket (Gryllotalpa major Saussure). Ashley P. Schmidt, Clair E. Bestul, Courtney L. Moore, Brooke K. Woelber, Carrie L. Hall, and Daniel R. Howard. Augustana College.
264 Proceedings of the South Dakota Academy of Science, Vol. 91 (2012)
The Interactive Effects of Climatic Variation and Land Use Change on In-creased Streamflow and Channel Adjustment within an Agricultural Watershed. Matthew J. Ley and Mark D. Dixon. University of South Dakota.
Projecting Long-term Landscape Change along the Missouri River: Implications for Cottonwood Forests and Bird Populations. C. L. Merkord, M. D. Dixon, D. L. Swanson, W. C. Johnson, and A. Benson. University of South Dakota.
Ephrin B1 in Immune Stimulation. Kara Prussing, Paola Vermeer and John Lee. Augustana College.
Investigating Epigenetic Regulation of Water-use Related Genes in Tomato. Kelly Wong, Steven Matzner, Eric Richards and Jed Sparks. Augustana Col-lege.
Histological Examination of NMDAR NR3 Subtypes in the Rat Kidney. Sarah Zokaites, and Karen A. Munger. Augustana College.
Whole Brain Monoamine Detection and Manipulation in a Stalk-eyed Fly. Andrew Bubak, John Swallow, and Kenneth Renner. University of South Dakota.
Size Matters, but so Does Shape: Quantifying Complex Shape Changes in a Sexually Selected Trait in Stalk-eyed Flies. Amy M. Worthington, Chelsea M. Berns, and John G. Swallow. University of South Dakota.
Role of Drp1 and Mitochondrial Fission in Mediating Sensitivity of Cancer Cells to Metformin-induced Cell Death. Rebecka Bogue, Allie Haugrud, and Keith Miskimins. Augustana College.
Sulforaphane Regulation of Cellular Redox and Growth. Cody J. Lensing, and Peter F. Vitiello. Augustana College.
Molecular Characterization of the Interactions of Galectin-1 and SUSD2 in Breast Cancer. Ashley Weber, Allison Watson, and Kristi A. Egland. Augustana College.
Nuclear Localization of the a1B-Adrenergic Receptor Subtype is Required for Hypertrophic Signaling in Cardiac Myocytes. Erika Dahl, Steven C. Wu, Andrew L. Cypher, Chastity L. Healy, Casey D. Wright, Yuan Huang, and Timothy D. O’Connell. Augustana College.
Exogenous Modification of Platelet Membranes with the Omega-3 Fatty Acids DHA and EPA Impairs Thrombogenesis. Nicole M. Ensz, Carl E. Hjelmen, Leah S. McComas, Garth W. Tormoen, Ishan A. Patel, Owen J.T. McCarty, and Mark K. Larson. Augustana College.
Multispecies Oral Bacterial Communities: Defining the Mechanism of Communication Between Streptococcus gordonii and Veillonella atypica. Wadie Mahauad Fernandez, Rebecca Joerger, Michael Edgington, and Paul Egland. Augustana College.
Characterization of Immunomodulatory Effects Between SUSD2 and Galectin-1 Protein Expression in Epithelial Ovarian Cancer. Jackie Miles, Emily Johnson , Sam Evenson, Ashley Weber, Allison Watson, Kristi Egland, and Jennifer A. A. Gubbels. Augustana College.
Mapping Quantitative Trait Loci for Plant Height in a Maize Population. James Wassom. Unaffiliated.
Proceedings of the South Dakota Academy of Science, Vol. 91 (2012) 265
Synthesis of 3-Pyridylmethyl Glucosinolate from 3-Pyridylacetonitrile. Joseph W. Keppen, Jordan J. Clark, and Jared R. Mays. Augustana College.
Core-Shell Quantum Dots Utilized in the Detection of Proteins. Seth Adrian, Kristen Luepke, and Barrett Eichler. Augustana College.
Synthesis and RP-HPLC Monitored Hydrolysis of Non-natural Glucosino-lates. Kayla Vastenhout and Jared R. Mays. Augustana College.
Sprectroscopic Study of the Ionic Liquid 1-Butyl-3-Methylimidazolium Chloride (BMICl). Yulun Han, Aravind Baride, Cuikun Lin, P. Stanley May, and Mary T. Berry. University of South Dakota.
Soluble Luminescent 2,3,4,5-Tetraarylsiloles: Synthesis and Characteriza-tion for use in OLED Devices. B. J. Jackson and B. E. Eichler. Augustana College.
Cottonwood Forests along the Missouri River: Historical Changes and Cur-rent Status. Mark D. Dixon, Michael L. Scott, W. Carter Johnson, Daniel Bowen, and Lisa A. Rabbe. University of South Dakota.
Development of Silver Nanoparticle Based Conductive Ink for Direct-Write Process Using M3D. Ravi Shankar, A. Amert, Jon J. Kellar, and Keith W. Whites. South Dakota School of Mines and Technology
Avian Response to a Landscape Undergoing Restoration in Eastern South Dakota. L. M. Erickson, K.C. Jensen, and W.C. Johnson. South Dakota State University.
Thermochemical Water-splitting for H2 Generation Using Sol-gel Synthe-sized Mn-doped Ferrites. R. R. Bhosale, X. Pasala, S. S. Yelakanti, J. A. Puszynski, and R. V. Shende. South Dakota School of Mines and Technology.
The Effects of Different Habitat Types on Raptor Electrocutions and Colli-sions with Power Lines in the Black Hills. Ashley A. Hrabe and Kent C. Jensen. South Dakota State University.
Habitat Selection of Four Owl Species in Eastern South Dakota. Brianna Graff and Kent C. Jensen. South Dakota State University.
The Effect of Wind Turbine-induced Vibration on the Reproductive Behav-ior of the Endangered American Burying Beetle (Nicrophorus america-nus). Christina H. Johnson, Courtney L. Moore, Carrie L. Hall, and Daniel R. Howard. Augustana College.
Affinity of Functionalized Nanoparticles for Human Tooth Enamel. A. Horn and G. Sereda. University of South Dakota.
Thin Film Deposition and Photodissociation Mechanisms for Lanthanide Oxide Production from Tris(2,2,6,6,-Tetramethyl-3,5-Heptanedionato) Ln(III) in Laser-Assistant MOCVD. Yajuan Gong*and Mary T. Berry. University of South Dakota.
Fast Marching Algorithm for Reaction Dynamics: A New Perspective for Monte Carlo Sampling and Reaction Paths. Nathan Truex and Bijoy Dey. Augustana College.


Proceedings of the South Dakota Academy of Science, Vol. 91 (2012) 267
INSTRUCTIONS FOR AUTHORSEditorial Policy: The South Dakota Academy of Science is a forum for the promotion of scientific teaching, research, and service in the state of South Dakota. The South Dakota Academy of Science meets each spring for the purpose of annual business, awards, and the interchange of ideas, information, and results from scientists and students of science. The minutes of the annual meeting and the abstracts of presentations are published annually in the Proceedings of the South Dakota Academy of Science. In many cases, authors choose to submit a full manuscript of their presenta-tion, which is published in lieu of the abstract. Deadlines for submission of full manuscripts are July 15 each year; to submit manuscripts, please adhere to the Submission Procedures listed below. Authors have the option of purchasing additional reprints; information on page and reprint charges will accompany the page proofs sent to the corresponding author. The following guidelines provide instructions for authors submitting manuscripts to the Proceedings. Be aware that these guidelines may vary from year to year, so please try to format your manuscript so that it meets the conventions described below.
Authorship Policy: The following is the policy on authorship of abstracts and manuscripts to be published in the Proceedings:
1) All papers published in the Proceedings of the South Dakota Academy of Science will include all authors that were shown on originally submit-ted abstracts or manuscripts.
2) Any request to change authors after a submission has been made to the Proceedings must be accompanied by a brief letter of explana-tion sent to the editor that includes the original signature of all authors (including authors removed from or added to the authorship list).
3) The deadline for requesting changes in authorship is 30 August of the year of submission.
Manuscript Submission Procedure: Manuscripts submitted for publication in Proceedings must be accompanied by two technical reviews. Authors are required to solicit reviewers that have expertise in the topic area of the manuscript. Co-authors of manuscripts are not considered reviewers. Each reviewer must provide their name, title, address, and phone number along with a brief review of the manuscript; to facilitate this process, the reviewers should use the Peer Review Form that can be downloaded from the Academy’s web site (http://sdstate.edu/sdas/). In turn, authors must provide a brief reconciliation letter describing how reviewer comments were addressed along with a final, revised copy of the manuscript. The submission package must include the following: 1) two technical reviews (Peer Review Forms), 2) written reconciliation from authors, and 3) revised manuscript. Failure to adhere to the submission procedure will result in manuscripts being returned to authors.
Submission of abstracts for publication in the Proceedings do not need to be peer-reviewed.
Abstracts or manuscripts may be submitted either electronically or by mail. Please do not submit abstracts or manuscripts both electronically and by mail.
Electronic submission:Electronic submissions should be forwarded to Robert Tatina at [email protected]. Manuscripts should be saved as MS Word files that include tables and/or figures. Reviewer comments and the author(s) reconciliation statement must be submitted as separate files (MS Word) along with the manuscript. Manuscript illustration files that have the extension .BMP, .GIF, .EPS, .JPG, .TIF, or .PCX are acceptable. IMPORTANT: Begin all file names with the corresponding author’s last name (e.g., Chipps_ms.doc, Chipps_review1.doc, Chipps_review2.doc, Chipps_reconcil.doc).
Mail submission:Manuscripts may be submitted by mail by including one hardcopy and one electronic copy (3.5” disk or CD) of each manuscript. Hardcopies of reviewer’s comments and reconciliation statement must also be included. Each diskette or CD should be identified with authors’ names and by the format used. Submit all information in MS Word. Illustration files that have the extension .BMP, .GIF, .EPS, .JPG, .TIF, or .PCX are acceptable. Begin all file names with the corresponding author’s last name (e.g., Chipps_ms.doc).
Mail manuscript submissions to:
Robert Tatina, Proceedings Editor 704 South MontanaMitchell, SD 57301
Phone: 605-996-7670E-mail: [email protected].
Membership. The author or one co-author of each abstract or paper must be a current member of the South Dakota Academy of Science.
Web Site Address. http://sdaos.org
Format Conventions: All manuscripts and abstracts should be single-spaced throughout including tables and the literature cited section. All pages should be numbered serially in the upper right-hand corner. Use a 1-inch margin all around but do not justify the right margin or hyphenate words on the right margin (i.e., use word wrap). Avoid footnotes in both articles and abstracts. Use metric measurements unless English units are clearly more appropriate, in which case metric equivalents must appear in parentheses. Give scientific names for all species the first time the species’ com-mon name is used as follows: Culver’s root (Veronicastrum virginicum). Write out numbers under 10, except in a series with numbers > 10 or with measurements or percentages. Statistical terms and other measures should conform with the Council of Science Editors Scientific Style and Format (e.g., t = 0.311, df = 33, P = 0.001, note italics, capital P and spaces before and after =). Finally, double space between sentences.
Manuscript Components:
TITLE PAGEAll manuscripts should include a title page that includes the author name(s), affiliation(s), and current mailing address(es). Here are the components and style of the title page:

268 Proceedings of the South Dakota Academy of Science, Vol. 91 (2012)
Microsoft Word Times New Roman, Font Size = 12Margin: Left = 0, Right = 6, Paragraph Indent = 4Title: All Caps, Bold, Centered, Font Size =14Authors: See example:
Alfred Jones1*, William Smith1 and Lawrence Porter2
1Biology DepartmentCognation University
South Chicago, IN 442302Chemistry Department
Intuition CollegeNewell, SD 57330
*Corresponding author email: [email protected]
ABSTRACTInclude a brief but informative abstract. The abstract should be a single paragraph of 200-300 words that concisely summarizes the results and conclusions of the study. The abstract should be followed by a short list of keywords (< 5). For authors submitting only an abstract, you may include a few literature citations, but please use sparingly, and enclose them in parentheses within the text of the abstract.
INTRODUCTIONThe introduction should include sufficient detail to establish the purpose and importance of the work being summarized. It should include pertinent literature related to the study question and end with a statement of the objectives/hypotheses being examined.
METHODSThe methods should include sufficient information for the reader to evaluate the data or repeat the study. It is better to be inclusive (i.e., overly explicit) when describing the methods used, but keep in mind that clarity and conciseness are important.
RESULTSResults follow the methods section and should include a concise summary of your findings. Be careful not to ‘discuss’ implications of results; reserve these points for the Discussion section. Results that are presented in tables or figures should not be exhaustively discussed in the text. When statistics are presented they should be explicit (e.g. t = 34.07, df = 48, P = 0.003).
DISCUSSIONThe common trait among good scientific papers is a well-written discussion section. The discussion section is where you synthesize what has been learned from the study and provide direction or generalities for future studies. The discussion section should not be merely a summary of relevant literature linked to restatements of your results. Rather, it should be an informative essay that advances what is known about the subject area. Be careful, however, not to extend the discussion beyond what can be supported by the data reported in the results.
LITERATURE CITED. All references cited in the text should be listed at the end of the manuscript under the Literature Cited heading. References should be in alphabetical order by the last name of the author(s). If different works by the same author(s) are referenced, references should be in chronological order. Authors cited in the text of abstracts or papers should be indicated in parentheses by last name and year of publication (e.g., Wade 1967; Bremer 1977). When a citation has more than two authors, the last name of the first author followed by et al. should be used (e.g., Seabloom et al. 1978). Where two or more papers by the same author(s) have appeared in one year, the style should be (Stewart 1967a, 1967b). Citations included in abstract only submissions should be complete and included within the text of the abstract.
Examples of Literature Cited
Bremer, P.E. 1977. Pelican kill. Loon 49:240-241.Gipson, P.S., I.K. Gipson, and J.A. Sealander. 1975. Reproductive biology of the bobcat (Lynx rufus). Journal of Mammalogy 56:605-612.Green, J.C., and R.B. Janssen. 1975. Minnesota birds: where, when, and how many. University of Minnesota Press, Minneapolis, MN. Stewart, A.V., A. Joachimiak and N. Ellison. 2009. Genomic and geographic origins of timothy (Phleum sp.) based upon ITS and chloroplast
sequences. Pages71-81in T. Yamada and G. Spangenberg, editors. Molecular breeding of forage and turf. Springer, New York, NY.Svihovec, L.K. 1967. A comparison study of the ecological distribution of small mammals in southwestern North Dakota. Thesis. University of
North Dakota, Grand Forks, ND.
(For Internet citations, include as much information as possible so that readers could access the material cited. Also include “Available at” and then include the URL in italics. Finally, add in square brackets the date you accessed the URL [Cited 6 June 2010].
Tables, Figures, Illustrations and Photographs. Tables should be double spaced throughout, without vertical lines, and with page numbers in the upper right-hand corner. If tables are more than one page in length, put “Table x. continued” on all subsequent pages. Each table should begin with a Table number (e.g., Table 1, Table 2, etc…) followed by a descriptive caption which is separated from the table headings and data by a horizontal line. Tables must be referenced in the text.
Figures should be done with black ink on firm quality paper or if computer generated, they should be of camera-ready quality (laser printer) with sharp lines suitable for reproduction. Photographs should be 5x7-inch, sharp, black and white glossy prints. When appropriate, a legend of symbols, etc., scale and a cardinal direction (e.g. North) should be indicated on figures of maps. On the back side, identify each figure or photograph lightly in pencil with the figure’s number, author(s) name(s), and an indication of the top of the figure. Figure captions should be numbered (e.g., Figure x.) and typed on a separate sheet of paper at the end of the manuscript. Letters, symbols, and legends should be large and clear enough on all figures and photographs to be legible after copy reduction. Figures must be referenced in the text.
A note on deadlines: If you cannot meet the July 15th deadline for full papers, you must send the editor a note requesting an extension. You must also request a new due date.