Embed Size (px)
Citation preview

Calibration
Techniques/Targets


N94-15575
Experience and Results of the 1991 MTLRS_I USSR Campaign
P. SPERBER
INSTITUT FUR ANGEWANDTE GEODASIE
FUNDAMENTALSTATION WETTZELL
DER FORSCHUNGSGRUPPE SATELLITENGEOD,_SIE
D-8493 K()TZTING
H. HAUCK
INSTITUT FUR ANGEANDTE GEODASIE
RICHARD-STRAUSS ALLEE II
D-6000 FRANKFURT/MAIN 70
Abstract. In the fall 1991 the Modular, Transportable Laser Ranging System MTLRS#I was operatingin the USSR for collocation of the SLR systems in Riga, Simeiz and Kazivelli. In this paper we willsummarize the results of the collocation experiments and we will show our (positive and negative)
experiences, we got during this campaign in the USSR).
1. Introduction
The year 1991 was a special year for the mobile laser ranging systems. Due to the scheduled
upgrades of the Modular Transportable Laser Ranging Systems MTLRS#1 (operated by the IfAG,
Germany) and MTLRS#2 (operated by the OSG Kootwijk, Netherlands) neither a WEGENER-
MEDLAS nor a Crustal Dynamics Project campaign was carried out in 1991.
After the successful upgrade of MTLRS#I in the first half of 1991 (P. Sperber et al.) the system
departed from Wettzell in August to make maesurements at two sites in the USSR.
In Riga/Latvia we operated close to the fixed SLR system, in Simeiz/Ucrainea the place for
MTLRS#1 pad was choosen to collocate the two fixed SLR station in Simeiz (300 m distance to
MTLRS#I) and Kasivelli (about 3 km distance).
2. Results
An overview about the number and quality of the MTLRS#1 passes is shown in Fig. 1 and Fig.
2.
The system arrived in Riga during week 32. Because the crew was not yet familiar with some
new parts of the system, which were installed during the upgrade, it took some days, before the
first data were collected successfully.
In week 34 we were faced with a problem, we never had before: In moscow parts of the soviet
army putsched against gorbatchov. Due to the unclear and dangereous political and military
situation we had to stop our observations again for nearly one week.
During the rest of measurements in Riga we were faced with extremely bad weather conditions.
All this problems are showing in an unusual poor performance of MTLRS# 1 in Riga. Neither
the quantity (number of passes per week) nor the quality (number of normalpoints per pass) was
completely satisfying.
After 43 Lageos passes we stopped the observations in Riga on October 3 rd and moved the
sytem to Simeiz.
Typeset by .AA,t-q-TEX
6-1

Here the system was able to show its habitual performance. After 53 Lageos passes with more
than eleven normalpoints per pass in average the campaign was finished on November 23 rd.
The computation of the collocation was performed by the computing center of the IfAG in
Frankfurt/Main. The results are summarized in Fig. 3 - Fig. 5.
Fig. 3 shows the results of the Riga collocation. We got 16 simuitaneos Lageos passes with a
R.M.S. of 20 cm at the Riga system and 1 cm or 2 cm at MTLBS#I depending whether a PMT
or a single photon avalanche diode (I. Prochaska et al., P. Sperber et al.) was used as receiver.
Out of this 16 passes six passes with good residual overlap (for example: Fig. 4) were selected
to calculate the range and epoch bias of the Riga SLR system. There is a small negative tendencyin both biases, but compared to the error values and the R.M.S. of the Riga system we can't finda significant bias.
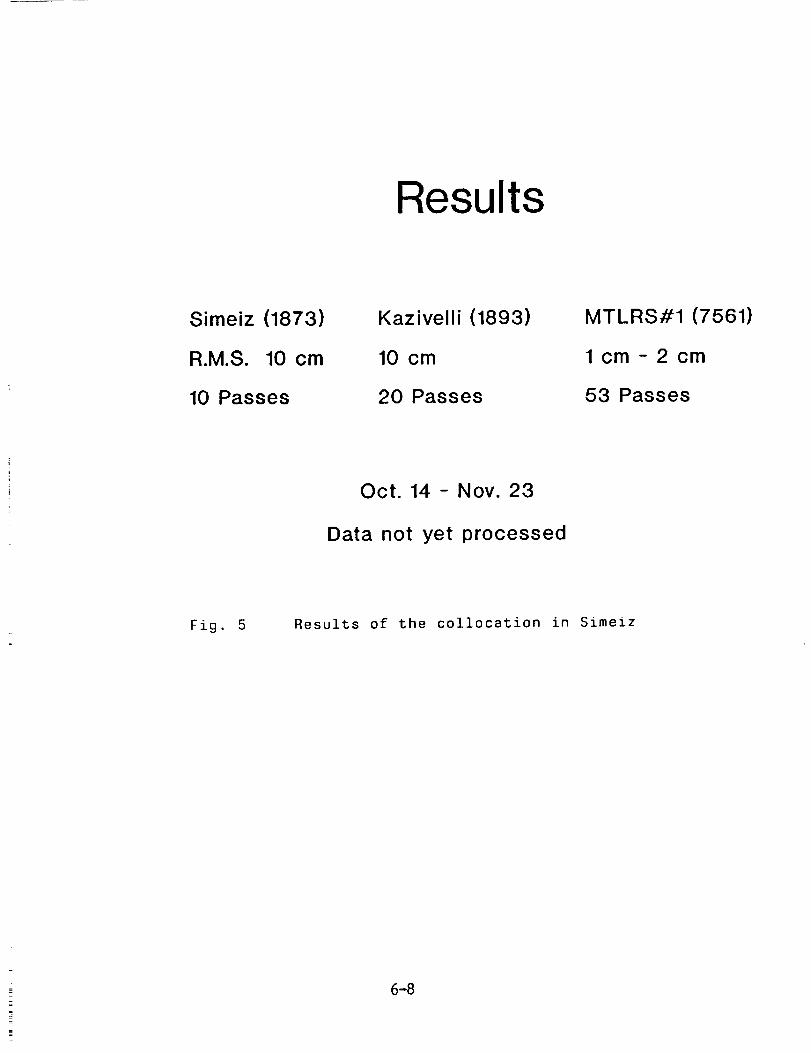
Fig. 5 summarizes the results of the collocation in Simeiz. Because of problems, the fixed
stations only were able to observe few passes during the collocation, but all of the passes weresimultaneous with MTLRS# 1.
The data of the fixed stations are not yet delivered to the network, so until now a computationwas not possible.
3. Experience
In this chapter we will summarize our experience during the on-site operartion and the transportof a dedicated geodetic system in the USSR.
2.2. Operation on stations
From the operational point of view there were no problems as long as the system was working
near stations. All our requirements concerning electrical power, safety, infrastructure, etc. were
fullfilled. In Riga also the supply of fuel and the hotel accomodation were satisfying.
On all stations an independent communication facility like Inmarsat is necessary. The only localdata channnel is a very unreliable telex line.
In Simeiz, the hotel, food and fuelsituation is very inconvenient:
• A hotel near the station is far under western standard, an acceptable one is more than 40km away.
• For fuel a big spare tank is necessary, because fuel is not always available.
• As there are no restaurants near the station, facalities are needed to prepare own food
Additionally most of the people only speak russian language.
In spite of this problems, the operation of a sir system near fixed stations is always possible, ifsome preparations are made to facilitate the life of the crew members.
2.2. Transport between stations
During the transport of a system from one station to the other the situation becomes very badcompared to the operation on stations.
• Communication channels to foreign countries are not available in short time
• Hotels only exist in big cities. Sleeping facilities for all persons in cars (caravans) are stronglyrecommended because most of the hotels are full without reservation four weeks in advance.
6-2

• Food is only available in hotels, so there are facilities necessary to cook in the cars.
• Security is a big problem, day and night guards are absolutely necessary.
• Fuel is not always availble, therefor big fuel tanks are needed in the ears.
• Car repair is possible, but takes a lot of time and you should have all spare parts with you.
The poeple only speak russian (or sometimes german), but are very friendly and will always try
to help if there are problems.
3. Summary
In the second half of 1991 the MTLRS#I was operating successfully in Riga and Simeiz to
collocate the fixed laser ranging stations on this places.The results of the collocation shows no significant problem at the Riga fixed slr station. The
collocation in Simeiz is not yet computed.
To operate and transport a dedicated geodetic system like MTLRS#I in in the underdeveloped
regions of the USSR big efforts and preparations are necessary to become as independent as possible
from the local infrastructure.
6-3

REFERENCES
P. Sperber, L. Amberg, L. Beyer, G. Blenski, U. Hessels, 11. Motz, in this Proceedings, Remlhj ol the MTLR5#1
Upgrscle, 199t.
I. Prochazka, K. Kamal, B. Sopko, Proceedings of the seventh international Workshop on Laser Ranging
Instrument&tion S. 219, PAotodiode Bazed Detector PackaEe ]or CentimeLer Satellite Ranglug , 1989.
P. Sperber, U. Hessels, R. Motz in this Proceedings, The new MTLRS#1 Receiver Pscka#e 199t.
6-4

NUMBER OF TRACKED PASSES
14 IILIGHT !_ NIGHT _ ALL II
II II
12 i-i ....n-m .... mm-- - _ ]
_1 410
8
6
J
1 30 32 34 36 38 40 42 44 46 48
WEEK IN 1991
Fig. 1 Number of Lageos Passes in Riga and Simeiz
NORMALPOINTS PER PASS
I E_J NIGHT ii ALL ]15 LIGHT
10
oii
0 I i t _ _ -7-
1 30 32 34 36 38 40 42 44 46 48
WEEK IN 1991
Fig. 2 Number of Normalpoints per Lageos passin Riga and Simeiz
6-5

Results
Riga (1884)
15868 Returns
R.M.S. 20 cm
MTLRS#1 (7560)
27166 Returns (43 Passes)
1 cm (SPAD) - 2 cm (PMT)
Aug. 15 - Oct. 10
16 Simultaneous Passes
Range Biasin cm
-6.1-2.5-5.1
-16.3-0.4-8.4
7560-1884 Epoch Biasin microsec
-24-30
-58-23
-4+66
7560-1884
-6.5 cm +- 5 cm -12 microsec +- 30
Fig. 3 Results of the collocation in Riga
6-6

__]<£
a:---,I
LLJ05.
RANGE RESIDUALS030
025
020
0.15
&10
0.05
0.00
-0.05
-0.10
-O.'15
-020
-025
-03072OOO
.'"'1 .... I .... I""1""1'"'1''"I'"'1 .... I .... 1'"'1 .... I .... I .... I'"'1 .... t'"'1 .... t .... I .... -
r.
!!;,t T= t<-.*,q-i - -o S I TE .,,7560 °- -
11l i" _ __'.
Y,. i,,i
,,,I .... t .... I,_a_LtJJ.a_l_LLt!!J_Jl .... I .... I .... I .... t .... I .... I .... I .... I,,,,I,,,,t_._t_J_l,,_
72250 72500 72750 73000 73250 73,..'..'..'..'._073750 74000 74250 74543C
Fig. 4 Example of a Residual plot of a collocation passbetween MTLRS-I and the Riga fixed SLR station
6-7
Results
Simeiz (1873 )
R.M.S. 10 cm
10 Passes
Kazivelli (1893)
10 cm
20 Passes
MTLRS#1 (7561)
1 cm - 2 cm
53 Passes
Oct. 14 - Nov. 23
Data not yet processed
Fig. 5 Results of the collocation in Simeiz
6-8

ETALON-15-2 CENTER OF MASS CORRECTION
AND ARRAY REFLECTIVITY
N94-15576
N.T.Mironov, A.I.Emetz
Main Astronomical Observatory of the Academy of Sciences
Ukraine_ 2521275 Kiev, Goloseevo
A.N.Zaharov, V.E.Tchebotarev
United Space Device Corporation
Russia, 111024, Moscow, Aviamotornaya st.,53
ABSTRACT. Center of mass correction to be applied to measu-
red ranges to the ETALON-1,-2 satellites are considered. Numeri-
cal values of the correction and reflectivity from retroreflector
array are computed. The variations of these values with satellite
orientation are investigated.
i. INTRODUCTION
In 1989 two identical passive satellites, ETALON-I,-2, deve-
loped for precise laser ranging measurements were launched in the
Soviet Union into nearly circular high orbits ( about 20,000 km ).
It was reported that the distance between the center of mass and
the plane of probable reflection is 558 mm ,Tatevian,1989.
To evaluate the ETALON-I,-2 satellites for Earth rotation ap-
plications5 the International Earth Rotation Service (IERS) Direc-
ting Board has announced an SLR campaign for the tracking of these
satellites. The campaign took place for three months period from
September 1, 1990 to December I_ 1990.
To discuss the various aspects of analysis of the ETALON-15-2
laser ranging data carried out at the number of scientific center_
the Institute of Astronomy of the USSR Academy of Sciences and the
Soviet Mission Control Center organized the International symposi-
um "ETALON-91" which took place in Moscow during June 3-9, 1991.
Recognizing the requirement for precise information characteriz-
ing the ETALON-I,-2 satellites, the participants of the Internati-
onal Symposium meeting in Moscow recommended
1) that complete design and orbit insertion information on
the ETALON-1,-2 satellites be released to the analyst participat-
6-9

ing in the international programs,
2) that the international community undertake experiments to
measure ETALON satellite characteristics, such as spin rate and
direction_ photometry, calorimetry and other.
We undertook the study of the center of mass correction and
array reflectivity of the ETALON satellites in order to ensure
their accuracy.
2. OPTICAL CUBE-CORNER SPECIFICATIONS
The optical cube corners on ETALON-I,-2 satellites have hexa-
gonal entrance faces, each with a width of 27.0 mm across flats.
The length from vertex to face is H=Ig.I mm. The optical cube-cor-
ners are made of fused silica and the reflecting faces are alumi-
nium coated The index of refraction of the fused silica is n =
1.455442 at _1=0.6943 Hm and n2=1.460915 at _i=0.5320 Hm.
The dihedral angles between the back faces have offsets in
order to compensate for velocity aberration. The divergence of the
cube corner is about 32 prad for half-maximum level.
3. GEOMETRY OF THE ARRAY
The ETALON satellite is a sphere 1294 mm in diameter with
2146 retroreflectors distributed over the surface (Figure I). Six
of the cube corners are made of germanium for infrared wavelength
and the others 2140 are made of fused silica for use at visible
wavelength.
The optical cube corners are arranged in 30b lattice frame
with 7 cube corners in each one. The lattice frame are mounted
over 14 separated zones. Their orientation is shown in Figure 2.
The distribution of the lattice frames and cube corners over the
zone is illustrated in Figure 3. Table I lists such distribution
for each zone.
The cube corners are recessed below the surface of the sphere
by 5.5 mm. This recession_ together with the fact that the front
face of a cube corner is flat_ places the center of the front face
of the cube corner closer to the center of the satellite than
647.0 mm radius of the satellite.
6-10
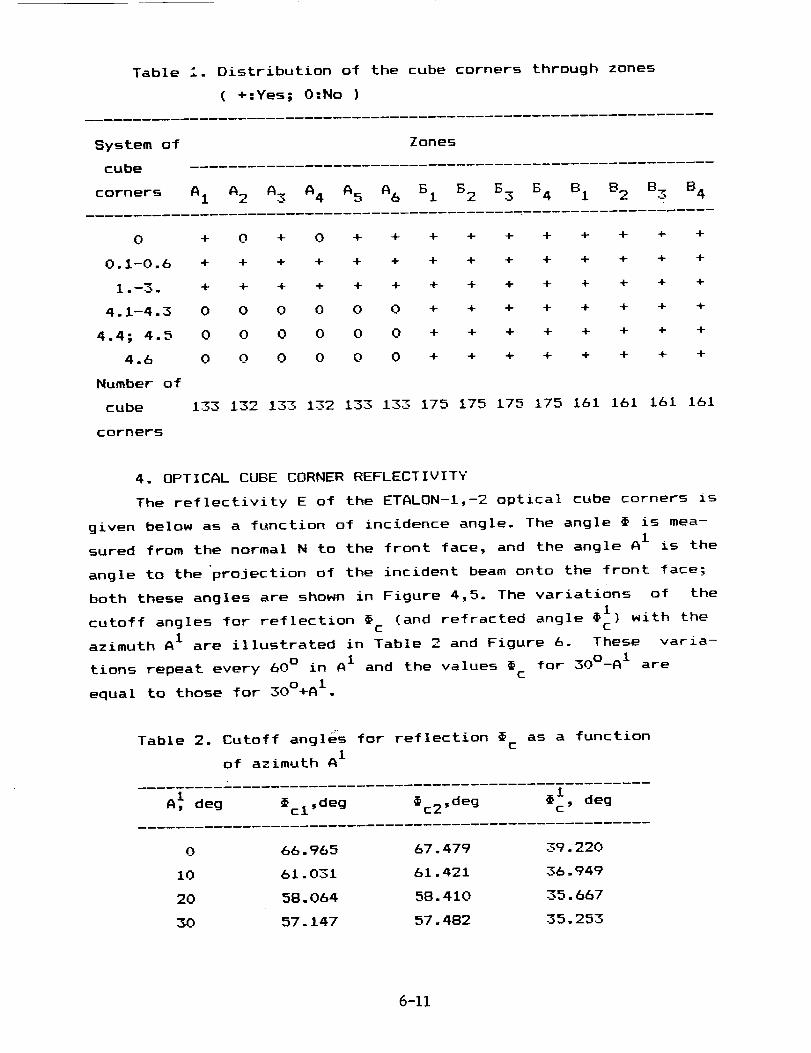
Table i Oistribution of the cube corners through zones
( +:Yes; O:No )
System of
cube
Zones
corners A I A 2 A 3 A 4 A 5 A 6 B I B 2 B 3 B 4 B i B 2 B 3 B4
0 + 0 + 0 + + + + + + ÷ + ÷ +
O. 1-0.6 + + + + + + + + + + + + + +
1.-3. + + + + + + + + + + + + + +
4.1-4.3 0 0 0 0 0 0 + + + + + + + +
4.4; 4.5 0 0 0 0 0 0 + + + + + + + +
4.6 0 0 0 0 0 0 + + + + + + + +
Number of
cube 133 132 133 132 133 133 175 175 175 175 161 161 161 161
corners
4. OPTICAL CUBE CORNER REFLECTIVITY
The reflectivity E of the ETALON-I_-2 optical cube corners is
given below as a function of incidence angle. The angle • is mea-
A Isured from the normal N to the front face_ and the angle is the
angle to the projection of the incident beam onto the front face;
both these angles are shown in Figure 4_5. The variations of the
cutoff angles for reflection • (and refracted angle ) with theC c
azimuth A I are illustrated in Table 2 and Figure 6. These varia-
tions repeat every 6n ° in A I and the values • for 30°-A I are- C
equal to those for 30°+A I.
Table 2. Cutoff angles for reflectionC
of azimuth A I
as a function
A_ deg _ deg c' degcl _ _c2,deg _1
0 66.965 67.479 39.220
10 61.031 61.421 36.949
20 58.064 58.410 35.667
30 57.147 57.482 35.253
6-11

In computing the reflectivity E it was assumed that the cube
corners had perfect-metal reflecting faces and no dihedral-angleoffset. In Figure 7 each curve is the calculated total reflecti-
vity and is proportional to the active reflecting area. The curves
include reflection losses at the front face in entering and leav-ing the cube corner by laser beam. All curves are normalized to
unity at normal incidence. The active reflecting area at normalincidence is &31.33 mm2 for a hexagonal cube corner whose width
W=27.0 mm across flats. The active reflecting area and the reflec-tivity repeat every 60 ° in A i In additional_ the values E for
30°-A i are equal to those for 30°+A I. The curves for the two dif-
ferent wavelengths are fairly similar. The results were used to
calculate the center of mass correction and array reflectivity.
5. ARRAY COORDINATE SYSTEM
The coordinate system used to describe the geometry of the
array is as follows (Figure 8).As a rule the position and orienta-
tion of each cube corner in the array are given by the six num-
bers: x, y, z B_L_A. The origin of the x-y-z coordinate system is
in the center of satellite. X_Y and Z are in the directions of the
and A zones respectively. The angles B and L arecenters AI_ A_ I 12given in an x -y -z coordinate system_ which is parallel to the
x-y-z system and the origin ks in the center of front face of each
cube corner. The azimuth angles A are given in _-_-_ coordinate
system. Its origin ks at the center of the front face_ its _ axis
normal to the front face_ _ in the direction of increasing B_ and
in the direction of increasing L. The orientation angle A ks me-
asured counterclockwise from _ axis to the projection of one of
the back edges of the cube corner onto front face_ as shown in Fi-
gure 8.
The direction of the incident beam V in the array coordinate
system is given by the angles _ and _: both these angles are shown
in Figure 8. To compute the incidence angles • and A i on the cube
corner_ the vector V must be expressed in the _-_-_ coordinate
system (Figure 8). The conversion between the coordinate systems
of the array and incident beam is accomplished by rotating the co-
ordinate system of V first about the z-axis by the angle L unti-
6-12
clockwise and then about new y-axis by the angle B clockwise.
For the ETALON-I_-2 cube corners the angles A are unknown but
the cube corners have been installed so as to give a uniform dif-
fraction divergence independent of satellite orientation. The di-
vergence of the retroreflector array is about 42 Hrad for half -
maximum level. Taking into account these aspects and the total re-
flectivity of the ETALON-1,-2 optical cube corners and their rece-
ssions_the active reflecting area of each retroreflectors has beenaveraged for AI=O°, I°,...,30 °.
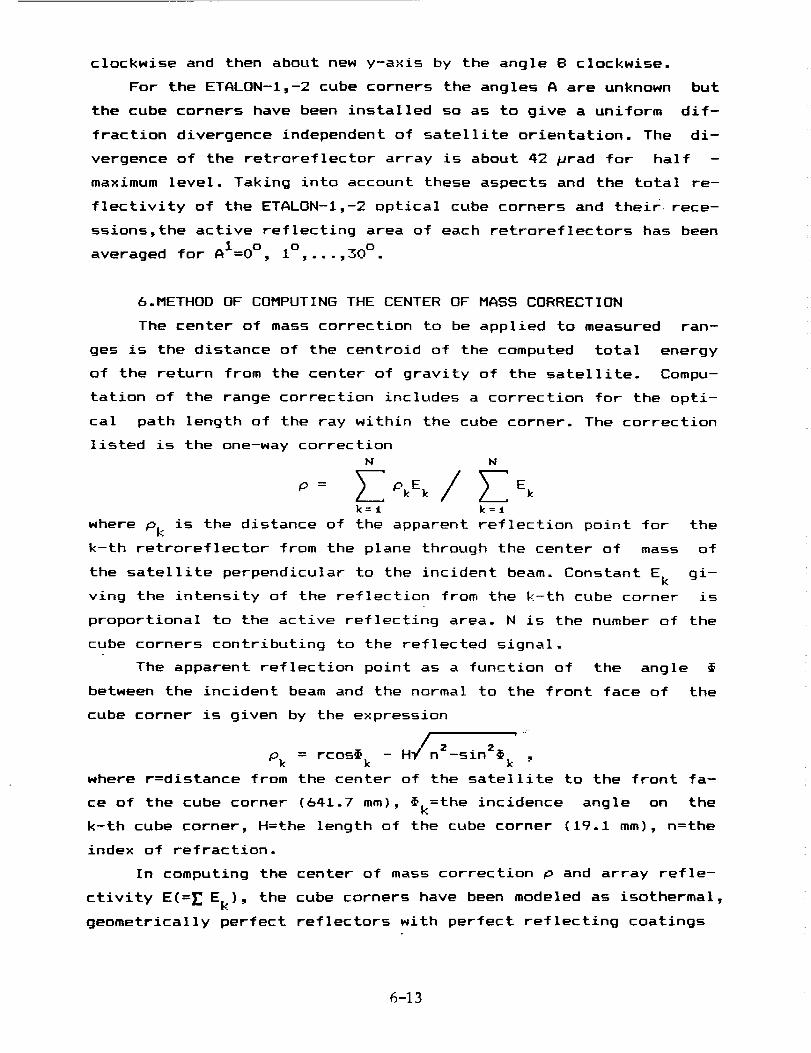
&.METHODOF COMPUTINGTHE CENTEROF MASS CORRECTION
The center of mass correction to be applied to measured ran-
ges is the distance of the centroid of the computed total energy
of the return from the center of gravity of the satellite. Compu-
tation of the range correction includes a correction for the opti-cal path length of the ray within the cube corner. The correction
listed is the one-way correction
N N
/k=l k=t
where Pk is the distance of the apparent reflection point for the
k-th retroreflector from the plane through the center of mass of
the satellite perpendicular to the incident beam. Constant E k gi-
ving the intensity of the reflection from the k-th cube corner is
proportional to the active reflecting area. N is the number of the
cube corners contributing to the reflected signal.
The apparent reflection point as a function of the angle
between the incident beam and the normal to the front face of the
cube corner is given by the expression
.-
z z_Pk = rcos_ k - H n -sin k
where r=distance from the center of the satellite to the front fa-
ce of the cube corner (641.7 mm)_ _k=the incidence angle on the
k-th cube corner, H=the length of the cube corner (19.1 mm), n=the
index of refraction.
In computing the center of mass correction p and array refle-
ctivity E(=_ Ek), the cube corners have been modeled as isothermal,
geometrically perfect reflectors with perfect reflecting coatings
6-13
on the back faces. The reflection losses at the front face as the
laser beam enters and leaves the cube corners are taken into
account.
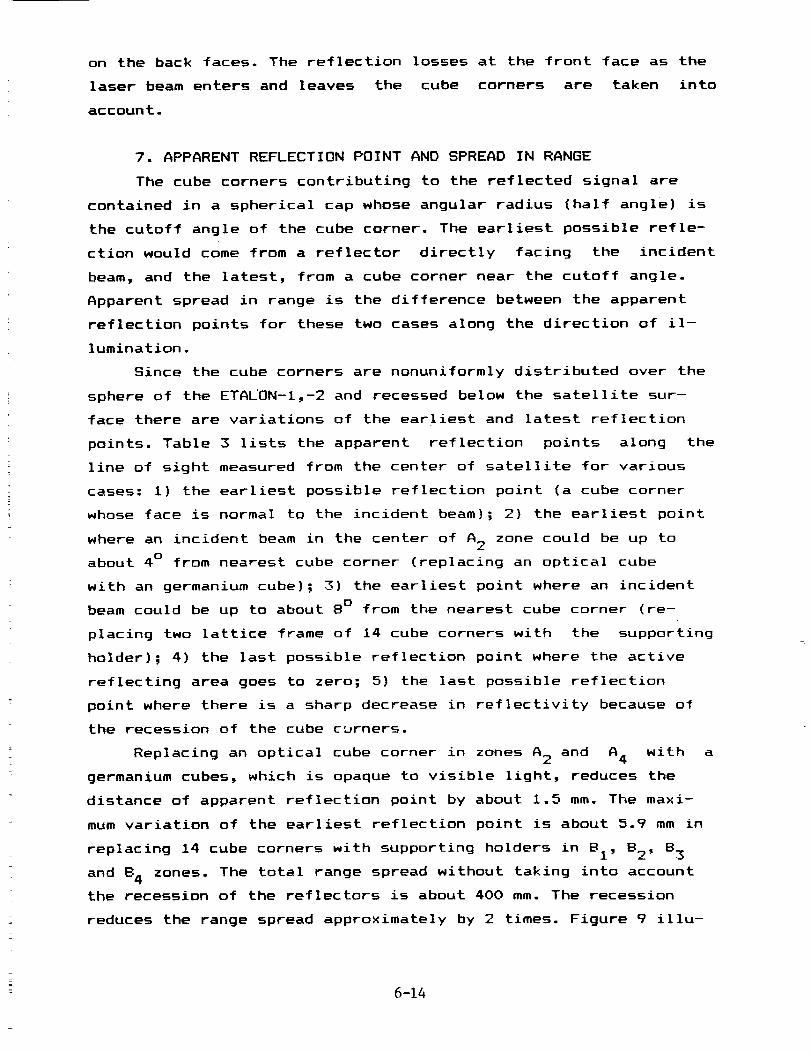
7. APPARENTREFLECTION POINT AND SPREADIN RANGE
The cube corners contributing to the reflected signal are
contained in a spherical cap whose angular radius (half angle) is
the cutoff angle of the cube corner. The earliest possible refle-
ction would come from a reflector directly facing the incident
beam, and the latest, from a cube corner near the cutoff angle.
Apparent spread in range is the difference between the apparent
reflection points for these two cases along the direction of il-
lumination.
Since the cube corners are nonuniformly distributed over the
sphere of the ETA_ON-I,-2 and recessed below the satellite sur-
face there are variations of the earliest and latest reflection
points. Table 3 lists the apparent reflection points along the
line of sight measured from the center of satellite for various
cases: i) the earliest possible reflection point (a cube corner
whose face is normal to the incident beam]_ 2) the earliest point
where an incident beam in the center of A 2 zone could be up to
about 4 ° from nearest cube corner (replacing an optical cube
with an germanium cube]; 3) the earliest point where an incident
beam could be up to about 8 ° from the nearest cube corner (re-
placing two lattice frame of 14 cube corners with the supporting
holder); 4) the last possible reflection point where the active
reflecting area goes to zero; 5) the last possible reflection
point where there is a sharp decrease in reflectivity because of
the recession of the cube curners.
Replacing an optical cube corner in zones A 2 and A 4 with a
germanium cubes, which is opaque to visible light, reduces the
distance of apparent reflection point by about 1.5 mm. The maxi-
mum variation of the earliest reflection point is about 5.9 mm in
replacing 14 cube corners with supporting holders in BI, B2, B 3
and B 4 zones. The total range spread without taking into account
the recession of the reflectors is about 400 mm. The recession
reduces the range spread approximately by 2 times. Figure 9 illu-
6-14

strates these results.
Table 3. Apparent reflection points for various incident angles
• ,deg X,pm n p_,mm Reflection point
0 0.6943 1.4554 6i3.90 0.5320 I'.4609 613.8
3.9287 0.6943 1.4554 6i2.43.9287 0.5320 1.4609 612.3
7.8574 0.6943 1.4554 608.0
7.8574 0.5320 1.4609 607.943.6000 0.6943 1.4554 440.2
43.6000 0.5320 1.4609 440.i
66.9650 0.6943 1.4554 229.6
67.4790 0.5320 1.4609 224.2
Earliest reflection point
Earliest reflection point
Nearest to the center A 2 zone
Nearest to the center A 2 zone
Nearest to the supporting holder
Nearest to the supporting holder
Latest recession reflection point
Latest recession reflection point
Latest of cutoff angle reflection
Latest of cutoff angle reflection
8. VARIATION OF THE CENTER OF MASS CORRECTION WITH SATELLITE
ORIENTATION
The surface of the ETALON-I,-2 satellites is nonuniformly
covered by the cube corners. As a result the center of mass cor-
rection and the reflecting properties depend on the satellite
orientation. A set of 2522 sampling points were distributed over
the surface of the sphere to study the variation of the center of
mass correction with ETALON-I,-2 orientation. Table 4 lists these
results for two laser wavelengths.
The mean range correction p for ETALON-I,-2 is about 576.0mm
for all orientations. The standard deviation of range correction
Ap is 3.2mm. The results obtained show the extreme variations in
the range correction over all orientations from a high of about
583.4mm to a low of about 567.3mm. The difference between the ma-
ximum and minimum range correction is 16.1mm.
The variations of the range correction with the period of 90 °
in k coordinate for orientation of the ETALON-I,-2 satellites are
due to the symmetry in the configuration of the cube corners from
different viewing angles.
6-15
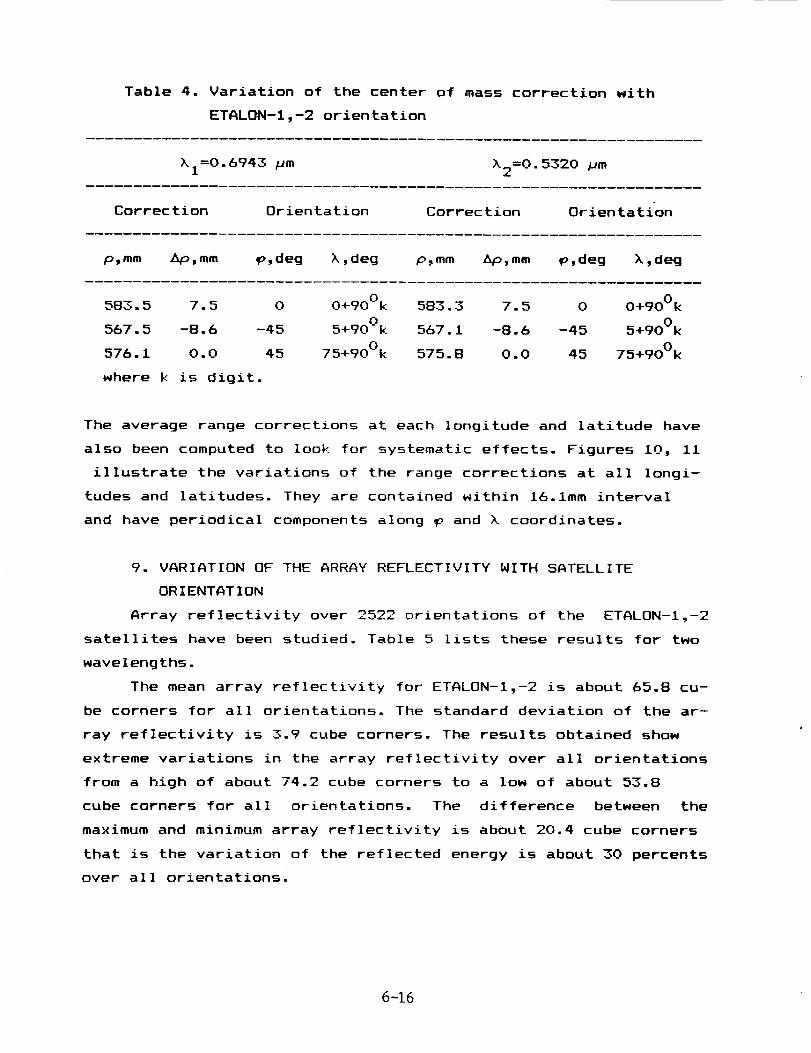
Table 4. Variation of the center of mass correction with
ETALON-1,-2 orientation
XI=0.6943 pm X2=0.5320 Hm
Correction Orientation Correction Orientation
p,mm _Ip,mm _,deg %,deg p,mm Ap,mm _,deg _,deg
583.5 7.5 0 O+900k 583.3 7.5 0 O+900k
567.5 -8.6 -45 5+900k 567.1 -8.6 -45 5+900k
576.1 0.0 45 75+900k 575.8 0.0 45 75+900k
where k is digit.
The average range corrections at each longitude and latitude have
also been computed to look for systematic effects. Figures I0, II
illustrate the variations of the range corrections at all longi-
tudes and latitudes. They are contained within 16.1mm interval
and have periodical components along _ and X coordinates.
9. VARIATION OF THE ARRAY REFLECTIVITY WITH SATELLITE
ORIENTATION
Array reflectivity over 2522 orientations of the ETALON-I,-2
satellites have been studied. Table 5 lists these results for two
wavelengths.
The mean array reflectivity for ETALON-I,-2 is about 65.8 cu-
be corners for all orientations. The standard deviation of the ar-
ray reflectivity is 3.9 cube corners. The results obtained show
extreme variations in the array reflectivity over all orientations
from a high of about 74.2 cube corners to a low of about 53.8
cube corners for all orientations. The difference between the
maximum and minimum array reflectivity is about 20.4 cube corners
that is the variation of the reflected energy is about 30 percents
over all orientations.
6-16

Table 5. Variation of the array reflectivity with
ETALON-I,-2 orientation
_i=0.6943 Hm X2=0.5320 Hm
Reflectivity Orientation Reflectivity Orientation
E_c.c. E_c.c. _deg X,deg E,c.c. E,c.c. _,deg X,deg
74.1 8.6 35 45+900k 74.4 8.6 35 45+900k
53.6 -12.0 -45 5+900k 53.9 -12.0 -45 5+900k
65.6 0.0 0 25+900k 65.9 0.0 0 25+900k
where k is digit.
The variations of the array reflectivity with the period of
90 degrees in k coordinate for orientation of the ETALON-I,-2 sa-
tellites are due to the symmetry in the configuration of the cube
corners from different viewing angles.
For the purpose of illustrating more detailed studies of the
ref!ectivity properties, the sampling points have been looked at
individually to find one whose properties are close to the averagefor all orientations. The point at _=45°, _=75 ° has nearly the
average range correction and reflectivity, so it has been used for
above purpose. Figures 12 are histograms of the contribution to
the reflected signal from each l-cm interval along the line of
sight starting from the earliest reflection point. The origin ofthe distance scale is the center of satellite. These histogramsare for a direction of illumination given by _=45 ° and _=75 °. For
this direction the total effective reflecting area is 66.8 times
the area of Qne cube corner, and the mean apparent reflection
point is 576.0mm from the center of the satellite. The cube corner
shown on the histogram is the closest possible position to the
observer.(None of the cube corner points exactly at the observer
for this particular direction of illumination. The earliest and
latest apparent reflection points for this case are 613.5mm and
440.7mm, respectively). Table 6 lists the data used to plot the
histogram: the equivalent number of cube corners at normal inci-
6-17

dence_ the percentage of the total return
percentage in each l-cm interval_starting
reflection point.
and the cumulative
from the earliest
Table 6. Total return in each l-cm interval starting from
the earliest apparent reflection point
Interval Equivalent numberof cube corners
% of total return Cumulative %
X1 X2 _I X2 _I _2
i 16.62 17.24 25.00 25.68 25.00 25.68
2 9.38 7.90 14.11 11.77 39.11 37.45
3 9.22 8.16 13 87 12.16 52.98 49.61
4 5.38 8.87 8.09 13.21 61.07 62 825 4.51 5.53 6.78 8.23 67.85 71.05
6 5.20 4.17 7.87 6.22 75.72 77.27
7 3.99 3.58 6.00 5.33 81.72 82.60
8 3.46 3.31 5.21 4.93 86.93 87.53
9 2.78 2.79 4.18 4.16 91.11 91.69
10 2.41 I. 98 3.62 2.94 94.73 94.63
ii 1.26 1.38 1.89 2.06 96.62 96.69
12 1.21 0.97 1.82 1.45 98.44 98.14
13 0.56 0.77 0.85 i. 14 99.29 99.28
14 0.28 0.24 0.42 0.35 99.70 99.63
15 0.12 0.16 O. 18 0.25 99.88 99.88
16 0.07 0.06 O. I0 0.09 99.98 99.97
17 0.02 0.02 0.02 0.03 100.00 100.00
A quarter of the return energy comes from the first l-cm in-
terval, over half the return energy comes from the first 3-cm in-
terval_ and over 90% comes from the first 9-cm interval. The cen-
ter of mass correction is at 576.0mm, which is 37.5mm in back of
the first reflection point.
The average array reflectivity at each latitude and longitude
have also been computed to look for systematic effects. The
6-18

variations of the average array reflectivity at all latitudes and
longitudes are contained within 21 cube corners and have periodi-
cal components. Figures 13 and 14 illustrate these regularities.These variations are similar to ones in the range correction of
ETALON-I,-2 satellites.F
The effects of the recession of cube corners in concentrating
the energy and computing the range correction have been studied.
The center of mass correction and array reflectivity_ if the cube
corners were not recessed_ would be 540.7mm and 126.53 cube
corners respectively.
lO. CONCLUSION
The ETALON-I_-2 center of mass correction is about 576.0mm
for both laser wavelengths. This value is 18mm more than value
which was published by Tatevian_1989. The range correction has pe-
riodical peak-to peak variations of about 2 cm with satellite
orientation. These peculiarities give the possibility to derive
for ETALON-I_-2 spin rate and direction using the precise laser
ranging measurements to the satellites with SLR systems of 3-rd
generation.
The mean array reflectivity for ETALON-I_-2 satellites is
about 66 cube corners. Difference between the maximum and minimum
array reflectivity is about 21 cube corners or 30% over all
satellite orientations.
Such regularities in ETALON-I_-2 center of mass correction and
array reflectivity are due to the symmetry with respect to the
X-axis in the dissemination of the cube corners over the satellite
surface.
REFERENCES
Tatevian S.K.Satellite report: ETALON. Satellite laser ranging
newsletter.1989,June,p.5.
Pochukaev V.N., Schutz 8.E., Tatevian S.K. International symposium
on ETALON satellites. Satellite laser ranging newsletter. 1991,Ap-
ril,p.22.
6-19

FiG.t. ETALON-1,-2SATeLLII'E
6-20
;i
t-
o/
>--I-
0
\
\
//
.a3
_PULI
4_
b,(:)
Q_4D_
u.I
IF-
Z9C
(:3I'-r,.ll
I.u,,ml
uill
Q_InILl
ILl"7"I"
LI.0
U.IZC_
N
L.,,;
U.
ot
I
__-2J...

270 ° @
@
® @
o i®,®
.® _ @ ®®
o _ogO °
FIG.3. D[s'reisuTioN OF THE LATTICE FRAME ANDReTRORe_LECTORS OVER A ZONE
6-22

/
W
]
Fief.4. DiRSCTiONOF iNCiDSN'r BEAU
. m
O !
o/Fiq.5. AcTiVE REFLECTING AREA: SEPARATION OF iNPuT
AND OUTPUT APERTURES
6-23

A_=P.70°
Fi(;.6. VARiATiO_ISOF THE CUTOFF ANqLES FOR
REFLECTION <P WiTH THE AZIMUTH Aj
OJ3!
0.001
6-24

COOR1)iNATESYSTEMSFORRETROREFLECTORPOSiTiONI_ND ORiEN'_ATiON
A
N
Fiq.9. APPARENT REFLECTION POINTS
AN]) SPREAD iN RANGE
6-25
/
::t o_o :,oot__ ! | I I I ! I J I ! I ! I ... ! I ! I
90 80 70 60 50 _0 30 20 t0 0 -_0-20-J0-40-50-50-70-80-90
6-26
Fi_.fO. VARiATiON OF ETALON-f;'2 CENTER OF MAr-'_ CORRECTION
AT EACH LONGJTUOE

o_o90
80
70
6o
30 40 50 60 70
/ \/
.¢........\./
M t:0.t
0.0
0.0
0.0
-f.O
;I,4)
"0.0
Z_.O
Fret. ffCL. VARiATiON OF ETALON-|,-2 CENTER OF HASS
CORRECT'ION )iT EACH UITiTU])E
6-27

8O
70
60
50
]0
2O
fO
0
-dO
-20
-30
-40
-50
-60
.--70
-80
-900
40 20 _0 _0 SO 60 70 SO 90 _o
" " 7-
,).,/.- ,,'\./)\ / X /
/ X /X / x/
V v
M t:O.fI | • | | J • •
t0 20 30 40 50 60 70 80 90
_.0
Fic;.Hb, VaRiATiONOF ETALON-1,--2CENTEROF_AssCORRECTIONAT EACH LATiTU])E
6-28

E_
t/t
uJz
o 44¢.#
U4= t2(.3
40
el
>==8I-- =o
_ 6
.=1
.>- 2
.it
576A m m
II
_. CENTER OFSATELLITE
1 I i i I I I | | | i J I | ! I It I I ! I
8 .12 _6 20 £Zt 28 32 56 40DISTANCE FROg
Ir.=
o.
| I°.
!!II
II_ 46 52 56
CENTER OF SATELLITE (CM)
Fi_.t2ct. RI_FLECTiViTY Hib-roC;RAXOF ETALON-1,-2;_=o.6_3j_m
;o
;
itr
octM2= 46
u t2
_.u.I- o
• - t0
:_u 8 _ CENTER Fw SATELLIT_1 2u. 6
_2
,_ e , i I I a l. I l !
0 _ 8
575.8mm _1
e
Fi_.t2b.
m,i i |= .
.t2 46 =0 24 =8 32 36 40 _ _8 5:l 56 60])ISTA_ICE FROM CENTER OF SATELLITE (CM)
REFLECTiViTY HISTOqRAt4 OF ETALON-|,-2; _=O.53ZOjqm
6-29
1IL

4
3
2
t
....,_=0 °
_ _ _,7,,=40°
,...,_., ._=20 °
e
\ \,v \.
90 60 70 60 50 _0 30 _0 |0 0 -40-20-30-/t0-_-60-70-60-90
Fi_..13. VAeiA'rioNOF ETALON-f;2 REFLECTiVJTY AT EACH tOl_T_e
6-30
90,
80
70
6O
50
,40
30
20
tO
0
/
e_ D
-3O
-SO
-60
-?0 _-
-gO
g
e,@e o
• • t • • • • • • •
/x," \
j
/ \
/
M 4:t
\
o 10
Fi .
90 30 _ 50 60
VAR}AT_ON OF ET/[LON-t,-2
AT EACH LATITU3E
6-31
-CL5
• • . . -3.0
-5.0
-4.0
-).0
_.4\\
3.2r
70 80 9O
IZEFLECTTIVITY

(_)o to 2o SO _o 50 60 ?0 so 90 _o
_0
30
_0
5.o
_o
io
20
I0
0
-I0
-20
-30
-40
-50
-60
-70
-80
-\I
•,,, /--.__ .:/
-90 ' • '
M _:t
| • • •
0 10 20 30 _ 50 60 70 _0 90
2.5r
2.5
t.5r
FiG.tttb. ' VARiAT;ON OF ETAL(]N-'I,-2 REFLECTiVh'YAT EACH LATITUDE
6-32

N94-15577
Test Results from LAGEOS-2 Optical
Characterization Using Pulsed Lasers
Thomas Varghese, Michael Selden,Thomas Oldham,Christopher ClarkeAllied Signal Aerospace Company,
BFEC/CDSLR
10210 Greenbelt Road
Seabrook, MD 20706USA
Thomas ZagwodzkiPhotonics Branch
NASA Goddard Space Flight CenterGreenbelt
Maryland, 20770U.S.A
Abstract
Laser Geodynamic Satellite (LAGEOS-2) has undergone extensive optical testing atNASA Goddard Space Flight Center during 1989. The techniques included
measuring the far field diffraction pattern using cw and pulsed lasers. In the pulsedmeasurement technique, response of the satellite was studied by measuring the
FFDP as a function of pulsewidth, wavelength, polarization, position in the FFDP,
detector/processing techniques, and satellite orientation. The purpose of the pulsed
laser testing was two-fold: (1) Characterize the satellite optical response with the
detector and signal processing electronics currently used in most SLR stations usingthe Portable laser ranging standard, and (2) to characterize the satellite response for
various conditions using the highest bandwidth optical detector (streak camera)
available for the next generation of SLR technology. The portable ranging standard
employed multiple measurement devices and an optical calibration scheme to
eliminate range-dependent and amplitude-dependent systematics. These
precautions were taken to eliminate/minimize instrumental errors and providemaximum accuracy. For LAGEOS orbit (6000 Km) ground stations are located 34 to
38/_-radians off the axis of the return signal from the satellite; therefore an opticalmask was used to restrict the field of view (FOV) of detection to this annular region of
the far-field diffraction pattern (FFDP). The two measurement techniques were
implemented using an aperture sharing scheme and complemented each other by
providing mutual verification.
6-33
The results indicate a variation of range correction as a function of satellite orientation
and location within the far-field diffraction pattern. Range correction as a function of
wavelength shows a maximum at 532 nm. For other wavelengths, the FFDP of
normal-incidence cube-corners is detuned, providing a greater contribution to the
integrated response from cube-corners farther away from the observer. Constant-
fraction processing of the detected pulse provided more consistent results than peak
and leading-edge. Changes in the orientation of the E-vector of the linearly polarized
light showed a systematic variation of _ 2mm in the polar regions of the satellite. A
consistent difference in RC of _,z2 mm between linearly polarized light and circularly
polarized light was also observed. The test results showed that a range correction of
-' 251 mm is applicable to the third-generation SLR systems operating at the multi-
photoelectron (MPE) level. The use of short (---15 ps) laser pulses and streak
cameras would provide time resolved signature of the satellite allowing improved(lmm accuracy) range correction.
6-34

" BACKGROUND
- LAGEOS-1 launched on May 4, 1976; 5900km orbit; 110 ° inclination.
- Prior to launch, the satellite was optically tested (532nm, 60ps) atGSFC.
- Remarkable progress in SLR technology over 15 years and theprojections for the future required understanding of LAGEOS-2 LRAbetter than LAGEOS-1.
- Major emphasis to accurately (submillimeter) determine the rangeoffset to satellite CM from the effective reflection point.
- Elaborate experimental schemes with state of the art Instrumentation
and expanded parameteric study than LAGEOS-1.
- Satellite manufactured by Aeritalia for ASI.
- LAGEOS-2 scheduled for deployment Oct. 15, 1992; 5900km orbit52 ° Inclination.
SATELLITE FEATURES:
MECHANICAL• Spherical satellite with a DIAMETER of 599.87mm.
• Two hemispherical shells with outer skin made of aluminum.
• Core of the satellite has brass to Improve mass..
• Cylindrical core for preferred spin axis (N-S).
• Total mass 405.38 kgm.
• Hemispherical shells and the brass core held together bya steel shaft.
• 426 cube corner cavities.
• Center of gravity and center of geometry are nearly coin-ciden ( 0.078mm)..
6-35

SATELLITE FEATURES:
OPTICAL
• 426 cube corners; fused silica (422), germanium (4).
• UV-near IR supported by FS; Ge for Infrared ranging..
• FS cubes distributed with symmetry about the polar axis;Ge cubes distributed as a tetrahedron.
• Special grade of FS (Suprasil 1, Special T19) for material homogenityand isotropy..
• Clear aperture 38.1 mm; face to apex depth 27.84mm..
• Dihedral offset of 1.5 arc sec for FS cubes; no dihedral offset for Gecubes.
• No metallic coating; only TIR to enhance reflection from CCs closeto the incoming laser beam.
• TIR cubes are sensitive to polarization affecting FFDP and thereforerange correction.
OPTICAL CHARACTERIZATIONPURPOSE
• Range correction to center of mass from effectivereflection point.
• Target spread function.
• Lidar cross section.
APPROACH
• Measure the temporal response of the satelliteusing mode-locked lasers and fast detectors(streak camera, photodiode, MCP-PMT) as afunction of wavelength, pulsewidth, polar-ization, position in the FFDP, satellite orien-tation, detection bandwidth and, type of signalprocessing; Compute and deduce the satellitecharacteristics.
6-36

MEASUREMENT PARAMETERS
LASER• Wavelength: Pulsed 1064, 532, 355nm• Polarization: Linear (horizontal, vertical), circular• Pulsewidth: 60ps (1064nm); 140ps, 45ps, 25ps (532nm), 30ps
(355nm)DETECTOR
• Temporal Resolution: 2.5ps (streak camera); 100ps (photo-diode) 500 ps (MCP-PMT)
• Photoelectron Level: 10-100 (MCP-PMT); 1000-10000 (SC);100000 - (Photodiode)
SIGNAL PROCESSING• Peak• Half Max.• Centroid• Constant Fraction
SATELLITE ORIENTATION• Polar• Equatorial• Others
Velocity Aberration: Various positions in the annular(34-38 microradlan) region of the FFDP.
EXPERIMENTAL APPROACH
PULSE MEASUREMENT• Mode-locked laser for illumination.
• Temporal detectors in the focal plane.• Detection limited to useful region in the FFDP.
ADVANTAGES
• Net effect of coherent/incoherent superpositionof FFDPs directly measured.
• More direct than cw case since instrumentatiion used is
similar to those currently used for SLR; easy to verifyspaceborne performance.
• Computationally simple.• Less sensitive to air currents, vibration, etc.
DISADVANTAGES
• Experimental measurement is complex.• Allows only discrete measurement of the FFDP.
I
6-37

LAGEOS-2 RESULTS
POLARIZATION EFFECT
• Although LAGEOS-1 testing showed no significant effect onpolarization, analysis of LAGEOS-2 RC using pulsed lasermeasurement showed + 1.5mm in the polar region
• Pulsed laser measurement showed z 2mm offset between
circular and linear polarization consistently for all pulse widths
PULSE LENGTH/DETECTION METHOD
• Peak and half max. detection produced Increased rangecorrections (l-2mm) for shorter pulses; at longer pulsewldths,an asymptotlc value of -=251mm Is reached.
• Experimental data on constant fraction discrimination showeddecreased range correction for shorter pulses in good agree-ment with theroretical predictions.
• Range correction to center of mass is 250.8mm (gausslan,200ps pulsewidth, 532 nm, average orientation, plane polarizedlight, centroid detection/constant fraction detection).
Range correction is a function of orientation, wavelength, pulselength, detection method, coherent effects, and location within thefar field diffraction pattern (FFDP).
WAVELENGTH EFFECT:
• Range correction is maximum at 532 nm and showed a decreasewith Increase in wavelength (355 - 1064).
• Detuning of the FFDP which is optimized for 532 nm andnear-normal Incidence; affects longer and shorter wave-lengths; cube corners farther from normal Incidencecontribute more and shift the range correction towardsthe center of the satellite.
6-38

SUMMARY
• Detailed investigation of LAGEOS-2 optical characteristicshas been completed, algorithms for RC to CM of the satel-lite have been derived to apply any SLR scenario.
• The small departure of LAGEOS-2 results from LAGEOS-1is currently believed to be due to calibration/instrumen-
tation errors in LAGEOS-1 measurement.
• Current estimates of the satellite-limited ranging accuracyis estimated to be < 3mm for the best multi-photoelectron(MPE) SLR station; accuracy approaching lmm can beobtained with shorter pulses (<15ps) and streak cameras.
6-39

I BroilI I T
4,
0
6-40

7,_t t t t t,_
II : I I I! ll,_8, i I I _JI I I ,J II I I _
li I i ; i I ,,
-Y' _ I i _, _
_'_11_,_ _ I_
6-41

@
; : ; : ,,.0.
: ; ; : "E
Iv3" ¢'q" _" C_
I
@o
, ,.... ° 0 , • ....., . , . ,'.
: : : , : : : : : : ;
EI °
•, d""i"'i"'""i'":i r">" _ .o_|B , . • • . , ". , m
.... -.,:,..°: : :
l I l I l I l I l I I l I
_ U3 U3 U3 "_" U3 _3 L'3 ¢_IU3 _-- UF) 0 _
©; ; ; : : ; ;
i I I I I I I
U_ _ U3 C',l U3 _ U3
,4 d ,- o
©
i.
W" U') _ _ _1 _ -- t._ 0 j
W
_ _b _
_°0.oo _
o I--"
o b-_Ozwcr)n__'_w
o° Dnn 13__ i_-r
0--' o0_Z ObZ ._IW(,#'_
W-l- 0(_) _)n
l--Z w
h0
Zoo3<
o iz<n
_o,,,-_<=__,,_o,
_z eql_
_"'wo°_z
_°-I-0_zO_)_Ob-(_91_-_i°-__0"--__0°
o___. _
__o I_<±-_oo°-U) n (_ Cq
6-42

Z
o _
_0 o _ o
0"_. (D
i!!
u_ I::1.'_ .£_o :i iili.........................._ o>.oo
n.........i.........,.........i.........i.........i.........i.........i.........i.........i.........i.........i,, o _ +" _ _O_mm
cs/ (_i C_l csl C_l
>' (ININ) NOllO3hl_lO0 :IDNVI::I
0n"
6-43

Z0
_q r,._
_o_8_ zoo
Will
O0
"1-'1-
O0OgZ
O°
(Ihl_) N01103_I_00 :=I£)N'_I
6-44

_1 _ _ ! ! t_ _.,,,_0"0_0"_'_ _c
_,i ,,1,,,_z_zz _ , _ -_ g ___I _o 88 ;..............u-,-_ _................!.........................._.....4 ,, "" _o_I O*.+, : ' " I "" '""-"®=
g , ........._ .....,............... ,+ ...............:i........... _,_o-.--®'mg_®$
l i...........................l.!i i 11 -_®
° I !....................._...............i......"............."÷ i.................!...........] _ _ ;___/ -t i] "----
.---- u _ .,.r"e- "0 (D '-s ",e" 0_, .........,.........,..................,..................;,,,,,,,,,,,,,,,,,,,,,,,,,,,i,,,,,,,,,,o .__-o__°
(ww) N011031:II:I00 3_NVI:I
6-45

"0
_I:113_17"IIIaI - NOIIO:IEII:IO0 :IONVI:I
6-46

N94-15575
ANALYSIS OF TOPEX LASER RETROREFLECTOR ARRAY
CHARACTERISTICS
Thomas Varghese
Allied-Signal Aerospace CompanyBendix/CDSLR Network
Seabrook, Maryland 20706U.S.A.
Abstract:
The joint U.S./French TOPEX/POSEIDON mission was successfully launched
on August 10, 1992 for the study of ocean height variation using
microwave altimetry. Accurate determination of the satellite orbit is
paramount to the determination of the above phenomenon. To accomplish
this, using laser ranging, the satellite is equipped with a laser retroreflector
array (LRA) around the altimeter antennae. The goal of laser ranging is to
obtain precision orbits with a radial accuracy of 13 cm to the Center of
Mass of the Satellite. This requires the laser range correction to the LRA
reference be known at the sub-cm level and is quite a challenge considering
the geometry of the LRA. Detailed studies were initiated by the TOPE×
project office (Christensen) under the auspices of the CDP/DOSE project
(Degnan) at Goddard Space Flight Center.
The studies included the following:
(1) Theoretical Modelling of the LRA using FFDP data and computationof Centroid tables: P. Minott/GSFC; D. Arnold/SAO
(2) Experimental measurement of the LRA trays using CW techniques:
P. Minott/GSFC; Carl Gliniak/EER
(3) Pulsed experimental measurement and modelling:T. Varghese/Bendix
(4) Range Correction tables for Global SLR Tracking Configurations:
T. Varghese/Bendix
(5) Data Compression using Fourier Analysis and Satellite RangeCorrection: A. Marshall/GSFC
This paper provides an overview of items (3) and (4).

TOPEX LRA OPTICAL CHARACTERIZATION
LIDAR CROSS SECTION: To determine optical linkandtherefore the photo electron yield for various trackingstrategies, detection configurations.
• TARGET SPREAD FUNCTION: To study impact on groundranging hardware configurations, calibration corrections, etc.
• RANGE CORRECTION" To deduce the range correction todetermine the satellite range to LRA reference center.
LASER RANGING CORRECTIONS FORTOPEX POD
DETERMINATION OF RANGE TO CENTER OF MASSINVOLVES THE FOLLOWING:
Range from the station to LRA 'reflection plane'.
Correction of the reflection plane to the LRA reference center.
Co-ordinate transformation from LRA reference center to space-craft body-fixed coordinate system origin.
Center of mass position co-ordinates with respect to the bodyfixed co-ordinate system origin.
6-48

r
LASER RANGING CORRECTIONS FORTOPEX POD
FACTORS AFFECTING LASER RANGING CORRECTION
• Satellite elevation angle with respect to the ranging station
• Satellite velocity normal to the line of sight and therefore the locationwithin the FFDP.
• Ranging hardware configuration
a) Laser wavelength and pulsewidth
b) Type of detection (peak, leading edge, centroid, CFD)
c) Detector bandwidth and skewd) Detection threshold (spe, mpe, low/high threshold)
Very accurate determination of each of these parameters is required
to obtain a laser ranging correction to 0.5cm (1 sigma).
I
TOPEX CHARACTERISTICS PERTINENTTO LASER RANGING
• Circular orbit of 1336 km
• Maximum Range ~ 2700 KM (20° Elevation)
• Minimum Range ~ 1336 KM (90 ° Elevation)
• Range of velocity aberration 28-481_r
• Nadir pointing LRA - orientation of the array changes as a function of elevation angle
• LRA consist of 192 hexagonal cubes in a conical ring configuration with 128 cubesin the lower row and 64 cubes in the upper row. There are 16 trays each with 12 cubes
• Lower row diameter - 826.3mm
• Upper row diameter - 852.9mm
• Height of lower row from reference center - 88.6mm
• Height of upper row from reference center - 66.3mm
• Center of mass is away from the LRA reference center by a known distance and varies as afunction of expended fuel
6-49
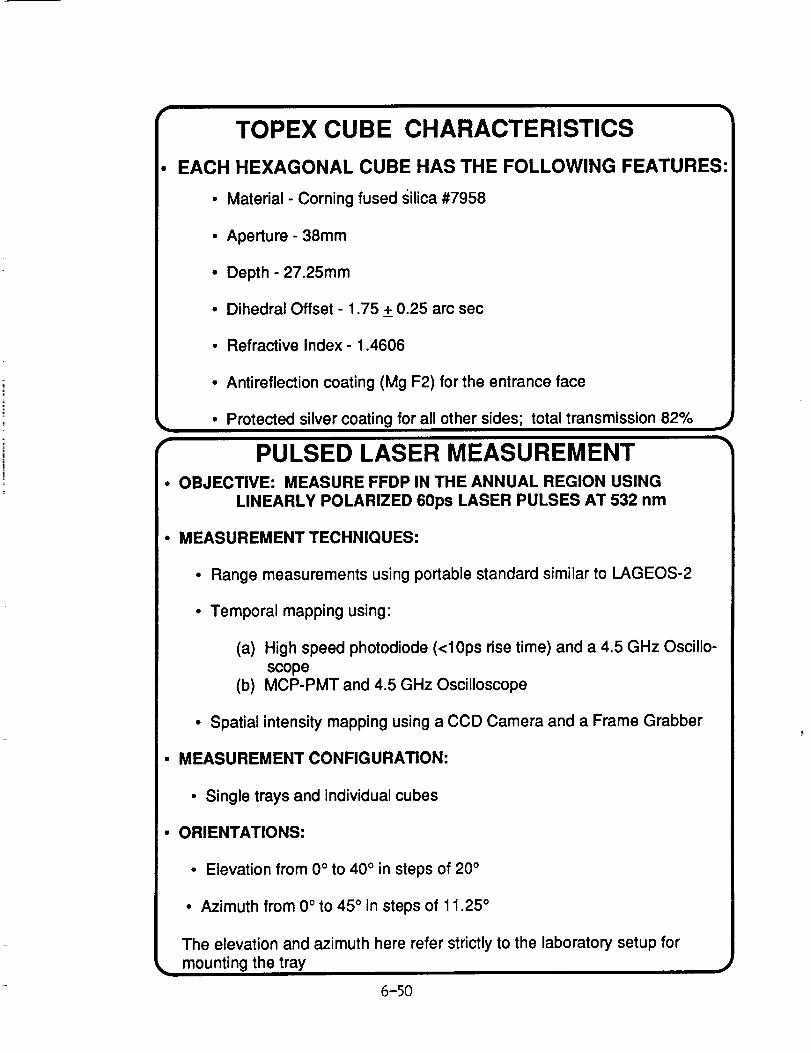
TOPEX CUBE CHARACTERISTICS
EACH HEXAGONAL CUBE HAS THE FOLLOWING FEATURES:
• Material -Corning fused silica #7958
• Aperture - 38mm
• Depth - 27.25mm
• Dihedral Offset - 1.75 + 0.25 arc secu
• Refractive Index- 1.4606
• Antireflection coating (Mg F2) for the entrance face
_. • Protected silver coating for all other sides; total transmission 82% •
• PULSED LASER MEASUREMENT• OBJECTIVE: MEASURE FFDP IN THE ANNUAL REGION USING
LINEARLY POLARIZED 60ps LASER PULSES AT 532 nm
• MEASUREMENT TECHNIQUES:
• Range measurements using portable standard similar to LAGEOS-2
• Temporal mapping using"
(a) High speed photodiode (<10ps rise time) and a 4.5 GHz Oscillo-scope
(b) MCP-PMT and 4.5 GHz Oscilloscope
• Spatial intensity mapping using a CCD Camera and a Frame Grabber
• MEASUREMENT CONFIGURATION:
• Single trays and individual cubes
• ORIENTATIONS:
• Elevation from 0 ° to 40 ° in steps of 20 °
• Azimuth from 0 ° to 45 ° in steps of 11.25 °
The elevation and azimuth here refer strictly to the laboratory setup for
mounting the,,tray _,,
6-50

TARGET SPREAD FUNCTION
Although the leading edge is fairly sharp, the trailing edge is skewedand very long.
The pulse shape is a function of elevation angle, and the positionin the FFDP annulus.
The presence of two rows of cubes arranged in the form of a conicsection produces a skewed return pulse; for the leading edge theskew diminishes monotonically until the elevation reaches 40 ° atwhich time the trailing edge picks up the contribution from the
upper row of cubes.
Simulations show that if the predicted contribution from eachcube is altered by a process such as thermal gradient, theresulting pulse can have significantly different temporalcharacteristics.
The temporal envelope of the pulse affects the range accuracy.
SUMMARY
Optical characterization of the LRA has been completed and amodel has been established to derive the LRA optical parameters
such as a Lidar Cross Section, target spread function and rangecorrection to the LRA reference center.
Range correction is profoundly impacted by type of detection. It is also afunction of the input pulse width and the number of photo electrons used
for signal definition.
Since the range varies considerably (3-6cm) within the FFDP, the rangecorrection has to be applied to the satellite data with the knowledge of the
satellite velocity and orientation.
Current efforts to incorporate velocity aberration and ranginginstrumentation features into the data correction algorithms should
provide data accuracy better than 1 cm.
6-51

Acknowledgements
The author acknowledges his deep appreciation to the following colleagues
for technical assistance during the course of this project. In strictly
alphabetical order, they are Steve Bucey, Christopher Clarke, Brion Conklin,
Tony Mann, Tom Oldham, and Mike Selden. He is also indebted to John
Degnan for various technical discussions and P. Minott for providing the farfield diffraction data of the individual cubes for various orientation of the
LRA.
6-52

[]
W_J
bJ Q_tv
ty
W
rv rv _--
tv[]
(Jw_J
13tv_-
tyWI-
(;_>-,,-4(,,i
>z
rv
bJ_JLgZH
z<E
<[tv.J
XbJa_DF-
i,[3
ZDH
<[0dH-(/)
_]_J
b_
6-53

JLOz
rv
A<[Z
i,O
ZDH
H-
Z
b_
ZD
F--ZW
AtD
rv.J
OJ
6_
6-54

or)
X
<_
(Y
n
.<Z
.<rr._J
{.D E)
II ItII II _
e_ _ x xX X _ O0
II II II II
.z: r- rY IY
IIII
II
tl
Ir"
W
_i O
DO
IX)
Z
5 O..-I
W"'mC)
w
-FI--
O
(.J
LL
I.---ZOrYI,
w"l"I--
w WI
0 0I-- l--
w w
D(D
Z
oF
oFWO_
a_ d d_-_ Z Z
w n-- Og
El rF [K
0 n
w 0 a_T __.1 DI--.- W W
u_ _ T
w _ L0 0 0
b_ w wm m
Z 0 00n_ W WU.. -1- -r
I--- I---w
_ ,, u_0 0
_ _ m W
0 0 0 C)_C
rY rY _ b_
F- _-- I--Z Z Z Z
W 0 0W (D
w Z w Z
T< ,,,-J I I
oZ v v
W W
I W D D
rnee1" I rY Pr"
II < II _ II II_ I'Y (NI /'Y _y c_l.C _1 _El I::E
mDO>-bO
Wt--<Z
rl
n-O0(__
W
(PZWn/wLLWrY
.<r,"_1
XWn0I--
I0
d_LL
6-55

I
o
,,5o
z
____1
I---Zl.,ul
Wn,"
GO,<
>.-,<n,,"l--
Xl.ul0..OI---
0i,
(J
I--<
I.M(DOr)
_J,<(D
I--O_O
6,i,
6-56

o Q 0
"_ II
o cE oo _o I _ /
'-' t_n
P,
__ ot'M
0 ___ 11
c0
J
0
Ite.-o
>i1)
w
<
XW
Q_
0F-
W
t.l_
0
IZI
Z0
<l--
Z
W
n,"
0
n_0
L
OqF-
ZW
m
C/3
m
>tY
0
<0_0co<
U'3
6,L
6-57

11111 III111111
6-58

N94-15579
HISTORICAL MOBLAS
SYSTEM CHARACTERIZA ON
Van S. Husson
Abstract - This paper is written as a direct response to the published NASA LAser GEOdynamic Satellite (LAGEOS)
orbital solution SL7.1 [Smith et al., 1991], in order to close the data information loop with an emphasis on the NASA
MOBile LAser Ranging System's (MOBLAS 4,5,6,7,8) LAGEOS fullrate data since November 1, 1983. A
preliminary analysis of the supporting information (i.e. satellite laser ranging system eccentricities and system
dependent range and time bias corrections) contained in SL7.1 indicated CentiMeter (cm) level discrepancies. In
addition, a preliminary analysis of the computed monthly MOBLAS range biases from SL7.1 appear to show cm
level systematic trends, some of which appear to be "real", particularly in the 1984 to 1987 time period. This paper
is intended to be a reference document for known MOBLAS systematic errors (magnitude and direction) and for
supporting MOBLAS information (eccentricities, hardware configurations, and potential data problem periods).
Therefore, this report is different than your typical system characterization report [Pearlman, 1984], but will be
more valuable to the user. The MOBLAS error models and supporting information contained in this paper will be
easily accessible from the Crustal Dynamics Data Information System (CDDIS).
1. INTRODUCTION
In the late 1970's, NASA developed five, second generation mobile laser ranging systems in support of
the SEa Altimeter SATellite (SEASAT) mission. The goal of the SEASAT mission was to map the surface
of the oceans using the onboard satellite altimeter. Satellite Laser Ranging (SLR) data was used to
calibrate the SEASAT altimeter. During the 1980's, the MOBLAS systems underwent an extensive
upgrade program that improved the data accuracy and precision an order of magnitude, from the
100 MilliMeter (mm) to the 10 mm level. Since the mid-1980's, LAGEOS data has been compressed into 2
minute bins (normal points), which statistically reduces the single shot precision level [Smith et al., 1985].
MOBLAS LAGEOS normal point precision levels have been at the 1-2 mm level since the late-1980's.
During the 1980's, cm level systematic biases were discovered through special and collocation analysis
techniques developed by Bendix in support of the Goddard Laser Tracking Network (GLTN) and the
Crustal Dynamics Satellite Laser Ranging (CDSLR) mission contracts. When centim_er level systematic
errors were discovered in NASA SLR data, the NASA management philosophy was to identify the source
of the bias; to eliminate or model the bias; and to document the nature of the bias. Due to cost
considerations, historical NASA SLR data were not repaired (in most cases) to remove known on level
systematics. In addition, the documentation of these bias problems was not maintained in a central
database and had a limited distribution. The intent of this paper is to provide one reference source for
known uncorrected MOBLAS (LAGEOS) systematic errors that will be available from the CDDIS.
6-59

The original MOBLAS major hardware components were the General Photonics (GP) q-switched laser, the
Amperex dynode-chain PhotoMultiplier Tube (PMT), the Ortec 934 discriminator, and the Hewlett Packard
(HI') 5360 time interval counter. In the 1983-1984 time frame, the largest systematic unrecoverable error
source, the GP laser, was replaced with a Qnantel mode-locked laser. The HP5370 counter was usually
incorporated as part of the Quantei laser upgrade. In the 1986-1987 timeframe, the largest systematic error
source, the Amperex 2233B and Ortec discriminator, was replaced with the ITT F4129 gated three-stage
Micro-Channel Plate (MCP)PMT and Tennelec TC454 discriminators. The systematic error sources
associated with the hardware components mentioned above are discussed in Degnan [1985] and
Varghese [1985].
It is virtually impossible to recover any hardware related systematic errors in the GP laser era due to the
domination of "wavefront-distortion" errors [Degnan, 1985]. In the Quantel laser pre-MCPPMT era, the
largest recoverable systematic hardw;_rf related error source was signal strength (0-30mm) of the returning
pulse [Heinick, 1984]. Discriminator and PMT "timewalk" characteristics, coupled with calibration signal
strengths not distributed the same as LAGEOS signal strengths induced a systematic bias. The magnitude
and direction of the bias was system dependent, and decreased in magnitude as calibration methods
improved. A model has been developed to recover this error based on the review of historical calibration and
LAGEOS "timewalk" curves. Unfortunately, only a small sample of these curves ever existed. Signal
strength effects did vary from pass-to-pass and within a pass. The MCPPMT and dual Tennelec
discriminators package developed by Varghese, coupled with proper calibration techniques essentially
eliminated signal strength as a bias source at the mm level.
In 1988, another recoverable hardware systematic error source was discovered by See and Sneed. They
discovered the measurement of the laser transmit delay (TDEL) was in error, because the TDEL electronics
did not measure the cable delay (__0.5 microseconds) between the time code generator and the system
computer. In addition, they and McCollums discovered that the TDEL electronics had other TDEL sub-
microsecond accuracy ambiguities, which would have masked this bias. In the 1989-1990 timeframe, the
TDEL electronics were modified to remove these sub-microsecond ambiguities. The cable delay has been
measured in MOBLAS-4,7,8 and is being modelled in the pre-processing. As of this writing, the MOBLAS-5
and 6 cable delays have not been measured.
Other mm level hardware errors are known to exist in the current MOBLAS hardware (i.e. HP5370
[Selden, 1992] and optical path changes as a function of pointing angle [McCollurns, 1986]), but are presently
unrecoverable. Not all systematic error sources in SLR systems are hardware related. Survey of ground
targets, survey of monument offsets, atmospheric modelling, data pre-processing, and orbital modelling are
other SLR error sources. Fortunately, many of these errors sources can be recovered to the 10-20mm level,
using historical processing results.
In the GP laser era, calibration targets were large boards at distances of 2-3 KiloMeters (Km). These
boards were mounted on metal poles which were guyed. The height of these poles was system dependent.
Cube corners also existed and were mounted on various structures and in most cases were in close proximity
(a few meters) to the calibration boards. The reason calibration boards were used versus cube corners was to
average the "wavefront-distortion" effects of the GP laser. Historical ground tests results [Brogdon et. al.]
indicated up to 20era and 60era differences in system delay between the board and cube corner, and as a
function of pointing angle, respectively. When the mode-locked (Quantel) lasers were installed, ground tests
results were dramatically improved, and for the first time, 10-20mm survey errors to the ground targets and
10-20mm ground target movement could be detected [Wroe et. a/.]. Within a few months of the MCPPMT's
(1986-1987) being installed, the primary calibration targets became the original cube corners. In the 1988-
1989 timeframe, long (2-3Km) Nelson piers became the primary calibration targets. In the 1991-
6-60

1992 timeframe, the primary targets became short (100-200 meters) Nelson piers with the advent of the
translator and the short target ranging dectronics [Eichinger et. aL, 1990].
In the early to mid 1980's, cm level movement of the original targets, coupled with survey uncertainties and
infrequent surveys, severely limited the absolute accuracy of MOBLAS data. "Average" target movement
and survey uncertainties, in most cases, is recoverable to the 10-20ram level using historical ground test
results. In the mid-1980's, surveying equipment and frequency of surveying was improved, but the problem
still existed with unstable targets. In the late-1980's, the target stability problem was minimized to the
millimeter level, when the current day target calibration structure, the Nelson pier, were used as the primary
calibration target.
The MOBLAS eccentricity measurement techniques were improved in the mid-1980's [Nelson, 1986]. The
infrequency of eccentricity surveys was a mm level systematic error source, because long term temporal
changes in the eccentricity data were at this level. Some of these errors are traceable based on MOBLAS log
records or special analysis techniques.
Neutral Density (ND) filters have always been used during calibration to attenuate the signal. During
satellite ranging the filters were removed, thus inducing a difference in the "effective" calibration and satellite
optical paths [Crawford, 1985]. This difference was not modelled, but is recoverable to the lmm level. In
1991-1992 the Optical Attenuation Mechanisms (OAM) [Silva et. al., 1991] were installed in the MOBLAS,
which minimizes the use of ND filters. The ND filter bias is currently being modelled in the pre-processing.
Prior to January 1, 1988, the tropospheric range correction applied to the fullrate data was computed
based on the MOBLAS elevation encoder measurements. These measurements could be in error by a few
millidegrecs and would thus induce a systematic error in the tropospheric refraction correction [Husson et.
a/., 1987]. This correction could be in error up to 20ram. The error was system and satellite dependent, but
is fully recoverable to the sub-mm level. To remove this error in pre-1988 MOBLAS data, the applied
tropospheric refraction must be removed and reapplied using the computed elevation angle. All MOBLAS
data taken after January 1, 1988, were pre-processed using the computed elevation angle from a short arc fit
to the ranges.
LAGEOS orbital modelling errors have improved significantly over the last 12 years along with the quality
of SLR data [Smith et. al., 1991]. Orbital modelling is limited by the quality and distribution of the global
SLR dataset, but in some instances, is the only hope for recovering the "net" historical SLR biases.
In the remainder of this article, each MOBLAS system is addressed individually. Each system's
eccentricities and recoverable bias sources are discussed and summarized in tables, which are contained at the
end of this article. The bias model tables include the major system configuration changes 0aser, PMT,
discriminators, counter) and important pre-processing information (i.e. calibration target and calibration
range). The tables and this article will be available from the CDDIS.
2. MOBLAS-4
2.1 MOBLAS-4 EccentricitiesSince August 15, 1983, MOBLAS-4 has only occupied one monument/marker (7110). Prior to August
1983, 7110 was occupied by MOBLAS-3. There exists 5 sets of MOBLAS-4 eccentricities and 10 MOBLAS-4
Site Occupation Designators (SOD's) at 7110. SOD's 71100402, 71100403, and 71100410, each have two sets
of eccentricities.
6-61

The 3mm change in the Up ecc., between the 1985 and 1988, surveys could be caused by settlement of the
pad and monument [Nelson, 1988]. There were no measurements of the eccentricities between 1985 and
1988. The MOBLAS-4 mount was releveled twice in 1988 (June 16 and December 13), but apparently there
was no change in eccentricities, based on the April 1988 and November 1989 surveys. In February 1992, the
eccentricities were remeasured prior to the removal of the mount. There was a 2mm unexplained change in
the North ecc. In March 1992, the MOBLAS-4 mount was removed from system to be refurbished, and in
April 1992, the refurbished mount was re-installed and the ecc. were remeasured. Table I contains the
recommended set of MOBLAS-4 eccentricities with their corresponding SOD(s) and effective starting dates.
2.2 MOBLAS-4 LAGEOS Biases
The net MOBLAS-4 recoverable biases (range and time) are presented in Table 2. To correct MOBLAS-4
LAGEOS data, the known range and time biases (in Table 2) should be subtracted from the LAGEOS range
and timetags, respectively. Any time there is the Potential for a change in the bias(es), even though the
bias(es) did not change, a new entry has been added. A component breakdown of the biases is presented,
followed by a section describing known problem data, and followed by a section describing potential problem
data.
2.2.1 MOBLAS-4 ND filters
MOBLAS-4 LAGEOS data was biased short by 3mm + 1 and lmm + 0mm from August 15, 1983 through
January 17, 1992, and from January 18 through May 31, 1992, respectively, due to ND filters. On January
18, 1992, the OAM was installed in MOBLAS-4 reducing the ND filter bias. After June 1, 1992, this bias has
been removed through modelling.
2.2.2 MOBLAS-4 signal strength
MOBLAS-4 LAGEOS data was biased long by 20mm + 10, 10mm + 5, 6mm + 3, and 4mm + 2 from
August 15, 1983 through June 30, 1984; July 1, 1984 through August 31, 1984; September 1, 1984 through
July 31, 1985; and August 1, 1985 through November 19, 1986; respectively, due to signal strength. This
bias would vary from pass-to-pass and would have a slight elevation dependence. Low elevation data would
be biased longer by several mm than high elevation data. Signal strength effects were reduced as the
MOBLAS-4 calibration techniques improved, and were eliminated when the MCPPMT package was installed
on November 20, 1986.
2.2.3 MOBLAS-4 elevation angles
Prior to January 1, 1988, the tropospheric range correction applied to the fullrate data was computed
based on the MOBLAS-4 encoder measurements. To remove this error in pre-1988 MOBLAS-4 data, the
applied tropospheric refraction must be removed and reapplied using the computed elevation angle.
2.2.4 MOBLAS-4 calibration targets/distances
MOBLAS-4 has used 4 different calibration targets (1 board and 3 cube corners) at marker 7110. From
August 15, 1983 through December 31, 1987; from January 1, 1987 through January 28, 1988; from January
29 through April 29, 1988; from April 29, 1988 through December 5, 1991; and from December 6, 1991 to
the present; the MOBLAS-4 primary calibration targets were the 2Km board, the 2Km cube corner, the 2Km
board, the 2Kin Nelson pier, and the 200m Nelson pier, respectively.
6-62

MOBLAS-4 has been surveyed 5 times (1983, 1985, 1988, and twice in 1992) at marker 7110. Sometime
between the 1983 and the 1985 surveys, vandals removed the bracing support of the MOBLAS-4 calibration
board tower [Nelson, 1985], which could explain the 13mm difference between the 1983 and 1985 calibration
board distances. When the new calibration board values were used in data processing, there would be an
automatically induced 13mm discontinuity in the MOBLAS-4 range bias. The new board values were used
with all data taken after June 20, 1985. Data just prior to June 20, 1985 would have been biased longer by
13mm than data after June 20, 1985 (This 13mm change does not appear in the range bias model, because
the exact date of the change is unknown). The cube corner became the operational target in January 1987
(The exact day is unknown at this time).
The distance (2Km) and the design/stability of the original MOBLAS-4 targets (a calibration board
mounted on a tower and a cube corner mounted on wooden posts) were limiting factors to surveying accuracy
and MOBLAS-4 data accuracy. The survey accuracy of these original targets was at the 10-15ram level
[Nelson]. Historical ground test results indicate up to 20mm differences in "apparent" system delays between
the MOBLAS-4 calibration board and the cube corner, which indicates both targets could move at least
10mm in either direction from month-to-month and from day-to-day. LAGEOS orbital analysis appears to
be the only viable means for recovering the "true" average MOBLAS-4 monthly target distance to better than
20mm in the October 1983 to April 1988 timeframe.
Between November 1, 1987 and January 28, 1988, the MOBLAS-4 operational calibration target, cube
corner, was very unstable, which caused unusual changes (up to 90mm) in the "apparent" system delay.
Individual MOBLAS-4 LAGEOS passes could be biased long (up to 90mm) during this period. Eanes [1987]
originally discovered this data problem. The bias could change (up to 30mm) from pass-to-pass and from
day-to-day. The problem was eliminated when the previous calibration target (board) was used starting
January 29, 1988. On April 30, 1988, the MOBLAS-4 calibration target became the 2Km Nelson pier.
2.2.5 MOBLAS-4 TDEL
All MOBLAS-4 data between January 5, 1990 and May 31, 1992 contains a time bias of -0.4 microseconds.
To correct this time bias, add +0.4 microseconds to each observation's timetag. This correction is only valid
after January 5, 1990, because on this date, the MOBLAS-4 TDEL electronics were modified to eliminate
other TDEL sub-microsecond accuracy ambiguities, which would have masked this bias. This bias has been
eliminated through modelling, effective June 1, 1992.
2.2.6 MOBLAS-4 known problem data
Between April 12, 1984 and May 24, 1984, individual MOBLAS-4 passes contained discontinuities (100mm
up to 600mm) due to the range gate window being changed during the pass. The magnitude of the
discontinuities depends upon where the return occurred in the range gate window [Varghese, 1985]; therefore,
data during this period should not be used. This problem was originally detected by Eanes [1985] and was
resolved when the system adhered to standard tracking procedures.
2.2.7 MOBLAS-4 potential problem data
Between December 29, 1988 and January 27, 1989, MOBLAS-4 LAGEOS data is questionable due to a bad
time interval unit (HP5370). The RMS scatter of this data was cyclic and dependent upon the LAGEOS
range [Heinick et. al., 1989]. The data is believed to be unbiased and just systematically noisy. This problem
was resolved by replacing the HP5370.
6-63

3. MOBLAS-5
3.1 Eccentricities
Since July 1, 1979_ MOBLAS-5 has only occupied one monument/marker (7090). There exists only 3
unique sets of MOBLAS-5 eccentricities and 12 MOBLAS-5 SOD's at 7090. SOD 70900508 has 2 sets of
eccentricities.
The MOBLAS-5 mount was releveled on September 5, 1985. No survey was performed after the releveling
til 1987. The 8mm change in the Up ecc., between the 1979 and 1987 surveys, remains unexplained. It is not
known how far back the 1987 Up ecc. can be backdated. The MOBLAS-5 mount was also releveled on
August 5, 1989, but the eccentricities were not remeasured. In January 1992, the mount was re-installed and
the eccentricities were remeasured. Table 3 contains the recommended set of MOBLAS-5 eccentricities with
their corresponding SOD(s) and effective starting dates.
3.2 MOBLAS 5 LAGEOS BiasesThe net MOBLAS-5 recoverable biases (range and time) are presented in Table 4. To correct MOBLAS-5
LAGEOS data, the known range and time biases (in Table 4) should be subtracted from the LAGEOS range
and timetags, respectively. Any time there is the potential for a change in the bias(es), even though the
bias(es) did not change, a new entry has been added. A component breakdown of the biases is presented,
followed by a section describing known problem data, and followed by a section describing potential problem
data.
3.2.1 MOBLAS-5 ND filters
Prior to June 1, 1992, MOBLAS-5 LAGEOS data was biased short by 3mm + 1 due to ND filters. After
June 1, 1992, this bias has been removed through modelling.
3.2.2 MOBLAS-5 signal strength
MOBLAS-5 LAGEOS data was biased short by 3mm + 2 from July 27, 1983 through April 22, 1987, due
to signal strength. This bias would be fairly constant from pass-to-pass. This bias was eliminated when the
MCPPMT package was installed in MOBLAS-5 on April 23, 1987.
3.2.3 MOBLAS-5 elevation angles
Prior to January 1, 1988, the tropospheric range correction applied to the fullrate data was computed
based on the MOBLAS-5 encoder measurements. To remove this error in pre-1988 MOBLAS-5 data, the
applied tropospheric refraction must be removed and reapplied using the computed elevation angle.
3.2.4 MOBLAS-5 calibration targets/distances
MOBLAS-5 has used 4 different calibration targets (2 boards and 2 cube corners) at marker 7090. From
August 1, 1979 through June 7, 1980; from June 8, 1980 through May 31, 1987; from June 1 through July
31, 1987; from August 1 through August 25, 1987; and from August 26, 1987 through June 30, 1992; the
MOBLAS-5 primary calibration targets were the 2Kin calibration board, the 3Kin calibration board, the
IKm cube corner, the 3Kin calibration board, and the 3Kin Nelson pier, respectively.
6-64

MOBLAS-5 has been surveyed only 3 times in 13 years (1979/80, 1987, & 1992) at marker 7090. Between
the 1979/80 and 1987 surveys, the lion cube corner and the 3Kin board ranges changed by +30ram and
-9ram, respectively. The 2Km board was never resurveyed and the 3Kin board blew away in August 1987.
In early January 1992, the mount was replaced and a new survey was performed.
The system delay differences obtained from the 1Kin cube corner and the 3Km board in historical minico
tests since June 1985 were 39ram 4- 5 and 0ram 4- 5 [Husson and Wroe, 1987] using the 1980 and 1987
surveys, respectively. Therefore, the 1987 survey values can be backdated to at least June 1985, which means
MOBLAS-5 data between June 1985 through May 31, 1987 (all board calibrated data) was biased long by
9ram +_.5ram. All data since June 1, 1987, until the mount replacement in 1992, was processed with the 1987
surveyed ranges and should be bias free. Research into minico results prior to June 1985 still needs to be
performed.
3.2.5 MOBLAS-5 TDEL
The MOBLAS-5 cable delay causing this bias has not been measured as of this writing. On January 30,
1990, the MOBLAS-5 TDEL electronics were modified to eliminate other TDEL sub-microsecond
ambiguities.
3.2.6 MOBLAS-5 PMT Gating
Prior to June 8, 1980, MOBLAS-5 LAGEOS data was biased short by 20mm+5 due to calibration data
falling in a non-linear region of the Amperex 2233B PMT gate. This bias was characterized by Varghese
[1985]. This bias was eliminated, effective June 8, 1980, when a longer calibration board (> 3Kin) was used.
3.2.7 MOBLAS-5 known problem data
Between December 19, 1991 and January 3, 1992, MOBLAS-5 data quality was degraded due to a stuck
bit. The bit was stuck low (100 picosec.) for LAGEOS. It does not appear that this data is recoverable,
because of it's unknown effect on calibration data.
3.2.8 MOBLAS-5 potential problem data
Between August 12, 1988 and January 31, 1989, MOBLAS-5 system ddays and pre-to-post calibration
shifts were erratic [Heinick et al., 1989]. Therefore, the uncertainty in the system delay is increased during
this period; however, this should be a random error than should average over several passes. This problem
disappeared during February 1989.
4. MOBLAS-6
4.1 MOBLAS-6 Eccentricities
Since March 3, 1983, MOBLAS-6 has only occupied one monmnent\marker (7122). There exists 4 sets of
MOBLAS-6 eccentricities and 9 MOBLAS-6 SOD's at 7122. SOD 71220604 has two sets of eccentricities.
The May 1988 survey sheet had the wron2 si2n for the East ecc. It should be negative, not positive. Based
on the 1991 survey, there was no apparent change in the eccentricities when the MOBLAS-6 mount was
releveled on August 5, 1989. Table 5 contains the recommended set of MOBLAS-6 eccentricities with their
corresponding SOD(s) and effective starting dates.
6-65

4.2 MOBLAS-6 LAGEOS Biases
The net MOBLAS-6 recoverable biases (range and time) are presented in Table 6. To correct MOBLAS-6
LAGEOS data, the known range and time biases (in Table 6) should be subtracted from the LAGEOS range
and timetags, respectively. Any time there is the potential for a change in the bias(es), even though the
bias(es) did not change, a new entry has been added. A component breakdown of the biases is presented,
followed by a section describing known problem data, and followed by a section describing potential problem
data.
4.2.1 MOBLAS-6 ND filters
All MOBLAS-6 LAGEOS data was biased short by 3mm + 1 due to ND filters.
4.2.2 MOBLAS-6 signal strength
MOBLAS-6 LAGEOS data was biased long by 12mm + 4, 10mm + 3, and 4ram + 2 from May 1, 1984
through March 31, 1986; from April 1 through August 31, 1986; and September 1, 1986 through January 27,
1987; respectively, due to signal strength. This bias would vary slightly (several ram) from pass-to-pass and
would have a slight elevation dependence. Low elevation data would be biased longer than high elevation
data. Signal strength effects were reduced as system calibration techniques improved, and were eliminated
when the MCPPMT package was installed in MOBLAS-6 on January 28, 1987.
4.2.3 MOBLAS-6 elevation angles
Prior to January 1, 1988, the tropospheric range correction applied to the fullrate data was computed
based on the MOBLAS-6 encoder measurements. To remove this error in pre-1988 MOBLAS-6 data, the
applied tropospheric refraction must be removed and reapplied using the computed elevation angle.
4.2.4 MOBLAS-6 calibration targets/distances
MOBLAS-6 has used 4 different calibration targets (1 board and 3 cube corners) at marker 7122. From
May 1, 1983 through March 26, 1987; from March 27, 1987 through August 16, 1988; from August 17, 1988
through October 3, 1989; and from October 4, 1989 through April 30, 1991; the MOBLAS-6 primary
calibration targets were the 2Kin calibration board, the 2Km cube corner, the first 2Kin Nelson pier, and the
second 2Km Nelson pier, respectively.
MOBLAS-6 was surveyed 4 times in 8 years (1983, 1988, 1989, & 1991) at marker 7122. In October 1983,
several months after the first survey, a hurricane passed through the site. Between the 1983 and 1988
surveys, the ranges to the 2Km cube corner and the 2Km board changed by + 6ram and -17mm, respectively.
The system delay differences obtained from the these two targets in historical minico tests, since the Quantel
laser installation (July 1984), were 33mm + 15 and 10mm + 15 [Husson and Wetzel, 1987] using the 1983
and 1988 surveyS, respectively. The 1988 surveyed target ranges for the cube corner and the board are only
accurate to the 10mm level. The 10mm difference which remains in the historical minico results can be
attributed to survey. Making this assumption and distributing the 10mm difference equally to both targets,
the 1988 survey (with adjustment) can be backdated to the hurricane (October 1983). This means
MOBLAS-6 data from October 1, 1983 through March 26, 1987; from March 27, 1987 through May 2, 1988;
and from May 3 through August 16, 1988; is biased long by 22mm + 10, short by llmm + 10, and short by
5mm + 10, respectively.
6-66
In 1988, the first Nelson pier was built; however, the pier foundation was not built to specifications. The
pier moved 14mm between 1988 and 1989 due to a poor foundation and being on a steep slope [Nelson,
1989]. Nelson believes this movement would have been linear over the 13 months between the 1988 and 1989
surveys. MOBLAS-6 data between August 17, 1989 and June 23, 1989, was biased long by 4mm +
lmm/month. On October 4, 1989, the primary MOBLAS-6 calibration target became the second Nelson
pier, which eliminated target movement as a MOBLAS-6 systematic bias source.
4.2.5 MOBLAS-6 TDEL
The MOBLAS-6 cable delay causing this bias has not been measured as of this writing. On January 11,
1990, the MOBLAS-6 TDEL electronics were modified to eliminate other TDEL sub-microsecond
ambiguities.
4.2.6 MOBLAS-6 known problem data
All MOBLAS-6 satellite RMS's between February 1 and March 1, 1984, were high caused by a bad
distribution amplifier [Oldham]. Data during this period should not be used. On March 2, 1984, the
distribution amplifier was replaced which eliminated the problem.
4.2.7 MOBLAS-6 potential problem data
All MOBLAS-6 data between February 8 and May 12, 1989, was affected by a bad Setra barometer. Setra
barometric data was in error by up to 30 millibars. All MOBLAS-6 data during this interval was corrected
and believed to be accurate to at least 3 millibars.
All MOBLAS-6 calibration data between April 1 and September 26, 1990, was unusually noisy (twice the
normal RMS). The LAGEOS data during this period is suspected to be bias free. The calibration data
returned to normal when some adjustments were performed on the HP5370 in late September [MOBLAS-6,
19901.
5. MOBLAS-7
5.1 MOBLAS-7 Eccentricities
Since January 1, 1981, MOBLAS-7 has only occupied one monument/marker (7105); however, two other
laser systems (TLRS-2, 71051206, and MOBLAS-2, 71050207) have been referenced to marker 7105. There
exists 14 sets of MOBLAS-7 eccentricities and 21 MOBLAS-7 SOD's at 7105.
The reason for the 5mm change in the east ecc. between the 1981 and 1984 survey is assumed to be caused
by movement of the survey monument to the East or by movement of the MOBLAS support pad to the West
[Nelson, 1984].
During the 1985 pre-collocation survey of MTLRS-1 and MOBLAS-7, a 2 em discrepancy was found in the
7105 Up eccentricity [Nelson, 1985]. The original determination of the Up eccentricity is suspected to be in
error [Nelson, private communication]; and therefore, the 1985 Up eccentricity can be backdated to
Jan 1, 1981.
Prior to the TLRS-I and MOBLAS-7 collocation in 1986 [Nelson, 1986], MOBLAS-7 eccentricities were
measured on three different occasions, once in December 1985 and twice in January 1986 (before and after
the MOBLAS-7 mount was releveled on January 18, 1986). There were millimeter level changes between
these surveys. This would give SOD 71050709 five unique sets of eccentricities.
6-67

During October 1989, a 1-2 cm bias existed between MOBLAS-7 and TLRS-3 [Varghese and Husson, 1989]
and a follow-up survey indicated cm level movement of the MOBLAS-7 reference point. Polyquick
collocation analysis revealed that the movement appeared to have occurred in August 1989; therefore, the
October 12, 1989 survey can be backdated to August 25, 1989.
MOBLAS-7 was down for approximately 6 months in early-1990 due to a major slip ring failure. During
this period that the slip rings were being repaired, MOBLAS-7 was removed from it's pad in order that the
pad could be reinforced. Prior to ranging and after MOBLAS-7 re-occupied marker 7105, the eccentricities
were remeasured. Table 7 contains the recommended set of MOBLAS-7 eccentricities with their
corresponding SOD(s) and effective starting dates.
5.2 MOBLAS-7 LAGEOS BiasesThe net MOBLAS-7 recoverable biases (range and time) are presented in Table 8. To correct MOBLAS-7
LAGEOS data, the known range and time biases (in Table 8) should be subtracted from the LAGEOS range
and timetags, respectively. Any time there is the potential for a change in the bias(es), even though the
bias(es) did not change, a new entry has been added. A component breakdown of the biases is presented,
followed by a section describing known problem data, and followed by a section describing potential problem
data.
5.2.1 MOBLAS-7 ND filters
All MOBLAS-7 LAGEOS data was biased short by 3mm +__1,1mm + 1,3mm + 1, and lmm + 1 from
January 1, 1981 through July 9, 1991; from July 10 through 23, 1991; from July 24 through October 17,
1991; and from October 18, 1991 through May 31, 1992; respectively, due to ND filters. The OAM was
installed on July 10, 1991, removed on July 24, 1991, and reinstalled on October 18, 1991. After June 1,
1992, this bias has been removed through modelling.
5.2.2 MOBLAS-7 signal strength
MOBLAS-7 LAGEOS data was biased long by 30mm + 15, 4mm + 2, 7mm + 3, 30ram + 10, 5mm + 3,
3mm + 2, and 4mm + 2 from August 22, 1983 through February 29, 1984; from March 1 through July 31,
1984; from August 1 through September 30, 1984; from October 1, 1984 through January 25, 1985; from
January 26, 1985 through March 31, 1985; from April 1, 1985 through March 30, 1986; and from February
1, 1988 through April 30, 1988; respectively, due to signal strength. This bias would vary slightly (several
ram) from pass-to-pass and would have a slight elevation dependence. Low elevation data would be biased
longer than high elevation data. Signal strength effects were reduced as system calibration techniques
improved, and were eliminated when the MCPPMT package was installed in MOBLAS-7 on March 31, 1986.
5.2.3 MOBLAS-7 elevation angles
Prior to January 1, 1988, the tropospheric range correction applied to the fullrate data was computed
based on the MOBLAS-7 encoder measurements. To remove this error in pre-1988 MOBLAS-7 data, the
applied tropospheric refraction must be removed and reapplied using the computed elevation angle.
5.2.4 MOBLAS-7 calibration targets/distances
MOBLAS-7 has used 3 different calibration targets (1 board and 2 cube corners) at marker 7105. From
January 1, 1981 through September 19, 1986; from September 20 through December 5, 1986; and from
December 6, 1986 to the present; the MOBLAS-7 primary calibration targets were the 3Km board, the
second 3Km cube corner, and the 200m Nelson pier, respectively.

MOBLAS-7hasbeensurveyedatleastonce per year since January 1984. The February 1981 and the June
1981 surveyed board ranges were incorrect, causing all MOBLAS-7 data from March 1 through
June 30, 1981 and from July 1 through December 31, 1981 to be biased long by 49mm + 20 and
22mm +_. 20, respectively.
Between the 1984 and 1985 surveys, the board range changed by 17mm, however; historical minico results
support the 1984 survey value [Heinick, 1985] for the board range (not the 1985 value). On
February 7, 1986, the guy wires were tensioned on the calibration board before the board was resurveyed
(12mm change); however, the new surveyed calibration board range was not used until March 2, 1986.
Therefore, all MOBLAS-7 LAGEOS passes from August 1, 1985 through February 6, 1986, and from
February 7 through March 1, 1986, is biased long by 17mm +__20 and short by 12mm + 20, respectively,
for the LAGEOS passes in Table 9. Occasionally due to ground fog conditions, the board could not be
ranged, so the secondary calibration target, the 3km cube corner, was used. All passes in Table 9 were
calibrated using the original 3Km cube corner and are believed to have the correct calibration distance.
Between the January and October 1989 surveys, the Nelson pier target range changed by 15mm due to
movement of the MOBLAS-7 reference point. Apparently, the MOBLAS-7 reference point moved around
August 25, 1989 based upon intercomparison with TLRS-3 [Varghese and Husson, 1989]. All MOBLAS-7
data from August 25 through October 11, 1989 is biased short by 15mm.
5.2.5 MOBLAS-7 TDEL
All MOBLAS-7 data from July 13, 1989 through September 27, 1990, and from September 28, 1990
through May 31, 1992 contains a time bias -0.5 and -0.3 microseconds, respectively. This correction is only
valid after July 13, 1989, because on this date, the MOBLAS-7 TDEL electronics were modified to eliminate
other TDEL sub-microsecond accuracy ambiguities, which would have masked this bias. On September 28,
1990, the cable length causing this bias was shortened, which caused a decrease in the magnitude of the bias.
This bias has been eliminated through modelling, effective June 1, 1992.
5.2.6 MOBLAS-7 known problem data
All MOBLAS-7 data between January 13 through January 17, 1986, has a reference frequency problem
and should not be used. The HP5370 frequency was on internal frequency during this period of time.
5.2.7 MOBLAS-7 potential problem data
All MOBLAS-7 LAGEOS data between June 7 and June 13, 1984 was noisy (100-130mm) and should be
used with caution. The cause of the high noise is unknown.
All MOBLAS-7 LAGEOS data between September 25 and October 5, 1984 was noisy (80-120mm) and
should be used with caution. The cause of the high noise is unknown.
6. MOBLAS-8
6.1 MOBLAS-8 Eccentricities
Since October 1, 1981, MOBLAS-8 has only occupied one monument/marker (7109). In July 1982, the
MOBLAS-4 and MOBLAS-8 morns vans were switched. There exists 9 sets of MOBLAS-8 eccentricities, and
15 MOBLAS-8 SOD's at 7109.
6-69

On August 4, 1982 the system was releveled, but there was not a follow-up survey until 1984, which
indicated a 17ram change in the Up ecc. Nelson [1984] recommends that the 1984 survey be backdated to
1982. There was a 4ram change in the Up ecc between 1985 and 1988, possibly due to settlement of the laser
support slab [Nelson ,1985]. Table 10 contains the recommended set of MOBLAS-8 eccentricities with their
corresponding SOD(s) and effective starting dates.
6.2 MOBLAS-8 LAGEOS Biases
The net MOBLAS-8 recoverable biases (range and time) are presented in Table 11. To correct
MOBLAS-8 LAGEOS data, the known range and time biases (in Table 11) should be subtracted from the
LAGEOS range and timetags, respectively. Any time there is the potential for a change in the bias(es), even
though the bias(es) did not change, a new entry has been added. A component breakdown of the biases is
presented and followed by a section describing known problem data.
6.2.1 MOBLAS-8 ND filters
All MOBLAS-8 LAGEOS data was biased short by 3mm + 1 and lmm + 1 from September 1, 1981
through April 7, 1992, and from April 8, 1992 through May 31, 1992, respectively, due to ND filters. On
April 7, 1992, the OAM was installed in MOBLAS-8 reducing the N-D filter bias. After June 1, 1992, this
bias has been removed through modelling.
6.2.2 MOBLAS-8 signal strength
MOBLAS-8 LAGEOS data was biased long by 5mm + 3, 10ram + 5, 6mm + 3, and 3ram + 2 from
August 4, 1982 through December 31, 1983; from January 1 through March 31, 1984; April 1 through July
31, 1984; and from August 1, 1984 through September 25, 1986; respectively, due to signal strength. This
bias would vary slightly (several mm) from pass-to-pass and would have a slight elevation dependence. Low
elevation data would be biased longer than high elevation data. Signal strength effects were reduced as
system calibration techniques improved, and were eliminated when the MCPPMT package was installed in
MOBLAS-8 on September 26, 1986.
6.2.3 MOBLAS-8 elevation angles
Prior to January 1, 1988, the tropospheric range correction applied to the fullrate data was computed
based on the MOBLAS-8 encoder measurements. To remove this error in pre-1988 MOBLAS-8 data, the
applied tropospheric refraction must be removed and re.applied using the computed elevation angle.
6.2.4 MOBLAS-8 calibration targets/distances
MOBLAS-8 has used 5 different calibration targets (2 boards and 3 cube corners) at marker 7109. From
September 1, 1981 through August 19, 1985; from August 20, 1985 through December 31, 1986; from
January 1, 1987 through March 22, 1989; from March 23, 1989 through April 7, 1992; and from April 8,
1992 to the present; MOBLAS-8 primary calibration targets were the original 2Km board, the second 2Km
board, the second 2Km cube corner, the 2Km Nelson pier, and the 200m Nelson pier, respectively.
6-70

MOBLAS-8 was surveyed 7 times (1981, 1982, 1984, 1985, 1988, and twice in 1991) at marker 7109.
During August 1985, new calibration targets (a 2Km board and 2Kin cube corner) were built to replace the
vandalized 2Km board and 2Km cube corner [Nelson, 1985]. The guy wires had been cut on both targets.
The newly constructed board became the operational target, effective August 20, 1985. The preliminary
board range and the final surveyed board range published in the November 1985 survey sheet were different
by 10mm. It is not known at this writing when the "official" number was used for fullrate data processing.
Sometime between October 1986 and January 1987, the cube corner became the operational target. In
December 1988, these targets were resurveyed along with a newly constructed 2Km Nelson pier. Between the
1985 and 1988 surveys, the board and cube corner ranges changed by 14mm and llmm, respectively.
Historical minico results, since January 1987, suggest that 1985 and 1988 cube corner surveyed ranges were
in error by -20ram and -9mm, respectively. Therefore, MOBLAS-8 data was biased long by 20 + 15 and
9 + 10ram from January 1, 1987 through December 11, 1988, and from December 12, 1988 through March
22, 1989, respectively. More research is needed into data processing results prior to January 1987.
6.2.5 MOBLAS-8 TDEL
All MOBLAS-8 data from November 22, 1989 through May 31, 1992, contains a time bias of +0.3
microseconds. This correction is only valid after November 22, 1989, because on this date, the MOBLAS-8
TDEL electronics were modified to eliminate other TDEL sub-microsecond accuracy ambiguities, which
would have masked this bias. This bias has been eliminated through modelling, effective June 1, 1992.
All MOBLAS-8 data from August 4, 1982 (the date of the moms van swap with MOBLAS-4) through
October 26, 1986 was biased late depending on the interval of a second the laser was fired [MOBLAS-8 crew
and Heinick, 1986]. The transmit delays (FDEL) on the .0, .2, .4, .6, .8 second intervals were reading high
by 0.0, 3.2, 6.4, 9.6, and 11 microseconds, respectively, due to a wiring problem. Since MOBLAS-8 data
was equally distributed in these different time intervals, a mean offset of 6.0 microseconds can be post-
applied to the data. The TDEL wiring problem was fixed on October 27, 1986.
6.2.6 MOBLAS-8 known problem data
All MOBLAS-8 data between January 1 through March 4, 1982, exhibited very high RMS's (300-600mm)
due to poor hardware performance. This data probably contains significant biases and should not be used.
The hardware was repaired on March 5, 1982, and the RMS's returned to nominal levels.
7. CONCLUDING REMARKS
The present article has been the first attempt to characterize known biases contained in historical
MOBLAS LAGEOS data; however, more research into historical ground test results and calibration
processing information is needed to resolve potential biases. These bias models and eccentricity information
should improve the quality of the historical MOBLAS LAGEOS dataset. We encourage other global data
producing centers to characterize their historical biases.
In the 1980-1983 timeframe, the laser was the dominant MOBLAS systematic error source. In the 1984-
1986 timeframe, target stability, survey related issues, and signal strength effects were the dominant error
sources. In the 1987-1988 timeframe, target stability and survey related issues were the dominant error
sources. In the 1989-1992 timeframe, the HP5370 counter and ND filters appear to have been the dominant
error sources. Some of the above mentioned systematic errors are recoverable (to some level) using historical
processing results; however, orbital analysis may be the only way to unravel the "net" biases in the global
SLR dataset to the 10mm level. These bias models will evolve as historical SLR data is better understood by
close cooperation of the data producer and the data user.
6-71
8. ACKNOWLEDGEMENTSThe material in this article has been amassed through years of close interaction with a highly talented
group of colleagues at the Bendix Field Engineering Corporation in Greenbelt and Columbia, Md; at the
NASA Goddard Space Flight Center in Greenbelt, Md; and at the Center for Space Research in Austin,
Texas, and much of their work is referenced here.
6-72

REFERENCES
Brogdon O. L., Heinick J. M., MOBLAS Ground Test Results, Bendix Field Engineering Corporation
internal reports, 1980-1983.
Crawford W. F., LTN Data, Bendix Field Engineering Corporation internal report, Nov. 1985.
Degnan J. J., Satellite Laser Ranging: Current Status and Future Prospects, IEEE Trans. Geosci. Remote
Sensing, Vol GE-23 Number 4, pp 398-413, Jul. 1985.
Eichinger R. A., Oldham T. J., MOBLAS 4, 6, 7, 8 AntiparaIlax Optical Path Differences, Bendix Field
Engineering Corporation internal reports, 1990-1992.
Heinick J. M., Receive Energy Dependence and Correction at MOBLAS 4, 5, 7, and 8, Bendix Field
Engineering Corporation, presented at the spring 1984 AGU, Feb. 1984.
Heinick J. M, Husson V. S., Wroe S. A., Brogdon O. L., Wetzel S. L., Clarke C. B., Six Month Data
Processing Report, Bendix Field Engineering Corporation internal report, Nov. 1989.
Heinick J. M., MOBLAS-7's calibrations using the corner cube and the most recently published calibration
board range, Bendix Field Engineering Corporation internal report, Oct. 1985.
Husson V. S., Wroe S. A., MOBLAS-5 Processing Dilemma Update, Bendix Field Engineering
Corporation, presented at the weekly CDPSLR meeting, Oct. 1987.
Husson V. S., Wetzel S. L., MOBLAS-6 Processing Dilemma Update, Bendix Field Engineering
Corporation, presented at the weekly CDPSLR meeting, Oct. 1987.
Husson V. S., Wroe S. A., Wetzel S. L., TLRS-I/MOBLAS-7 Collocation Analysis Report, Bendix Field
Engineering Corporation internal report, 1987.
McCollums D. L., private communication, Bendix Field Engineering Corporation.
McCollums D. L., Varghese T. K., MOBLAS-7 System Characterization Reports, Bendix Field
Engineering Corporation, 1986-1988.
MOBLAS-8 Crew, Heinick J. M., MOBLAS-8 Transmit Delay Investigation, Bendix Field Engineering
Corporation internal report, Oct. 1986.
Murphy B., Nelson V. E., MOBLAS 5 Survey Reports, Australian Division of National Mapping, Bendix
Field Engineering Corporation, 1979/80, 1987, 1992.
Nelson V. E., MOBLAS 4 Survey Reports, Bendix Field Engineering Corporation, 1983, 1985, 1988, 1992.
Nelson V. E., MOBLAS 6 Survey Reports, Bendix Field Engineering Corporation, 1983, 1988, 1989, 1991.
Nelson V. E., MOBLAS 7 Survey Reports, Bendix Field Engineering Corporation, 1981, 1982, 1984, 1985,
1986, 1987, 1988, 1889, 1990, 1991, 1992.
Nelson V. E., MOBLAS 8 Survey Reports, Bendix Field Engineering Corporation, 1981, 1982, 1984, 1985,1988, 1989, 1991.
Nelson V. E., private communication, Bendix Field Engineering Corporation.
6-73

Nelson V. E., System Eccentricity Measurement Procedures for MOBLAS Systems, Bendix Field
Engineering Corporation internal report, 1986.
Oldham T. J., private communication, Bendix Field Engineering Corporation.
Pearlman M. R., Laser System Characterization, Smithsonian Institution Astrophysical Observatory,
Proc. 5th Int. Workshop on Laser Ranging Instrumentation, Sep. 1984.
Selden M. D., Varghese T. K., Heinick J. M., Oldham T. J., Preliminary Results from the Portable
Standard Satellite Ranging Intercomparison with MOBLAS-7, Proc. 8th Int. Workshop on Laser Ranging
Instrumentation, May 1992.
See D., Sneed R. S., Suggestions for new or improved LRC logic, Bendix Field Engineering Corporation
internal report, Oct. 1988.
Silva T. D, Malitson P. H. Eichinger R. E., Optical Attenuation Mechanism, Bendix Field Engineering
Corporation internal report, Feb. 1991.
Smith D. E., Kolenkiewicz R., Dunn, P. D., Klosko S. M., Robbins J. W., Torrence M. H., Williamson R.
G., Pavlis E. C, Douglas N. B, Fricke S. K., LAGEOS Geodetic Analysis--SL7.1, NASA Technical
Memorandum 104549, Sep. 1991.
Varghese T. K., Heinick J. M., Sub-cm Multiphotoelectron Satellite Laser Ranging, Bendix Field
Engineering Corporation, Proc. of 6th Int. Workshop on Laser Ranging Instrumentation, 1986.
Varghese T. K., Husson V. S., TLRS-3: Engineering Upgrades and Performance Evaluation through
Intercomparison with MOBLAS-7 from Oct. 88 - Nov. 89., Bendix Field Engineering Corporation internal
report, Nov. 1989.
Wroe S. A., Heinick J. M., Brogdon O. L., Wetzel S. L., Clarke C. B, Cheng G. S., Horvath J. E.,
MOBLAS Ground Test Results, Bendix Field Engineering Corporation internal reports, 1984-1992.
6-74

Table 1. MOBLAS-4 Eccentricities for SOD 711004xx
Occ. Start North East Up Revis.
No. Dat___g (M) _ (M) Dat___ge
2 08/15/83 -0.033 -0.015 3.209 01Aug92
2-3 06/2,0/85 -0.033 -0.015 3.210 01Aug92
3-10 04/27/88 -0.033 -0.016 3.213 01Aug92
10 02/01/92 -0.031 -0.016 3.213 01Aug92
11 04/21/92 -0.026 -0.019 3.189 01Aug92
Comments
First survey
lmm change in Up
1 & 3mm change in East and Up
2mm change in North, no survey
sheet published
Mount replacement
Table 2. MOBLAS-4 LAGEOS Biases at 7110
Range Time Revis.
Time Span Bias(mm) Bi_(us) Date Comments
08/15/83 - 04/11/84 17 0 01Aug92
04/12/84 - 05/24/84 17 0 01Aug92
05/25/84 - 06/30/84 17 0 01Aug92
07/01/84 - 08/31/84 7 0 01Aug92
09/01/84 - 06/19/85 3 0 01Aug92
06/20/85 - 07/31/85 3 0 01Aug92
08/01/85 - 11/19/86 1 0 01Aug92
11/20/86- 12/31/86 -3 0 01Aug92
01/01/87- 10/31/87 -3 0 01Aug92
11/01/87- 12131/87 -3 0 01Aug92
01101188 - 01/28/88 -3 0 01Aug92
01/29/88 - 04/29/88 -3 0 01Aug92
04/30/88- 12/28/88 -3 0 01Aug92
12/29/88 - 01/27/89 -3 0 01Aug92
01/28/89- 11/06/89 -3 0 01Aug92
11/07/89- 11/11/90 -3 0 01Aug92
11/12/90 - 01/04/90 -3 0 01Aug92
01/05/90 - 12/05/91 -3 -0.4 01Aug92
12/06/91 - 01/17/92 -3 -0.4 01Aug92
01/18/92 - 04/20/92 -1 -0.4 01Aug92
04/21/92 - 05/31/92 -1 -0.4 01Aug92
Quantel, 2233B, 5370, Ortec, & board
(1954.6037m)
Gating problem causing discontinuous data, see
2.2.6
Data quality returned to normal
Improvement in amplitude modelling
Improvement in amplitude modelling
New target range (1954.5910m), see 2.2.4
para. 2
Improvement in amplitude modelling
MCP & Tennelec disc. installed
Cube corner (1955.469m)
Unstable cube corner, see 2.2.4 para. 4
Computed angles used, see 2.2.3, unstable cube
corner, see 2.2.4 para. 4
Cal. board (1954.5910m)
Long Nelson pier (1955.2677m)
Questionable data, bad counter, see 2.2.7
New counter installed
New range (1955.2682m), cube replaced
Cube vandalized and replaced (1955.2600m)
Transmit delay modification see 2.2.5
Translator installed, short Nelson pier
(186.9920m)
OAM installed
Mount replaced, new target range (186.9986m)
6-75

Table 3. MOBLAS-5 Eccentricities for SOD 709005xx
Occ. Start North East Up Revis.
No___. Date (M) (M) fM) l)at_
1-8
8-10
11-12
08/01/79 0.003 0.011 3.185 01Aug92
10/15/87 0.003 0.010 3.177 01Aug92
01/12/92 -0.011 0.020 3.181 01Aug92
Comments
First survey
lmm & 8mm change in East and Up
Mount replaced
Time
08/01/79
06/08/80
07/27/83
06/01/85
04/23/87
06/01/87
08/01/87
08126/87
01101/88
08/12/88
02/01/89
01130/90
07123190
12/19/91
01/04/92
01/12/92
Table 4. MOBLAS-5 LAGEOS Biases at 7090
Range Time Revis.
Span Bias(mm) _ Date Comments
- 06/07/80 -23 0 01 Aug92
- 07/26/83 -3 0 01Aug92
- 05/31/85 -6 0 01Aug92
- 04/22/87 3 0 01Aug92
- 05/31/87 6 0 01Aug92
- 07/31/87 -3 0 01Aug92
- 08/25/87 -3 0 01Aug92
- 12/31/87 -3 0 01Aug92
- 08/11/88 -3 0 01Aug92
- 01/31/89 -3 0 01Aug92
- 01/29/90 -3 0 01Aug92
- 07/22/90 -3 0 01Aug92
- 12/18/91 -3 0 01Aug92
- 01/03/92 -3 0 01Aug92
- 01/11/92 -3 0 01Aug92
- 05/31/92 -3 0 01Aug92
GP laser, 2233B, 5360, Ortec, & board
(2065.491m), gating problem see 3.2.6
New board (3100.2532m) used
Quantel & 5370 installed
Suspect 9mm error in target range, see 3.2.4
MCP & Tennelec disc. installed
Cube corner (1257.9630m) used
Board (3100.2442m) used
Long Nelson pier (3116.8969m) used
Computed angles used, see 3.2.3
High cal. shifts, see 3.2.8
Cal. shifts return to normal
Transmit delay modification, see 3.2.5
New range (3116.8974m), cube replaced
Bad data, stuck bit see 3.2.7
Stuck bit repaired
Mount replaced, new survey (3116.9047m)
6-76

Table 5. MOBLAS-6 Eccentricities for SOD 712206xx
Occ. Start North East Up Rev.
No. Dat____e (M_ (M) /M) Dat.___ge Comments
1-4 05/01/83 0.001 -0.007 3.182 01Aug92
4-7 05/03/88 0.002 -0.006 3.181 01Aug92
8-9 06/23/89 0.002 -0.006 3.181 01Ang92
9 04/30/91 0.002 -0.006 3.181 01Aug92
First survey
lmm change in all eccs., see 4.1
No change
No change, final survey
Table 6. MOBLAS-6 LAGEOS Biases at 7122
Range Time Revis.
Time Span Bias(mm) _ Date Comments
05/01/83 - 09/30/83 -3 0 01Aug92
10/01/83 - 01/31/84 19 0 01Aug92
02/01/84 - 03/01/84 19 0 01Aug92
03/02/84 - 04/30/84 19 0 01Aug92
05/01/84 - 03/31/86 31 0 01Aug92
04/01/86 - 08/31/86 29 0 01Aug92
09/01/86 - 01/27/87 23 0 01Aug92
01/28/87 - 03/26/87 19 0 01Aug92
03/27/87- 12/31/88 -14 0 01Aug92
01/01/88 - 05/02/88 -14 0 01Aug92
05/03/88 - 08/16/88 -8 0 01Aug92
08/17/88 - 08/31/88 1 0 01Aug92
09/01/88 - 09/30/88 2 0 01Aug92
10/01/88- 10/31/88 3 0 01Aug88
11/01/88- 11/30/88 4 0 01Aug92
12/01/88- 12/31/88 5 0 01Aug92
01/01/89 - 01/31/89 6 0 01Aug92
02/01/89 - 02/28/89 7 0 01Aug92
03/01/89 - 03/31/89 8 0 01Aug92
04/01/89 - 04/30/89 9 0 01Aug92
05/01/89 - 05/12/89 10 0 01Aug92
05/13/89 - 05/31/89 10 0 01Aug92
06/01/89 - 06/22/89 11 0 01Aug92
06/23/89 - 11/16/89 -3 0 01Aug92
11/17/89 - 01/10/90 -3 0 01Aug92
01/11/90 - 03/31/90 -3 0 01Aug92
04/01/90 - 09/26/90 -3 0 01Aug92
09/27/90 - 04/30/91 -3 0 01Aug92
GP laser, 2233B, 5360, Ortec, & Board
(2229.1998m)
Hurricane, suspect target movement, see 4.2.4,
para 2
Bad distribution amplifier, see 4.2.6
Distribution amplifier replaced
Quantel laser and HP5370 installed
Improvement in amplitude modelling
Improvement in amplitude modelling
MCP and Tennelec installed
Cube corner used (2229.4086m)
Computed angles used, see 4.2.3
New cube corner range used (2229.4150m)
First Nelson pier used (2229.2215m)
Nelson pier movement, see 4.2.4 para 3
Nelson pier movement
Nelson pier movement
Nelson pier movement
Nelson pier movement
Nelson pier movement, bad barometric data
Nelson pier movement, bad barometric data
Nelson pier movement, bad barometric data
Nelson pier movement, bad barometric data
Barometer repaired
Nelson pier movement
Second Nelson pier used (2232.7419m)
New range (2232.7447m), cube replaced
Transmit delay modification
Calibration RMS's are high
Calibration RMS's return to normal levels
6-77

Table 7. MOBLAS-7 Eccentricities for SOD 710507xx
Occ. Start North East Up Rev.
No. Dat....ee (M) (M) (M) Date
1-4 01/01/81 0.016 -0.026 3.169 01Aug92
5 03/22/84 0.017 -0.031 3.169 01Aug92
8 05/07/85 0.017 -0.031 3.169 01Aug92
9 07/29/85 0.017 -0.032 3.169 01Aug92
9 12/13/85 0.017 -0.032 3.170 01Aug92
9 01/17/86 0.016 -0.031 3.168 01Aug92
01/22/86 0.017 -0.031 3.168 01Aug92
03/17/86 0.017 -0.031 3.168 01Aug92
10/06/86 0.017 -0.031 3.168 01Aug92
06/18/87 0.017 -0.031 3.168 01Aug92
01/09/89 0.017 -0.031 3.168 01Aug92
08/25/89 0.035 -0.040 3.162 01Aug92
9
9-10
10-11
11-12
13
15-16
17-18 07/25/90 -0.014 -0.033 3.153 01Aug92
19-23 12/10/90 -0.014 -0.033 3.153 01Aug92
Comments
First survey, Up was in error
1 & 5mm change in North & East
No change
lmm change in East
lmm change in Up
1, 1 and 2mm changes in North,
East, and Up
lmm change in North
No change
No change
No change
No change
System moved, 18mm, 9mm, 6mm
changes in North, East, and Up
Relocation
No change
6-78

Table 8. MOBLAS-7 LAGEOS Biases at 7105
Time Span
01/01/81 - 06/30/81
07101181 - 12/31/81
01/01/82 - 01/31/83
02101183 - 08121/83
08/22/83 - 02/29/84
03/01/84 - 03/21/84
03/22/84 - 06/06/84
06/07/84 - 06/13/84
06/14/84 - 07/31/84
08/01/84 - 09/24/84
09/25/84 - 09/30/84
10/01/84- 10/05/84
10/05/84 - 01/25/85
01/26/85 - 03/31/85
04/01/85 - 07/31/85
08/01/85 - 01/12/86
01/13/86 - 01/17/86
01/18/86 - 02/06/86
02/07/86 - 03/01/86
03/02/86 - 03/30/86
03/31/86 - 09/30/86
10/01/86 - 12/05/86
12/06/86 - 12/31/87
01/01/88 - 01/31/88
02/01/88 - 04/30/88
05/01/88 - 01/08/89
01/09/89 - 06/14/89
06/15/89 - 07/12/89
07/13/89 - 08/02/89
08/03/89 - 08/24/89
08/25/89- 10/11/89
10/12/89 - 07/23/90
07/24/90 - 09/27/90
09/28/90 - 12/09/90
12/10/90 - 07/09/91
07/10/91 - 07/23/91
07/24/91 - 10/17/91
10/18/91 - 05/31/92
Range Time Revis.
Bias(ram) _ Date
46 0 01Aug92
19 0 01Aug92
-3 0 01Aug92
-3 0 01Aug92
27 0 01Aug92
1 0 01Aug92
1 0 01Aug92
1 0 01Aug92
1 0 01Aug92
4 0 01Aug92
4 0 01Aug92
27 0 01Aug92
27 0 01Aug92
2 0 01Aug92
0 0 01Aug92
17 0 01Aug92
17 0 01Aug92
17 0 01Aug92
-12 0 01Aug92
0 0 01Aug92
-3 0 01Aug92
-3 0 01Aug92
-3 0 01Aug92
-3 0 01Aug92
1 0 01Aug92
-3 0 01Aug92
-3 0 01Aug92
-3 0 01Aug92
-3 -0.5 01Aug92
-3 -0.5 01Aug92
-18 -0.5 01Aug92
-3 -0.5 01Aug92
-3 -0.5 01Aug92
-3 -0.3 01Aug92
-3 -0.3 01Aug92
-1 -0.3 01Aug92
-3 -0.3 01Aug92
-1 -0.3 01Aug92
Comments
GP laser, 2233B, 5360, Ortec, & board
(3225.460m)
Slyvania laser installed, board (3225.433m)
Board (3225.411m)
HP5370 counter installed
Quantel laser installed
Improvement in amplitude modelling
New board (3225.421m)
Data suspect, high RMS's, see 5.2.7
RMS's return to normal
Increase in amplitude dependence
Data suspect, high RMS's, see 5.2.7
Increase in ampl. dependence, high RMS's
RMS's return to normal
Improvement in amplitude modelling
Improvement in amplitude modelling
New range (3225.438m), see 5.2.4 & Table 9
5370 on internal frequency, see 5.2.6
5370 put back on external frequency
Guy wires on board tensioned, Secondary cal.
target new cube corner (3482.552m)
New board range (3225.450m)
MCP and Tennelec disc. installed
Cube corner used (3482.547m)
Nelson pier used (223.385m), antiparallax
hardware installed
Computed angles used 5.2.3
Amplitude dependence (+ 4ram)
Elimination of amplitude dependence
New range (223.3868m)
New antiparallax hardware installed
Transmit delay modification, see 5.2.5
Original antiparallax hardware installed
Apparent movement of system, see 5.2.4
New range (223.4018m)
New range (223.3922m), cube replaced
TDEL cable shortened, see 5.2.5
New antiparallax hardware installed
OAM installed
OAM removed
OAM reinstalled
6-79

Table 9. MOBLAS-7 Cube Corner Calibrated LAGEOS Passes
(The range biases for these passes would be 0)
Date Time
08/09/85 5:20
08/09/85 8:51
08/14/85 5:51
08/28/85 4:11
08/29/85 6:16
08/29/85 9:42
08/30/85 8:30
08/31/85 7:08
09/04/85 5:10
09/04/85 8:36
09/06/85 5:55
09/06/85 9:22
09/07/85 4:35
09/07185 8:03
09/10/85 3:59
09/10/85 7:31
09/11/85 2:52
09/11/85 6:15
09/11185 9:37
09/17/85 5:04
09/18/85 10:38
09/20/85 8:01
09/21/85 9:59
10/01/85 10:22
10/07/85 12:49
10/08/85 11:24
10/16/85 11:34
10/17/85 13:22
12/03/85 21:32
12/04/85 0:59
02/13/86 22:07
6-80

Table 10. MOBLAS-8 Eccentricities for SOD 710908xx
Occ. Start North East Up Rev.
No_..._. Date 0Vl) (M) ¢M3 Date Comments
1 09/01/81 0.012 0.011 3.225 01Aug92
1 07/22/82 -0.029 0.011 3.124 01Aug92
1-2 08/04/82 -0.029 0.011 3.141 01Aug92
2-3 09/24/84 -0.029 0.011 3.141 01Aug92
3-5 08/20/85 -0.029 0.011 3.142 01Aug92
6-11 12/12/88 -0.027 0.012 3.138 01Aug92
12 12/01/91 -0.019 0.005 3.184 01Aug92
13-15 12/12/91 -0.035 -0.003 3.184 01Aug92
First Survey
M8 & M4 mom's van swap
System releveled, 17mm change in
Up, based on 84 survey
No survey sheet
lmm change in Up
2, 1, & 4mm change in North, East,
and Up
Mount replacement
System releveled, 16 & 8mm change
in North and East
Table 11. MOBLAS-8 LAGEOS Biases at 7109
Range Time Revis.
Time Span Bias(mm) _ Date Comments
09/01/81 - 12/31/81 -3 0 01Aug92
01/01/82 - 03/04/82 -3 0 01Aug92
03/05/82 - 08/03/82 -3 0 01Aug92
08/04/82 - 12/31/83 2 + 6.0 01Aug92
01/01/84 - 03/31/84 7 +6.0 01Aug92
04/01/84 - 07/31/84 3 + 6.0 01Aug92
08/01/84 - 08/19/85 0 + 6.0 01Aug92
08/20/85 - 09/25/86 0 + 6.0 01Aug92
09/26/86- 10/26/86 -3 +6.0 01Aug92
10/27/86- 12/31/86 -3 0 01Aug92
01/01/87- 12/31/87 17 0 01Aug92
01/01/88- 12/11/88 17 0 01Aug92
12/12/88 - 03/22/89 6 0 01Aug92
03/23/89- 11/06/89 -3 0 01Aug92
11/07/89- 11/21/89 -3 0 01Aug92
11/22/89- 11/30/91 -3 -0.3 01Aug92
12/01/91 - 12/11/91 -3 -0.3 01Aug92
12/12/91 - 04/06/92 -3 -0.3 01Aug92
04/07/92 - 05/31/92 -1 -0.3 01Aug92
GP laser, 2233B, 5360, Ortec, & board
(2394.087m)
Very high RMS's (300-600mm), see 6.2.6
Hardware repaired, data nominal
M4/M8 van switch, Quantel, HP5370, transmit
delay problem see 6.2.5, board (2394.120m)
Increase in amplitude dependence
Improvement in amplitude modelling
Improvement in amplitude modelling
New board used (2389.506 or 2389.496m), see
6.2.4
MCP & Tennelec disc. installed
Transmit delay wire connected, see 6.2.5
Cube corner used (2389.519m), see 6.2.4
Computed angles, see 6.2.3
New cube corner range (2389.508m)
Nelson pier used (2401.1450m)
New range (2401.1458m), cube replaced
Transmit delay modification, see 6.2.5
Mount re-installed, Nelson pier (2401.1392m)
Mount releveled, Nelson pier (2401.1576m)
Short range Nelson pier used (207.4742m), OAM
installed
6-81


![Proceedings of the Twenty-Eighth AAAI Conference on ...AAAI14]Hybrid... · †tzhou1@ntu.edu.sg, ‡jspan@i2r.a-star.edu.sg, ... Proceedings of the Twenty-Eighth AAAI Conference on](https://img.pdfslide.us/doc/110x75/5cbb885188c9937f418bf940/proceedings-of-the-twenty-eighth-aaai-conference-on-aaai14hybrid-tzhou1ntuedusg.jpg)