Embed Size (px)
Citation preview

20 – 25 June 2010
Figueira da Foz, Coimbra
PPOORRTTUUGGAALL
http://exrs2010.fis.uc.pt/
PROCEEDINGS OF THE 14TH
EUROPEAN CONFERENCE ON
X-RAY SPECTROMETRY, 2010
photo by Jorge Dias (www.jorgedias.com)

ISBN: 978-989-20-2881-1
Editors
Joaquim Marques Ferreira dos Santos
Maria Luísa de Carvalho
Elisabete Dinora Caldas de Freitas
Cristina Maria Bernardes Monteiro
EDXRF 2011 Proceedings, Coimbra (2011)

i
Local Organizing Committee
Joaquim Santos, University of Coimbra - Chair
M. Luisa Carvalho, University of Lisbon - Co-chair
Cristina Monteiro, University of Coimbra
Elisabete Freitas, University of Coimbra
Emanuel Gautier, University of Coimbra
Hugo Natal da Luz, University of Coimbra
João Veloso, University of Aveiro
José Lopes, University of Coimbra
Luis Requicha Ferreira, University of Coimbra
Luis Fernandes, University of Coimbra
Manuela Ramos Silva, University of Coimbra
International Advisory Committee
Burkhard Beckhoff, Germany
Maria Luisa Carvalho, Portugal
Roberto Cesareo, Italy
Stjepko Fazinić, Croatia
Jorge E. Fernandez, Italy
René Van Grieken, Belgium
Yohichi Gohshi, Japan
Marie-Christine Lepy, France
Marcelo Rubio, Argentina
Eva Selin-Lindgren, Sweden
Szabina Török, Hungary
Peter Wobrauschek, Austria
ii
Conference Sponsors
· EXSA – European X-ray Spectrometry Association (http://www.exsa.hu)
· Universidade de Coimbra (http://www.uc.pt)
· GIAN–Grupo de Instrumentação Atómica e Nuclear
(http://gian.fis.uc.pt/pt/index.html)
· FCTUC – Faculdade de Ciências e Tecnologia (http://www.uc.pt/fctuc)
· ADDF – Associação para o Desenvolvimento do Departamento de Física
· Universidade de Lisboa (http://www.ul.pt)
· Figueira Grande Turismo (http://www.figueiraturismo.com)
· Câmara Municipal da Figueira da Foz (http://www.figueiradigital.com/cmff)
· CAE, Figueira da Foz (http://www.cae.pt)
Industrial Exhibitors
· AMPTEK, Inc. http://www.amptek.com/
· BRUKER AXS http://www.bruker-axs-ma.com/
· Cambridge Scientific http://www.cambridgescientific.net/
· CANBERRA http://www.canberra.com/
· CLAISSE http://www.claisse.com/
· e2v Scientific Instruments http://www.e2vsi.com/
· AMETEK/EDAX/ SPECTRO http://www.ametek.de/
http://www.edax.com/
http://spectro.com/
· Elvatech, Ltd. http://www.elvatech.com/
· Gravimeta, Lda. http://www.gravimeta.pt/
· Fischer-Instruments, S.A. http://www.helmut-fischer.com/
· KETEK GmbH http://www.ketek.net/
· MOXTEK, Inc. http://www.moxtek.com/
· PANalytical B.V. http://www.panalytical.com/
· PNDetector GmbH http://www.pndetector.de/
· PNSensor GmbH http://www.pnsensor.de/
· Rigaku http://www.rigaku.com/
· ROENALYTIC GmbH/ Schaefer GmbH http://www.roentgenanalytik.de/
http://www.schaefer-tec.com/
· SII NanoTechnology USA Inc. http://www.siintusa.com/
· Thermo Fisher Scientific, Inc. http://www.thermo.fr/
· ToIvEl Co. http://www.toivel.com/
· XIA LLC http://www.xia.com/
· X-Ray Optical Systems, Inc. (XOS®) http://www.xos.com/
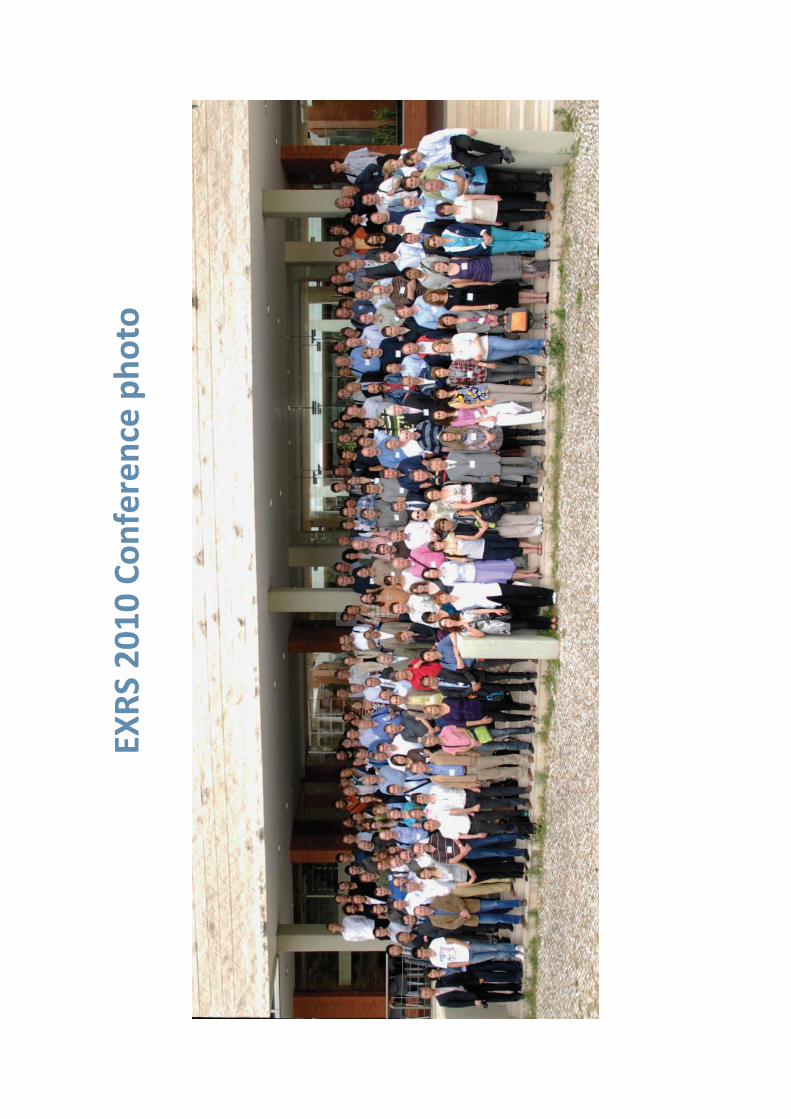
EX
RS
20
10
Co
nfe
ren
ce p
ho
to

iv
v
Contents European Conference on X-ray Spectrometry Conference Proceedings of the 14th European Conference on X-Ray Spectrometry, 2010
20-25 June, 2010, Figueira da Foz, Coimbra - PORTUGAL
X-ray sources, optics and detectors
Design of X-ray quasi-monochromatic source based on ion-beam accelerator
equipped with a X-ray focusing optical system
V. Storizhko, V. Denysenko, A. Drozdenko, M. Iljashenko, L. Shabel’nikov, S. Vershynskyi …. 1
Quantification methodology
Towards a quantitative analysis using a portable micro-EDXRF spectrometer
J. M. Sampaio, S. Pessanha, L. Peralta, P. Amorim and M. L. Carvalho…………….……….. 4
TXRF, GIXRF and related techniques
Analysis of mineral nutrients in Liquid Nutritional Products (LNP) by means of Total
reflection X-Ray Spectroscopy (TXRF)
H. Stosnach and R. Baechler .............................................................................................. 8
Sequential Micro Total Reflection X-ray Fluorescence Analysis
Masaya Kawamata and Kouichi Tsuji …………………………………………………...…… 15
PIXE and electron induced XRS
A new facility for High energy PIXE at the ARRONAX Facility
C. Koumeir, F. Haddad, V. Metivier, N. Servagent and N. Michel …………………………. 23
XRS Applications: Art and Cultural Heritage
Brass lamps: Preliminary study on the constituent materials and production
technology by X-ray and microscopical techniques
M. Simas, T. Ferreira, C. Dias, N. Schiavon, E. Fragoso, M. J. Furtado, R. J. C. Silva, A. Alegria,
A. Le Gac ……………………………………………………………..………………………... 34
vi
PIXE and PXRF comparison analysis of a standard canvas painting
C.R. Appoloni, F. Lopes, M.A. Rizzutto, A.C. Neiva, R. Ikeoka, A. Cacione and M. Rizzo … 45
Non Destructive Sourcing Ecuadorian Obsidians by PXRF
T. D. Galvão, F. Lopes and C. R. Appoloni …………………………………………………... 56
Determination of the elemental composition of a 19th century book by EDXRF:
understanding paper discoloration
S. Pessanha, F. Figueira, M. Manso, A. Guilherme, P. Amorim and M.L. Carvalho ……….. 64
XRS Applications: Earth and environment sciences
Optimization of operational scenarios of an EDXRF facility for the determination of
major and trace elements in environmental samples - Optimum EDXRF operational
scenarios for environmental samples analysis
N.A. Valmantonis, P.K. Rouni, M.J. Anagnostakis ……………………………………………. 69
X-Ray fluorescence determination of FeO content in rocks and iron ores
V. Chubarov, A. Finkelshtein ………………………………………………………………….. 81
XRS Applications: Life sciences and forensics
Vibrio harveyi bacteria under X-ray irradiation
P. Alifano, G. Buccolieri, V. Nassisi, F. Paladini, A. Talà, S.M. Tredici and M.V. Siciliano ...... 92
Potential Effects of Some Functional Food in Ovine Breeding: Analysis of Nutrition-
Relevant Trace Elements in Sheep Serum by TXRF
C. L. Mota, R. C. Barroso, S. C. Cardoso, L. Pascolo, B. Stefanon, S. Sgorlon, C. Scaini, D.
Braz and S. Moreira .......................................................................................................... 99
Inorganic elements determination in laboratory animals whole blood samples by
EDXRF technique
M. M. Redígolo, R. O. Aguiar, C. B. Zamboni, M. A. Scapin, V. L. R. Salvador and I. M.
Sato…………………………………………………………………………………………………..…… 113
Multianalytical techniques in brain lead determination: Hypothalamic Defence Area
and Nucleus Tractus Solitarius
D. Guimarães, M.L. Carvalho, M.S. Diniz V. Geraldes, I. Rocha, J.P. Santos …………….. 121
EXRS2010 Conference Proceedings 1
Design of X-ray quasi-monochromatic source based on ion-beam accelerator equipped with a X-ray
focusing optical system
V. Storizhko1, V. Denysenko1, A. Drozdenko1, M. Iljashenko1, L. Shabel’nikov2, S. Vershynskyi1
1 Institute of Applied Physics, National Academy of Sciences of Ukraine (IAP NASU),
58, Petropavlivska St., 40030 Sumy, Sumy Region, Ukraine 2 Institute of Microelectronics Technology and High-Purity Materials, Russian
Academy of Sciences (IMT RAS), 6, Institutskaya St., 142432 Chernogolovka, Moscow Region, Russia
E-mail: [email protected]
ABSTRACT Design and construction of a small-sized ion-impact X-ray source equipped with a X-ray focusing system is underway. A 2 MeV proton beam provides an X-ray yield comparable to that of 30-50 keV electron beams, with the bremsstrahlung background being reduced by nearly two orders of magnitude, which makes unnecessary filters or monochromators generally used for monochromatic radiation sources. Preliminary calculations and measurements of the characteristic X-ray yield for various converter materials were performed on the IAP NASU microanalytical facility. The expected K-radiation yield for the proton energy of 2 MeV is of the order of 10-4 photons/(proton*sr). To focus the ion beam it is intended to use doublet of two electrostatic quadrupole lenses. The X-ray radiation generated by the converter is to be focused using X-ray optical system. A possible application of the polycapillary optics in the source is considered. The source can be used in a variety of X-ray techniques, e.g. μXRF, XRD, TXRF, and CMT.
INTRODUCTION
The small-sized X-ray sources are widely used in science and engineering. One of the main problems of electron-impact X-ray sources is bremsstrahlung background. In order to reduce the background, filters or monochromators leading to intensity loss have to be used. But it is possible to create a source which generates quasi-monochromatic X-ray radiation. Such source can use ion beam and produce characteristic radiation. 2 MeV electrostatic accelerator based microanalytical facility [1, 2] available at the Institute of Applied Physics is to be used as ion beam source. ION-IMPACT X-RAY SOURCE YIELD
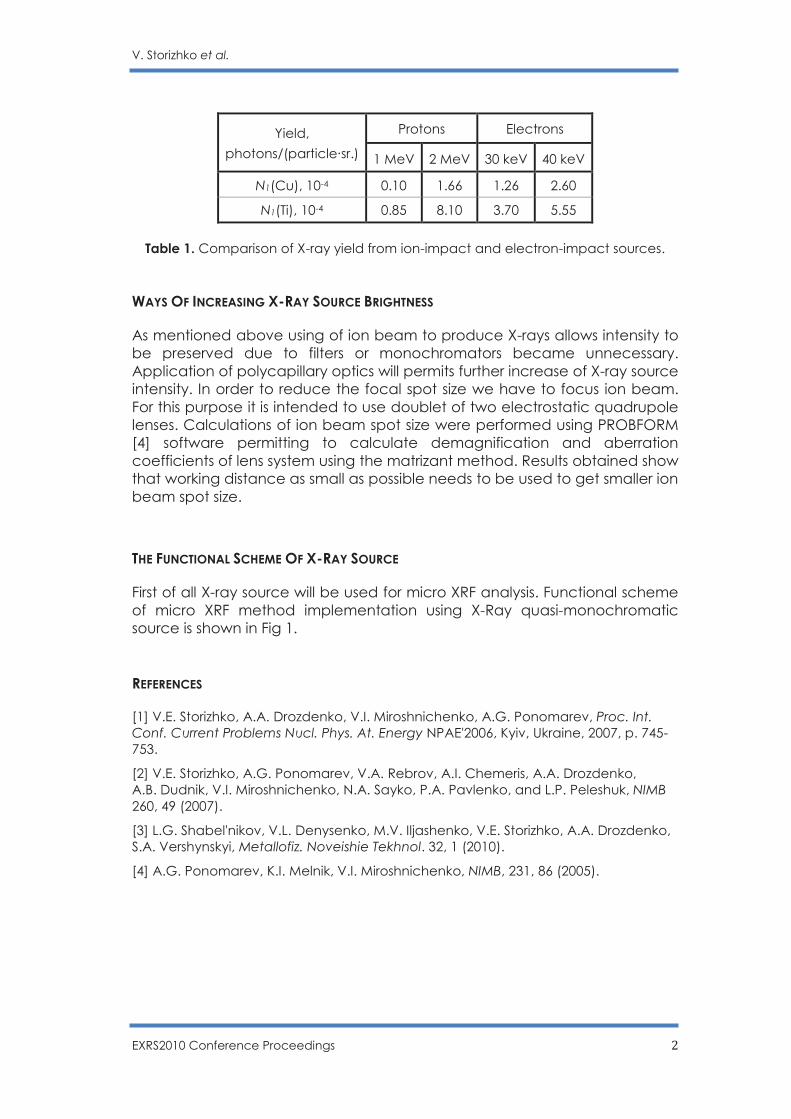
Table 1 presents X-ray yield for ion-impact and electron-impact sources with different energies of particle beam [3]. It is seen that 2 MeV proton beam provides an X-ray yield comparable to that of 30-50 keV electron beams with the bremsstrahlung background being reduced by nearly two orders of magnitude.
V. Storizhko et al.
EXRS2010 Conference Proceedings 2
Yield,
photons/(particle∙sr.)
Protons Electrons
1 MeV 2 MeV 30 keV 40 keV
N1(Cu), 10-4 0.10 1.66 1.26 2.60
N1(Ti), 10-4 0.85 8.10 3.70 5.55
Table 1. Comparison of X-ray yield from ion-impact and electron-impact sources. WAYS OF INCREASING X-RAY SOURCE BRIGHTNESS
As mentioned above using of ion beam to produce X-rays allows intensity to be preserved due to filters or monochromators became unnecessary. Application of polycapillary optics will permits further increase of X-ray source intensity. In order to reduce the focal spot size we have to focus ion beam. For this purpose it is intended to use doublet of two electrostatic quadrupole lenses. Calculations of ion beam spot size were performed using PROBFORM [4] software permitting to calculate demagnification and aberration coefficients of lens system using the matrizant method. Results obtained show that working distance as small as possible needs to be used to get smaller ion beam spot size.
THE FUNCTIONAL SCHEME OF X-RAY SOURCE
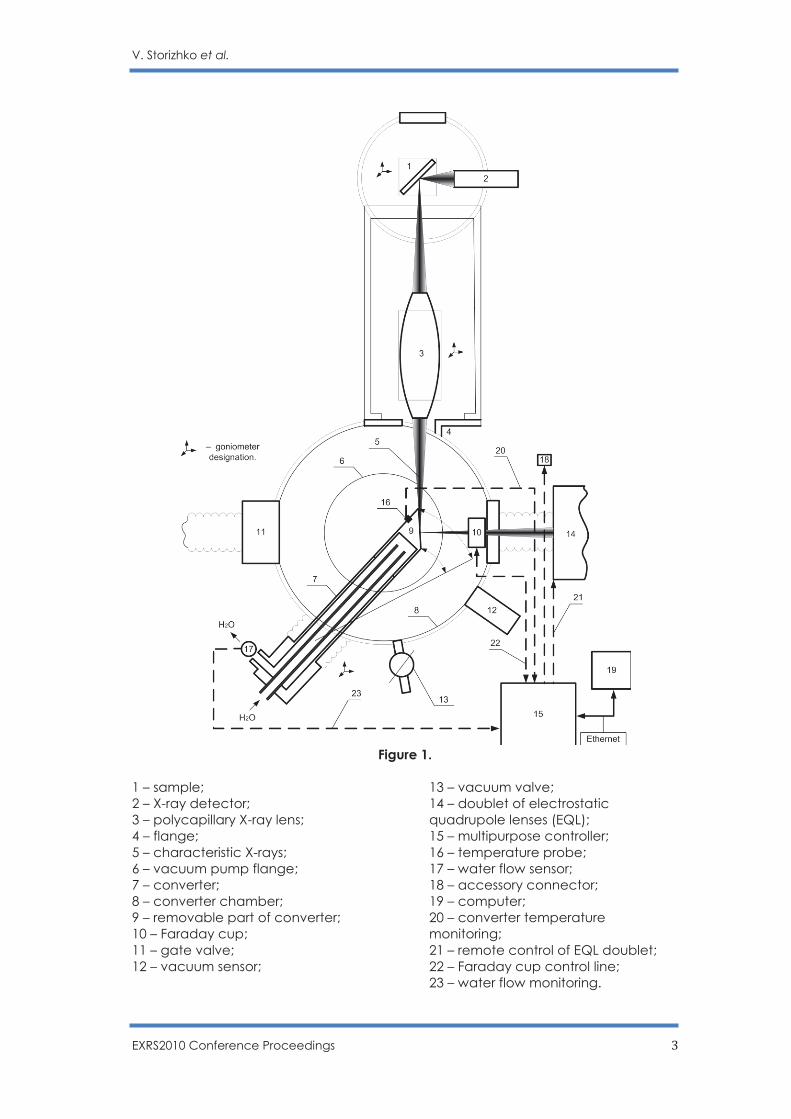
First of all X-ray source will be used for micro XRF analysis. Functional scheme of micro XRF method implementation using X-Ray quasi-monochromatic source is shown in Fig 1. REFERENCES
[1] V.E. Storizhko, A.A. Drozdenko, V.I. Miroshnichenko, A.G. Ponomarev, Proc. Int. Conf. Current Problems Nucl. Phys. At. Energy NPAE'2006, Kyiv, Ukraine, 2007, p. 745-753.
[2] V.E. Storizhko, A.G. Ponomarev, V.A. Rebrov, A.I. Chemeris, A.A. Drozdenko, A.B. Dudnik, V.I. Miroshnichenko, N.A. Sayko, P.A. Pavlenko, and L.P. Peleshuk, NIMB 260, 49 (2007).
[3] L.G. Shabel'nikov, V.L. Denysenko, M.V. Iljashenko, V.E. Storizhko, A.A. Drozdenko, S.A. Vershynskyi, Metallofiz. Noveishie Tekhnol. 32, 1 (2010).
[4] A.G. Ponomarev, K.I. Melnik, V.I. Miroshnichenko, NIMB, 231, 86 (2005).
V. Storizhko et al.
EXRS2010 Conference Proceedings 3
Figure 1.
1 – sample; 2 – X-ray detector; 3 – polycapillary X-ray lens; 4 – flange; 5 – characteristic X-rays; 6 – vacuum pump flange; 7 – converter; 8 – converter chamber; 9 – removable part of converter; 10 – Faraday cup; 11 – gate valve; 12 – vacuum sensor;
13 – vacuum valve; 14 – doublet of electrostatic quadrupole lenses (EQL); 15 – multipurpose controller; 16 – temperature probe; 17 – water flow sensor; 18 – accessory connector; 19 – computer; 20 – converter temperature monitoring; 21 – remote control of EQL doublet; 22 – Faraday cup control line; 23 – water flow monitoring.
EXRS2010 Conference Proceedings 4
Towards a quantitative analysis using a portable micro-EDXRF spectrometer
J. M. Sampaio1), S. Pessanha1), L. Peralta2), P. Amorim1)
and M. L. Carvalho1)
1) Centro de Física Atómica da Universidade de Lisboa, Av. Prof. Gama Pinto, Lisboa, Portugal
2) Laboratório de Instrumentação e Física Experimental de Partículas, Portugal
E-mail: [email protected]
ABSTRACT We present a methodology for quantitative analysis with a portable micro-EDXRF spectrometer based on Monte Carlo calculations. First results towards benchmarking our calculations are also shown and ongoing steps to improve the reliability of our simulations are discussed.
INTRODUCTION
The use of micro-EDXRF has notoriously increased the spatial resolution analysis of various kinds of samples. An important feature of EDXRF techniques is the possibility to predict elemental concentrations from experimentally measured spectral intensities using well established mathematical relations. The Fundamental Parameter Method (FPM) [1] has been for many years very useful in calculating concentrations of unknown samples. Two ways are possible in using the FPM: the standard-less approach, where additional information about geometrical and physical quantities of the spectrometer and experimental setup are needed, or using standards of known elemental concentrations to calibrate measured intensities. The later approach has the advantage of cancelling out unknown factors in the fundamental equations and eliminates, in first approach, dependencies on the experimental setup parameters.
The need of standards is however a practical limitation for doing quantitative EDXRF analysis. Standards are expensive or simply they are not available with adequate compositions for the type of samples measured. To overcome this limitation it was proposed the use of Monte Carlo (MC) techniques to simulate standards instead of measuring them [2, 3]. This work will report on the first results towards a reliable implementation of a MC simulation of the micro-EDXRF spectrometer at the CFA. For this we used the code package PENELOPE-2008 [4] and implemented a geometry including all the main features of the system, importantly the angle of the Mo anode, the aperture and collimation of the X-ray beam.
J.M. Sampaio et al.
EXRS2010 Conference Proceedings 5
EXPERIMENTAL SETUP
The Atomic Physics Centre of the University of Lisbon (CFA) has a portable micro-EDXRF spectrometer able to alternate between a simple collimator and a poly-capillary lens (the latter produces a spot size of less than 100 μm). The X-ray generator (Oxford X-ray tube series 5000, model XTF5011) and Si drift detector (Vortex-EX SDD thermoelectrically cooled) are coupled with a vacuum chamber in a 45o degrees geometry. Samples are placed outside the vacuum chamber, at the vertex of the geometry, and X-ray are transmitted through a window (usually made of Kapton) towards it. This equipment has been used at the laboratory and in situ for many analyses in environmental and health sciences and cultural heritage studies.
For future benchmarking of our simulations, we measured transmitted and fluorescence on a water sample, and later adding an Al sample, for different angles between the detector and the X-ray tube (0º, 45º, 60º and 90º). The X-ray tube was operated at 50 kV and 1 mA and the spectra were acquired for 100 s by a digital pulse processor with PI-Spec A software package.
SIMULATION
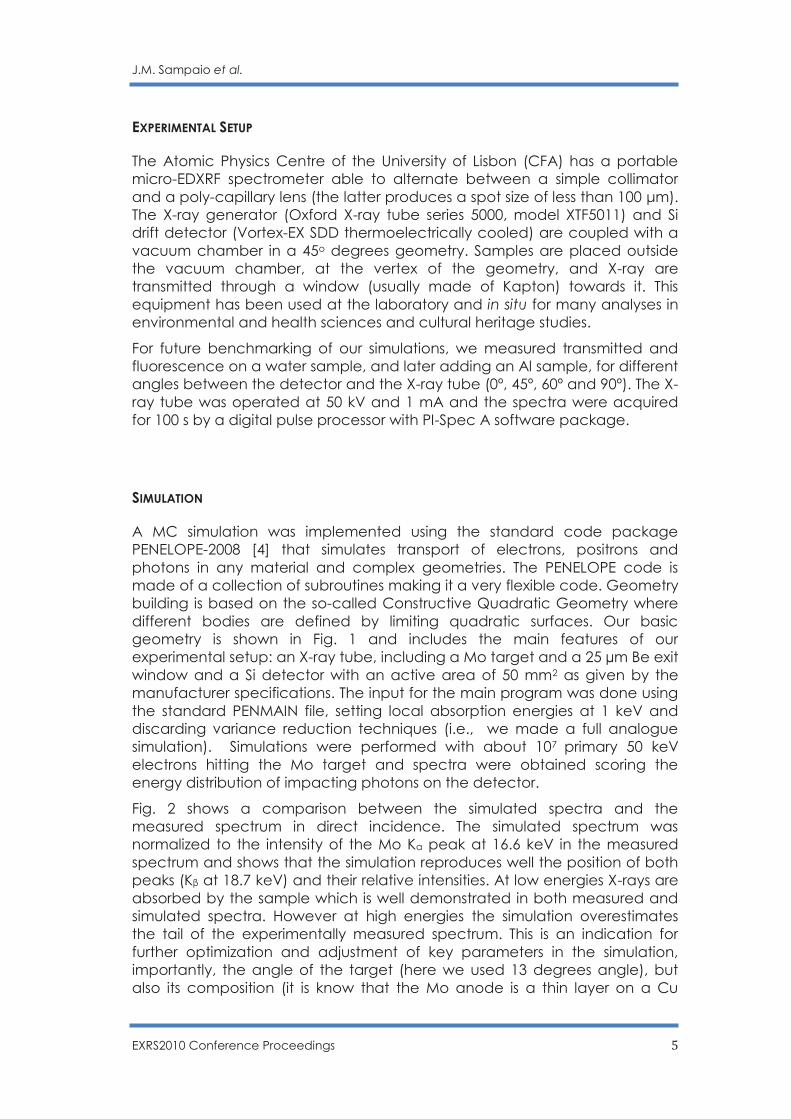
A MC simulation was implemented using the standard code package PENELOPE-2008 [4] that simulates transport of electrons, positrons and photons in any material and complex geometries. The PENELOPE code is made of a collection of subroutines making it a very flexible code. Geometry building is based on the so-called Constructive Quadratic Geometry where different bodies are defined by limiting quadratic surfaces. Our basic geometry is shown in Fig. 1 and includes the main features of our experimental setup: an X-ray tube, including a Mo target and a 25 µm Be exit window and a Si detector with an active area of 50 mm2 as given by the manufacturer specifications. The input for the main program was done using the standard PENMAIN file, setting local absorption energies at 1 keV and discarding variance reduction techniques (i.e., we made a full analogue simulation). Simulations were performed with about 107 primary 50 keV electrons hitting the Mo target and spectra were obtained scoring the energy distribution of impacting photons on the detector.
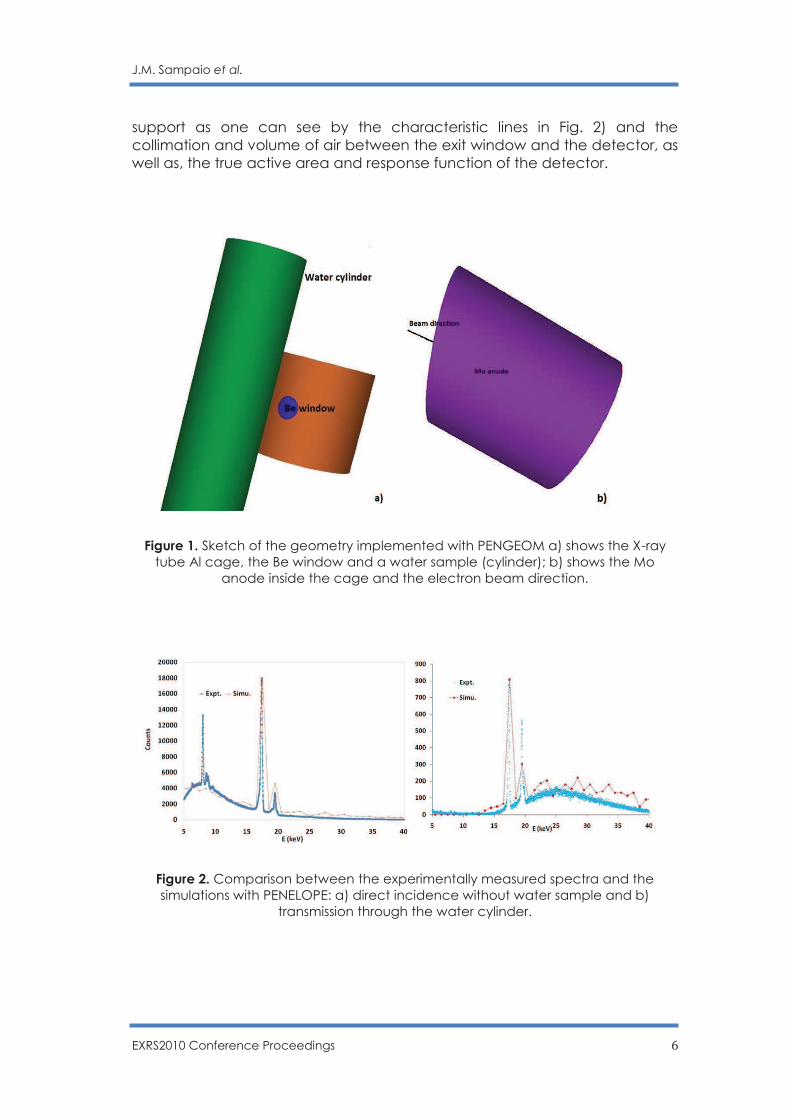
Fig. 2 shows a comparison between the simulated spectra and the measured spectrum in direct incidence. The simulated spectrum was normalized to the intensity of the Mo Kα peak at 16.6 keV in the measured spectrum and shows that the simulation reproduces well the position of both peaks (Kβ at 18.7 keV) and their relative intensities. At low energies X-rays are absorbed by the sample which is well demonstrated in both measured and simulated spectra. However at high energies the simulation overestimates the tail of the experimentally measured spectrum. This is an indication for further optimization and adjustment of key parameters in the simulation, importantly, the angle of the target (here we used 13 degrees angle), but also its composition (it is know that the Mo anode is a thin layer on a Cu
J.M. Sampaio et al.
EXRS2010 Conference Proceedings 6
support as one can see by the characteristic lines in Fig. 2) and the collimation and volume of air between the exit window and the detector, as well as, the true active area and response function of the detector.
Figure 1. Sketch of the geometry implemented with PENGEOM a) shows the X-ray tube Al cage, the Be window and a water sample (cylinder); b) shows the Mo
anode inside the cage and the electron beam direction.
Figure 2. Comparison between the experimentally measured spectra and the simulations with PENELOPE: a) direct incidence without water sample and b)
transmission through the water cylinder.
J.M. Sampaio et al.
EXRS2010 Conference Proceedings 7
CONCLUSIONS AND FINAL REMARKS
It was shown that the PENELOPE-2008 code is able to reproduce the transmitted X-ray spectra measured experimentally. Simulations were also done for angles greater than 0º, but, so far, results have insufficient statistics to allow for quantitative analysis. It is a well know fact that X-ray tubes are very inefficient devices, where almost all the energy of primary electrons is lost in anode, rendering a very low fraction of emitted X-rays for a given number of primary electron impinging on the anode. As mentioned above, several key parameters still need to be tuned, but also the simulation needs to be partitioned in several stages, namely: i) production of the primary X-ray spectra; ii) transmission and scattering of X-rays in the samples and iii) transport and detection of the scattered X-rays. Each stage is a new simulation where the primary particles and their energy distribution is given by the output of the precedent simulation but scaled to a number sufficiently large to held statistical significance to the results.
Measurements were already made for X-ray transmission for different material windows (Kapton, Polypropylene, Prolene, Etnom and Mylar) and standards (NIST-Orchard leaves, IAEA- Soil 7 and NIST- Bone ash) and will be used to benchmark our simulation of the micro-EDXRF spectrometer. The ultimate goal will then be the production of a spectra database of simulated reference standards to be used with available software for spectral intensity fitting.
REFERENCES
[1] J. W. Criss and L. S. Briks, Anal. Chem. (1968) 1080;
[2] P. Van Espen and P. Lemberge, Adv. X-ray Anal. 43 (2000) 560;
[3] L. Peralta, A. Farinha and F. Rego, Eur. J. Phys. 29 (2008) 901-909;
[4] F. Salvat, J. Fernández-Varea and J. M., Sempau, PENELOPE-2008, NEA Workshop Proceedings, Barcelona, Spain (2008).
EXRS2010 Conference Proceedings 8
Analysis of mineral nutrients in Liquid Nutritional Products (LNP) by means of Total reflection X-Ray
Spectroscopy (TXRF)
H. Stosnach1 and R. Baechler2
1 Bruker Nano GmbH, Schwarzschildstrasse 12, 12489 Berlin, Germany,
2 Nestlé Research Centre Lausanne, Nestec Ltd., Vers-chez-les-Blanc,
1000 Lausanne 26, Switzerland,
Keywords: TXRF, mineral fortifiers, liquid products
ABSTRACT Liquid nutritional products are nutritionally enriched food products designed for people at risk of malnutrition. In addition to a broad range of fortifiers they contain macronutrients (Na, Mg, P, K, Ca, Mn, Fe, Cu and Zn in the mg/kg range) and micronutrients (Cr, Se, Mo and I in the µg/kg-range). The present feasibility study reports the performance of Total-Reflection X-Ray Fluorescence (TXRF) spectroscopy for a rapid and simultaneous quantification of micronutrients (Cr and Se) and macronutrients (P, Ca, K, Mn, Fe, Cu and Zn) in liquid nutritional products (LNP) products after a simple sample preparation procedure. The TXRF trend and level of detection limits and precision are compared with values obtained by ICPs methods.
INTRODUCTION
Liquid nutritional products (LNP) are nutritionally supplemented for patients who are recovering from illness, injury or surgery and for population groups at risk of malnutrition. In addition to a broad range of vitamins, proteins, lipids and carbohydrates they contain minerals, which can be divided in two groups:
§ Macronutrients Na, Mg, P, K, Ca, Mn, Fe, Cu and Zn (concentration range: mg/100g)
§ Micronutrients as fortifiers Cr, Se, Mo and I (concentration range µg/100g).
The analysis of these minerals is of crucial importance for product compliance and quality control.
Macronutrients can be analyzed by means of Inductively Coupled Plasma Optical Emission Spectroscopy (ICP-OES)1 where as micro-nutrients are generally analyzed by Inductively Coupled Plasma Mass Spectrometry (ICP-MS)2 as reference and rapid multi-element techniques.
H. Stosnach and R. Baechler
EXRS2010 Conference Proceedings 9
However, ICP analytical methods demand laborious sample preparation (acid digestion) and require skilled ICP operators in a cost-effective analytical laboratory environment (i.e. clean room and argon gas) which is not compatible to quality control in a production environment.
The present study reports the feasibility of multi-element analysis of macro- and micronutrients in LNP by means of Total-Reflection X-Ray Fluorescence (TXRF) spectroscopy.
EXPERIMENTAL
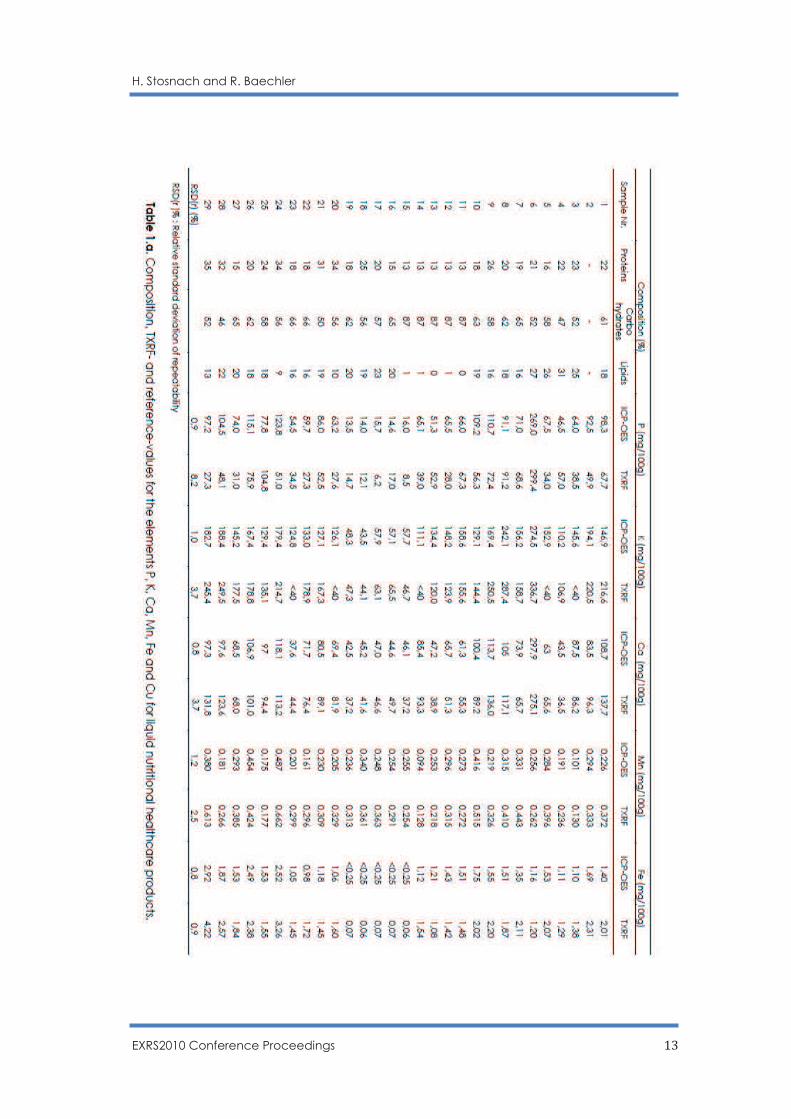
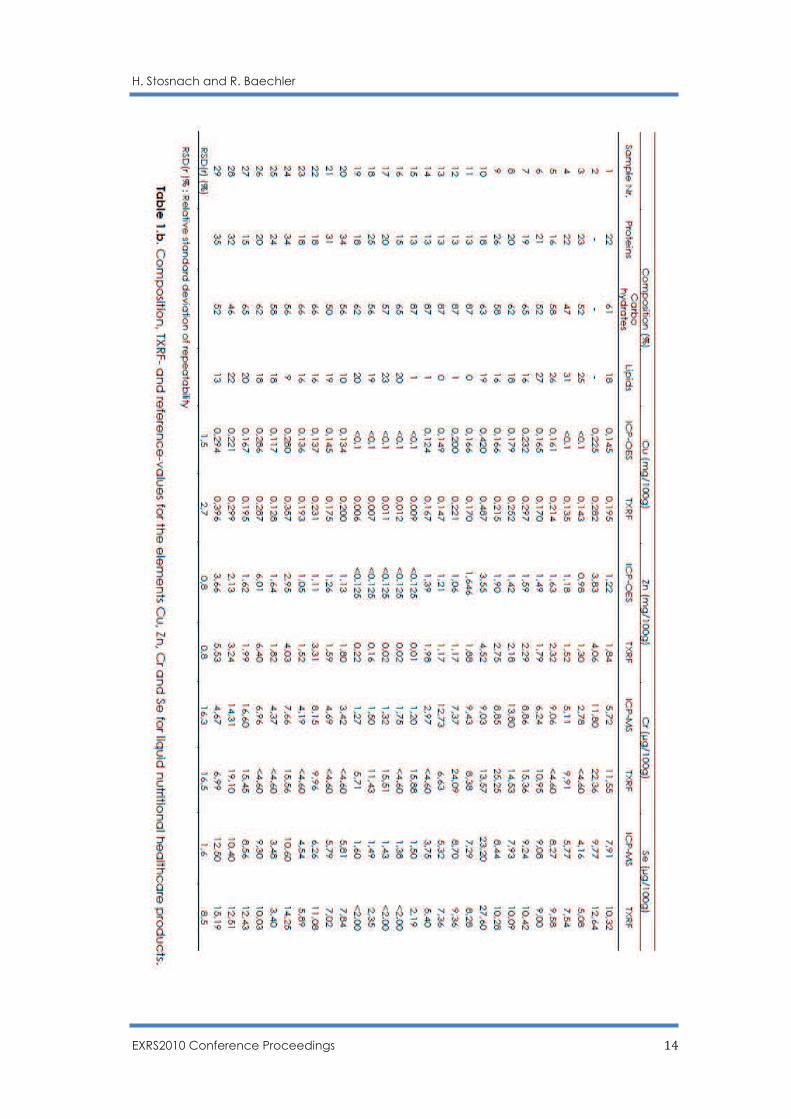
29 LNP samples with different compositions (Table 1.a. and 1.b.) were purchased as OTC (over-the-counter) products and analyzed in duplicate by:
§ ICP-OES for Macronutrients
§ ICP-MS for Micronutrients
§ TXRF for Macro & Micronutrients
Reference values of all samples were determined using:
· ICP-OES method (Varian Optima 2100 DV), similar to AOAC method 984.274, after microwave digestion system for P, K, Ca, Mn, Fe, Cu and Zn.
· ICP-MS in-house validated method (Perkin Elmer DRC II ), after High Pressure Asher digestion system for Cr and Se.
Sample preparation for TXRF analysis was performed by mixing sample aliquots of 1 ml with 1 ml of ultra pure water and subsequent addition of 10 µl of a Y solution (Merck, 1 g/l) for internal standardisation. After homogenisation by stirring 10 µl of the sample were transferred to quartz glass sample carriers and dried in vacuum.
Measurements were performed on a bench top spectrometer S2 PICOFOX (Bruker Nano GmbH. Berlin, Germany), Mo-excitation at 50 kV/750 µA and 1000 s of measurement time. As this sample preparation technique does not provide samples with the demanded low thickness for the matrixless approach of TXRF spectroscopy, systematic underestimations for the light elements P, K and Ca, caused by self-adsorption in the samples will occur. These were compensated by an adjustment of the setup calibration factors, based on the measurement of samples with concentrations, derived by ICP-MS analysis.
RESULTS
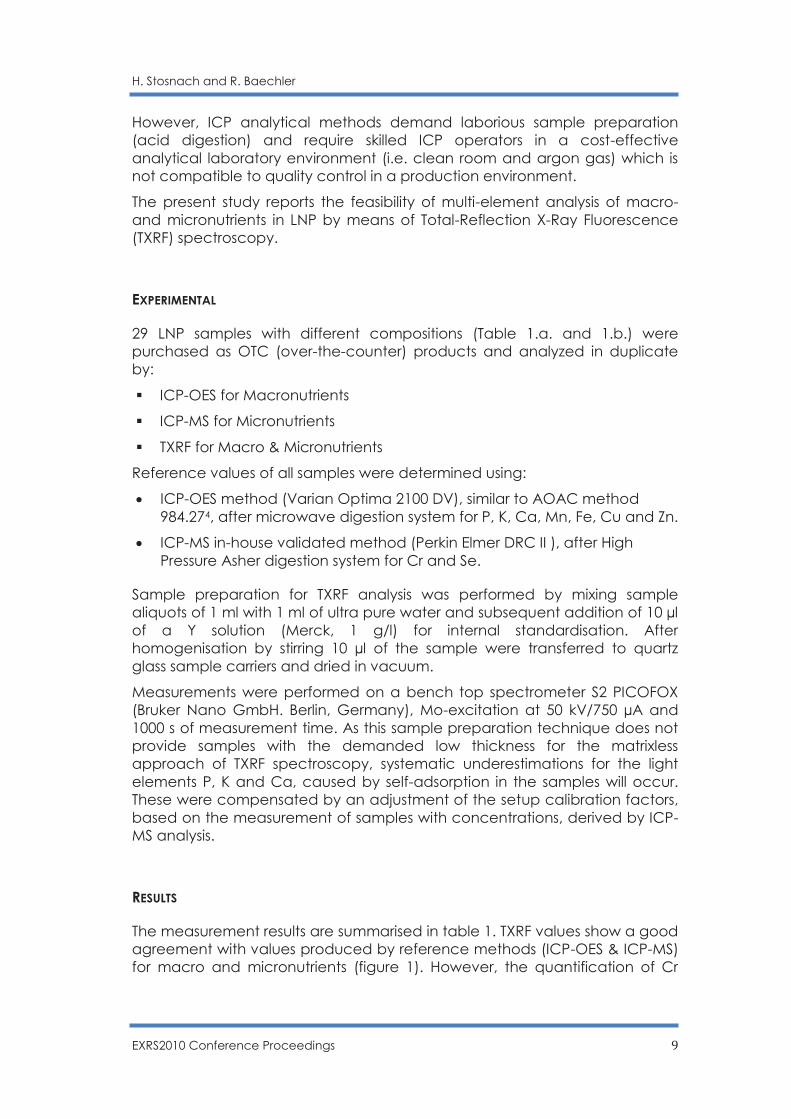
The measurement results are summarised in table 1. TXRF values show a good agreement with values produced by reference methods (ICP-OES & ICP-MS) for macro and micronutrients (figure 1). However, the quantification of Cr
H. Stosnach and R. Baechler
EXRS2010 Conference Proceedings 10
needs additional work to deliver significant results, e.g. an optimisation of sample preparation procedures.
Figure 1. Comparison of TXRF- and reference method measurement results.
H. Stosnach and R. Baechler
EXRS2010 Conference Proceedings 11
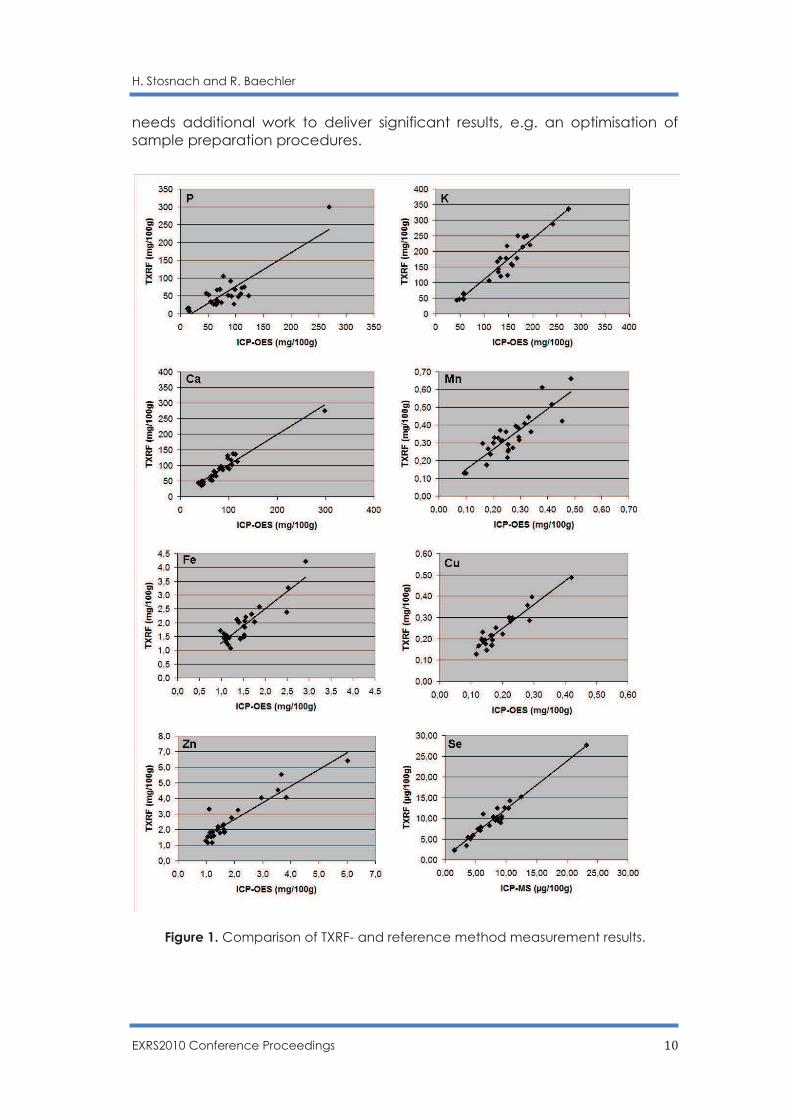
Figure 2. Comparison of detection limits for TXRF and reference methods.
The instrumental limits of detection (LOD) according to formula 13 established for the TXRF (figure 2) are similar to those of ICP-OES and ICP-MS methods, except for Mn, Cr and P.
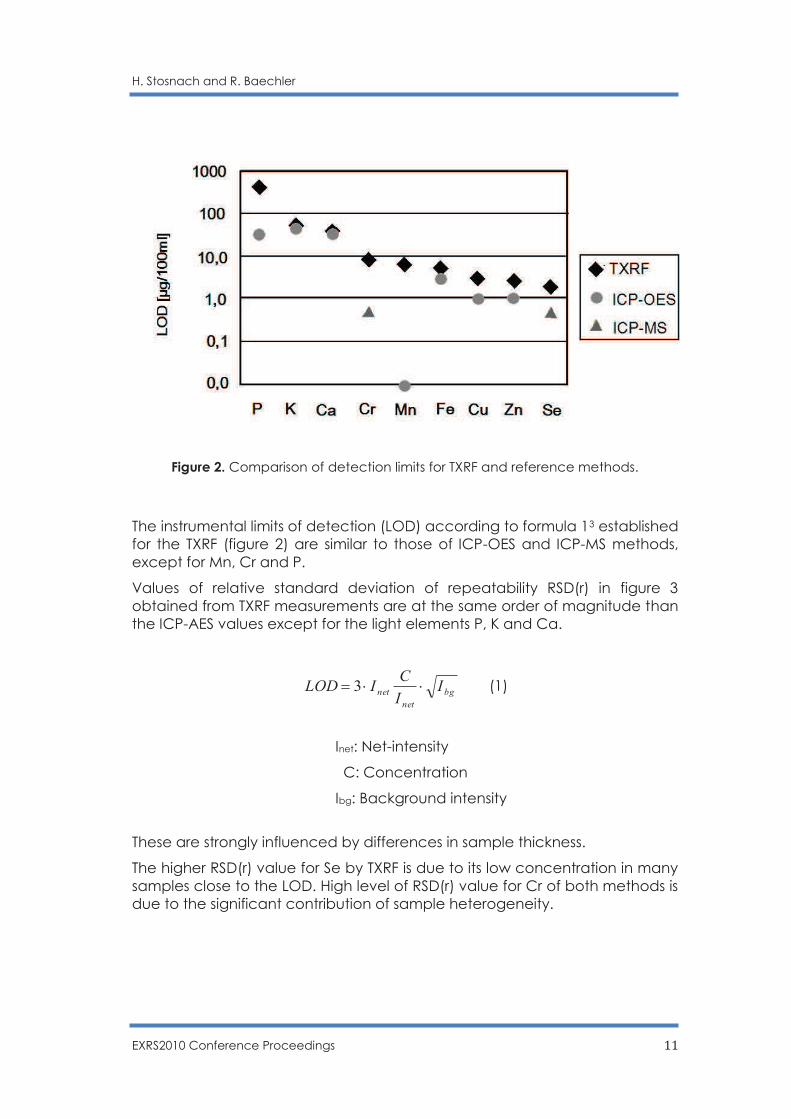
Values of relative standard deviation of repeatability RSD(r) in figure 3 obtained from TXRF measurements are at the same order of magnitude than the ICP-AES values except for the light elements P, K and Ca.
bg
net
net II
CILOD ××= 3 (1)
Inet: Net-intensity
C: Concentration
Ibg: Background intensity
These are strongly influenced by differences in sample thickness.
The higher RSD(r) value for Se by TXRF is due to its low concentration in many samples close to the LOD. High level of RSD(r) value for Cr of both methods is due to the significant contribution of sample heterogeneity.
H. Stosnach and R. Baechler
EXRS2010 Conference Proceedings 12
Figure 3. Comparison of relative standard deviations for TXRF and reference
methods. CONCLUSIONS
TXRF spectroscopy is clearly identified as a suitable and rapid method for the multi-element quantification including macro and micronutrients in liquid nutritional product (LNP) after a simplified sample preparation. TXRF method based on the internal standardization showed a good agreement with ICP methods. But it was also found that the quantification of Macronutrients lighter than P is not possible using TXRF. The micronutrients Cr and Se are quantifiable above the LOD while Mo and Iodine can not be analyzed by TXRF instruments equipped with a Mo excitation X-ray source.
For all elements discussed in this paper sensitivity and precision of TXRF method fit for mineral compliance analysis of the LNP.
REFERENCES
[1] A. Nwankwoalab, S. Odueyungboa, K. Nyavora, N. Egiebora, Food Chemistry 2002; 77, 4.
[2] S. P. Dolan, D. A. Nortrup, P. M. Bolger, S. G. Capar, J. Agric. Food Chem. 2003; 51, 5
[3] R. Klockenkämper, in Total Reflection X-Ray Spectrometry, Wiley & Sons, London, 1997
[4] AOAC method 984.27; Ca, Cu, Fe, Mg, Mn, P, K, Na, Zn in infant formula.
H. Stosnach and R. Baechler
EXRS2010 Conference Proceedings 13
H. Stosnach and R. Baechler
EXRS2010 Conference Proceedings 14
EXRS2010 Conference Proceedings 15
Sequential Micro Total Reflection X-ray Fluorescence Analysis
Masaya Kawamata and Kouichi Tsuji*
Department of Applied Chemistry, Osaka City University, 3-3-138 Sugimoto,
Sumiyoshi-ku, Osaka 558-8585, Japan
* corresponding author (Tsuji): TEL/FAX : +81-(0)6-6605-3080,
E-mail : [email protected]
KEYWORDS: micro analysis, trace analysis, TXRF, surface analysis, total reflection
ABSTRACT Previously, we proposed micro Total Reflection X-ray Fluorescence (micro-TXRF), where only a small region on a sample substrate is analyzed through a pinhole placed between the sample and the x-ray detector. This technique is useful for reducing the background intensity for samples of droplet residues, because the x-ray fluorescence emitted from areas other than that of the residue is not detected. In addition, this technique enables x-ray elemental mapping under conditions of total reflection. In this case, lateral resolution depends on the diameter of the pinhole and the distance between the pinhole and the sample, as we previously reported. In this article, we propose another application of micro-TXRF. Usually, in conventional TXRF, one droplet of residue is prepared at the center of the substrate. That means, in the case of five TXRF samples, five independent substrates are prepared, and then analyzed one by one. However, in the case of micro-TXRF, it is possible to prepare five residues on a single substrate. In this article, we demonstrate that each residue can be independently analyzed without interference from any other particles. This method, namely, sequential micro-TXRF, offers the advantages of reducing the total time for analysis, because no exchange of the samples is required. It is also expected that the degree of reproducibility will be improved because the chance of experimental errors caused by exchanging substrates is reduced.
INTRODUCTION
TXRF is well known as a trace analytical method for the surface of flat samples such as Si wafers [1] [2]. The method has been used routinely for the analysis of contaminants on Si wafers in the semiconductor industry. Alternatively, we can prepare samples for TXRF analysis on flat substrates such as optically flat glass. One traditional method is to use a micropipette to drop a sample of the solution on the substrate. A recently developed picodroplet technique is also useful for sample preparation for TXRF [3] [4].
In this case, we want to measure only the droplet residue on the substrate. Therefore, application of a pinhole or focusing optics, which is placed between the sample substrate and the detector, would be useful to detect x-ray fluorescence from only the droplet. In the previous paper, we called this technique "micro-TXRF," and fundamental analytical characteristics were reported with the application of the pinhole [5]. In micro-TXRF, the sample
M. Kawamata and K. Tsuji
EXRS2010 Conference Proceedings 16
substrate is placed on an X-Y-Z stepping motor stage that is controlled by a PC. The sample substrate is moved relative to the pinhole. Therefore, x-ray elemental mapping is also possible under conditions of total reflection. The spatial resolution for the mapping is dependent on the diameter of the pinhole and the distance between the pinhole and the sample. Application of a polycapillary x-ray lens instead of a pinhole gives elemental mapping with good spatial resolution although the TXRF intensity is reduced due to the low transmission efficiency of the polycapillary lens [5]-[7].
In this article, we will discuss another application of micro-TXRF. Multiple droplet residues are prepared on a single substrate, and then each residue is sequentially measured by micro-TXRF. In this case, there is no need to exchange the sample substrate, leading to a reduction in analyzing time and easy automatic TXRF analysis.
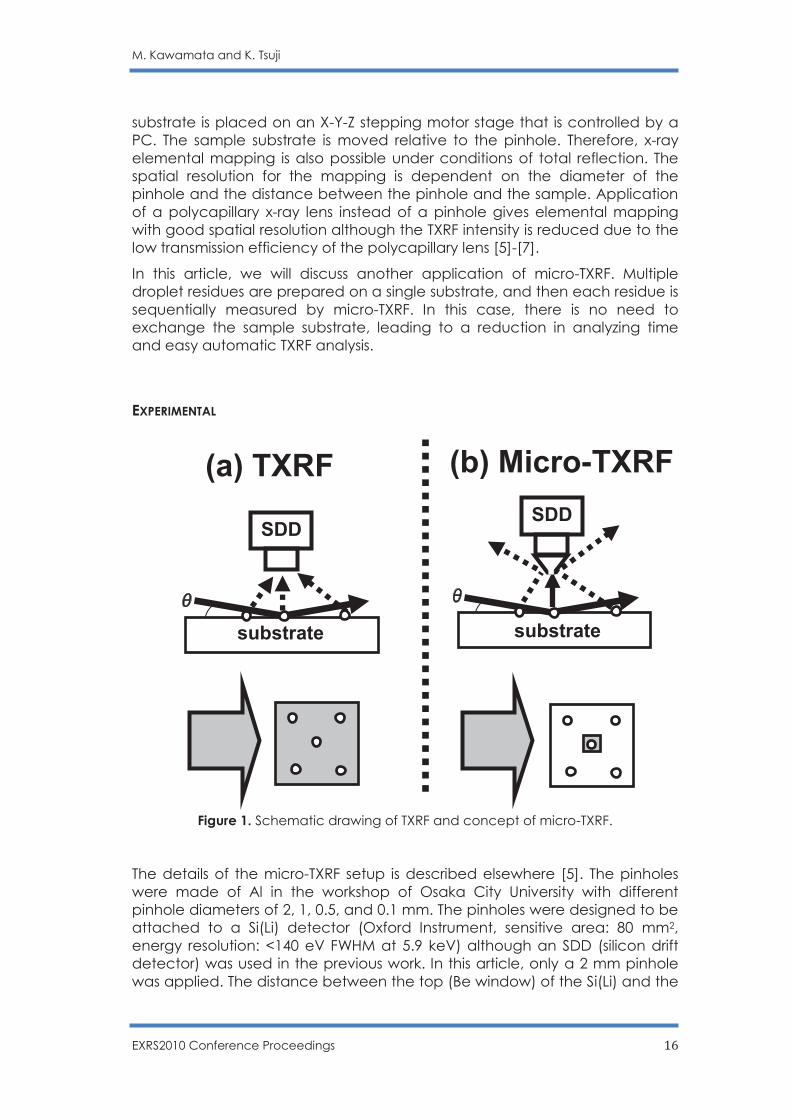
EXPERIMENTAL
Figure 1. Schematic drawing of TXRF and concept of micro-TXRF.
The details of the micro-TXRF setup is described elsewhere [5]. The pinholes were made of Al in the workshop of Osaka City University with different pinhole diameters of 2, 1, 0.5, and 0.1 mm. The pinholes were designed to be attached to a Si(Li) detector (Oxford Instrument, sensitive area: 80 mm2, energy resolution: <140 eV FWHM at 5.9 keV) although an SDD (silicon drift detector) was used in the previous work. In this article, only a 2 mm pinhole was applied. The distance between the top (Be window) of the Si(Li) and the
(a) TXRF
SDD
SDD
substrate substrate
(b) Micro-TXRF
M. Kawamata and K. Tsuji
EXRS2010 Conference Proceedings 17
pinhole was about 3 mm. The distance between the end of the pinhole and the sample stage was 4 mm. Under this condition, the spatial resolution was about 5 mm. A Mo x-ray tube was operated at a voltage of 40 kV and a current of 30 mA. A W/C multilayer was used in the monochromator. The incident angle of the monochromatic primary x-rays was adjusted by moving the sample stage with a large goniometer. The sample holder was an X-Y-Z translation stage equipped with stepping motors, which were controlled by a computer. X-ray elemental maps were obtained by moving the sample stages with steps of 50 µm in an X-Y plane that was almost in the same plane as the primary x-ray irradiation. RESULTS AND DISCUSSION Reduction of background intensity in TXRF spectrum
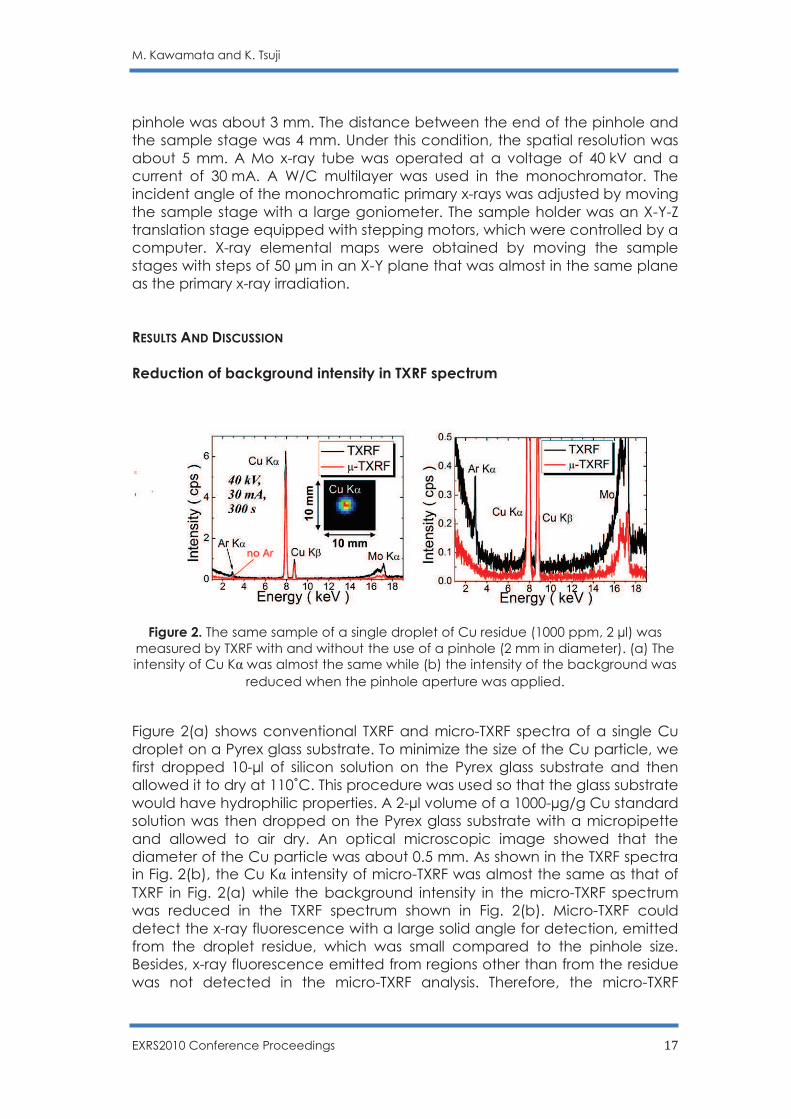
Figure 2. The same sample of a single droplet of Cu residue (1000 ppm, 2 µl) was measured by TXRF with and without the use of a pinhole (2 mm in diameter). (a) The intensity of Cu Kα was almost the same while (b) the intensity of the background was
reduced when the pinhole aperture was applied.
Figure 2(a) shows conventional TXRF and micro-TXRF spectra of a single Cu droplet on a Pyrex glass substrate. To minimize the size of the Cu particle, we first dropped 10-µl of silicon solution on the Pyrex glass substrate and then allowed it to dry at 110˚C. This procedure was used so that the glass substrate would have hydrophilic properties. A 2-µl volume of a 1000-µg/g Cu standard solution was then dropped on the Pyrex glass substrate with a micropipette and allowed to air dry. An optical microscopic image showed that the diameter of the Cu particle was about 0.5 mm. As shown in the TXRF spectra in Fig. 2(b), the Cu Kα intensity of micro-TXRF was almost the same as that of TXRF in Fig. 2(a) while the background intensity in the micro-TXRF spectrum was reduced in the TXRF spectrum shown in Fig. 2(b). Micro-TXRF could detect the x-ray fluorescence with a large solid angle for detection, emitted from the droplet residue, which was small compared to the pinhole size. Besides, x-ray fluorescence emitted from regions other than from the residue was not detected in the micro-TXRF analysis. Therefore, the micro-TXRF

M. Kawamata and K. Tsuji
EXRS2010 Conference Proceedings 18
method gave a lower background intensity than that of conventional TXRF. In fact, the signal/background intensity ratio (S/B) of TXRF was 22.02 while the S/B of micro-TXRF was 33.14. This demonstrates that in the case of micro region analysis, micro-TXRF analysis has a great advantage in low background analysis. In addition, Ar Kα was not observed in the micro-TXRF spectrum, probably due to the short distance between the localized sample and the x-ray detector. Calibration curve and detection limit
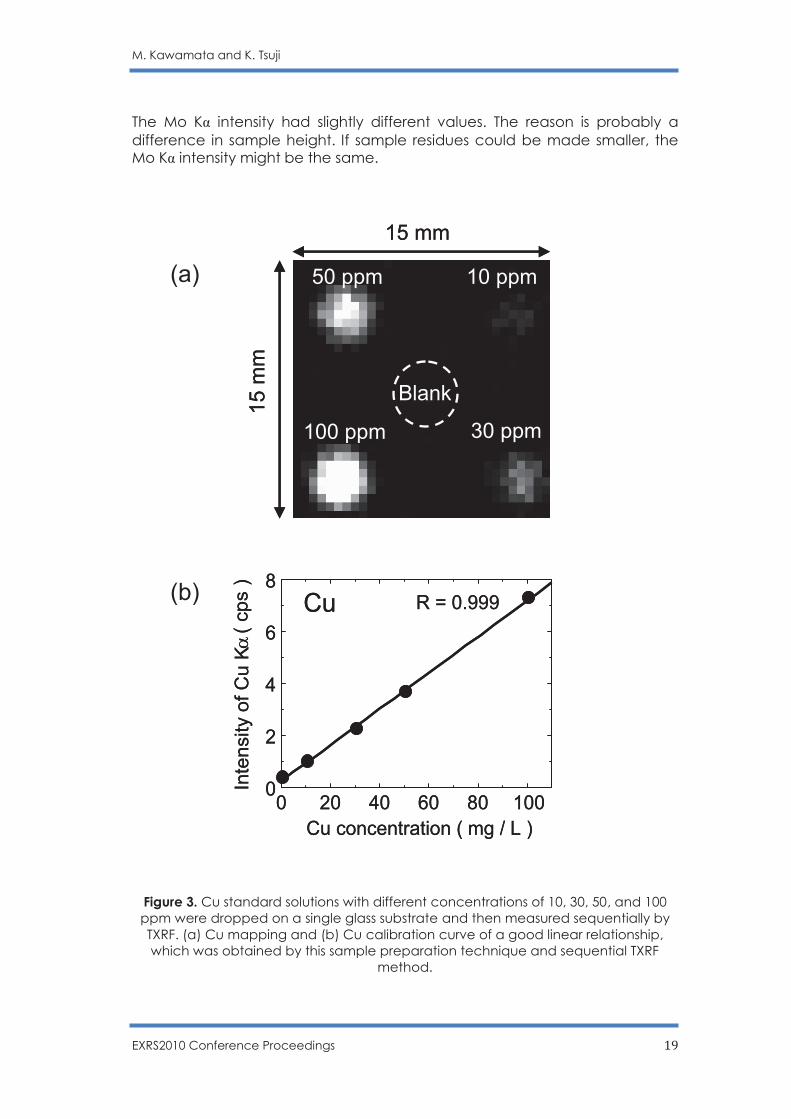
The micro-TXRF device was equipped with an X-Y-Z stage, which could be controlled by a computer. Therefore, we were able to know the elemental distributions under total reflection conditions. Figure 3(a) shows an elemental mapping of Cu obtained by micro-TXRF analysis. The analyzed samples were a 2-µl volume of 100, 50, 30, 10 µg/g Cu droplets and blank (pure water) on the same Pyrex glass substrate. The 100, 50, 30, 10 µg/g Cu droplets were positioned at the corner of a 10 mm × 10 mm square; the blank (pure water) sample was positioned at the center of the square. Here, we assumed that the height of each droplet was 10 µm. When the incident angle was 0.05˚, the droplet casts a shadow 5.73 mm long. If the distance between particles is shorter than 5.73 mm, the particles cannot be sufficiently irradiated. Figure 3(b) shows the calibration curve of Cu. Each plot was obtained by micro-TXRF with a measuring time of 500 s. Using the same substrate with five different concentrated samples gave a good linear relationship. Conventional TXRF requires several substrates to obtain calibration curves. If the chemical states of the substrate surfaces are different, the droplet residues would form in different shapes. If the thicknesses of the substrates are different, the incident angles might be changed slightly. As a result, differences in measurement conditions might cause poor linear relationships. Micro-TXRF analysis is a feasible method for a highly quantitative, economical, and rapid analytical process because the method is performed on the same substrate without any changes. Sequential micro-TXRF analysis
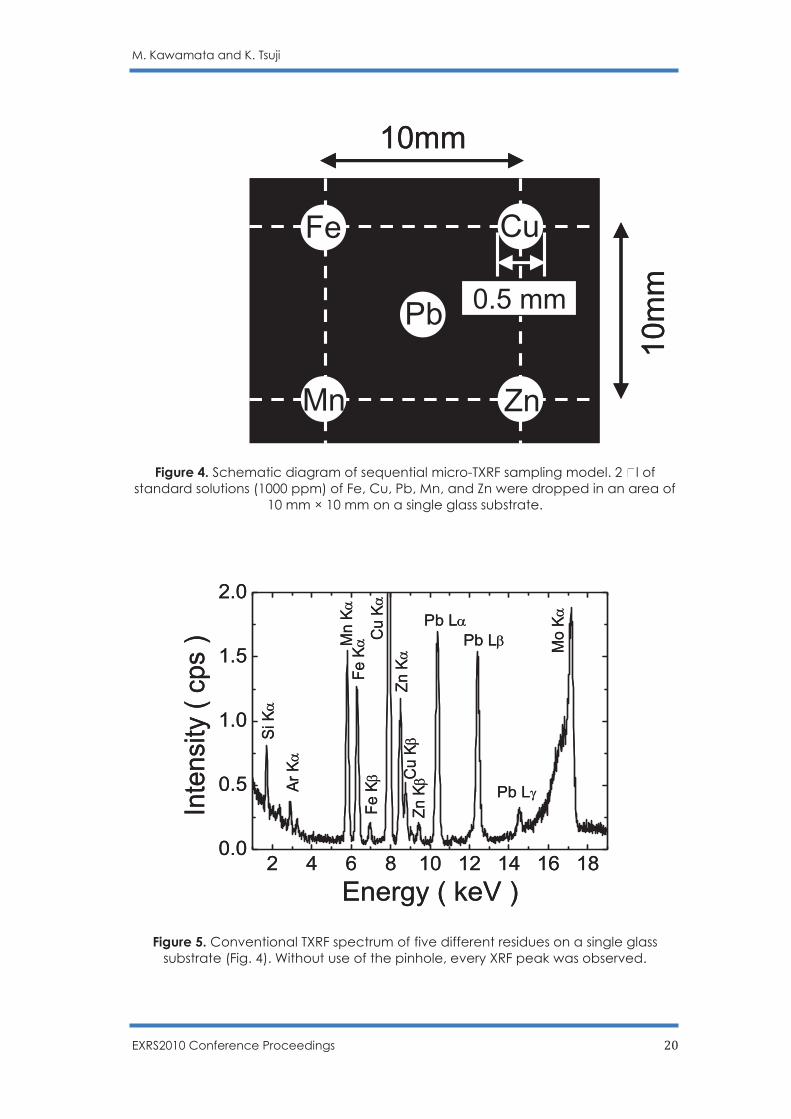
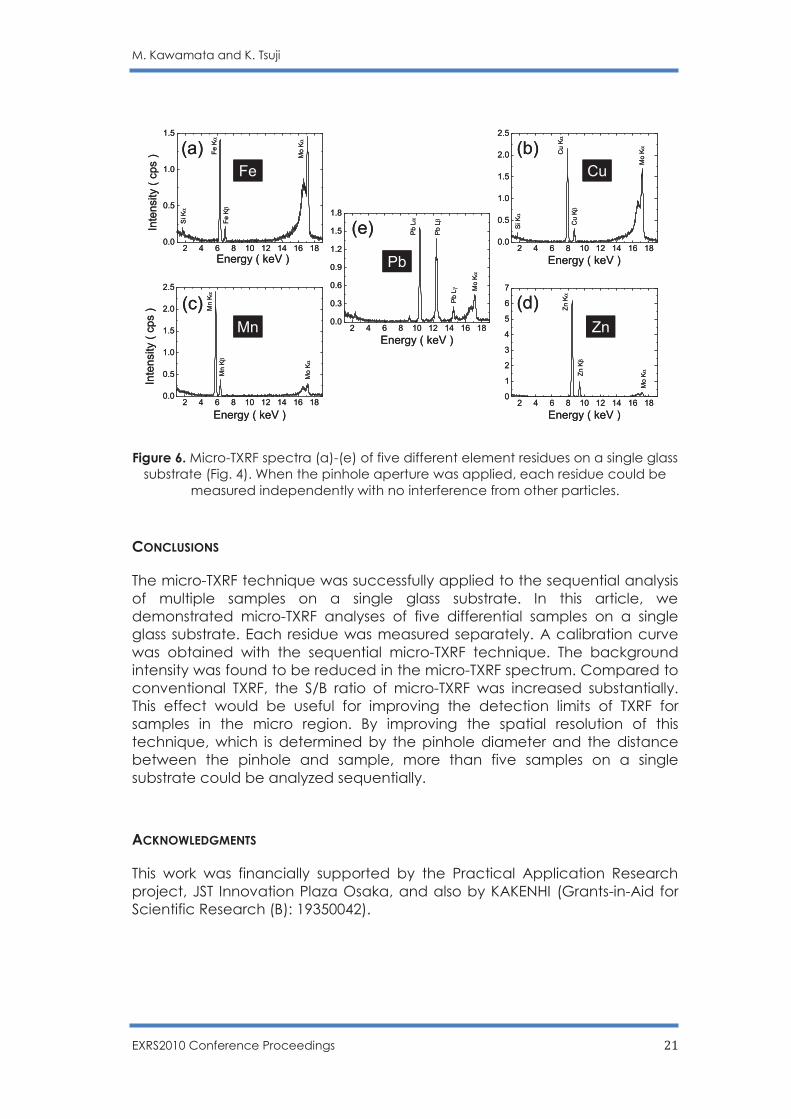
Figure 4 is a schematic diagram of the sample prepared for sequential micro-TXRF analysis. Five standard solution samples were prepared on a single glass substrate. 2-µl volumes of 1000-µg/g Mn, Fe, Cu, Zn, and Pb were dropped on a single Pyrex glass substrate and allowed to air dry. The Mn, Fe, Cu, Zn particles were positioned at the corners of a 10 mm × 10 mm square; the Pb particle was positioned at the center of the square. An optical microscopic image showed that each particle was 0.5 mm in size. Figure 5 shows a conventional TXRF spectrum. Figure 6 shows micro-TXRF spectra measured with a 2-mm pinhole. When TXRF was measured without the pinhole, all XRF peaks were observed. When the pinhole aperture was applied, each residue could be measured separately without interference from other particles, as shown in Fig. 6 (a)-(e). Sequential micro-TXRF analysis suggests the possibility of multiple sample analyses on a single glass substrate.
M. Kawamata and K. Tsuji
EXRS2010 Conference Proceedings 19
The Mo Kα intensity had slightly different values. The reason is probably a difference in sample height. If sample residues could be made smaller, the Mo Kα intensity might be the same.
Figure 3. Cu standard solutions with different concentrations of 10, 30, 50, and 100 ppm were dropped on a single glass substrate and then measured sequentially by TXRF. (a) Cu mapping and (b) Cu calibration curve of a good linear relationship, which was obtained by this sample preparation technique and sequential TXRF
method.
100 ppm
10 ppm50 ppm
Blank
30 ppm
15 mm15 m
m
100 ppm
10 ppm50 ppm
Blank
30 ppm
15 mm15 m
m
0 20 40 60 80 1000
2
4
6
8
Inte
nsity o
f C
u Ka
( cps )
Cu concentration ( mg / L )
R = 0.999Cu
0 20 40 60 80 1000
2
4
6
8
Inte
nsity o
f C
u Ka
( cps )
Cu concentration ( mg / L )
R = 0.999Cu
(a)
(b)
M. Kawamata and K. Tsuji
EXRS2010 Conference Proceedings 20
Figure 4. Schematic diagram of sequential micro-TXRF sampling model. 2 l of standard solutions (1000 ppm) of Fe, Cu, Pb, Mn, and Zn were dropped in an area of
10 mm × 10 mm on a single glass substrate.
Figure 5. Conventional TXRF spectrum of five different residues on a single glass
substrate (Fig. 4). Without use of the pinhole, every XRF peak was observed.
10mm
10m
m
Pb
Cu
ZnMn
Fe
0.5 mm
10mm
10m
m
Pb
Cu
ZnMn
Fe
0.5 mm
2 4 6 8 10 12 14 16 180.0
0.5
1.0
1.5
2.0
Pb Lg
Pb LbPb La
Zn Kb
Zn Ka
Cu Kb
Fe Kb
Mn Ka
Si Ka
Ar
Ka
Fe Ka Mo Ka
Cu Ka
Inte
nsity (
cps )
Energy ( keV )2 4 6 8 10 12 14 16 18
0.0
0.5
1.0
1.5
2.0
Pb Lg
Pb LbPb La
Zn Kb
Zn Ka
Cu Kb
Fe Kb
Mn Ka
Si Ka
Ar
Ka
Fe Ka Mo Ka
Cu Ka
Inte
nsity (
cps )
Energy ( keV )
M. Kawamata and K. Tsuji
EXRS2010 Conference Proceedings 21
Figure 6. Micro-TXRF spectra (a)-(e) of five different element residues on a single glass substrate (Fig. 4). When the pinhole aperture was applied, each residue could be
measured independently with no interference from other particles. CONCLUSIONS
The micro-TXRF technique was successfully applied to the sequential analysis of multiple samples on a single glass substrate. In this article, we demonstrated micro-TXRF analyses of five differential samples on a single glass substrate. Each residue was measured separately. A calibration curve was obtained with the sequential micro-TXRF technique. The background intensity was found to be reduced in the micro-TXRF spectrum. Compared to conventional TXRF, the S/B ratio of micro-TXRF was increased substantially. This effect would be useful for improving the detection limits of TXRF for samples in the micro region. By improving the spatial resolution of this technique, which is determined by the pinhole diameter and the distance between the pinhole and sample, more than five samples on a single substrate could be analyzed sequentially.
ACKNOWLEDGMENTS
This work was financially supported by the Practical Application Research project, JST Innovation Plaza Osaka, and also by KAKENHI (Grants-in-Aid for Scientific Research (B): 19350042).
2 4 6 8 10 12 14 16 180.0
0.5
1.0
1.5
2.0
2.5
Mn Kb
Mn Ka
Mo Ka
Inte
nsity (
cps )
Energy ( keV )
2 4 6 8 10 12 14 16 180.0
0.5
1.0
1.5
Fe Kb
Si Ka
Fe Ka
Mo Ka
Inte
nsity (
cps )
Energy ( keV )
2 4 6 8 10 12 14 16 180.0
0.3
0.6
0.9
1.2
1.5
1.8
Pb Lg
Pb Lb
Pb La
Mo Ka
Energy ( keV )
2 4 6 8 10 12 14 16 180.0
0.5
1.0
1.5
2.0
2.5
Si Ka
Cu Ka
Mo Ka
Cu Kb
Energy ( keV )
2 4 6 8 10 12 14 16 180
1
2
3
4
5
6
7
Zn Kb
Zn Ka
Mo Ka
Energy ( keV )
Fe
Mn
Pb
Cu
Zn
(a)
(c)
(b)
(d)
(e)
2 4 6 8 10 12 14 16 180.0
0.5
1.0
1.5
2.0
2.5
Mn Kb
Mn Ka
Mo Ka
Inte
nsity (
cps )
Energy ( keV )
2 4 6 8 10 12 14 16 180.0
0.5
1.0
1.5
Fe Kb
Si Ka
Fe Ka
Mo Ka
Inte
nsity (
cps )
Energy ( keV )
2 4 6 8 10 12 14 16 180.0
0.3
0.6
0.9
1.2
1.5
1.8
Pb Lg
Pb Lb
Pb La
Mo Ka
Energy ( keV )
2 4 6 8 10 12 14 16 180.0
0.5
1.0
1.5
2.0
2.5
Si Ka
Cu Ka
Mo Ka
Cu Kb
Energy ( keV )
2 4 6 8 10 12 14 16 180
1
2
3
4
5
6
7
Zn Kb
Zn Ka
Mo Ka
Energy ( keV )
Fe
Mn
Pb
Cu
Zn
(a)
(c)
(b)
(d)
(e)
M. Kawamata and K. Tsuji
EXRS2010 Conference Proceedings 22
REFERENCES
[1] Y. Yoneda, T. Horiuchi. Rev. Sci. Instrum. 1971, 42, 1069.
[2]R. Klockenkamper. Total-Reflection X-Ray Fluorescence Analysis. John Wiley and Sons: New York, 1997.
[3] T.C. Miller, C.M. Sparks, G.J. Havrilla, M.R. Beebe. Spectrochim. Acta B 2004, 59, 1117.
[4] T.C. Miller, H.L. DeWitt, G.J. Havrilla. Spectrochim. Acta B 2005, 60, 1458.
[5] K. Tsuji, M. Kawamata. X-Ray Spectrum. 2006, 35, 375.
[6] T. Emoto, Y. Sato, Y. Konishi, X. Ding, K. Tsuji. Spectrochim. Acta B 2004, 59, 1291.
[7] K. Nakano, K. Tsuji. X-Ray Spectrom. 2009, 38, 446.
EXRS2010 Conference Proceedings 23
A new facility for High energy PIXE at the ARRONAX Facility
C. Koumeir1, F. Haddad1, 2, V. Metivier1, N. Servagent1
and N. Michel1, 2
(1) SUBATECH, Université de Nantes, Ecole des Mines de Nantes, CNRS/IN2P3, La
Chantrerie, 4, rue A. Kastler, BP 20722, 44307 Nantes, France
(2) GIP ARRONAX, 1 rue Aronnax, Saint Herblain France ABSTRACT Proton Induced X-ray Emission (PIXE) using high energy protons is a non destructive multi elemental technique that can analyze medium and heavy trace elements on thick samples. A new experimental setup is being built at the ARRONAX facility (Nantes, France) for such purpose. Tests have been made in order to quantify the background induced by a 68 MeV proton beam on a 250µm copper target. Our measurement has been compared with expected theoretical value including the various components of the bremsstrahlung and the Compton induced by gamma rays. This study has allowed us to determine a detection limit of the order of tens of ppm and has shown also the different ways to improve it. Amongst them are a better shielding of the detector and the use of lower beam intensity. Another ways consist to use the prompt gamma rays emitted by the interaction of the beam with the target nucleus as well as the registration of the decay of the activation product after the end of the bombardment. This activation and especially the production of long lived radionuclide can be controlled by tuning the proton energy and intensity resulting in a low activation which is not prejudicial to most of the samples and with almost no effect on the PIXE performances.
HIGH ENERGY PIXE
Proton induced X-ray emission (PIXE) is a non destructive multi elemental technique allowing to determine concentration of elements with Z>11. This method has been applied with success in many different field using low-energy protons (1-5 MeV) with a detection limit in the order of ppm [1].The thickness of analyzed samples is limited by the range of low-energy protons and is of the order of 35µm for 3 MeV protons in Cu. Analysis is done using K X-rays for light element and L-Xrays for heavy element. It is then difficult sometimes to deconvolve two peaks from neighbour elements [2].
High energy PIXE presents several advantages compared to low energy PIXE. Heavy element can be studied using their K X-ray emission since their production cross-section increase with the proton incident energy (see Fig. 1). This additional information can help analysing the data. Thick target can be studied thanks to the much larger range of the energetic protons and to the smaller absorption of the hard K X-rays. Heavy elements can be detected as far as few millimetres deep inside the sample. For example, the range of 30 MeV protons in copper matrix is ~ 1.6 mm and K X-Rays for Sn (Z = 50) in copper can be seen at a depth of ~ 1mm. Additionally, for high energy protons, the energy loss, the energy straggling and the angular diffusion are low. It is then possible to make experiments directly in air with
C. Koumeir et al.
EXRS2010 Conference Proceedings 24
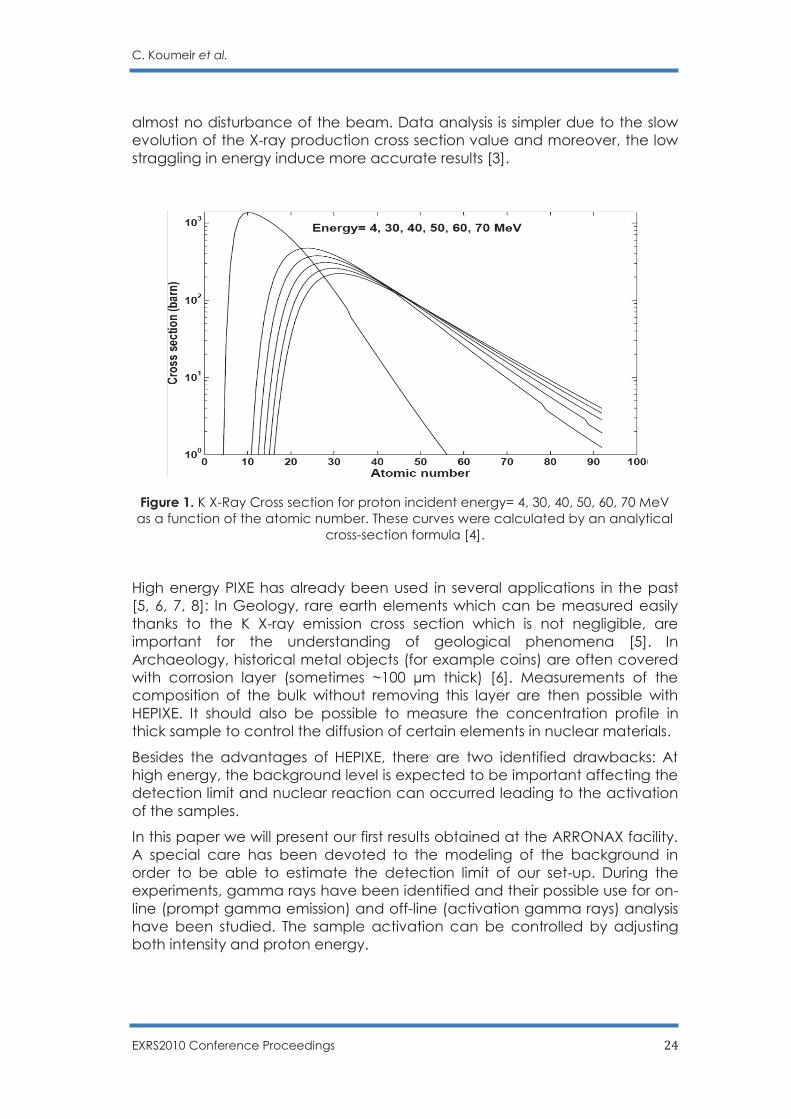
almost no disturbance of the beam. Data analysis is simpler due to the slow evolution of the X-ray production cross section value and moreover, the low straggling in energy induce more accurate results [3].
Figure 1. K X-Ray Cross section for proton incident energy= 4, 30, 40, 50, 60, 70 MeV as a function of the atomic number. These curves were calculated by an analytical
cross-section formula [4].
High energy PIXE has already been used in several applications in the past [5, 6, 7, 8]: In Geology, rare earth elements which can be measured easily thanks to the K X-ray emission cross section which is not negligible, are important for the understanding of geological phenomena [5]. In Archaeology, historical metal objects (for example coins) are often covered with corrosion layer (sometimes ~100 µm thick) [6]. Measurements of the composition of the bulk without removing this layer are then possible with HEPIXE. It should also be possible to measure the concentration profile in thick sample to control the diffusion of certain elements in nuclear materials.
Besides the advantages of HEPIXE, there are two identified drawbacks: At high energy, the background level is expected to be important affecting the detection limit and nuclear reaction can occurred leading to the activation of the samples.
In this paper we will present our first results obtained at the ARRONAX facility. A special care has been devoted to the modeling of the background in order to be able to estimate the detection limit of our set-up. During the experiments, gamma rays have been identified and their possible use for on-line (prompt gamma emission) and off-line (activation gamma rays) analysis have been studied. The sample activation can be controlled by adjusting both intensity and proton energy.
C. Koumeir et al.
EXRS2010 Conference Proceedings 25
EXPERIMENTAL SETUP
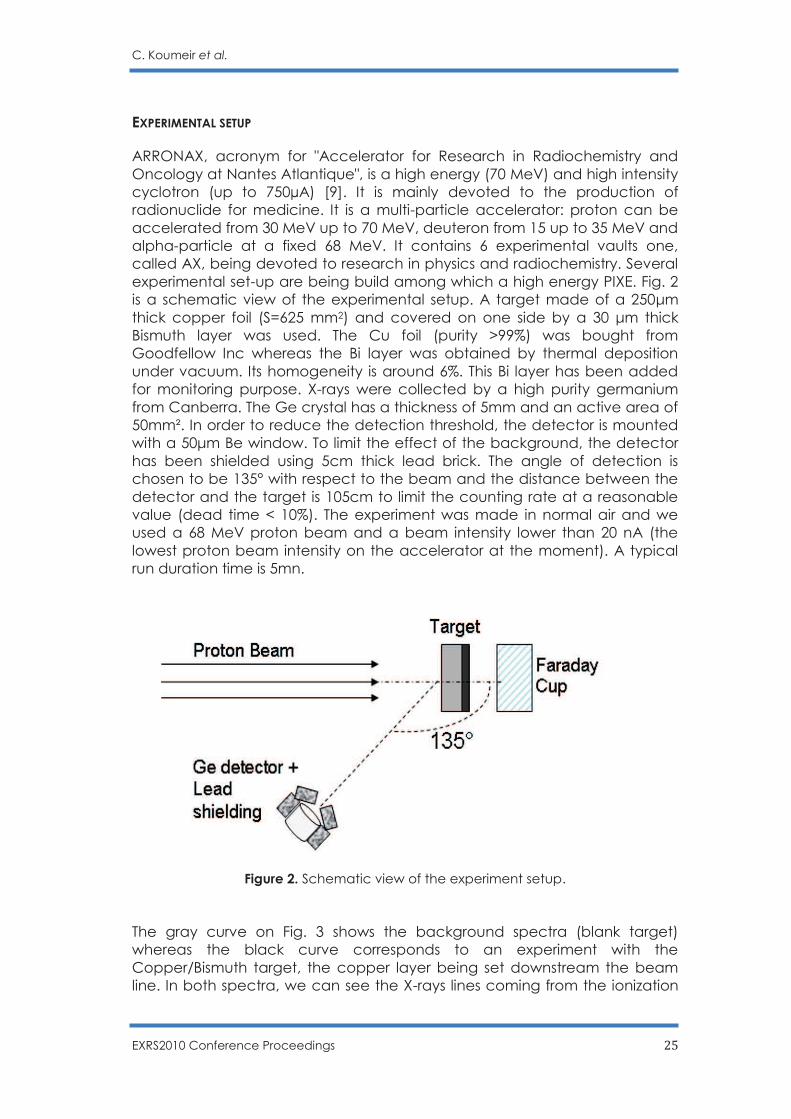
ARRONAX, acronym for "Accelerator for Research in Radiochemistry and Oncology at Nantes Atlantique", is a high energy (70 MeV) and high intensity cyclotron (up to 750µA) [9]. It is mainly devoted to the production of radionuclide for medicine. It is a multi-particle accelerator: proton can be accelerated from 30 MeV up to 70 MeV, deuteron from 15 up to 35 MeV and alpha-particle at a fixed 68 MeV. It contains 6 experimental vaults one, called AX, being devoted to research in physics and radiochemistry. Several experimental set-up are being build among which a high energy PIXE. Fig. 2 is a schematic view of the experimental setup. A target made of a 250μm thick copper foil (S=625 mm2) and covered on one side by a 30 μm thick Bismuth layer was used. The Cu foil (purity >99%) was bought from Goodfellow Inc whereas the Bi layer was obtained by thermal deposition under vacuum. Its homogeneity is around 6%. This Bi layer has been added for monitoring purpose. X-rays were collected by a high purity germanium from Canberra. The Ge crystal has a thickness of 5mm and an active area of 50mm². In order to reduce the detection threshold, the detector is mounted with a 50μm Be window. To limit the effect of the background, the detector has been shielded using 5cm thick lead brick. The angle of detection is chosen to be 135° with respect to the beam and the distance between the detector and the target is 105cm to limit the counting rate at a reasonable value (dead time < 10%). The experiment was made in normal air and we used a 68 MeV proton beam and a beam intensity lower than 20 nA (the lowest proton beam intensity on the accelerator at the moment). A typical run duration time is 5mn.
Figure 2. Schematic view of the experiment setup. The gray curve on Fig. 3 shows the background spectra (blank target) whereas the black curve corresponds to an experiment with the Copper/Bismuth target, the copper layer being set downstream the beam line. In both spectra, we can see the X-rays lines coming from the ionization
C. Koumeir et al.
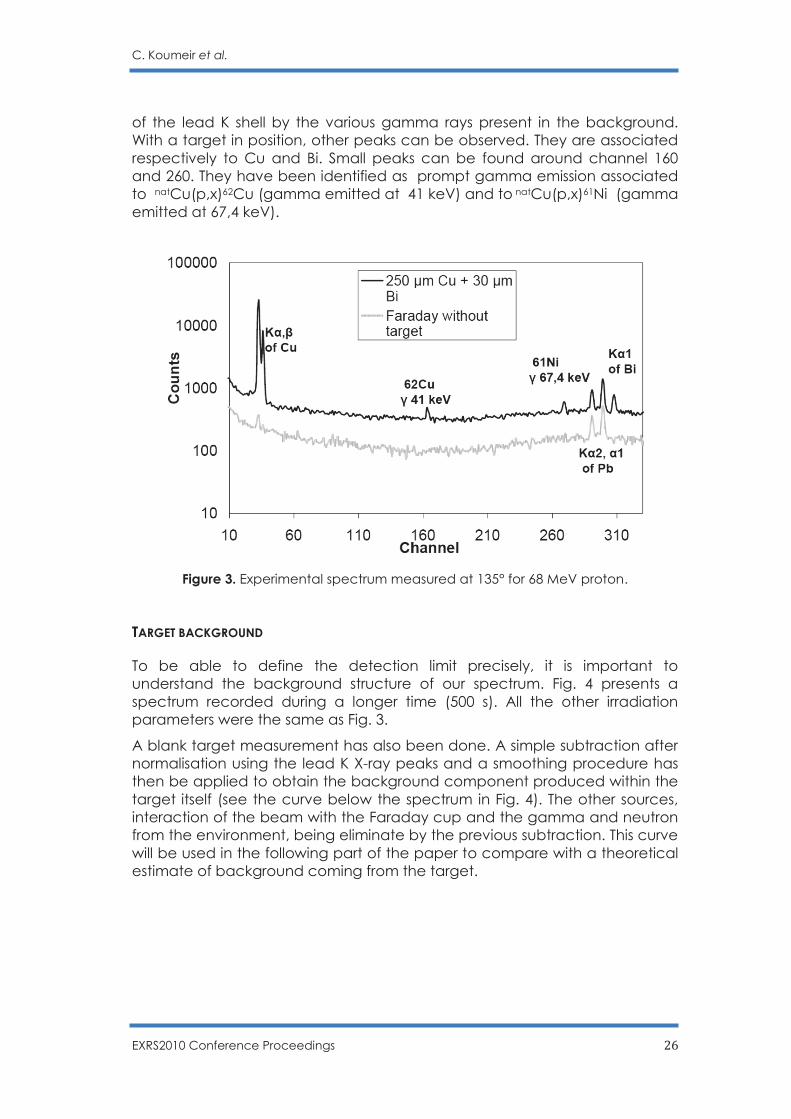
EXRS2010 Conference Proceedings 26
of the lead K shell by the various gamma rays present in the background. With a target in position, other peaks can be observed. They are associated respectively to Cu and Bi. Small peaks can be found around channel 160 and 260. They have been identified as prompt gamma emission associated to natCu(p,x)62Cu (gamma emitted at 41 keV) and to natCu(p,x)61Ni (gamma emitted at 67,4 keV).
Figure 3. Experimental spectrum measured at 135° for 68 MeV proton. TARGET BACKGROUND
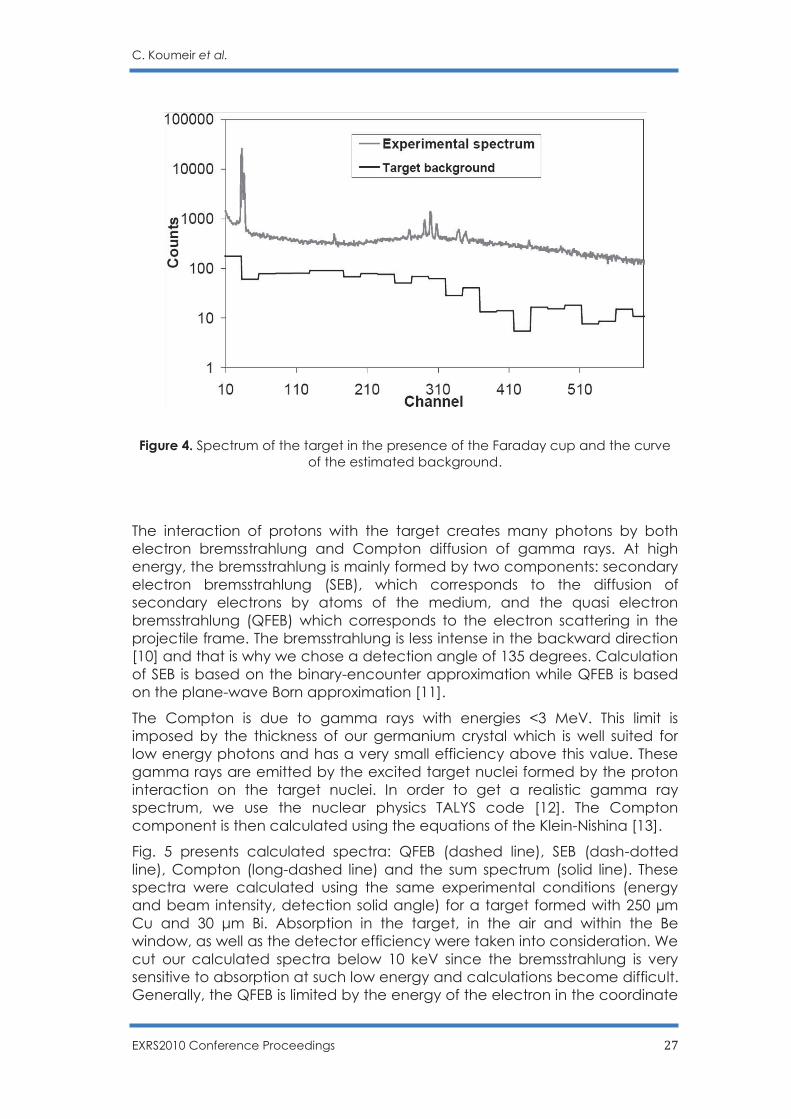
To be able to define the detection limit precisely, it is important to understand the background structure of our spectrum. Fig. 4 presents a spectrum recorded during a longer time (500 s). All the other irradiation parameters were the same as Fig. 3.
A blank target measurement has also been done. A simple subtraction after normalisation using the lead K X-ray peaks and a smoothing procedure has then be applied to obtain the background component produced within the target itself (see the curve below the spectrum in Fig. 4). The other sources, interaction of the beam with the Faraday cup and the gamma and neutron from the environment, being eliminate by the previous subtraction. This curve will be used in the following part of the paper to compare with a theoretical estimate of background coming from the target.
C. Koumeir et al.
EXRS2010 Conference Proceedings 27
Figure 4. Spectrum of the target in the presence of the Faraday cup and the curve of the estimated background.
The interaction of protons with the target creates many photons by both electron bremsstrahlung and Compton diffusion of gamma rays. At high energy, the bremsstrahlung is mainly formed by two components: secondary electron bremsstrahlung (SEB), which corresponds to the diffusion of secondary electrons by atoms of the medium, and the quasi electron bremsstrahlung (QFEB) which corresponds to the electron scattering in the projectile frame. The bremsstrahlung is less intense in the backward direction [10] and that is why we chose a detection angle of 135 degrees. Calculation of SEB is based on the binary-encounter approximation while QFEB is based on the plane-wave Born approximation [11].
The Compton is due to gamma rays with energies <3 MeV. This limit is imposed by the thickness of our germanium crystal which is well suited for low energy photons and has a very small efficiency above this value. These gamma rays are emitted by the excited target nuclei formed by the proton interaction on the target nuclei. In order to get a realistic gamma ray spectrum, we use the nuclear physics TALYS code [12]. The Compton component is then calculated using the equations of the Klein-Nishina [13].
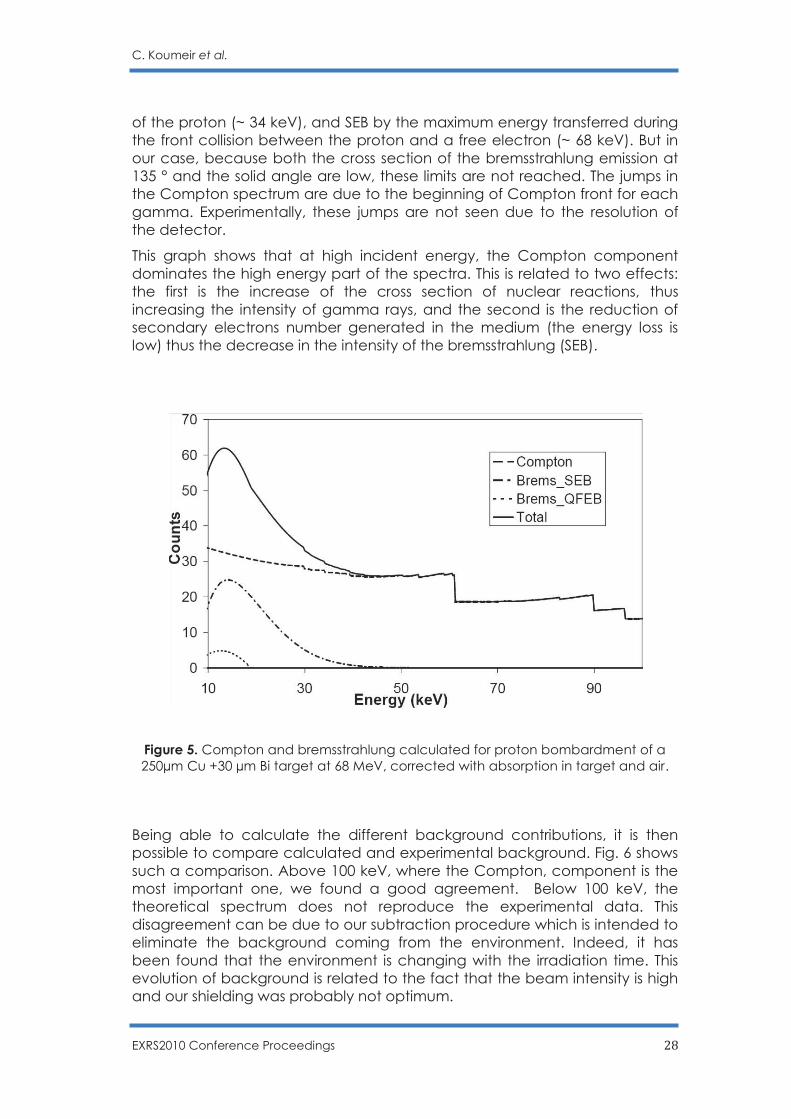
Fig. 5 presents calculated spectra: QFEB (dashed line), SEB (dash-dotted line), Compton (long-dashed line) and the sum spectrum (solid line). These spectra were calculated using the same experimental conditions (energy and beam intensity, detection solid angle) for a target formed with 250 µm Cu and 30 μm Bi. Absorption in the target, in the air and within the Be window, as well as the detector efficiency were taken into consideration. We cut our calculated spectra below 10 keV since the bremsstrahlung is very sensitive to absorption at such low energy and calculations become difficult. Generally, the QFEB is limited by the energy of the electron in the coordinate
C. Koumeir et al.
EXRS2010 Conference Proceedings 28
of the proton (~ 34 keV), and SEB by the maximum energy transferred during the front collision between the proton and a free electron (~ 68 keV). But in our case, because both the cross section of the bremsstrahlung emission at 135 ° and the solid angle are low, these limits are not reached. The jumps in the Compton spectrum are due to the beginning of Compton front for each gamma. Experimentally, these jumps are not seen due to the resolution of the detector.
This graph shows that at high incident energy, the Compton component dominates the high energy part of the spectra. This is related to two effects: the first is the increase of the cross section of nuclear reactions, thus increasing the intensity of gamma rays, and the second is the reduction of secondary electrons number generated in the medium (the energy loss is low) thus the decrease in the intensity of the bremsstrahlung (SEB).
Figure 5. Compton and bremsstrahlung calculated for proton bombardment of a 250µm Cu +30 µm Bi target at 68 MeV, corrected with absorption in target and air.
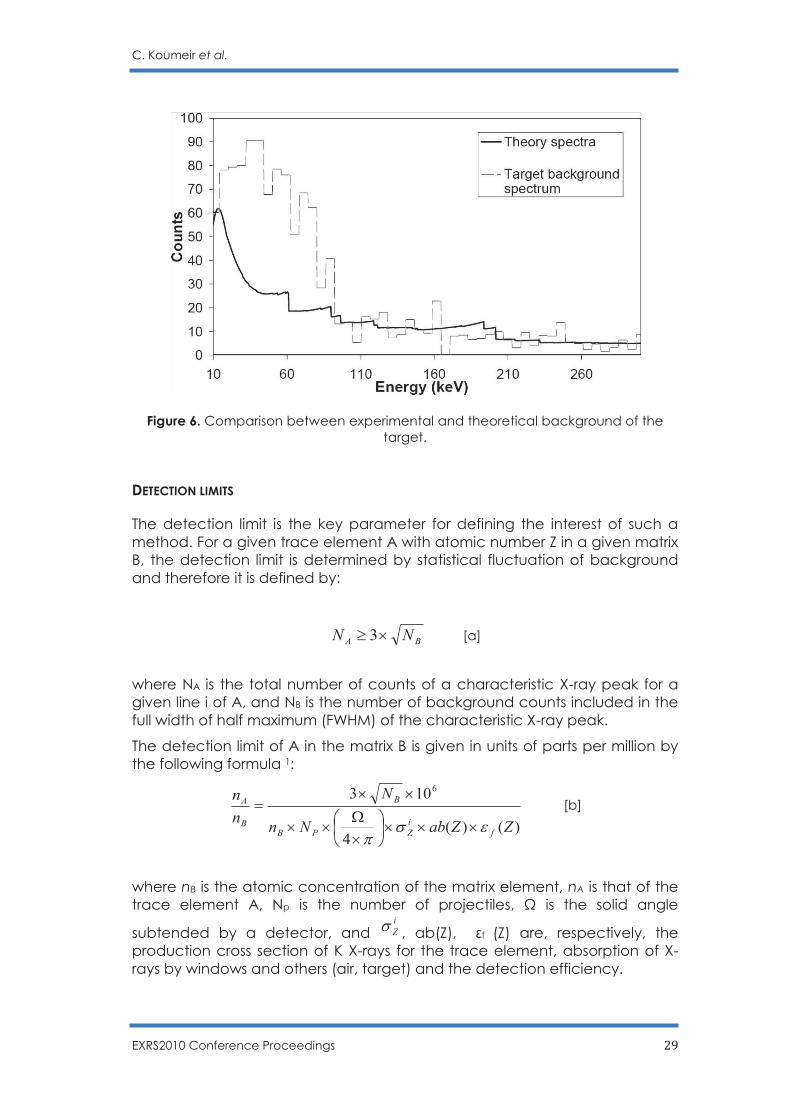
Being able to calculate the different background contributions, it is then possible to compare calculated and experimental background. Fig. 6 shows such a comparison. Above 100 keV, where the Compton, component is the most important one, we found a good agreement. Below 100 keV, the theoretical spectrum does not reproduce the experimental data. This disagreement can be due to our subtraction procedure which is intended to eliminate the background coming from the environment. Indeed, it has been found that the environment is changing with the irradiation time. This evolution of background is related to the fact that the beam intensity is high and our shielding was probably not optimum.
C. Koumeir et al.
EXRS2010 Conference Proceedings 29
Figure 6. Comparison between experimental and theoretical background of the target.
DETECTION LIMITS
The detection limit is the key parameter for defining the interest of such a method. For a given trace element A with atomic number Z in a given matrix B, the detection limit is determined by statistical fluctuation of background and therefore it is defined by:
BA NN ´³ 3 [a]
where NA is the total number of counts of a characteristic X-ray peak for a given line i of A, and NB is the number of background counts included in the full width of half maximum (FWHM) of the characteristic X-ray peak.
The detection limit of A in the matrix B is given in units of parts per million by the following formula 1:
)()(4
103 6
ZZabNn
N
n
n
f
i
ZPB
B
B
A
esp
´´´÷ø
öçè
æ´W
´´
´´= [b]
where nB is the atomic concentration of the matrix element, nA is that of the trace element A, Np is the number of projectiles, Ω is the solid angle
subtended by a detector, and i
Zs , ab(Z), εf (Z) are, respectively, the production cross section of K X-rays for the trace element, absorption of X-rays by windows and others (air, target) and the detection efficiency.
C. Koumeir et al.
EXRS2010 Conference Proceedings 30
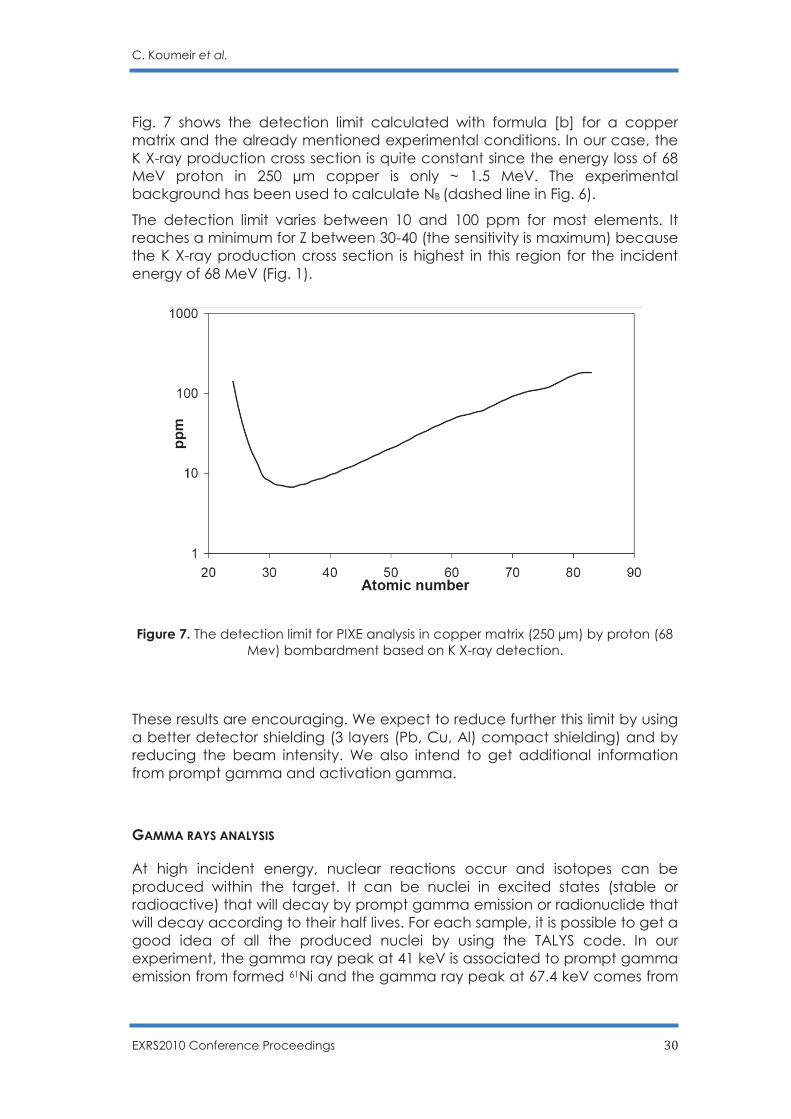
Fig. 7 shows the detection limit calculated with formula [b] for a copper matrix and the already mentioned experimental conditions. In our case, the K X-ray production cross section is quite constant since the energy loss of 68 MeV proton in 250 µm copper is only ~ 1.5 MeV. The experimental background has been used to calculate NB (dashed line in Fig. 6).
The detection limit varies between 10 and 100 ppm for most elements. It reaches a minimum for Z between 30-40 (the sensitivity is maximum) because the K X-ray production cross section is highest in this region for the incident energy of 68 MeV (Fig. 1).
Figure 7. The detection limit for PIXE analysis in copper matrix (250 µm) by proton (68 Mev) bombardment based on K X-ray detection.
These results are encouraging. We expect to reduce further this limit by using a better detector shielding (3 layers (Pb, Cu, Al) compact shielding) and by reducing the beam intensity. We also intend to get additional information from prompt gamma and activation gamma.
GAMMA RAYS ANALYSIS
At high incident energy, nuclear reactions occur and isotopes can be produced within the target. It can be nuclei in excited states (stable or radioactive) that will decay by prompt gamma emission or radionuclide that will decay according to their half lives. For each sample, it is possible to get a good idea of all the produced nuclei by using the TALYS code. In our experiment, the gamma ray peak at 41 keV is associated to prompt gamma emission from formed 61Ni and the gamma ray peak at 67.4 keV comes from
C. Koumeir et al.
EXRS2010 Conference Proceedings 31
the 62Cu formed in an exited state. This copper 62 (half life: T1/2 = 9.673 mn) will undergo further decay mainly via beta+ emission.
These peaks which are produced by the interaction of the beam with copper can be used to follow the copper deeper inside matter. Indeed, K X-ray of copper are at low energy and the absorption in matter is important limiting the zone of interest close to the surface. Knowing the nuclear data associated to the reaction mechanisms that produce copper, it is possible to determine the detection limit of copper in a thick target (> 200 μm). As an example, at a depth of 200µm, this value is greater than that achieved with X-rays by a factor ~ 2. In the one hand, the production cross section of these gamma rays is lower than that of X-rays by a factor of ~ 5000. On the other hand, at 200µm the absorption coefficient of 67.4 keV gamma rays is lower than Cu K X-rays by a factor ~ 10000. The use of prompt gamma ray may enhance the range of accessible nuclei deep inside thick samples. Since, most of the produced nuclei from a copper target are unstable (such as zinc, copper, nickel, cobalt, iron and manganese), they will decay by electron capture or β decay, leading to excited daughter nuclide. Among these parent isotopes, there are some who have a period T1/2 of the order of minutes and hours. Thus, they can be measured when the beam is turned off using a high precision shielded gamma ray detector. This off line measurement can give additional information about the composition of the target on a macroscopic level helping define the measurement strategy. ACTIVATION CONTROL
When instable nuclei with half lives of days or weeks (long-lived isotopes) are produced, activation can become a problem. In our experiments, we measure the dose on our samples at different times. Two weeks after our experiments, our samples have returned to the background level of radioactivity. This is due to the short half life of the majority of produced isotopes. Indeed, according to a TALYS calculation, only small amount of Cobalt isotopes are produced which are the only long live isotopes in this case with no effect on the sample dose. Nevertheless, it is possible to control to a certain level the activation sample by choosing the incident proton energy as well as limiting the beam intensity. The latter point is obvious since the activation is directly related to the number of incident proton. As an example, in our case, if we reduce the beam intensity down to 50 pA, with the same counting time (500 sec), and target-detector distance of 5 cm, we can register the same spectra that were measured (Fig. 2). In this case, we produce 400 times less radionuclides and we get also a better signal to background ratio.
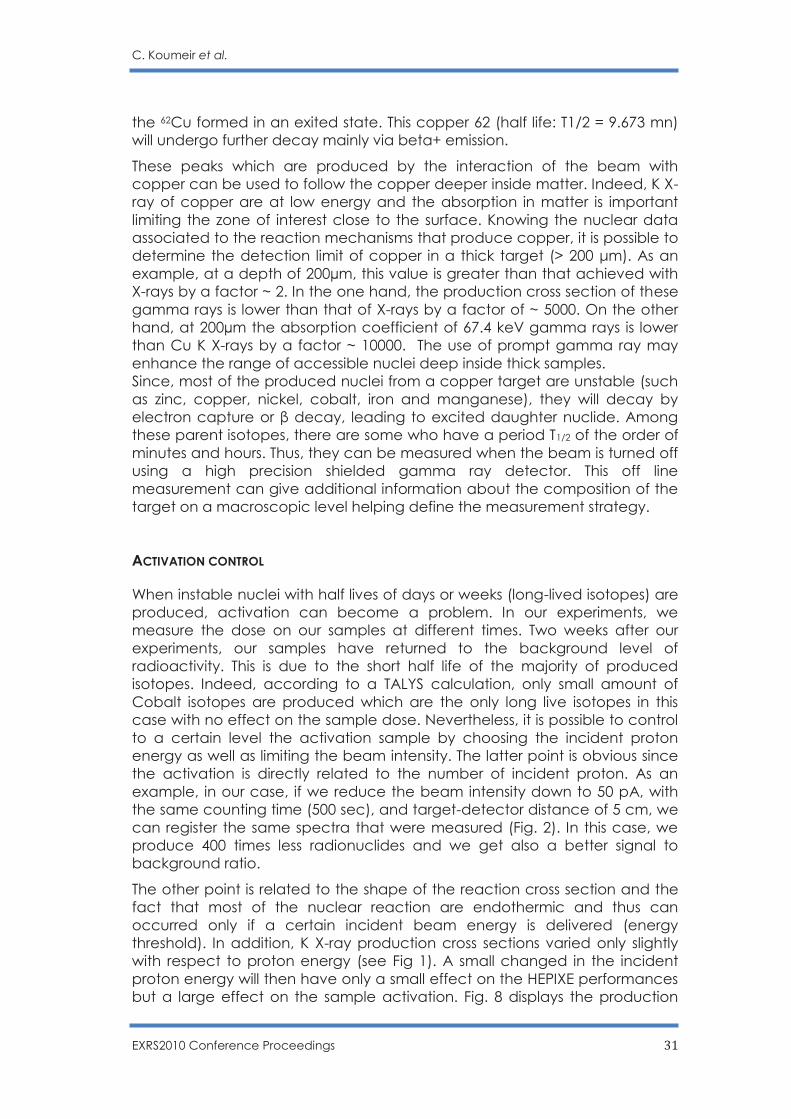
The other point is related to the shape of the reaction cross section and the fact that most of the nuclear reaction are endothermic and thus can occurred only if a certain incident beam energy is delivered (energy threshold). In addition, K X-ray production cross sections varied only slightly with respect to proton energy (see Fig 1). A small changed in the incident proton energy will then have only a small effect on the HEPIXE performances but a large effect on the sample activation. Fig. 8 displays the production
C. Koumeir et al.
EXRS2010 Conference Proceedings 32
cross section of different Cobalt isotopes using natural Copper target (57Co and 60Co), and the total production cross section (all isotopes) as function of the proton energy. It can be seen that below 35 MeV none of these two isotopes are produced. The total production cross section stays almost constant above 15 MeV. The main sample activation comes from the matrix which is often known. For trace element, activation will be small and its effect can be neglected.
Figure 8. Radionuclide production cross section from natural copper as a function of proton energy. Triangles are associated to 60Co production, square to 57Co and
circles to the total reaction cross section. CONCLUSION
An experimental setup is being installed at the ARRONAX facility to perform high energy PIXE. From our first measurement, we can expect ppm detection limit for medium mass isotopes as measured from a first experiment using a thick copper target. The detection limit is directly connected to the background. In order to reduce it, a new shielding of the detector is underway using three layers made of lead, copper and aluminium. Some modeling has started in order to get a better knowledge of the different background components. These calculations take into account electron bremsstrahlung and Compton diffusion. The next step will be to take into account the effect of secondary fluorescence in composed medium at high energy. Finally, we are also interested in measuring the K X-Ray production cross section for heavy elements these data will be necessary to take advantage of the high energy proton which are well suited to measure concentration profile of an element as a function of the depth in a thick target.
C. Koumeir et al.
EXRS2010 Conference Proceedings 33
Gamma rays coming from nuclear reaction can be registered on-line and off-line. For thick sample studies, this additional information can substitute to low energy K X-rays which are greatly attenuate in matter. Thus gamma ray emission can help us by giving information of low Z isotopes deeper in the samples and can improve the detection limit. Sample activation, which is inherent to the use of high energy particles, should be manageable by either reducing the beam intensity, limiting the irradiation time or by selecting carefully particle incident energy in order to limit the production of long-lived isotopes. REFERENCES
[1] K. Ishii and S. Morita, Nucl. Instr. and Meth. B 1988 34, 209.
[2] J. J. G. Durocher, N. M. Halden, F. C. Hawthorne, and J. S. C. McKee, Nucl. Instr. And Meth. B 1988 30, 470.
[3] J. L. Ruvalcaba and J. Miranda, Nucl. Instr. and Meth. B 1996 109-110,121.
[4] H. Paul, Nucl. Instr. and Meth. B 1984 3, 5.
[5] N. M. Halden, Nucl. Instr. and Meth. B 1993 77, 399.
[6] A. Denker, W. Bohne, J. Opitz-Coutureau, J. Rauschenberg, J. Röhrich, and E. Strub, Nucl. Instr. and Meth. B 2005 239, 65.
[7] H. Homeyer, Nucl. Instr. and Meth. B 1998 139, 58.
[8] A. Denker and K. H. Maier, Nucl. Instr. and Meth. B 2000 161-163, 704.
[9] F. Haddad et al, Eur. J. Med. Mol. Imaging 2008 35, 1377-1387.
[10] K. Ishii, A. Yamadera, M. Sebata, and S. Morita, Phys. Rev. A 1981 24, 1720–1725.
[11] K. Ishii, Radiat. Phys. Chem. 2006 75, 1135.
[12] A.J. Koning, S. Hilaire and M.C. Duijvestijn, “TALYS-1.0”, Proceedings of the International Conference on Nuclear Data for Science and Technology - ND2007, 2007 Nice France.
[13] C. Leroy, P. Rancoita, Principles of Radiation Interaction in Matter and Detection, World Scientific, Singapore, 2009.
EXRS2010 Conference Proceedings 34
Brass lamps: Preliminary study on the constituent materials and production technology by X-ray and
microscopical techniques
M. Simas1, T. Ferreira2,3, C. Dias2,3, N. Schiavon3,4, E. Fragoso1, M. J. Furtado1,5,6, R. J. C. Silva5, A. Alegria7, A. Le Gac1,6*
1 Departamento de Conservação e Restauro, Faculdade de Ciências e Tecnologia,
Universidade Nova de Lisboa, 2829-516 Monte de Caparica, Portugal
2 Centro de Química de Évora, Universidade de Évora, Colégio Luís António Verney, Rua Romão Ramalho, 59, 7000-671 Évora, Portugal
3 Laboratório HERCULES – Herança Cultural, Estudos e Salvaguarda, Universidade de Évora, Largo Marquês de Marialva 8, 7000-809 Évora, Portugal.
4 Centro de Geofísica de Évora, Colégio Luís António Verney, Departamento de Física, Rua Romão Ramalho, 59, 7000 Évora, Portugal
5 CENIMAT/I3N, Faculdade de Ciências e Tecnologia, Universidade Nova de Lisboa, 2829-516 Monte de Caparica, Portugal
6 Instituto Tecnológico e Nuclear, Estrada Nacional 10, 2686-953 Sacavém, Portugal
7 Museu de Évora, Largo Conde de Vila Flor, 7000-804 Évora, Portugal
*Author for correspondence:
E-mail: [email protected]
ABSTRACT This paper reports a preliminary study concerning two brass lamps belonging to the Évora Museum collection and one brass lamp belonging to a private collection. The main objective of this study was to acquire scientific data to assess the production technology used in the making of these lamps. Optical microscopy, X-ray digital radiography and scanning electron microscopy/energy dispersive spectrometry (SEM/EDS) were used to study the base, oil reservoir and the reflector of the selected lamps.
SEM/EDS analysis showed that although the analyzed parts of the lamps have slightly different elemental compositions, they are all made out of yellow brass (Cu »70% and Zn »30%, in w.t.) and soft-solder (Pb-Sn alloy). The lamp bases alloys also contain tin, which increases the dezincification resistance, and lead was also found in one of the lamps, which is known to increase malleability and reduce the melting point of the alloy.
Metallographic procedures were performed on two selected components of a lamp. Observation of as-cast and wrought brass microstructures support the main processing techniques used in manufacturing of this kind of objects. Likewise, the metallic phase encountered – alpha – of the Cu-Zn binary system – are in agreement with the elemental analysis performed.
This study reveals the importance of the radiography analysis to obtain a better understanding of structural aspects, as much thickness and density as mechanical processes and their impact on the manufacture of the different elements of these lamps. Fissures, cracks and restoration marks could also be identified in these lamps.
EXRS2010 Conference Proceedings 35
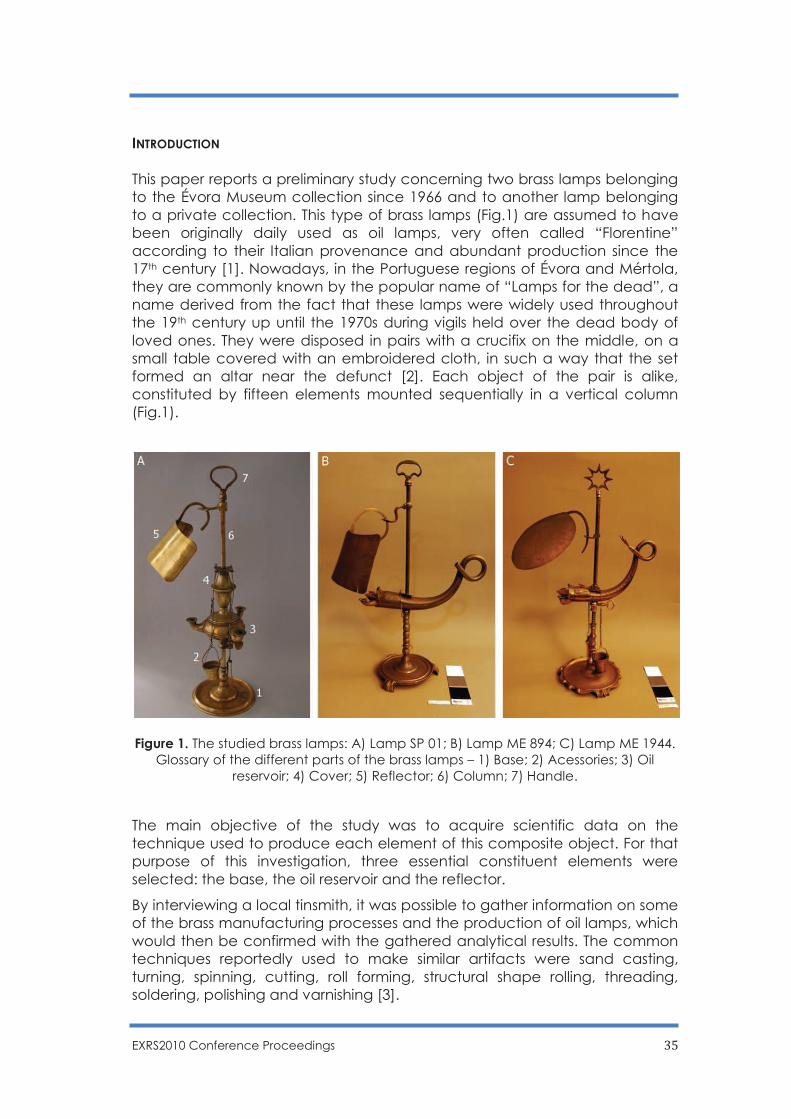
INTRODUCTION This paper reports a preliminary study concerning two brass lamps belonging to the Évora Museum collection since 1966 and to another lamp belonging to a private collection. This type of brass lamps (Fig.1) are assumed to have been originally daily used as oil lamps, very often called “Florentine” according to their Italian provenance and abundant production since the 17th century [1]. Nowadays, in the Portuguese regions of Évora and Mértola, they are commonly known by the popular name of “Lamps for the dead”, a name derived from the fact that these lamps were widely used throughout the 19th century up until the 1970s during vigils held over the dead body of loved ones. They were disposed in pairs with a crucifix on the middle, on a small table covered with an embroidered cloth, in such a way that the set formed an altar near the defunct [2]. Each object of the pair is alike, constituted by fifteen elements mounted sequentially in a vertical column (Fig.1).
Figure 1. The studied brass lamps: A) Lamp SP 01; B) Lamp ME 894; C) Lamp ME 1944. Glossary of the different parts of the brass lamps – 1) Base; 2) Acessories; 3) Oil
reservoir; 4) Cover; 5) Reflector; 6) Column; 7) Handle.
The main objective of the study was to acquire scientific data on the technique used to produce each element of this composite object. For that purpose of this investigation, three essential constituent elements were selected: the base, the oil reservoir and the reflector.
By interviewing a local tinsmith, it was possible to gather information on some of the brass manufacturing processes and the production of oil lamps, which would then be confirmed with the gathered analytical results. The common techniques reportedly used to make similar artifacts were sand casting, turning, spinning, cutting, roll forming, structural shape rolling, threading, soldering, polishing and varnishing [3].
M. Simas et al.
EXRS2010 Conference Proceedings 36
To verify these processes and identify the alloys used in different parts of an oil lamp, three brass lamps were selected: ME 894 and ME 1944 lamps (Évora Museum collection), chosen for their specific fuel tank that imitates the spindle-shaped appearance of an eel or a fish; and the SP 01 lamp (private collection), of a more “standard” design. Although the former two fish-shaped lamps are assumed as independent objects in the museum inventory (ME 894 and ME 1944), they are very similar and could match, acting as a pair according to their traditional use and funerary purpose. The third lamp (Fig.1), isolated, serves as a counterpoint to the above mentioned lamps, since its shape and decorative features are more common.
The three lamps were analyzed by means of Optical Microscopy, X-ray Digital Radiography and Scanning Electron Microscopy/Energy Dispersive Spectrometry (SEM/EDS).
BRASS
Copper and its alloys constitute a group of metallic materials and they have been widely used in different applications since ancient times. These materials have a set of characteristics that justify their widespread use, such as high corrosion resistance, moderate strength and workability [4].
With regard to brasses, the mechanical properties, corrosion resistance and manufacturing are strictly dependent upon the Zinc content. The addition of Zinc improves mechanical strength and hardness, and facilitates the casting process by reducing the melting temperature and the alloy viscosity [4].
There are three main classes of brass, depending on the phase type: α brass, αβ brass and β brass. The first contains up to 37 % of zinc and corresponds to a single phase (α). From 37 % to 45 % of zinc, β phase appears and a two-phased brass (αβ) is formed. From 45 % to 50 % of zinc, the brass becomes again a single phase (β) [5].
The color of brass changes with increasing zinc content. The common form of brass is the yellow brass which is the type of brass present in this study. It may contain from 30% to 40% of zinc without losing its high degree of resistance and malleability [5] and its characteristic golden color which ended up considering it "the poor’s gold" in the past.
EXPERIMENTAL DETAILS / PROTOCOLS
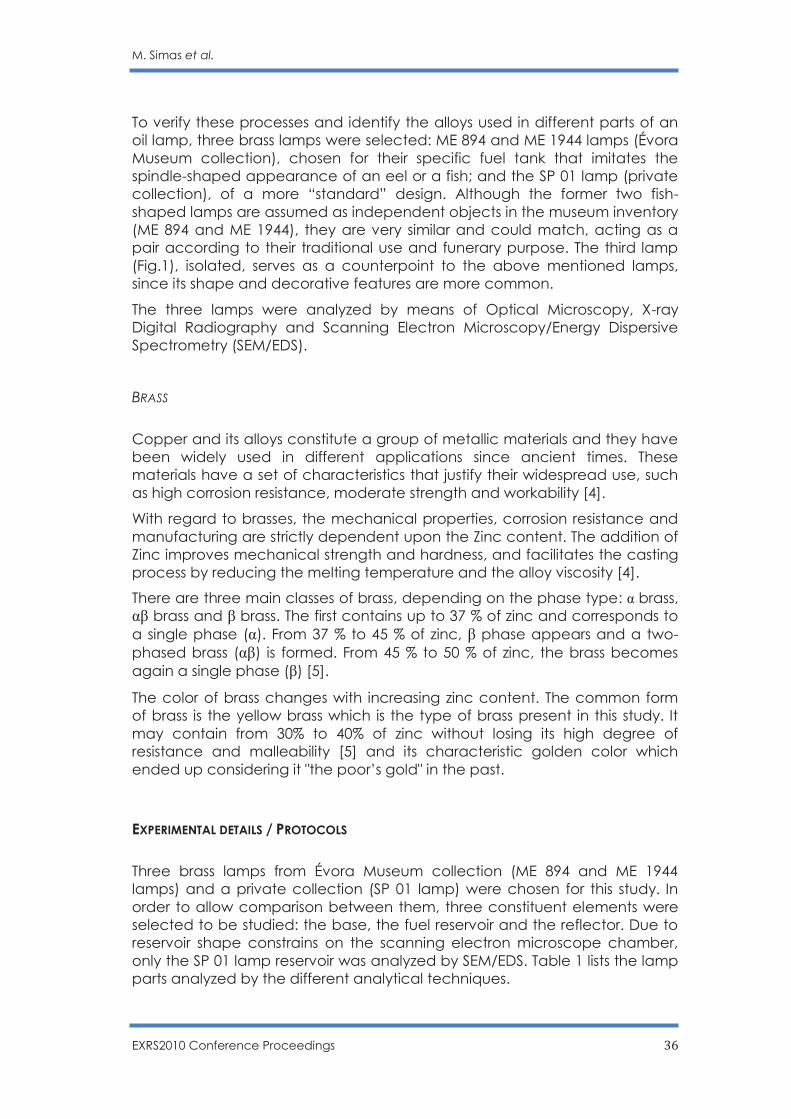
Three brass lamps from Évora Museum collection (ME 894 and ME 1944 lamps) and a private collection (SP 01 lamp) were chosen for this study. In order to allow comparison between them, three constituent elements were selected to be studied: the base, the fuel reservoir and the reflector. Due to reservoir shape constrains on the scanning electron microscope chamber, only the SP 01 lamp reservoir was analyzed by SEM/EDS. Table 1 lists the lamp parts analyzed by the different analytical techniques.
M. Simas et al.
EXRS2010 Conference Proceedings 37
Radiography Optical
microscopy SEM SEM/EDS
SP 01 base
oil reservoir reflector
base oil reservoir
reflector
base oil reservoir
reflector reservoir soldering
base oil reservoir
reflector reservoir soldering
ME 894 base
oil reservoir reflector
base oil reservoir
reflector
base reflector
base reflector
ME 1944 base
oil reservoir reflector
base oil reservoir
reflector
base oil reservoir
reflector reflector soldering
base reflector reflector soldering
Table 1. Parts of the lamps that were analyzed by the different analytical techniques.
METALLOGRAPHIC PROCEDURES
Metallographic procedures were performed only on the base (as-cast) and the reflector (rolling sheet) of SP 01 lamp. Examination was made directly in less exposed areas of the two components. The first polishing was done using carbon-silicon (SiC) and Micro-Mesh abrasives, grit sizes of P320 – 12000. The polishing was done in perpendicular directions to carefully remove the superficial layers. The final polishing was done using diamond paste (Magnum – Top-Plus, Extra Hochkon zentriert, 1μm), followed by silica coloidal emulsion (non-crystallizing colloidal silica polishing suspension - Buehler Masternet). After a few microscopic observations of the polished layer for control, the surface was carefully treated with an aqueous solution of ferric chloride (FeCl3) for a few seconds.
OPTICAL MICROSCOPY (OM)
The analyses were performed in CENIMAT at the Universidade Nova de Lisboa, Faculdade de Ciências e Tecnologias, with a Microscope Leica DMI5000M, equipped with a motorized Z focus, a set of five semi-apochromatic objectives HCX PL FL corresponding to 5x, 10x, 20x, 50x and 100x magnifications and a digital camera Leica DFC290. Optical microscopy of the surfaces which were prepared by the described metallographic procedure before chemical attack were made in bright field, dark filed and polarized light using different magnifications. After chemical attack with FeCl3, analyses were performed in bright field.
M. Simas et al.
EXRS2010 Conference Proceedings 38
SCANNING ELECTRON MICROSCOPY/ENERGY DISPERSIVE X-RAY SPECTROSCOPY (SEM/EDS)
The analyses were performed at the Universidade de Évora, Laboratório HERCULES, on an Hitachi S-3700N variable pressure scanning electron microscope interfaced with a Bruker X-ray Energy Dispersive Spectrometer. Analytical conditions were as follows: 20-30 kV range, working distance: 10 mm, AXS X-Flash 5010 Si (Li) detector, 129 eV spectral resolution, 100 sec counting time. Quantitative and semi-quantitative elemental concentrations were determined using a Quantax software standardless spectrum analysis based on P/B-ZAF formalism. The large 21 cm diameter wide SEM chamber allowed the analysis of the investigated objects directly, avoiding the need for destructive sampling.
RADIOGRAPHY
The radiographies were performed at the Departamento de Conservação e Restauro, Universidade Nova de Lisboa, Faculdade de Ciências e Tecnologia. The equipment ArtXray used is a system of digital radiography with high resolution, providing images with 12 bits (4096 grades of gray), 83 μm or 12 pixels/mm of resolution. According to the alloys, their density and thickness, parameters such as the intensity (kV), amperage (mA) and time (ms) were adapted. Their respective values varied between 110 kV and 144 kV, 3,3 mA and 4,4 mA, 100 ms and 400 ms.
RESULTS AND DISCUSSION
METALLOGRAPHIC PROCEDURES EVALUATED BY OM AND SEM/EDS TECHNIQUES
Metals are solid crystalline materials at room temperature (apart from mercury), composed by aggregates of small crystals denominated grains. Throughout the metallographic studies, the microstructural characteristics of the metals such as grain size, inclusions, impurities, second phases, porosity, segregation and other microstructural heterogeneities can be studied. These features are dependent on the original materials and proportions used and the mechanical and thermal treatments inherent to the manufacturing objects [6].
In order to analyze some of these aspects, namely the distinct production techniques, metallographic procedures were performed on the base and the reflector of SP 01 lamp. Optical microscopy and SEM/EDS analysis were used to evaluate the lamp treated zones.
M. Simas et al.
EXRS2010 Conference Proceedings 39
Constituent Element
Method of Production
Alloy (% wt)
SP 01 ME 894 ME 1944
Cu Zn Sn Cu Zn Sn Cu Zn Sn Pb
Base As-cast 77,2 21,1 1,6 73,9 23,4 2,7 66,4 18,6 6,6 7,4
Oil reservoir Rolling (metal sheet)
61,5 38,5 0,0 __ __ __ __ __ __ __
Reflector Rolling (metal sheet)
70,9 29,1 0,0 69,4 30,6 0,0 67,2 32,8 0,0 0,0
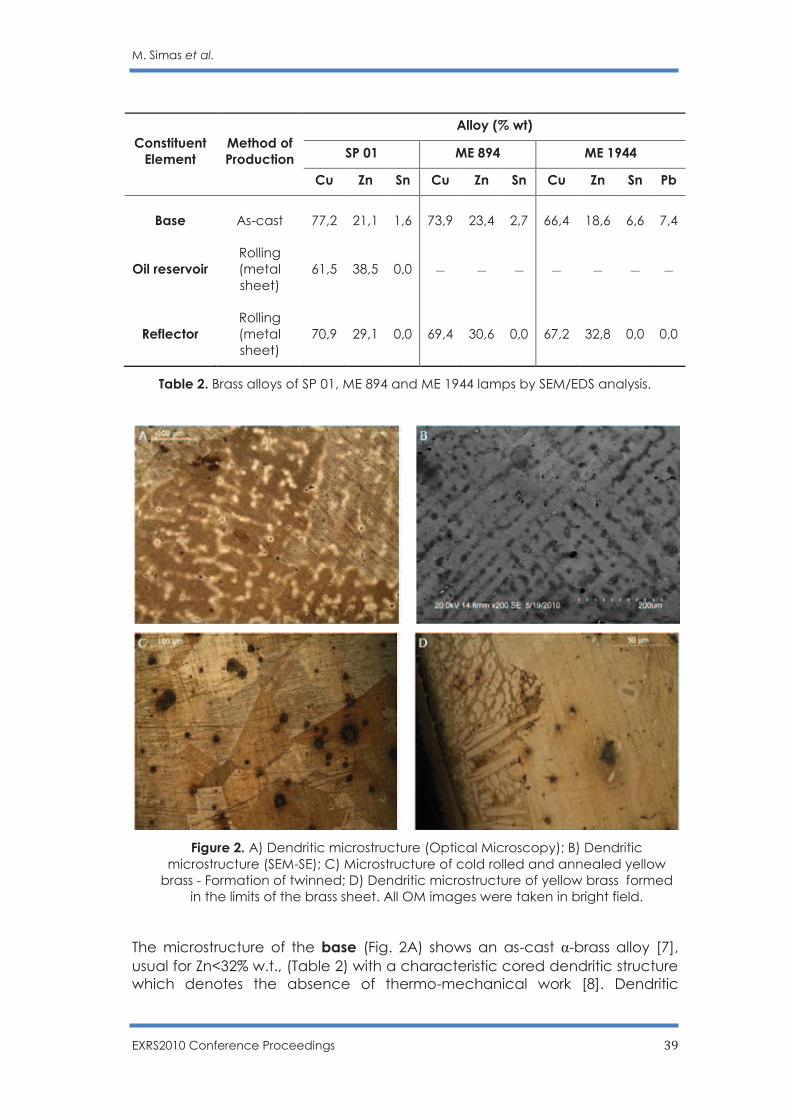
Table 2. Brass alloys of SP 01, ME 894 and ME 1944 lamps by SEM/EDS analysis.
Figure 2. A) Dendritic microstructure (Optical Microscopy); B) Dendritic
microstructure (SEM-SE); C) Microstructure of cold rolled and annealed yellow brass - Formation of twinned; D) Dendritic microstructure of yellow brass formed
in the limits of the brass sheet. All OM images were taken in bright field.
The microstructure of the base (Fig. 2A) shows an as-cast α-brass alloy [7], usual for Zn<32% w.t., (Table 2) with a characteristic cored dendritic structure which denotes the absence of thermo-mechanical work [8]. Dendritic
M. Simas et al.
EXRS2010 Conference Proceedings 40
growth is one form of segregation that can occur during casting. It is a segregation phenomenon that often arises in alloys due to the difference in the melting point of its constituents. When the alloy cools and begins to solidify by dendritic segregation, the first part of the formed dendrite arms are richer in copper (darker areas in the optical microscopy analysis, Fig. 2A) since this constituent solidifies first, while the outer parts of the arms are richer in zinc. This results in a compositional gradient from the inner region to the outer surface of a dendritic arm [6]. SEM image (secondary electron imaging) for these areas is shown in Fig. 2B and the EDS analysis confirmed the gradient elemental composition (data not shown).
Regarding the microstructure of the reflector, twinned grains caused by the rolling and beating process were observed (Fig. 2C). The grains are large, polyhedral and, in fact, present twinning. This morphology is indicative of heat treatment (annealing recristalyzation) for reducing strain hardening in a cold-worked material [9]. Regarding the edges of the reflector, a typically dendritic solidification structure was observed (Fig. 2D). This only occurs if the material is heated exceeding its liquidus temperature (T > 900 ºC). Since the phenomenon was observed only at the edges of the reflector, it can be inferred that it may have been caused by localized heating, e.g., during the metal sheet cutting.
SEM/EDS ANALYSIS OF THE SELECTED LAMP PARTS
In order to characterize the lamps and identify the alloy and solder composition, the analysis focused on determining the respective concentrations of the metallic elements (i.e. Cu, Zn Sn, Pb). Other non-metallic elements, which may result from cleaning, burning and dust, were not considered because they have no significant value in this research.
The shape and dimensions of the oil reservoir of ME 894 and ME 1944 lamps hampered their integral study by SEM/EDS. However, SEM analysis was possible in some areas of the oil reservoir of ME 1944 lamp.
The compositions of the alloys used in the three reflectors, made with brass sheet, are very similar (Table 2), revealing copper and zinc contents of 70% w.t. and 30% w.t. (ca.), respectively, which corresponds to a yellow brass.
The bases, as-cast, are made from tin brass alloys (Table 2). The addition of 0,2-3,0% of tin to a copper-zinc alloy is usually done to prevent dezincification and help the foundry process due to low melting point and high wettability of Sn [9]. Moreover, the addition of lead in the alloy used for ME 1944 base should have increased the working capacity of this alloy, contributing also to an increased resistance towards atmospheric corrosion [9]. The detection of Pb and distinct relations among Cu/Zn/Sn elements (Table 2) in composition of the ME 1944 base suggest that it is unlikely that this lamp constituted a pair with ME 894 lamp.
The analysis of the solder used in the joins may also supply interesting information. Several areas of the SP 01 oil reservoir and the ME 1944 reflector
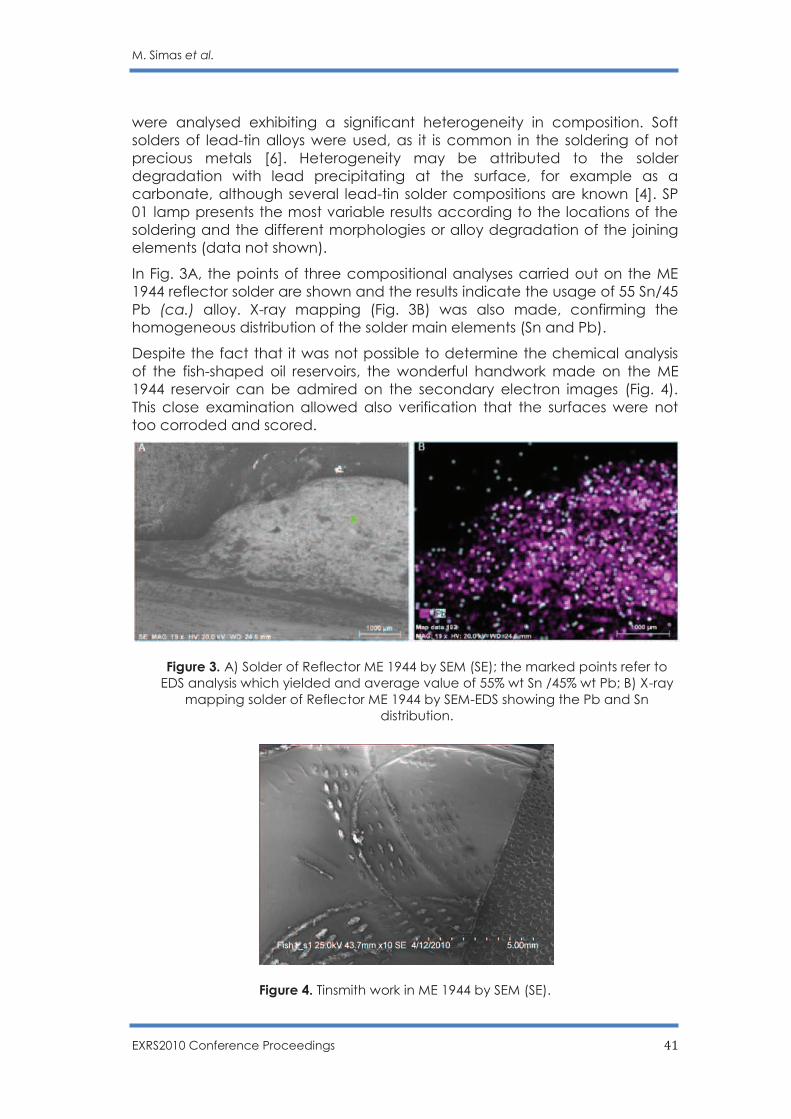
M. Simas et al.
EXRS2010 Conference Proceedings 41
were analysed exhibiting a significant heterogeneity in composition. Soft solders of lead-tin alloys were used, as it is common in the soldering of not precious metals [6]. Heterogeneity may be attributed to the solder degradation with lead precipitating at the surface, for example as a carbonate, although several lead-tin solder compositions are known [4]. SP 01 lamp presents the most variable results according to the locations of the soldering and the different morphologies or alloy degradation of the joining elements (data not shown).
In Fig. 3A, the points of three compositional analyses carried out on the ME 1944 reflector solder are shown and the results indicate the usage of 55 Sn/45 Pb (ca.) alloy. X-ray mapping (Fig. 3B) was also made, confirming the homogeneous distribution of the solder main elements (Sn and Pb).
Despite the fact that it was not possible to determine the chemical analysis of the fish-shaped oil reservoirs, the wonderful handwork made on the ME 1944 reservoir can be admired on the secondary electron images (Fig. 4). This close examination allowed also verification that the surfaces were not too corroded and scored.
Figure 3. A) Solder of Reflector ME 1944 by SEM (SE); the marked points refer to EDS analysis which yielded and average value of 55% wt Sn /45% wt Pb; B) X-ray
mapping solder of Reflector ME 1944 by SEM-EDS showing the Pb and Sn distribution.
Figure 4. Tinsmith work in ME 1944 by SEM (SE).
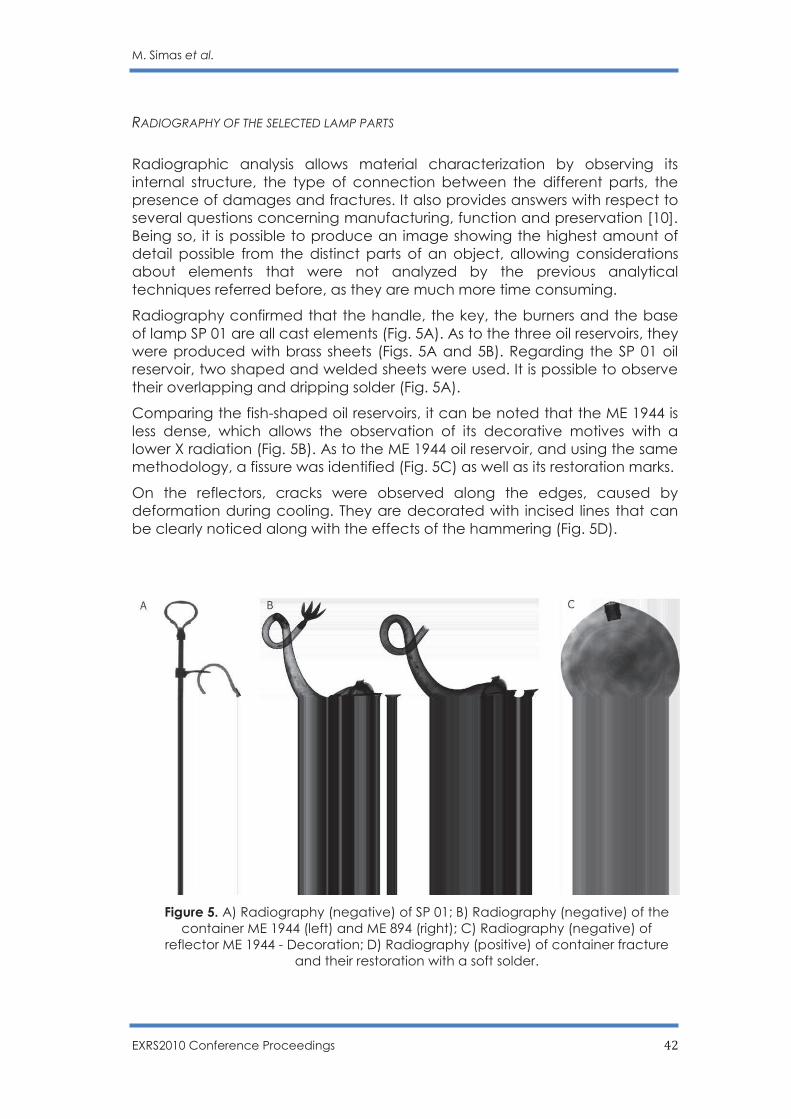
M. Simas et al.
EXRS2010 Conference Proceedings 42
RADIOGRAPHY OF THE SELECTED LAMP PARTS
Radiographic analysis allows material characterization by observing its internal structure, the type of connection between the different parts, the presence of damages and fractures. It also provides answers with respect to several questions concerning manufacturing, function and preservation [10]. Being so, it is possible to produce an image showing the highest amount of detail possible from the distinct parts of an object, allowing considerations about elements that were not analyzed by the previous analytical techniques referred before, as they are much more time consuming.
Radiography confirmed that the handle, the key, the burners and the base of lamp SP 01 are all cast elements (Fig. 5A). As to the three oil reservoirs, they were produced with brass sheets (Figs. 5A and 5B). Regarding the SP 01 oil reservoir, two shaped and welded sheets were used. It is possible to observe their overlapping and dripping solder (Fig. 5A).
Comparing the fish-shaped oil reservoirs, it can be noted that the ME 1944 is less dense, which allows the observation of its decorative motives with a lower X radiation (Fig. 5B). As to the ME 1944 oil reservoir, and using the same methodology, a fissure was identified (Fig. 5C) as well as its restoration marks.
On the reflectors, cracks were observed along the edges, caused by deformation during cooling. They are decorated with incised lines that can be clearly noticed along with the effects of the hammering (Fig. 5D).
Figure 5. A) Radiography (negative) of SP 01; B) Radiography (negative) of the container ME 1944 (left) and ME 894 (right); C) Radiography (negative) of
reflector ME 1944 - Decoration; D) Radiography (positive) of container fracture and their restoration with a soft solder.
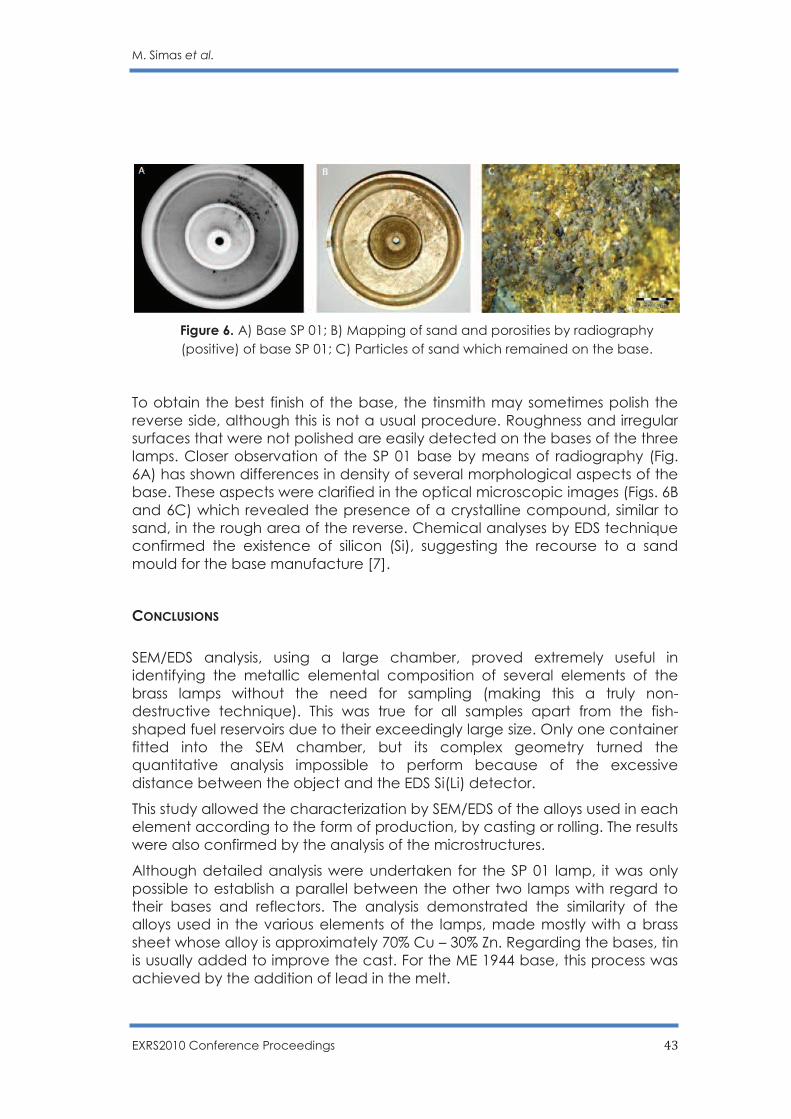
M. Simas et al.
EXRS2010 Conference Proceedings 43
Figure 6. A) Base SP 01; B) Mapping of sand and porosities by radiography (positive) of base SP 01; C) Particles of sand which remained on the base.
To obtain the best finish of the base, the tinsmith may sometimes polish the reverse side, although this is not a usual procedure. Roughness and irregular surfaces that were not polished are easily detected on the bases of the three lamps. Closer observation of the SP 01 base by means of radiography (Fig. 6A) has shown differences in density of several morphological aspects of the base. These aspects were clarified in the optical microscopic images (Figs. 6B and 6C) which revealed the presence of a crystalline compound, similar to sand, in the rough area of the reverse. Chemical analyses by EDS technique confirmed the existence of silicon (Si), suggesting the recourse to a sand mould for the base manufacture [7].
CONCLUSIONS
SEM/EDS analysis, using a large chamber, proved extremely useful in identifying the metallic elemental composition of several elements of the brass lamps without the need for sampling (making this a truly non-destructive technique). This was true for all samples apart from the fish-shaped fuel reservoirs due to their exceedingly large size. Only one container fitted into the SEM chamber, but its complex geometry turned the quantitative analysis impossible to perform because of the excessive distance between the object and the EDS Si(Li) detector.
This study allowed the characterization by SEM/EDS of the alloys used in each element according to the form of production, by casting or rolling. The results were also confirmed by the analysis of the microstructures.
Although detailed analysis were undertaken for the SP 01 lamp, it was only possible to establish a parallel between the other two lamps with regard to their bases and reflectors. The analysis demonstrated the similarity of the alloys used in the various elements of the lamps, made mostly with a brass sheet whose alloy is approximately 70% Cu – 30% Zn. Regarding the bases, tin is usually added to improve the cast. For the ME 1944 base, this process was achieved by the addition of lead in the melt.
M. Simas et al.
EXRS2010 Conference Proceedings 44
This study reveals how essential X-ray application was to obtain a better understanding of structural aspects, as much thickness and density as mechanical processes and their impact on the manufacture of the different elements. Combining the methods of examination and analysis explored in this research, it was possible to verify the brass techniques explained by the tinsmith.
The combined methodological approach adopted in this study proved extremely useful in identifying which brass productions technique (among the different ones indicated by tinsmith experts) was used in the manufacturing of the lamp objects investigated.
Observation of as-cast and wrought brass microstructures support the main processing techniques used in manufacturing of this kind of objects. Likewise, the metallic phase encountered – alpha – of the Cu-Zn binary system – are in agreement with the elemental analysis performed by SEM/EDS.
ACKNOWLEDGMENTS
To António Camões Gouveia, Director of Évora Museum.
REFERENCES
[1] B. MAHOT , LES LAMPES A HUILE, MASSIN EDITEUR, PARIS, 2005, P. 78-85.
[2] I. SIMÕES, ORAL INTERVIEW, MÉRTOLA (PORTUGAL) 2009.
[3] F. SILVA, ORAL INTERVIEW, LISBOA (PORTUGAL) 2009.
[4] H. C. ASM, ASM HANDBOOK, PROPERTIES AND SELECTION: NONFERROUS ALLOYS AND SPECIAL-PURPOSE MATERIALS, VOL 2. ASM INTERNATIONAL - THE MATERIAL INFORMATION SOCIETY, 1990.
[5] THAMES, HUDSON, MANUAL OF DIRECT METAL SCULPTURE,. TREVO FAULKNER, 1978.
[6] D. SCOTT, METALLOGRAPHY AND MICROSTRUCTURE OF ANCIENT AND HISTORIC METALS, THE GETTY
CONSERVATION INSTITUTE, 1991.
[7] H. C. ASM, ASM HANDBOOK, CASTING, VOL 15. ASM INTERNATIONAL - THE MATERIAL
INFORMATION SOCIETY, 1988.
[8] H. C. ASM, ASM HANDBOOK, METALLOGRAPHY AND MICROSTRUCTURES, VOL 9. ASM
INTERNATIONAL - THE MATERIAL INFORMATION SOCIETY, 2004.
[9] J. ASHTON, D. HALLAM, METAL 04, PROCEEDINGS OF THE INTERNATIONAL CONFERENCE ON METAL
CONSERVATION, CANBERRA, AUSTRALIA, 2004 .
[10] J. LANG, A. MIDDLETON, RADIOGRAPHY OF CULTURAL MATERIAL, ELSEVIER BUTTERWORTH- HEINEMANN, OXFORD 2005.
EXRS2010 Conference Proceedings 45
PIXE and PXRF comparison analysis of a standard canvas painting
C.R. Appoloni1, F. Lopes1, M.A. Rizzutto2, A.C. Neiva3, R. Ikeoka1, A.
Cacione2 and M. Rizzo4,5
1 Departamento de Física da Universidade Estadual de Londrina, Laboratório de Física Nuclear Aplicada (LFNA), Caixa Postal 6001,
CEP 86051-990, Campus Universitário, Londrina, PR – Brasil 2 Instituto de Física da Universidade de São Paulo, Laboratório de Análise de
Materiais por Feixes Iônicos (LAMFI), Rua do Matão Travessa R Nr.187, CEP 05508-090 Cidade Universitária, São Paulo, SP – Brasil
3 Escola Politécnica da Universidade de São Paulo, Laboratório de Eletroquímica e Corrosão (LEC), Departamento de Engenharia Química, Av. Prof. Luciano
Gualberto, Trav. 3, 380, CEP 05508-900, São Paulo, SP – Brasil
4 Instituto de Química da Universidade de São Paulo, Av. Professor Lineu Prestes, 748, CEP 05513-970 São Paulo, SP – Brasil
5 Departamento de Filosofia, Comunicação, Letras e Artes da Pontifícia Universidade Católica de São Paulo, Rua Monte Alegre, 984, Perdizes,
CEP: 05014-901 São Paulo, SP – Brasil
E-mail: [email protected]
ABSTRACT For purposes of comparison among different equipments and laboratories involved in atomic-nuclear methodologies applied in arts and archaeometry, a special standard canvas painting was made with dozens of pigments of different colors, varnishes of different types and manufacturers, inclusions of metals (Ag and Au foils and pieces of metal), alternate layers of pigments and foils inclusions. With the objective to evaluate XRF and PIXE methods as complementary tools to examine canvas paintings, twenty organic substances, Au and Ag foils, and thirty four pigments of this standard canvas were measured in three different laboratories, LEC, LFNA and LAMFI. In the present paper, net count ratios and standard percentage deviations between lines are shown, as well as examples of sensibility to low-content elements which can be used for distinguishing pigments, and also a comparison of the penetration of these techniques. Results show the differences among the XRF and PIXE methodologies and also between the two PXRF geometry/equipments employed.
INTRODUCTION
The use of non-destructive elemental spectroscopic methods as X ray fluorescence spectroscopy and PIXE (Particle-Induced X-ray Emission) is becoming usual in the area of art and cultural heritage objects, helping the characterization of the constituents of the artwork as well as the identification of the deterioration processes, in order to choose the better method to conserve them. These techniques are very powerful and important in the material characterization, especially for the pigments
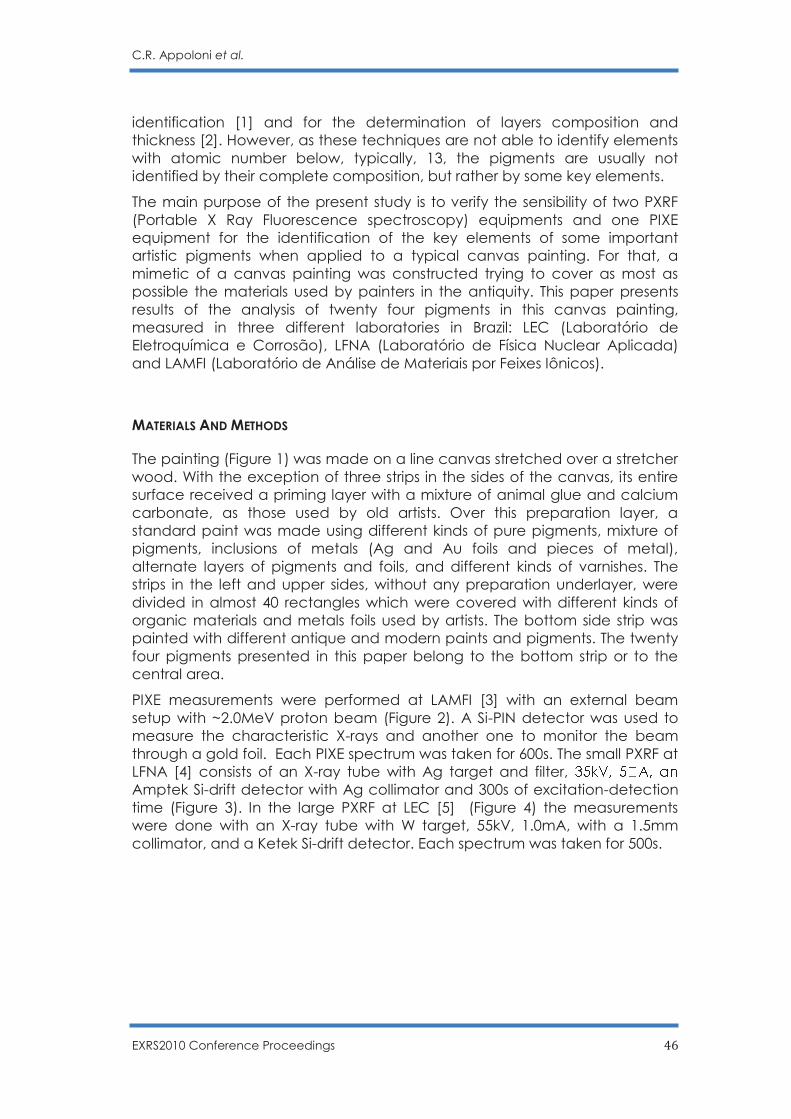
C.R. Appoloni et al.
EXRS2010 Conference Proceedings 46
identification [1] and for the determination of layers composition and thickness [2]. However, as these techniques are not able to identify elements with atomic number below, typically, 13, the pigments are usually not identified by their complete composition, but rather by some key elements.
The main purpose of the present study is to verify the sensibility of two PXRF (Portable X Ray Fluorescence spectroscopy) equipments and one PIXE equipment for the identification of the key elements of some important artistic pigments when applied to a typical canvas painting. For that, a mimetic of a canvas painting was constructed trying to cover as most as possible the materials used by painters in the antiquity. This paper presents results of the analysis of twenty four pigments in this canvas painting, measured in three different laboratories in Brazil: LEC (Laboratório de Eletroquímica e Corrosão), LFNA (Laboratório de Física Nuclear Aplicada) and LAMFI (Laboratório de Análise de Materiais por Feixes Iônicos).
MATERIALS AND METHODS
The painting (Figure 1) was made on a line canvas stretched over a stretcher wood. With the exception of three strips in the sides of the canvas, its entire surface received a priming layer with a mixture of animal glue and calcium carbonate, as those used by old artists. Over this preparation layer, a standard paint was made using different kinds of pure pigments, mixture of pigments, inclusions of metals (Ag and Au foils and pieces of metal), alternate layers of pigments and foils, and different kinds of varnishes. The strips in the left and upper sides, without any preparation underlayer, were divided in almost 40 rectangles which were covered with different kinds of organic materials and metals foils used by artists. The bottom side strip was painted with different antique and modern paints and pigments. The twenty four pigments presented in this paper belong to the bottom strip or to the central area.
PIXE measurements were performed at LAMFI [3] with an external beam setup with ~2.0MeV proton beam (Figure 2). A Si-PIN detector was used to measure the characteristic X-rays and another one to monitor the beam through a gold foil. Each PIXE spectrum was taken for 600s. The small PXRF at LFNA [4] consists of an X-ray tube with Ag target and filter, Amptek Si-drift detector with Ag collimator and 300s of excitation-detection time (Figure 3). In the large PXRF at LEC [5] (Figure 4) the measurements were done with an X-ray tube with W target, 55kV, 1.0mA, with a 1.5mm collimator, and a Ketek Si-drift detector. Each spectrum was taken for 500s.
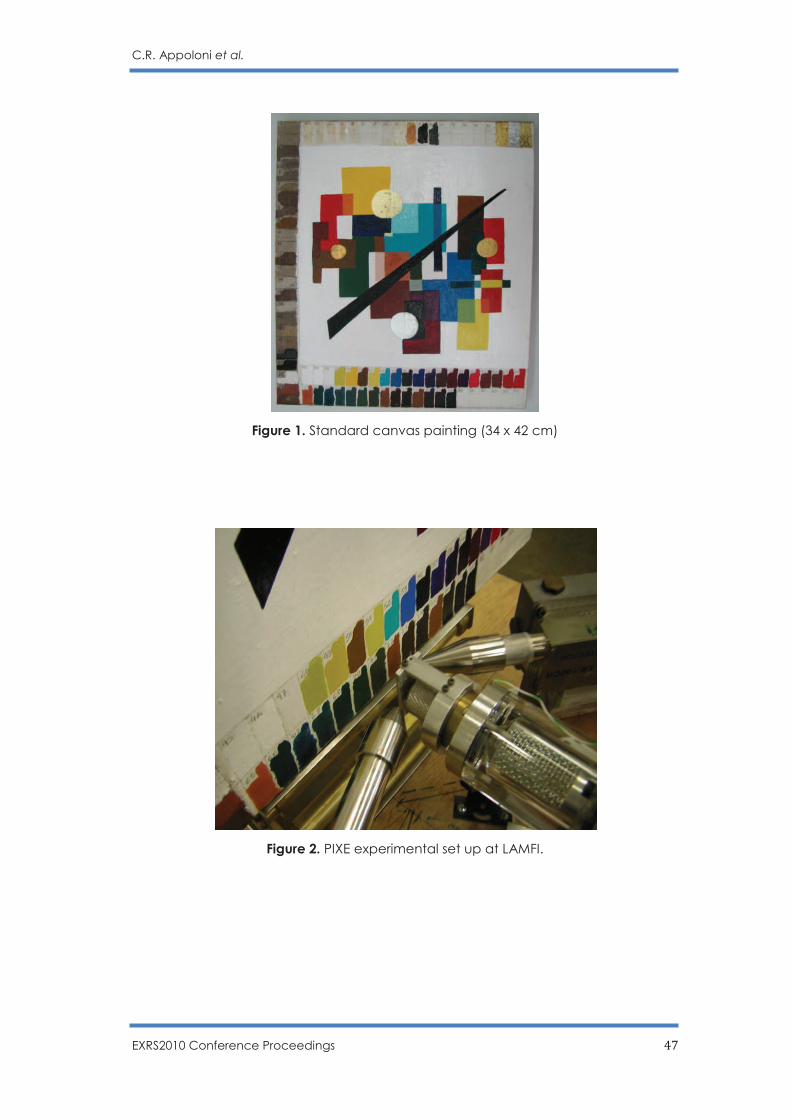
C.R. Appoloni et al.
EXRS2010 Conference Proceedings 47
Figure 1. Standard canvas painting (34 x 42 cm)
Figure 2. PIXE experimental set up at LAMFI.
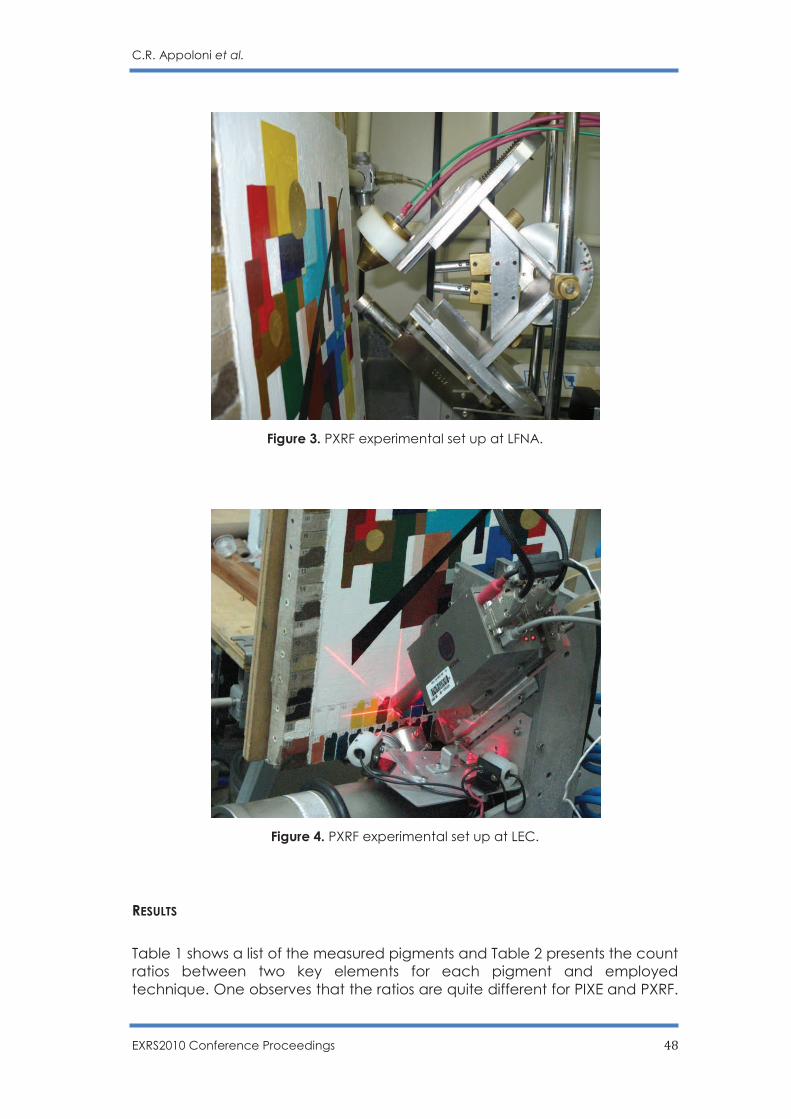
C.R. Appoloni et al.
EXRS2010 Conference Proceedings 48
Figure 3. PXRF experimental set up at LFNA.
Figure 4. PXRF experimental set up at LEC.
RESULTS
Table 1 shows a list of the measured pigments and Table 2 presents the count ratios between two key elements for each pigment and employed technique. One observes that the ratios are quite different for PIXE and PXRF.
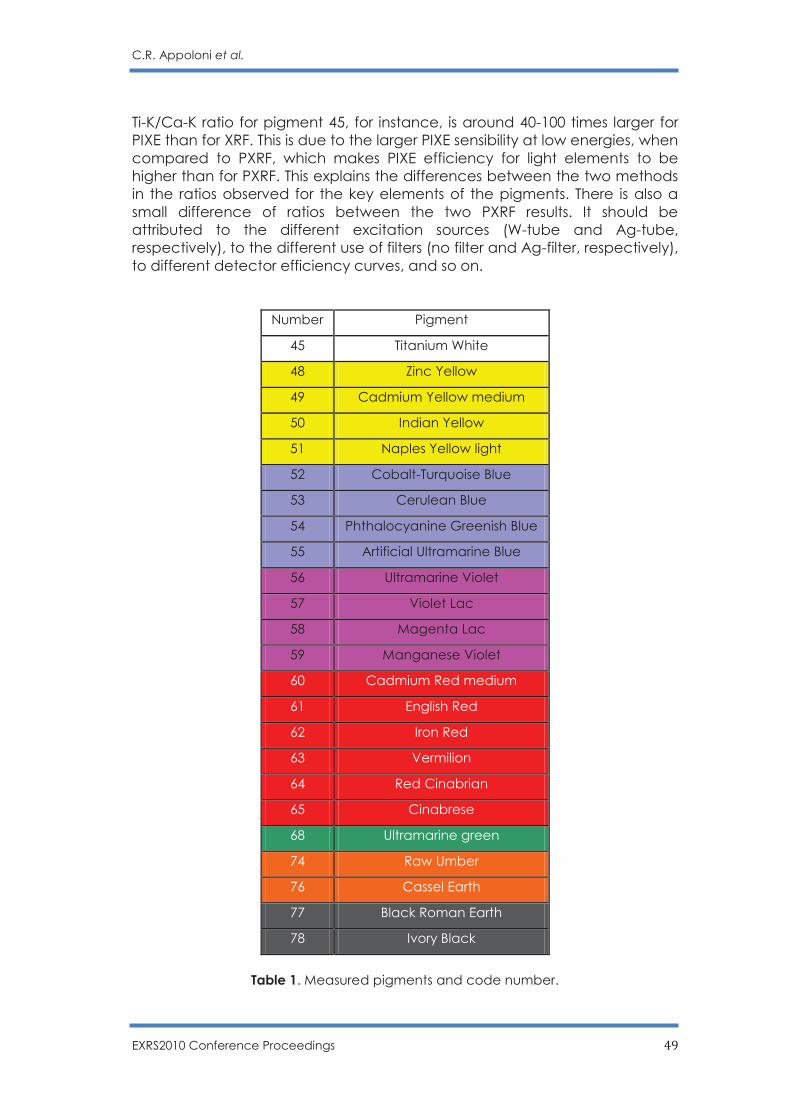
C.R. Appoloni et al.
EXRS2010 Conference Proceedings 49
Ti-K/Ca-K ratio for pigment 45, for instance, is around 40-100 times larger for PIXE than for XRF. This is due to the larger PIXE sensibility at low energies, when compared to PXRF, which makes PIXE efficiency for light elements to be higher than for PXRF. This explains the differences between the two methods in the ratios observed for the key elements of the pigments. There is also a small difference of ratios between the two PXRF results. It should be attributed to the different excitation sources (W-tube and Ag-tube, respectively), to the different use of filters (no filter and Ag-filter, respectively), to different detector efficiency curves, and so on.
Number Pigment
45 Titanium White
48 Zinc Yellow
49 Cadmium Yellow medium
50 Indian Yellow
51 Naples Yellow light
52 Cobalt-Turquoise Blue
53 Cerulean Blue
54 Phthalocyanine Greenish Blue
55 Artificial Ultramarine Blue
56 Ultramarine Violet
57 Violet Lac
58 Magenta Lac
59 Manganese Violet
60 Cadmium Red medium
61 English Red
62 Iron Red
63 Vermilion
64 Red Cinabrian
65 Cinabrese
68 Ultramarine green
74 Raw Umber
76 Cassel Earth
77 Black Roman Earth
78 Ivory Black
Table 1. Measured pigments and code number.
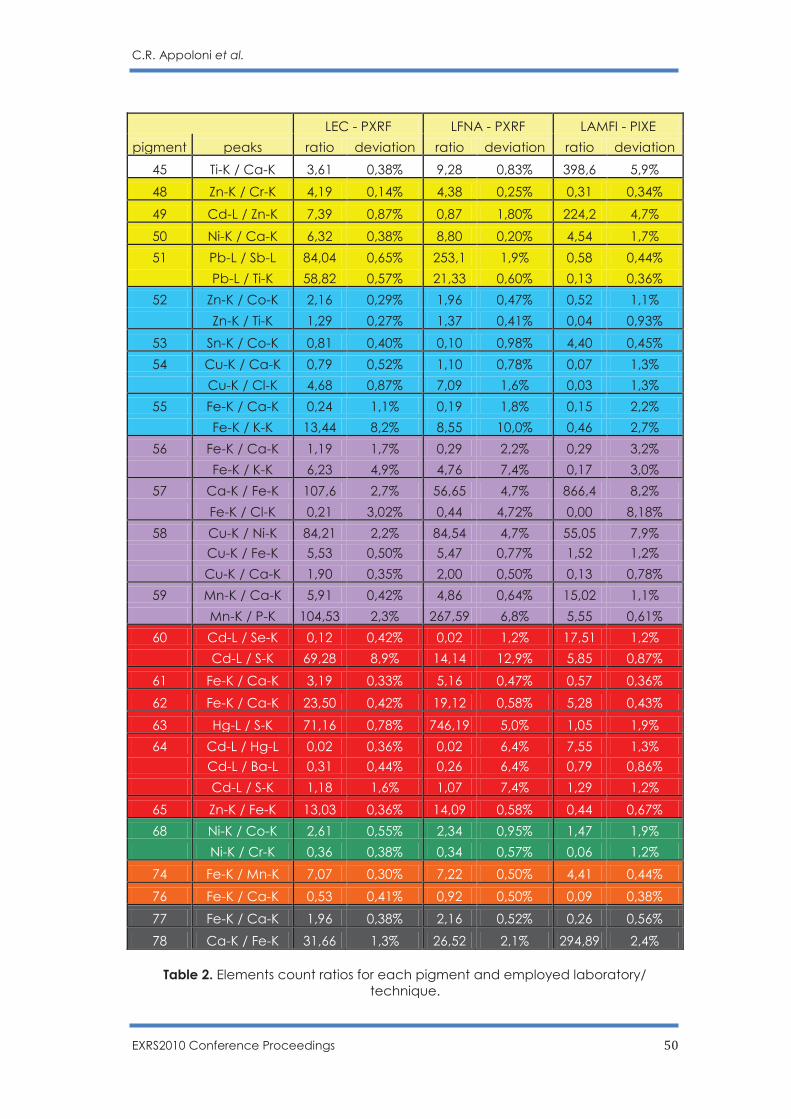
C.R. Appoloni et al.
EXRS2010 Conference Proceedings 50
LEC - PXRF LFNA - PXRF LAMFI - PIXE
pigment peaks ratio deviation ratio deviation ratio deviation
45 Ti-K / Ca-K 3,61 0,38% 9,28 0,83% 398,6 5,9%
48 Zn-K / Cr-K 4,19 0,14% 4,38 0,25% 0,31 0,34%
49 Cd-L / Zn-K 7,39 0,87% 0,87 1,80% 224,2 4,7%
50 Ni-K / Ca-K 6,32 0,38% 8,80 0,20% 4,54 1,7%
51 Pb-L / Sb-L 84,04 0,65% 253,1 1,9% 0,58 0,44%
Pb-L / Ti-K 58,82 0,57% 21,33 0,60% 0,13 0,36%
52 Zn-K / Co-K 2,16 0,29% 1,96 0,47% 0,52 1,1%
Zn-K / Ti-K 1,29 0,27% 1,37 0,41% 0,04 0,93%
53 Sn-K / Co-K 0,81 0,40% 0,10 0,98% 4,40 0,45%
54 Cu-K / Ca-K 0,79 0,52% 1,10 0,78% 0,07 1,3%
Cu-K / Cl-K 4,68 0,87% 7,09 1,6% 0,03 1,3%
55 Fe-K / Ca-K 0,24 1,1% 0,19 1,8% 0,15 2,2%
Fe-K / K-K 13,44 8,2% 8,55 10,0% 0,46 2,7%
56 Fe-K / Ca-K 1,19 1,7% 0,29 2,2% 0,29 3,2%
Fe-K / K-K 6,23 4,9% 4,76 7,4% 0,17 3,0%
57 Ca-K / Fe-K 107,6 2,7% 56,65 4,7% 866,4 8,2%
Fe-K / Cl-K 0,21 3,02% 0,44 4,72% 0,00 8,18%
58 Cu-K / Ni-K 84,21 2,2% 84,54 4,7% 55,05 7,9%
Cu-K / Fe-K 5,53 0,50% 5,47 0,77% 1,52 1,2%
Cu-K / Ca-K 1,90 0,35% 2,00 0,50% 0,13 0,78%
59 Mn-K / Ca-K 5,91 0,42% 4,86 0,64% 15,02 1,1%
Mn-K / P-K 104,53 2,3% 267,59 6,8% 5,55 0,61%
60 Cd-L / Se-K 0,12 0,42% 0,02 1,2% 17,51 1,2%
Cd-L / S-K 69,28 8,9% 14,14 12,9% 5,85 0,87%
61 Fe-K / Ca-K 3,19 0,33% 5,16 0,47% 0,57 0,36%
62 Fe-K / Ca-K 23,50 0,42% 19,12 0,58% 5,28 0,43%
63 Hg-L / S-K 71,16 0,78% 746,19 5,0% 1,05 1,9%
64 Cd-L / Hg-L 0,02 0,36% 0,02 6,4% 7,55 1,3%
Cd-L / Ba-L 0,31 0,44% 0,26 6,4% 0,79 0,86%
Cd-L / S-K 1,18 1,6% 1,07 7,4% 1,29 1,2%
65 Zn-K / Fe-K 13,03 0,36% 14,09 0,58% 0,44 0,67%
68 Ni-K / Co-K 2,61 0,55% 2,34 0,95% 1,47 1,9%
Ni-K / Cr-K 0,36 0,38% 0,34 0,57% 0,06 1,2%
74 Fe-K / Mn-K 7,07 0,30% 7,22 0,50% 4,41 0,44%
76 Fe-K / Ca-K 0,53 0,41% 0,92 0,50% 0,09 0,38%
77 Fe-K / Ca-K 1,96 0,38% 2,16 0,52% 0,26 0,56%
78 Ca-K / Fe-K 31,66 1,3% 26,52 2,1% 294,89 2,4%
Table 2. Elements count ratios for each pigment and employed laboratory/ technique.
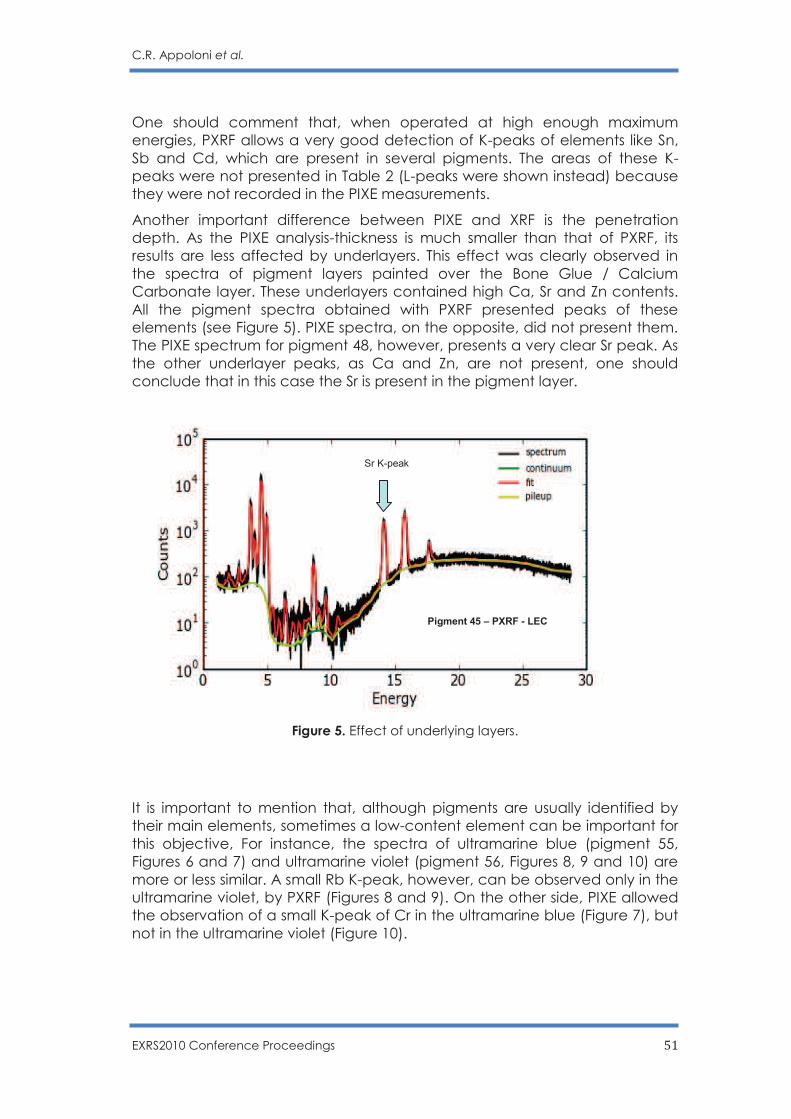
C.R. Appoloni et al.
EXRS2010 Conference Proceedings 51
One should comment that, when operated at high enough maximum energies, PXRF allows a very good detection of K-peaks of elements like Sn, Sb and Cd, which are present in several pigments. The areas of these K-peaks were not presented in Table 2 (L-peaks were shown instead) because they were not recorded in the PIXE measurements.
Another important difference between PIXE and XRF is the penetration depth. As the PIXE analysis-thickness is much smaller than that of PXRF, its results are less affected by underlayers. This effect was clearly observed in the spectra of pigment layers painted over the Bone Glue / Calcium Carbonate layer. These underlayers contained high Ca, Sr and Zn contents. All the pigment spectra obtained with PXRF presented peaks of these elements (see Figure 5). PIXE spectra, on the opposite, did not present them. The PIXE spectrum for pigment 48, however, presents a very clear Sr peak. As the other underlayer peaks, as Ca and Zn, are not present, one should conclude that in this case the Sr is present in the pigment layer.
Figure 5. Effect of underlying layers.
It is important to mention that, although pigments are usually identified by their main elements, sometimes a low-content element can be important for this objective, For instance, the spectra of ultramarine blue (pigment 55, Figures 6 and 7) and ultramarine violet (pigment 56, Figures 8, 9 and 10) are more or less similar. A small Rb K-peak, however, can be observed only in the ultramarine violet, by PXRF (Figures 8 and 9). On the other side, PIXE allowed the observation of a small K-peak of Cr in the ultramarine blue (Figure 7), but not in the ultramarine violet (Figure 10).
Pigment 45 – PXRF - LEC
Sr K-peak
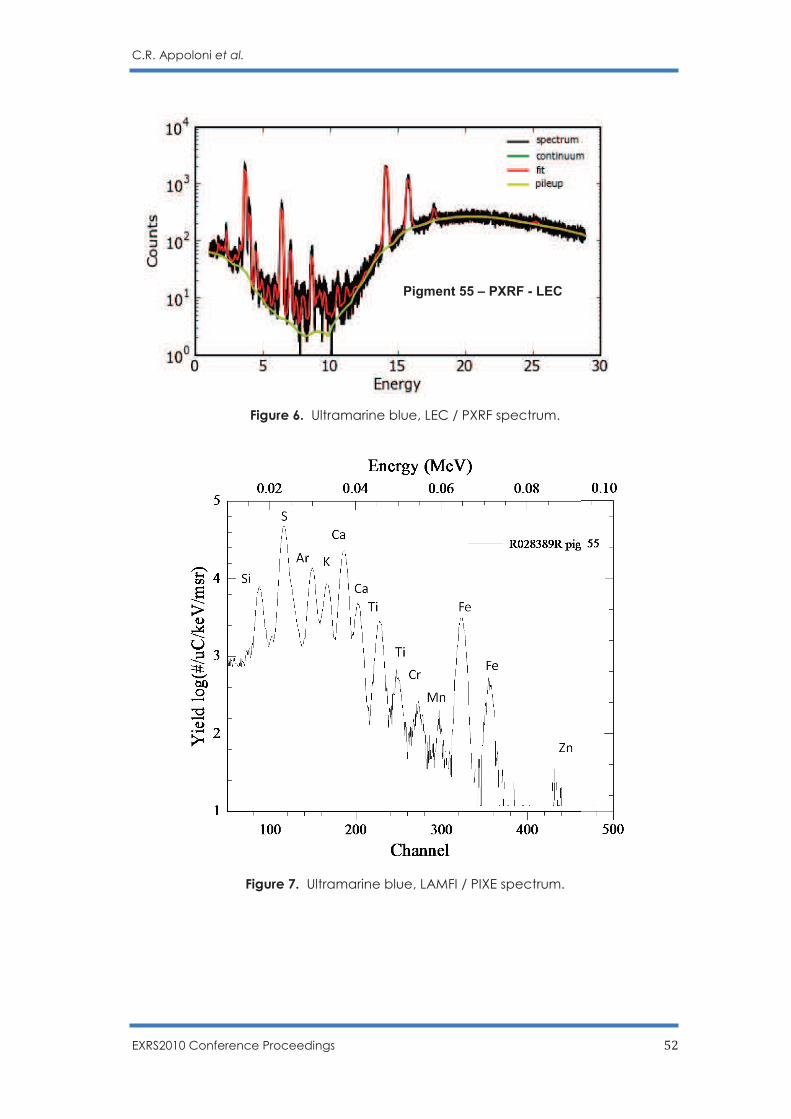
C.R. Appoloni et al.
EXRS2010 Conference Proceedings 52
Figure 6. Ultramarine blue, LEC / PXRF spectrum.
Figure 7. Ultramarine blue, LAMFI / PIXE spectrum.
Pigment 55 – PXRF - LEC
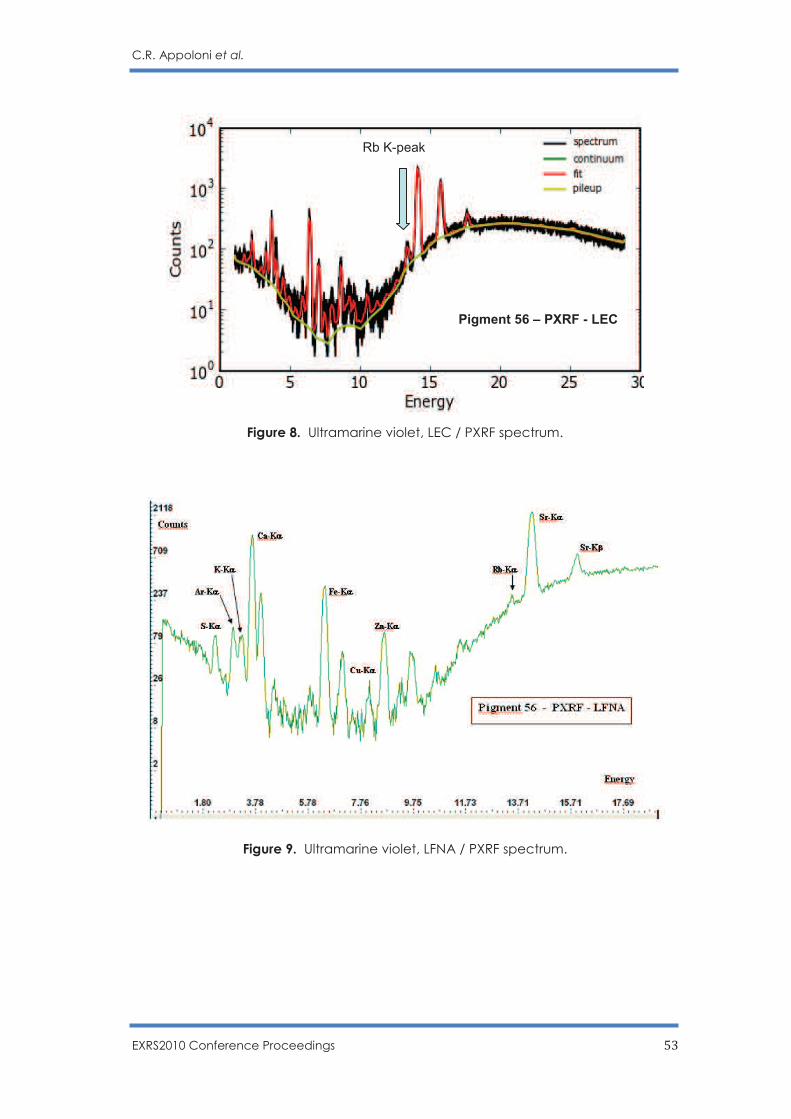
C.R. Appoloni et al.
EXRS2010 Conference Proceedings 53
Figure 8. Ultramarine violet, LEC / PXRF spectrum.
Figure 9. Ultramarine violet, LFNA / PXRF spectrum.
Pigment 56 – PXRF - LEC
Rb K-peak
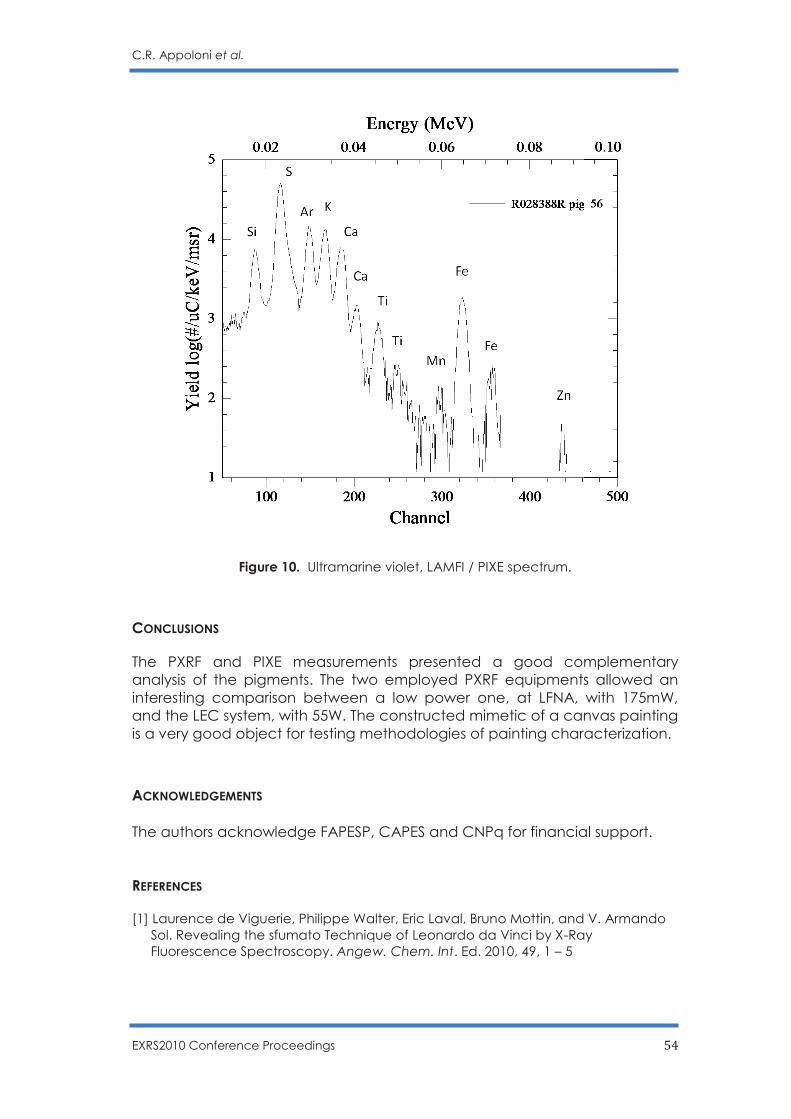
C.R. Appoloni et al.
EXRS2010 Conference Proceedings 54
Figure 10. Ultramarine violet, LAMFI / PIXE spectrum.
CONCLUSIONS
The PXRF and PIXE measurements presented a good complementary analysis of the pigments. The two employed PXRF equipments allowed an interesting comparison between a low power one, at LFNA, with 175mW, and the LEC system, with 55W. The constructed mimetic of a canvas painting is a very good object for testing methodologies of painting characterization.
ACKNOWLEDGEMENTS
The authors acknowledge FAPESP, CAPES and CNPq for financial support. REFERENCES
[1] Laurence de Viguerie, Philippe Walter, Eric Laval, Bruno Mottin, and V. Armando Sol. Revealing the sfumato Technique of Leonardo da Vinci by X-Ray Fluorescence Spectroscopy. Angew. Chem. Int. Ed. 2010, 49, 1 – 5
C.R. Appoloni et al.
EXRS2010 Conference Proceedings 55
[2] C. Neelmeijer, I. Brissaud, T. Calligaro, G. Demortier, A. Hautojärvi, M. Mäder, L. Martinot, M. Schreiner, T. Tuurnala and G. Weber. Paintings— a challenge for XRF and PIXE analysis. X-Ray Spectrometry, v. 29, 2000,101–110.
[3] Rizzutto, M. A., Tabacniks, M. H., Added, N., Barbosa, M. D. L., Curado, J. F., Santos, Jr., W. A., Lima, S. C., Melo, H. G., Neiva, A. C.. The external beam facility used to characterize corrosion products in metallic statuettes . Nuclear Instruments & Methods in Physics Research B240, 2005; p.549 - 553, 2005.
[4] C. R. Appoloni, M. S. Blonski, P. S. Parreira, L. A. C. Souza, Nuclear Instruments & Methods in Physics Research A580, 2007; 580, 710.
[5] Neiva, A. C., Dron, Jérémie Nicolae, Lima, Sílvia Cunha. Considering spurious peaks in the EDXRF analysis of metallic pre-Columbian pieces of the Museum of Ethnology and Archaeology of the University of Sao Paulo In: Heritage, Weathering and Conservation International Conference, 2006, Madrid. Heritage, Weathering and Conservation International Conference. Leiden: Taylor & Francis, 2006. v.2. p.605 – 611.
EXRS2010 Conference Proceedings 56
Non Destructive Sourcing Ecuadorian Obsidians by PXRF
T. D. Galvão, F. Lopes and C. R. Appoloni
Departamento de Física, CCE, Universidade Estadual de Londrina - UEL, 86051-990.
Caixa Postal 6001, Londrina PR, Brazil
E-mail: [email protected] [email protected]
KEYWORDS: portable X-ray fluorescence; chemical characterization; provenance studies
ABSTRACT The main objective of this work was to characterize and test provenance discrimination of twenty three obsidian samples: twenty samples from Ecuador, two from Italy and one from Mexico. Two portable EDXRF equipments were employed. The PXRF-LFNA-02 system, used for elements with atomic number greater than 26, which is composed of a 4W X-ray tube (with Ag filter and target) and a Si-PIN detector model XR-100CR Ampetc Inc., which has a resolution of 221 eV for the 5.9 keV line (25 μm-thickness Be window and Ag collimator). The PXRF-LFNA-03 system, used for elements with atomic number lower than 26, which is composed of a 4W X-ray tube (with W target) and a Si-PIN detector model XR-100CR Ampetc Inc., which has a resolution of 149 eV for the 5.9 keV line (12.7 μm-thickness Be window and Ag collimator). Elements K, Ca, Ti, Mn, Fe, Rb, Sr, Y, Zr and Nb were detected in all samples. Element contents were determined through calibration curves obtained from standard obsidian samples. The results were compared with those obtained by the more robust techniques, for instance, INAA. They are in reasonable agreement, especially for Fe and Rb, taking into account the non-destructive, low power and portable characteristics of the PXRF systems used. The two-dimensional graphs of ratios Rb/Fe vs. Rb/Sr and Mn/Ca vs. Rb/Sr showed that four samples of obsidian from Cotopaxi are grouped to form a distinct group as well as two samples of obsidian from Quiscatola, while samples Mullumica, Rio Guambi and Oyacachi form a large group.
INTRODUCTION
The study of archaeological and cultural heritage artifacts by means of analytical techniques with portable equipment has become increasingly routinely today, for instance obsidian. The chemical characterization of archaeological obsidian samples provides valuable information for the archaeologist that enables the development of hypotheses regarding the circulation and exchange of prehistoric raw material from different sources [1]. Obsidian is volcanic natural glass formed by rapid cooling of lava consists basically of silicon dioxide, also known as silica (SiO2), not having crystal formation. Because they are easy to manipulate were widely used as decorations, tips of arrows, objects used in rituals, earrings, decorative objects and various types of tools by pre-Hispanic cultures [2, 3], especially as blades used for bloodletting and human sacrifice by indigenous societies pre-Columbian [4]. These artifacts can be produced with obsidian found in archaeological sites far from the volcanic areas which results in transport and
T.D. Galvão et al.
EXRS2010 Conference Proceedings 57
possible trade between different cultures [5]. Currently, several methods are used to determine the chemical composition of obsidian [6], and almost all of them are based on analytical techniques that require a physical or chemical processing of samples (preparation of samples), and are very expensive, besides the fact that these procedures destroy the samples and do not preserve the integrity of the archaeological artifact.
The main objective of this work was to characterize and test provenance discrimination of twenty three obsidian samples: twenty samples from Ecuador, two from Italy and one from Mexico. Two portable EDXRF equipments were employed.
MATERIALS AND METHODS
The measurements were performed with two portable Energy Dispersion X-ray Fluorescence (portable-EDXRF) systems. The PXRF-LFNA-02 system, used for elements with atomic number greater than 26, is composed of a 4W X-ray tube (with Ag filter and target) and a Si-PIN detector model XR-100CR Ampetc Inc., which has a resolution of 221 eV for the 5.9 keV line (25 μm-thickness Be window and Ag collimator). The PXRF-LFNA-03 system, used for elements with atomic number lower than 26, is composed of a 4W X-ray tube (with W target) and a Si-PIN detector model XR-100CR Amptek Inc., which has a resolution of 149 eV for the 5.9 keV line (12.7 μm-thickness Be window and Ag collimator). The analytical sensitivity of the two mobile devices was optimized for obsidian matrix using a factorial design 24 on current and voltage applied to the X-ray tube and distances tube-sample and detector-sample.
The collections of samples from Ecuador were performed in four different primary sources and a secondary source, and the five sources in the vicinity of Quito in the graben interandean between the Cordillera Occidental and the Cordillera Real. These samples were kindly provided by Professors, Dr. Rosa B. Scorzelli (CBPF-Brazil) and Dr. Gerard Poupeau (CNRS-France), which enabled this work.
Samples were measured without any previous preparation, with a 1000 s excitation-detection time. Intensities of characteristics Ka and La X-rays were employed for the elements detection. For the spectra analysis it was employed the WinQ-XAS software. For elemental analysis, peak intensity ratios were used instead of absolute concentration. Only net areas greater than three sigmas above mean background level were accepted.
Elements K, Ca, Ti, Mn, Fe, Rb, Sr, Y, Zr and Nb were detected in all samples. Element contents were determined through calibration curves obtained from standard obsidian samples. The data from the WinQxas software were translated directly into Excel for Windows for manipulation and then on into SPSS for Windows for statistical analyses [7].
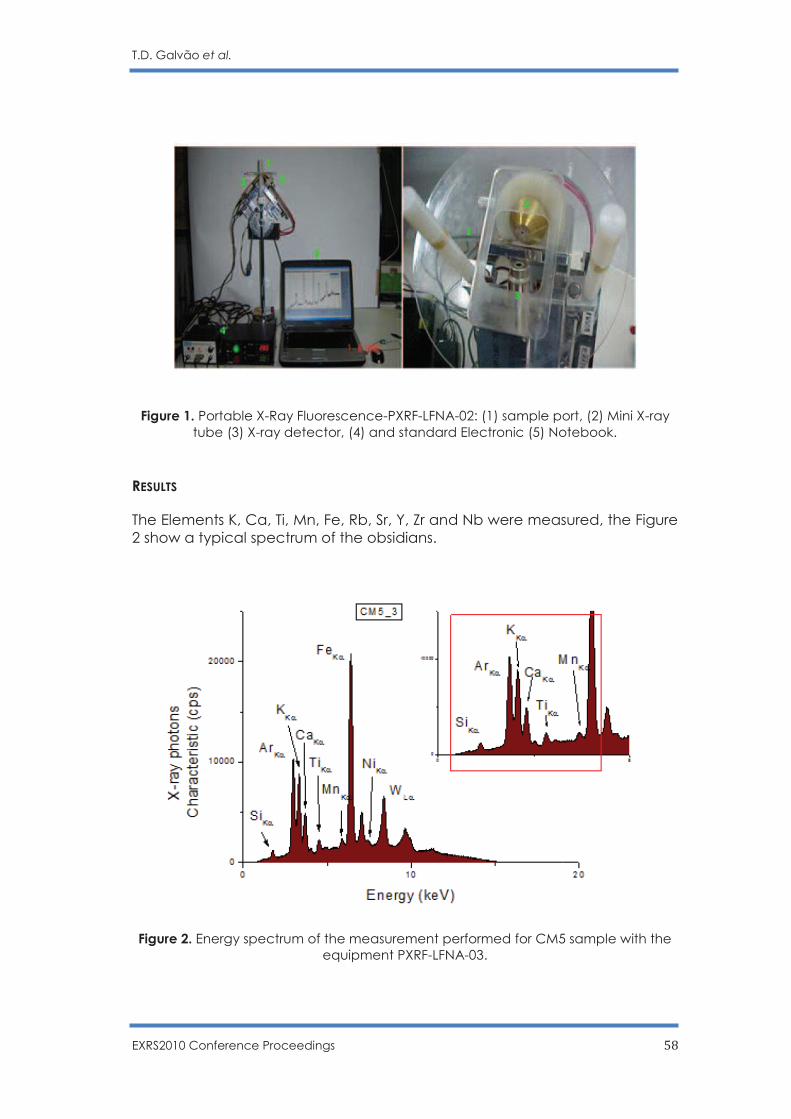
T.D. Galvão et al.
EXRS2010 Conference Proceedings 58
Figure 1. Portable X-Ray Fluorescence-PXRF-LFNA-02: (1) sample port, (2) Mini X-ray tube (3) X-ray detector, (4) and standard Electronic (5) Notebook.
RESULTS
The Elements K, Ca, Ti, Mn, Fe, Rb, Sr, Y, Zr and Nb were measured, the Figure 2 show a typical spectrum of the obsidians.
Figure 2. Energy spectrum of the measurement performed for CM5 sample with the equipment PXRF-LFNA-03.
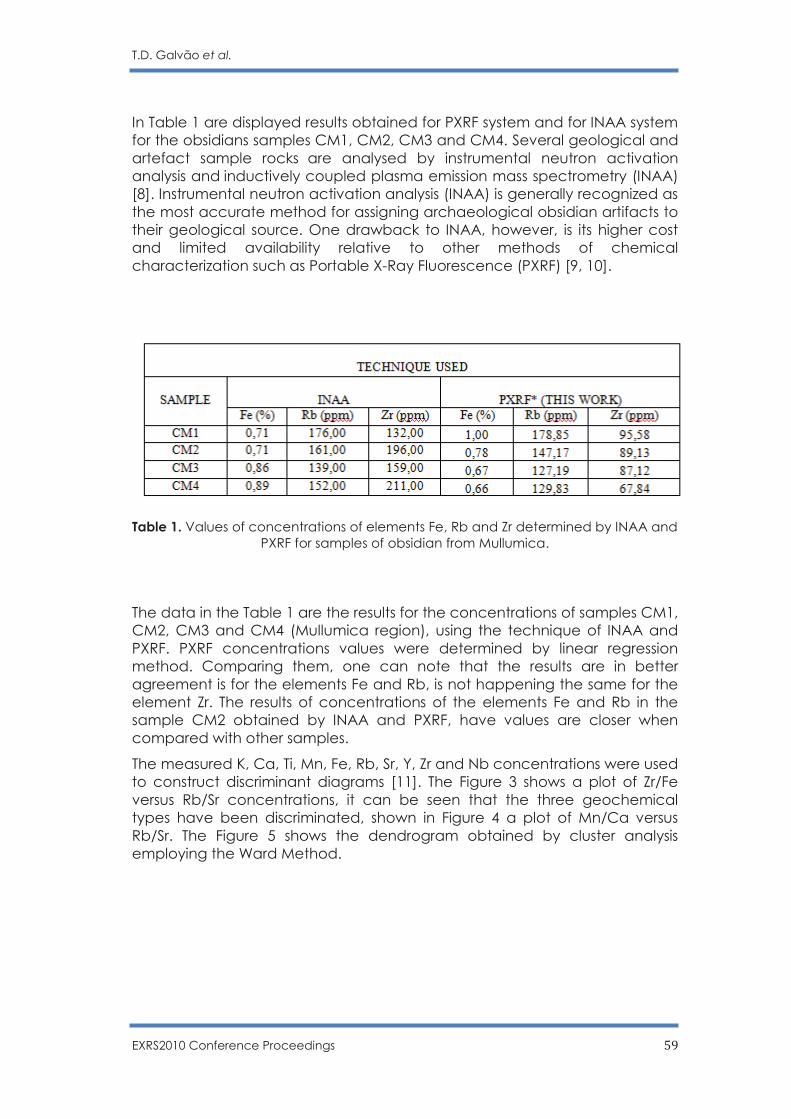
T.D. Galvão et al.
EXRS2010 Conference Proceedings 59
In Table 1 are displayed results obtained for PXRF system and for INAA system for the obsidians samples CM1, CM2, CM3 and CM4. Several geological and artefact sample rocks are analysed by instrumental neutron activation analysis and inductively coupled plasma emission mass spectrometry (INAA) [8]. Instrumental neutron activation analysis (INAA) is generally recognized as the most accurate method for assigning archaeological obsidian artifacts to their geological source. One drawback to INAA, however, is its higher cost and limited availability relative to other methods of chemical characterization such as Portable X-Ray Fluorescence (PXRF) [9, 10].
Table 1. Values of concentrations of elements Fe, Rb and Zr determined by INAA and PXRF for samples of obsidian from Mullumica.
The data in the Table 1 are the results for the concentrations of samples CM1, CM2, CM3 and CM4 (Mullumica region), using the technique of INAA and PXRF. PXRF concentrations values were determined by linear regression method. Comparing them, one can note that the results are in better agreement is for the elements Fe and Rb, is not happening the same for the element Zr. The results of concentrations of the elements Fe and Rb in the sample CM2 obtained by INAA and PXRF, have values are closer when compared with other samples.
The measured K, Ca, Ti, Mn, Fe, Rb, Sr, Y, Zr and Nb concentrations were used to construct discriminant diagrams [11]. The Figure 3 shows a plot of Zr/Fe versus Rb/Sr concentrations, it can be seen that the three geochemical types have been discriminated, shown in Figure 4 a plot of Mn/Ca versus Rb/Sr. The Figure 5 shows the dendrogram obtained by cluster analysis employing the Ward Method.
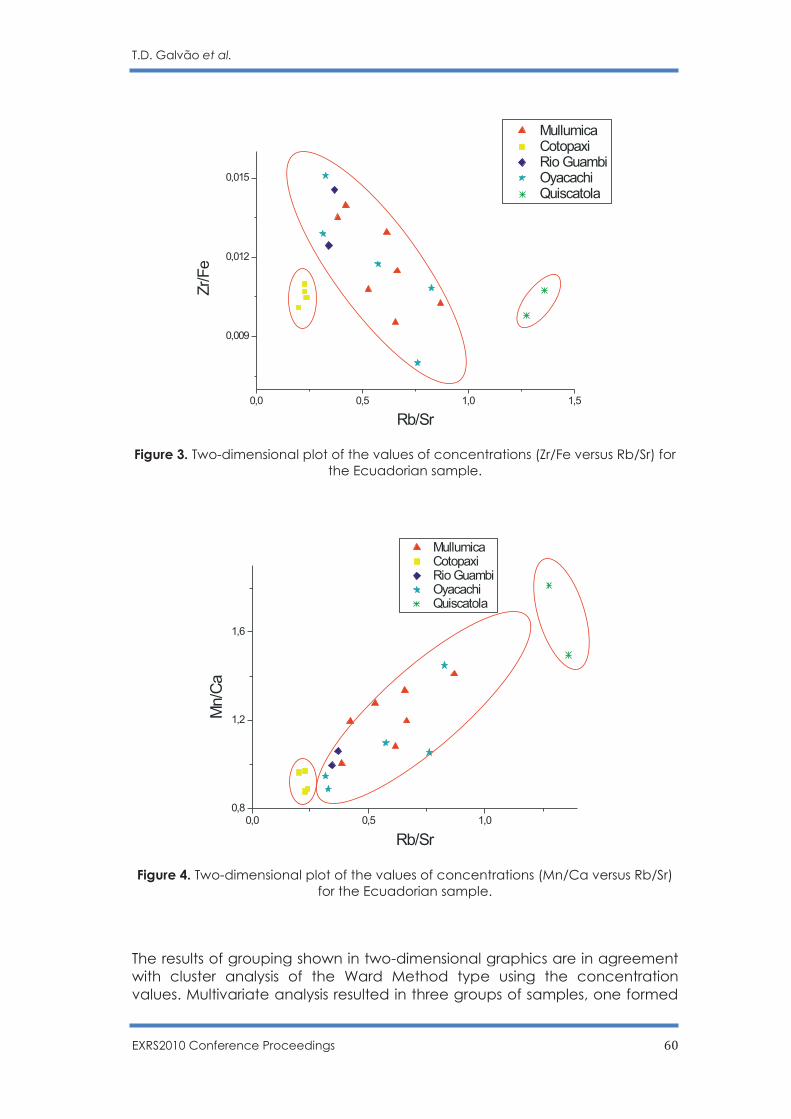
T.D. Galvão et al.
EXRS2010 Conference Proceedings 60
Figure 3. Two-dimensional plot of the values of concentrations (Zr/Fe versus Rb/Sr) for
the Ecuadorian sample.
Figure 4. Two-dimensional plot of the values of concentrations (Mn/Ca versus Rb/Sr)
for the Ecuadorian sample.
The results of grouping shown in two-dimensional graphics are in agreement with cluster analysis of the Ward Method type using the concentration values. Multivariate analysis resulted in three groups of samples, one formed
0,0 0,5 1,0 1,5
0,009
0,012
0,015
MullumicaCotopaxiRio GuambiOyacachiQuiscatola
Zr/Fe
Rb/Sr
0,0 0,5 1,00,8
1,2
1,6
MullumicaCotopaxiRio GuambiOyacachiQuiscatola
Mn/C
a
Rb/Sr
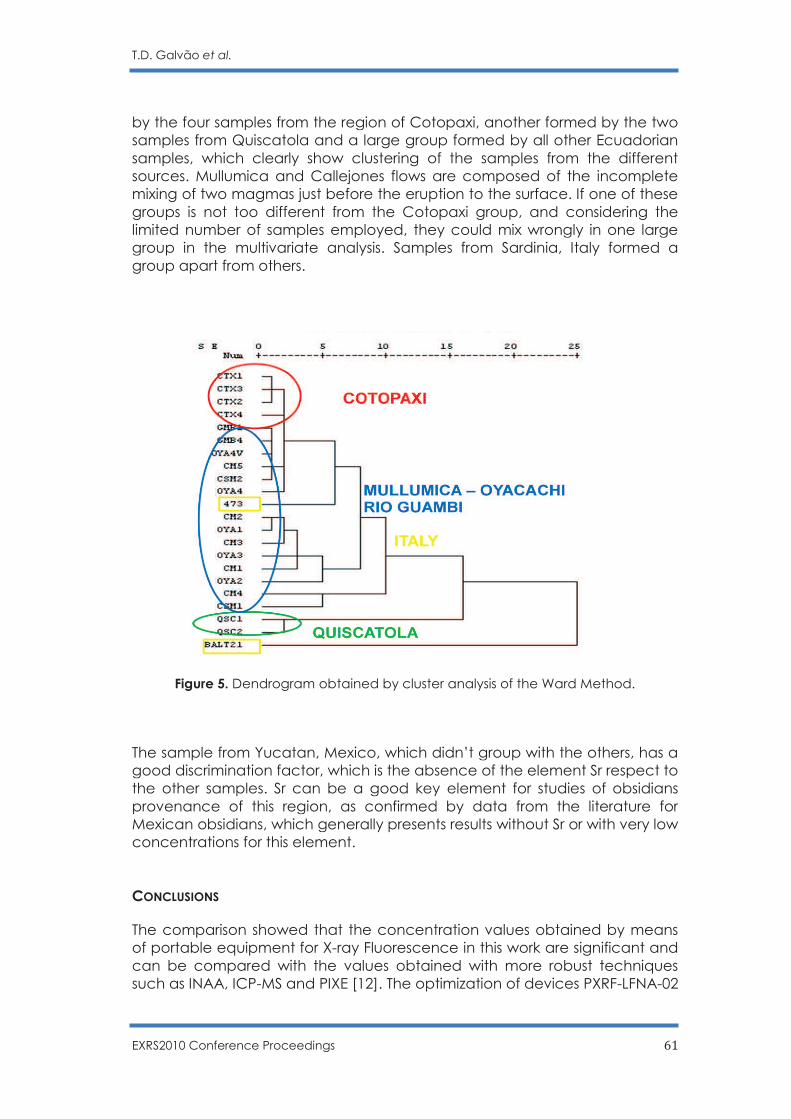
T.D. Galvão et al.
EXRS2010 Conference Proceedings 61
by the four samples from the region of Cotopaxi, another formed by the two samples from Quiscatola and a large group formed by all other Ecuadorian samples, which clearly show clustering of the samples from the different sources. Mullumica and Callejones flows are composed of the incomplete mixing of two magmas just before the eruption to the surface. If one of these groups is not too different from the Cotopaxi group, and considering the limited number of samples employed, they could mix wrongly in one large group in the multivariate analysis. Samples from Sardinia, Italy formed a group apart from others.
Figure 5. Dendrogram obtained by cluster analysis of the Ward Method.
The sample from Yucatan, Mexico, which didn’t group with the others, has a good discrimination factor, which is the absence of the element Sr respect to the other samples. Sr can be a good key element for studies of obsidians provenance of this region, as confirmed by data from the literature for Mexican obsidians, which generally presents results without Sr or with very low concentrations for this element. CONCLUSIONS
The comparison showed that the concentration values obtained by means of portable equipment for X-ray Fluorescence in this work are significant and can be compared with the values obtained with more robust techniques such as INAA, ICP-MS and PIXE [12]. The optimization of devices PXRF-LFNA-02
T.D. Galvão et al.
EXRS2010 Conference Proceedings 62
and PXRF-LFNA-03 was essential for the quality of concentration results obtained. It was possible to compare data obtained with the system PXRF-LFNA-02 optimized and not optimized and observe a significant difference between values. The results of grouping shown in two-dimensional graphics are in agreement with cluster analysis of the Ward Method type using the concentration values. Multivariate analysis resulted in three groups of samples, one formed by the four samples from the region of Cotopaxi, another formed by the two samples from Quiscatola and a large group formed by all other Ecuadorian samples. Mullumica and Callejones flows are composed of the incomplete mixing of two magmas just before the eruption to the surface. Samples from Sardinia, Italy formed a group apart from others. The sample from Yucatan, Mexico, which didn’t group with the others, has a good discrimination factor, which is the absence of the element Sr respect to the other samples. Sr can be a good key element for studies of obsidians provenance of this region, as confirmed by data from the literature for Mexican obsidians, which generally presents results without Sr or with very low concentrations for this element. This can be an important data for the formulation of hypotheses of possible trade routes between ancient Mexican civilizations [13, 14]. REFERENCES
[1] J. G. OTERO, C. R. STERN, Circulación, intercambio y uso de obsidianas en la costa de la provincia del Chubut (Patagonia Argentina), durante el Holoceno tardío, Intersecciones en Antropología 6, 2005; pp. 93-108. ISSN 1666-2105. Facultad de Ciencias Sociales - UNCPBA – Argentina.
[2] L. B. GURLET, O. DORIGHEL, G. POUPEAU, Obsidian provenance studies in Colombia and Ecuador: obsidian sources revisited, Journal of Archaeological Science XX. 2007; pp. 1 e 18.
[3] R. L. BURGER, M. D. GLASCOCK, Locating the Quispisisa Obsidian Source in the Department of Ayacucho, Peru, Latin American Antiquity.2000, 11, No. 3, pp. 258-268.
[4] J. S. NICHOLAS, A Dark Light: Reflections on Obsidian in Mesoamerica World Archaeology. 2001, 33, No. 2, Archaeology and Aesthetics, pp. 220-236.
[5] C. STERN, Black obsidian from central-south Patagonia; chemical characteristics, sources and regional distribution of artifacts. Soplando en el Viento... Actas de las III Jornadas de Arqueología de la Patagonia. 1999; pp. 221-234. Neuquén, Buenos Aires.
[6] C. STERN, J. G. OTERO, J. B. BELARDI, Características químicas, fuentes potenciales y distribución de diferentes tipos de obsidiana en el norte de la Provincia del Chubut, Patagonia, Argentina. Anales del Instituto de la Patagonia,
2000; 28: pp. 275-290.
[7] A. NEGASH, M. S. SHACKLEY, Geochemical provenance of obsidian artefacts from the msa site of porc epic, Ethiopia, Archaeometry. 2006; 48, pp. 1-12.
[8] C. BELLELLI, F. X. PEREYRA, M. CARBALLIDO, Obsidian localization and circulation in northwestern Patagonia (Argentina): sources and archaeological record, Geomaterials in Cultural Heritage. Geological Society, London. Special Publications. 2006; 257, pp. 241-255.
T.D. Galvão et al.
EXRS2010 Conference Proceedings 63
[9] R. L. BURGER, F. ASARO, H. V. MICHEL, F. H. STROSS, E. SALAZAR, An Initial Consideration of Obsidian Procurement and Exchange in Prehispanic Ecuador, Latin American Antiquity.1994; 5, No. 3, pp. 228-255.
[10] M. E. SMITH, A. L. BURKE, T. S. HARE, M. D. GLASCOCK, Sources of Imported Obsidian at Postclassic Sites in the Yautepec Valley, Morelos: A Characterization Study Using XRF and INAA, Latin American Antiquity.2007; 18, No. 4, pp. 429-450.
[11] A. SEELENFREUND, J. MIRANDA, M. I. DINATOR, J. R. MORALES, The provenance of archaeological obsidian artifacts from Northern Chile determined by source-induced X-ray fluorescence, Journal of Radioanalytical and Nuclear Chemistry. 2002; 251, pp. 15-19.
[12] L. B. GURLET, G. POUPEAU, J. SALOMON, T. CALLIGARO, B. MOIGNARD, J. C. DRAN, J. A. BARRAT, L. PICHON, Obsidian provenance studies in archaeology: A comparison between PIXE, ICP-AES and ICP-MS, Nuclear Instruments and Methods in Physics Research B. 240; 2005; pp. 583–588.
[13] M. H. NAGY, Mexican Obsidian at Tikal, Guatemala Latin American Antiquity. 1999, 10, No. 3, pp. 300-313.
[14] O. D. B. BROWN, M. L. DREISS, R. E. HUGHES, Preclassic Obsidian Procurement and Utilization at the Maya Site of Colha, Latin American Antiquity. 2004; 15, No. 2, pp. 222-240.
EXRS2010 Conference Proceedings 64
Determination of the elemental composition of a 19th century book by EDXRF: understanding paper
discoloration
S. Pessanha, F. Figueira, M. Manso, A. Guilherme, P. Amorim and M.L. Carvalho
Centro de Física Atómica da Universidade de Lisboa, Av. Professor Gama Pinto, 2 1649-003, Lisboa,
Portugal
E-mail: [email protected]
ABSTRACT Paper ageing may be defined as the irreversible change occurring on materials over time. Discoloration is due to reactions inducing physical and chemical changes mainly in the cellulose matrix. These changes can also be studied through the elemental content of the paper stains and compare them with the un-aged paper. This way, more information into the behavior of certain materials and the mechanism of a specific deterioration process can be attained. In this study a 19th century book that presented both stained and un-stained batches of paper was studied by Energy dispersive X Ray Fluorescence. This book presents an excellent case study because, any environmental factors that could have contributed to the local discolorations designated as foxing were common to the three types of paper, and only the different paper manufacturing conditions and constituents could explain why one type of paper was more resistant to foxing than the other.
INTRODUCTION Foxing stains, the reddish-brown, brown or yellowish stains of circular or irregular shape that often occur in books belonging to the 16th to 20th centuries1, have been fully described in conservation literature but still, no scientific agreement has been found regarding the causes of this phenomenon. Despite active investigations during the past sixty years there remains uncertainty as to what causes foxing and if there is more than one type of foxing. There are mainly four major explanations for the appearance of foxing,2 a) fungal activity, b) metal-induced degradation, c) multiple causes and d) discoloration of paper due to the interaction of moisture and cellulose. Lingterink3 suggests that foxing may be the result from the prolonged humidity absorption and desorption in papers differentiated by multiple caused local paper differences.
In this work a contribution to this foxing definition is presented not only based on the weathering conditions to which the paper is submitted, but also on the chemical information present in the paper. Here we will compare the elemental composition of paper sheets of the same book that presented different degrees of foxing discoloration (or none). The differences found will be helpful in understanding why some types of paper are more resistant to foxing.
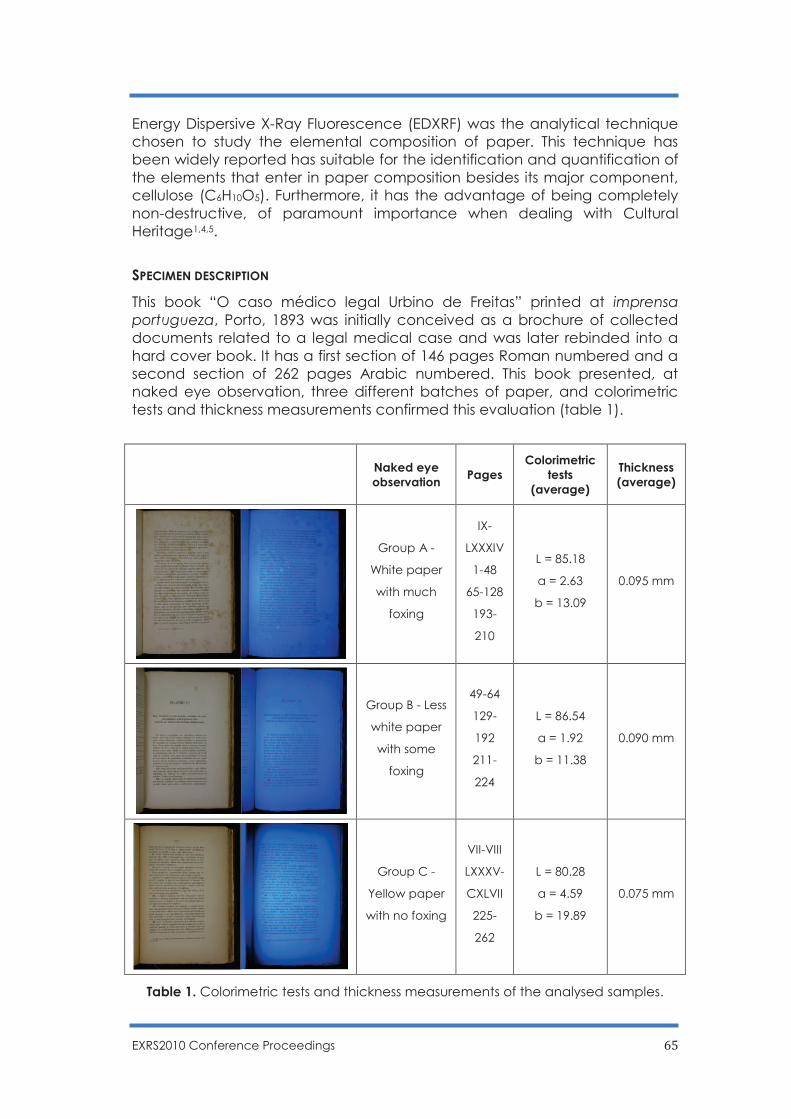
EXRS2010 Conference Proceedings 65
Energy Dispersive X-Ray Fluorescence (EDXRF) was the analytical technique chosen to study the elemental composition of paper. This technique has been widely reported has suitable for the identification and quantification of the elements that enter in paper composition besides its major component, cellulose (C6H10O5). Furthermore, it has the advantage of being completely non-destructive, of paramount importance when dealing with Cultural Heritage1,4,5.
SPECIMEN DESCRIPTION
This book “O caso médico legal Urbino de Freitas” printed at imprensa portugueza, Porto, 1893 was initially conceived as a brochure of collected documents related to a legal medical case and was later rebinded into a hard cover book. It has a first section of 146 pages Roman numbered and a second section of 262 pages Arabic numbered. This book presented, at naked eye observation, three different batches of paper, and colorimetric tests and thickness measurements confirmed this evaluation (table 1).
Naked eye observation
Pages Colorimetric
tests (average)
Thickness (average)
Group A -
White paper
with much
foxing
IX-
LXXXIV
1-48
65-128
193-
210
L = 85.18
a = 2.63
b = 13.09
0.095 mm
Group B - Less
white paper
with some
foxing
49-64
129-
192
211-
224
L = 86.54
a = 1.92
b = 11.38
0.090 mm
Group C -
Yellow paper
with no foxing
VII-VIII
LXXXV-
CXLVII
225-
262
L = 80.28
a = 4.59
b = 19.89
0.075 mm
Table 1. Colorimetric tests and thickness measurements of the analysed samples.
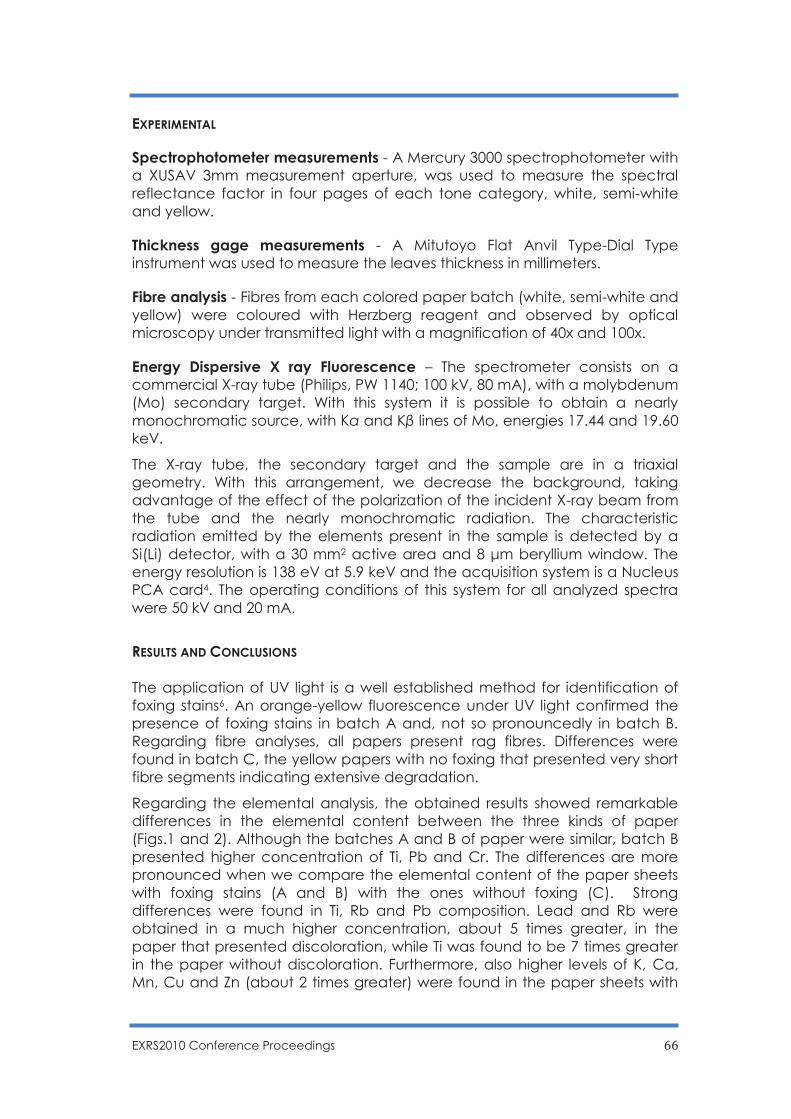
EXRS2010 Conference Proceedings 66
EXPERIMENTAL
Spectrophotometer measurements - A Mercury 3000 spectrophotometer with a XUSAV 3mm measurement aperture, was used to measure the spectral reflectance factor in four pages of each tone category, white, semi-white and yellow.
Thickness gage measurements - A Mitutoyo Flat Anvil Type-Dial Type instrument was used to measure the leaves thickness in millimeters.
Fibre analysis - Fibres from each colored paper batch (white, semi-white and yellow) were coloured with Herzberg reagent and observed by optical microscopy under transmitted light with a magnification of 40x and 100x.
Energy Dispersive X ray Fluorescence – The spectrometer consists on a commercial X-ray tube (Philips, PW 1140; 100 kV, 80 mA), with a molybdenum (Mo) secondary target. With this system it is possible to obtain a nearly monochromatic source, with Kα and Kβ lines of Mo, energies 17.44 and 19.60 keV.
The X-ray tube, the secondary target and the sample are in a triaxial geometry. With this arrangement, we decrease the background, taking advantage of the effect of the polarization of the incident X-ray beam from the tube and the nearly monochromatic radiation. The characteristic radiation emitted by the elements present in the sample is detected by a Si(Li) detector, with a 30 mm2 active area and 8 μm beryllium window. The energy resolution is 138 eV at 5.9 keV and the acquisition system is a Nucleus PCA card4. The operating conditions of this system for all analyzed spectra were 50 kV and 20 mA.
RESULTS AND CONCLUSIONS The application of UV light is a well established method for identification of foxing stains6. An orange-yellow fluorescence under UV light confirmed the presence of foxing stains in batch A and, not so pronouncedly in batch B. Regarding fibre analyses, all papers present rag fibres. Differences were found in batch C, the yellow papers with no foxing that presented very short fibre segments indicating extensive degradation.
Regarding the elemental analysis, the obtained results showed remarkable differences in the elemental content between the three kinds of paper (Figs.1 and 2). Although the batches A and B of paper were similar, batch B presented higher concentration of Ti, Pb and Cr. The differences are more pronounced when we compare the elemental content of the paper sheets with foxing stains (A and B) with the ones without foxing (C). Strong differences were found in Ti, Rb and Pb composition. Lead and Rb were obtained in a much higher concentration, about 5 times greater, in the paper that presented discoloration, while Ti was found to be 7 times greater in the paper without discoloration. Furthermore, also higher levels of K, Ca, Mn, Cu and Zn (about 2 times greater) were found in the paper sheets with
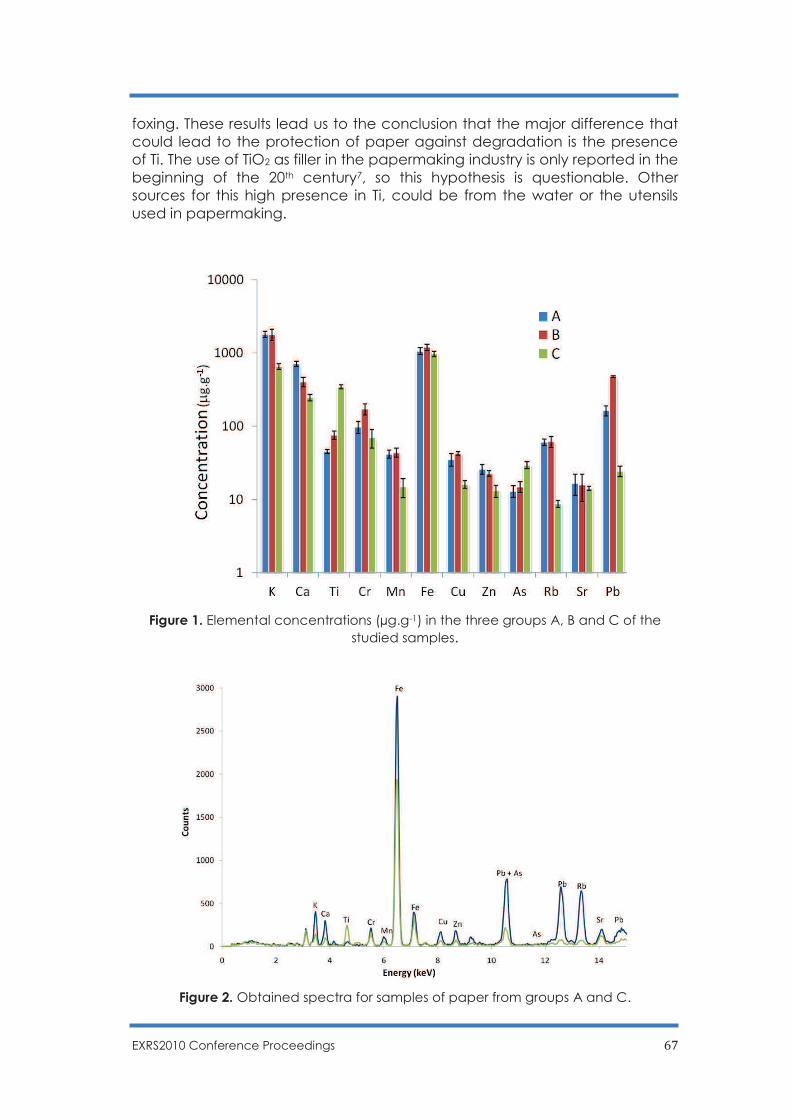
EXRS2010 Conference Proceedings 67
foxing. These results lead us to the conclusion that the major difference that could lead to the protection of paper against degradation is the presence of Ti. The use of TiO2 as filler in the papermaking industry is only reported in the beginning of the 20th century7, so this hypothesis is questionable. Other sources for this high presence in Ti, could be from the water or the utensils used in papermaking.
Figure 1. Elemental concentrations (µg.g-1) in the three groups A, B and C of the studied samples.
Figure 2. Obtained spectra for samples of paper from groups A and C.

EXRS2010 Conference Proceedings 68
REFERENCES
[1] Bichieri M, Pappalardo G, Romano FP, Sementilli FM, Acutis R (2001) Characterisation of foxing stains by chemical a spectrometric methods. Restaurator 22:1–19.
[2] Derow J, Owen A (1992) In: Paper conservation catalog, American Institute for Conservation Book and Paper Group, Foxing, Washington, D.C.: AIC. Chap.13:1–39.
[3] Ligterink FJ, Porck HJ, Smith WJ Th (1991) Foxing stains and discolouration of leaf margins and paper surrounding printing ink: elements of a complex phenomenon in books. The Paper Conservator, IPC, 15:45–52.
[4] Pessanha S, Manso M, Guilherme A, Costa M, Carvalho ML (2009) Investigation on historical documents for forensic purposes by X ray fluorescence analysis. Surface and Interface Analysis 42: 419-422.
[5] Manso M, Pessanha Carvalho ML (2006) Artificial aging processes in modern papers: X-ray spectrometry studies. Spectr Acta B 61:922–928.
[6] Choi S (2007) Foxing on paper: a literature review. J Am Inst Conserv 46:37–152.
[7] Krogerous, B. Fillers and pigments. (ed) Neimo L. Papermaking chemistry. Helsinky: Tappi press, 1999, pp 116-149.
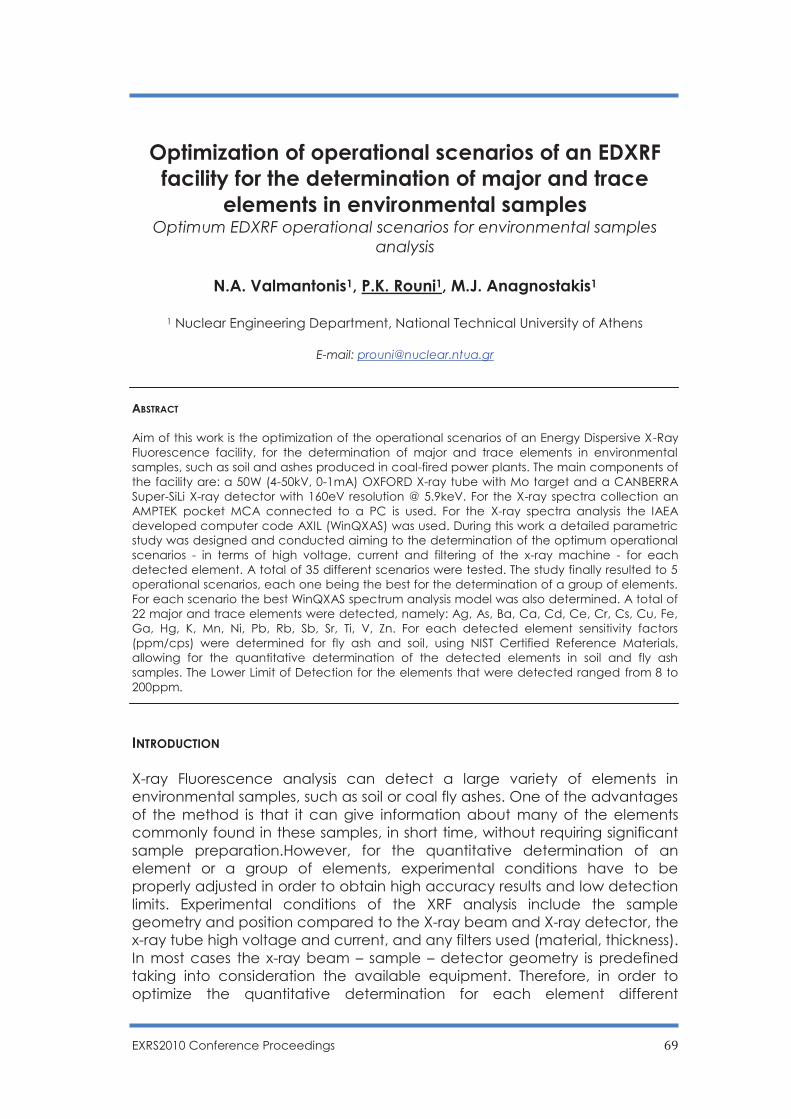
EXRS2010 Conference Proceedings 69
Optimization of operational scenarios of an EDXRF facility for the determination of major and trace
elements in environmental samples Optimum EDXRF operational scenarios for environmental samples
analysis
N.A. Valmantonis1, P.K. Rouni1, M.J. Anagnostakis1
1 Nuclear Engineering Department, National Technical University of Athens
E-mail: [email protected]
ABSTRACT Aim of this work is the optimization of the operational scenarios of an Energy Dispersive X-Ray Fluorescence facility, for the determination of major and trace elements in environmental samples, such as soil and ashes produced in coal-fired power plants. The main components of the facility are: a 50W (4-50kV, 0-1mA) OXFORD X-ray tube with Mo target and a CANBERRA Super-SiLi X-ray detector with 160eV resolution @ 5.9keV. For the X-ray spectra collection an AMPTEK pocket MCA connected to a PC is used. For the X-ray spectra analysis the IAEA developed computer code AXIL (WinQXAS) was used. During this work a detailed parametric study was designed and conducted aiming to the determination of the optimum operational scenarios - in terms of high voltage, current and filtering of the x-ray machine - for each detected element. A total of 35 different scenarios were tested. The study finally resulted to 5 operational scenarios, each one being the best for the determination of a group of elements. For each scenario the best WinQXAS spectrum analysis model was also determined. A total of 22 major and trace elements were detected, namely: Ag, As, Ba, Ca, Cd, Ce, Cr, Cs, Cu, Fe, Ga, Hg, K, Mn, Ni, Pb, Rb, Sb, Sr, Ti, V, Zn. For each detected element sensitivity factors (ppm/cps) were determined for fly ash and soil, using NIST Certified Reference Materials, allowing for the quantitative determination of the detected elements in soil and fly ash samples. The Lower Limit of Detection for the elements that were detected ranged from 8 to 200ppm.
INTRODUCTION X-ray Fluorescence analysis can detect a large variety of elements in environmental samples, such as soil or coal fly ashes. One of the advantages of the method is that it can give information about many of the elements commonly found in these samples, in short time, without requiring significant sample preparation.However, for the quantitative determination of an element or a group of elements, experimental conditions have to be properly adjusted in order to obtain high accuracy results and low detection limits. Experimental conditions of the XRF analysis include the sample geometry and position compared to the X-ray beam and X-ray detector, the x-ray tube high voltage and current, and any filters used (material, thickness). In most cases the x-ray beam – sample – detector geometry is predefined taking into consideration the available equipment. Therefore, in order to optimize the quantitative determination for each element different
N.A. Valmantonis et al.
EXRS2010 Conference Proceedings 70
operational conditions can be selected for each element of interest. The detection of an element by its characteristic x-rays depends on the count rate of the corresponding photopeaks and the Lower Limit of Detection (LLD) in the area of the photopeak, which depends on the sample matrix and the experimental conditions during the measurement. The determination of the best experimental conditions (operational scenario) for each element requires the realization of a large number of experiments.
MATERIALS AND METHODS In order to select the optimum experimental conditions for the detection of each element a parametric study was designed and conducted in the x-ray fluorescence facility of the Nuclear Engineering Department of the National Technical University of Athens. This facility consists of
· a 50W (4-50kV, 0-1mA) OXFORD (model XTF5011) x-ray tube with Mo target,
· a CANBERRA Super-SiLi x-ray detector (160eV @ 5.9keV),
· an AMPTEK Multi-channel analyzer (model 8000A) and
· a 20t HERTZOG hydraulic press for sample preparation.
Figure 1.
The ‘x-ray beam-to-detector’ angle is 90o and the ‘x-ray beam-to-sample’
angle is 30o (Figure 1). The x-ray beam is collimated with a collimator made
X-ray tube
SiLi Detector
Sample in Aluminium cup
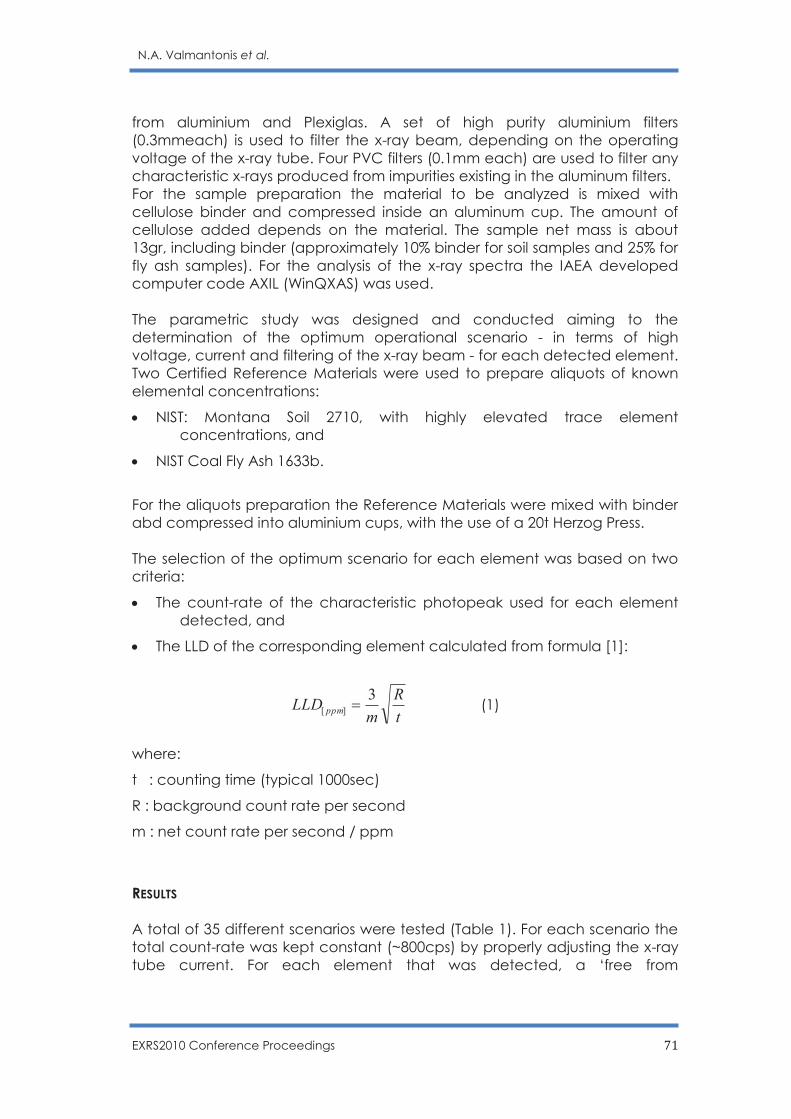
N.A. Valmantonis et al.
EXRS2010 Conference Proceedings 71
from aluminium and Plexiglas. A set of high purity aluminium filters (0.3mmeach) is used to filter the x-ray beam, depending on the operating voltage of the x-ray tube. Four PVC filters (0.1mm each) are used to filter any characteristic x-rays produced from impurities existing in the aluminum filters. For the sample preparation the material to be analyzed is mixed with cellulose binder and compressed inside an aluminum cup. The amount of cellulose added depends on the material. The sample net mass is about 13gr, including binder (approximately 10% binder for soil samples and 25% for fly ash samples). For the analysis of the x-ray spectra the IAEA developed computer code AXIL (WinQXAS) was used. The parametric study was designed and conducted aiming to the determination of the optimum operational scenario - in terms of high voltage, current and filtering of the x-ray beam - for each detected element. Two Certified Reference Materials were used to prepare aliquots of known elemental concentrations:
· NIST: Montana Soil 2710, with highly elevated trace element concentrations, and
· NIST Coal Fly Ash 1633b.
For the aliquots preparation the Reference Materials were mixed with binder abd compressed into aluminium cups, with the use of a 20t Herzog Press. The selection of the optimum scenario for each element was based on two criteria:
· The count-rate of the characteristic photopeak used for each element detected, and
· The LLD of the corresponding element calculated from formula [1]:
t
R
mLLD ppm
3][ = (1)
where:
t : counting time (typical 1000sec)
R : background count rate per second
m : net count rate per second / ppm
RESULTS A total of 35 different scenarios were tested (Table 1). For each scenario the total count-rate was kept constant (~800cps) by properly adjusting the x-ray tube current. For each element that was detected, a ‘free from
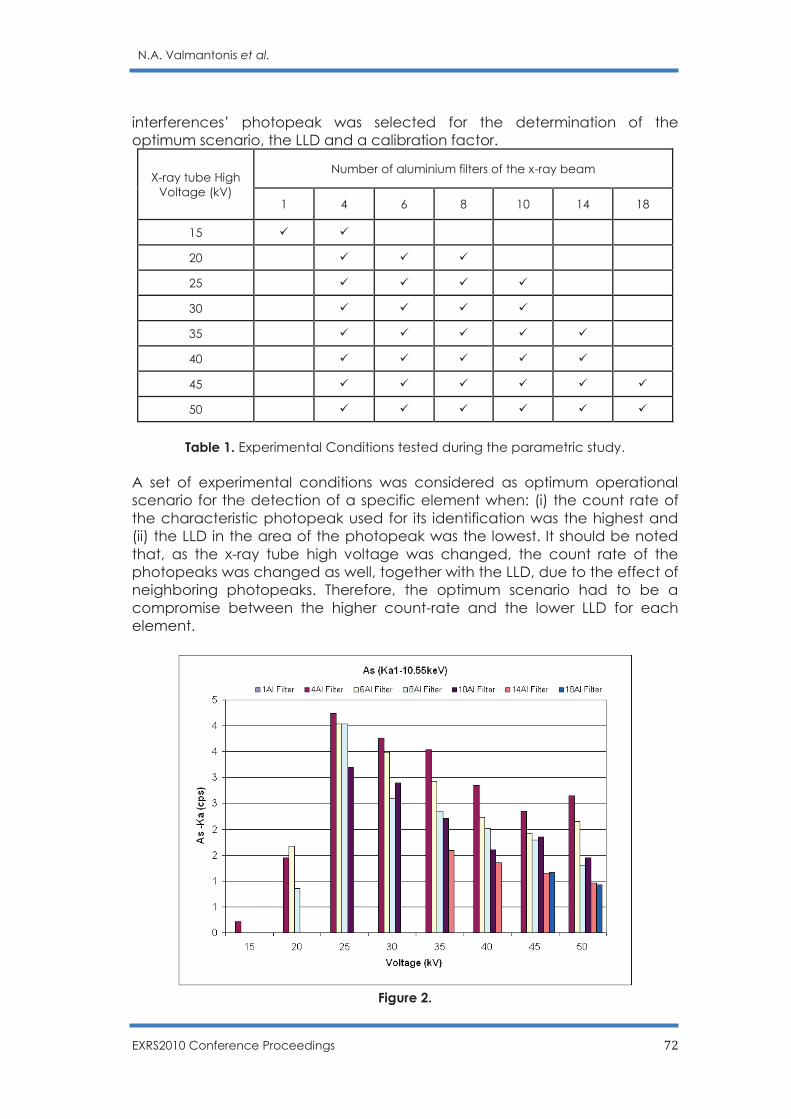
N.A. Valmantonis et al.
EXRS2010 Conference Proceedings 72
interferences’ photopeak was selected for the determination of the optimum scenario, the LLD and a calibration factor.
X-ray tube High Voltage (kV)
Number of aluminium filters of the x-ray beam
1 4 6 8 10 14 18
15 ü ü
20 ü ü ü
25 ü ü ü ü
30 ü ü ü ü
35 ü ü ü ü ü
40 ü ü ü ü ü
45 ü ü ü ü ü ü
50 ü ü ü ü ü ü
Table 1. Experimental Conditions tested during the parametric study. A set of experimental conditions was considered as optimum operational scenario for the detection of a specific element when: (i) the count rate of the characteristic photopeak used for its identification was the highest and (ii) the LLD in the area of the photopeak was the lowest. It should be noted that, as the x-ray tube high voltage was changed, the count rate of the photopeaks was changed as well, together with the LLD, due to the effect of neighboring photopeaks. Therefore, the optimum scenario had to be a compromise between the higher count-rate and the lower LLD for each element.
Figure 2.
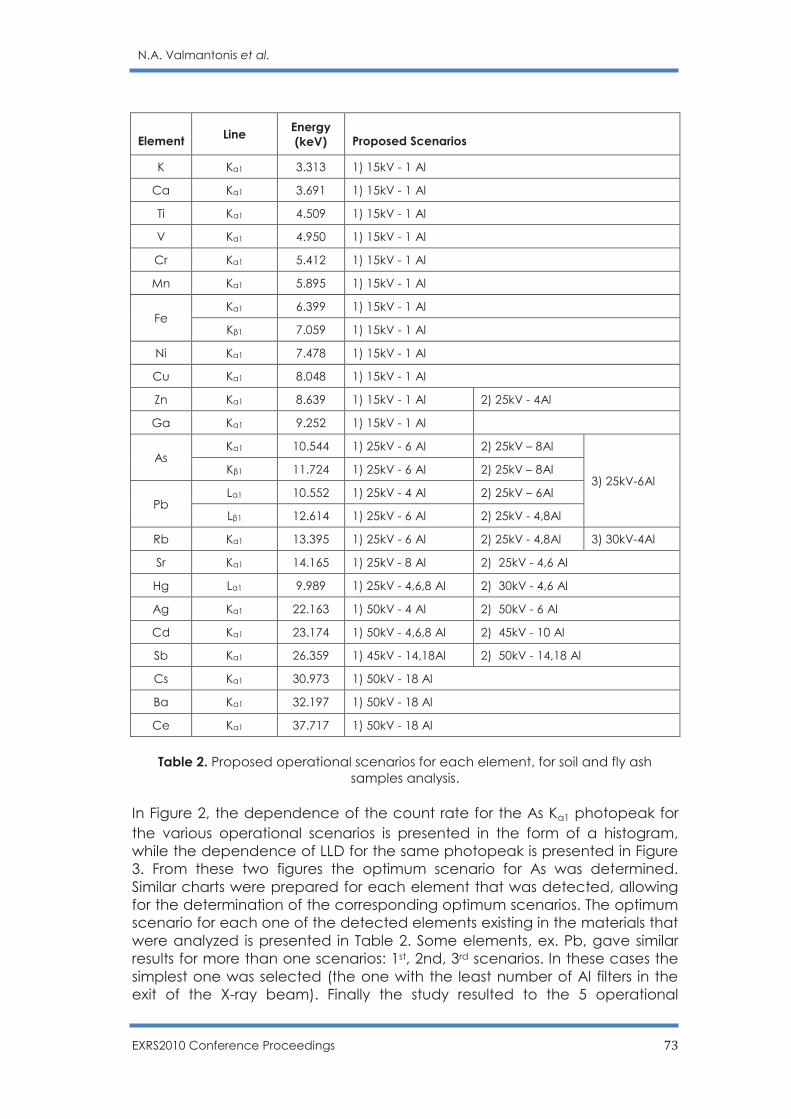
N.A. Valmantonis et al.
EXRS2010 Conference Proceedings 73
Element Line
Energy (keV) Proposed Scenarios
K Kα1 3.313 1) 15kV - 1 Al
Ca Kα1 3.691 1) 15kV - 1 Al
Ti Kα1 4.509 1) 15kV - 1 Al
V Kα1 4.950 1) 15kV - 1 Al
Cr Kα1 5.412 1) 15kV - 1 Al
Mn Kα1 5.895 1) 15kV - 1 Al
Fe Kα1 6.399 1) 15kV - 1 Al
Κβ1 7.059 1) 15kV - 1 Al
Ni Kα1 7.478 1) 15kV - 1 Al
Cu Kα1 8.048 1) 15kV - 1 Al
Zn Kα1 8.639 1) 15kV - 1 Al 2) 25kV - 4Al
Ga Kα1 9.252 1) 15kV - 1 Al
As Kα1 10.544 1) 25kV - 6 Al 2) 25kV – 8Al
3) 25kV-6Al Κβ1 11.724 1) 25kV - 6 Al 2) 25kV – 8Al
Pb Lα1 10.552 1) 25kV - 4 Al 2) 25kV – 6Al
Lβ1 12.614 1) 25kV - 6 Al 2) 25kV - 4,8Al
Rb Kα1 13.395 1) 25kV - 6 Al 2) 25kV - 4,8Al 3) 30kV-4Al
Sr Kα1 14.165 1) 25kV - 8 Al 2) 25kV - 4,6 Al
Hg Lα1 9.989 1) 25kV - 4,6,8 Al 2) 30kV - 4,6 Al
Ag Kα1 22.163 1) 50kV - 4 Al 2) 50kV - 6 Al
Cd Kα1 23.174 1) 50kV - 4,6,8 Al 2) 45kV - 10 Al
Sb Kα1 26.359 1) 45kV - 14,18Al 2) 50kV - 14,18 Al
Cs Kα1 30.973 1) 50kV - 18 Al
Ba Kα1 32.197 1) 50kV - 18 Al
Ce Kα1 37.717 1) 50kV - 18 Al
Table 2. Proposed operational scenarios for each element, for soil and fly ash samples analysis.
In Figure 2, the dependence of the count rate for the As Ka1 photopeak for the various operational scenarios is presented in the form of a histogram, while the dependence of LLD for the same photopeak is presented in Figure 3. From these two figures the optimum scenario for As was determined. Similar charts were prepared for each element that was detected, allowing for the determination of the corresponding optimum scenarios. The optimum scenario for each one of the detected elements existing in the materials that were analyzed is presented in Table 2. Some elements, ex. Pb, gave similar results for more than one scenarios: 1st, 2nd, 3rd scenarios. In these cases the simplest one was selected (the one with the least number of Al filters in the exit of the X-ray beam). Finally the study resulted to the 5 operational
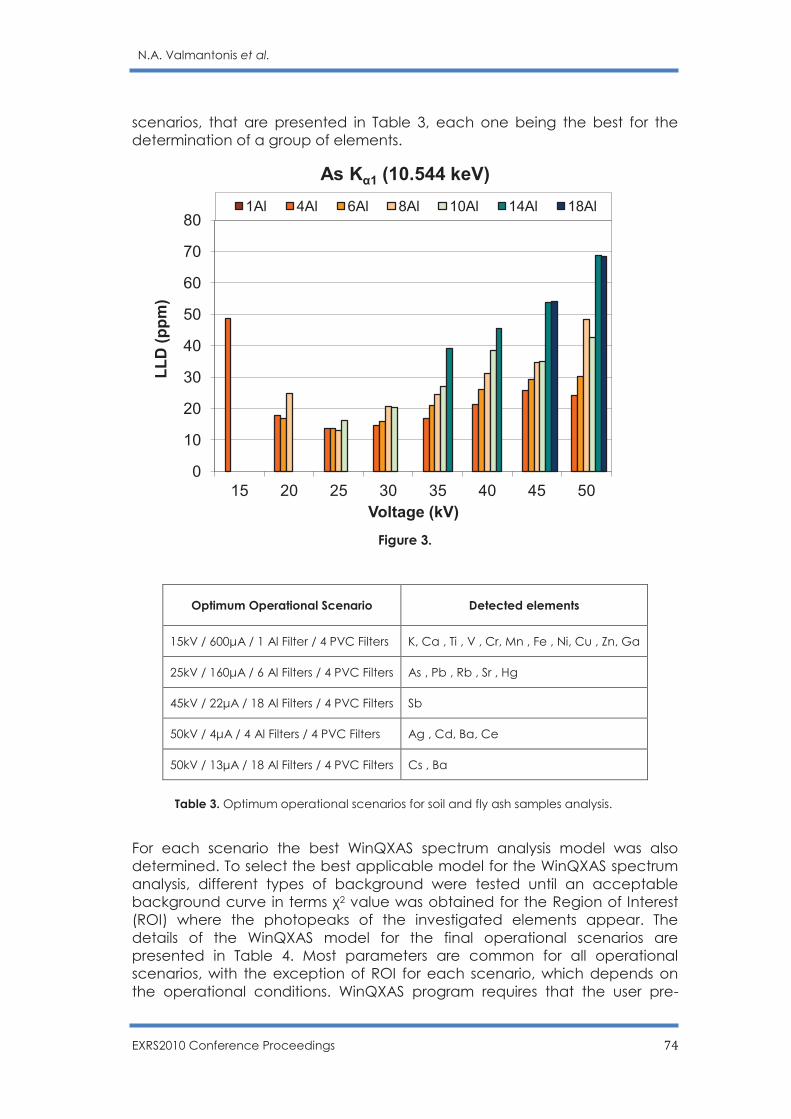
N.A. Valmantonis et al.
EXRS2010 Conference Proceedings 74
scenarios, that are presented in Table 3, each one being the best for the determination of a group of elements.
0
10
20
30
40
50
60
70
80
15 20 25 30 35 40 45 50
LL
D (
pp
m)
Voltage (kV)
As Kα1 (10.544 keV)
1Al 4Al 6Al 8Al 10Al 14Al 18Al
Figure 3.
Optimum Operational Scenario Detected elements
15kV / 600μΑ / 1 Al Filter / 4 PVC Filters K, Ca , Ti , V , Cr, Mn , Fe , Ni, Cu , Zn, Ga
25kV / 160μΑ / 6 Al Filters / 4 PVC Filters As , Pb , Rb , Sr , Hg
45kV / 22μΑ / 18 Al Filters / 4 PVC Filters Sb
50kV / 4μΑ / 4 Al Filters / 4 PVC Filters Ag , Cd, Ba, Ce
50kV / 13μΑ / 18 Al Filters / 4 PVC Filters Cs , Ba
Table 3. Optimum operational scenarios for soil and fly ash samples analysis.
For each scenario the best WinQXAS spectrum analysis model was also determined. To select the best applicable model for the WinQXAS spectrum analysis, different types of background were tested until an acceptable background curve in terms χ2 value was obtained for the Region of Interest (ROI) where the photopeaks of the investigated elements appear. The details of the WinQXAS model for the final operational scenarios are presented in Table 4. Most parameters are common for all operational scenarios, with the exception of ROI for each scenario, which depends on the operational conditions. WinQXAS program requires that the user pre-
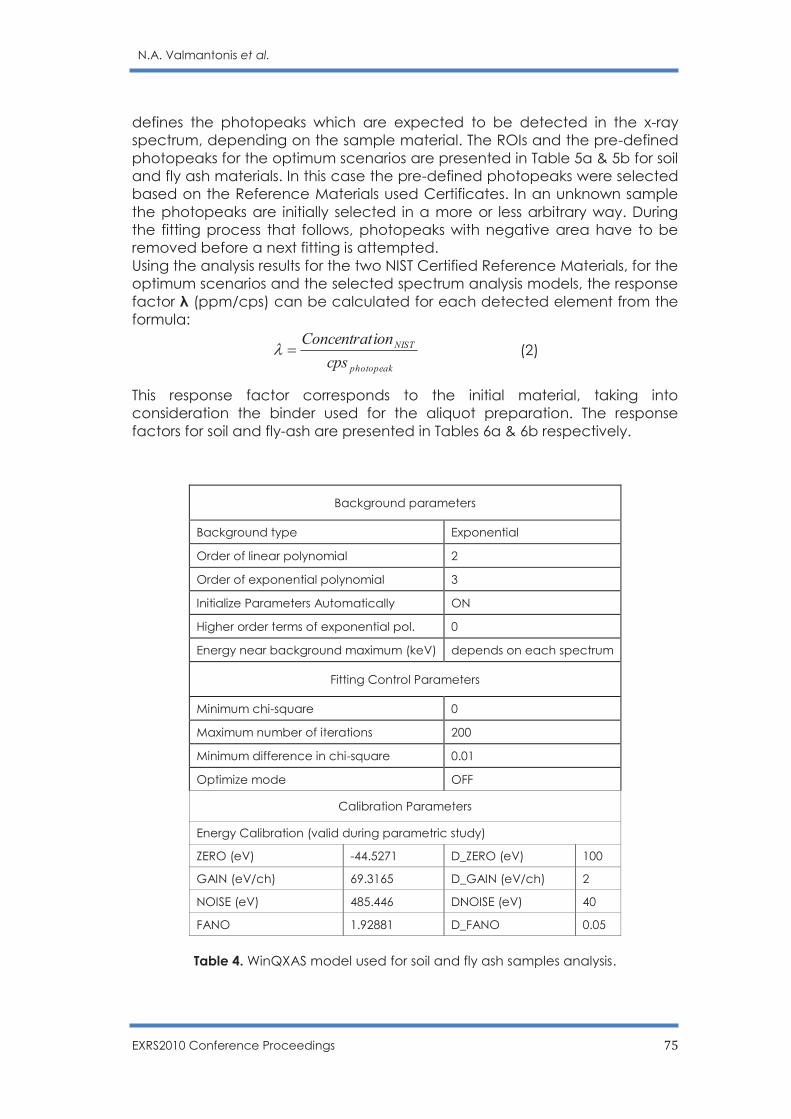
N.A. Valmantonis et al.
EXRS2010 Conference Proceedings 75
defines the photopeaks which are expected to be detected in the x-ray spectrum, depending on the sample material. The ROIs and the pre-defined photopeaks for the optimum scenarios are presented in Table 5a & 5b for soil and fly ash materials. In this case the pre-defined photopeaks were selected based on the Reference Materials used Certificates. In an unknown sample the photopeaks are initially selected in a more or less arbitrary way. During the fitting process that follows, photopeaks with negative area have to be removed before a next fitting is attempted. Using the analysis results for the two NIST Certified Reference Materials, for the optimum scenarios and the selected spectrum analysis models, the response factor λ (ppm/cps) can be calculated for each detected element from the formula:
photopeak
NIST
cps
ionConcentrat=l (2)
This response factor corresponds to the initial material, taking into consideration the binder used for the aliquot preparation. The response factors for soil and fly-ash are presented in Tables 6a & 6b respectively.
Background parameters
Background type Exponential
Order of linear polynomial 2
Order of exponential polynomial 3
Initialize Parameters Automatically ON
Higher order terms of exponential pol. 0
Energy near background maximum (keV) depends on each spectrum
Fitting Control Parameters
Minimum chi-square 0
Maximum number of iterations 200
Minimum difference in chi-square 0.01
Optimize mode OFF
Calibration Parameters
Energy Calibration (valid during parametric study)
ZERO (eV) -44.5271 D_ZERO (eV) 100
GAIN (eV/ch) 69.3165 D_GAIN (eV/ch) 2
NOISE (eV) 485.446 DNOISE (eV) 40
FANO 1.92881 D_FANO 0.05
Table 4. WinQXAS model used for soil and fly ash samples analysis.
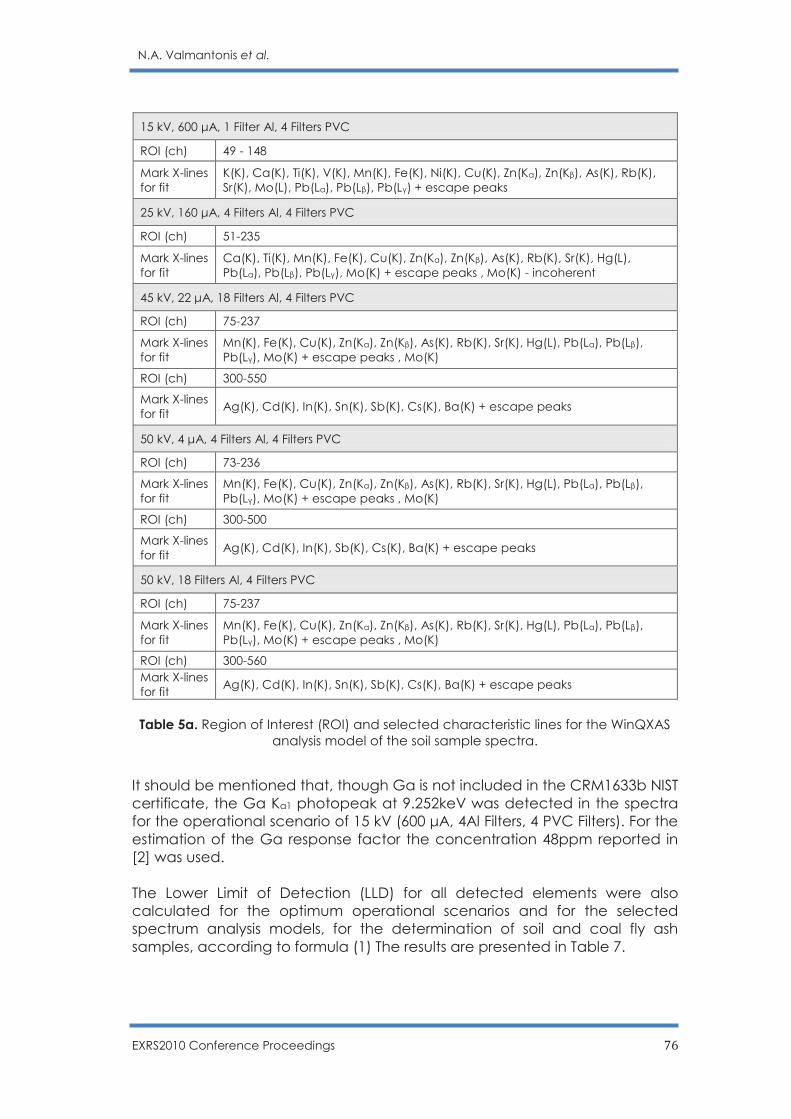
N.A. Valmantonis et al.
EXRS2010 Conference Proceedings 76
15 kV, 600 μΑ, 1 Filter Al, 4 Filters PVC
ROI (ch) 49 - 148
Mark X-lines for fit
K(K), Ca(K), Ti(K), V(K), Mn(K), Fe(K), Ni(K), Cu(K), Zn(Kα), Zn(Kβ), As(K), Rb(K), Sr(K), Mo(L), Pb(Lα), Pb(Lβ), Pb(Lγ) + escape peaks
25 kV, 160 μΑ, 4 Filters Al, 4 Filters PVC
ROI (ch) 51-235
Mark X-lines for fit
Ca(K), Ti(K), Mn(K), Fe(K), Cu(K), Zn(Kα), Zn(Kβ), As(K), Rb(K), Sr(K), Hg(L), Pb(Lα), Pb(Lβ), Pb(Lγ), Mo(K) + escape peaks , Mo(K) - incoherent
45 kV, 22 μΑ, 18 Filters Al, 4 Filters PVC
ROI (ch) 75-237
Mark X-lines for fit
Mn(K), Fe(K), Cu(K), Zn(Kα), Zn(Kβ), As(K), Rb(K), Sr(K), Hg(L), Pb(Lα), Pb(Lβ), Pb(Lγ), Mo(K) + escape peaks , Mo(K)
ROI (ch) 300-550
Mark X-lines for fit
Ag(K), Cd(K), In(K), Sn(K), Sb(K), Cs(K), Ba(K) + escape peaks
50 kV, 4 μΑ, 4 Filters Al, 4 Filters PVC
ROI (ch) 73-236
Mark X-lines for fit
Mn(K), Fe(K), Cu(K), Zn(Kα), Zn(Kβ), As(K), Rb(K), Sr(K), Hg(L), Pb(Lα), Pb(Lβ), Pb(Lγ), Mo(K) + escape peaks , Mo(K)
ROI (ch) 300-500
Mark X-lines for fit
Ag(K), Cd(K), In(K), Sb(K), Cs(K), Ba(K) + escape peaks
50 kV, 18 Filters Al, 4 Filters PVC
ROI (ch) 75-237
Mark X-lines for fit
Mn(K), Fe(K), Cu(K), Zn(Kα), Zn(Kβ), As(K), Rb(K), Sr(K), Hg(L), Pb(Lα), Pb(Lβ), Pb(Lγ), Mo(K) + escape peaks , Mo(K)
ROI (ch) 300-560 Mark X-lines for fit
Ag(K), Cd(K), In(K), Sn(K), Sb(K), Cs(K), Ba(K) + escape peaks
Table 5α. Region of Interest (ROI) and selected characteristic lines for the WinQXAS analysis model of the soil sample spectra.
It should be mentioned that, though Ga is not included in the CRM1633b NIST certificate, the Ga Kα1 photopeak at 9.252keV was detected in the spectra for the operational scenario of 15 kV (600 μΑ, 4Al Filters, 4 PVC Filters). For the estimation of the Ga response factor the concentration 48ppm reported in [2] was used. The Lower Limit of Detection (LLD) for all detected elements were also calculated for the optimum operational scenarios and for the selected spectrum analysis models, for the determination of soil and coal fly ash samples, according to formula (1) The results are presented in Table 7.
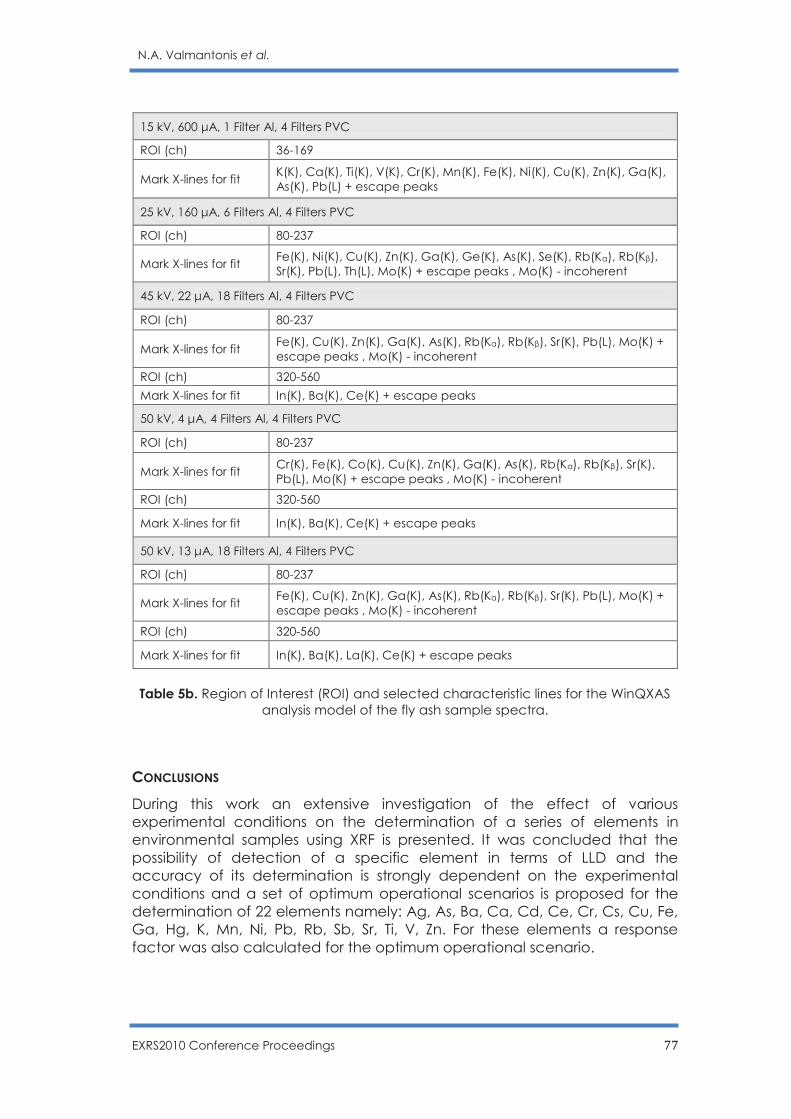
N.A. Valmantonis et al.
EXRS2010 Conference Proceedings 77
15 kV, 600 μΑ, 1 Filter Al, 4 Filters PVC
ROI (ch) 36-169
Mark X-lines for fit K(K), Ca(K), Ti(K), V(K), Cr(K), Mn(K), Fe(K), Ni(K), Cu(K), Zn(K), Ga(K), As(K), Pb(L) + escape peaks
25 kV, 160 μΑ, 6 Filters Al, 4 Filters PVC
ROI (ch) 80-237
Mark X-lines for fit Fe(K), Ni(K), Cu(K), Zn(K), Ga(K), Ge(K), As(K), Se(K), Rb(Kα), Rb(Kβ), Sr(K), Pb(L), Th(L), Mo(K) + escape peaks , Mo(K) - incoherent
45 kV, 22 μΑ, 18 Filters Al, 4 Filters PVC
ROI (ch) 80-237
Mark X-lines for fit Fe(K), Cu(K), Zn(K), Ga(K), As(K), Rb(Kα), Rb(Kβ), Sr(K), Pb(L), Mo(K) + escape peaks , Mo(K) - incoherent
ROI (ch) 320-560
Mark X-lines for fit In(K), Ba(K), Ce(K) + escape peaks
50 kV, 4 μΑ, 4 Filters Al, 4 Filters PVC
ROI (ch) 80-237
Mark X-lines for fit Cr(K), Fe(K), Co(K), Cu(K), Zn(K), Ga(K), As(K), Rb(Kα), Rb(Kβ), Sr(K), Pb(L), Mo(K) + escape peaks , Mo(K) - incoherent
ROI (ch) 320-560
Mark X-lines for fit In(K), Ba(K), Ce(K) + escape peaks
50 kV, 13 μΑ, 18 Filters Al, 4 Filters PVC
ROI (ch) 80-237
Mark X-lines for fit Fe(K), Cu(K), Zn(K), Ga(K), As(K), Rb(Kα), Rb(Kβ), Sr(K), Pb(L), Mo(K) + escape peaks , Mo(K) - incoherent
ROI (ch) 320-560
Mark X-lines for fit In(K), Ba(K), La(K), Ce(K) + escape peaks
Table 5b. Region of Interest (ROI) and selected characteristic lines for the WinQXAS analysis model of the fly ash sample spectra.
CONCLUSIONS
During this work an extensive investigation of the effect of various experimental conditions on the determination of a series of elements in environmental samples using XRF is presented. It was concluded that the possibility of detection of a specific element in terms of LLD and the accuracy of its determination is strongly dependent on the experimental conditions and a set of optimum operational scenarios is proposed for the determination of 22 elements namely: Ag, As, Ba, Ca, Cd, Ce, Cr, Cs, Cu, Fe, Ga, Hg, K, Mn, Ni, Pb, Rb, Sb, Sr, Ti, V, Zn. For these elements a response factor was also calculated for the optimum operational scenario.
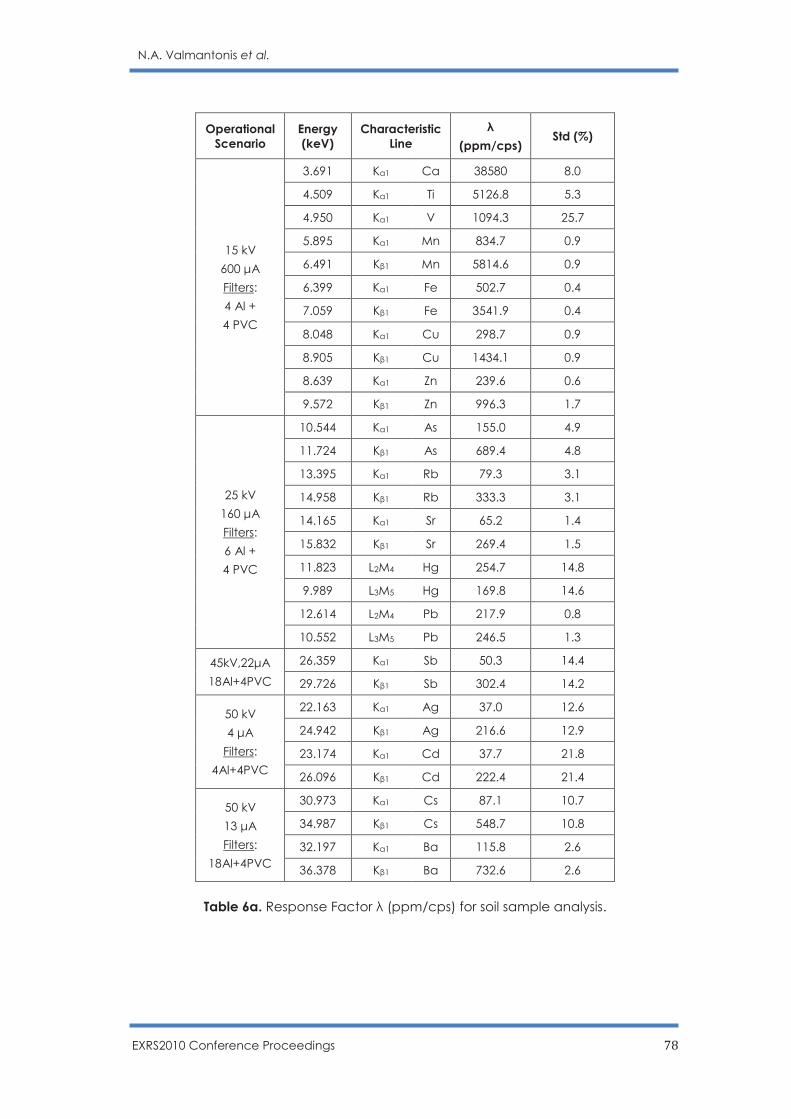
N.A. Valmantonis et al.
EXRS2010 Conference Proceedings 78
Operational Scenario
Energy (keV)
Characteristic Line
λ
(ppm/cps) Std (%)
15 kV
600 μΑ
Filters:
4 Al +
4 PVC
3.691 Kα1 Ca 38580 8.0
4.509 Kα1 Ti 5126.8 5.3
4.950 Kα1 V 1094.3 25.7
5.895 Kα1 Mn 834.7 0.9
6.491 Kβ1 Mn 5814.6 0.9
6.399 Kα1 Fe 502.7 0.4
7.059 Kβ1 Fe 3541.9 0.4
8.048 Kα1 Cu 298.7 0.9
8.905 Kβ1 Cu 1434.1 0.9
8.639 Kα1 Zn 239.6 0.6
9.572 Kβ1 Zn 996.3 1.7
25 kV
160 μΑ
Filters:
6 Al +
4 PVC
10.544 Kα1 As 155.0 4.9
11.724 Kβ1 As 689.4 4.8
13.395 Kα1 Rb 79.3 3.1
14.958 Kβ1 Rb 333.3 3.1
14.165 Kα1 Sr 65.2 1.4
15.832 Kβ1 Sr 269.4 1.5
11.823 L2M4 Hg 254.7 14.8
9.989 L3M5 Hg 169.8 14.6
12.614 L2M4 Pb 217.9 0.8
10.552 L3M5 Pb 246.5 1.3
45kV,22μΑ
18Al+4PVC
26.359 Kα1 Sb 50.3 14.4
29.726 Kβ1 Sb 302.4 14.2
50 kV
4 μΑ
Filters:
4Al+4PVC
22.163 Kα1 Ag 37.0 12.6
24.942 Kβ1 Ag 216.6 12.9
23.174 Kα1 Cd 37.7 21.8
26.096 Kβ1 Cd 222.4 21.4
50 kV
13 μΑ
Filters:
18Al+4PVC
30.973 Kα1 Cs 87.1 10.7
34.987 Kβ1 Cs 548.7 10.8
32.197 Kα1 Ba 115.8 2.6
36.378 Kβ1 Ba 732.6 2.6
Table 6a. Response Factor λ (ppm/cps) for soil sample analysis.
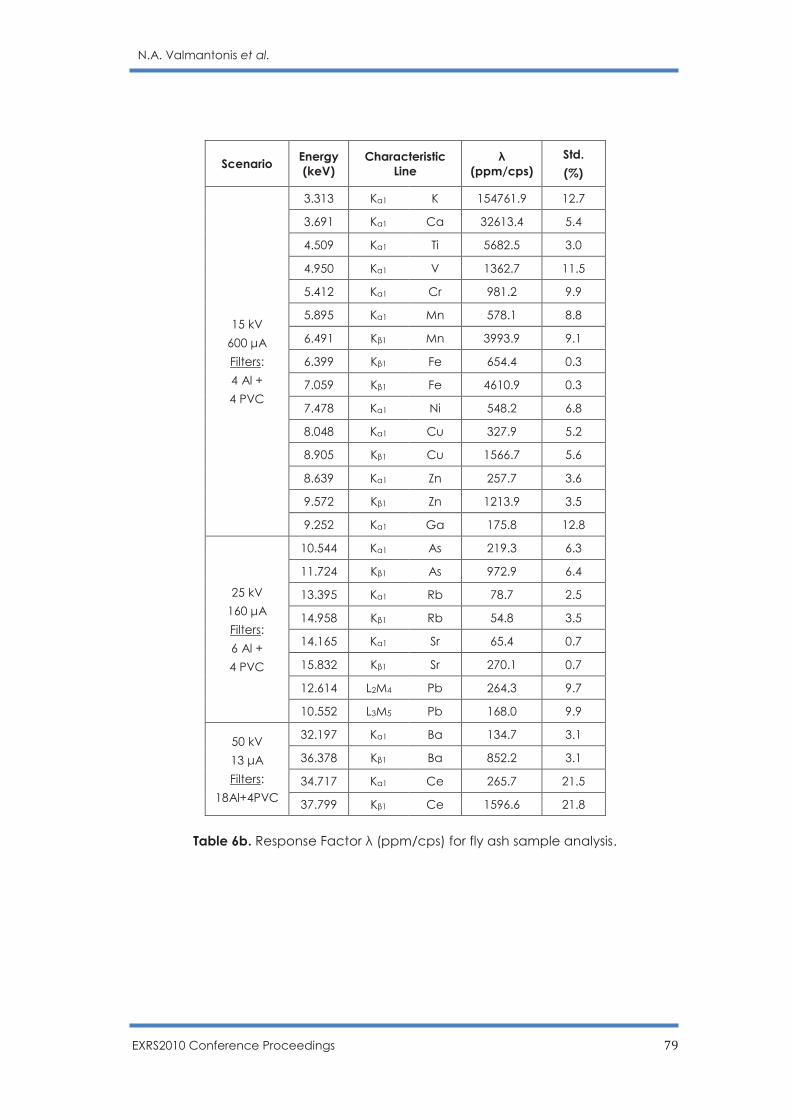
N.A. Valmantonis et al.
EXRS2010 Conference Proceedings 79
Scenario Energy (keV)
Characteristic Line
λ
(ppm/cps)
Std.
(%)
15 kV
600 μΑ
Filters:
4 Al +
4 PVC
3.313 Kα1 K 154761.9 12.7
3.691 Kα1 Ca 32613.4 5.4
4.509 Kα1 Ti 5682.5 3.0
4.950 Kα1 V 1362.7 11.5
5.412 Kα1 Cr 981.2 9.9
5.895 Kα1 Mn 578.1 8.8
6.491 Kβ1 Mn 3993.9 9.1
6.399 Kβ1 Fe 654.4 0.3
7.059 Kβ1 Fe 4610.9 0.3
7.478 Kα1 Ni 548.2 6.8
8.048 Kα1 Cu 327.9 5.2
8.905 Kβ1 Cu 1566.7 5.6
8.639 Kα1 Zn 257.7 3.6
9.572 Kβ1 Zn 1213.9 3.5
9.252 Kα1 Ga 175.8 12.8
25 kV
160 μΑ
Filters:
6 Al +
4 PVC
10.544 Kα1 As 219.3 6.3
11.724 Kβ1 As 972.9 6.4
13.395 Kα1 Rb 78.7 2.5
14.958 Kβ1 Rb 54.8 3.5
14.165 Kα1 Sr 65.4 0.7
15.832 Kβ1 Sr 270.1 0.7
12.614 L2M4 Pb 264.3 9.7
10.552 L3M5 Pb 168.0 9.9
50 kV
13 μΑ
Filters:
18Al+4PVC
32.197 Kα1 Ba 134.7 3.1
36.378 Kβ1 Ba 852.2 3.1
34.717 Kα1 Ce 265.7 21.5
37.799 Kβ1 Ce 1596.6 21.8
Table 6b. Response Factor λ (ppm/cps) for fly ash sample analysis.
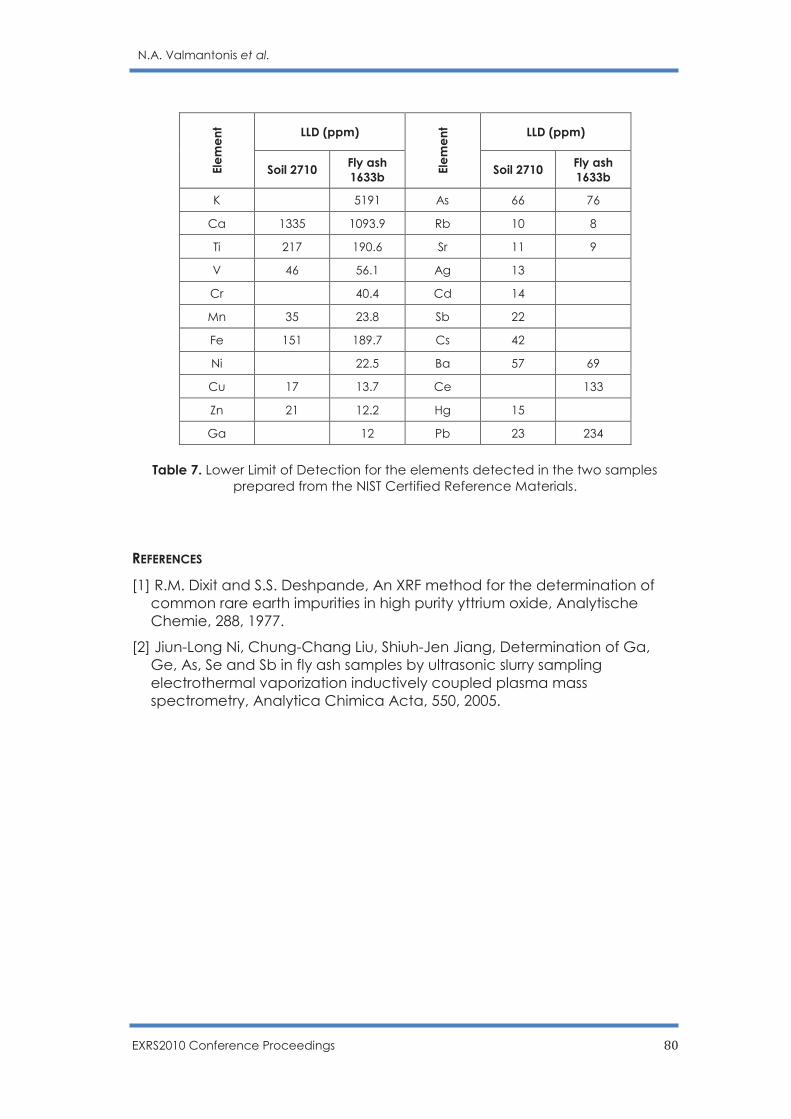
N.A. Valmantonis et al.
EXRS2010 Conference Proceedings 80
Ele
me
nt LLD (ppm)
Ele
me
nt LLD (ppm)
Soil 2710 Fly ash 1633b
Soil 2710 Fly ash 1633b
K 5191 As 66 76
Ca 1335 1093.9 Rb 10 8
Ti 217 190.6 Sr 11 9
V 46 56.1 Ag 13
Cr 40.4 Cd 14
Mn 35 23.8 Sb 22
Fe 151 189.7 Cs 42
Ni 22.5 Ba 57 69
Cu 17 13.7 Ce 133
Zn 21 12.2 Hg 15
Ga 12 Pb 23 234
Table 7. Lower Limit of Detection for the elements detected in the two samples prepared from the NIST Certified Reference Materials.
REFERENCES
[1] R.M. Dixit and S.S. Deshpande, An XRF method for the determination of common rare earth impurities in high purity yttrium oxide, Analytische Chemie, 288, 1977.
[2] Jiun-Long Ni, Chung-Chang Liu, Shiuh-Jen Jiang, Determination of Ga, Ge, As, Se and Sb in fly ash samples by ultrasonic slurry sampling electrothermal vaporization inductively coupled plasma mass spectrometry, Analytica Chimica Acta, 550, 2005.
EXRS2010 Conference Proceedings 81
X-Ray fluorescence determination of FeO content in rocks and iron ores
V. Chubarov, A. Finkelshtein
Institute of Geochemistry SB RAS
(1a, Favorsky str., Irkutsk, Russia)
E-mail: [email protected]
INTRODUCTION Determination of iron and manganese valence state as Fe2+ / Fe3+ and Mn2+/Mn4+ in rocks and other mineral objects is of interest for mineralogy, petrology, geochemistry and other related disciplines. The X-ray fluorescence (XRF) analysis is commonly applied to determine the content of the rock-forming elements in rocks [1, 2] and iron ores [3], as it provides a high performance and fairly low costs of sample preparation. This analysis measures the contents of the total element form of iron (as Fe2O3tot) and manganese (as MnOtot). The valence states of iron as FeO content and manganese as MnO2 content are usually determined by wet chemistry technique [4-6]. The methods of nuclear gamma-resonance [7] and XANES [8] can also be employed to measure Fe2+ and Fe3+ contents in certain minerals. Position of the peak and intensity of some characteristic lines of emission x-ray spectrum are affected by the chemical bonds [9-10]. Conventional x-ray spectrometers have no sufficient resolution to define the chemical state of elements as to shifting the analytical line peak. The influence of chemical bonds on the intensity of transition elements spectrum lines, being extremely low for the mostly intense characteristic Ka-line used for a quantitative element analysis, is quite significant for rather weak satellites of Kβ-line produced by transitions of electrons from the state in the valence M-shell into internal levels of K-shells of atom [11-12]. The authors [13] reported that Fe2+/Fe3+ and Mn2+/Mn3+ ratio in minerals may be evaluated by an electron microprobe analyzer from the ratio of La1,2 and Lβ line intensities. Papers [14-17] describe the procedures of a quantitative determination of Fe2+ and Fe3+ to be implemented by electron microprobe analyzer in amphiboles [14], pyroxenes [15], garnet [16] and chromite [17]. The error in determining Fe2+/Fe3+ ratio varying from 4% to 25%. The study [18] recommends the ratio of the integral intensity of Kβ2,5 satellite to be applied to the intensity of Kβ1,3-line to define the valence state of iron in oxides using the X-ray fluorescence (XRF) spectra. The data on dependence of the ratio of XRF line intensities of K-series on oxidation states for neighboring elements Cr and Mn [19, 20] are in favor of the
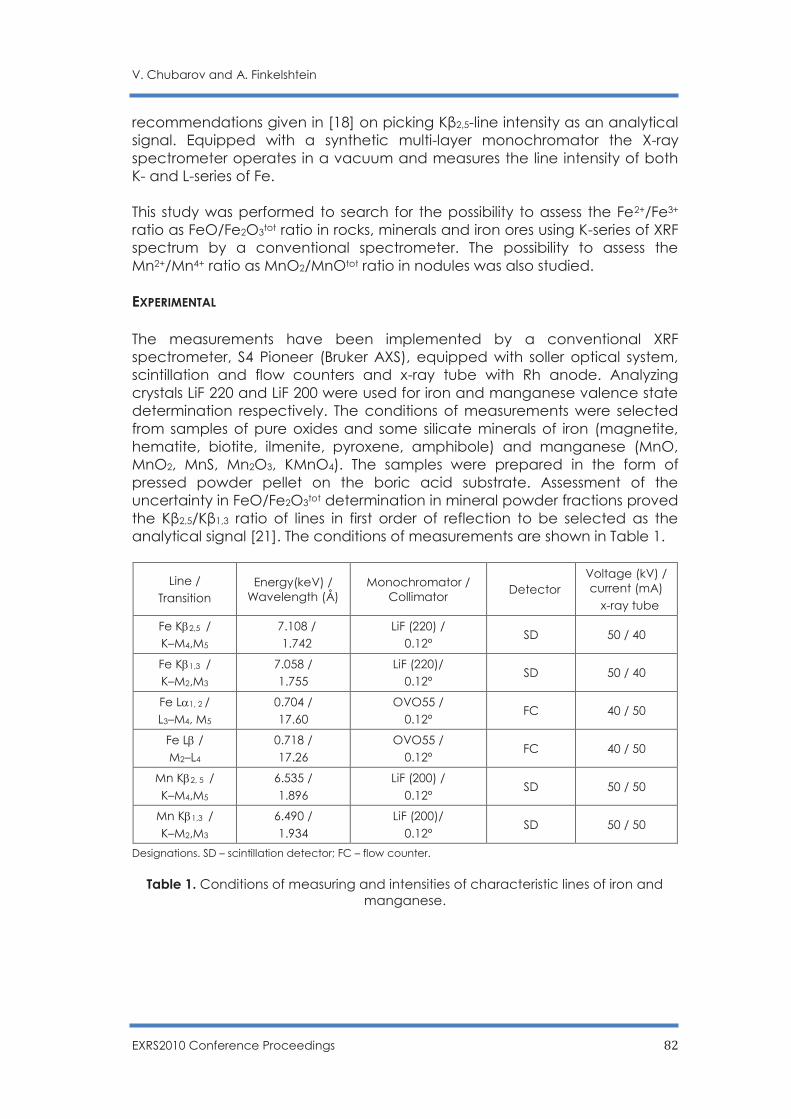
V. Chubarov and A. Finkelshtein
EXRS2010 Conference Proceedings 82
recommendations given in [18] on picking Kβ2,5-line intensity as an analytical signal. Equipped with a synthetic multi-layer monochromator the X-ray spectrometer operates in a vacuum and measures the line intensity of both K- and L-series of Fe. This study was performed to search for the possibility to assess the Fe2+/Fe3+ ratio as FeO/Fe2O3tot ratio in rocks, minerals and iron ores using K-series of XRF spectrum by a conventional spectrometer. The possibility to assess the Mn2+/Mn4+ ratio as MnO2/MnOtot ratio in nodules was also studied. EXPERIMENTAL
The measurements have been implemented by a conventional XRF spectrometer, S4 Pioneer (Bruker AXS), equipped with soller optical system, scintillation and flow counters and x-ray tube with Rh anode. Analyzing crystals LiF 220 and LiF 200 were used for iron and manganese valence state determination respectively. The conditions of measurements were selected from samples of pure oxides and some silicate minerals of iron (magnetite, hematite, biotite, ilmenite, pyroxene, amphibole) and manganese (MnO, MnO2, MnS, Mn2O3, KMnO4). The samples were prepared in the form of pressed powder pellet on the boric acid substrate. Assessment of the uncertainty in FeO/Fe2O3tot determination in mineral powder fractions proved the Kβ2,5/Kβ1,3 ratio of lines in first order of reflection to be selected as the analytical signal [21]. The conditions of measurements are shown in Table 1.
Line / Transition
Energy(keV) / Wavelength (Å)
Monochromator / Collimator
Detector Voltage (kV) / current (mA)
x-ray tube
Fe Kb2,5 / K–M4,M5
7.108 / 1.742
LiF (220) / 0.12º
SD 50 / 40
Fe Kb1,3 / K–M2,M3
7.058 / 1.755
LiF (220)/ 0.12º
SD 50 / 40
Fe La1, 2 / L3–M4, M5
0.704 / 17.60
OVO55 / 0.12º
FC 40 / 50
Fe Lb / M2–L4
0.718 / 17.26
OVO55 / 0.12º
FC 40 / 50
Mn Kb2, 5 / K–M4,M5
6.535 / 1.896
LiF (200) / 0.12º
SD 50 / 50
Mn Kb1,3 / K–M2,M3
6.490 / 1.934
LiF (200)/ 0.12º
SD 50 / 50
Designations. SD – scintillation detector; FC – flow counter.
Table 1. Conditions of measuring and intensities of characteristic lines of iron and manganese.
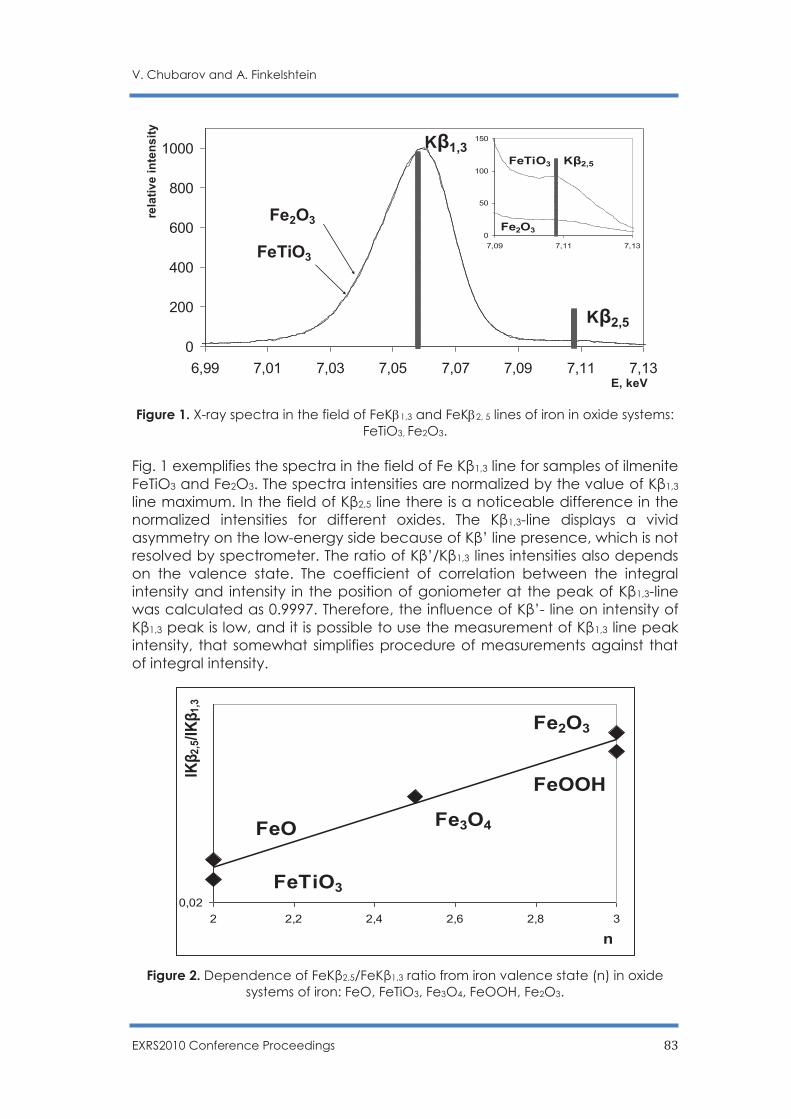
V. Chubarov and A. Finkelshtein
EXRS2010 Conference Proceedings 83
0
200
400
600
800
1000
6,99 7,01 7,03 7,05 7,07 7,09 7,11 7,13E, keV
rela
tiv
e i
nte
ns
ity
Kβ1,3
Kβ2,5
Fe2O3
FeTiO3
0
50
100
150
7,09 7,11 7,13
Kβ2,5FeTiO3
Fe2O3
Figure 1. X-ray spectra in the field of FeKb1,3 and FeKb2, 5 lines of iron in oxide systems:
FeTiO3, Fe2O3. Fig. 1 exemplifies the spectra in the field of Fe Kβ1,3 line for samples of ilmenite FeTiO3 and Fe2O3. The spectra intensities are normalized by the value of Kβ1,3 line maximum. In the field of Kβ2,5 line there is a noticeable difference in the normalized intensities for different oxides. The Kβ1,3-line displays a vivid asymmetry on the low-energy side because of Kβ’ line presence, which is not
resolved by spectrometer. The ratio of Kβ’/Kβ1,3 lines intensities also depends on the valence state. The coefficient of correlation between the integral intensity and intensity in the position of goniometer at the peak of Kβ1,3-line was calculated as 0.9997. Therefore, the influence of Kβ’- line on intensity of Kβ1,3 peak is low, and it is possible to use the measurement of Kβ1,3 line peak intensity, that somewhat simplifies procedure of measurements against that of integral intensity.
Figure 2. Dependence of FeKβ2,5/FeKβ1,3 ratio from iron valence state (n) in oxide
systems of iron: FeO, FeTiO3, Fe3O4, FeOOH, Fe2O3.
0,02
2 2,2 2,4 2,6 2,8 3
n
IKβ
2,5/IKβ
1,3
FeOOH
Fe3O4
FeTiO3
Fe2O3
FeO
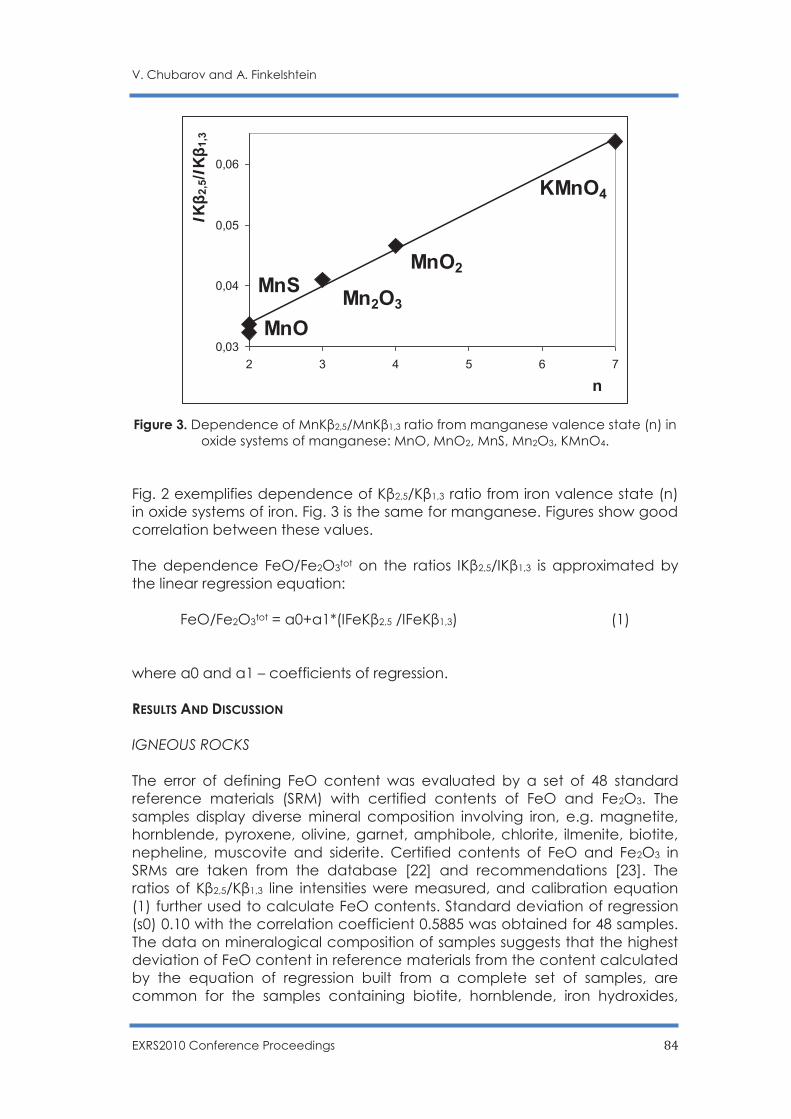
V. Chubarov and A. Finkelshtein
EXRS2010 Conference Proceedings 84
Figure 3. Dependence of MnKβ2,5/MnKβ1,3 ratio from manganese valence state (n) in oxide systems of manganese: MnO, MnO2, MnS, Mn2O3, KMnO4.
Fig. 2 exemplifies dependence of Kβ2,5/Kβ1,3 ratio from iron valence state (n) in oxide systems of iron. Fig. 3 is the same for manganese. Figures show good correlation between these values. The dependence FeO/Fe2O3tot on the ratios IKβ2,5/IKβ1,3 is approximated by the linear regression equation:
FeO/Fe2O3tot = a0+a1*(IFeKβ2,5 /IFeKβ1,3) (1)
where а0 and а1 – coefficients of regression. RESULTS AND DISCUSSION IGNEOUS ROCKS The error of defining FeO content was evaluated by a set of 48 standard reference materials (SRM) with certified contents of FeO and Fe2O3. The samples display diverse mineral composition involving iron, e.g. magnetite, hornblende, pyroxene, olivine, garnet, amphibole, chlorite, ilmenite, biotite, nepheline, muscovite and siderite. Certified contents of FeO and Fe2O3 in SRMs are taken from the database [22] and recommendations [23]. The ratios of Kβ2,5/Kβ1,3 line intensities were measured, and calibration equation (1) further used to calculate FeO contents. Standard deviation of regression (s0) 0.10 with the correlation coefficient 0.5885 was obtained for 48 samples. The data on mineralogical composition of samples suggests that the highest deviation of FeO content in reference materials from the content calculated by the equation of regression built from a complete set of samples, are common for the samples containing biotite, hornblende, iron hydroxides,
0,03
0,04
0,05
0,06
2 3 4 5 6 7
n
IKβ
2,5
/IKβ
1,3
KMnO4
MnO2
Mn2O3
MnO
MnS
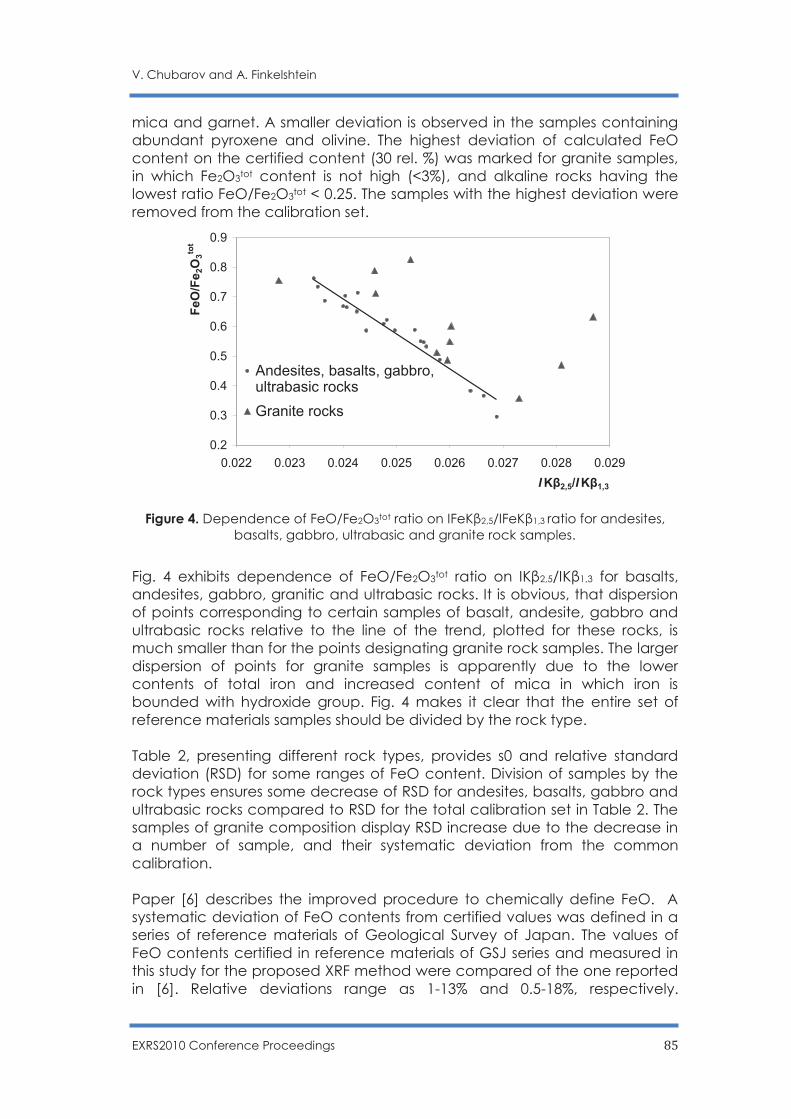
V. Chubarov and A. Finkelshtein
EXRS2010 Conference Proceedings 85
mica and garnet. A smaller deviation is observed in the samples containing abundant pyroxene and olivine. The highest deviation of calculated FeO content on the certified content (30 rel. %) was marked for granite samples, in which Fe2O3tot content is not high (<3%), and alkaline rocks having the lowest ratio FeO/Fe2O3tot < 0.25. The samples with the highest deviation were removed from the calibration set.
Figure 4. Dependence of FeO/Fe2O3tot ratio on IFeKβ2,5/IFeKβ1,3 ratio for andesites,
basalts, gabbro, ultrabasic and granite rock samples.
Fig. 4 exhibits dependence of FeO/Fe2O3tot ratio on IKβ2,5/IKβ1,3 for basalts, andesites, gabbro, granitic and ultrabasic rocks. It is obvious, that dispersion of points corresponding to certain samples of basalt, andesite, gabbro and ultrabasic rocks relative to the line of the trend, plotted for these rocks, is much smaller than for the points designating granite rock samples. The larger dispersion of points for granite samples is apparently due to the lower contents of total iron and increased content of mica in which iron is bounded with hydroxide group. Fig. 4 makes it clear that the entire set of reference materials samples should be divided by the rock type. Table 2, presenting different rock types, provides s0 and relative standard deviation (RSD) for some ranges of FeO content. Division of samples by the rock types ensures some decrease of RSD for andesites, basalts, gabbro and ultrabasic rocks compared to RSD for the total calibration set in Table 2. The samples of granite composition display RSD increase due to the decrease in a number of sample, and their systematic deviation from the common calibration. Paper [6] describes the improved procedure to chemically define FeO. A systematic deviation of FeO contents from certified values was defined in a series of reference materials of Geological Survey of Japan. The values of FeO contents certified in reference materials of GSJ series and measured in this study for the proposed XRF method were compared of the one reported in [6]. Relative deviations range as 1-13% and 0.5-18%, respectively.
0.2
0.3
0.4
0.5
0.6
0.7
0.8
0.9
0.022 0.023 0.024 0.025 0.026 0.027 0.028 0.029
IKβ2,5/IKβ1,3
FeO
/Fe
2O
3to
t
Andesites, basalts, gabbro,ultrabasic rocks
Granite rocks
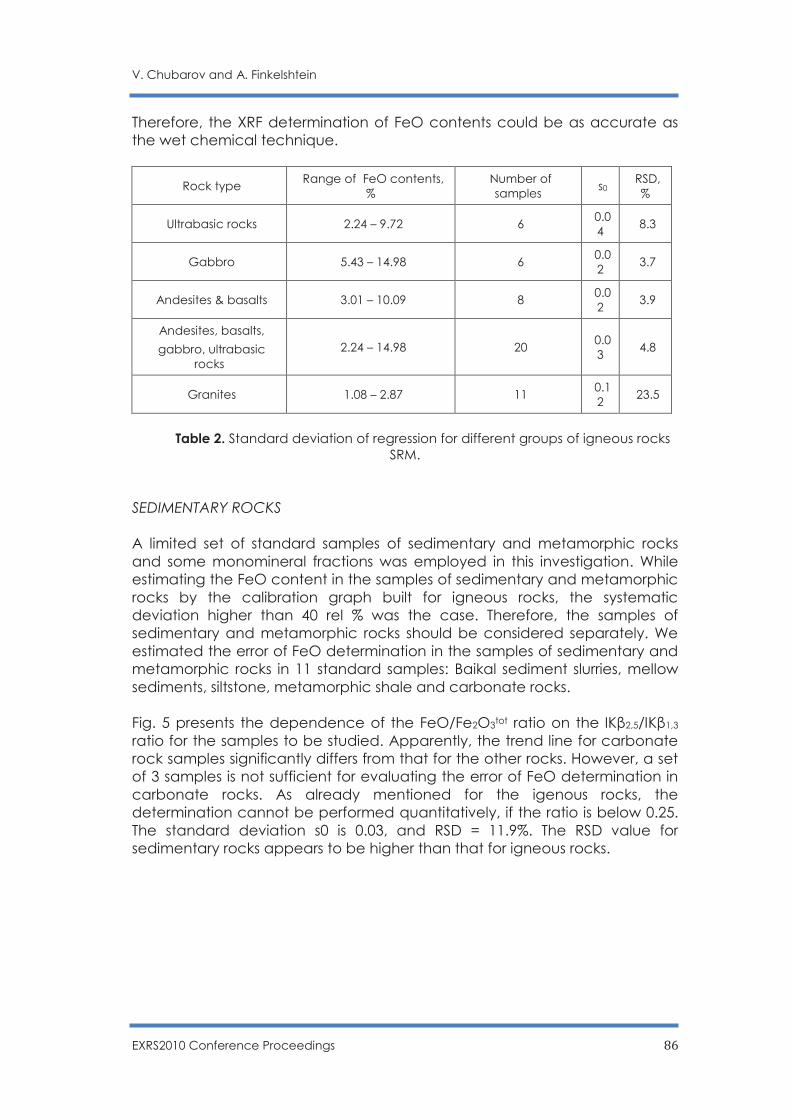
V. Chubarov and A. Finkelshtein
EXRS2010 Conference Proceedings 86
Therefore, the XRF determination of FeO contents could be as accurate as the wet chemical technique.
Rock type Range of FeO contents,
% Number of samples
s0 RSD, %
Ultrabasic rocks 2.24 – 9.72 6 0.04
8.3
Gabbro 5.43 – 14.98 6 0.02
3.7
Andesites & basalts 3.01 – 10.09 8 0.02
3.9
Andesites, basalts,
gabbro, ultrabasic rocks
2.24 – 14.98 20 0.03
4.8
Granites 1.08 – 2.87 11 0.12
23.5
Table 2. Standard deviation of regression for different groups of igneous rocks SRM.
SEDIMENTARY ROCKS A limited set of standard samples of sedimentary and metamorphic rocks and some monomineral fractions was employed in this investigation. While estimating the FeO content in the samples of sedimentary and metamorphic rocks by the calibration graph built for igneous rocks, the systematic deviation higher than 40 rel % was the case. Therefore, the samples of sedimentary and metamorphic rocks should be considered separately. We estimated the error of FeO determination in the samples of sedimentary and metamorphic rocks in 11 standard samples: Baikal sediment slurries, mellow sediments, siltstone, metamorphic shale and carbonate rocks. Fig. 5 presents the dependence of the FeO/Fe2O3tot ratio on the IKβ2,5/IKβ1,3 ratio for the samples to be studied. Apparently, the trend line for carbonate rock samples significantly differs from that for the other rocks. However, a set of 3 samples is not sufficient for evaluating the error of FeO determination in carbonate rocks. As already mentioned for the igenous rocks, the determination cannot be performed quantitatively, if the ratio is below 0.25. The standard deviation s0 is 0.03, and RSD = 11.9%. The RSD value for sedimentary rocks appears to be higher than that for igneous rocks.
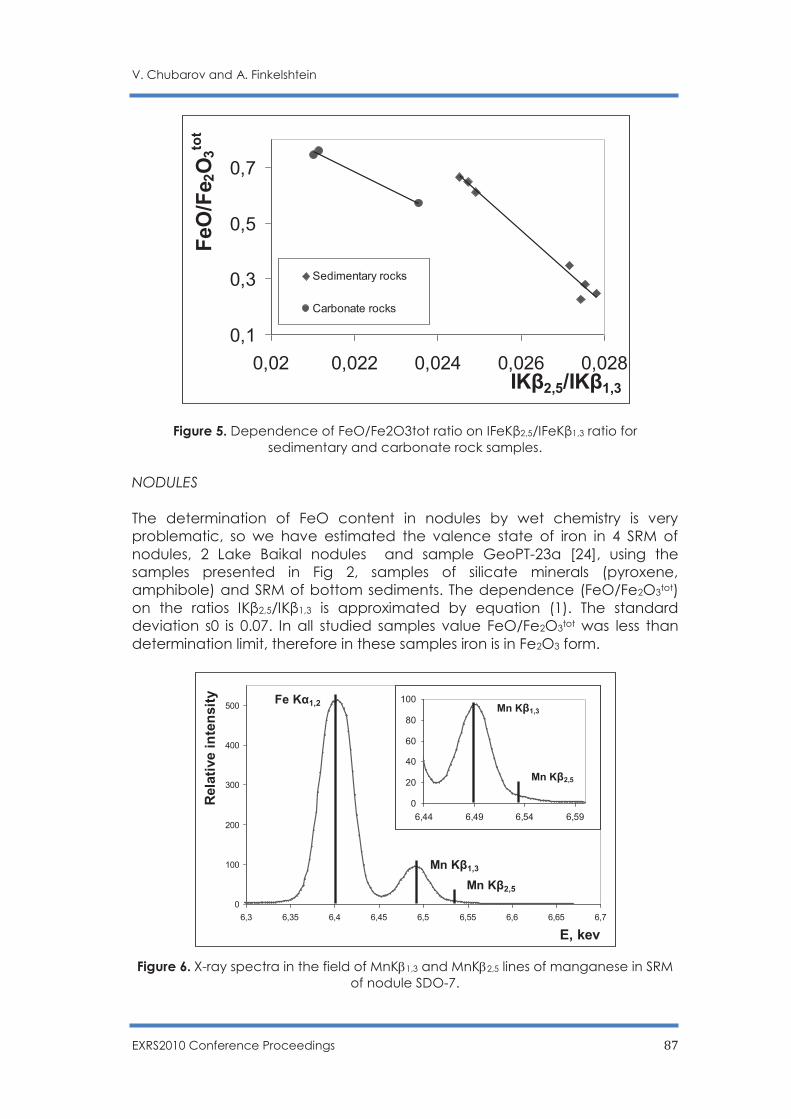
V. Chubarov and A. Finkelshtein
EXRS2010 Conference Proceedings 87
Figure 5. Dependence of FeO/Fe2O3tot ratio on IFeKβ2,5/IFeKβ1,3 ratio for sedimentary and carbonate rock samples.
NODULES The determination of FeO content in nodules by wet chemistry is very problematic, so we have estimated the valence state of iron in 4 SRM of nodules, 2 Lake Baikal nodules and sample GeoPT-23a [24], using the samples presented in Fig 2, samples of silicate minerals (pyroxene, amphibole) and SRM of bottom sediments. The dependence (FeO/Fe2O3tot) on the ratios IKβ2,5/IKβ1,3 is approximated by equation (1). The standard deviation s0 is 0.07. In all studied samples value FeO/Fe2O3tot was less than determination limit, therefore in these samples iron is in Fe2O3 form.
Figure 6. X-ray spectra in the field of MnKb1,3 and MnKb2,5 lines of manganese in SRM
of nodule SDO-7.
0,1
0,3
0,5
0,7
0,02 0,022 0,024 0,026 0,028IKβ2,5/IKβ1,3
FeO
/Fe
2O
3to
t
Sedimentary rocks
Carbonate rocks
0
100
200
300
400
500
6,3 6,35 6,4 6,45 6,5 6,55 6,6 6,65 6,7
E, kev
Rela
tive i
nte
nsit
y Fe Kα1,2
Mn Kβ1,3
Mn Kβ2,5
0
20
40
60
80
100
6,44 6,49 6,54 6,59
Mn Kβ1,3
Mn Kβ2,5
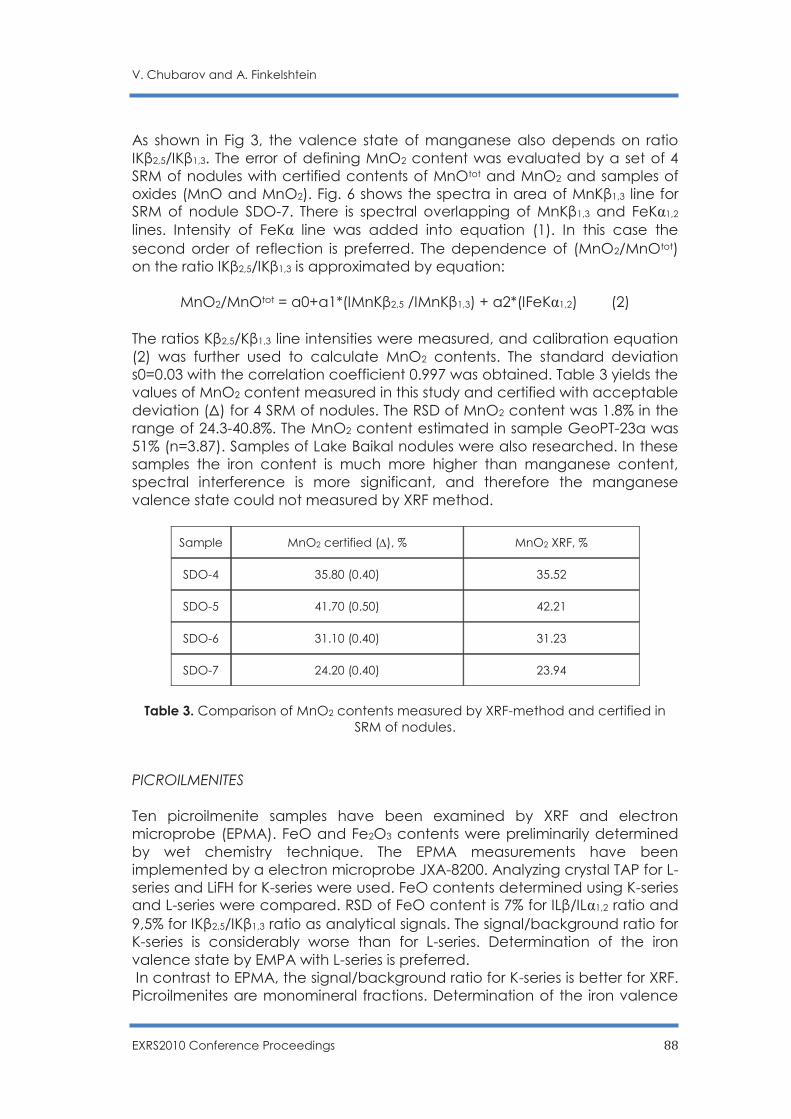
V. Chubarov and A. Finkelshtein
EXRS2010 Conference Proceedings 88
As shown in Fig 3, the valence state of manganese also depends on ratio IKβ2,5/IKβ1,3. The error of defining MnO2 content was evaluated by a set of 4 SRM of nodules with certified contents of MnOtot and MnO2 and samples of oxides (MnO and MnO2). Fig. 6 shows the spectra in area of MnKβ1,3 line for SRM of nodule SDO-7. There is spectral overlapping of MnKβ1,3 and FeKα1,2 lines. Intensity of FeKα line was added into equation (1). In this case the second order of reflection is preferred. The dependence of (MnO2/MnOtot) on the ratio IKβ2,5/IKβ1,3 is approximated by equation:
MnO2/MnOtot = a0+a1*(IMnKβ2,5 /IMnKβ1,3) + a2*(IFeKα1,2) (2) The ratios Kβ2,5/Kβ1,3 line intensities were measured, and calibration equation (2) was further used to calculate MnO2 contents. The standard deviation s0=0.03 with the correlation coefficient 0.997 was obtained. Table 3 yields the values of MnO2 content measured in this study and certified with acceptable deviation (Δ) for 4 SRM of nodules. The RSD of MnO2 content was 1.8% in the range of 24.3-40.8%. The MnO2 content estimated in sample GeoPT-23a was 51% (n=3.87). Samples of Lake Baikal nodules were also researched. In these samples the iron content is much more higher than manganese content, spectral interference is more significant, and therefore the manganese valence state could not measured by XRF method.
Sample MnO2 certified (D), % MnO2 XRF, %
SDO-4 35.80 (0.40) 35.52
SDO-5 41.70 (0.50) 42.21
SDO-6 31.10 (0.40) 31.23
SDO-7 24.20 (0.40) 23.94
Table 3. Comparison of MnO2 contents measured by XRF-method and certified in SRM of nodules.
PICROILMENITES Ten picroilmenite samples have been examined by XRF and electron microprobe (EPMA). FeO and Fe2O3 contents were preliminarily determined by wet chemistry technique. The EPMA measurements have been implemented by a electron microprobe JXA-8200. Analyzing crystal TAP for L-series and LiFH for K-series were used. FeO contents determined using K-series and L-series were compared. RSD of FeO content is 7% for ILβ/ILα1,2 ratio and 9,5% for IKβ2,5/IKβ1,3 ratio as analytical signals. The signal/background ratio for K-series is considerably worse than for L-series. Determination of the iron valence state by EMPA with L-series is preferred. In contrast to EPMA, the signal/background ratio for K-series is better for XRF. Picroilmenites are monomineral fractions. Determination of the iron valence
V. Chubarov and A. Finkelshtein
EXRS2010 Conference Proceedings 89
state could be performed using both L-series (Lβ/La1,2) and K-series (Kβ2,5/Kβ1,3) by XRF with the same accuracy. The RSD of FeO content was about 5% for K-series and 4.3% for L-series for the range of FeO content 12-27%. The FeO content determined by XRF is closer to wet chemistry results than that determined by EPMA. It could be explained by a larger sample mass in XRF than in EPMA. IRON ORES The error of FeO content determination was evaluated by a set of 15 iron ore samples with FeO and Fe2O3 contents determined by wet chemistry technique. The conditions of measurements were chosen using samples of mixtures of mineral hematite and magnetite. The standard deviation of FeO/Fe2O3tot ratio was 0.018. The RSD of FeO content was 10.3% for the range of FeO content 3-25%. Table 4 yields the values of FeO content measured by XRF method and determined by wet chemistry technique for 10 samples of iron ores.
Sample name
FeO content (wet chemistry), %
FeO content (XRF), %
Relative deviation, %
B4-21 9.22 10.54 -14,3
C-11a 14.80 15.48 -4,6
K-1 21.53 22.48 -4,4
M-7777 25.30 25.02 1,1
H465-461 16.68 15.00 10,1
O92 18.98 18.20 4,1
OK-13-11 15.46 15.37 0,6
C-11b 18.78 19.70 -4,9
T-620 15.26 15.70 -2,9
7679 3.63 3.18 12,4
Table 4. Results of XRF analysis of iron ores. CONCLUSIONS The data acquired in this study indicates that the XRF determination of FeO content with К-series of XRF spectra in rocks and iron ores provides RSD values 3-16% for the range 0.4–25% of FeO content. The wet chemical method to determine FeO in rocks offers the RSD values varying from 0.7 to 7% [3]. Thus, the XRF measures FeO content in rock and iron ores samples with ratio FeO/Fe2O3tot > 0,25 and MnO2 content in nodules with the accuracy comparable with that of chemical analysis, or somewhat worse. However, the XRF method is more preferable for it is fairly fast and low cost of sample preparation, so it could be widely employed for routine geochemical investigations. As regards the nodules, the XRF method can be used for
V. Chubarov and A. Finkelshtein
EXRS2010 Conference Proceedings 90
estimation of both iron and manganese valence states, as the wet chemical technique is labour-consuming in application. The XRF and EPMA techniques could by equally used for picroilmenites, and the results are comparable. REFERENCES
[1] Afonin V.P., Gunicheva Т.N., Piskuniva L.F., X-Ray Fluorescence silicate analysis, Nauka, Noviosibirsk, 1984. (in Russian)
[2] Puri S, Shahi J.S., Chand B., Garg M.L., Singh N., Trehan P.N., Nath N. Elemental analysis of polymetallic nodules from the central Indian basin: a study using EDXRF // X-ray Spectrometry. 1998. V. 27. P. 105-110.
[3] Feret F. Routine analysis of iron ores by X-ray spectrometry // Spectrochimica Acta. 1982. V. 37B. P. 349-357.
[4] Murray J., Balistrieri L., Paul B. The oxidation state of manganese in marine sediments and ferromanganese nodules // Geochimica et Cosmochimica Acta. 1984. V. 48. Issue 5. P. 1237-1247.
[5] Andrade S., Hypolito R., Ulbrich H., Silva M., Iron (II) oxide determination in rocks and minerals, Chemical Geology. 2002; 182, 85.
[6] Yokoyama T., Nakamura E., Precise determination of ferrous iron in silicate rocks, Geochimica et Cosmochimica Acta. 2002; 66, 1085.
[7] Jayasuriya K.D., O’Neill H., Berry A.J., Campbell S.J., A Mössbauer study of the
oxidation state of iron in silicate melts, Amer. Miner. 2003; 67, 213.
[8] Bajt S., Sutton S.R., Delaney J.S., X-ay microprobe analysis of iron oxidation states in silicates and oxides using X-ray absorption near edge structure (XANES), Geochimica et Cosmochimica Acta. 1994; 58, 5209.
[9] Barinsky R.L., Nefedov V.I., X-ray spectral determination of atomic charge in molecules, Nauka, Moscow, 1966. (in Russian)
[10] Blokhin M.A., The Physics of X-Rays (English translation U.S. Atomic Energy Commission, AEC-TR-4502), 1957.
[11] Tsutsumi K., Nakamori H., Ichikawa K. X-ray Mn Kb emission spectra of manganese oxides and manganates // Physical review. 1976. V. 13. N 2. P. 930-933.
[12] Narbutt K.I., X-ray spectra of iron atoms in minerals, Phys. Chem. Minerals. 1980; 5, 285.
[13] Albee A.L., Chodos A.A., Semiqantitative electron microprobe determination of Fe2+/Fe3+ and Mn2+/Mn3+ in oxides and silicates and its application to petrologic problems, Amer. Miner. 1970; 55, 103.
[14] Taskaev V.I., Struchaeva G.G., Pyatkov А.G., Determination of Fe2+ and Fe3+ concentrations in pyroxene by x-ray spectral microanalysis, in Methods of x-ray spectral analysis (Ed V.P. Afonin), Nauka, Novosibirsk, 1986, pp. 154-158. (in Russian)
[15] Legkova G.V., Voikevich V.G., Sharkin О.P., Microprobe determination of Fe2+ and Fe3+ contents in amphiboles, Mineral. Journal. 1982; 4, 90. (in Russian)
V. Chubarov and A. Finkelshtein
EXRS2010 Conference Proceedings 91
[16] Höffer H.E., Brey G.P., The iron oxidation state of garnet by electron microprobe; Its determination with the flank method combined with major-element analysis, Amer. Miner. 2007; 92, 873.
[17] Fanlo I., Gervilla F., Mateo E., Irusta S., X-ray photoelectron spectroscopy characterization of natural chromite from Mercedita Mine (Eastern Cuba): quantification of the Fe3+/Fe2+ ratio, Eur. J. Mineral. 2008; 20, 125.
[18] Filippov М.N., Kupriyanova Т.А., Lyamina О.I., Simultaneous Determination of the
Concentration of Elements and Their Speciation in Solid Samples Using X-ray Fluorescence Spectrometry, Journ. Analyt. Chemistry. 2001; 56, 817. (in Russian)
[19] Deluigi M.T., Tirao G., Stulz G., Dependence with the oxidation state of X-ray transition energies intensities and natural line widths of CrKβ spectra, Chemical
Physics. 2006; 325, 477.
[20] Sakurai K., Eba H., Chemical characterization using relative intensity of manganese Kβ’ and Kβ5 X-ray fluorescence, Nuclear Instrument and Methods in Physical Research B. 2003; 199, 391.
[21] Finkelshtein A.L., Chubarov V.M., X-ray fluorescence determination of the FeO/Fe2O3tot ratio in igneous rocks // X-ray spectrometry. 2010. V 39. P. 17-21.
[22] Govindaraju K., Compilation of working values and sample description for 383 Geostandards, Geostandards Newsletter. Special Issue. 1994; 18, 1.
[23] Reference samples of chemical composition of natural mineral substances: Method. Recommendations (Ed. N.V. Arnautov), UIGGM SB RAS, Novosibirsk, 1987. (in Russian)
[24] Thompson M. GeoPT1. International Proficiency Teat for Analytical Geochemistry Laboratories Round 1 (July 1996) / M.Thompson, P.J.Potts, P.C.Webb.
EXRS2010 Conference Proceedings 92
Vibrio harveyi bacteria under X-ray irradiation
P. Alifano2, G. Buccolieri3, V. Nassisi1, F. Paladini1, A. Talà2, S.M. Tredici2 and M.V. Siciliano1,3
1 Laboratorio di Elettronica Applicata e Strumentazione, LEAS, Dipartimento di Fisica, Università del Salento & INFN - Lecce, Via Provinciale Lecce-Monteroni, 73100 Lecce
- Italia Tel. +39 0832 297495, Fax. +39 0832 297482
2 Dipartimento Microbiologia, Di.S.Te.B.A., Università del Salento, via Provinciale Lecce-Monteroni, C.P. 193, 73100 Lecce - Italia
3 Dipartimento di Scienza dei Materiali, University of Salento, via Provinciale Lecce-
Monteroni, C.P. 193, 73100 Lecce – Italia
ABSTRACT The study of the interaction between ionizing radiations and living organisms in natural environments is of extreme interest for structural, mechanistic and evolutionary implications. To analyze this interaction under controlled laboratory conditions we used three photo-luminescent bacterial strains belonging to a new species evolutionary close to Vibrio harveyi sampled from a coastal cave (Ionian Sea) with high radon content that generates also X-ray. Survival of the bacterial strains was analyzed, in the light and in the dark, following a variety of genotoxic treatments including ethidium bromide treatment, UV (254 nm) and X-ray radiation exposure. For X-ray treatment, strains were irradiated by an X-ray flux generated by a vacuum tube applying an accelerating voltage of 10, 15 and 20 kV at different values of exposure times and doses. Results demonstrated that most of strains exhibited a high rate of survival after the UV exposure. All strains showed high capability of photoreactivation when grown in the presence of visible light following the exposure to UV. This capability was quite unexpected because these bacteria were sampled from a dark site without UV radiation. This leads to hypothesize that the photoreactivation process might have been evolved to repair also DNA lesions induced by radiations other than UV (e.g. X-ray) and that the luminescent bacteria might use their own light emission to carry out the photoreactivation.
I. INTRODUCTION Luminous vibrios are natural inhabitants of coastal waters [1]. Some luminous Vibrio species are pathogenic and can cause vibriosis, a serious infectious disease in both wild and cultured marine organisms [2]. In recent years, vibriosis has become one of the most important bacterial diseases in marine-cultured organisms [2–4]. Luminescence is controlled by the lux operon and is regulated in a cell density-dependent manner, termed quorum sensing or autoinduction, a response in target gene expression when extracellular signal molecules, called autoinducers, reach a critical concentration[5]. In this work, vibrio bacterial isolates were sampled from a dark site in a cave along the Ionian coast of Apulia, Italy near Otranto; 40°00′43″N 18°25′50″E
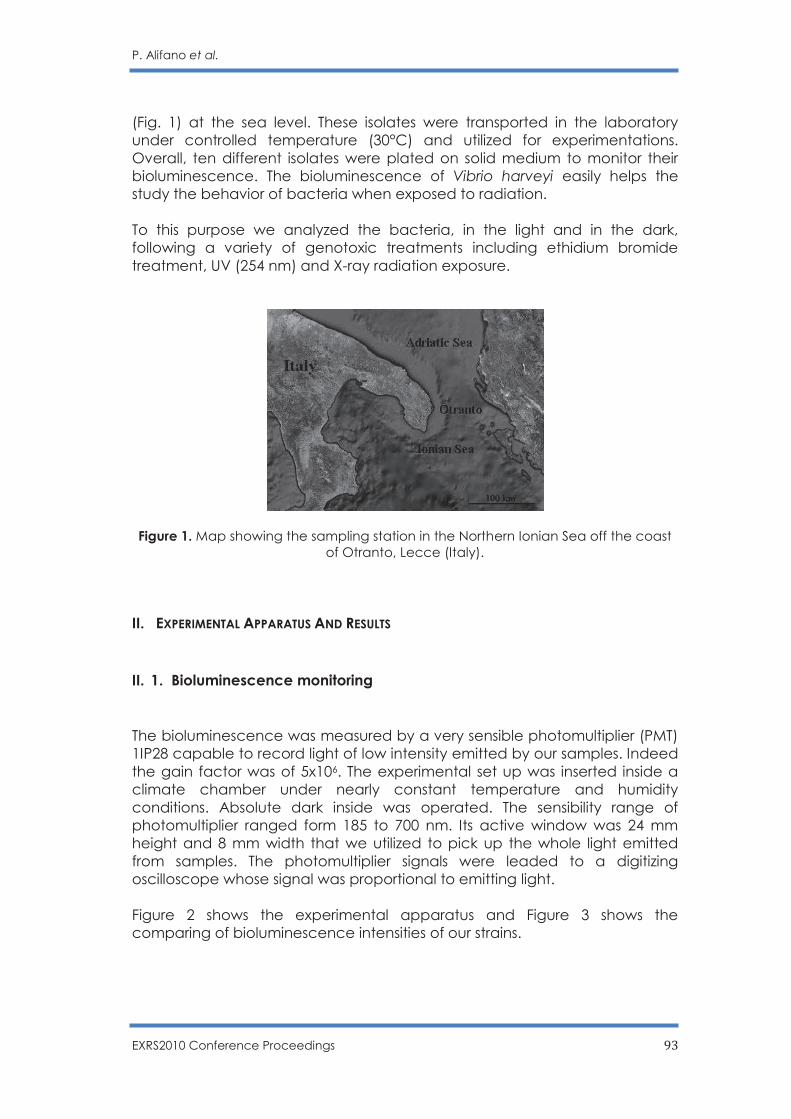
P. Alifano et al.
EXRS2010 Conference Proceedings 93
(Fig. 1) at the sea level. These isolates were transported in the laboratory under controlled temperature (30°C) and utilized for experimentations. Overall, ten different isolates were plated on solid medium to monitor their bioluminescence. The bioluminescence of Vibrio harveyi easily helps the study the behavior of bacteria when exposed to radiation. To this purpose we analyzed the bacteria, in the light and in the dark, following a variety of genotoxic treatments including ethidium bromide treatment, UV (254 nm) and X-ray radiation exposure.
Figure 1. Map showing the sampling station in the Northern Ionian Sea off the coast of Otranto, Lecce (Italy).
II. EXPERIMENTAL APPARATUS AND RESULTS
II. 1. Bioluminescence monitoring
The bioluminescence was measured by a very sensible photomultiplier (PMT) 1IP28 capable to record light of low intensity emitted by our samples. Indeed the gain factor was of 5x10⁶. The experimental set up was inserted inside a climate chamber under nearly constant temperature and humidity conditions. Absolute dark inside was operated. The sensibility range of photomultiplier ranged form 185 to 700 nm. Its active window was 24 mm height and 8 mm width that we utilized to pick up the whole light emitted from samples. The photomultiplier signals were leaded to a digitizing oscilloscope whose signal was proportional to emitting light. Figure 2 shows the experimental apparatus and Figure 3 shows the comparing of bioluminescence intensities of our strains.
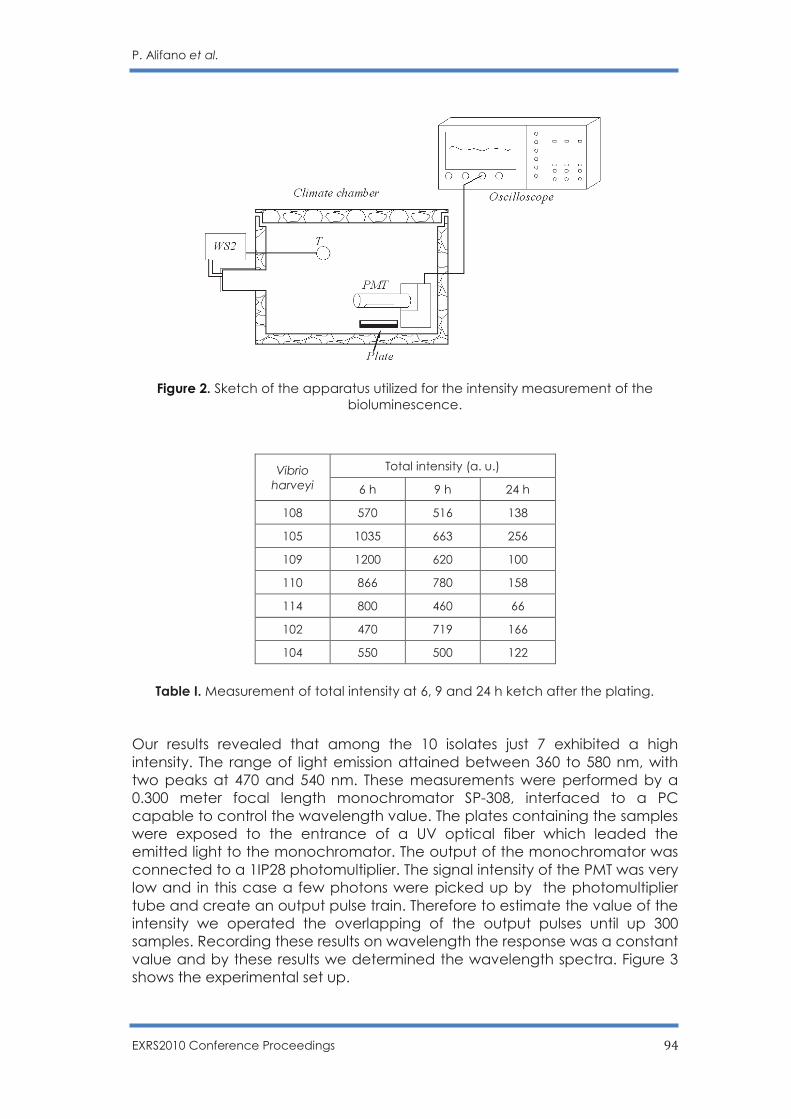
P. Alifano et al.
EXRS2010 Conference Proceedings 94
Figure 2. Sketch of the apparatus utilized for the intensity measurement of the bioluminescence.
Table I. Measurement of total intensity at 6, 9 and 24 h ketch after the plating. Our results revealed that among the 10 isolates just 7 exhibited a high intensity. The range of light emission attained between 360 to 580 nm, with two peaks at 470 and 540 nm. These measurements were performed by a 0.300 meter focal length monochromator SP-308, interfaced to a PC capable to control the wavelength value. The plates containing the samples were exposed to the entrance of a UV optical fiber which leaded the emitted light to the monochromator. The output of the monochromator was connected to a 1IP28 photomultiplier. The signal intensity of the PMT was very low and in this case a few photons were picked up by the photomultiplier tube and create an output pulse train. Therefore to estimate the value of the intensity we operated the overlapping of the output pulses until up 300 samples. Recording these results on wavelength the response was a constant value and by these results we determined the wavelength spectra. Figure 3 shows the experimental set up.
Vibrio harveyi
Total intensity (a. u.)
6 h 9 h 24 h
108 570 516 138
105 1035 663 256
109 1200 620 100
110 866 780 158
114 800 460 66
102 470 719 166
104 550 500 122
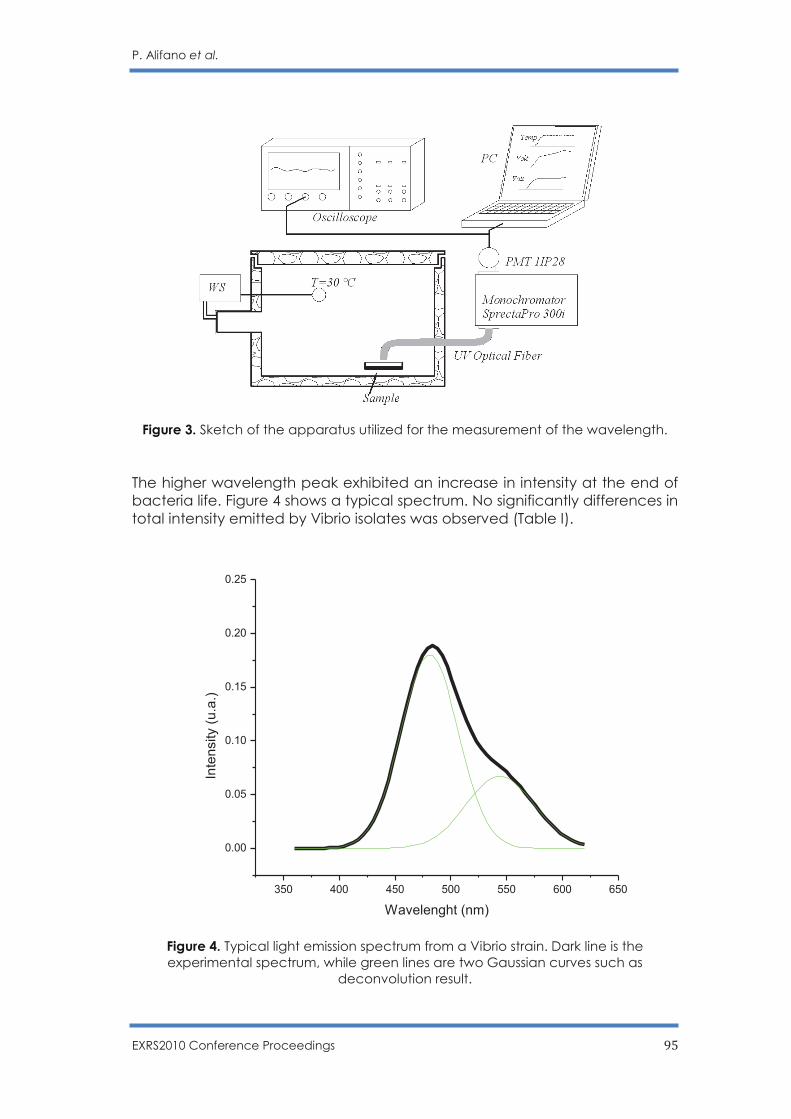
P. Alifano et al.
EXRS2010 Conference Proceedings 95
Figure 3. Sketch of the apparatus utilized for the measurement of the wavelength.
The higher wavelength peak exhibited an increase in intensity at the end of bacteria life. Figure 4 shows a typical spectrum. No significantly differences in total intensity emitted by Vibrio isolates was observed (Table I).
350 400 450 500 550 600 650
0.00
0.05
0.10
0.15
0.20
0.25
Inte
nsity (
u.a
.)
Wavelenght (nm)
Figure 4. Typical light emission spectrum from a Vibrio strain. Dark line is the experimental spectrum, while green lines are two Gaussian curves such as
deconvolution result.
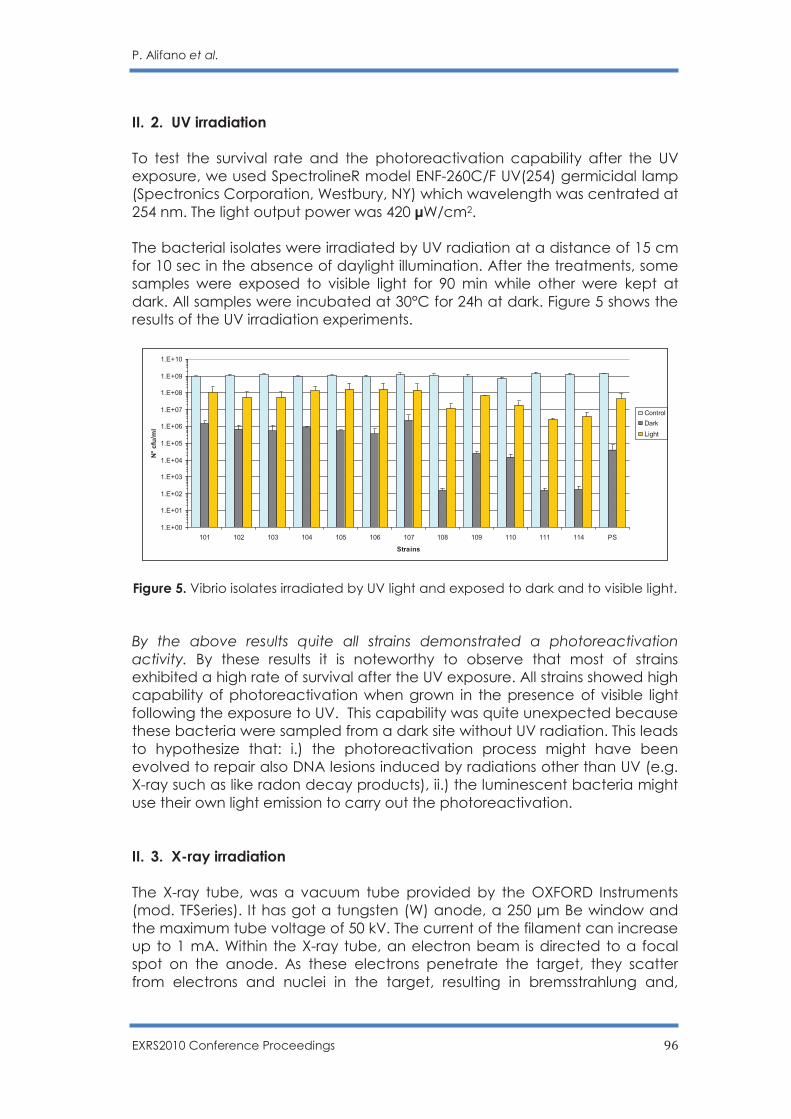
P. Alifano et al.
EXRS2010 Conference Proceedings 96
II. 2. UV irradiation To test the survival rate and the photoreactivation capability after the UV exposure, we used SpectrolineR model ENF-260C/F UV(254) germicidal lamp (Spectronics Corporation, Westbury, NY) which wavelength was centrated at 254 nm. The light output power was 420 μW/cm2. The bacterial isolates were irradiated by UV radiation at a distance of 15 cm for 10 sec in the absence of daylight illumination. After the treatments, some samples were exposed to visible light for 90 min while other were kept at dark. All samples were incubated at 30°C for 24h at dark. Figure 5 shows the results of the UV irradiation experiments.
Figure 5. Vibrio isolates irradiated by UV light and exposed to dark and to visible light. By the above results quite all strains demonstrated a photoreactivation activity. By these results it is noteworthy to observe that most of strains exhibited a high rate of survival after the UV exposure. All strains showed high capability of photoreactivation when grown in the presence of visible light following the exposure to UV. This capability was quite unexpected because these bacteria were sampled from a dark site without UV radiation. This leads to hypothesize that: i.) the photoreactivation process might have been evolved to repair also DNA lesions induced by radiations other than UV (e.g. X-ray such as like radon decay products), ii.) the luminescent bacteria might use their own light emission to carry out the photoreactivation. II. 3. X-ray irradiation The X-ray tube, was a vacuum tube provided by the OXFORD Instruments (mod. TFSeries). It has got a tungsten (W) anode, a 250 μm Be window and the maximum tube voltage of 50 kV. The current of the filament can increase up to 1 mA. Within the X-ray tube, an electron beam is directed to a focal spot on the anode. As these electrons penetrate the target, they scatter from electrons and nuclei in the target, resulting in bremsstrahlung and,
1.E+00
1.E+01
1.E+02
1.E+03
1.E+04
1.E+05
1.E+06
1.E+07
1.E+08
1.E+09
1.E+10
101 102 103 104 105 106 107 108 109 110 111 114 PS
Strains
N°
cfu
/ml
Control
Dark
Light
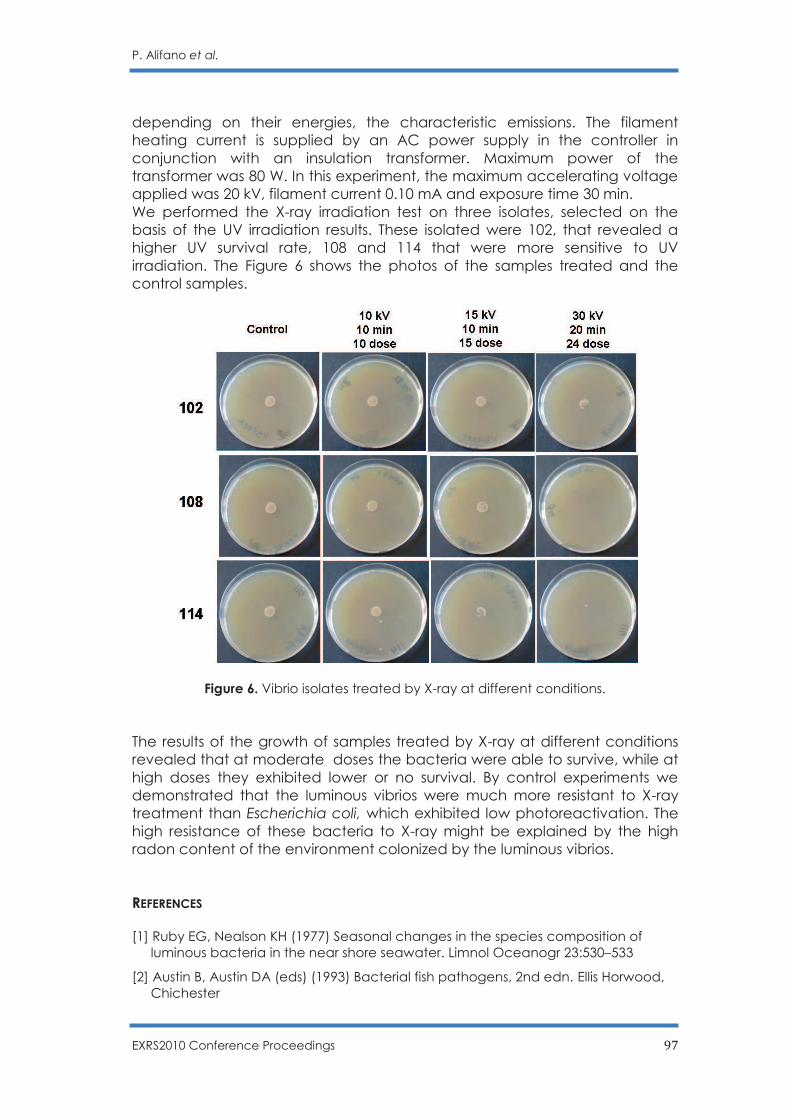
P. Alifano et al.
EXRS2010 Conference Proceedings 97
depending on their energies, the characteristic emissions. The filament heating current is supplied by an AC power supply in the controller in conjunction with an insulation transformer. Maximum power of the transformer was 80 W. In this experiment, the maximum accelerating voltage applied was 20 kV, filament current 0.10 mA and exposure time 30 min. We performed the X-ray irradiation test on three isolates, selected on the basis of the UV irradiation results. These isolated were 102, that revealed a higher UV survival rate, 108 and 114 that were more sensitive to UV irradiation. The Figure 6 shows the photos of the samples treated and the control samples.
Figure 6. Vibrio isolates treated by X-ray at different conditions. The results of the growth of samples treated by X-ray at different conditions revealed that at moderate doses the bacteria were able to survive, while at high doses they exhibited lower or no survival. By control experiments we demonstrated that the luminous vibrios were much more resistant to X-ray treatment than Escherichia coli, which exhibited low photoreactivation. The high resistance of these bacteria to X-ray might be explained by the high radon content of the environment colonized by the luminous vibrios. REFERENCES [1] Ruby EG, Nealson KH (1977) Seasonal changes in the species composition of
luminous bacteria in the near shore seawater. Limnol Oceanogr 23:530–533
[2] Austin B, Austin DA (eds) (1993) Bacterial fish pathogens, 2nd edn. Ellis Horwood, Chichester

P. Alifano et al.
EXRS2010 Conference Proceedings 98
[3] Austin B, Austin DA (eds) (1999) Bacterial fish pathogens: disease of farmed and wild fish, 3rd edn. Springer-Verlag KG, Berlin, Germany
[4] Zorrilla I, Arijo S, Chabrillon M, Diaz P, Martinez-Manzanares E, Balebona MC, Morinigo MA (2002) Vibrio species isolated from diseased farmed sole, Solea senegalensis. J Fish Dis 26:103–108
[5] Defoirdt T, Boon N, Sorgeloos P, Verstraete W, Bossier P. 2008. Quorum sensing and quorum quenching in Vibrio harveyi: lessons learned from in vivo work. ISME J. 2008 Jan; 2(1):19-26.
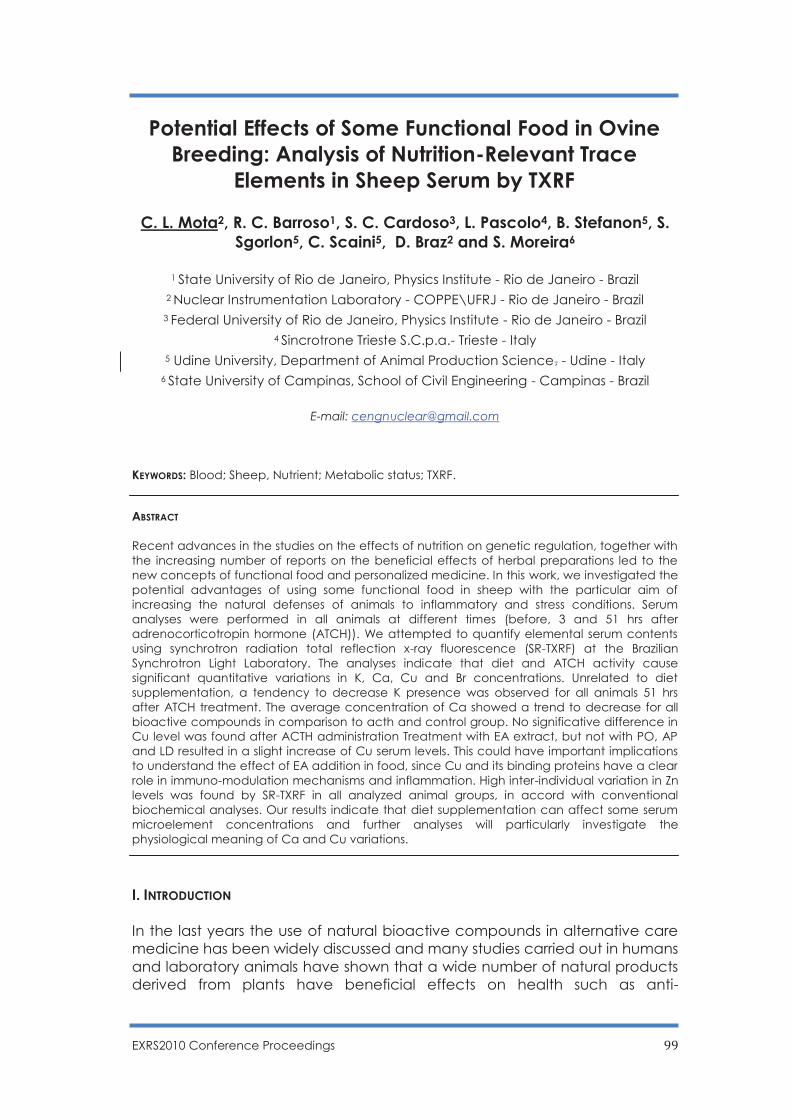
EXRS2010 Conference Proceedings 99
Potential Effects of Some Functional Food in Ovine Breeding: Analysis of Nutrition-Relevant Trace
Elements in Sheep Serum by TXRF
C. L. Mota2, R. C. Barroso1, S. C. Cardoso3, L. Pascolo4, B. Stefanon5, S. Sgorlon5, C. Scaini5, D. Braz2 and S. Moreira6
1 State University of Rio de Janeiro, Physics Institute - Rio de Janeiro - Brazil
2 Nuclear Instrumentation Laboratory - COPPE\UFRJ - Rio de Janeiro - Brazil 3 Federal University of Rio de Janeiro, Physics Institute - Rio de Janeiro - Brazil
4 Sincrotrone Trieste S.C.p.a.- Trieste - Italy 5 Udine University, Department of Animal Production Science, - Udine - Italy
6 State University of Campinas, School of Civil Engineering - Campinas - Brazil
E-mail: [email protected]
KEYWORDS: Blood; Sheep, Nutrient; Metabolic status; TXRF.
ABSTRACT Recent advances in the studies on the effects of nutrition on genetic regulation, together with the increasing number of reports on the beneficial effects of herbal preparations led to the new concepts of functional food and personalized medicine. In this work, we investigated the potential advantages of using some functional food in sheep with the particular aim of increasing the natural defenses of animals to inflammatory and stress conditions. Serum analyses were performed in all animals at different times (before, 3 and 51 hrs after adrenocorticotropin hormone (ATCH)). We attempted to quantify elemental serum contents using synchrotron radiation total reflection x-ray fluorescence (SR-TXRF) at the Brazilian Synchrotron Light Laboratory. The analyses indicate that diet and ATCH activity cause significant quantitative variations in K, Ca, Cu and Br concentrations. Unrelated to diet supplementation, a tendency to decrease K presence was observed for all animals 51 hrs after ATCH treatment. The average concentration of Ca showed a trend to decrease for all bioactive compounds in comparison to acth and control group. No significative difference in Cu level was found after ACTH administration Treatment with EA extract, but not with PO, AP and LD resulted in a slight increase of Cu serum levels. This could have important implications to understand the effect of EA addition in food, since Cu and its binding proteins have a clear role in immuno-modulation mechanisms and inflammation. High inter-individual variation in Zn levels was found by SR-TXRF in all analyzed animal groups, in accord with conventional biochemical analyses. Our results indicate that diet supplementation can affect some serum microelement concentrations and further analyses will particularly investigate the physiological meaning of Ca and Cu variations.
I. INTRODUCTION In the last years the use of natural bioactive compounds in alternative care medicine has been widely discussed and many studies carried out in humans and laboratory animals have shown that a wide number of natural products derived from plants have beneficial effects on health such as anti-
C. L. Mota et al.
EXRS2010 Conference Proceedings 100
inflammatory, immunomodulatory, antioxidant, antimicrobial and anticancer properties[1-3]. Vegetables and fruits contain several functional molecules (pectines, polyphenoles, flavonoids, tannins, terpenoids, etc.) which activities have been plentifully investigated [4].
In animal production systems, the interest for these plants has grown, especially after the limitations imposed in the use of synthetic drugs that are not allowed in organic production and are under surveillance for conventional productions within the European Community [5]. Farm animals experience a large variety of challenges that can lead to metabolic, environmental or immune stress conditions [6, 7]. Furthermore, stress can result in an increased incidence of diseases or a loss of animal welfare [8, 9] and a consequent decrease of safety and quality of products.
Studies on ruminants have recently underlined the beneficial role of bioactive compounds in enhancing the endogenous defenses, regulating both gene expression and activity of key enzymes of animal antioxidant systems [10-14]. These preliminary results suggest that natural bioactive compounds can represent a valid alternative to antibiotics and synthetic anti-inflammatory drugs in the control of developing inflammation both for their anti-inflammatory and immunomodulatory activity, and for antimicrobial properties showed in different studies by plant extracts and essential oils [1, 15].
In order to monitor the effects on health of bioactive compounds in animals during farming, blood analyses are performed for known biochemical markers. In addition many blood chemical elements can be evaluated to check physiological conditions; variations in their concentrations may reflect for instance acid-base alterations, renal functionality, or responses to infections. At the same time minimal variations in blood element presence, although in the range of physiological normal values, may be useful to understand the individual responses to stress conditions or responses to drug treatments. Among the others, some microelements like Cu and Zn are recently receiving increased attentions due to the emerging large complexity of biological mechanism in which they are involved. In this work, we investigated the potential advantages of using some bioactive compounds in sheep with the particular aim of increasing the natural defenses of animals to inflammatory and stress conditions. For this purpose, groups of sheep under known feeding treatments, including either PolinaceaTM (PO), Echinacea angustifolia (EA), Andrographis paniculata (AP) or cortex of Larix decidua (LD) were subjected to a cortisol-induced stress, by ACTH injection.
The biological response to stress and the potential counteracting activity of functional compounds were investigated at a bloodstream level by monitoring biochemical markers and the concentration of some blood chemical elements. Thank to the quantitative sensitivity of TXRF also minimal variations were revealed thus suggesting the utility of this approach in combination with conventional analyses to investigate health state and to disclose new aspects in the influence of diet on the individual state and homeostatic regulation.
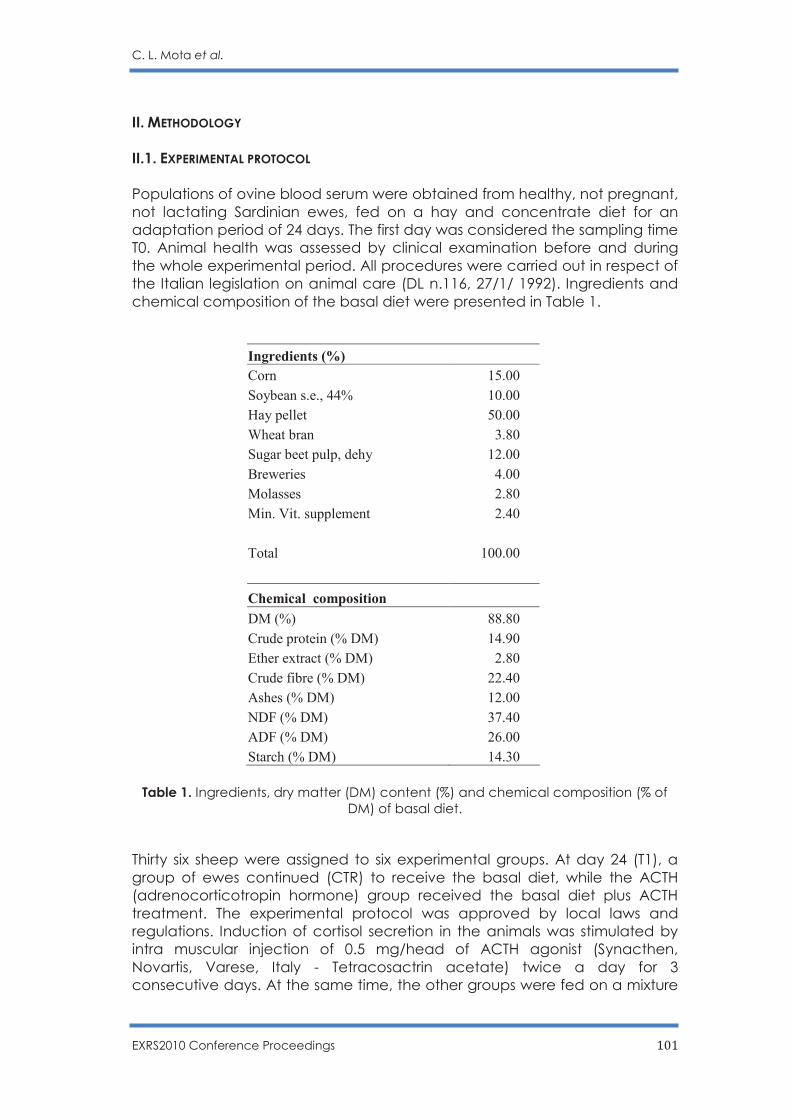
C. L. Mota et al.
EXRS2010 Conference Proceedings 101
II. METHODOLOGY II.1. EXPERIMENTAL PROTOCOL Populations of ovine blood serum were obtained from healthy, not pregnant, not lactating Sardinian ewes, fed on a hay and concentrate diet for an adaptation period of 24 days. The first day was considered the sampling time T0. Animal health was assessed by clinical examination before and during the whole experimental period. All procedures were carried out in respect of the Italian legislation on animal care (DL n.116, 27/1/ 1992). Ingredients and chemical composition of the basal diet were presented in Table 1.
Table 1. Ingredients, dry matter (DM) content (%) and chemical composition (% of DM) of basal diet.
Thirty six sheep were assigned to six experimental groups. At day 24 (T1), a group of ewes continued (CTR) to receive the basal diet, while the ACTH (adrenocorticotropin hormone) group received the basal diet plus ACTH treatment. The experimental protocol was approved by local laws and regulations. Induction of cortisol secretion in the animals was stimulated by intra muscular injection of 0.5 mg/head of ACTH agonist (Synacthen, Novartis, Varese, Italy - Tetracosactrin acetate) twice a day for 3 consecutive days. At the same time, the other groups were fed on a mixture
Ingredients (%)
Corn 15.00
Soybean s.e., 44% 10.00
Hay pellet 50.00
Wheat bran 3.80
Sugar beet pulp, dehy 12.00
Breweries 4.00
Molasses 2.80
Min. Vit. supplement 2.40
Total 100.00
Chemical composition
DM (%) 88.80
Crude protein (% DM) 14.90
Ether extract (% DM) 2.80
Crude fibre (% DM) 22.40
Ashes (% DM) 12.00
NDF (% DM) 37.40
ADF (% DM) 26.00
Starch (% DM) 14.30
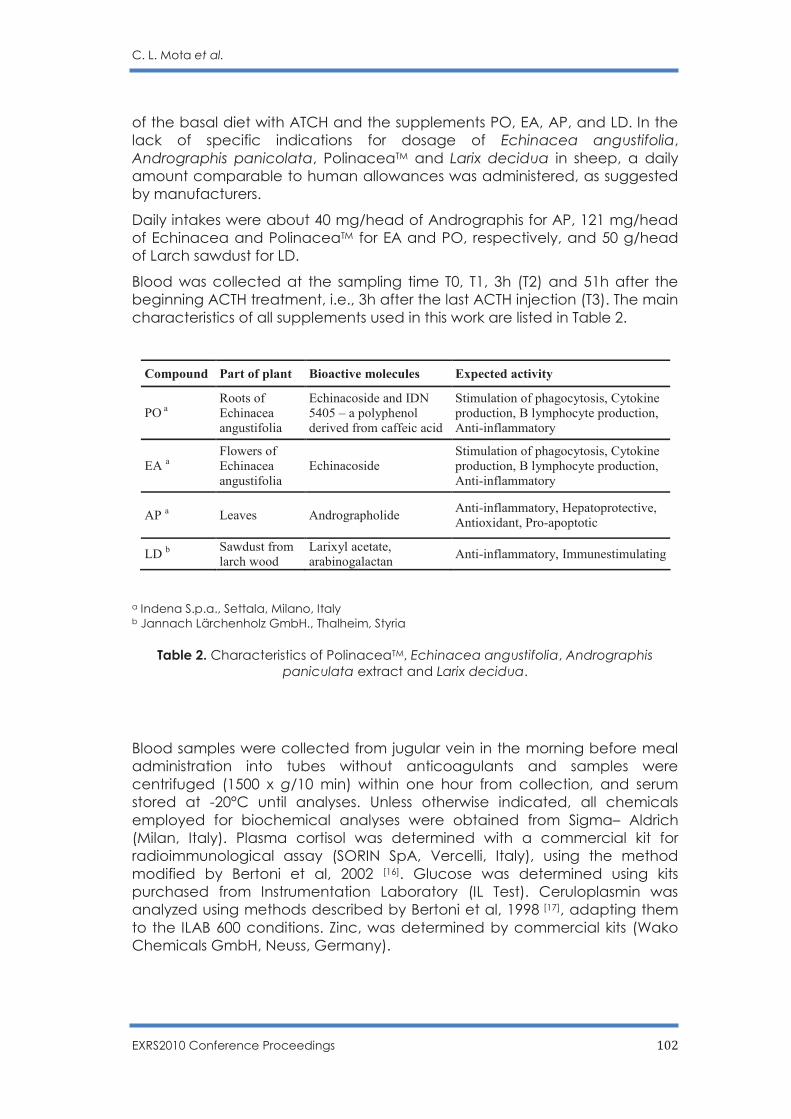
C. L. Mota et al.
EXRS2010 Conference Proceedings 102
of the basal diet with ATCH and the supplements PO, EA, AP, and LD. In the lack of specific indications for dosage of Echinacea angustifolia, Andrographis panicolata, PolinaceaTM and Larix decidua in sheep, a daily amount comparable to human allowances was administered, as suggested by manufacturers.
Daily intakes were about 40 mg/head of Andrographis for AP, 121 mg/head of Echinacea and PolinaceaTM for EA and PO, respectively, and 50 g/head of Larch sawdust for LD.
Blood was collected at the sampling time T0, T1, 3h (T2) and 51h after the beginning ACTH treatment, i.e., 3h after the last ACTH injection (T3). The main characteristics of all supplements used in this work are listed in Table 2.
a Indena S.p.a., Settala, Milano, Italy b Jannach Lärchenholz GmbH., Thalheim, Styria
Table 2. Characteristics of PolinaceaTM, Echinacea angustifolia, Andrographis paniculata extract and Larix decidua.
Blood samples were collected from jugular vein in the morning before meal administration into tubes without anticoagulants and samples were centrifuged (1500 x g/10 min) within one hour from collection, and serum stored at -20°C until analyses. Unless otherwise indicated, all chemicals employed for biochemical analyses were obtained from Sigma– Aldrich (Milan, Italy). Plasma cortisol was determined with a commercial kit for radioimmunological assay (SORIN SpA, Vercelli, Italy), using the method modified by Bertoni et al, 2002 [16]. Glucose was determined using kits purchased from Instrumentation Laboratory (IL Test). Ceruloplasmin was analyzed using methods described by Bertoni et al, 1998 [17], adapting them to the ILAB 600 conditions. Zinc, was determined by commercial kits (Wako Chemicals GmbH, Neuss, Germany).
Compound Part of plant Bioactive molecules Expected activity
PO a
Roots of
Echinacea
angustifolia
Echinacoside and IDN
5405 – a polyphenol
derived from caffeic acid
Stimulation of phagocytosis, Cytokine
production, B lymphocyte production,
Anti-inflammatory
EA a
Flowers of
Echinacea
angustifolia
Echinacoside
Stimulation of phagocytosis, Cytokine
production, B lymphocyte production,
Anti-inflammatory
AP a Leaves Andrographolide
Anti-inflammatory, Hepatoprotective,
Antioxidant, Pro-apoptotic
LD b
Sawdust from
larch wood
Larixyl acetate,
arabinogalactan Anti-inflammatory, Immunestimulating
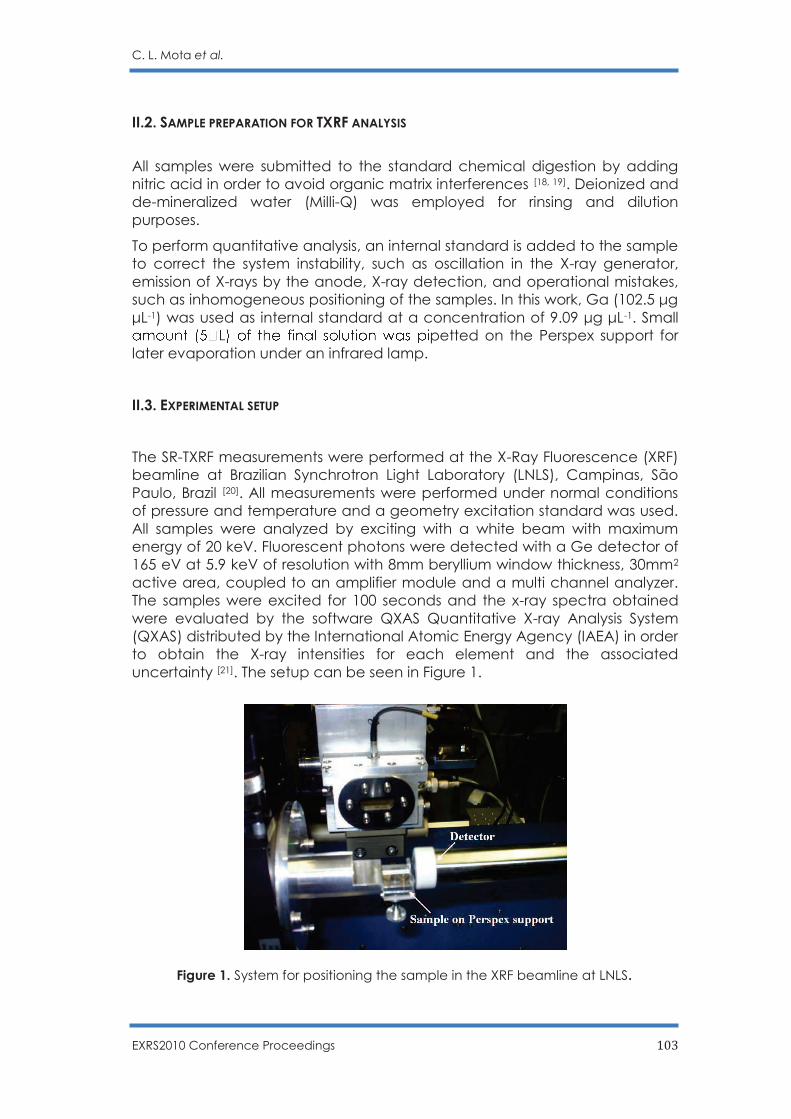
C. L. Mota et al.
EXRS2010 Conference Proceedings 103
II.2. SAMPLE PREPARATION FOR TXRF ANALYSIS
All samples were submitted to the standard chemical digestion by adding nitric acid in order to avoid organic matrix interferences [18, 19]. Deionized and de-mineralized water (Milli-Q) was employed for rinsing and dilution purposes.
To perform quantitative analysis, an internal standard is added to the sample to correct the system instability, such as oscillation in the X-ray generator, emission of X-rays by the anode, X-ray detection, and operational mistakes, such as inhomogeneous positioning of the samples. In this work, Ga (102.5 μg μL-1) was used as internal standard at a concentration of 9.09 μg μL-1. Small
petted on the Perspex support for later evaporation under an infrared lamp.
II.3. EXPERIMENTAL SETUP
The SR-TXRF measurements were performed at the X-Ray Fluorescence (XRF) beamline at Brazilian Synchrotron Light Laboratory (LNLS), Campinas, São Paulo, Brazil [20]. All measurements were performed under normal conditions of pressure and temperature and a geometry excitation standard was used. All samples were analyzed by exciting with a white beam with maximum energy of 20 keV. Fluorescent photons were detected with a Ge detector of 165 eV at 5.9 keV of resolution with 8mm beryllium window thickness, 30mm2 active area, coupled to an amplifier module and a multi channel analyzer. The samples were excited for 100 seconds and the x-ray spectra obtained were evaluated by the software QXAS Quantitative X-ray Analysis System (QXAS) distributed by the International Atomic Energy Agency (IAEA) in order to obtain the X-ray intensities for each element and the associated uncertainty [21]. The setup can be seen in Figure 1.
Figure 1. System for positioning the sample in the XRF beamline at LNLS.
C. L. Mota et al.
EXRS2010 Conference Proceedings 104
II.4. QUANTITATIVE ANALYSIS
In the TXRF technique, there is not any occurrence of the absorption effect and enhancement as in EDXRF or WDXRF and so, it is not necessary to correct the matrix effect due to the small thickness of the sample and high energy of the X-rays usually used for the excitation [22, 23]. Therefore, the quantitative analysis is performed with the equation:
iii CSI = (1)
where Ii is the net intensity of theX-rays (cps) of the characteristicK or L line of the element i; Ci is the concentration (ppm or mg.mL-1) of the element i; and Si is the elementary sensitivity of the system for the element i (cps/ppm).
Through Equation (1), the relationship between the intensity of the element i and the internal standard (Ga) can be established:
Ga
i
Ga
i
Ga
i
C
C
S
S
I
I=
(2)
The concentration of the element of interest is calculated using the equation:
R
Ga
Ga
ii
S
C
I
IC =
(3) where: is the relative sensitivity (in relation to the element used as
internal standard).
As there exists a high mathematical correlation between the elementary sensitivities and the atomic numbers of the elements, it is possible to estimate the sensitivity for an element detected in the sample and not contained in the standard solution, based on the elementary sensitivities of the elements contained in the standard solution and, consequently, to estimate its concentration in the sample. II.5. STATISTICAL ANALYSIS Biochemical data were analyzed using mixed model analysis according to the following model: Yij = μ + Ti + Pj + (TxP)ij + ij Where Yij is the response variable, μ is the overall mean of the population, Ti is the mean of dietary treatment (i = 1 to 6), Pj is the mean effect of sampling time (j = 1 to 3) with sampling as a repeated factor, (TxP)ij is the interaction treatment and sampling and εij is the unexplained residual element assumed to be independent and normally distributed. Computational data was performed using the repeated measure statement of the SPSS (1997) [24],
Ga
iR
S
SS =
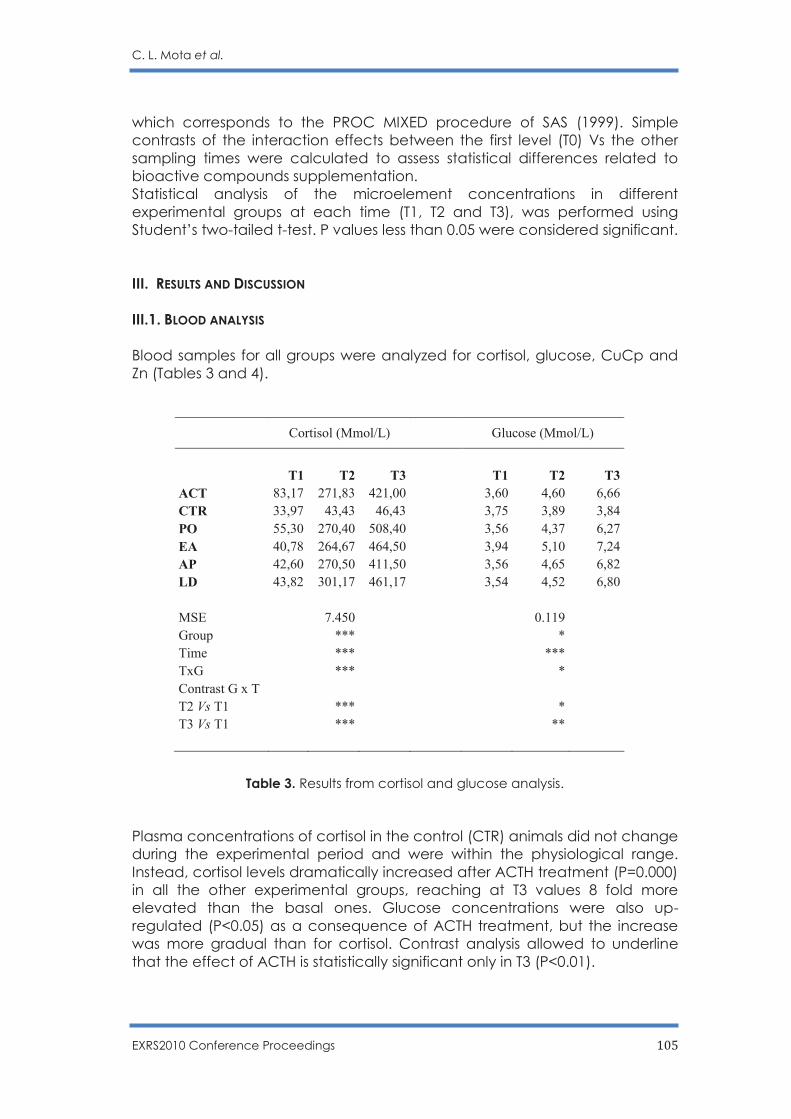
C. L. Mota et al.
EXRS2010 Conference Proceedings 105
which corresponds to the PROC MIXED procedure of SAS (1999). Simple contrasts of the interaction effects between the first level (T0) Vs the other sampling times were calculated to assess statistical differences related to bioactive compounds supplementation. Statistical analysis of the microelement concentrations in different experimental groups at each time (T1, T2 and T3), was performed using Student’s two-tailed t-test. P values less than 0.05 were considered significant. III. RESULTS AND DISCUSSION III.1. BLOOD ANALYSIS Blood samples for all groups were analyzed for cortisol, glucose, CuCp and Zn (Tables 3 and 4).
Table 3. Results from cortisol and glucose analysis.
Plasma concentrations of cortisol in the control (CTR) animals did not change during the experimental period and were within the physiological range. Instead, cortisol levels dramatically increased after ACTH treatment (P=0.000) in all the other experimental groups, reaching at T3 values 8 fold more elevated than the basal ones. Glucose concentrations were also up-regulated (P<0.05) as a consequence of ACTH treatment, but the increase was more gradual than for cortisol. Contrast analysis allowed to underline that the effect of ACTH is statistically significant only in T3 (P<0.01).
Cortisol (Mmol/L) Glucose (Mmol/L)
T1 T2 T3 T1 T2 T3
ACT 83,17 271,83 421,00 3,60 4,60 6,66
CTR 33,97 43,43 46,43 3,75 3,89 3,84
PO 55,30 270,40 508,40 3,56 4,37 6,27
EA 40,78 264,67 464,50 3,94 5,10 7,24
AP 42,60 270,50 411,50 3,56 4,65 6,82
LD 43,82 301,17 461,17 3,54 4,52 6,80
MSE 7.450 0.119
Group *** *
Time *** ***
TxG *** *
Contrast G x T
T2 Vs T1 *** *
T3 Vs T1 *** **

C. L. Mota et al.
EXRS2010 Conference Proceedings 106
Table 4. Results from CuCp and Zn analysis.
CuCp did not significantly vary either with time of sampling or with group (Table 4), but a clear trend is evident from data reported in the table. Animals of EA group showed higher concentrations of this plasma protein in all the times of sampling.
Although the variations do not result statistically significant by multivariate analyses due to a certain inter-individual variability, the trend seems to indicate that EA may have cryptic effects on this parameter, which usually is increased by stress conditions and inflammatory events. However, since the changes are in a non pathological range, the CuCp increase may reflect an unknown mechanism of action of the drug and needs further investigations.
Zn concentrations significantly decreased between time of sampling in ACT, AP, EA, LD groups, being influenced by ACTH treatment [25-27]. On the contrary, PO group showed the same trend of CTR group, keeping more elevated probably due to the antinflammatory properties of this compound that counteract the ACTH effect An high inter-individual variation (up to 40%) is however revealed by the analyses.
III.2. TXRF ANALYSIS Figure 2 shows typical x-ray spectra of serum samples. The result for the relative sensitivities (SR = Si/Ss ) with the corresponding fittings for the K serie is shown in figure 3.
The major elements K, Ca, Cu and Br were found in all the analyzed samples. Figures 2 to 5 show the average concentrations found to for each elements, respectively, at each time (T1, T2 and T3) for each bioactive compounds
CuCp (mM/L) Zn (mM/L)
T1 T2 T3 T1 T2 T3
ACT 2,76 2,96 3,26 12,26 12,67 8,37
CTR 2,72 2,85 2,90 12,41 11,45 11,45
PO 2,85 3,08 3,22 12,71 11,90 11,32
EA 4,02 3,63 3,66 12,28 12,09 10,42
AP 2,69 2,87 2,92 11,86 10,88 9,36
LD 2,75 3,07 3,10 12,40 12,89 9,80
MSE 0.104 0.227
Group NS NS
Time NS ***
TxG NS *
Contrast G x T
T2 Vs T1 NS NS
T3 Vs T1 NS NS
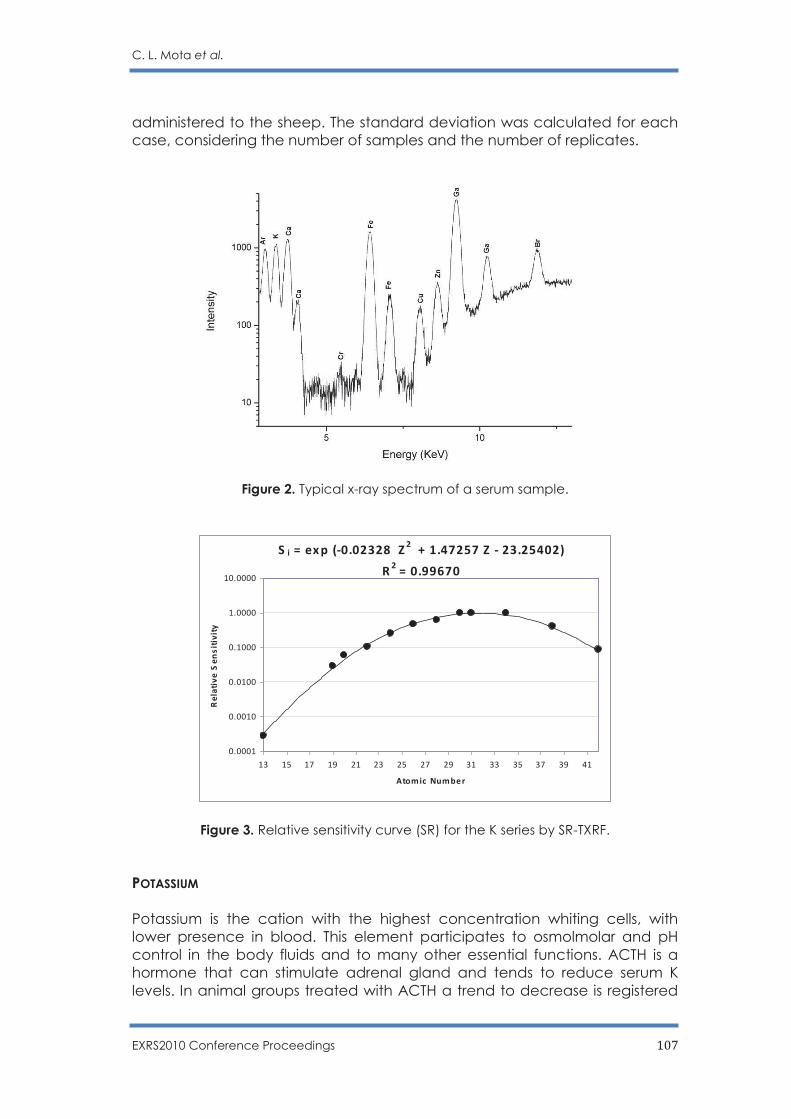
C. L. Mota et al.
EXRS2010 Conference Proceedings 107
administered to the sheep. The standard deviation was calculated for each case, considering the number of samples and the number of replicates.
Figure 2. Typical x-ray spectrum of a serum sample.
Figure 3. Relative sensitivity curve (SR) for the K series by SR-TXRF. POTASSIUM Potassium is the cation with the highest concentration whiting cells, with lower presence in blood. This element participates to osmolmolar and pH control in the body fluids and to many other essential functions. ACTH is a hormone that can stimulate adrenal gland and tends to reduce serum K levels. In animal groups treated with ACTH a trend to decrease is registered
S i = ex p (-0.02328 Z2 + 1.47257 Z - 23.25402)
R2
= 0.99670
0.0001
0.0010
0.0100
0.1000
1.0000
10.0000
13 15 17 19 21 23 25 27 29 31 33 35 37 39 41
Atomic Number
Re
lati
ve
Se
ns
itiv
ity
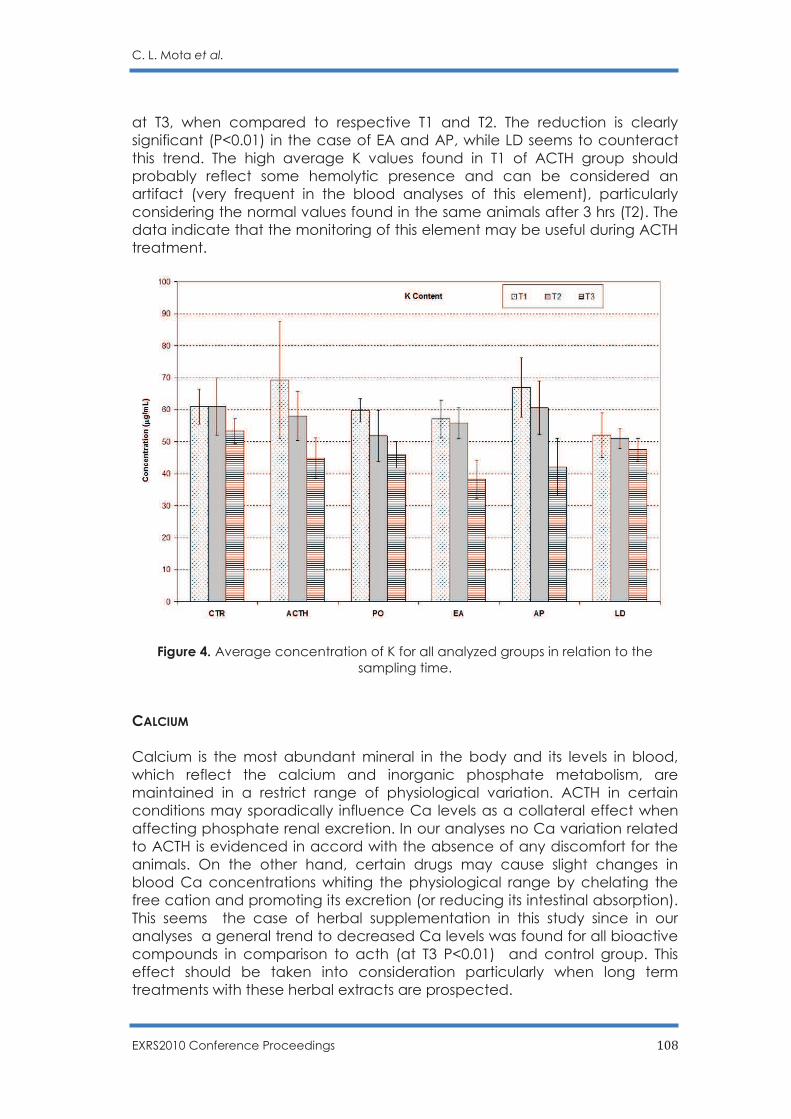
C. L. Mota et al.
EXRS2010 Conference Proceedings 108
at T3, when compared to respective T1 and T2. The reduction is clearly significant (P<0.01) in the case of EA and AP, while LD seems to counteract this trend. The high average K values found in T1 of ACTH group should probably reflect some hemolytic presence and can be considered an artifact (very frequent in the blood analyses of this element), particularly considering the normal values found in the same animals after 3 hrs (T2). The data indicate that the monitoring of this element may be useful during ACTH treatment.
Figure 4. Average concentration of K for all analyzed groups in relation to the sampling time.
CALCIUM Calcium is the most abundant mineral in the body and its levels in blood, which reflect the calcium and inorganic phosphate metabolism, are maintained in a restrict range of physiological variation. ACTH in certain conditions may sporadically influence Ca levels as a collateral effect when affecting phosphate renal excretion. In our analyses no Ca variation related to ACTH is evidenced in accord with the absence of any discomfort for the animals. On the other hand, certain drugs may cause slight changes in blood Ca concentrations whiting the physiological range by chelating the free cation and promoting its excretion (or reducing its intestinal absorption). This seems the case of herbal supplementation in this study since in our analyses a general trend to decreased Ca levels was found for all bioactive compounds in comparison to acth (at T3 P<0.01) and control group. This effect should be taken into consideration particularly when long term treatments with these herbal extracts are prospected.
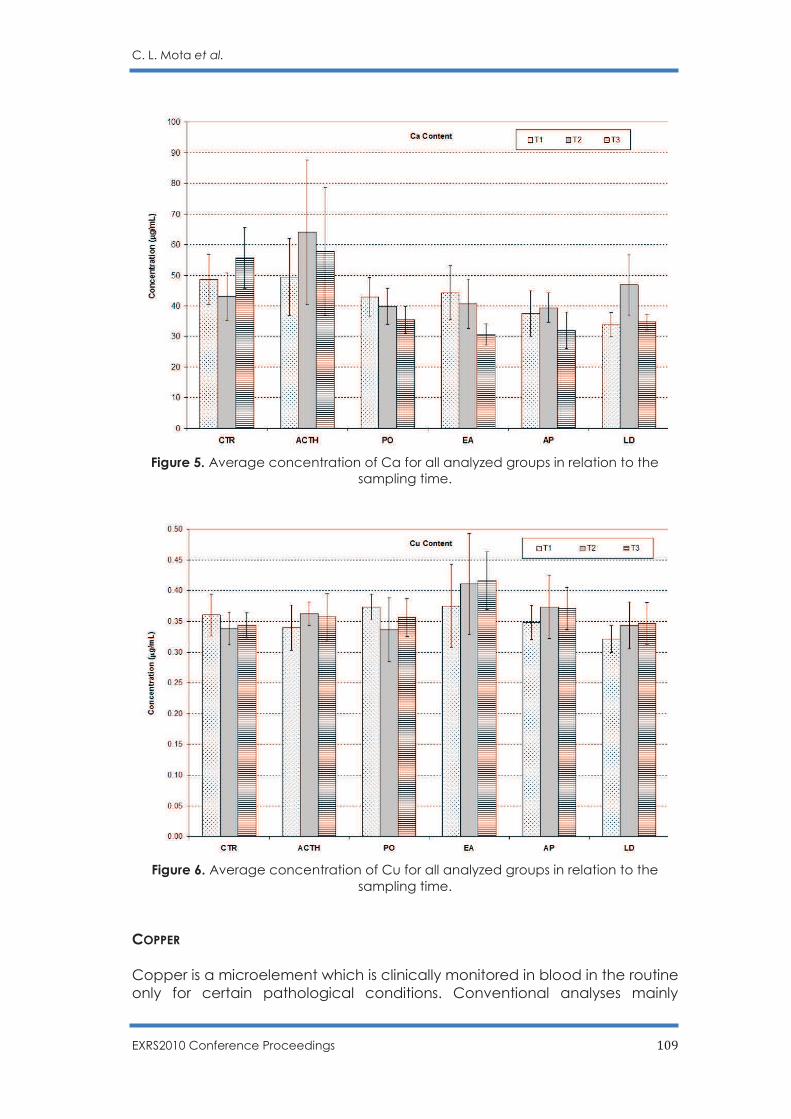
C. L. Mota et al.
EXRS2010 Conference Proceedings 109
Figure 5. Average concentration of Ca for all analyzed groups in relation to the sampling time.
Figure 6. Average concentration of Cu for all analyzed groups in relation to the sampling time.
COPPER Copper is a microelement which is clinically monitored in blood in the routine only for certain pathological conditions. Conventional analyses mainly
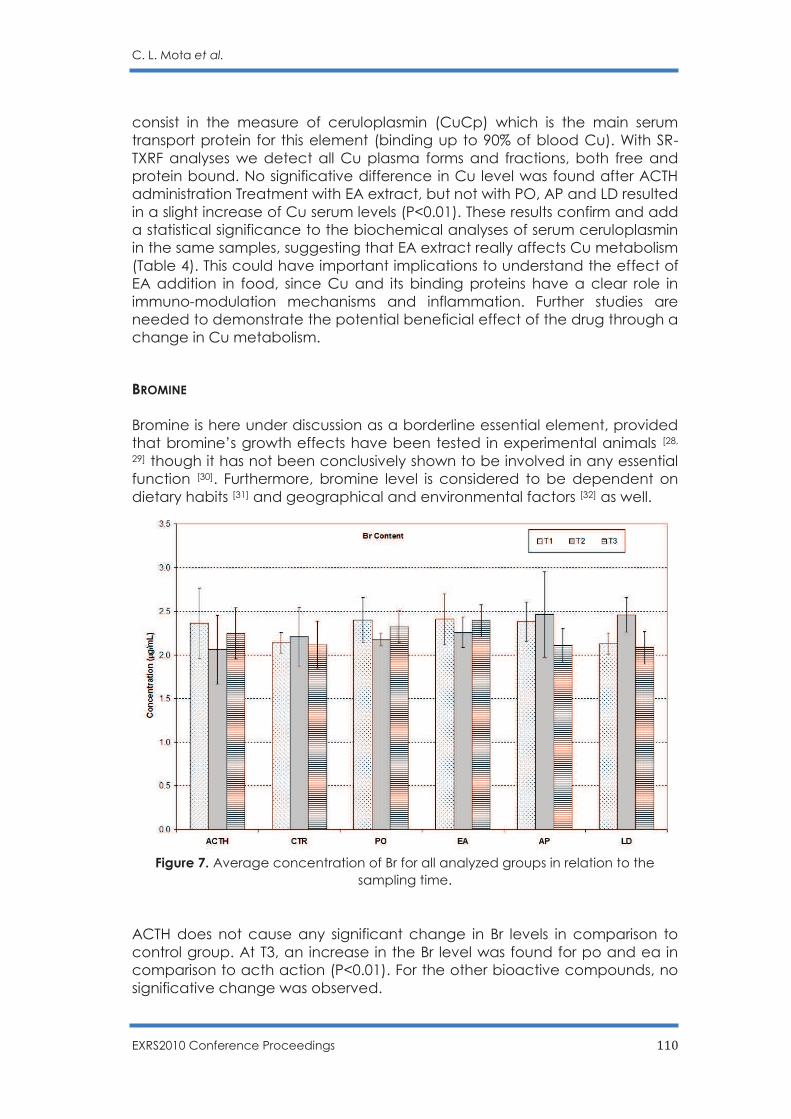
C. L. Mota et al.
EXRS2010 Conference Proceedings 110
consist in the measure of ceruloplasmin (CuCp) which is the main serum transport protein for this element (binding up to 90% of blood Cu). With SR-TXRF analyses we detect all Cu plasma forms and fractions, both free and protein bound. No significative difference in Cu level was found after ACTH administration Treatment with EA extract, but not with PO, AP and LD resulted in a slight increase of Cu serum levels (P<0.01). These results confirm and add a statistical significance to the biochemical analyses of serum ceruloplasmin in the same samples, suggesting that EA extract really affects Cu metabolism (Table 4). This could have important implications to understand the effect of EA addition in food, since Cu and its binding proteins have a clear role in immuno-modulation mechanisms and inflammation. Further studies are needed to demonstrate the potential beneficial effect of the drug through a change in Cu metabolism.
BROMINE Bromine is here under discussion as a borderline essential element, provided that bromine’s growth effects have been tested in experimental animals [28,
29] though it has not been conclusively shown to be involved in any essential function [30]. Furthermore, bromine level is considered to be dependent on dietary habits [31] and geographical and environmental factors [32] as well.
Figure 7. Average concentration of Br for all analyzed groups in relation to the sampling time.
ACTH does not cause any significant change in Br levels in comparison to control group. At T3, an increase in the Br level was found for po and ea in comparison to acth action (P<0.01). For the other bioactive compounds, no significative change was observed.
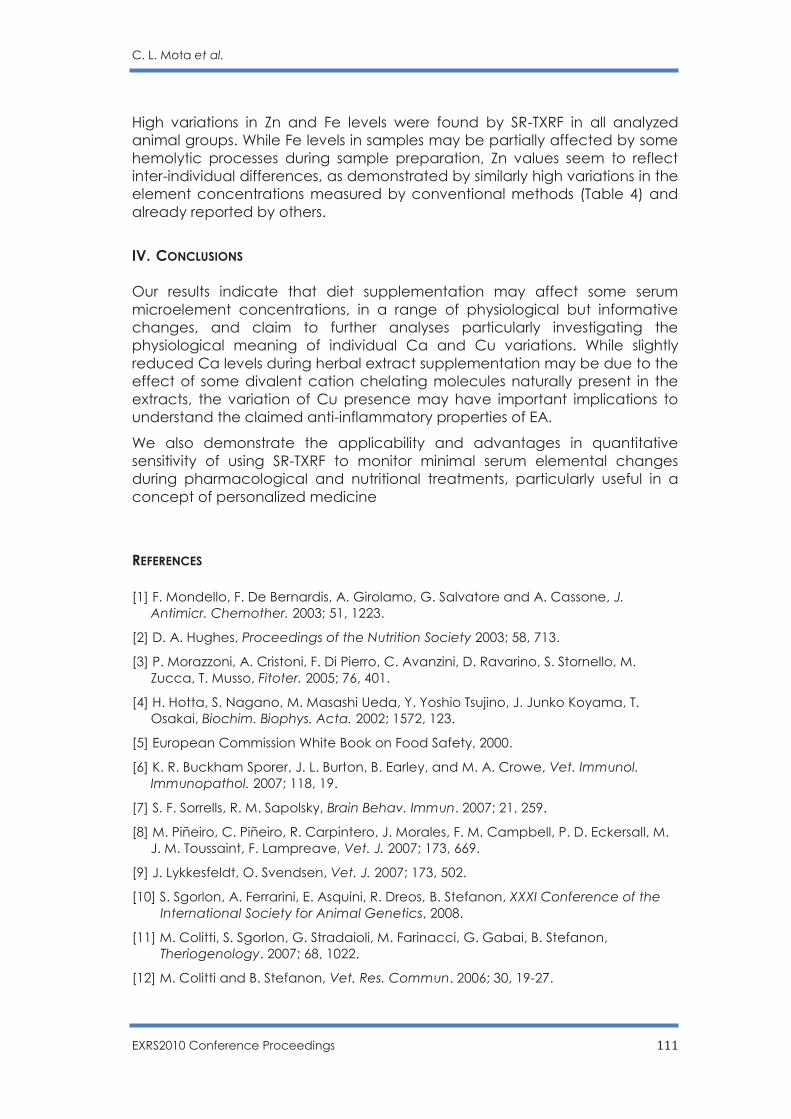
C. L. Mota et al.
EXRS2010 Conference Proceedings 111
High variations in Zn and Fe levels were found by SR-TXRF in all analyzed animal groups. While Fe levels in samples may be partially affected by some hemolytic processes during sample preparation, Zn values seem to reflect inter-individual differences, as demonstrated by similarly high variations in the element concentrations measured by conventional methods (Table 4) and already reported by others.
IV. CONCLUSIONS
Our results indicate that diet supplementation may affect some serum microelement concentrations, in a range of physiological but informative changes, and claim to further analyses particularly investigating the physiological meaning of individual Ca and Cu variations. While slightly reduced Ca levels during herbal extract supplementation may be due to the effect of some divalent cation chelating molecules naturally present in the extracts, the variation of Cu presence may have important implications to understand the claimed anti-inflammatory properties of EA.
We also demonstrate the applicability and advantages in quantitative sensitivity of using SR-TXRF to monitor minimal serum elemental changes during pharmacological and nutritional treatments, particularly useful in a concept of personalized medicine
REFERENCES
[1] F. Mondello, F. De Bernardis, A. Girolamo, G. Salvatore and A. Cassone, J.
Antimicr. Chemother. 2003; 51, 1223.
[2] D. A. Hughes, Proceedings of the Nutrition Society 2003; 58, 713.
[3] P. Morazzoni, A. Cristoni, F. Di Pierro, C. Avanzini, D. Ravarino, S. Stornello, M. Zucca, T. Musso, Fitoter. 2005; 76, 401.
[4] H. Hotta, S. Nagano, M. Masashi Ueda, Y. Yoshio Tsujino, J. Junko Koyama, T. Osakai, Biochim. Biophys. Acta. 2002; 1572, 123.
[5] European Commission White Book on Food Safety, 2000.
[6] K. R. Buckham Sporer, J. L. Burton, B. Earley, and M. A. Crowe, Vet. Immunol. Immunopathol. 2007; 118, 19.
[7] S. F. Sorrells, R. M. Sapolsky, Brain Behav. Immun. 2007; 21, 259.
[8] M. Piñeiro, C. Piñeiro, R. Carpintero, J. Morales, F. M. Campbell, P. D. Eckersall, M. J. M. Toussaint, F. Lampreave, Vet. J. 2007; 173, 669.
[9] J. Lykkesfeldt, O. Svendsen, Vet. J. 2007; 173, 502.
[10] S. Sgorlon, A. Ferrarini, E. Asquini, R. Dreos, B. Stefanon, XXXI Conference of the
International Society for Animal Genetics, 2008.
[11] M. Colitti, S. Sgorlon, G. Stradaioli, M. Farinacci, G. Gabai, B. Stefanon, Theriogenology. 2007; 68, 1022.
[12] M. Colitti and B. Stefanon, Vet. Res. Commun. 2006; 30, 19-27.
C. L. Mota et al.
EXRS2010 Conference Proceedings 112
[13] S. Sgorlon, G. Stradaioli, D. Zanin, B. Stefanon, Small Rum. Res. 2005; 64, 143.
[14] B. Stefanon, S. Sgorlon, G. Gabai, Vet. Res. Commun. 2005; 29, 387.
[15] A. M. Tortorano, A. Prigitano, G. Dho, R. Piccinini, V. Daprà, M. A. Viviani, J. Antimicrob. Chemother. 2008; 61, 1312.
[16] G. Bertoni, R. Lombardelli, F. Piccioli-Cappelli, and J. Blum, Ital. J. Anim. Sci. 2002; 1, 127.
[17] G. Bertoni, E. Trevisi, L. Calamari, and R. Lombardelli, Zootec. Nutr. Anim. 1998; 24, 17.
[18] M. L. Carvalho, P. J. Custódio, U. Reus, A. Prange, Spectrochim. Acta Part B 2001; 56, 2175.
[19] L. M. P. Marcó & E. A. Hernández-Caraballo, Spectrochim. Acta Part B 2004; 59, 1077.
[20] C. A. Pérez, M. Radtke, H. J. Sánchez, H. Tolentino, R. T. Neuenshwander, W. Barg, M. Rubio, M. I. Silveira Bueno, I. M. Raimundo, J. R. Rohwedder, X-Ray Spectrom. 1999; 28, 320.
[21] QXAS. Manual for quantitative X-ray analysis system. IAEA. Vienna. 2005.
[22] A. Prange, Spectrochim. Acta B 1989; 44, 437.
[23] R. Klockenkämper, A. von Bohlen, Xray Spectrom. 1996; 25, 156.
[24] Statistical Package for Social Science, 1997. SPSS Advanced Statistics 7.5. SPSS Inc., Chicago, IL, USA.
[25] J. D. Arthington, S. D. Eicher, W. E. Kunkle, and F. G. Martin, J. Anim. Sci. 2003; 81, 1120.
[26] C. K. Cebra, J. R. Heidel, R. O. Crisman, B. V. Stang, J. Vet. Intern. Med. 2003; 17, 902.
[27] S. Sgorlon, M. Colitti, M. Farinacci, B. Gaspardo, B. Stefanon, Proceedings of 55th International Congress and Annual Meeting of the Society for Medicinal Plant Research 2007; 73, 838.
[28] J. Versieck, R. Cornelis, Anal. Chim. Acta 1980; 116, 217.
[29] T. Martinez , J. Lartigue, P. Avila-Perez, G. Zarazua, M. Navarrete, S. Tejeda and A. Ramírez, J. Radional. Nucl. Chem. 2004; 259, 511.
[30] N. M. Spyrou, Intern. Atom. Energy Agency 1972.
[31] L. O. Plantin, Intern. Atom. Energy Agency 1972.
[32] H. Sklavenitis & D. Comar, Intern. Atom. Energy Agency 1967.
EXRS2010 Conference Proceedings 113
Inorganic elements determination in laboratory animals whole blood samples by EDXRF technique
M. M. Redígolo1, R. O. Aguiar2, C. B. Zamboni2, M. A. Scapin1, V. L. R.
Salvador1, and I. M. Sato1
1 Instituto de Pesquisas Energéticas e Nucleares - Centro de Química e Meio Ambiente, Av. Prof. Lineu Prestes, 2242 – Cidade Universitária - 05508-000 São
Paulo, SP Brazil
2 Instituto de Pesquisas Energéticas e Nucleares - Centro do Reator de Pesquisas, Av. Prof. Lineu Prestes, 2242 – Cidade Universitária - 05508-000 São Paulo, SP Brazil
E-mail: [email protected], [email protected]
Keywords: x-ray fluorescence, whole blood analysis, golden hamster, interval reference values
ABSTRACT Trace elements are of great importance to animal physiology. They activate and inhibit several enzymatic reactions, control permeability of cellular membranes and are co-factors of metalloproteins. Therefore, their concentration in whole blood can be used as a health monitor for laboratory animals, like the golden hamster (Mesocricetus auratus). In the last years, analytical nuclear techniques, such as neutron activation analysis (NAA) and X-ray fluorescence (XRF) have become prominent, due to their characteristics, such as multi-elemental analysis, short time of analysis, small amount of samples requirement (few micro liters) and, mainly, the possibility to perform analysis in whole blood, an important condition when the biological material is scarce. In the present work, energy dispersive X-ray fluorescence spectrometry was used to determine inorganic elements in golden hamster whole blood samples. The elemental determination was carried out using the Fundamental Parameters method. The interval reference values for Na (1714 – 1819 µg g-1); Mg (51 – 79 µg g-1); P (970 – 1080 µg g-1); S (1231 – 1739 µg g-1); Cl (2775 – 2865 µg g-1); K (1968 – 2248 µg g-1); Ca (209 – 257 µg g-1); Fe (145 – 267 µg g-1); Cu (4 – 6 µg g-1) and Zn (3 – 5 µg g-1) were determined. A comparison of the results with NAA data was carried out. The EDXRF spectrometry showed to be appropriate for whole blood samples analysis and offer good perspective in veterinary medicine.
INTRODUCTION Mice and rats are often used as a biomedical model for the study of several diseases, from cognitive disorders to cancer. In the organism, concentration of inorganic elements, though being small, has a great influence in the maintenance of good bodily functions, such as control of enzymatic reactions (Mg, Ca, S), respiratory and cardiac functions (K, Mg, Ca), osmotic regulation (Na, Cl, K), oxidation processes (Fe), hemoglobin synthesis (Zn) and ATP production (P, Mg).
Glucose, urea, total protein and analyses of inorganic elements are recommended in mice clinical pathology evaluation [1]. In order to consider subject healthy or unhealthy, such parameters should be compared with
M. M. Redígolo et al.
EXRS2010 Conference Proceedings 114
reference values. Reference values or intervals are established by testing selected individuals according to defined criteria. The results are statistically described as a normal distribution with significance level (α = 0.05).
Blood is composed of liquid and solid parts, namely plasma and cells, respectively. The term whole blood refers to samples containing both parts. Working with whole blood samples has two main advantages: no material is lost and also no pre-treatment is necessary. Mice and hamsters’ blood
sample collection is difficult due to the small sample volume that can be obtained from one subject. For a long term observation, the pathological evaluation requires many animals, what, in some cases, may lead to failure in the study.
The determination of inorganic elements is often performed in serum using techniques such as atomic absorption spectrometry (AAS), high performance liquid chromatography (HPLC), ion selective electrode (ISE) and colorimetry methods, which demand a great volume of samples for multi-element determination.
Nuclear analytical techniques such as neutron activation analysis (NAA) and X-ray fluorescence (XRF) spectrometry have shown great progress in the analytical field, owing to their characteristics such as multi-elemental analysis, short time of analysis and small amount of samples requirement. The Nuclear Structure Laboratory and the X-ray Fluorescence Laboratory at IPEN, SP, Brazil have performed the determination of inorganic elements in human and animal whole blood samples [2, 3].
In this work, the elements Na, Mg, P, S, Cl, K, Ca, Fe, Cu and Zn were determined quantitatively by EDXRFS using the Fundamental Parameters method in golden hamster (Mesocricetus auratus) whole blood samples. A comparison of the results with NAA data was carried out. This work intends to offer an alternative method for inorganic elements determination in whole blood in small laboratory animals, such as mice and rabbits.
MATERIALS AND METHODS SAMPLE PREPARATION
The samples were obtained from renowned Brazilian public research laboratories, namely Instituto Butantan and Centro de Pesquisas Aggeu Magalhães. 1 mL of whole blood was collected from adult golden hamsters in a vacuum plastic tube without any anticoagulant agent. Before coagulation, 100 μL of whole blood were deposited onto Whatman 41 filter paper. Ten samples were prepared in duplicate to be analyzed by XRF techniques. The remainder samples were sent to conventional serology tests. The samples were dried with an infrared lamp, for a few minutes, the deposition area was 500 – 700 mm2. A comparison of results between NAA and XRF results was carried out to provide more data for golden hamsters inorganic elements reference intervals values.
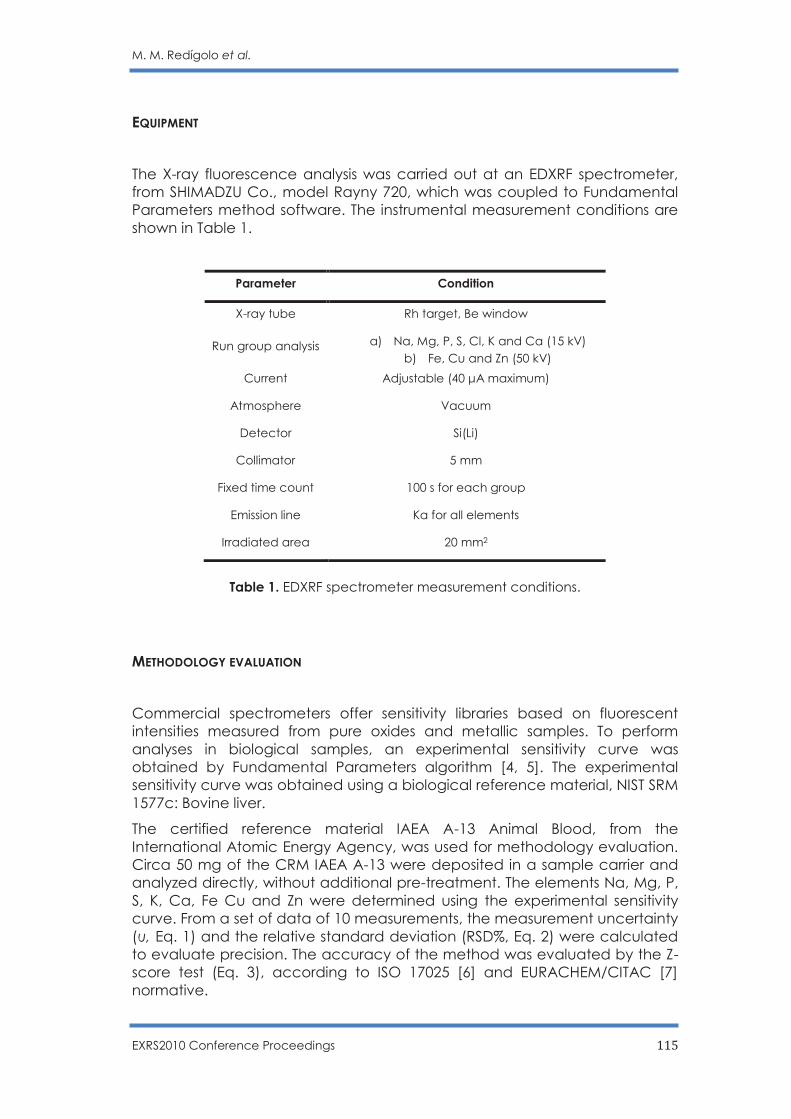
M. M. Redígolo et al.
EXRS2010 Conference Proceedings 115
EQUIPMENT
The X-ray fluorescence analysis was carried out at an EDXRF spectrometer, from SHIMADZU Co., model Rayny 720, which was coupled to Fundamental Parameters method software. The instrumental measurement conditions are shown in Table 1.
Parameter Condition
X-ray tube Rh target, Be window
Run group analysis a) Na, Mg, P, S, Cl, K and Ca (15 kV) b) Fe, Cu and Zn (50 kV)
Current Adjustable (40 μA maximum)
Atmosphere Vacuum
Detector Si(Li)
Collimator 5 mm
Fixed time count 100 s for each group
Emission line Kα for all elements
Irradiated area 20 mm2
Table 1. EDXRF spectrometer measurement conditions.
METHODOLOGY EVALUATION
Commercial spectrometers offer sensitivity libraries based on fluorescent intensities measured from pure oxides and metallic samples. To perform analyses in biological samples, an experimental sensitivity curve was obtained by Fundamental Parameters algorithm [4, 5]. The experimental sensitivity curve was obtained using a biological reference material, NIST SRM 1577c: Bovine liver.
The certified reference material IAEA A-13 Animal Blood, from the International Atomic Energy Agency, was used for methodology evaluation. Circa 50 mg of the CRM IAEA A-13 were deposited in a sample carrier and analyzed directly, without additional pre-treatment. The elements Na, Mg, P, S, K, Ca, Fe Cu and Zn were determined using the experimental sensitivity curve. From a set of data of 10 measurements, the measurement uncertainty (u, Eq. 1) and the relative standard deviation (RSD%, Eq. 2) were calculated to evaluate precision. The accuracy of the method was evaluated by the Z-score test (Eq. 3), according to ISO 17025 [6] and EURACHEM/CITAC [7] normative.
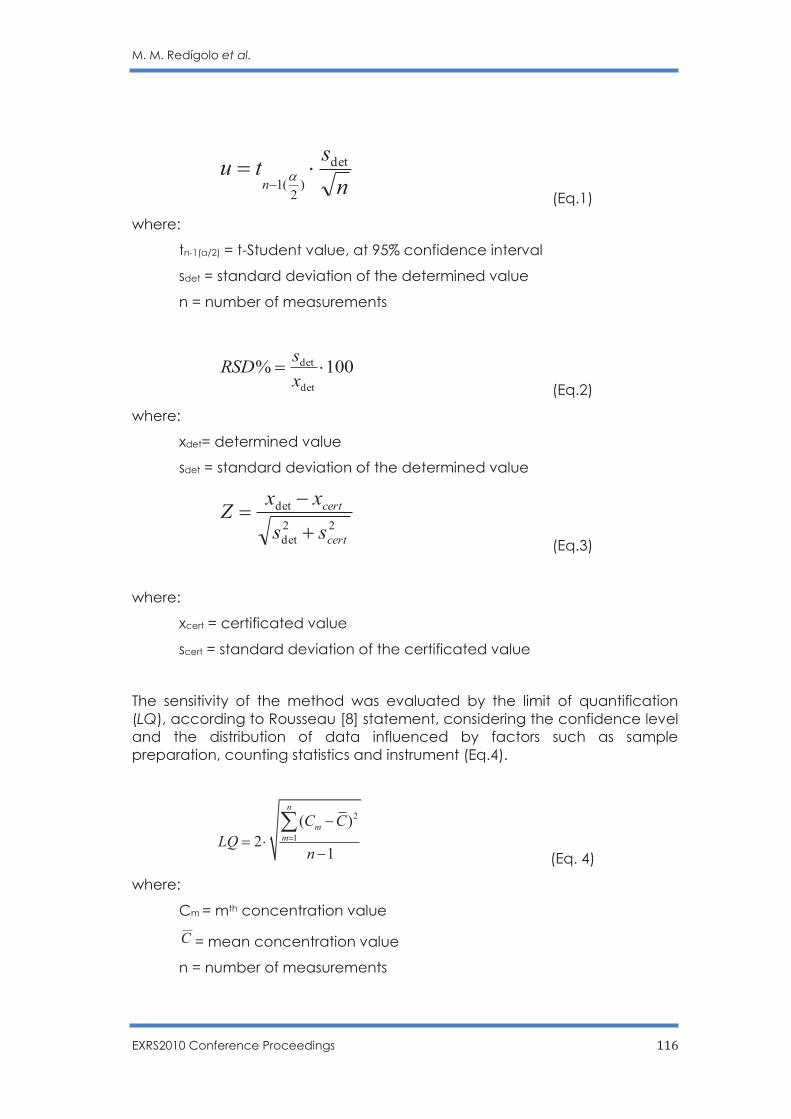
M. M. Redígolo et al.
EXRS2010 Conference Proceedings 116
n
stun
det
)2
(1×=
-a
(Eq.1)
where:
tn-1(α/2) = t-Student value, at 95% confidence interval
sdet = standard deviation of the determined value
n = number of measurements
100%det
det ×=x
sRSD
(Eq.2)
where:
xdet= determined value
sdet = standard deviation of the determined value
22
det
det
cert
cert
ss
xxZ
+
-=
(Eq.3)
where:
xcert = certificated value
scert = standard deviation of the certificated value
The sensitivity of the method was evaluated by the limit of quantification (LQ), according to Rousseau [8] statement, considering the confidence level and the distribution of data influenced by factors such as sample preparation, counting statistics and instrument (Eq.4).
2
1
( )
21
n
m
m
C C
LQn
=
-= ×
-
å
(Eq. 4)
where:
Cm = mth concentration value
C = mean concentration value
n = number of measurements
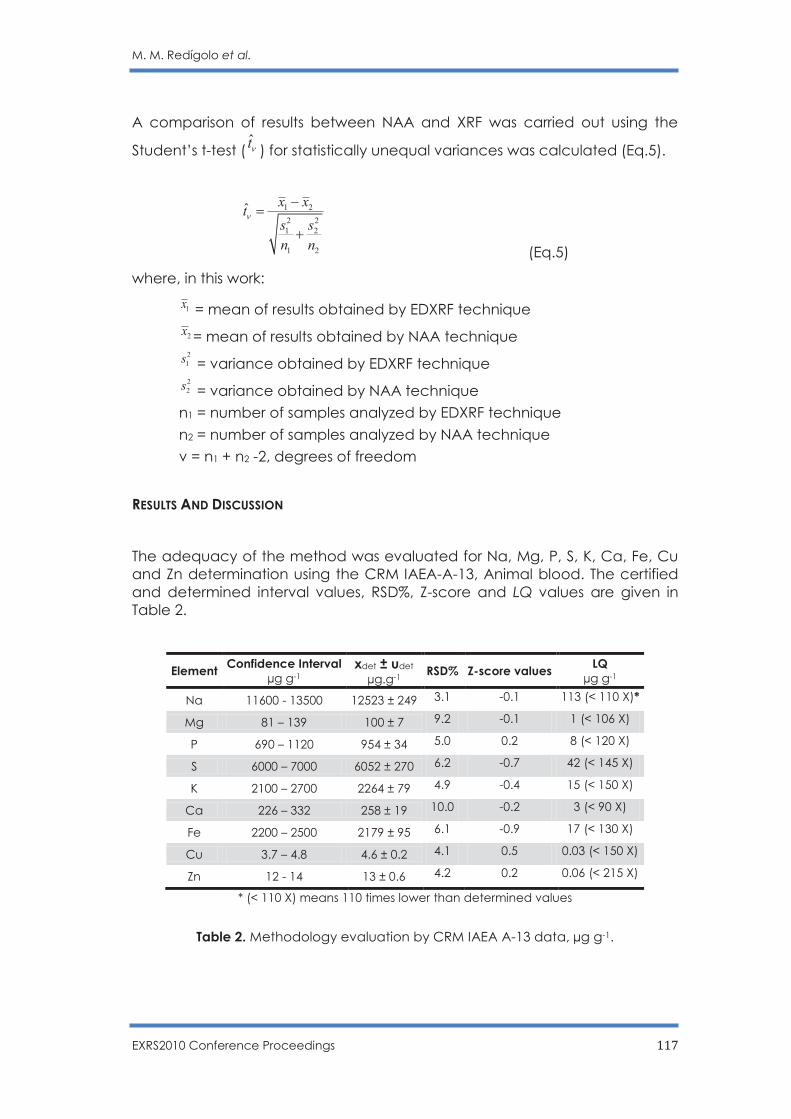
M. M. Redígolo et al.
EXRS2010 Conference Proceedings 117
A comparison of results between NAA and XRF was carried out using the
Student’s t-test ( tn ) for statistically unequal variances was calculated (Eq.5).
1 2
2 2
1 2
1 2
ˆx x
ts s
n n
n
-=
+ (Eq.5)
where, in this work:
1x = mean of results obtained by EDXRF technique
2x = mean of results obtained by NAA technique 2
1s = variance obtained by EDXRF technique 2
2s = variance obtained by NAA technique
n1 = number of samples analyzed by EDXRF technique
n2 = number of samples analyzed by NAA technique
ν = n1 + n2 -2, degrees of freedom
RESULTS AND DISCUSSION
The adequacy of the method was evaluated for Na, Mg, P, S, K, Ca, Fe, Cu and Zn determination using the CRM IAEA-A-13, Animal blood. The certified and determined interval values, RSD%, Z-score and LQ values are given in Table 2.
Element Confidence Interval
µg g-1 xdet ± udet
µg.g-1 RSD% Z-score values
LQ µg g-1
Na 11600 - 13500 12523 ± 249 3.1 -0.1 113 (< 110 X)*
Mg 81 – 139 100 ± 7 9.2 -0.1 1 (< 106 X)
P 690 – 1120 954 ± 34 5.0 0.2 8 (< 120 X)
S 6000 – 7000 6052 ± 270 6.2 -0.7 42 (< 145 X)
K 2100 – 2700 2264 ± 79 4.9 -0.4 15 (< 150 X)
Ca 226 – 332 258 ± 19 10.0 -0.2 3 (< 90 X)
Fe 2200 – 2500 2179 ± 95 6.1 -0.9 17 (< 130 X)
Cu 3.7 – 4.8 4.6 ± 0.2 4.1 0.5 0.03 (< 150 X)
Zn 12 - 14 13 ± 0.6 4.2 0.2 0.06 (< 215 X)
* (< 110 X) means 110 times lower than determined values
Table 2. Methodology evaluation by CRM IAEA A-13 data, µg g-1.
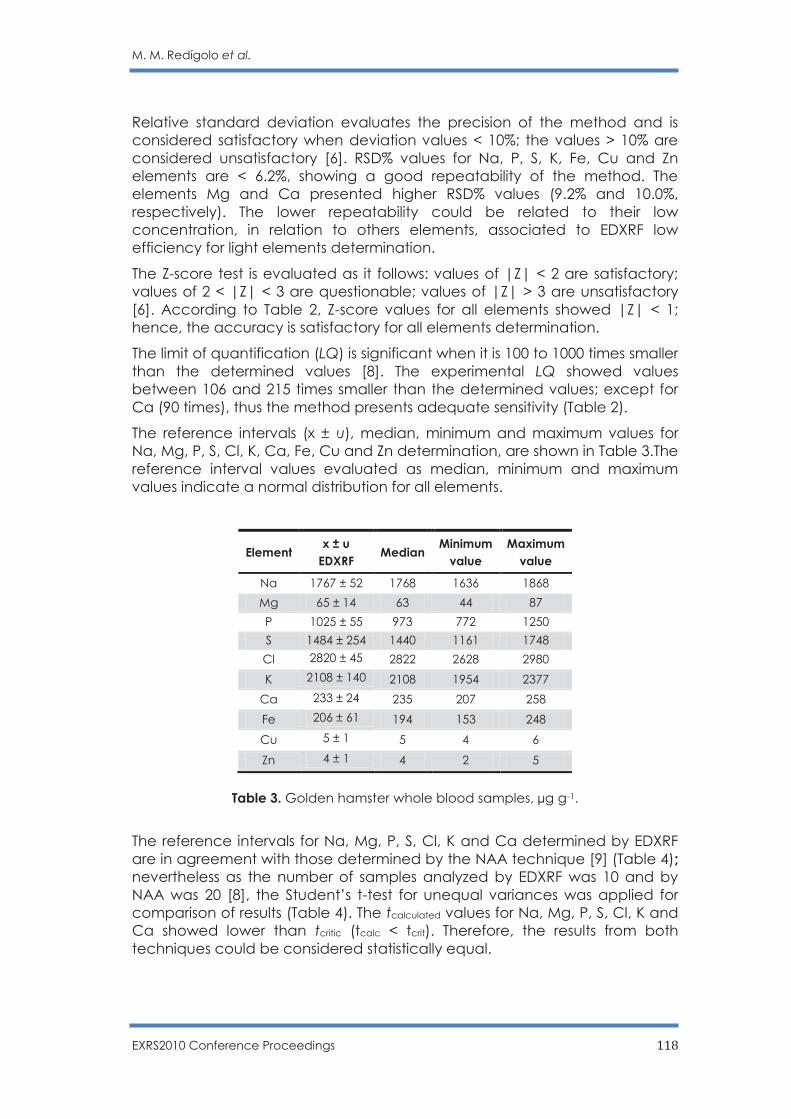
M. M. Redígolo et al.
EXRS2010 Conference Proceedings 118
Relative standard deviation evaluates the precision of the method and is considered satisfactory when deviation values < 10%; the values > 10% are considered unsatisfactory [6]. RSD% values for Na, P, S, K, Fe, Cu and Zn elements are < 6.2%, showing a good repeatability of the method. The elements Mg and Ca presented higher RSD% values (9.2% and 10.0%, respectively). The lower repeatability could be related to their low concentration, in relation to others elements, associated to EDXRF low efficiency for light elements determination.
The Z-score test is evaluated as it follows: values of |Z| < 2 are satisfactory; values of 2 < |Z| < 3 are questionable; values of |Z| > 3 are unsatisfactory [6]. According to Table 2, Z-score values for all elements showed |Z| < 1; hence, the accuracy is satisfactory for all elements determination.
The limit of quantification (LQ) is significant when it is 100 to 1000 times smaller than the determined values [8]. The experimental LQ showed values between 106 and 215 times smaller than the determined values; except for Ca (90 times), thus the method presents adequate sensitivity (Table 2).
The reference intervals (x ± u), median, minimum and maximum values for Na, Mg, P, S, Cl, K, Ca, Fe, Cu and Zn determination, are shown in Table 3.The reference interval values evaluated as median, minimum and maximum values indicate a normal distribution for all elements.
Element x ± u
EDXRF Median
Minimum
value
Maximum
value
Na 1767 ± 52 1768 1636 1868
Mg 65 ± 14 63 44 87
P 1025 ± 55 973 772 1250
S 1484 ± 254 1440 1161 1748
Cl 2820 ± 45 2822 2628 2980
K 2108 ± 140 2108 1954 2377
Ca 233 ± 24 235 207 258
Fe 206 ± 61 194 153 248
Cu 5 ± 1 5 4 6
Zn 4 ± 1 4 2 5
Table 3. Golden hamster whole blood samples, µg g-1.
The reference intervals for Na, Mg, P, S, Cl, K and Ca determined by EDXRF are in agreement with those determined by the NAA technique [9] (Table 4); nevertheless as the number of samples analyzed by EDXRF was 10 and by NAA was 20 [8], the Student’s t-test for unequal variances was applied for comparison of results (Table 4). The tcalculated values for Na, Mg, P, S, Cl, K and Ca showed lower than tcritic (tcalc < tcrit). Therefore, the results from both techniques could be considered statistically equal.
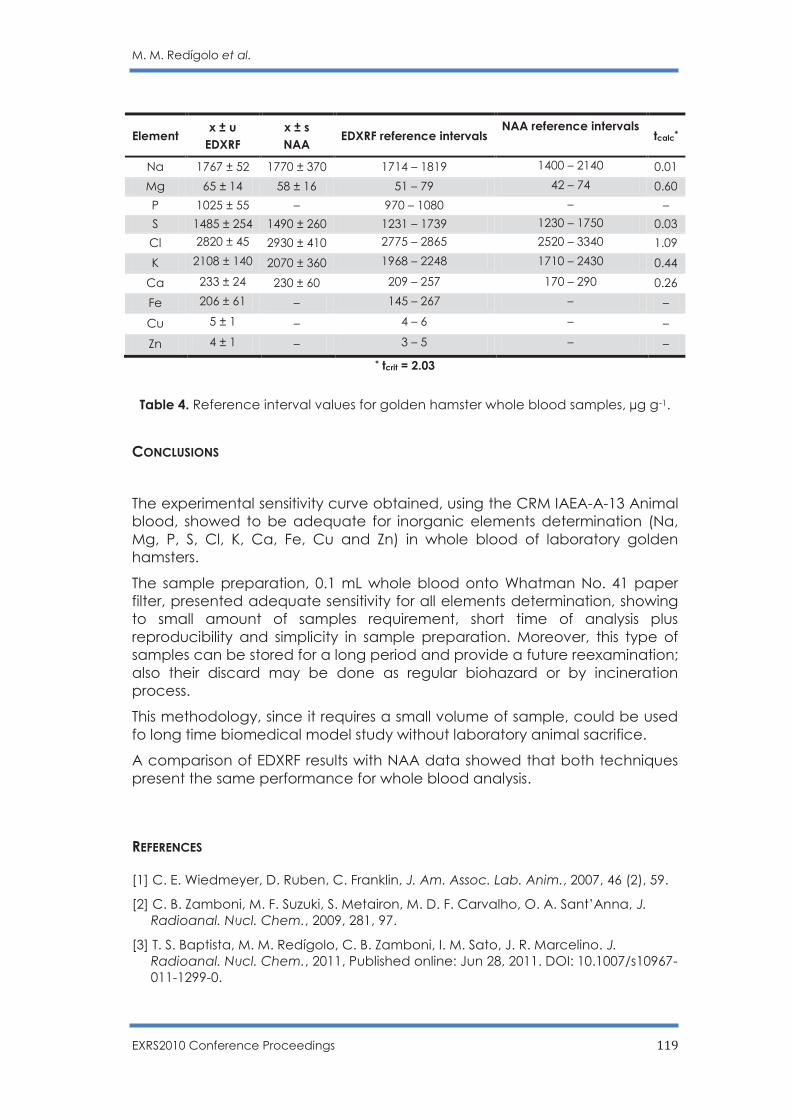
M. M. Redígolo et al.
EXRS2010 Conference Proceedings 119
Element x ± u
EDXRF
x ± s
NAA EDXRF reference intervals
NAA reference intervals tcalc*
Na 1767 ± 52 1770 ± 370 1714 – 1819 1400 – 2140 0.01
Mg 65 ± 14 58 ± 16 51 – 79 42 – 74 0.60
P 1025 ± 55 – 970 – 1080 – –
S 1485 ± 254 1490 ± 260 1231 – 1739 1230 – 1750 0.03
Cl 2820 ± 45 2930 ± 410 2775 – 2865 2520 – 3340 1.09
K 2108 ± 140 2070 ± 360 1968 – 2248 1710 – 2430 0.44
Ca 233 ± 24 230 ± 60 209 – 257 170 – 290 0.26
Fe 206 ± 61 – 145 – 267 – –
Cu 5 ± 1 – 4 – 6 – –
Zn 4 ± 1 – 3 – 5 – –
* tcrit = 2.03
Table 4. Reference interval values for golden hamster whole blood samples, µg g-1.
CONCLUSIONS
The experimental sensitivity curve obtained, using the CRM IAEA-A-13 Animal blood, showed to be adequate for inorganic elements determination (Na, Mg, P, S, Cl, K, Ca, Fe, Cu and Zn) in whole blood of laboratory golden hamsters.
The sample preparation, 0.1 mL whole blood onto Whatman No. 41 paper filter, presented adequate sensitivity for all elements determination, showing to small amount of samples requirement, short time of analysis plus reproducibility and simplicity in sample preparation. Moreover, this type of samples can be stored for a long period and provide a future reexamination; also their discard may be done as regular biohazard or by incineration process.
This methodology, since it requires a small volume of sample, could be used fo long time biomedical model study without laboratory animal sacrifice.
A comparison of EDXRF results with NAA data showed that both techniques present the same performance for whole blood analysis.
REFERENCES [1] C. E. Wiedmeyer, D. Ruben, C. Franklin, J. Am. Assoc. Lab. Anim., 2007, 46 (2), 59.
[2] C. B. Zamboni, M. F. Suzuki, S. Metairon, M. D. F. Carvalho, O. A. Sant’Anna, J. Radioanal. Nucl. Chem., 2009, 281, 97.
[3] T. S. Baptista, M. M. Redígolo, C. B. Zamboni, I. M. Sato, J. R. Marcelino. J. Radioanal. Nucl. Chem., 2011, Published online: Jun 28, 2011. DOI: 10.1007/s10967-011-1299-0.

M. M. Redígolo et al.
EXRS2010 Conference Proceedings 120
[4] G. R. Lachance, F. Claisse, Quantitative X-Ray Fluorescence Analysis. Theory and Application, John Wiley & Sons, England, 1994.
[5] B. Beckhoff et al., Handbook of Practical X-Ray Fluorescence Analysis, Berlin-London, Springer, 1st edition, 2006.
[6] ABNT ISO/IEC 17025, Requisitos Gerais para a Competência de Laboratórios de
Ensaio e de Calibração, ABNT, Brasil, 2005.
[7] EURACHEM/CITAC, Quantifying Uncertainty in Analytical Measurement, Eurachem, London, 2nd edition, 2003.
[8] R. Rousseau. Rigaku J., 2001, 18(2), 33-47.
[9] R. O. Aguiar, Determinação de elementos em sangue de hamster dourado usando AAN [dissertation], São Paulo (SP): Instituto de Pesquisas Energéticas e Nucleares, 2009, http://www.teses.usp.br/teses/disponiveis/85/85131/tde-02062009-172318/publico/RodrigoOliveiradeAguiar.pdf. Accessed 2011 Jul 5.
D. Guimarães et al.
EXRS2010 Conference Proceedings 121
Multianalytical techniques in brain lead determination: Hypothalamic Defence Area and
Nucleus Tractus Solitarius
D. Guimarãesa, M.L. Carvalhob, M.S. Dinizc V. Geraldesd, I. Rochad,
J.P. Santosa
a Centro de Física Atómica da Universidade de Lisboa, Departamento de Física,
Faculdade de Ciências e Tecnologia, FCT, Universidade Nova de Lisboa,
2829-516 Caparica, Portugal
b Centro de Física Atómica da Universidade de Lisboa, Departamento de Física, Faculdade de Ciências, Av. Prof. Gama Pinto 2, 1649-003, Lisboa, Portugal
c REQUIMTE, Departamento de Química, Faculdade de Ciências e Tecnologias da Universidade Nova de Lisboa, 2829-516 Monte da Caparica, Portugal
d Instituto de Fisiologia, Faculdade de Medicina de Lisboa and Instituto de Medicina
Molecular, Lisboa, , Av. Prof. Egas Moniz, 1649-028 Lisboa, Portugal
ABSTRACT Measurements in brain of Wistar rats exposed to lead acetate (n=12) in drinking water since the foetal period were compared with those obtained from a control group (n=6), in order to assess the accumulation of Pb in brain. Aiming to study the accumulation of lead in two specific areas of the brain that control arterial pressure, the Nucleus Tractus Solitarius (NTS) and the Hypothalamic Defence Area (HDA), the brain samples were separated in three: NTS, HDA and the remaining part of the brain wi. To determine the Pb content of the total brain samples Energy Dispersive X-ray Fluorescence (EDXRF) was used. The results showed no differences between exposed and non exposed tissues and all measured values were similar to the detection limit (2 µg/g). However, using Electrothermal Atomic Absorption Spectrometry (ETAAS) to study NTS and HDA, were observed differences between non exposed and exposed rats: about 5 times higher for NTS and 8 times higher for HDA. Significant differences in lead concentration were also found in exposed rats according to the type of tissue, with values in HDA showing an increase of about 50% in comparison to NTS values. Histological examination and histochemical analysis (Rhodozinate method) confirmed the presence of Pb in contaminated tissues showing that accumulation and Pb distribution varies differently according to the type of tissue analyzed.
I. INTRODUCTION There are several studies conducted on animals and humans exposed to lead (Pb) that report the occurrence of cardiovascular pathologies (for instance, heart rate variability, heart failure and hypertension), and related them with Pb concentrations [1]. The relationship between exposure to Pb and hypertension is generally attributed to several cardiovascular and renal mechanisms [2, 3], such as effects on the renin-angiotensin system, depletion of nitric oxide (NO), increased central sympathetic nervous system activity, constrictive effects on vascular smooth muscle and decrements in glomerular filtration rate [4, 5]. Some studies have also tried to establish a
D. Guimarães et al.
EXRS2010 Conference Proceedings 122
relationship between lead exposure and the hypertension by correlating it to blood lead and bone lead [6, 7].
Guided by some evidences that hypertension may be a direct consequence of Pb accumulation in the brain, rather than an indirect consequence due to cardiovascular and renal effects, two different and specific areas of the brain of Wistar rats associated to the control of arterial pressure – the Nucleus Tractus Solitarius (NTS) and the Hypothalamic Defence Area (HDA) – were analyzed using the Electrothermal Atomic Absorption Spectrometry (ETAAS) technique. In addition, mean lead concentrations in brain samples without NTS and HDA were analysed by Energy Dispersive X Ray Fluorescence (EDXRF).
EDXRF allow us to have a global view of Pb concentration in the brain tissues while ETAAS, due to its low limits of detection (<1 ppm, in the order of µg/L) and to the ability to analyse very small amounts of sample, give us information about that two specific brain parts. ETAAS and XRF are two of the most common techniques used to study trace elements in food, environmental, biological, geological and industrial samples [1, 8-10]. It is important to notice that the ETAAS and EDXRF measurements reported in this article are preliminary (only a few number of samples were analysed) and are part of a major study of the mechanisms underlying Pb concentrations in biological tissues that involves a total of 50 rats (30 contaminated and 20 control), and a large amount of biological samples: bones, liver, kidneys, brain; excretions (faeces and urine); blood and hair. Furthermore, histochemical and histological analysis were carried out to assess the distribution of Pb granules in HDA and NTS and to evaluate potential changes in tissue structure.
II. MATERIALS AND METHODS
II.1 EDXRF INSTRUMENTATION The EDXRF analysis was performed using a spectrometer, consisting on a commercial X-ray tube with a tungsten anode, a molybdenum changeable secondary target that works as the excitation source in the respective K lines energy, and a Si(Li) detector [11]. The quantitative evaluation is made by the fundamental parameters method [12, 13] and the acquisitions were made at 50 kV and 20 mA with an acquisition live time of 1000 s.
The detection limit of this spectrometer, obtained with the standard reference pattern of Orchard leaves 1571 from National Bureau of Standards (NBS) and calculated according to Custódio [11], is 2 μg/g for Pb. The accuracy was checked by the analysis of the same reference material with a Pb concentration of (45±3) µg/g, and the measured value (n=3) was (42±3) µg/g. A relative standard deviation (RSD) less than 10% was obtained for all the samples measured.
II.2 ETAAS INSTRUMENTATION
D. Guimarães et al.
EXRS2010 Conference Proceedings 123
The ETAAS measurements were performed with an experimental setup consisting on an Analytik Jena AG atomic absorption spectrometer model AASZenit 650 equipped with a lead hollow cathode lamp (Analytik Jena; 4.0 mA; 217.0 nm). The pyrolysis was made at 900º C, atomization at 1800º and Pd(NO3)2, from Fluka (Buchs, Switzerland), used as chemical modifier.
The calibration was performed with calibration curves (peak area measurements) for the lead stock standard solution (1000 mg/L Fluka Analytical) ranging from 0 to 30 µg/L. The detection and quantification limits (LOD, LOQ) were calculated according to Miller and Miller [14] and the values were 0.7 µg/L for LOD and 2.1 µg/L for LOQ.
The limits of detection and quantification of the method (mLOD and mLOQ, respectively) were calculated taking into account the LOQ and LOD of the ETAAS system, the mass of sample used in the extraction process and the extracting volume solution. Considering the smallest mass tissue with Pb concentration levels bellow LOQ (1.948 mg), it was obtained 0.4 µg/g for mLOD and 1.1 µg/g for mLOQ.
To test the accuracy of this spectrometer the supernatant acid solution where the brain samples were sonicated were spiked with known amounts of Pb up to 6 µg/L, 15 µg/L and 24 µg/L, and analyzed. The recoveries obtained were (X±R.S.D, n=3) 97±9%, 101±4% and 100± 2% respectively. Three injections of each sample were analyzed and a RSD less than 10% was obtained.
For 3 replicate determinations the Relative Standard Deviation (RSD) was less than 10% for all samples.
II.3 HISTOLOGY INSTRUMENTATION The histochemical and histological examinations were accomplished using a Leica Jung-RM-2035 microtome and a Leica-ATC2000 (Wetzal, Germany) optical microscope, with a DFC digital camera. II.4 CHEMICALS Milli-Q ultrapure water (18 MΩ resistivity) was used to prepare and cleaning processes. HNO3 from Merck (Suprapur 65%) was used to acidify the solutions. A Pb solution of 0.2% w/V was prepared by dissolving lead acetate obtained from Panreac Quimica SA (Lead (II) Acetate 3-hydrate DIDATIC) in distilled water.
Formaldehyde 37-38% w/w purchased from Pancreac was used to prepare a formaldehyde 10% solution with pH 7.4 to preserve the brain samples. Analytical reference solutions were prepared by successive dilution of the Pb stock standard solution (1000 mg/L Fluka Analytical). The chemical modifier solution was obtained from a high purity reagent Pd(NO3)2 from Fluka (Buchs, Switzerland).
Absolute ethanol (Merck, Germany), then prepared to different grades and xylene (Carlo Erba RPE, Italy) were used during the dehydration and impregnation in histology processing.
D. Guimarães et al.
EXRS2010 Conference Proceedings 124
For the revelation of Pb granules within tissues it was used sodium rhodizonate, glacial acetic acid and aqueous fast green (FCF) as counterstain, all purchased from Sigma-Aldrich (USA). Hematoxyline and eosine were from Riedel de Haen (Seelze, Germany). DPX resin from BDH (Poole, England) was used as mounting medium for slides. II.5 ANIMALS Two groups of Wistar rats were studied: the Pb group that was exposed to lead acetate in drinking water since foetal period; and the control group that was exposed to normal drinking water. The age of these animals varies from 1 to 11 months and the lead exposure regimen was based on the previous validated study of Bielarczyk et al. [15].
The rats were maintained under standard animal facilities, in accordance with EU legislation on animal experimentation and welfare. They were fed with commercial pellet food and water ad libitum. Animals from both groups were killed with an overdose of sodium pentobarbitone (100 mg/mL/kg) and undergone the surgical procedures performed in accordance with EU legislation on animal experimentation.
II.6 SAMPLE TREATMENT II.6.1 EDXRF A total of 12 brain samples were collected from the exposed group and 6 brain samples in the control group. Brain samples were lyophilized using the Edwards Modulyo Freeze Dryer, for 3.5 days at -60 ºC and 20 Pa. Afterwards, the samples were powdered using a mortar and pressed into circular pellets, with 2.0 cm in diameter, by 13 tons with a manual hydraulic press from Specac. Each pellet, weighing about 0.2 g, was glued on a Mylar film, mounted on a sample holder and placed in the X-ray beam for the element determination. Two pellets of each sample were made.
II.6.2 ETAAS
For ETAAS analysis 24 specific brain areas tissues of the Pb group (12 NTS samples and 12 HDA samples) and 12 brain areas tissues of the control group (6 NTS and 6 HDA) were used. These samples were removed from the rats, placed in four different vessels according the type of tissue and exposure regime, and preserved in formaldehyde at 2ºC.
The brain tissue samples were transferred to plastic watch glasses previously cleaned and decontaminated, and placed in the oven at 50ºC for 24 h. After the drying process samples were weighted and dry mass value registered. Afterwards, each tissue sample was placed in 1.5 mL eppendorf containing 1.0 mL of blank solution with 10% HNO3, and sonicated using an ultrasonic probe UP 200 s (200 watts, 24 kHz, 1 mm diameter titanium probe tip) from Hielscher - Ultrasound Technology (Teltow, Germany), for 3 minutes [16, 17]. Ultrasonic energy irradiation was fixed at a power setting of 50%.
D. Guimarães et al.
EXRS2010 Conference Proceedings 125
Between each minute the eppendorf was placed in ice for 1 min to avoid heating. After sonication, the brain tissue remained intact. Then after samples were centrifuged (7000 rpm for 10 min) the supernatant was pipetted onto the auto-sampler cups to be analyzed.
II.7 HISTOCHEMICAL AND HISTOLOGY For histology and histochemical analysis samples were processed following the usual procedures described by Martoja and Martoja [18].
The histochemistry was performed according to the rhodizonate method for lead salts [19] to reveal Pb granules. In brief, brain samples preserved in formaldehyde (10% v/v) were washed for 3 h with Milli-Q for formaldehyde removal. Afterwards, they were dehydrated in a progressive series of ethanol dilutions and finally placed in xylene used for intermediate impregnation. Subsequently, the samples were embedded in paraffin and placed in the oven at 50ºC over night. After paraffin inclusion, sections 5–7 μm thin were stained with sodium rhodizonate solution for 1 hour. Then, counterstained with aqueous fast green (0,05%) in acetic acid (0,2%) for 1 minute. Finally, the sample was rinsed in distilled water, dehydrated, clear and mounted in DPX resin. Additional sections were stained with haematoxylin and eosin for structural analysis.
Slides were prepared in duplicate for each tissue with 5 sections per slide, and examined through optical microscope observation. Pictures from tissue sections were acquired using the image analysis software Irfan View v. 4.0.
II.8 STATISTICAL ANALYSIS The results are expressed as mean value±standard deviation. Data were analyzed with the non-parametric significance Mann-Whitney U test. The package for Social Sciences (SPSS) software, version 17.0, was used in all statistics using a 0.05 level of significance.
III. RESULTS
III.1 BRAIN TISSUES MEASUREMENTS
All the brain samples measured by EDXRF, in control and exposed group, presented values below the detection limits of the technique.
The lead concentration results in HDA and NTS brain rat tissues obtained in this work by ETAAS technique, are shown in Table 1.
We found that both tissues from the control group rats show no significant values of lead concentration since all measured values are below the quantification limit of the spectrometer (Table 1). In addition, significant concentration values were found in the NTS and HDA tissues from the group exposed to Pb. It was also noticed that, within the Pb group, that the HDA brain tissue present higher lead concentration than the corresponding
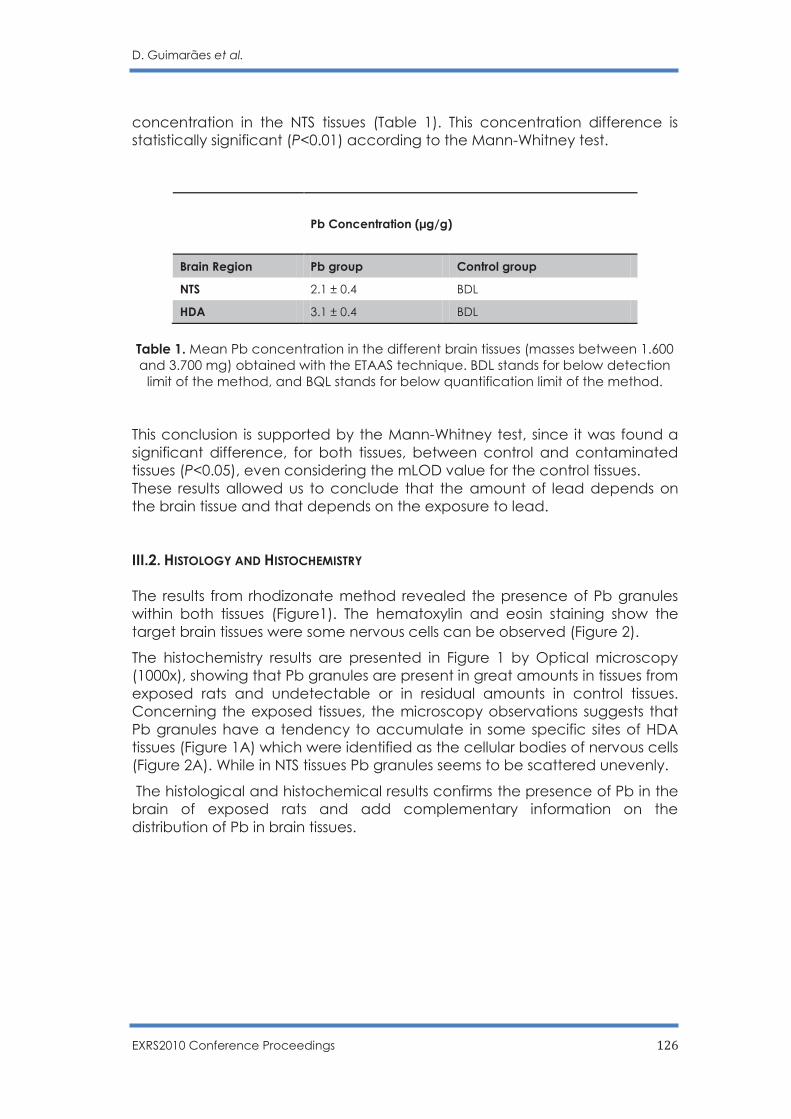
D. Guimarães et al.
EXRS2010 Conference Proceedings 126
concentration in the NTS tissues (Table 1). This concentration difference is statistically significant (P<0.01) according to the Mann-Whitney test.
Pb Concentration (µg/g)
Brain Region Pb group Control group
NTS 2.1 ± 0.4 BDL
HDA 3.1 ± 0.4 BDL
Table 1. Mean Pb concentration in the different brain tissues (masses between 1.600 and 3.700 mg) obtained with the ETAAS technique. BDL stands for below detection
limit of the method, and BQL stands for below quantification limit of the method. This conclusion is supported by the Mann-Whitney test, since it was found a significant difference, for both tissues, between control and contaminated tissues (P<0.05), even considering the mLOD value for the control tissues. These results allowed us to conclude that the amount of lead depends on the brain tissue and that depends on the exposure to lead. III.2. HISTOLOGY AND HISTOCHEMISTRY The results from rhodizonate method revealed the presence of Pb granules within both tissues (Figure1). The hematoxylin and eosin staining show the target brain tissues were some nervous cells can be observed (Figure 2).
The histochemistry results are presented in Figure 1 by Optical microscopy (1000x), showing that Pb granules are present in great amounts in tissues from exposed rats and undetectable or in residual amounts in control tissues. Concerning the exposed tissues, the microscopy observations suggests that Pb granules have a tendency to accumulate in some specific sites of HDA tissues (Figure 1A) which were identified as the cellular bodies of nervous cells (Figure 2A). While in NTS tissues Pb granules seems to be scattered unevenly.
The histological and histochemical results confirms the presence of Pb in the brain of exposed rats and add complementary information on the distribution of Pb in brain tissues.
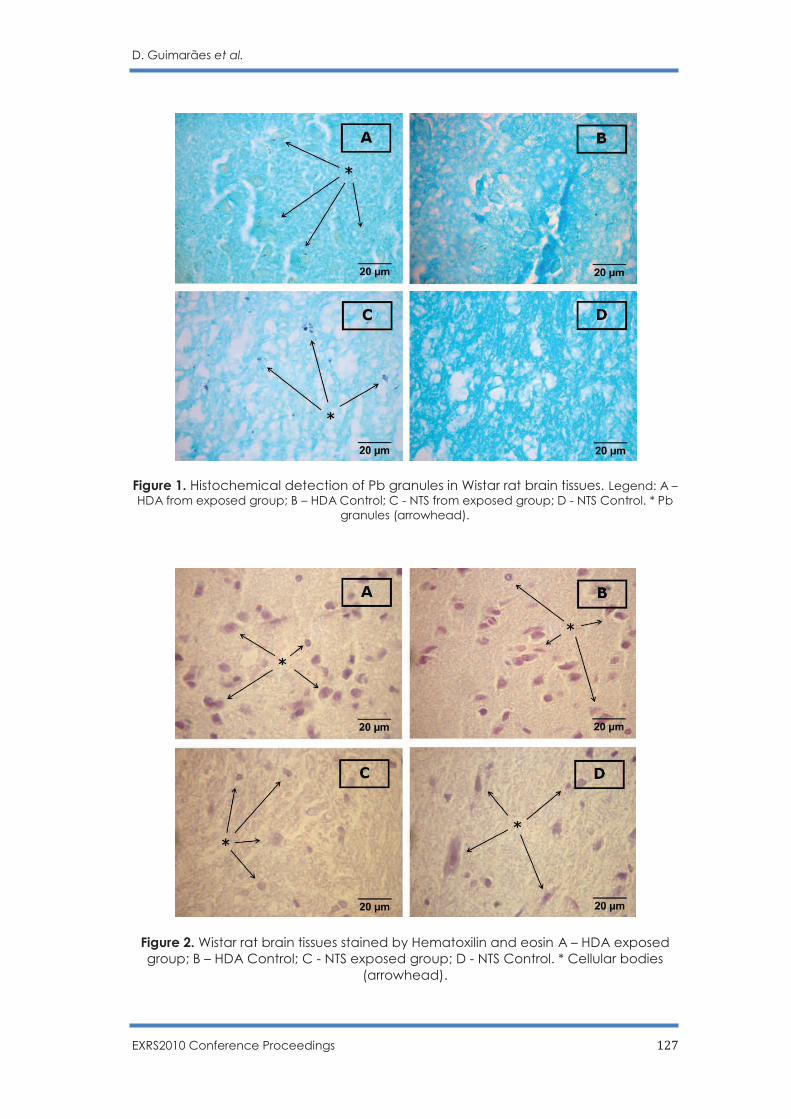
D. Guimarães et al.
EXRS2010 Conference Proceedings 127
Figure 1. Histochemical detection of Pb granules in Wistar rat brain tissues. Legend: A – HDA from exposed group; B – HDA Control; C - NTS from exposed group; D - NTS Control. * Pb
granules (arrowhead).
Figure 2. Wistar rat brain tissues stained by Hematoxilin and eosin A – HDA exposed group; B – HDA Control; C - NTS exposed group; D - NTS Control. * Cellular bodies
(arrowhead).
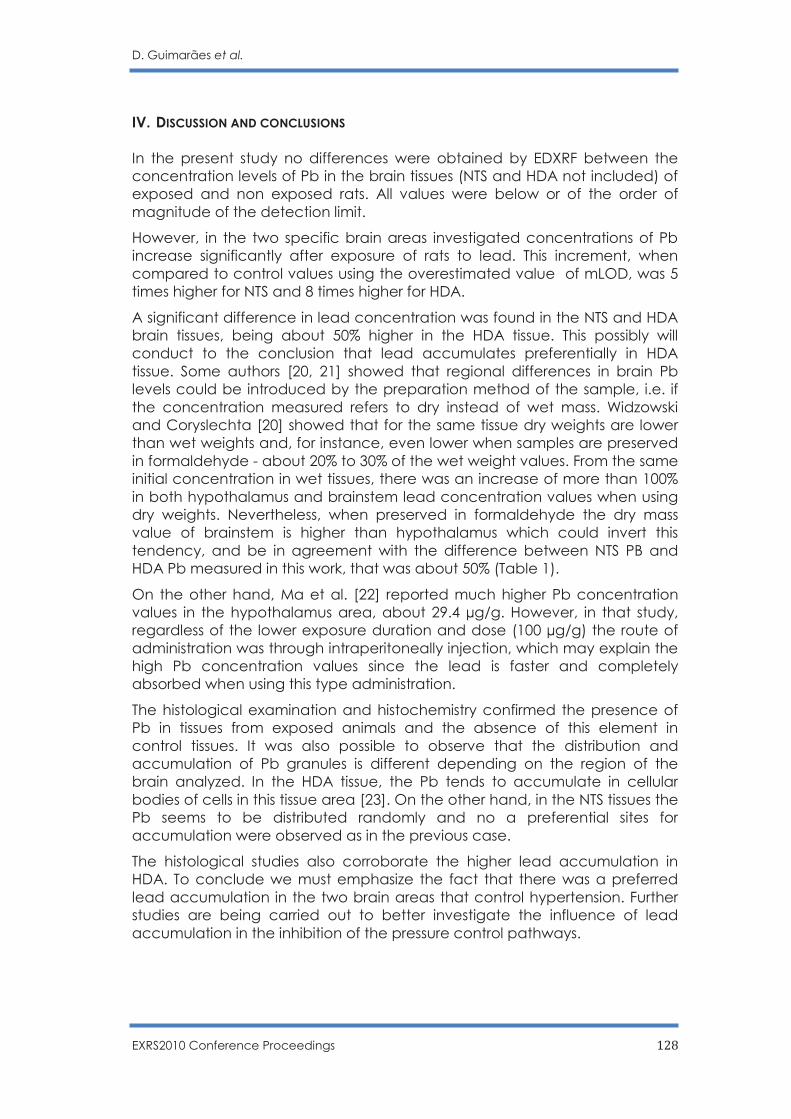
D. Guimarães et al.
EXRS2010 Conference Proceedings 128
IV. DISCUSSION AND CONCLUSIONS In the present study no differences were obtained by EDXRF between the concentration levels of Pb in the brain tissues (NTS and HDA not included) of exposed and non exposed rats. All values were below or of the order of magnitude of the detection limit.
However, in the two specific brain areas investigated concentrations of Pb increase significantly after exposure of rats to lead. This increment, when compared to control values using the overestimated value of mLOD, was 5 times higher for NTS and 8 times higher for HDA.
A significant difference in lead concentration was found in the NTS and HDA brain tissues, being about 50% higher in the HDA tissue. This possibly will conduct to the conclusion that lead accumulates preferentially in HDA tissue. Some authors [20, 21] showed that regional differences in brain Pb levels could be introduced by the preparation method of the sample, i.e. if the concentration measured refers to dry instead of wet mass. Widzowski and Coryslechta [20] showed that for the same tissue dry weights are lower than wet weights and, for instance, even lower when samples are preserved in formaldehyde - about 20% to 30% of the wet weight values. From the same initial concentration in wet tissues, there was an increase of more than 100% in both hypothalamus and brainstem lead concentration values when using dry weights. Nevertheless, when preserved in formaldehyde the dry mass value of brainstem is higher than hypothalamus which could invert this tendency, and be in agreement with the difference between NTS PB and HDA Pb measured in this work, that was about 50% (Table 1).
On the other hand, Ma et al. [22] reported much higher Pb concentration values in the hypothalamus area, about 29.4 µg/g. However, in that study, regardless of the lower exposure duration and dose (100 µg/g) the route of administration was through intraperitoneally injection, which may explain the high Pb concentration values since the lead is faster and completely absorbed when using this type administration.
The histological examination and histochemistry confirmed the presence of Pb in tissues from exposed animals and the absence of this element in control tissues. It was also possible to observe that the distribution and accumulation of Pb granules is different depending on the region of the brain analyzed. In the HDA tissue, the Pb tends to accumulate in cellular bodies of cells in this tissue area [23]. On the other hand, in the NTS tissues the Pb seems to be distributed randomly and no a preferential sites for accumulation were observed as in the previous case.
The histological studies also corroborate the higher lead accumulation in HDA. To conclude we must emphasize the fact that there was a preferred lead accumulation in the two brain areas that control hypertension. Further studies are being carried out to better investigate the influence of lead accumulation in the inhibition of the pressure control pathways.
D. Guimarães et al.
EXRS2010 Conference Proceedings 129
ACKNOWLEDGEMENTS D. Guimarães acknowledges Fundação para a Ciência e Tecnologia (FCT) for the Grant (SFRH/BD/38788/2007). The authors acknowledges REQUIMTE, and Carla Rodrigues and Nuno Costa for the technical support. REFERENCES [1] ATSDR, Toxicological Profile for Lead, Atlanta, Georgia, 2005.
[2] S. Kasperczyk, M. Dziwisz, A. Kasperczyk, E. Birkner, [Influence of lead exposure on arterial hypertension], Wiad Lek, 55 Suppl 1 (2002) 230-234.
[3] N. Vaziri, Mechanisms of lead-induced hypertension and cardiovascular disease., Am J Physiol Heart Circ Physiol, 295 (2008) H454-465.
[4] P. Apostoli, A. Corruli, M. Metra, L. Dei Cas, Piombo e cardiopatie, Medicina del Lavoro, 95 (2004) 124-132.
[5] P. Boscolo, M. Carmignani, Neurohumoral blood pressure regulation in lead exposure., Environ Health Perspect, 78 (1988) 101-106.
[6] D. Martin, T. Glass, K. Bandeen-Roche, A. Todd, W. Shi, B. Schwartz, Association of blood lead and tibia lead with blood pressure and hypertension in a community sample of older adults., Am J Epidemiol, 163 (2006) 467-478.
[7] S. Park, B. Mukherjee, X. Xia, D. Sparrow, M. Weisskopf, H. Nie, H. Hu, Bone Lead Level Prediction Models and Their Application to Examine the Relationship of Lead Exposure and Hypertension in the Third National Health and Nutrition Examination Survey, Journal of Occupational and Environmental Medicine, (2009) 1422-1436.
[8] J. Sardans, F. Montes, J. Penuelas, Determination of As, Cd, Cu, Hg and Pb in biological samples by modern electrothermal atomic absorption spectrometry, Spectrochimica Acta Part B-Atomic Spectroscopy, 65 (2010) 97-112.
[9] M. Farinas, J. Garcia, S. Martin, R. Crecente, C. Latorre, Determination of Cr and Ni in Orujo spirit samples by ETAAS using different chemical modifiers, Food Chemistry, (2008) 177-186.
[10] F. Reuter, W. Raynolds, Metal analysis in biological material by energy dispersive x-ray fluorescence spectroscopy., Adv Exp Med Biol, 48 (1974) 621-637.
[11] P. Custodio, M. Carvalho, F. Nunes, S. Pedroso, A. Campos, Direct analysis of human blood (mothers and newborns) by energy dispersive X-ray fluorescence, Journal of Trace Elements in Medicine and Biology, 19 (2005) 151-158.
[12] A. Rindby, Software for Energy-Dispersive X-Ray Fluorescence, X-Ray Spectrometry, 18 (1989) 113-118.
[13] J. Boman, J. Isakson, Comparison between 2 X-ray-analysis software packages, X-Ray Spectrometry, 20 (1991) 305-314.
[14] J.C. Miller, J.N. Miller, Statistics and chemometrics for analytical chemistry, 4th ed. ed., Prentice Hall, Harlow, 2000.
D. Guimarães et al.
EXRS2010 Conference Proceedings 130
[15] H. Bielarczyk, X. Tian, J. Suszkiw, Cholinergic denervation-like changes in rat hippocampus following developmental lead exposure., Brain Res, 708 (1996) 108-115.
[16] H. Santos, J. Capelo, Trends in ultrasonic-based equipment for analytical sample treatment., Talanta, 73 (2007) 795-802.
[17] C. Maduro, G. Vale, S. Alves, M. Galesio, M. da Silva, C. Fernandez, S. Catarino, M. Rivas, A. Mota, J. Capelo, Determination of Cd and Pb in biological reference materials by electrothermal atomic absorption spectrometry: A comparison of three ultrasonic-based sample treatment procedures., Talanta, 68 (2006) 1156-1161.
[18] M.M. R. Martoja, Initiation aux tecniques de l'histologie animal, Masson and Cie, Paris, 1967.
[19] R.D. Lillie, Histopathologic technic and practical histochemistry, Blakiston, New York, 1954.
[20] D. Widzowski, D. Cory-Slechta, Homogeneity of regional brain lead concentrations, Neurotoxicology, 15 (1994) 295-307.
[21] E. Fjerding, G. Danscher, E. Fjerding, Hippocampus- selective concentration of lead in normal rat-brain, Brain Research, 80 (1974) 350-354.
[22] T. Ma, H. Chen, D. Lim, A. Hume, I. Ho, Effects of subacute lead exposure on [H-3]MK-801 binding in hippocampus and cerebral cortex in the adult rat, BRAIN RESEARCH, (1997) 187-192.
[23] P.R. Wheater, H.G. Burkitt, Functional histology : a text and colour atlas, 2nd ed. / revised and edited by Paul R. Wheater and H. George Burkitt / drawings by Philip J. Deakin. ed., Churchill Livingstone, Edinburgh, 1987.