Embed Size (px)
Citation preview
ISBN : 978-979-8452-71-0
MINISTRY OF ENVIRONMENT AND FORESTRY
RESEARCH, DEVELOPMENT AND INNOVATION AGENCY2016
Proceedings of International Conference of Indonesia Forestry Researchers III-2015
“Forestry research to support sustainable timber production and self-sufficiency in food, energy, and water”
Intern
atio
nal C
onferen
ce of In
donesia
Forestry R
esearch
ersO
ctober 2
1 - 2
2, 2
01
5
rdPR
OCEED
ING
S O
F TH
E 3
INAFO
R 2
01
5International Conference of Indonesia Forestry ResearchersOctober 21 - 22, 2015
rdPROCEEDINGS OF THE 3 INAFOR
ISBN 978-979-8452-71-0

106
Paper Presented at The International Conference of Indonesia Forestry Researchers III 3rd INAFOR 2015 Bogor, 21-22 October 2015
PAPER A13 - Role of forest in livelihood strategy in the peat land of Central Kalimantan ex-mega rice project area
Noviana Khususiyah1 and S.Suyanto1
1World Agroforestry Centre (ICRAF), Jl. Cifor, Situ Gede, Sindang Barang, Bogor, Indonesia Corresponding Email: [email protected]
ABSTRACT
Overexploitation of natural resources leading to forest degradation has occurred due to increased human populations and economic pressures. Politics also plays an important role, for example, in the conversion of forests to rice fields on peatland in the ex-mega-rice project in Central Kalimantan. Yet, forests are important sources of livelihoods for local communities. The degradation of forests as a result of the ex-mega-rice project had considerable impact on local communities. We carried out a study in Block A (southern part) and Block E (northern part) of the project area in Kapuas district, Central Kalimantan, to assess the role of forests for local communities. The sites were chosen to represent both degraded and functional forested areas. Focus-group discussions and household surveys were conducted to collect data. The results were showed that forests were less available in Block A, since accessing forests far away was costly, not many villagers in Block A were interested in extraction of forest products. However, forests remained an important resource for poor people who had limited access to other income sources. In contrast, the forests in Block E were more available and accessible. About 35.5% of income in Block E came from gemor (a forest product) and about 57% of respondents collected it. Forest extraction reduced the inequality of income in Block A but increased it in Block E. Keywords: ex-mega rice project area, forest, livelihoods, poverty and equity. 1. INTRODUCTION Current international negotiations on incentive systems for reducing emissions from deforestation and forest degradation in developing countries (REDD) have yet to clarify the scope of the intended rules and the relationship with other types of land use change emissions (previously deforested peatlands, agriculture and trees outside forest). However, the landscape-scale relationships between rural livelihoods, economic development and conservation and enhancement of above and belowground carbon stocks need to be understood for any of the institutional mechanisms currently discussed. Within Indonesia, the peatlands of Central Kalimantan are a recognized hotspot of emissions, with a complex history of planned and spontaneous land use change as their cause, within a peat dome environment that provides strong linkages between water tables and associated fire risk and requires the integration of management on a scale considerably above the village level. This article details a livelihood assessment that included an analysis of land management, land tenure, livelihood, poverty, and equity for the area known as the Ex-Mega Rice Project’ in Central Kalimantan, focusing on Block A (strongly affected by the Rice Project) and Block E (relatively intact) that cover parts of the major peat dome and adjacent rivers.

107
Paper Presented at The International Conference of Indonesia Forestry Researchers III 3rd INAFOR 2015 Bogor, 21-22 October 2015
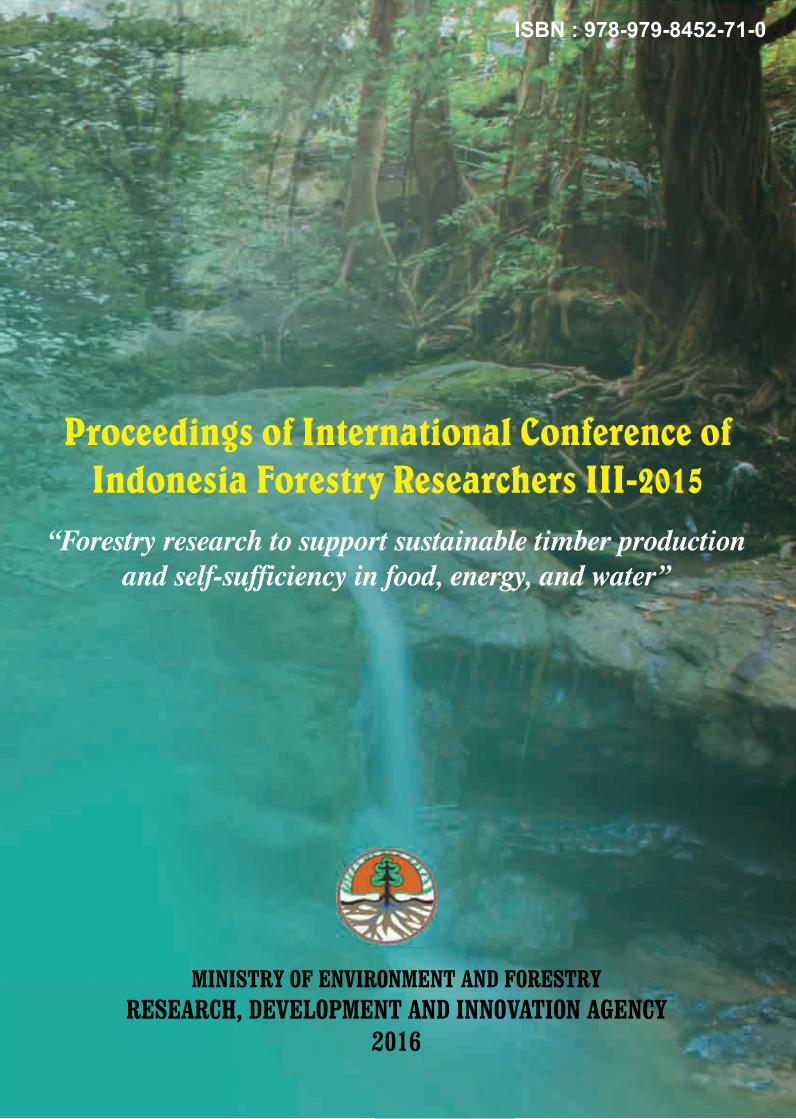
2. METHOD 2.1 General description of the study area Land use intensification has generally progressed from more accessible peat sites to more remote ones and from downstream (south) to upstream (north) in this peatland ecosystem. The Block A site was settled and logged out much earlier than the Block E site. The Block A site has been subjected to substantial development activities, which have included the Mega Rice Project and oil palm plantations. The Block E site is still largely under forest vegetation closely allied to the conservation of the orangutan. The area represents these villages belong to two sub-districts (Kecamatan) of the District (Kabupaten) Kapuas: Mantangai sub-districts and Timpa sub-districts. Overall, there are 14 settlements along the Kapuas River. For the in-depth study and households survey, eight settlements were selected, involving six villages and two hamlets. Block A contained Desa Mantangai Hulu, Desa Kalumpang, Desa Sei Ahas and Desa Katunjung. Block E contained Desa Tumbang Muroi, and Dusun Tanjung Kalanis (Kecamatan Mantangai); Desa Petak Puti and Dusun Kanjarau (Kecamatan Timpa). Sample villages were purposefully selected based on size of settlement area. Consequently, villages rather than hamlets were selected in order to sample a larger population spread over a greater area.
Figure 1: Location of study area in Central Kalimantan
2.2 Data collection Focus group discussions were used to gather information on sources of livelihood, demography, poverty, land tenure, and commercial activities. Focus groups discussions were conducted in four settlements/villages in each block. Around eight people representing the formal and informal leaders were invited to attend two days of discussion. Following up on issues raised at the focus group discussions, more quantitative data were collected through a survey at household level. A total of 30 respondents for each block (60 for the whole study) were randomly. As much as possible, both the husband and wife in each household were interviewed together.

108
Paper Presented at The International Conference of Indonesia Forestry Researchers III 3rd INAFOR 2015 Bogor, 21-22 October 2015
3. RESULT AND DISCUSSION 3.1 Livelihoods: from past to present 3.1.1 Forest extraction Logging In the study area, the Dayak people perceived up to this day that forest are an open access resource, implying that anyone from their community along the river can access the forest without being restricted by any territorial ties. People from the study area currently look for gemor in areas upstream, for example, as more accessible supplies are depleted. As further detailed in the tenure report, the Dayak claim on forest access is not accepted by forestry authorities. Rules for forest access or management defined externally are not accepted by the Dayak villages. The Dayak people stated that the forest was occupied by a mystic spirit. To access and exploit the forest, the villagers needed to ask for the permission of the spirit (rather than obtaining government permits). Before the 1970s, people used timber for their own consumption, such as for housing and boat (Klotok) construction. In this period the non-timber forest products, such as getah jelutung (Dyera costulata), getah hangkang (Palaquium leiocarpum Bl.), getah nyatu (Palaquium javense), getah katiau (Ganua motleyana), dammar (Shorea sp.) and rattan were more important. Since the 1970s, timber commercialization commenced and reached a peak in the period 1990-1995. Local people called that period “Jaman Ramin” (the ramin era). Ramin (Gonystylus bancanus) was the most sought after species. Others valuable timbers were kayu ulin (Eusideroxylon zwageri), meranti (Shorea sp.), jelutung (Dyera costulata), belangiran (Shorea belangiran), kemedang (Litsea spp.), and kruing (Dipterocarpus sp.). Since the Mega Rice Project in 1995, it became difficult to source valuable timber species. Thus, non-timber forest products, such as rattan and gemor (markets emerged in the 1970’s, see below) became more dominant than timber. In recent years (2007-2008), logging of timber species such as meranti, kruing, benuas, and kemedang has occurred again, but it is of lower importance than the non-timber forest products. The reduction in forest area in the period 1970–1995 was due mostly to illegal logging, agricultural land clearing and logging activities by concession companies. In the period 1996 - 2009, the Mega Rice Project, forest fires, land clearing for agriculture, and establishment of oil palm were the main causes of a reduction in forest area. Continuous deforestation caused the forest to become more distant from the villages. The distance to the forest in Block A is farther than in Block E. Gemor (Alseodaphne coriacea) Farmers became aware of the value of the bark of gemor (Alseodaphne coriacea) in the 1970's from traders from the Banjar, where the bark had an established commercial value. The bark of gemor plants can be used to effectively repel mosquitoes (Zulnely and Martono, 2003) The traders asked farmers to collect gemor bark, which the traders then purchased. Initially, not many farmers were involved in collecting gemor. However, now gemor collection has become important in many livelihoods, especially for villagers around Block E. The collection of gemor involved felling the big trees and removing the bark. Gemor bark could be sold fresh as well as dry. Dry bark fetched a higher price than fresh bark. In the past, only dry bark could be sold and it is only recently that both fresh and dry bark have been sold, probably reflecting resource depletion across the supply zone. In the past, big trees of gemor

109
Paper Presented at The International Conference of Indonesia Forestry Researchers III 3rd INAFOR 2015 Bogor, 21-22 October 2015
with a diameter of around 90 cm were available in the forest, producing around 5-7 quintal (1 quintal = 100 kg) of dry bark. Now, gemor trees are limited to a diameter of around 5-15 cm that produces only around 10-20 kg of dry bark.
Figure 2: Drying of Gemor
3.1.2 Fishing Fishing provides a main source of income as well as local consumption. Initially, fishing was part of the daily life of most villagers but it has gained a more commercial purpose because of increasing law enforcement regarding illegal logging activities. Fishing thus became more important to villager livelihood as a source of cash income. This situation was supported by a better price for fish and an increase in the many traders who came to the villages to buy the catch. Four types of fishing were identified in the study area : Fishing in the river, Fishing in peat areas, Fishing in canals, beje. 3.1.3 Labor in gold mining Working in gold mining was also an important livelihood. People, who worked in gold mining, migrated for a maximum of one year, mostly to Kecamatan (sub-districts) Mentangai and Kecamatan Timpa, two neighbouring sub-districts within Kabupaten (District) Kapuas. Gold miners normally sent home their money to their village while they were still working out of village. Villagers started gold mining using spray machinery in the study area in the 1980’s. The technique was adopted from similar activity in Palangkaraya. The current popular practice for gold mining along the river was to use suction machinery. Villagers were no longer attracted to gold mining inland using spray machinery. Most villagers became paid gold miners in a group. One group had a team of four laborers. The investors behind the gold mining activities by the villagers were gold traders from Balikpapan (the capital of East Kalimanta province). Gold miners sold their gold to these traders/investors. Farmers calculated the gold production based on the amount of fuel they used. They estimated that for 1 drum of fuel (approximately 200 l) they could get 8-9 gram of gold. The current price of gold was IDR 200 000 per gram, while the price of fuel varied between IDR 600 000 to IDR 1 000 000 per drum. Mercury was used in the gold mining process, polluting the Kapuas river. Intensive gold mining also caused bank collapses along the river, increasing turbidity and sedimentation in the river. The hazardous impact of gold mining to the environment and the health of the people were not fully understood by the villagers.

110
Paper Presented at The International Conference of Indonesia Forestry Researchers III 3rd INAFOR 2015 Bogor, 21-22 October 2015
3.2 Relative importance of components of the livelihood portfolio A sample of villagers was used to qualitatively assess the relative importance of livelihood (top five values). There was a different pattern in the relative importance of livelihoods within the villages and between the blocks. In the villages of Mentangai Hulu and Katunjung (lower part of Block A), agriculture (rubber and swidden-rice cultivation) was more important than fishing and forest extraction. In Mentangai Hulu village, rubber was the most important source of livelihood followed by swidden-rice cultivation and fishing, with a small contribution from forest extraction and working in gold mining. Kalumpang village was similar to Mentangai Hulu, except that the extraction of rattan was important (ranked third). In the middle of the lower part of the study area (Sei Ahas and Katunjung villages), both agriculture (rubber and paddy) and forest extraction were equally important sources of livelihood. Logging of timber was second most important in Sei Ahas village and gemor was the most important livelihood in Katunjung village. Rubber and rice were also important. In block E, contrary to the Block A results, the major livelihoods were fishing and forest extraction of gemor. 3.3 Change in the relative importance of livelihood source over time In this section the change in relative source of livelihood over time is analyzed using four time periods: prior to 1970, before the Mega Rice Project (1970-1995), after the Mega Rice Project (1996-2006), and 2007-2008. The time classification was draw based on policies changed that affected of local livelihoods. Those policies were (1). Policy on forest concessions in 1970’s; (2). Mega rice project in 1995/1996; (3). Combating of illegal logging since 1995 and (4). Banning of using fire for land clearing since 2007. There were six important sources of livelihood: swidden-rice cultivation, smallholder plantations, forest timber extraction, non-timber forest products, fishing and labor. 3.3.1 Prior to 1970 In the period prior to 1970, local people were not yet logging timber for commercial purposes. Timber was used for their own consumption, such as for house construction and boats (klotok). Non-timber forest products such as rattan, dammar, jelutung, gaharu ramin, katiau, kalanis, ehang, nyatu and animals (snake, bird and deer) were very important sources of livelihood. Swidden-rice cultivation was practiced both in Block A and Block E. Fishing for local consumption was a very important source of livelihood. Smallholder plantations were not yet being actively developed. 3.3.2 Before the Mega Rice Project (1970-1996) The relative importance of the means of livelihood changed dramatically in the period 1970-2006 before the Mega Rice Project, in association with the commencement of commercial logging. Large-scale commercial logging in Indonesia started in 1967, when the government of Indonesia took control of forest management in the country. They initiated a mechanism of concessions that allocated forest management to privately owned companies. The distribution of forest under the control of private logging companies made Indonesia the world’s largest exporter of tropical timber, shipping nearly 300 million m3 to international markets during the 1970’s (Barr, 2001). The timber concession companies: PT. Mangkatib Raya I, PT. Mangkatib Raya II, PT. Jayanti Jaya, PT. Sumber Alam and PT Sumber Usaha operated in the study area in the early 1970’s logging commercial timber in the original mature high forests. The logging of commercial timber became the most important source of villager livelihood. Respondents said that in that period, villagers became rich from the logging. The non-timber forest products became less important.

111
Paper Presented at The International Conference of Indonesia Forestry Researchers III 3rd INAFOR 2015 Bogor, 21-22 October 2015
3.3.3 After the Mega Rice Project (1997-2006) After the Mega Rice Project, the relative importance of logging timber began to decline. Smallholder plantations (mostly rubber and rattan) and swidden-rice cultivation were very important in Block A, while in Block E, non-timber forest products and fishing were more important sources of livelihood. One exception was labor/working in gold mining that was important in Tumbang Muroi village in Block E. 3.3.4 The current situation (>2007) After 2007, in the lower parts of the study area (Mentangai hulu and Kalumpang villages), smallholder plantations and swidden-rice cultivation became the most important sources of livelihood, followed by fishing. Timber and non-timber forest extraction were of lesser importance. In the middle part of the study area (Sei Ahas and Katunjung villages), the forest was still an important source of livelihood, especially for gemor. In the upper streams of the area (Block E), livelihood from agriculture (rice and smallholder plantations) became less important, although there had been a tendency to develop rubber plantations in recent years. Non-timber forest products (gemor and rattan) and fishing were major sources of livelihood. 3.4 Poverty and equity 3.4.1 Land holding Based on our survey of 60 households and within the local concept of land tenure (see companion report), the average land holding of Block A villagers was larger (10.73 ha) than that of Block E villagers (4.14 ha). Villagers in Block A were more dependent on agriculture land especially on rubber plantation. The average rubber plantation land in Block A and E were 5.49 ha and 2.37 ha per household, respectively. This accounted for more than 50% from total land holding in both blocks; this does not include the fallow parts of the swidden cycle and other forest areas that the villagers consider as under their control. Currently cropped swiddens with rice in Block A were 0.7 ha/household, while in Block E it was almost none (0.03 ha). Bush fallow Rubber accounted for 3.9 ha/ household for Block A farmers and 2.2 ha/ household for Block E farmers (Table 1). Table 1: Average land holding by land use in study site
Land use
Block A Block E Total
Average plot per
household
Average land
holding (ha)
Average plot per
household
Average land
holding (ha)
Average plot per
household
Average land
holding (ha)
Swidden‐rice cultivation 0.7 0.86 0.1 0.03 0.7 0.45
Rubber plantation 2.2 5.49 1.5 2.37 3.7 3.94
Rattan plantation 0.2 0.48 0.1 0.25 0.3 0.36
Bush fallow 1.5 3.90 0.7 1.49 2.2 2.69
Total 4.6 10.73 2.4 4.14 6.9 7.44
Number of respondent 30 30 60
3.4.2 Poverty indicators: participatory assessment The poverty indicators discussed by the villagers were not only based on income, but ranged more widely including: education, health, jobs, and quality of the house. These indicators are

112
Paper Presented at The International Conference of Indonesia Forestry Researchers III 3rd INAFOR 2015 Bogor, 21-22 October 2015
similar to the components of the human development index (HDI). The HDI provides a composite measure of three dimensions of human development: living a long and healthy life (measured by life expectancy), being educated (measured by adult literacy and enrolment at the primary, secondary and tertiary levels) and having a decent standard of living (income). The HDI for Indonesia in 2005 was 0.728, which gave the country a rank of 107 out of 177 countries. Life expectancy was 69.7 years, with the adult literacy rate (for age 15 and older) 90.4%, and the combined primary, secondary and tertiary gross enrolment ratio was 68.2%. (Human Development Index Report, 2008). From a sub-sample of 60 respondents, two poverty indicators were calculated (Table 2). The adult literacy rate in the study area was 98.7%, being slightly higher than at the provincial and national levels. However, the school dropout rate for ages 7-12 years and ages 13-15 years were higher than the provincial and national figures. The school dropout rate for ages 13-15 year was very high (24%). This indicated a problem in education at the junior high school level. It seems that the Program wajib belajar 9 tahun (the compulsory education program) in the study area had not been a success. Others poverty indicators are BLT (Bantuan Langsung Tunai) and Raskin (Bantuan Beras Untuk Keluarga Miskin) (Table 13). BLT represents the government’s effort to anticipate the effect of the increase in fuel price on poor households. Under this program, poor households receive IDR 200 000 per month. Raskin is also a government program for poverty alleviation. Under this program, poor households receive 20 kg rice/month. In the study area, however, rice from this program was distributed equally to all members of the village. Table 2: Poverty indicators in education
Indicators Study Site Central Kalimantan
(2007) National (2007)
Adult literacy rate (%)
Ages 15 ‐55 years 98.7 98.05 88.07
School Dropout (%):
Ages 7‐12 years 3.0
0.81
0.67
Ages 13‐15 years
24.0 4.30 4.21
3.4.3 Income analysis The calculation of income included the value of commodities consumed, with 95% of income from swidden-rice cultivation and 37% of income from fishing in Block A being consumable income. In Block E, 56% of income from swidden-rice cultivation and 13% of income from fishing made up the consumable income. Other sources of income, such as from smallholder plantations and forest extraction were mostly cash. While the average total income per year per household in Block E was slightly higher than in Block A, the composition of income sources was very different. Agriculture was the major source of income in Block A, while forest extraction was the major source of income in Block E. In Block A, the highest source of income was from rubber (31%), followed by fishing (17%), entrepreneurial activities (12.6%) and professional work (11.0%). Swidden-rice cultivation was also important (9.0%). Income from forest extraction was low (8.40%) (Table 3). In contrast, fishing (39%) and gemor extraction (35.3%) were the major sources of income in Block E, with their total income share being 74.3%. This indicated a high dependency on open access to natural resources. Other sources of income from open access to natural

113
Paper Presented at The International Conference of Indonesia Forestry Researchers III 3rd INAFOR 2015 Bogor, 21-22 October 2015
resources were timber logging (5.2%) and rattan extraction from the forest (3.4%). Income from working in gold mining represented 6.5%. Although there was a tendency for rubber plantation establishment in Block E, its contribution to income was relatively low (4.3%), as was that from rattan gardens (3.4%). Swidden-rice cultivation was not common, accounting for just 0.4%. Table 3: Sources of income in Block A and Block E in 2008
Sources of Income
Income per Household Income per Capita
Block A Block E Block A Block E
Rupiah % Rupiah % Rupiah Rupiah
1. Agriculture
Swidden‐rice cultivation
1,447,083 9.0 73,500 0.4 364,811 16,705
Rubber plantation 5,023,573 31.1 899,680 4.3 1,266,447 204,473
Rattan plantation 162,167 1.0 11,000 0.1 40,882 2,500
2. Forest Extraction
Timber 1,071,333 6.6 1,081,667 5.2 270,084 245,833 Gemor 215,200 1.3 7,413,167 35.3 54,252 1,684,811
Rattan 70,500 0.4 704,000 3.4 17,773 160,000
3. Fishing 2,737,967 17.0 8,173,533 39.0 690,244 1,857,621
4. Worker (laborer)
Gold mining 120,000 0.7 1,363,633 6.5 30,252 309,917
Sawmill 238,000 1.5 ‐ 0.0 60,000 0
Other 717,000 4.4 423,333 2.0 180,756 96,212
5. Firewood 238,000 1.5 242,667 1.2 60,000 55,152
6. Entrepreneurship 2,031,333 12.6 388,333 1.9 512,101 88,258
7. Professional 1,781,333 11.0 ‐ 0.0 449,076 0
8. Other 294,133 1.8 207,950 1.0 74,151 47,261
9. Total Income Per Year
16,147,623 100 20,982,463 100 4,070,829 4,768,742
10. Income per day 11,153 13,065
Daily income per capita of respondents in Block A was IDR 11 153 (USD $1.09)8 and in Block E was IDR 13 065 (USD $1.28), while the average family size ranged from 3.97 to 4.4 members at both sites. Using the international poverty line standard of USD $1 a day, the percentage of respondents living below the international poverty line in Block A (53%) was higher than in Block E (33%). 3.4.4 Equity analysis In order to analyze the equity of income, decomposition analysis was applied using the Gini coefficient that ranges from 0 (equal distribution of income) to 1 (total concentration of income). Gini decomposition is commonly applied in economic analysis (Alderman and
8 Average exchange rate in June 2009 was USD 1 = IDR 10,215.

114
Paper Presented at The International Conference of Indonesia Forestry Researchers III 3rd INAFOR 2015 Bogor, 21-22 October 2015
Garcia, 1993) using the Gini decomposition formula that was developed by Fei, Ranis, and Kuo (1978) and Pyatt, Chen, and Fei (1980). The computation results of the decomposed Gini ratios for income are shown in Table 4. The overall Gini ratios for income in Block A (0.26) and Block E (0.22) were relatively small. This indicated that incomes in both areas were equally distributed. Nonetheless, the income from fishing reduced the overall inequality of income distribution at both sites, as the concentration coefficients were less than unity. This suggests that the income from fishing was relatively equally distributed, making this income important in reducing poverty and increasing income equality. In addition, about 97% of respondents engaged in fishing. Forest extraction reduced the inequality of income in Block A but it increased the inequality of income in Block E. Since less forest area was available in Block A, with additional forest far away and thus costly to access, not many villagers in Block A were interested in working in forest extraction. However, the forest was an important income source for poor people who had limited income opportunities. In contrast, the forest areas in Block E were more available. Gemor was an important and valuable forest product. About 35.5% of income in Block E came from gemor and about 57 % of respondents collected gemor. The coefficient concentration for smallholder plantations (0.95) was almost unity in Block A, thus the impact on inequality was not very clear. In Block E, smallholder plantations reduced income inequality but the share of income was low (4.34%). Income from growing rice was more evenly distributed at both sites. However, in Block E only 7% of respondents were growing rice that only produced a very small share of income (0.35%). Thus, the impact analysis on income inequality in Block E was not relevant. Table 4: Income inequality in Block A and Block E in 2008
Source of income
Block A Block E
Income Share
Coefficient Concentration
Pseudo Gini ratio
Income Share
Coefficient Concentration
Pseudo Gini ratio
1. Agriculture
Swidden‐rice Cultivation
8.96 0.82 0.21 0.35 1.52 0.34
Tree plantation 32.11 0.95 0.24 4.34 0.28 0.06
2. Forest Extraction 8.40 0.22 0.06 43.84 1.79 0.40
3. Fishing 16.96 0.15 0.04 38.95 0.76 0.17
4. Worker (laborer) 6.66 0.84 0.22 8.52 0.87 0.19
5. Firewood 1.47 0.43 0.11 1.16 0.43 0.10
6. Entrepreneurship 12.58 3.38 0.87 1.85 0.37 0.08
7. Professional 11.03 2.19 0.56 0.00 0.00 0.00
8. Other 1.82 0.6 0.15 0.99 1.53 0.34
Total Income 0.26 0.22

115
Paper Presented at The International Conference of Indonesia Forestry Researchers III 3rd INAFOR 2015 Bogor, 21-22 October 2015
Working, especially in gold mining, made up a very important share of total income (6.7-8.5%) and the concentration coefficient was lower than unity for both sites, which implied a distribution that was equal. It is important to note that for poor farmers selling their labor is a very important income source. Collecting firewood also reduced income inequality at both sites. About 93-97% of respondents were involved in collecting firewood that was all used for household consumption. Non-farm income (entrepreneurship and professional work) was more unequally distributed in Block A. Income from entrepreneurship accounted for 12.58% and income from professional work was 11.03% of total income. Most non-farm income came from professional work requiring higher skills, higher education and large amounts of capital, such as teaching, government positions, trading, rubber and rattan collecting, and commissioners. Therefore, non-farm income widened the income disparities between individuals and households in the community. However, in Block E, there were no professional workers among the respondents. Non-farm income came from one type of intrepreneurship only, namely warung (small shops). The income share from non-farm income was very low (1.85%). This suggests the use of non-farm income to decrease income inequality in Block E was low. 3.5 Profitability analysis (gemor extraction) In the past, big trees of gemor with a diameter of around 90 cm were available in the forest, producing around 5-7 quintal (1 quintal = 100 kg) of dry bark. Now, gemor trees are limited to a diameter of around 5-15 cm that produces only around 10-20 kg of dry bark. Every villager had free access to harvest gemor in the forest. No local ownership existed for gemor trees. Farmers usually went to the forest for 7-14 days to harvest the bark. Non-labor cost approximately IDR 525 000/person for food, levy to enter tatah and gasoline for 13 person-days in the forest. In one trip a farmer could harvest 430 kg of gemor bark. The current price for dry gemor in study site was IDR 4 000 Kg-1. The price for dry gemor in area close to palangkalaraya was 6 500/ kg (Kompas, July 13, 2009). The return to labor was high (IDR 89 179). It was higher than the daily wage for agriculture (IDR 30 000), even it was higher than the return to labor for smallholder rubber (IDR 65 365). Table 5: Revenue, cost and return to labor of gemor collection
Total Gemor collection (Kg dry Bark) 430
Price (IDR Kg‐1
) 4,000
Revenue (IDR) 1,720,000
Cost (IDR) 525,000
Levy to enter tatah (IDR) 108,333
Meal (IDR) 316,667
Gasoline (IDR) 100,000
Income (IDR) 1,195,000
Labor use (person‐day) 13.4
Return to labor (IDR) 89,179

Paper Presented at The International Conference of Indonesia Forestry Researchers III 3rd INAFOR 2015
Bogor, 21-22 October 2015
116
However, villagers did not feel confident about the future of gemor harvesting. This was based on the difficulties they encountered when carrying out gemor harvesting in the forest, such as: (i) Trees were increasingly farther away from their settlements and more difficult to reach (ii) Gemor trees were difficult to find and those that they could find were small. (iii) Farmers would harvest gemor of any size, thus there was no chance for a tree to reach a
large diameter. (iv) High competition, as more and more farmers were embarking on gemor
harvesting. (v) Forest fire and over harvesting threatened the growth of gemor trees. 4. CONCLUSION Based on our survey of 60 households and within the local concept of land tenure, the average land holding of Block A villagers was larger (10.73 ha) than that of Block E villagers (4.14 ha). In Block A, the highest source of income was from rubber (31%), in contrast, fishing (39%) and gemor extraction (35.3%) were the major sources of income in Block E, with their total income share being 74.3%. This indicated a high dependency on open access to natural resources. Forest extraction reduced the inequality of income in Block A but it increased the inequality of income in Block E. Since less forest area was available in Block A, with additional forest far away and thus costly to access, not many villagers in Block A were interested in working in forest extraction. However, the forest was an important income source for poor people who had limited income opportunities. In contrast, the forest areas in Block E were more available. Gemor was an important and valuable forest product. About 35.5% of income in Block E came from gemor and about 57 % of respondents collected gemor. REFERENCE Alderman, H., & Garcia, M. (1993). Poverty, household food security and nutrition in rural Pakistan.
Research Report 96. International Food Policy Research Institute, Washington DC. Angelsen, A., & Lund, J.F. (2011). Designing the Household Questionnaire. In Angelsen A, Larsen
HO, Lund JF, Smith-Hall C, Wunder S. Measuring Livelihoods and Environmental Dependence: Methods for Research and Fieldwork. Washington: Earthscan.
Badan Pusat Statistik. (2008). Data dan Infromasi Kemiskinan Tahun 2007 Buku 1: provinsi. BPS Jakarta-Indonesia
Badan Pusat Statistik. (2008). Data dan Infromasi Kemiskinan Tahun 2007 Buku 2: Kabupaten/Kota. BPS Jakarta-Indonesia
Badan Pusat Statistik Kalimantan Tengah. (2009). http://kalteng.bps.go.id/ Barr, C. (2001). Banking on Sustainability: Structural Adjustment and Forestry Reform in Post- Suharto
Indonesia. Macroeconomics for Sustainable Development Program Office, WWF, Washington DC. 140pp.
Fei, J.C.H., Ranis, G., & Kuo, S.W.Y. (1978). Growth and family distribution of income by factor component. Quarterly Journal of Economics 92:17-53.
Kompas. (2009). Hasil Hutan Marak, Pencarian Gemor Saat kemarau. 13 Juli 2009. Pyatt, G., Chen, C., & Fei, J. (1980). The distribution of income by factor components. Quarterly Journal
of Economics 95 (3): 451^173.

Paper Presented at The International Conference of Indonesia Forestry Researchers III 3rd INAFOR 2015
Bogor, 21-22 October 2015
117
Suyanto, S., Tomich, T.P., & Otsuka, K. (2001). Land tenure and farm management efficiency: the case of smallholder rubber production in customary land areas of Sumatra. Agroforestry Systems. 52(2):P. 145-160.
UNDP. (2009). Human Development Report 2007/2008 Indonesia. http://hdrstats.undp.org/countries/country_fact_sheets/cty_fs_IDN.html
Van Beukering P.J.H., Schaafsma M., Davies O., & Oskolokaite I. (2008). The economic value of peatland resources within the Central Kalimantan Peatland Project in Indonesia. Palangkaraya, unpublished report
Zulnely, & Martono, D. (2003). The Possible Utilization of Gemor (Alseodaphne sp.) Bark as Material for the Manufacture of Anti Mosquito Agent.

ISBN : 978-979-8452-71-0
MINISTRY OF ENVIRONMENT AND FORESTRY
RESEARCH, DEVELOPMENT AND INNOVATION AGENCY2016
Proceedings of International Conference of Indonesia Forestry Researchers III-2015
“Forestry research to support sustainable timber production and self-sufficiency in food, energy, and water”
Intern
atio
nal C
onferen
ce of In
donesia
Forestry R
esearch
ersO
ctober 2
1 - 2
2, 2
01
5
rdPR
OCEED
ING
S O
F TH
E 3
INAFO
R 2
01
5International Conference of Indonesia Forestry ResearchersOctober 21 - 22, 2015
rdPROCEEDINGS OF THE 3 INAFOR
ISBN 978-979-8452-71-0


![IEEE 979-2015 draft[1]](https://img.pdfslide.us/doc/110x75/55cf8ea5550346703b943882/ieee-979-2015-draft1.jpg)