Embed Size (px)
Citation preview

Proceedings from the Second Annual Public Workshop for the SONGS Mitigation Project
February 27, 2002
San Clemente Community Center, San Clemente, CA
Edited by Dan Reed, Steve Schroeter, Mark Page
Marine Science Institute University of California, Santa Barbara
Submitted to the California Coastal Commission
April 3, 2002

Acknowledgements
We gratefully acknowledge the following team of scientists from UCSB’s Marine Science Institute’s SONGS Mitigation Project for their hard work and dedication in gathering the information contained in this report: David Huang, Dan Malone, Jake Bunch, Dale Gates, Immanuel Huasig, Clint Nelson, Jonathan Schaffer, Garret Snyder, Danielle Toole, Denise Weisman, Greg Welch, and Jenny Wolfe. Ms. Jody Loeffler provided administrative services for the project and helped organize the workshop. The work contained in these proceedings was funded by Southern California Edison as required by the California Coastal Commission under SCE’s coastal development permit (No.6-81-330-A, formerly 183-73) for Units 2 and 3 of the San Onofre Nuclear Generating Station.

CONTENTS
INTRODUCTION 4
STATUS OF THE SAN DIEGUITO LAGOON RESTORATION PROJECT - SPRING 2002, David W. Kay 6
WETLAND RESTORATION: PRE-RESTORATION MONITORING, Mark Page 11
OVERVIEW OF THE EXPERIMENTAL REEF DESIGN AND MONITORING, Dan Reed 41
PHYSICAL CHARACTERISTICS OF THE EXPERIMENTAL PHASE OF THE SAN CLEMENTE ARTIFICIAL REEF, Dan Reed 48
GIANT KELP, Dan Reed 62
KELP FOREST BENTHIC COMMUNITY, Steve Schroeter 86
KELP-BED FISHES, Todd W. Anderson 105
BEACH MONITORING, Robert Grove 123
ARTIFICIAL REEF STUDIES PLANNED FOR 2002, Steven Schroeter 134

INTRODUCTION In 1974, the California Coastal Zone Conservation Commission issued a permit (No. 6-81-330- A, formerly 183-73) to Southern California Edison Company for Units 2 and 3 of the San Onofre Nuclear Generating Station (SONGS). A condition of the permit required study of the impacts of the operation of Units 2 and 3 on the marine environment offshore from San Onofre, and mitigation of any adverse impacts. As a result of the impact studies, in 1991 the Coastal Commission added new conditions to mitigate the adverse impacts of the power plant on the marine environment which require SCE and its partners to: (1) create or substantially restore at least 150 acres of southern California wetlands, (2) install fish barrier devices at the power plant, and (3) construct a 300-acre kelp reef (Conditions A through C). The 1991 conditions also require SCE to provide the funds necessary for Commission contract staff technical oversight and independent monitoring of the mitigation projects (Condition D). In 1993, the Commission added a requirement for SCE to partially fund construction of an experimental white sea bass hatchery. Due to its experimental nature, the Commission did not assign mitigation credit to the hatchery requirement. After extensive review of new kelp impact studies, in April 1997 the Commission approved amended conditions which: (1) reaffirm the Commission’s prior decision that San Dieguito is the site that best meets the permit’s standards and objectives for wetland restoration, (2) allow up to 35 acres credit for enhancement of wetland habitat at San Dieguito Lagoon by keeping the rivermouth permanently open, and (3) revise the kelp mitigation requirements in Condition C. Specifically, the revised Condition C requires construction of an artificial reef large enough to sustain 150 acres of medium to high density kelp bed community (which could result in a reef larger than 150 acres) together with funding for a mariculture/marine fish hatchery as compensation for the loss of 179 acres of high density kelp bed community resulting from the operation of SONGS Units 2 and 3. The artificial reef is to consist of an initial small experimental reef (~ 22 acres) and a subsequent larger mitigation reef that meets the 150-acre requirement. The purpose of the experimental reef is to determine which combinations of substrate type and substrate coverage will most likely achieve the performance standards specified in the permit. The design of the mitigation reef will be contingent on the results of the experimental reef. The Commission also found in April 1997 that there is continuing importance for the independent monitoring and technical oversight required in Condition D to ensure full mitigation under the permit. Condition D establishes the administrative structure to fund the independent monitoring and technical oversight of the mitigation projects. It specifically: (1) enables the Commission to retain contract scientists and technical staff to assist the Commission in carrying out its oversight and monitoring functions, (2) provides for a scientific advisory panel to advise the Commission on the design, implementation, monitoring, and remediation of the mitigation projects, (3) assigns financial responsibility for the Commission’s oversight and monitoring functions to SCE and its partners, and sets forth associated administrative guidelines, and (4) provides for periodic public review of the performance of the mitigation projects in the form of a public workshop. Condition D requires SCE and its partners to fund scientific and support staff retained by the Commission to oversee the site assessments, project design and implementation, and monitoring

activities for the mitigation projects. Scientific expertise is provided to the Commission by a small technical oversight team hired under contract. The technical oversight team members include three Research Biologists from UC Santa Barbara: Steve Schroeter, Ph.D., marine ecologist, Mark Page, Ph.D., wetlands ecologist (half time), and Dan Reed, Ph.D., kelp forest ecologist (half-time). A half-time administrator completes the contract program staff. In addition, a science advisory panel advises the Commission on the design, implementation, monitoring, and remediation of the mitigation projects. Current science advisory panel members include Richard Ambrose, Ph.D., Professor, UCLA, William Murdoch, Ph.D., Professor, UC Santa Barbara, and Peter Raimondi, Ph.D., Associate Professor, UC Santa Cruz. In addition to the science advisors, the contract program staff is aided by a team of field assistants hired under a contract with the University of California, Santa Barbara to collect and assemble the monitoring data. The contract program staff is also assisted on occasion by independent consultants and contractors when expertise for specific tasks is needed. The Commission’s permanent staff also spend a portion of their time on this program, but their costs are paid by the Commission and are not included in the SONGS budget.
STATUS OF THE SAN DIEGUITO LAGOON RESTORATION PROJECT - SPRING 2002
David W. Kay
Southern California Edison Company [email protected]
The purpose of the San Dieguito Lagoon Restoration project is to mitigate estimated impacts to certain marine fish populations resulting from the operation of the San Onofre Nuclear Generating Station (SONGS) Units 2&3 cooling water systems. Current Status SCE, representing the SONGS owners, is working in partnership with the San Dieguito River Park Joint Powers Authority (JPA) to carry out the restoration project. A Final Restoration Plan has been completed in collaboration with local, state and federal agencies including the cities of Del Mar and San Diego, California Department of Fish and Game, California Coastal Commission, U.S. Fish and Wildlife Service, and the National Marine Fisheries Service. The Final Restoration Plan was submitted to the CCC for approval in late 2001. Approval of the Final Restoration Plan will enable SCE to final design and engineering and file applications for all of the permits necessary to begin construction, including a coastal development permit. Pending litigation concerning the Environmental Impact Report, as explained below, may delay receipt of the necessary permits. Recent Planning History Following an extensive site selection study by SCE, the CCC approved San Dieguito in 1992 as the preferred site for wetlands restoration to satisfy the CDP mitigation requirement. Numerous designs were initially considered for the restoration project, but most were rejected because they did not meet pre-established criteria that the project not exacerbate scour or flooding, or cause beach sand loss. These criteria drove designs to recognize that the San Dieguito River must be allowed to flow freely to the ocean, and that restored wetlands must be constructed off-channel and protected from the river. Consequently, the final alternative designs all employed variations of off-channel tidal basins and river berms to ensure that sediments carried by the river continued to flow to the ocean and did not settle in constructed tidal basins. SCE prepared a Preliminary Restoration Plan, which was approved by the JPA on September 19, 1997. The JPA found that the preliminary plan was consistent with Park goals and objectives for the lagoon restoration. The Coastal Commission approved the Preliminary Restoration Plan on November 5, 1997. This enabled the environmental review process under the California Environmental Quality Act (CEQA) and the National Environmental Policy Act (NEPA) to begin. The JPA and the U.S. Fish and Wildlife Service are the lead agencies responsible for the environmental review. The environmental review included numerous studies that led to the preparation of a Draft Environmental Impact Report (EIR) in January 2000. CDP design criteria required that the proposed restoration must maintain an open ocean inlet to the lagoon, must not increase river

scour or cause beach sand loss, and must result in at least 150 acres of restored wetlands. Based on these and other criteria, five alternative project designs were proposed in the Draft EIR. Throughout the EIR process, extensive public comments, including recommendations of many technical experts, were considered. Numerous modifications were made to the plan, leading to development of the Final EIR and selection of one design, called the Mixed Habitat Plan, as the preferred alternative. After considering and responding to all comments, the JPA certified the Final Environmental Impact Report for the project in September 2000.
Figure 1. Mixed Habitat Plan
The Mixed Habitat Plan will employ a large subtidal basin at the location of the “airfield” property west of I-5 and intertidal channels north of the river to the east of I-5. Least tern nesting islands will be constructed at four locations and broad areas of salt marsh will border the river to the west of I-5 and the intertidal mudflats east of I-5. Beach-quality sand encountered during excavation will be used to top the nesting sites and supplement the beach, while other dredged soil will be used to construct the nesting site bases and the river berms. Excess dredge material will be disposed to several designated disposal sites, which will be vegetated following construction. The JPA will construct several interpretive trails around the restoration and a visitor center on Via De La Valle east of I-5. CEQA Litigation Shortly after the JPA certified the Final EIR, two citizen groups representing owners of beachfront homes south of the lagoon inlet sued the JPA, SCE and several other participating agencies in San Diego County Superior Court, alleging that the EIR did not comply with CEQA. Among other claims, the groups alleged that the project would increase scour at the lagoon inlet and result in sand loss at the Del Mar beach.
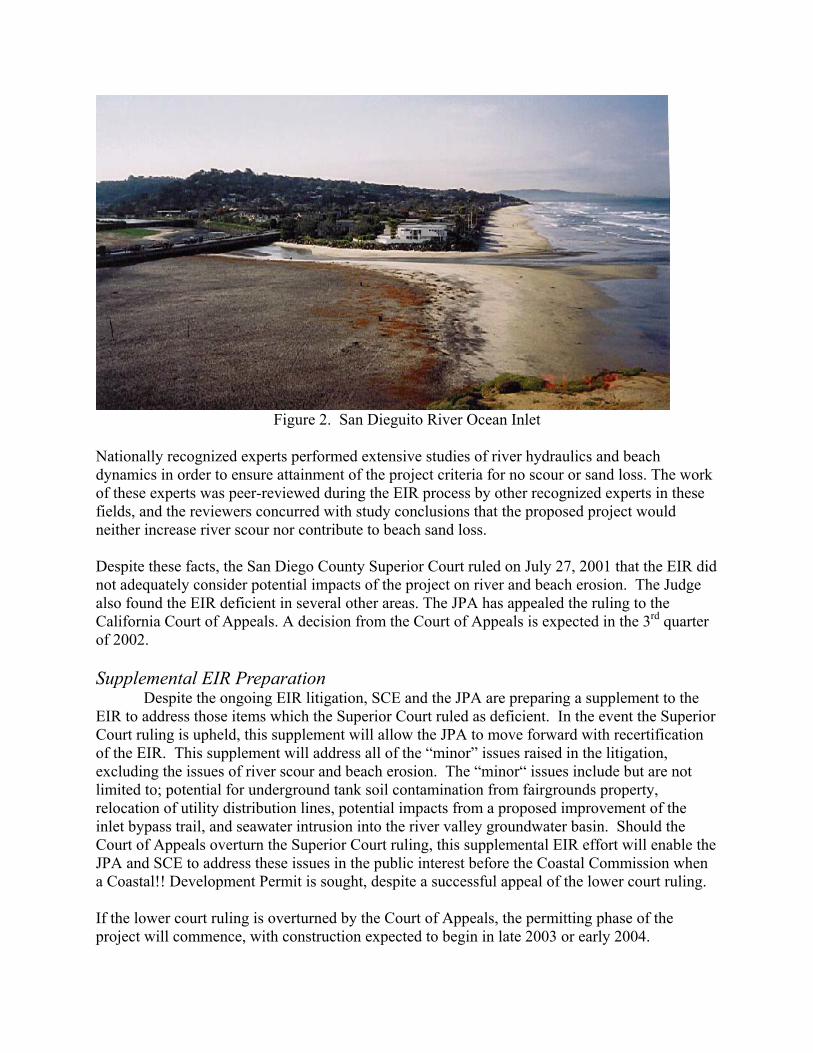
Figure 2. San Dieguito River Ocean Inlet
Nationally recognized experts performed extensive studies of river hydraulics and beach dynamics in order to ensure attainment of the project criteria for no scour or sand loss. The work of these experts was peer-reviewed during the EIR process by other recognized experts in these fields, and the reviewers concurred with study conclusions that the proposed project would neither increase river scour nor contribute to beach sand loss. Despite these facts, the San Diego County Superior Court ruled on July 27, 2001 that the EIR did not adequately consider potential impacts of the project on river and beach erosion. The Judge also found the EIR deficient in several other areas. The JPA has appealed the ruling to the California Court of Appeals. A decision from the Court of Appeals is expected in the 3rd quarter of 2002. Supplemental EIR Preparation Despite the ongoing EIR litigation, SCE and the JPA are preparing a supplement to the EIR to address those items which the Superior Court ruled as deficient. In the event the Superior Court ruling is upheld, this supplement will allow the JPA to move forward with recertification of the EIR. This supplement will address all of the “minor” issues raised in the litigation, excluding the issues of river scour and beach erosion. The “minor“ issues include but are not limited to; potential for underground tank soil contamination from fairgrounds property, relocation of utility distribution lines, potential impacts from a proposed improvement of the inlet bypass trail, and seawater intrusion into the river valley groundwater basin. Should the Court of Appeals overturn the Superior Court ruling, this supplemental EIR effort will enable the JPA and SCE to address these issues in the public interest before the Coastal Commission when a Coastal!! Development Permit is sought, despite a successful appeal of the lower court ruling. If the lower court ruling is overturned by the Court of Appeals, the permitting phase of the project will commence, with construction expected to begin in late 2003 or early 2004.

Public Comment
MR. STREICHENBERGER: My name is Rodolphe Streichenberger, marine forest scientist. I have three questions. My first question is why is the manager of this mitigation is not here? I mean Peter Douglas -- is a second meeting here, the guy who manages is not here. This is recorded, and the guy -- the person who manages, who micro-managed every technical detail is the CEO of the Coastal Commission, Mr. Douglas. Mr. Douglas is absent for this -- is not normal. If you have an explanation on that, for that? I don't know if you have one, but if you have one, like to hear that. Second, others are absent, is the public. I would like to know how many people from the public are here? Can you -- I am from the public, how many other people? one, two, three, four, five, six. So, we can say that the public is not there. It means this workshop is disconnected, disconnected for the management, Peter Douglas, disconnected for the public. I have a third observations to do, following his interesting presentation of this gentlemen, is about the judgment of this judge, who says that you say that he has overstepped, you know, his jurisdiction, giving a scientific advice on the things, because very good scientists have said that this wetland things was occasioned scientifically. But, you have to understand the judge, and a case is coming now, up north in Oregon, is very indicative about that. A judge doesn't want to hear only the government scientists, or the scientists who are involved in the project, itself. The judge doesn't want that. They want independent scientists. There is a very big case about the fish sucker up north, about that, and there was the trouble about that, so the Independent National Association of Science stepped in, and they have just said that the government scientists have been completely wrong about it. And, the National Association hit very strongly these government scientists, so please, when you say that the judge, you know, has overstepped his authority to talking about science, I think the judge has his point. He likes -- probably, he was not comfortable hearing only government scientists, or eventually 80-some scientists, because they are involved in that. This is all what I have to say for the time being. MR. KAY: Are you wanting answers to those questions? MR. STREICHENBERGER: Well, if you have an answer for the absenteeism of Mr. Douglas, please tell us. MS. HANSCH: I am here representing Mr. Douglas. MR. STREICHENBERGER: That is the nature of the man. The guy who decides on everything, of the technology, is Mr. Douglas, is not here, is absent. So, it is not satisfying at all. The public is disconnected.

MS. HANSCH: We did a very large notice of the meeting. MR. STREICHENBERGER: Yes, and you failed. My second question is just a comment about what -- don't attack too much the judge, because the first time, the first time I hear that, but my first reaction is to say I understand, very much, the judge

WETLAND RESTORATION: PRE-RESTORATION MONITORING
Mark Page Marine Science Instititute
University of California, Santa Barbara [email protected]
Background Pre-restoration monitoring is a responsibility of the contract scientists retained by the Coastal Commission on the San Dieguito Lagoon restoration project. Condition A of the Coastal Development Permit for SONGS states that “pre-restoration site monitoring shall be conducted to collect baseline data on the wetland attributes to be monitored” [during construction and post-restoration monitoring]. The permit also states “the results of the pre-restoration monitoring will be incorporated into the Monitoring and Management Plan that will provide an overall framework to guide the post-restoration monitoring work”. Objectives Three objectives of the pre-restoration monitoring program are to: 1) collect physical and biological data on pre-restoration conditions: quantitative data that will permit an assessment of construction-related impacts and changes in the existing wetland following construction, 2) evaluate sampling designs for the post-restoration monitoring of physical and biological attributes that will be used to evaluate performance of the wetland, and 3) examine the suitability of other wetlands as reference sites. The performance of the wetland following construction will be measured using standards that are given the coastal development permit and compared to from three to four reference sites. The acreage of tidally inundated habitat that SCE is given credit for by the Coastal Commission is dependant on the inlet being open to tidal exchange (Fig. 1). The permit calls for a one-time restorative dredging followed by maintenance dredging to maintain the inlet in an open condition following restoration. Filling in of the inlet reduces or mutes tidal exchange, affecting the acreage of tidally influenced habitat and also alters water quality parameters such as salinity and dissolved oxygen concentration. The death of wetland fauna such as the bubble snails shown lining the Fish and Game basin in January 2002 in Figure 2 frequently follows inlet closure. Water quality is a long-term physical standard and CC contract scientists have been collecting baseline data on temperature, salinity and oxygen concentration. Contract scientists are also collecting data on water depth since anomalous changes in the tidal cycle may provide early warning of inlet closure. Environmental data are collected using continuous recording YSI data logging instruments (Fig. 3). The instrument installed on the railroad bridge at San Dieguito Lagoon logs data every 15 minutes. There are also instruments installed at the Grand Avenue Bridge and at Carpinteria Salt Marsh, one of the sites that may be used in post-restoration monitoring. Figure 4 shows data collected at the Railroad Bridge from November 8 to December 3, 2001 and provides an example of how data from the YSI could provide an early indication of tidal muting. The top figure shows changes in water depth associated with tidal cycle and eventual termination of tidal oscillation with inlet closure. Following inlet closure, water level in the lagoon increased

associated with spill over during spring tides. The bottom figure shows the response of lagoon salinity to inlet closure. A slight increase, followed by a plateau, and then a general decline in salinity into early December reflecting freshwater inputs into the lagoon following rainfall events. Salinity is an important physical parameter that affects the distribution and abundance of estuarine species. Figure 5 provides an example of how YSI data could provide information on water quality differences in different locations within the lagoon by showing salinity differences between the Railroad Bridge and Grand Avenue bridge related to localized inputs of freshwater. The point source of the freshwater input was a large drainpipe near the railroad bridge (Fig. 6). Sampling designs for post-restoration monitoring One of objectives of pre-restoration monitoring is to develop sampling designs for post-restoration monitoring that can most effectively determine whether the various performance standards have been met. Other important issues related to the design of a fish monitoring program include impacts of sampling to the wetland through the destruction or disturbance of habitat and the time and cost-effectiveness of the sampling program. The coastal development permit for SONGS sets standards that are to be achieved by the restored wetland. The restoration standard for invertebrates states that within 4 years of construction, total densities and number of species of macro-invertebrates shall be similar to densities and number of species in similar habitats in reference wetlands. Figure 7 shows typical invertebrates found in San Dieguito Lagoon, including clams, the sea hare, a predatory sea slug, and California horn snails, which can be quite abundant. Of particular concern from a monitoring and sampling design point-of-view is spatial patchiness in the densities of wetland species. Small variations in elevation, sediment characteristics, or organic matter could lead to gradients and/or the patchy distribution of benthic fauna. To illustrate this point with a hypothetical example, Figure 8 shows a gradient in total density with distance along a transect. Replicate stations located too close together, for example at the beginning of the transect, could provide information on density that is not representative of the transect or study channel as a whole. To determine the appropriate spacing of samples, invertebrates were sampled in three tidal wetlands that may serve as reference sites during post-restoration monitoring: Carpinteria Salt Marsh, Mugu Lagoon, and Tijuana Estuary. San Dieguito Lagoon was not included because the inlet was closed and the water level was too high to permit sampling. Two different habitats, main or river channel habitat and smaller tidal creek habitats, were also sampled in each wetland. Figure 9 shows the location of study transects in these habitats at Carpinteria Salt Marsh as well as the location of the YSI data-logging instrument on the Franklin Creek bridge. Figure 10 shows main channel and tidal creek habitats at Mugu Lagoon. Core samples were taken 1 m apart to a depth of 50 cm along 30 m long transects in each habitat (Fig. 11). The samples were sieved through 3 mm mesh sieves in the field and the species and number of invertebrates recorded. Smaller cores were also taken to a depth of 6 cm. These samples were returned to the lab for sieving through 0.5 mm mesh to catch smaller invertebrates. CC contract scientists are currently analyzing the data from the samples. Figure 12 illustrates the types of data collected as well as within habitat variability for small cores for transects A and D from the Main Channel at Carpinteria Salt Marsh. “A” was located closest to the inlet and

“D” was located further upstream. The average density for all 30 cores is given by the dotted line. Total density varies among cores within a transect, example from 1 to >50 individuals/core at transect A and 10 to ~100 individuals/core at transect D and mean densities differ between the two transects. Over the next few weeks, data from all transects will be subjected to statistical analysis to determine the appropriate spacing and number of samples for use in the post-restoration monitoring of invertebrates. Data were also collected on sediment characteristics along each transect line. These data will be useful in designing the sampling program if, for example, it becomes necessary to stratify sampling by sediment properties, and in characterizing the physical properties of sediments present in reference wetlands. Figure 13 shows data collected on the percent organic content of the sediment and grain size as % silt-clay from Carpinteria Salt Marsh and Mugu Lagoon. Similar patterns are evident in both wetlands—a general increase in organic content with increase in the percentage of silt-clay and, for a given percent silt-clay, the organic content is higher in the tidal creek habitats than main channels. The standards set by the permit for fish are similar to those for invertebrates: within 4 years of construction, total densities and number of species of fish shall be similar to densities and number of species in similar habitats in reference wetlands. During the coming year, pre-restoration monitoring will focus on designing a sampling program for fish. Figure 14 shows some typical native fishes found in San Dieguito Lagoon: the Longjaw mudsucker, California killifish, Arrow goby, and the Barred pipefish. These particular fishes are all small on the order of a few centimeters in length. A variety of methods have been used to sample fish and Figure 15 shows two methods. The minnow trap, on the left, is a passive method. These traps are baited and left out for a known period of time, which is often 24 hours. Fish abundance is expressed as “catch per unit effort”, which is the amount of time the trap was deployed in the field. The beach seine, shown on the right, is an active sampling method. The seine is pulled through the water column and is typically used in conjunction with blocking nets to prevent fish from escaping the sampling area. Fish abundance can be expressed in terms of density—the number of fish caught per area sampled. Figure 16 summarizes the effectiveness of various methods in sampling some of the more common wetland fishes that occupy various microhabitats. For each fish species, sampling methods are rated as “E” for effective, “ME” for moderately effective, and “NE” for not effective. Unfortunately, no single method can effectively sample all species. For example, minnow traps are effective for mudsuckers, but not effective for gobies, topsmelt or mullet. Beach seines are effective for three species, but less effective for two. In addition to the selection of the most effective mix of sampling gear types for post-restoration monitoring of fish, there is a need for adequate spatial replication in the sampling design. The importance of spatial replication is illustrated by the data in Figure 17, which shows the variability in numbers of fishes between stations and between two replicate minnow traps deployed on opposite banks at each station. There are large differences in the abundance of mudsuckers and killifish between stations B and D, which are close to one another. There were also large differences in the numbers of fish caught in replicate traps within a station (e.g., C vs.

D). Shore crabs were captured in the minnow traps and these traps may be useful for sampling these animals. Fish assemblages also vary over time. Figure 18 compares fish density between samples taken on July 27, 2000 and August 8, 2001. Densities were quite different between the two years at stations D and F. There was also an interesting trend of higher densities at stations C and D than E and F in 2000 and the opposite pattern in 2001. The potential impact of sampling activities on the wetland, for example, through footprints that remain for days, weeks or longer or trampling of vegetation is an important issue in the design of any sampling program, but is typically ignored in monitoring programs for fish (Fig. 19). Figure 20 illustrates that the different sampling methods have varying impacts to the physical habitat of the wetland. For example, enclosure and minnow traps, as passive sampling methods, have relatively low impact. Unfortunately, these methods only sample a small subset of the fish assemblage. In contrast, the method most effective in catching the broadest range of fishes, the seine, is also the most destructive to channel bottoms and banks. Not discussed here are the potential biological impacts of sampling, through the killing of fish and other animals during the sampling process. In summary, the following tasks will be completed to evaluate sampling designs for wetland fish: 1) determine the appropriate mix of methods to effectively sample densities and number of species of fish, 2) determine appropriate spatial and temporal scales of sampling, and 3) evaluate the potential of different sampling methods to adversely affect wetland and work to minimize those impacts Finally, pre-restoration monitoring has been conducted in tidal wetlands that may serve as potential reference sites. Reference sites will be used as a standard to which performance of the restored wetland will be compared in post-restoration monitoring. The permit specifies that these reference wetlands need to be 1) relatively undisturbed, 2) tidal wetlands, and 3) within the southern California Bight. We have reviewed 46 wetlands in the Southern California Bight to determine which sites meet the basic permit criteria for a reference site. Of the 46, only 7 or 8 meet these criteria, including Carpinteria Salt Marsh, Mugu Lagoon, and Tijuana, Estuary. In addition to the basic permit requirements, reference wetlands should have similar flora and fauna to that projected for the San Dieguito site. Figure 21 shows the location Tijuana Estuary, Mugu Lagoon, and Carpinteria Salt Marsh, potential reference from which CC contract scientists have collected pre-restoration monitoring data,. To summarize, the 2002-2003 Work Plan specifies that CC contract scientists will: 1) continue to collect water quality data with data loggers and analyze those data, 2) finalize the analysis of invertebrate data to determine the appropriate spatial sampling design, and 3) evaluate designs to most effectively sample fish in post-restoration monitoring in a manner that minimize impacts to existing wetland.

a.
b.
Figure 1. Inlet of San Dieguito Lagoon in an (a) open and (b) closed condition

Figure 2. Dead bubble snails lining the Fish and Game basin in January 2001 following inlet closure.

YFigure 3. YSI environmental data logging instrument attached to the railroad bridge at San Dieguito Lagoon. Data are downloaded every two weeks by wetland technician Jenny Wolf (shown on the right).
YSI

Figure 4. Examples of data on changes in water depth and salinity at the railroad bridge associated with the tide cycle and inlet closure.
Water depth
0.40.60.81.01.21.41.61.8
Salinity
Time (date)11/7/01 11/11 11/15 11/19 11/23 11/27
2728293031323334
Inlet closure
Water depth
0.40.60.81.01.21.41.61.8
Salinity
Time (date)11/7/01 11/11 11/15 11/19 11/23 11/27
2728293031323334
Inlet closure
12/1
Sal
inity
12/1
Sal
inity
Dep
th (m
)D
epth
(m)

Figure 5. Data on variation in salinity associated with inlet closure and localized inputs of freshwater at the railroad bridge and the Grand Avenue bridge.
RR Bridge
2728293031323334
Grand Avenue
11/7/01 11/11 11/15 11/19 11/23 11/27 12/1
Sal
inity
2728293031323334
Inlet closureLocalized inputs27
28293031323334
Grand Avenue
11/7/01 11/11 11/15 11/19 11/23 11/27 12/1
Sal
inity
2728293031323334
Inlet closureLocalized inputs
RR Bridge
Time (date)Time (date)
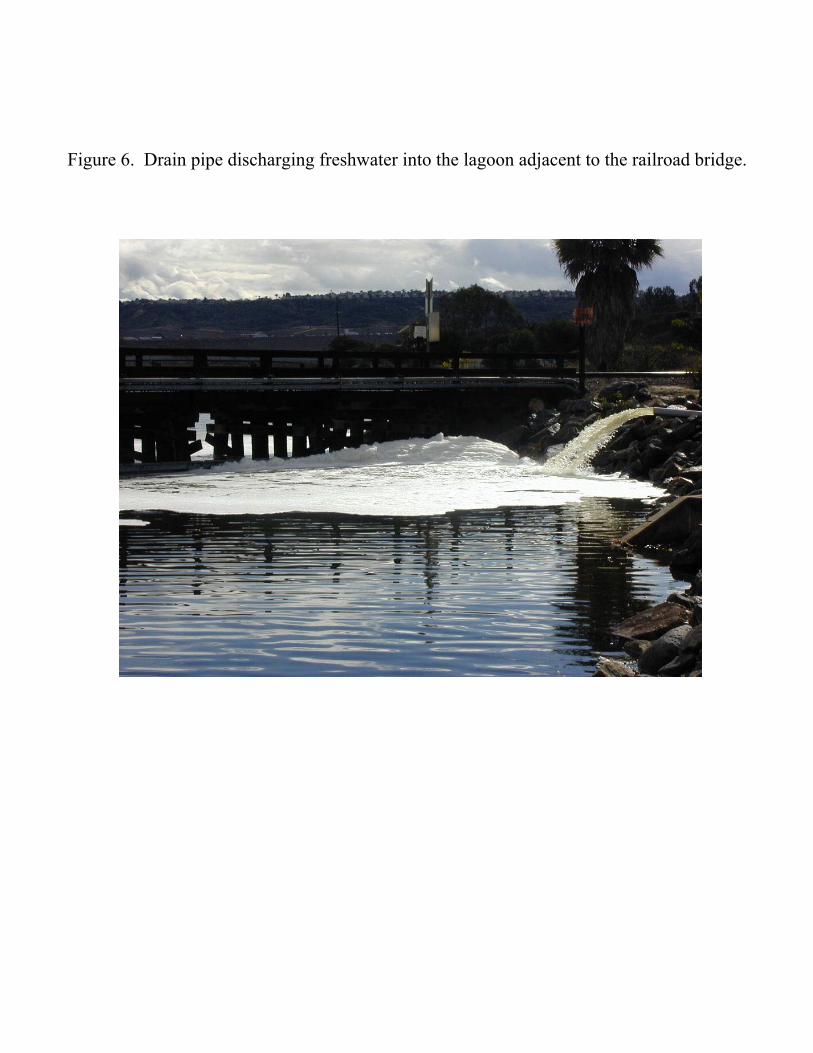
Figure 6. Drain pipe discharging freshwater into the lagoon adjacent to the railroad bridge.

Clams
Sea slug Horn snails
Sea hare
Figure 7. Typical benthic macroinvertebrates in San Dieguito Lagoon.

Figure 8. Hypothetical example of invertebrate patchiness along a transect line in a main channel or tidal creek habitat.
Den
sity
(No.
per
cor
e)D
ensi
ty (N
o. p
er c
ore)
Distance along a transect (m)0
20406080
100120140
average
Distance along a transect (m)0
20406080
100120140
average

Main channel
Pacific Ocean Pacific Ocean
Tidal
Tidal creeks
YSI
creeks
Main channel

Figure 10. Main channel (a) and tidal creek (b) habitats at Mugu Lagoon.
b.
a.

Figure 11. Illustration of the sampling design to dand number of samples for use in postmacroinvertebrates. Core samples wealong 30 m long transect lines.
samples
etermine the appropriate spacing -restoration monitoring of re taken at one meter invervals
1 m1 m

Figure 12. Examples of data on total density of macroinvertebrates from transects A and D in the main channel at Carpinteria Salt Marsh. Data illustrate variation in density of invertebrates within and between transects.
Main channel A
020406080
100120
Distance along transect (m)0 5 10 15 20 25 30
020406080
100120
Den
sity
(No.
/ 44
cm2 )
Main channel D
average=18
average=54
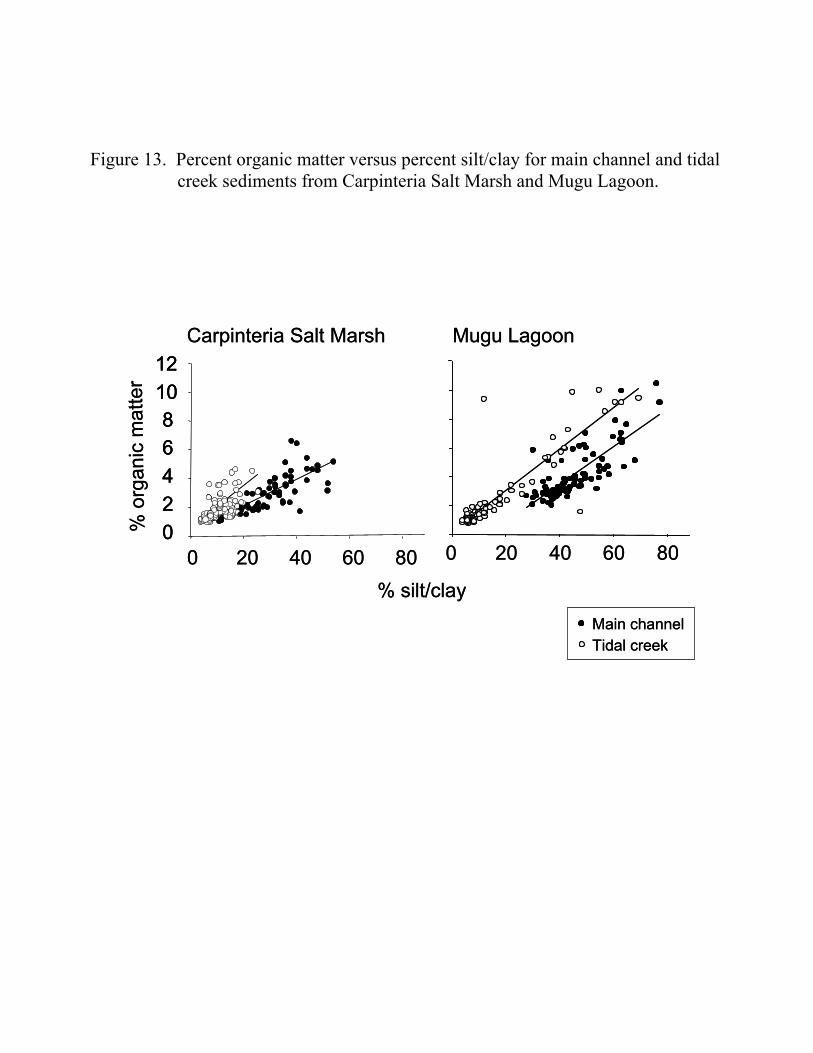
Figure 13. Percent organic matter versus percent silt/clay for main channel and tidal creek sediments from Carpinteria Salt Marsh and Mugu Lagoon.
Mugu Lagoon
20 40 60 800
Main channelTidal creekidal creek
Carpinteria Salt Marsh
% silt/clay
% o
rgan
ic m
atte
r
02468
1012
0 20 40 60 80
Mugu Lagoon
0 20 40 60 80
Main channelT
Carpinteria Salt Marsh
% silt/clay
% o
rgan
ic m
atte
r
02468
1012
02468
1012
0 20 40 60 80

Figure 14. Typical native fishes found in San Dieguito Lagoon.
Barred pipefish
Long jaw mudsucker
Arrow goby
California killifish

Figure 15. Examples of methods that have been used to sample fish.
Minnow trap Seine

Figure 16. Effectiveness of different methods for sampling typical wetland fish.l
E E E
EE ME
NE
E
ME
NE
Fish
Killifish
Topsmelt
Mullet
Mudsucker
Gobies E
EEE
ME
ME
ME
ME
NE
NE
NE
NE
NE NE
NE
E
E
E E ME
Minno
EMENE
Effective
Moderately effective
Not effective w traps
Channel N
et
Gill N
et
Beach S
eine
Otter Traw
Enclosure

Figure 17.
Num
ber
0
20
40
60
80
20
40
60
80Num
ber
0
20
40
60
80
20
40
60
80
00
Example of between and within station variation in fish abundance. Fish sampled with replicate minnow traps (dark and open bars) at each station.
Station B
Station D
Station B
Station D Station C
Mudsucker
Top smelt
KillifishShore crab
0
20
40
60
80
Mudsucker
Top smelt
KillifishShore crab
Station C
Mudsucker
Top smelt
KillifishShore crab
0
20
40
60
80
Mudsucker
Top smelt
KillifishShore crab

Figure 18. Temporal variation in the total density of fishes. Fish sampled using a seine.
StationC D E F
Den
sity
(No.
/m2 )
0
2
4
6
8
10
July 27, 2000August 8, 2001
StationC D E F
Den
sity
(No.
/m2 )
0
2
4
6
8
10
July 27, 2000August 8, 2001

Figure 19. Impacts of sampling to wetland habitats—footprints on the mud surface.

Figure 20. Impacts of different methods for sampling fish on the physical habitat
Relative impactMethod
Enclosure traps
Channel/Fyke Net
Gill Net
Beach Seine
Otter Trawl
Low
Low
Moderate
High
Low
LowMinnow traps

Figure 21. Map showing the location of potential reference sites used in pre-restoration monitoring.

Public Comment MR. KAY: Mark, would you just brainstorm for a minute about the key word on that permit requirement is "similar". MR. PAGE: Right. MR. KAY: How are we going to define what is similar? We know the reference sites aren't identical to San Dieguito. They all have some differences. You are not going to have the same distribution of the same kinds of plants and animals at all of them, so when we get down to brass tacks, how are you going to make the judgment there that San Dieguito is similar enough to one or more of the reference sites? MR. PAGE: All right, and that is a very important issue. I am not going to brainstorm it off of the cuff. I think that is something that we need to do, the Coastal Commission scientists, need to do collectively with the Science Advisory Panel. In the Monitoring and Management Draft Plan there is information on the statistical methodology that will be used to make that similar comparison, but I think that is still -- we are still working to refine that methodology, and I could send you a draft of the Management Plan. MR. KAY: I think I have it. MR. PAGE: Yes, and there is a section in that on the fiscal analysis, but it is not a done deal. We need to refine it again. So, I agree with you, that is a very important issue. MR. KAY: Any other comments? MS. WINTERER: Jacqueline Winterer, of Del Mar, and I wonder if you could go back to your slides and show the one that has your fishes, and then the three little lagoons, east of the freeway, west of the freeway. MR. PAGE: Okay, we can do that. Just put one in, and I'll tell you which way to go. There you go, right there, right -- the other way, okay. MS. WINTERER: That one. I am a geomorphologist, and I was recently asked to give a talk about this area, and it came to mind -- if I could show on the map, that this is an abandoned meander of the San Dieguito River Valley, and that by the construction of the freeway, which occurred nearly 50 years ago, in 1963, this basin has been entirely isolated from an input of sea water, and so, first, I am totally astonished that there is any fish alive there, at all. Is it your expectation that --
36
MR. PAGE: This is not actually a sample. This line goes up over to here. MS. WINTERER: Oh, okay, I thought that you were showing that. MR. PAGE: No, no, no. MS. WINTERER: Is there any fish left there? MR. PAGE: Not that I know of. MS. WINTERER: They are all gone. MR. PAGE: Yes. MS. WINTERER: Well, that takes care of my question, thank you. MR. PAGE: More comments, or questions, before we move on? MS. REID: I am Freida Reid, from the San Dieguito Lagoon Committee, and a biologist at the Scripps Institution of Oceanography. I have a statement here from John McGowan, who is a professor at Scripps Institution, with which I totally agree, most explicitly. I can just read it to you? MR. PAGE: Sure. MS. REID: The San Dieguito Lagoon is the receiving water for the point source effluent from the storm drains from at least five co-permittees, and the 22nd Agricultural District. There is also diffuse source runoff from a large, rapidly urbanizing area, golf courses, and agricultural fields. There has been a well-tended, long term, monitoring program of the main lagoon for a few chemical physical properties, such as temperature, salinity, p.h., and 02, and these have shown large differences in water chemistry between time when the lagoon was closed and when it was opened. These differences indicate large biological changes; however, there has been no, or very inconsistent, effort to monitor these changes biologically, or to monitor for public health threats. The lagoon has been only episodically opened to the ocean, for relatively short periods of time, for the past 15 years. An open lagoon will certainly be ventilated by tidal action, and the pollutants diluted and dispersed. We are, therefore, concerned about public health, and the ecological well-being of this body of water. We recommend that frequent, once-a-week measurements begin, at least at three stations for chloroform, fecal chloroform, and entrococci, in order to assess the public health risk.
37
Such micro-organisms can bloom quickly, so a high frequency of measurement is necessary. We also recommend measurements of water clarity, and particular concentration, as an index of the biologist status of the waters. Basically, we would like to see something smaller than fish and macro-invertebrates added to this sampling program, since in many cases, samples are already being taken, and we think that this should be part of this program. Thank you. MR. PAGE: Thank you. Any others? MR. STREICHENBERGER: How does this, does it cost, the wetland restoration? A project -- what does it cost? what is the benefits? We call that an analysis of costs and benefits. Can you tell me, how, at least how it would cost? MR. PAGE: I am going to defer issues related to cost to Coastal Commission staff. Maybe, Jody, do you want to comment on that? MS. LOEFFLER: I am Jody Loeffler, Coastal Commission. Actually, I think, if I am correct, Mr. Streichenberger, you are asking what the implementation of the wetland restoration would cost? MR. STREICHENBERGER: No. MS. LOEFFLER: Or the Coastal Commission's -- MR. STREICHENBERGER: No, no, no. MS. LOEFFLER: -- program? MR. STREICHENBERGER: What I am asking, a decision, a choice has been done, as part of the total restoration would be the restoration of the San Dieguito thing is a choice. You have said something to do, what is this cost? MS. LOEFFLER: The cost -- MR. STREICHENBERGER: You could have chosen another things to do, another typical reef, I don't know what -- another devices, other things to do. You have chosen, among your selection, it was the San Dieguito restoration. What is the cost of that choice you have done? I think you did that in '91. What is the cost? and, what is the benefits you expect?
38

Because, you have to compare, you know. In environmental science, you always come to that. You have to make choice, and to choose priorities, so when you do your job about cost analysis, and the benefits, after that you decide if your choice is good or not. But, my question is, you have chosen that, what is the cost? what is the benefits, and perhaps when you look at this information, this data, these numbers, what you will see, that something else could have been done. But, start by the beginning, what is the cost? MS. LOEFFLER: Well, I think the cost of the implementation project, itself, would have to be answered by Edison, since they are the ones who are actually doing the work. I can certainly provide cost figures on what the Coastal Commission has spent in its oversight and monitoring so far. MR. STREICHENBERGER: I ask you more than that one. MS. LOEFFLER: I don't have the information to answer your entire question, Mr. Streichenberger, sorry. UNIDENTIFIED SPEAKER: I am one of the rare members of the public, who is present there, and I want to let you know that I have been a former mayor of the City of Del Mar, and that our community is extremely supportive of this project. I cannot address the issue of the cost, obviously, but the benefits I can address. There has been for the last 25 years an extraordinary effort on the part of our community to see this problem, this project come to be. Our community, in particular -- and we are the smallest town in the County of San Diego, only 5000 people -- has spent a large amount of money to buy some of the land that is part of this project. Besides ourselves, the County of San Diego has put into place the joint powers authority, which is now a group of the elected representatives of the communities that live along the San Dieguito River Valley, and they have put up an extraordinary effort to buy the land that is now in the process of being restored. Southern California Edison, itself, is buying a small piece of property. But, most of it has been bought by the people of the region, and so there is an extraordinary amount of support, not only by voting, but by coming up with money to contribute to this project. So, I want all of the scientists, and administrators, who work here, to know that they have the full support of the public of the area. Thank you. MR. PAGE: Yes, David.
39
MR. KAY: Yes, from Edison, and I can answer that question on the costs for the restoration project. Starting in 1991, and going all the way to the completion, and the post-restoration monitoring, is estimated at about $86 million -- in 1997 dollars? In 1997 dollars. And, the benefit, obviously, is to restore the impacts that were caused by the power plant. MR. STREICHENBERGER: Like was said, obviously need to say it more, absent the -- MR. PAGE: Please take the microphone. MR. STREICHENBERGER: I want to answer to this lady, who says the interests of her community has, in restoring that wetlands, I am not surprised of that. Every community, where there is a wetland, want to restore the wetland, and so this community has done a lot of efforts, and have put money, but that is the point. We just come back, always, to the money. The money is rare, to make what we have done with the environment, there is not enough money, this is absolutely sure. So, when I seen the old project here, which is a project of $300 -- to my calculation, the total project, you know -- this one, and the other thing, is the total project of $300 million. I just say it is waste of money. So, when communities, you know, look at things, they need money for everything around their own communities, and they don't have so much money. There is a scarcity of money. And, when I see this old project, now spanning now $300 million of dollars, I say, "This is a waste." So, that is a big mistake, and we cannot make mistakes of that importance when the money is rare. But, the mistake has been done, and if other communities have enough money for their own program, they should not be so happy to see so much money wasted, otherwise, when presented, there is not the money they would like to have to restore the wetlands. MR. PAGE: Yes. MR. HELVEY: I am Mark Helvey, National Fisheries Service. I think the question should be, "What are the benefits?" And, I don't think the money is rare. I think the habitat is rare, and any opportunity to get back wetlands, is an important step forward, so I disagree with the point that the money is the issue. MR. PAGE: Any other comments?[ No Response ]
40

OVERVIEW OF THE EXPERIMENTAL REEF DESIGN AND MONITORING
Dan Reed
Marine Science Instititute University of California, Santa Barbara
Mitigation Requirement Condition C of the permit requires construction of an artificial reef in two phases; an experimental phase that is relatively short in duration (i.e. five years) and small in size (~ 20 acres), and a mitigation phase that is larger in size (at least 150 acres) and of a duration equivalent to the operating life of SONGS Units 2 and 3 (i.e. 20 to 30 years). The primary goal of the experimental reef is to determine the substrate types and configurations that best provide: (1) adequate conditions for giant kelp recruitment, growth and reproduction, and (2) adequate conditions for establishing and sustaining other reef-associated biota, including benthic algae, invertebrates and fishes. Originally the SONGS coastal development permit required that the mitigation reef be constructed of quarry rock, and that the rock cover at least two-thirds of the sea floor within the boundary of the mitigation reef. On April 9, 1997 the Commission agreed to allow the Executive Director to change these requirements if the results of the experimental reef indicated that a different coverage or substrate type would replace a minimum of 150 acres of medium to high density giant kelp and associated kelp forest biota. Thus, a major objective of the experimental reef is to determine whether substrate coverages less than two-thirds and substrate types other than quarry rock (e.g., recycled concrete) can be used to meet the performance standards for the mitigation reef. Information obtained from the experimental reef will form the basis of the Executive Director’s decision on the type and percentage cover of hard substrate required for the mitigation reef Experimental Reef Siting and Design SCE submitted a preliminary conceptual plan to the CCC to build the experimental reef in June 1997. The plan was approved by the Executive Director and forwarded to state and federal agencies for review. The environmental review process was finalized in June 1999 and construction of the experimental reef was completed on September 30, 1999. The final design of the experimental reef approved by the CCC and built by SCE is a low-lying modular artificial reef located off San Clemente, CA that tests eight different reef designs that vary in substrate composition, substrate coverage and presence of transplanted kelp (Table 1). All eight reef designs are represented as individual 40 m x 40 m modules that are replicated in seven areas (i.e., blocks) for a total of 56 artificial reef modules totaling 22.4 acres (Figure 1).
41

Monitoring Goals and Rationale Deciding upon a design for the mitigation reef using information from the experimental reef entails uncertainties that stem from the length of the experiment (five years), which may not be sufficient for the development of a mature kelp forest community on a newly constructed reef. Moreover, because five years is short relative to the generation times of most kelp forest species (other than giant kelp), there is no guarantee that reef designs that appear successful at the end of the experiment (i.e. meet the performance criteria) will continue to perform successfully in the future. Given these uncertainties, it is possible that none of the experimental modules will develop a sustainable kelp community that meets the performance criteria for the mitigation reef. In this event the Executive Director will need to rely on information that best predicts which of the reef designs will meet the performance standards when applied to the mitigation reef. To address this possible need, the Commission’s contract scientists are taking a three-part approach to evaluating the results of the experimental reef. Evaluation of the experimental phase consists of: (1) monitoring a variety of physical and biological variables to determine the degree to which the eight reef designs achieve the performance criteria, (2) using the monitoring data to evaluate the performance of the eight reef designs relative to each other, and (3) collecting data from additional monitoring and experiments that will aid in predicting which design(s) will most likely be successful if applied to the mitigation reef. These additional data will relate key physical and biological processes to: (1) specific aspects of community development, and (2) the degree of success in achieving the performance criteria. This last approach acknowledges that there are both processes that facilitate the development of kelp and related biota and those that suppress it. An example of the former is an adequate rate of dispersal and successful settlement of kelp spores. An example of the latter is too high a rate of recruitment and development of species (e.g., sea fans) that can monopolize space on the reef and prevent the establishment of kelp. Results from these process studies will be used to predict whether the criteria for evaluating the performance of the different reef designs are likely to be met and how long it will likely take to meet them. Information obtained from process studies also will be used to gain insight into how physical and biological variables of interest are affected by specific reef characteristics that are not explicitly tested in the experiment (e.g. the size and shape of rocks and concrete rubble). The three-fold approach depends in part on the idea that the dynamics of a kelp forest community can be predicted from: (1) the values of the variables that describe the state of the kelp forest community on which the performance standards for the mitigation reef are based (e.g. the area of medium-to-high density kelp, the density of fish and number of fish species, etc.), and (2) a knowledge of the physical and biological processes that control the average values and dynamics of the state variables (e.g., the effects of sand scour on community structure, lack of giant kelp due to insufficient spore dispersal, etc.). Information on the values of the state variables that describe the state of the community is being obtained from spatially representative monitoring of the experimental modules and reference reefs to describe “what’s there.” Insight into processes will be obtained from focused sampling and experiments aimed at predicting “what will be there over the long term.”
42

Performance Criteria Although success of a particular reef design does not depend on the achievement of specific performance standards, the criteria by which the experimental reef will be evaluated are a subset of the permit performance standards by which the success of the larger mitigation reef will be judged. This choice of criteria was motivated by the need to predict which of the reef designs are most likely to produce a full-sized mitigation reef whose performance will meet the standards of the permit. Not all of the performance standards to be applied to the mitigation reef are appropriate for evaluating the results of the experimental reef. For example, because fish are likely to move among different reef modules, the relatively small size of the modules (0.4 acres) precludes obtaining reasonable estimates of the standing stock of kelp bed fish that can be scaled up to the size of the mitigation reef. Given these kinds of constraints, the following subset of the performance standards for the mitigation reef will be used as criteria to evaluate the performance of the different experimental reef designs: 1. Substrate characteristics
• At least 90% of the area of hard substrate (as determined by the first post-construction survey) must remain available for attachment of reef biota.
2. Giant Kelp • There must be a sustained giant kelp density of at least 4 adult plants per 100 m2.
3. Kelp-bed fish • Resident fish assemblage shall be similar in density and species number to natural
reefs within the region. • Young-of-year fish assemblage shall be similar in density and species number to
natural reefs within the region. • Fish production shall be similar to natural reefs in the region. • Fish reproductive rates shall be similar to natural reefs in the region.
4. Kelp-bed invertebrates and understory algae • Benthic community (both algae and macro-invertebrates) shall have coverage or
density and number of species similar to natural reefs within the region. • Benthic community shall provide food-chain support for fish similar to natural
reefs within the region. • Important functions of the reef shall not be impaired by undesirable or invasive
benthic species These above performance criteria fall into two categories: absolute standards, which require that the variable of interest attain or exceed a predetermined value, and relative standards, which require that the value of the variable of interest be similar to that measured on natural reference reefs. The rationale for requiring that the value of a resource be similar to that on natural reefs is based on the requirement that to be successful the mitigation reef must provide the types and amounts of resources that occur on natural reefs. Resources on natural reefs, however, vary tremendously in space and time. Differences in physical characteristics of a reef (e.g., depth and topography) can cause plant and animal assemblages to differ greatly among reefs while seasonal and inter-annual differences in oceanographic conditions can cause the biological
43

assemblages within reefs to fluctuate greatly over time. Ideally, the biological assemblages on a successful artificial reef should fluctuate in a manner similar those on the natural reefs used for reference. One way to help ensure that this will be the case is to select reference reefs that are close to and physically similar to the experimental reef. The premise here is that nearby reefs with similar physical characteristics should support similar biota, which should fluctuate similarly over time. Temporal variability, especially of the sort associated with changes in oceanographic conditions, can be accounted for more easily by sampling the experimental and natural reference reefs concurrently. Concurrent monitoring of the natural reefs will help ensure that regional changes in oceanographic conditions affecting the experimental reef will be reflected in the performance criteria, since nearby natural reefs will be subjected to similar changes in oceanographic conditions. San Mateo kelp bed located adjacent to the southern end of the experimental reef and Barn kelp bed located approximately 12 km south of San Mateo kelp bed were chosen as reference reefs for the artificial reef experiment (Figure 2). Nine permanent transects were established at each site and are used in comparisons with transects on the experimental reef. Coverage of hard substrate was not an explicit criterion for selecting these sites or for selecting the location of transects within them. Instead, the criteria used in choosing plots within reference reefs was that they: (1) have a history of sustaining giant kelp at medium to high densities, (2) be located at a depth similar to the experimental reef, and (3) be primarily low relief, preferably consisting of cobble or boulders. The criterion that the reference reefs have persistent stands of giant kelp is important because communities on reefs without giant kelp can differ dramatically from those with kelp. Because medium to high density giant kelp is required of the mitigation reef, it is important that it be present on the natural reference reefs during the five-year experiment. Because species composition and abundance varies greatly within and among natural reefs it is important that the number and spacing of reference transects be sufficient to allow the performance of different reef designs to be compared to the wide range of variation that occurs naturally. Also kelp persistence can vary greatly within and among sites over a five year period as a result of localized disturbances (e.g. sea urchin grazing). This is a concern for the experimental reef because the plant and animal assemblages associated with persistent populations of kelp are needed to evaluate the performance of the different reef designs. The use of multiple reference plots will help to ensure a standard for comparison for the experimental reef is maintained, even in the event of localized extinctions of giant kelp. Monitoring Contract scientists working for the CCC produced a monitoring and management plan for the experimental reef that was reviewed by SCE, various resource agencies and other technical specialists, and also was included in the draft PEIR for general public review. The plan provides an overall framework to guide the monitoring and describes the sampling methodology, analytical techniques, and methods for measuring performance of the different experimental reef designs relative to the performance criteria listed above.
44

The monitoring and management plan for the experimental reef was approved by the Commission on July 15, 1999. The field work required to do the monitoring is contracted out to the University of California Santa Barbara. The field work is being done by a team of university scientists under the direction of Drs. Steve Schroeter and Dan Reed. In the fall of 1999 four permanent 40 m transect lines were installed on each of the 56 modules and nine permanent 40 m transects were install at each of the two reference reefs. These lines are used to mark the areas on each module that are routinely monitored. The abundance of giant kelp, kelp-bed fish, and large macro invertebrates and understory algae are surveyed each year in a 2 m wide swath along the permanent transect lines. The abundances of smaller algae and invertebrates, cryptic fish and area and coverage of hard and soft substrates are recorded in six permanent 1 m2 quadrats spaced evenly along each transect. The experimental modules and natural reference plots are being monitored for the entire five year experiment. The purpose of collecting data throughout the experiment is to assess differences in rates of development (and processes affecting development) between the different reef designs, and to determine whether the biota on the different reef designs has stabilized. Monitoring reference reefs for the duration of the experiment is critical. If the biological assemblages on any of the experimental modules have not stabilized after five years, then data collected from natural reference reefs will be used to determine whether the lack of stability reflects natural variability in the region. Permanently fixed quadrats and transects are being used to ensure that differences observed over time reflect temporal rather than spatial variability in the performance of the experimental modules. As of December 31, 2001 a total of 4275 dives amounting to 2873 hours underwater were spent in the field monitoring the artificial and reference reefs.
45

Table 1. The eight reef designs tested in the San Clemente experimental artificial reef 67% bottom cover of quarry rock 34% bottom cover of quarry rock 34% bottom cover of quarry rock with transplanted kelp 17% bottom cover of quarry rock 67% bottom cover of concrete rubble 34% bottom cover of concrete rubble 34% bottom cover of concrete rubble with transplanted kelp 17% bottom cover of concrete rubble
46

Figure 1. Location of the San Clemente experimental artificial reef.
San Clemente Pier
7
6 5
4
3
2
1
47

PHYSICAL CHARACTERISTICS OF THE EXPERIMENTAL PHASE OF THE SAN CLEMENTE ARTIFICIAL REEF
Dan Reed
Marine Science Instititute University of California, Santa Barbara
Mitigation requirement The SONGS coastal development permit requires that the mitigation reef be constructed of rock, concrete, or a combination of these materials at a coverage that is suitable for sustaining giant kelp and associated kelp forest biota similar in composition and diversity to nearby reference reefs, as determined by results from the experimental artificial reef. The total areal extent of the mitigation reef shall be no less than 150 acres. An important performance standard is that at least 90 percent of the area of exposed artificial substrate must remain available for the attachment of reef biota. SCE will be required to add sufficient artificial reef material to the mitigation reef to replace lost or unsuitable hard substrate, if at any time the Executive director determines that more than 10 percent of the artificial reef material has become covered by sediment, or has become unsuitable for growth of attached biota due to scouring and there is no sign of recovery within three years. In accordance with Condition D, scientists contracted by the Commission shall initiate surveys to monitor the amount and distribution of exposed artificial reef substrate. These surveys shall begin immediately after construction of the mitigation reef is complete and continue for at least 10 years. Methods The amount and distribution of artificial reef material is being surveyed on the experimental reef modules to determine the likelihood of the different experimental reef designs in meeting the performance standard for hard substrate required of the mitigation reef. The area of exposed artificial reef substrate for a given module is being estimated as the product of the area defined by the perimeter of the module (i.e. the module footprint) and the percent cover of artificial substrate within the module’s perimeter. Footprint area is estimated using side scan sonar and percent cover of artificial substrate is estimated by divers using a uniform point contact method. Ecosystems management has been contracted by the CCC o monitor changes in the footprint areas of the 56 artificial reef modules using side scan sonar. The navigation for the side scan sonar surveys is performed using a Differential Global Positioning System (DGPS) in conjunction with a navigational software to navigate the vessel. The side scan sonar data are collected using a Side Scan Data Acquistion System that consists of the data acquisition software, computer with A/D Data Acquisition Board, and the 500 kHz Klien Digital Side Scan sonar Model 595.
48

Each of the 56 modules was pre-plotted with 4 lines, each about 10 m on the outside of each of the four sides of the module. The vessel runs a transect along each of the pre-plotted lines until a “good” image is obtained. The criteria for a “good” image are that the image is not distorted, the vessel track is relatively parallel to the edge of the module, and that the entire module is visible. This digital image is stored on hard disk and processed at a later date. The processing involves the justification of the image. The 2 axes of each image are the axis of the vessel track and the axis perpendicular to the vessel track. The dimension of the axis perpendicular to the vessel track is accurate because the speed of sound in water during the survey is the speed of the sound of water during the survey is relatively accurate. This axis is also corrected for slant range within the side scan sonar processing software. The dimensions of the vessel track axis vary because of vessel speed changes and are corrected by using the dimensions measured from the perpendicular passes to justify the image. Consequently, the north and south passes are used to justify the dimensions of the east and west passes, and conversely, the east and west passes are used to justify the dimensions of the north and south passes. The justified image is then digitized and the area and perimeter of the module is determined. The mean of the four images is calculated (in some cases, an image is not used due to distortion, or indistinct boundaries) and used to estimate the footprint area. To date, there have been three side-scan sonar surveys of module footprint areas: September/October 1999 immediately following construction, October 2000, and July 2001. The percent cover of hard substrate on each module is measured by divers using a uniform grid of 20 points placed in the six permanent 1 m2 quadrats that are uniformly arranged on each permanent 40 m transect. The grid of 20 points consists of five knots spaced every 20 cm on each of four equally spaced lines that are positioned parallel to the transect line. The observer draws an imaginary line through each of the points that is perpendicular to the bottom, and records the substrate intercepted by the line extending below the point. Substrates are categorized as bedrock (continuous rocky reef), mudstone, large boulder (rock ≥ 1 m), medium boulder (50 cm ≤ rock < 1 m), small boulder (25.6 cm ≤ rock < 50 cm), cobble (6.4 cm ≤ rock < 25.6 cm), pebble (2 mm ≤ granule < 6.4 cm), sand/silt/clay (granule < 2 mm), and shell hash. When the substrate is covered with 1 cm or more of silt, making it an unsuitable for recruitment of organisms, the substrate is noted as being silted. Much of the concern about using quarry rock vs. recycled concrete to build the mitigation reef was not based on toxicity or longevity; there are numerous examples that show both materials are quite adept at supporting marine life. Rather, the concern about using rock vs. concrete to build the mitigation reef arose from uncertainties pertaining to how reefs built from materials having different sizes and shapes alter the topographic features of a reef, that in turn influence the abundance and composition of reef biota. Although widely used, the method of assessing percent cover described above does not fully capture the topographic complexity of the different artificial reef designs. To gain information on how rock and concrete modules of varying coverage differ with respect to various physical characteristics of the reef we employed a second sampling method aimed at
49

providing information on the small scale topographic complexity of the different reef designs. In this second method, small link chain is laid out in the quadrats in the same four locations as the knotted line used in the first method. One end of the chain is attached to the distal side of the quadrat frame (i.e. the side farthest from the zero end of the transect) and the chain is laid out parallel to the transect line such that it follows the contour of the bottom and extends to the proximal side of the quadrat (i.e. the side of the quadrat closest to the zero end of the transect). The substrate category beneath the chain is recorded at each 20 cm increment of chain creating an non-planar uniform grid of points in each quadrat. The diver imagines 10 cm lines perpendicular to the orientation of the chain that intersect each point. The surface slope of the substrate is recorded at each point sampled using an underwater level consisting of a graduated arc and a small piece of line attached to a float. These angles are categorized as vertical (90° ± 15°), approaching vertical (45° – 75°), approaching horizontal (15° ≤ 45°), horizontal (0° ± 15°), and overhanging (angle less than vertical, facing the bottom). The total length of chain needed to transverse the quadrat is recorded for each of the four lengths of chain. Substrate rugosity within a quadrat is estimated as the ratio of the average contour length of the bottom (as measured by the average length of chain needed to traverse the quadrat) to the planar length of the quadrat (which in this case is equal to 1 m). Results Changes in the area of artificial substrate The module footprint areas of all reef designs increased by 8 to 15% during the first year following construction (Figure 1). Much smaller changes in footprint area were observed during the second year. Redistribution of artificial substrates by wave action is believed to have caused the increase in footprint area. Observations by divers that artificial reef material had been deposited on permanent transect lines confirmed that some redistribution had occurred. Initially, the footprint areas of low coverage rock and concrete modules (i.e. 17%) were noticeably smaller than those of higher coverage modules. Overtime, there has been a convergence of the footprint areas of rock modules and by summer 2001 there was little difference in the areas of rock modules having different bottom coverages. In contrast, differences in footprint areas among concrete modules having different bottom coverages have remained substantial and relatively constant over time. The percent cover of artificial substrate also increased considerably during the first year following construction (Figure 2). Like footprint area, redistribution of reef material by waves is believed to have caused the increase in percent cover of artificial substrate as well. It is important to note that data on the initial percent cover of artificial substrate were collected by Coastal Environments immediately after reef construction using a different sampling design than that used by CCC contract scientists in subsequent surveys. Thus, it is possible that some of the increases in percent cover observed between the initial and subsequent surveys reflect differences in sampling accuracies between the two methods rather than actual differences in percent cover. Calibration studies are planned for 2002 to compare the sampling accuracies of the two methods.
50

The increases in footprint area and percent cover due to redistribution have resulted in there being more area of hard substrate available to reef biota than that which was initially deployed (Figure3). Physical characteristics of rock, concrete and natural reference reefs Measurements of concrete and rock taken on land before the material was deployed to the ocean show that the pieces used to build the concrete modules were on average 50 % longer and 47% wider than pieces used to build the rock modules (Figure 4). The thickness of the two materials was quite similar. Data collected by divers on the size frequency distributions of the artificial substrates in permanent quadrats show that concrete modules are composed primarily of large pieces. Nearly one third of the concrete substrates were longer than 100 cm and over 70% were longer than 50 cm. In contrast, nearly 40 % of the rock was < 50 cm in length and only 3% was greater than 100cm long. The relatively large flat pieces of concrete used to construct the reef resulted in concrete modules having proportionally more horizontal surfaces than rock modules (Figure 5). In general, the surface slopes of rock reefs were more evenly distributed than those of concrete reefs. This highly diverse array of vertical and horizontal surface slopes on rock modules contrasted sharply with that observed for the reference reefs, which were characterized by a large proportion of horizontal surface. The greater rate of change in surface slopes observed for rock reefs compared to concrete reefs indicates that the large percentage of horizontal surface on concrete occurs primarily in relatively large continuous patches (Figure 6). That the rate of change in surface slope generally increased with the percent cover of artificial substrate reflects the flat nature of soft sediments and the extent to which they reduce the topographic complexity of reefs. Despite the differences seen in the size and surface slope of rock and concrete modules, the small scale rugosity (i.e., contour length / planar length of a quadrat) of the two types of reefs was remarkably similar, and substantially higher than the reference reefs (Figure 7). Summary • The percentage cover of artificial substrate on the experimental modules is
substantially greater than the intended nominal coverages of 17%, 34% and 67%. • The area of hard substrate increased substantially on all reef designs shortly after
construction (likely due to redistribution). • Since this initial increase, the area of artificial substrate has shown slight to
moderate declines (likely due to burial). • Concrete modules are made of larger, flatter pieces than rock modules.
51

• The low slope characteristics of concrete modules are more similar to the reference reefs than those of rock modules.
• The small-scale rugosity of rock and concrete modules is very similar and
substantially greater than that of the reference reefs.
52

Figure 1. Footprint area estimated from side scan sonar for the three levels of bottom coverage of quarry rock and concrete modules.
Are
a (m
2 )
RockConcrete
17% 67%34%
Module Footprint Area
1300
1400
1500
1600
1700
1800
1900
Sep 99 Oct 00 July 01 Sep 99 Oct 00 July 01
Are
a (m
2 )
RockConcrete
17% 67%34%
Module Footprint Area
1300
1400
1500
1600
1700
1800
1900
Sep 99 Oct 00 July 01 Sep 99 Oct 00 July 01 Sep 99 Oct 00 July 01 Sep 99 Oct 00 July 01
53

Figure 2. Percent cover of artificial substrate estimated by divers using a uniform point contact method for the three levels of bottom coverage of quarry rock and concrete modules.
99 00 01 02 03 0499 00 01 02 03 040
20
40
60
80
100
Per
cent
Year
Concrete
Percent Cover of Artificial Substrate
Reference
Rock
17% 67%34%
99 00 01 02 03 0499 00 01 02 03 040
20
40
60
80
100
Per
cent
Year
Concrete
Percent Cover of Artificial Substrate
Reference
Rock
17% 67%34%
54

Figure 3. Change in area of artificial substrate for the three levels of bottom coverage of quarry rock and concrete modules. Dashed horizontal line indicates the performance standard of 90%.
Change in Area of Artificial Substrate
17% 67%34%
Rock
99 00 01 02 03 040
50
100
150
200
250
Concrete
99 00 01 02 03 04
Per
cent
of i
nitia
l are
a
Change in Area of Artificial Substrate
17% 67%34%
Rock
99 00 01 02 03 040
50
100
150
200
250
Concrete
99 00 01 02 03 04
Per
cent
of i
nitia
l are
a
YearYear
55

Figure 4. Mean dimensions of the quarry rock and rubble concrete used to build SCAR.
Length Width Height0
40
20
60
80
Rock (N = 145)
Concrete (N = 864
Mea
n (c
m)
100)
56

Figure 5. Frequency distribution of the lengths of quarry rock and rubble concrete on SCAR.
Freq
uenc
y
7 - 25 26 - 50 51 - 99 > 100
20
40
60
Sizes of Artificial Substrates
Rock
Concrete
Length ( cm)
Freq
uenc
y
7 - 25 26 - 50 51 - 99 > 100
20
40
60
Sizes of Artificial Substrates
Rock
Concrete
Length ( cm)
57

Figure 6. Frequency distribution of the surface slope (i.e., angle of inclination) of quarry rock and concrete modules and of the reference reefs.
Slope of Substrate
0-15 16-45 46-75 76-90 Overhang
0
10
20
30
40
50
Freq
uenc
y
ReferenceConcreteRock
Angle
58

Figure 7. Surface irregularity of the three bottom coverages of rock and concrete modules and of the reference reefs.
Surface Irregularity of Substrate
# A
ngle
Cha
nges
/ 1
m(p
oint
s sa
mpl
ed e
very
10
cm)
17% 34% 67% Reference0
1
2
3
4
5
6 Rock Concrete
59
Public Comment MR. SPECKER: John Specker, Santa Monica Reef Restoration Project. How deep are your modules placed? MR. REED: The depth is about 48 to 50 feet. MR. SPECKER: In the shallowest? MR. REED: Yes, the whole range. I mean, it is a fairly narrow range where the reef exists. MR. SPECKER: And, it is right out -- approximately, how many acres? MR. REED: The amount of materials deposited was 22.4 acres. MR. SPECKER: Thank you. MR. REED: Others? MR. STREICHENBERGER: It was a brilliant presentation, but the question, why is this experiment limited to five years, because we know that when you are through with that kind of experiment, to know the production of an artificial reef, we need 10 years. The first five years is the time when the space is established, you know, on the new reef, and the other of five years is a time there is a kind of change, seasonal change, or change of spaces, and it is only after 10 years that really you can have the information you look for. So, it means, when you are going to stop the experiment in three years, you are going to be short of information, and you still not be with adequate information to take a decision for the future. If you want to take it with knowledge, you know, your decision, you have to put it up to more than five years. At that time, you are going to be 36 years after the beginning of it, and this is not acceptable. But, please, at least limit my question: why five years? and you stop? You are not going to get information you need. MR. REED: That is a very good point. That was debated quite a bit back in '97 when the permit was amended. There were a lot of proponents that wanted to make the experimental phase longer, 10 years. And, you said it pretty eloquently there, that the tradeoff is the longer you extend the experiment, the longer you are putting off compensation for the lost resources.
60

And, ultimately, after the debate, the Commission decided that it was better to include some process studies that would allow us to help predict what is going to happen over the long term, and get the mitigation on track, and to curtail the experiment to five years, and to move into the mitigation phase as soon as possible. That was the decision that was made. MR. STREICHENBERGER: Thank you.
61

GIANT KELP
Dan Reed Marine Science Instititute
University of California, Santa Barbara [email protected]
Mitigation requirement An important performance standard for the mitigation reef is that it sustain 150 acres of the giant kelp, Macrocystis pyrifera at medium to high densities. For purposes of the SONGS coastal development permit, medium to high density kelp is defined as more than four adult plants per 100 m2, which was the definition used by the Marine Review Committee to estimate the amount of kelp loss attributed to SONGS during the impact assessment phase of the SONGS monitoring program. Methods A multi-component approach to monitoring giant kelp is being used during the experimental phase to obtain the pertinent information needed to evaluate the performance of the different reef designs with respect to the standard for giant kelp. The monitoring involves collecting information on a range of size classes of naturally occurring kelp as well as data on kelp transplanted to the San Clemente Artificial Reef (SCAR). The size categories used in monitoring giant kelp are as follows: Adult – an individual having eight or more stipes or having haptera extending up to or
above the primary dichotomy. Sub-adult – an individual exceeding one meter in height having fewer than eight stipes
and having no haptera that extend up to or above the primary dichotomy. Juvenile – a small blade having a split or an individual consisting of a few fronds < 1 m
tall. Recruit – a small blade lacking a split that can be identified as Macrocystis by the
undulation at the base of the blade. Unidentified kelp blade – a small kelp blade (generally < 2 cm tall) that cannot be
identified to species. Data collected on adults are used to evaluate how well the different experimental reef designs meet the performance standard for giant kelp that will be applied to the mitigation reef. Data collected on the abundances of sub-adults, juveniles, and recruits provide insight into the biological processes needed to sustain adult giant kelp at densities at or above the performance standard. Data collected on transplanted kelp are used to assess whether the transplant method is likely to be a viable means of augmenting the abundance of giant kelp on the larger mitigation reef. Adult and sub-adult plants are sampled twice per year (winter & summer) in permanently located 40 m x 2 m transects on the artificial reef modules of SCAR and at the nearby reference reefs, Barn kelp bed and San Mateo kelp bed. All transects are marked with lead line anchored to the bottom with stakes. There are four transects on each of the 56
62
artificial reef modules and nine transects at each of the two reference sites. A pair of divers swimming on opposite sides of the 40 m long lead line record information on all adult and sub-adult plants encountered in a one meter wide swath adjacent to the lead line. Frequently, only a portion of a plant is located within the 1 m swath. Of special concern is the case when a plant recruits outside the swath and then encroaches into the swath on subsequent surveys via the spreading of its holdfast. To avoid counting “encroaching” plants that were not located in the swath in previous surveys, divers only count adult and sub-adult plants if their primary dichotomy is located within 105 cm of the lead line. Every adult plant encountered along each transect is counted and tagged and its survivorship is followed on subsequent surveys. Tags consist of a white plastic paper label containing a unique alpha-numeric identification number. Tags are fastened with a nylon cable tie to either the holdfast or the secondary dichotomy. The dimensions of the reef substrate to which the plant is attached is recorded at the time of initial tagging. Data on the size of all tagged adults are collected on each survey. Plant size is measured in two ways: by the number of fronds >1 m tall, and by the basal area of the holdfast. Holdfast area is calculated from measurements of holdfast length and width using the equation for an ellipse (area = length*width*π/4). Data on fecundity is recorded for the first 30 adult plants encountered on each transect. The fecundity of a plant is based on its total sorus area, which is estimated as the product of the number of sporophylls having sori and the average length and width of the sori. Sub-adults are not tagged until they reach adulthood. Data collected on sub-adults include the number of stipes greater than 1 m tall and the category of substrate to which the plant is attached. Substrate categories are as follows: bedrock, large boulder (> 100 cm in length), medium boulder (51 to 100 cm in length), small boulder (26 to 50 cm length), cobble (7 to 25 cm length), and pebble (2 to 7 cm length). Juveniles and recruits of giant kelp are sampled once per year in the summer. Juveniles are counted in the same 2 m x 40 m areas that adults and sub-adults are counted in. Because it is inefficient to count numerous small kelp plants in an area as large as that delineated by the transects, recruits of Macrocystis are counted in six 1m2 quadrats that are evenly spaced along each transect. Coastal Research Associates transplanted laboratory-reared giant kelp to fourteen of the 56 modules in June/July 2000 (one 34 % rock module and one 34 % concrete module in each of the seven blocks). Thirty transplant units were uniformly placed approximately two meters from two of the four transect lines on each of the 14 transplant modules (N = 60 transplant units per transplant module). A transplant unit consisted of a small length of braided nylon rope containing many young laboratory-reared giant kelp. The braided rope with transplanted kelp was fastened to a plastic plate bolted to the artificial reef substrate. Each transplant unit was sampled in August 2000 and August 2001 for presence/absence of the transplant plate, presence/absence of giant kelp on the transplant plate, and size category of kelp on the transplant plate (i.e. recruit, juvenile, sub adult, adult).
63

Results Colonization Substantial recruitment of giant kelp occurred on SCAR during the late spring and early summer of 2000. Colonization by giant kelp was slightly higher on rock modules compared to concrete modules (Figure 1). More strikingly, the density of kelp recruits increased with increasing cover of artificial substrate; 34 % and 67% cover modules had two to three times more juvenile Macrocystis than 17% cover modules. With the exception of block 1, the density of kelp recruits generally decreased with increasing distance from the San Mateo kelp bed (Figure 2). Nonetheless, substantial recruitment of giant kelp still occurred in block 7, which is located approximately 3.5 km up coast of San Mateo, the nearest kelp bed. In contrast to SCAR, only sparse recruitment of giant kelp was observed at the two natural reference reefs (Figures 1 and 2). Shading by a dense surface canopy was the most probable cause of poor kelp recruitment at these sites. Very little kelp recruitment was observed during the summer of 2001at SCAR or the reference sites. The dense recruitment of kelp on modules relatively far from the nearest population of giant kelp is contrary to the conventional wisdom that spore dispersal in giant kelp is limited to a few meters of the parent plant. The constraint on longer distance dispersal arises because fertilization in kelp occurs on the bottom following spore dispersal. As spores disperse they become progressively diluted in the water column thereby reducing the odds that male and female spores will settle close enough for fertilization to occur. Because of this limitation, colonization by kelps at sites removed from extent populations has been explained most often by local spore dispersal from detached plants and reproductive plant fragments that drifted to the site. Drifting adult plants were observed on SCAR shortly after it was constructed. Surveys done in winter/spring 2000 revealed giant kelp densities on SCAR that were about one plant per module, which was substantially lower than the adult densities recorded on the reference reefs (Figure 3). Giant kelp survey on SCAR at this time were smaller (i.e. had fewer stipes) and less fecund (i.e. had less sorus area) than those at the control sites (Figures 4 and 5). That kelp plants at SCAR were attached largely to small cobbles (Figure 6), which is consistent with the idea that they drifted to the artificial reef modules and became wedged in the concrete and quarry rock substrates. No recruits were observed on SCAR of the reference reefs at this time, indicating that the spores that gave rise to the strong recruitment pulse in summer 2000 likely settled during the winter of 2000. The size of the spore source at SCAR during the winter of 2000 was nearly two and one half orders of magnitude less than that at San Mateo and Barn kelp beds (Table 1). Had drifters contributed substantially to the summer 2000 recruitment event on SCAR, one would have expected to see greater numbers of recruits on modules with larger spore sources. This was not observed. There was no relationship between the total sorus area of a module in winter/spring of 2000 and the number of giant kelp that recruited to that module in August 2000 (Figure 7). Collectively, these data suggest that the dense colonization of giant kelp on the artificial reef modules in summer 2000 resulted from km-scale spore dispersal from neighboring kelp beds rather than from local spore dispersal from isolated plants that drifted to SCAR.
64
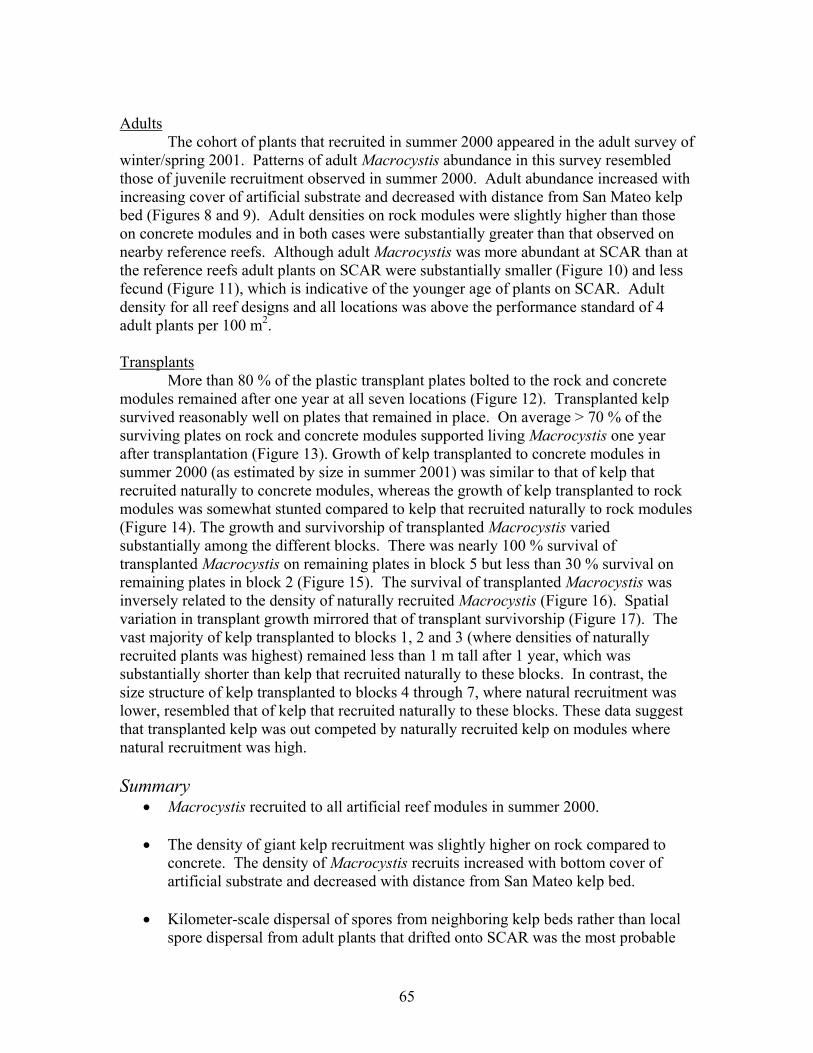
Adults The cohort of plants that recruited in summer 2000 appeared in the adult survey of winter/spring 2001. Patterns of adult Macrocystis abundance in this survey resembled those of juvenile recruitment observed in summer 2000. Adult abundance increased with increasing cover of artificial substrate and decreased with distance from San Mateo kelp bed (Figures 8 and 9). Adult densities on rock modules were slightly higher than those on concrete modules and in both cases were substantially greater than that observed on nearby reference reefs. Although adult Macrocystis was more abundant at SCAR than at the reference reefs adult plants on SCAR were substantially smaller (Figure 10) and less fecund (Figure 11), which is indicative of the younger age of plants on SCAR. Adult density for all reef designs and all locations was above the performance standard of 4 adult plants per 100 m2. Transplants More than 80 % of the plastic transplant plates bolted to the rock and concrete modules remained after one year at all seven locations (Figure 12). Transplanted kelp survived reasonably well on plates that remained in place. On average > 70 % of the surviving plates on rock and concrete modules supported living Macrocystis one year after transplantation (Figure 13). Growth of kelp transplanted to concrete modules in summer 2000 (as estimated by size in summer 2001) was similar to that of kelp that recruited naturally to concrete modules, whereas the growth of kelp transplanted to rock modules was somewhat stunted compared to kelp that recruited naturally to rock modules (Figure 14). The growth and survivorship of transplanted Macrocystis varied substantially among the different blocks. There was nearly 100 % survival of transplanted Macrocystis on remaining plates in block 5 but less than 30 % survival on remaining plates in block 2 (Figure 15). The survival of transplanted Macrocystis was inversely related to the density of naturally recruited Macrocystis (Figure 16). Spatial variation in transplant growth mirrored that of transplant survivorship (Figure 17). The vast majority of kelp transplanted to blocks 1, 2 and 3 (where densities of naturally recruited plants was highest) remained less than 1 m tall after 1 year, which was substantially shorter than kelp that recruited naturally to these blocks. In contrast, the size structure of kelp transplanted to blocks 4 through 7, where natural recruitment was lower, resembled that of kelp that recruited naturally to these blocks. These data suggest that transplanted kelp was out competed by naturally recruited kelp on modules where natural recruitment was high. Summary
• Macrocystis recruited to all artificial reef modules in summer 2000.
• The density of giant kelp recruitment was slightly higher on rock compared to concrete. The density of Macrocystis recruits increased with bottom cover of artificial substrate and decreased with distance from San Mateo kelp bed.
• Kilometer-scale dispersal of spores from neighboring kelp beds rather than local
spore dispersal from adult plants that drifted onto SCAR was the most probable
65

source for the recruitment of giant kelp that was observed on SCAR in summer 2000.
• Patterns of adult abundance on SCAR in summer 2001 reflected patterns of
juvenile abundance in summer 2000.
• Adults on all artificial reef designs were smaller, less fecund, but more abundant than adults on reference reefs.
• All reef designs and blocks exceeded the performance standard for adult kelp (i.e.,
> 4 four adults / 100 m2) in summer 2001.
• The method used to transplant Macrocystis was largely successful in augmenting kelp abundance on both rock & concrete modules.
66

Table 1. Size of potential spore sources for Macrocystis recruitment on SCAR in summer 2000.
SCAR San Mateo Barn
Sorus area / plant (m2) 0.155 0.292 0.202
Plant density (no. m-2) 0. 009 0.100 0.408
Reef area (m2) 85,099 1,662,147 704,204
Sorus area / reef (m2) 117 48,567 58,108
67
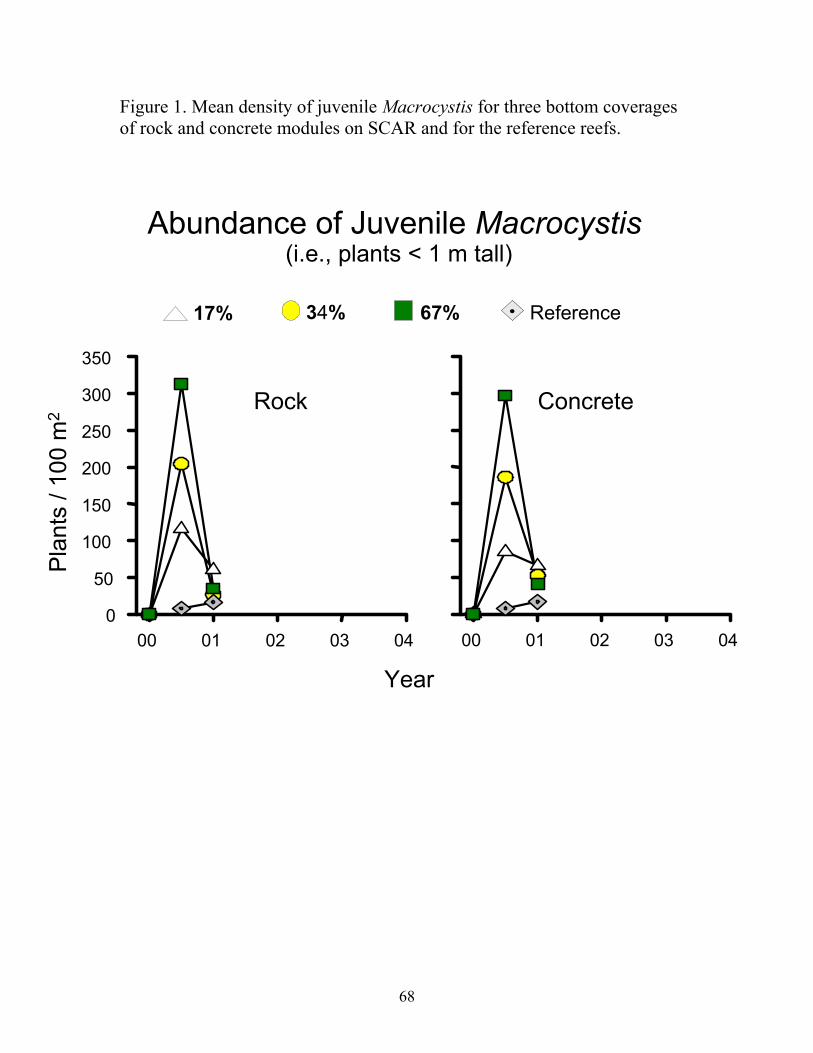
Figure 1. Mean density of juvenile Macrocystis for three bottom coverages of rock and concrete modules on SCAR and for the reference reefs.
00 01 02 03 040
50
100
150
200
250
300
350
00 01 02 03 04
Abundance of Juvenile Macrocystis(i.e., plants < 1 m tall)
Year
Pla
nts
/ 100
m2
Rock Concrete
17% 67%34% Reference
68
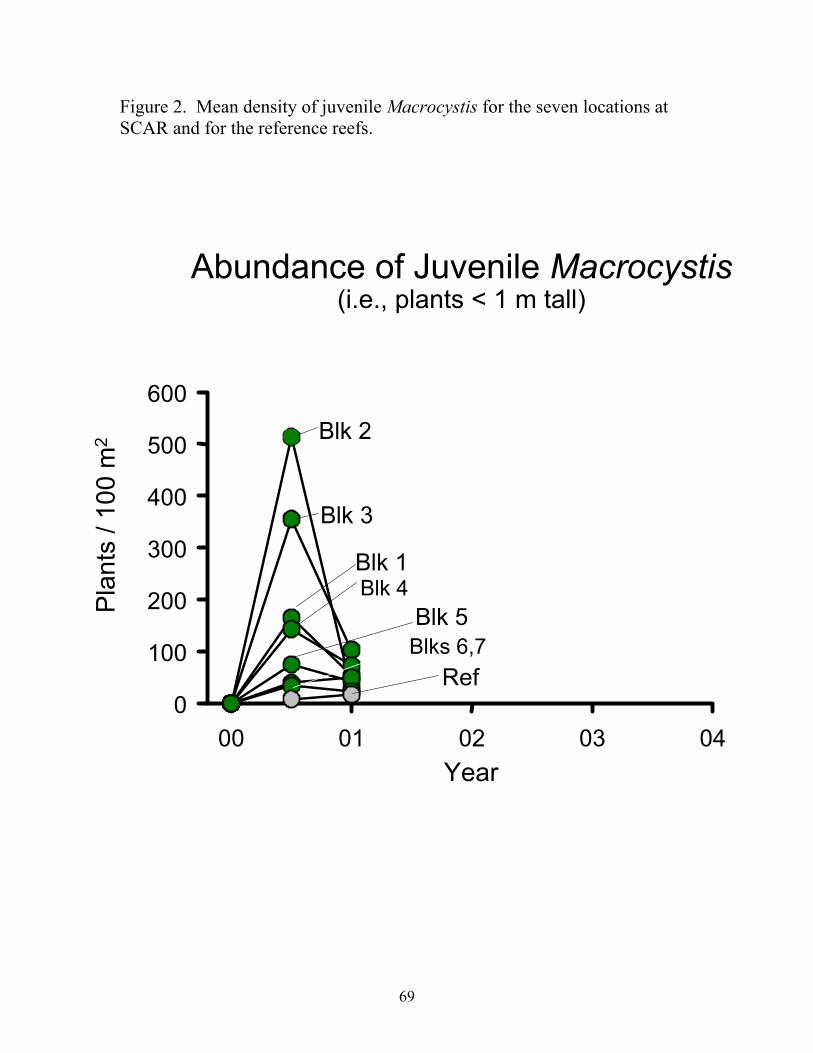
Figure 2. Mean density of juvenile Macrocystis for the seven locations at SCAR and for the reference reefs.
00 01 02 03 04
600
Abundance of Juvenile Macroc(i.e., plants < 1 m tall)
0
100
200
300
400
500 Blk 2
Blk 3
Blk 1
Blk 5
Ref
ystis
Year
Pla
nts
/ 100
m2
Blk 4
Blks 6,7
69

Figure 3. Mean density of Macrocystis at SCAR, San Mateo, and Barn during the winter /spring of 2000.
SCAR SMK Barn0
10
20
30
40
50
Macrocystis density(winter/spring 2000)
Pla
nts
/ 100
m2
70

Figure 4. Frequency distribution of frond number for Macrocystis at SCAR, San Mateo, and Barn during the winter/spring of 2000.
Number of fronds plant-11-4 5-8 9-12 13-16 17-20 > 20
Freq
uenc
y (%
)
0
20
40
60
80
100
Macrocystis – Plant Size (winter/spring 2000)
SCARBarn San Mateo
71

Figure 5. Frequency distribution of the size of the substrate to which Macrocystis was attached at SCAR, San Mateo, and Barn during the winter /spring of 2000.
Substrate Size (m2)
0
20
40
60
80
100
Macrocystis – Size of Attachment Substrate(winter/spring 2000)
SCARBarn San Mateo
<.2 .21-.4 .41-.6 .61-.8 >.8
Freq
uenc
y (%
)
72

Figure 6. Mean sorus area of Macrocystis at SCAR, San Mateo, and Barn during the winter /spring of 2000.
Sor
us a
rea
(m )
/ pl
ant
2
0.0
0.1
0.2
0.3
Macrocystis fecundity(winter/spring 2000)
SCAR SMK Barn
73

Figure 7. Relationship between local fecundity and the density of Macrocystis recruits on SCAR in summer 2000.
Sorus area (m-2) * module-10 5 10 15 20 25 30
Rec
ruits
* m
odul
e x
100
0
0
5
10
15
20
25Macrocystis
-1
74
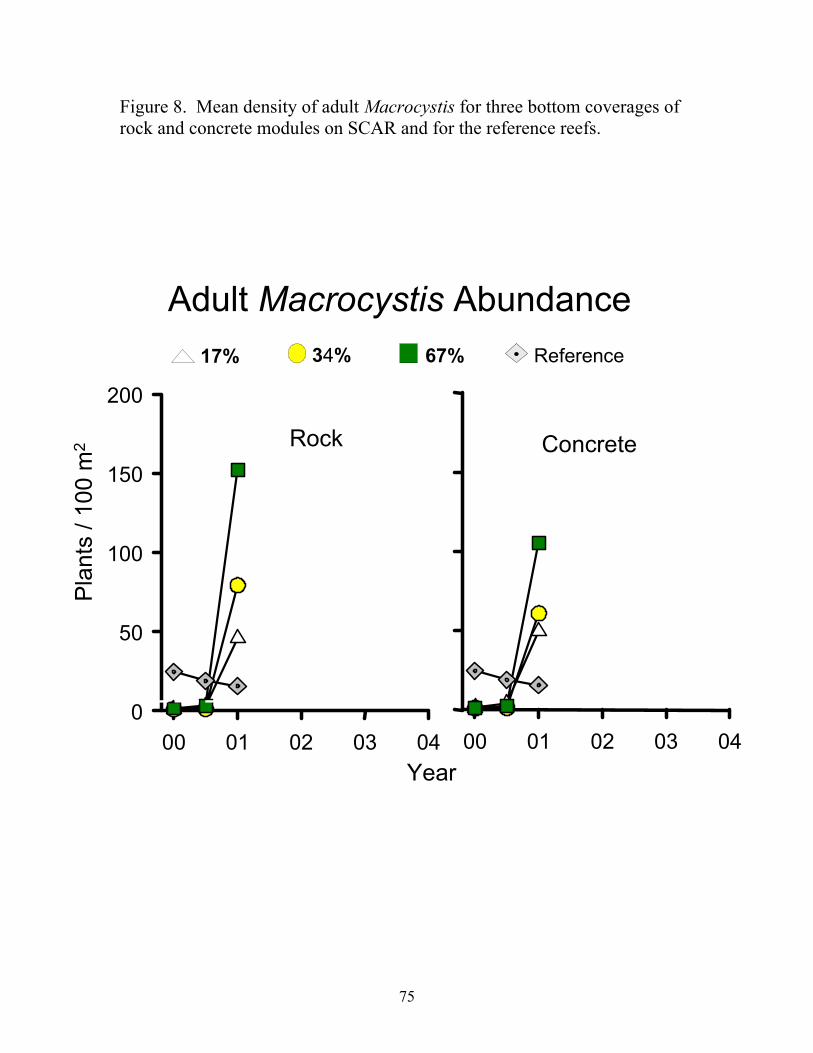
Figure 8. Mean density of adult Macrocystis for three bottom coverages of rock and concrete modules on SCAR and for the reference reefs.
00 01 02 03 04 00 01 02
Rock Concrete
Adult Macrocystis Abundance17% 67%34% Reference
Year03 04
0
50
100
150
200
Pla
nts
/ 100
m2
75

Figure 9. Mean density of adult Macrocystis for the seven locations at SCAR and for the reference reefs.
Blks 6,7
Blk 4Blk 5
Blk 1
00 01 02 03 040
25
50
75
100
125
150
Ref
Adult Macrocystis Abundance
Pla
nts
/ 100
m2
Year
Blk 2
Blk 3
76

Figure 10. Frequency distribution of the number of stipes on Macrocystis > 1 m tall during spring 2001 on rock and concrete modules at SCAR and the reference reefs.
Size of Macrocystis >1m (Spring 2001)
Number of Stipes
Freq
uenc
y (%
)
17%34%67%
Reference
1-4 5-8 9-12 13-16 17-20 >200
20
40
60
Concrete
0
20
40
60
Rock
0
20
40
60
77

Figure 11. Mean sorus area of Macrocystis for three bottom coverages of rock and concrete modules on SCAR and for the reference reefs during spring 2001.
Reference17% 34% 67%0
500
1000
1500
2000
2500
3000
3500
Sor
us A
rea
(cm
2 / p
lant
)
RockConcrete
Macrocystis Fecundity(Spring 2001)
SitesTreatment
78
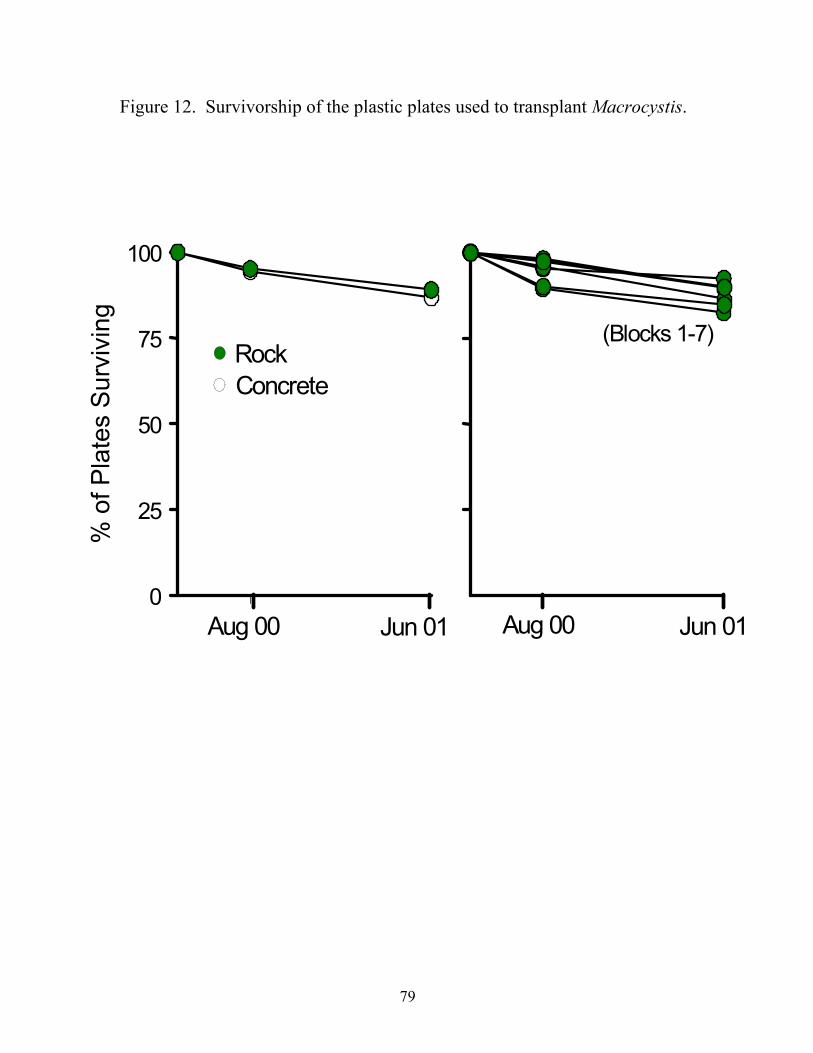
Figure 12. Survivorship of the plastic plates used to transplant Macrocystis.
0
25
50
75
100
Aug 00 Jun 01 Aug 00 Jun 01
(Blocks 1-7)RockConcrete
% o
f Pla
tes
Surv
ivin
g
79

Figure 13. Survivorship of Macrocystis transplanted to rock and concrete modules on SCAR.
Jun 010
25
50
75
100
% o
f Pla
tes
with
Kel
p
Aug 00
RockConcrete
80
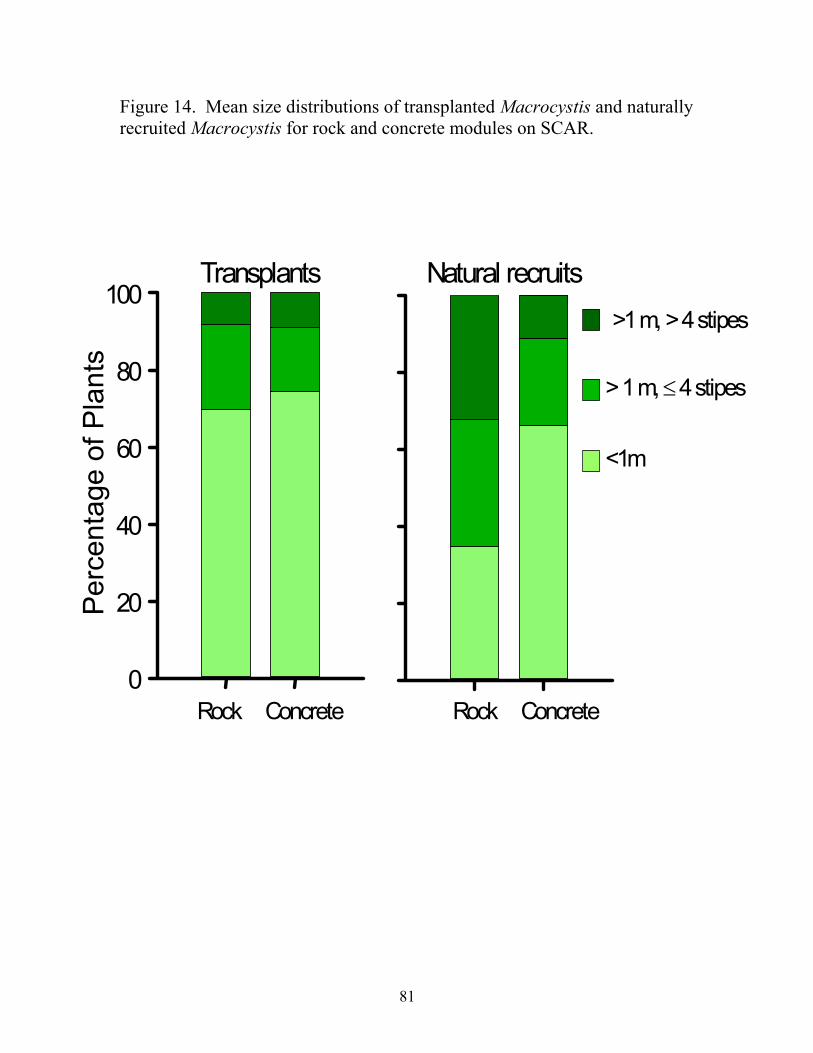
Figure 14. Mean size distributions of transplanted Macrocystis and naturally recruited Macrocystis for rock and concrete modules on SCAR.
20
40
60
80
100
Per
cent
age
of P
lant
s
> 1 m, ≤4 stipes
<1m
>1 m, > 4 stipes
Transplants Natural recruits
Rock Concrete Rock Concrete0
81
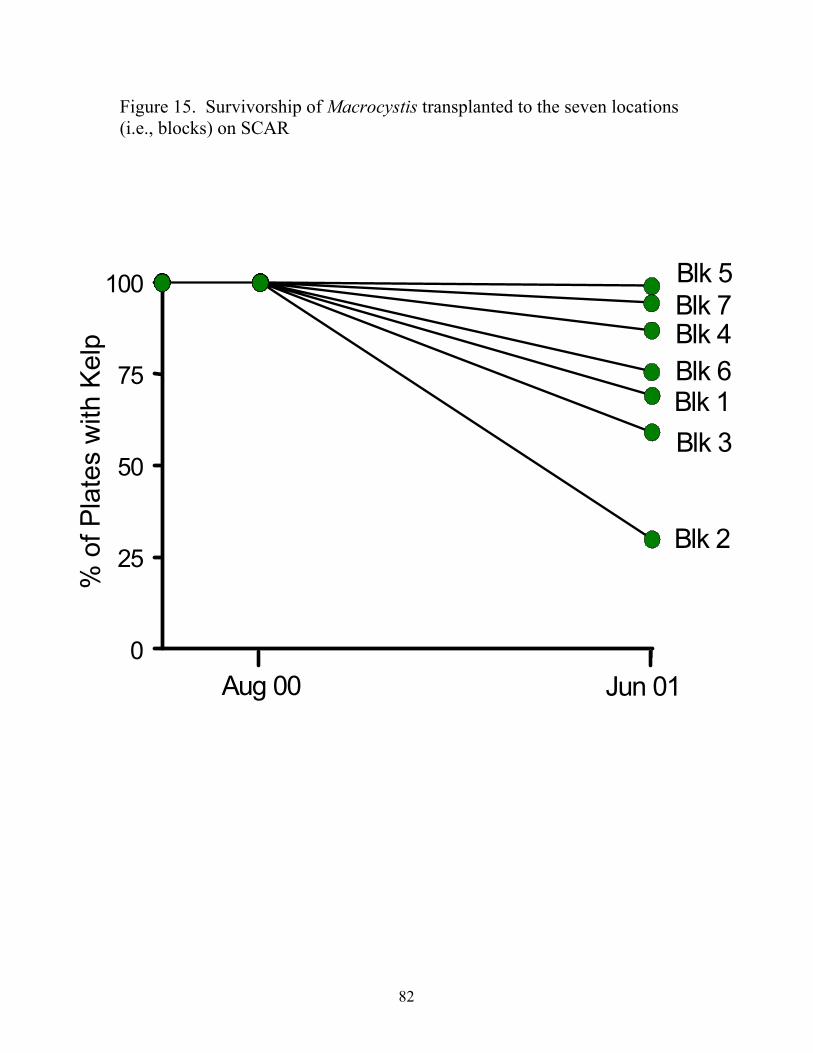
Figure 15. Survivorship of Macrocystis transplanted to the seven locations (i.e., blocks) on SCAR
25
50
75
100
% o
f Pla
tes
with
Kel
p
Blk 5Blk 7Blk 4Blk 6Blk 1Blk 3
Blk 2
Aug 00 Jun 010
82

Figure 16. Relationship between percent of transplants surviving vs. the density of Macrocystis recruits in August 2000.
0 100 200 300 400 500 6000
25
50
75
100
Per
cent
of p
late
s w
ith K
elp
(Jun
e 20
01)
Density of Macrocystis <1 m tall (August 2000)
83

Figure 17. Mean size distributions of transplanted Macrocystis and naturally recruited Macrocystis for the seven locations (i.e., blocks) on SCAR.
0
20
40
60
80
100Transplants Natural recruits
Per
cent
age
of P
lant
s
1 2 3 4 5 6 7 1 2 3 4 5 6 7Block
> 1 m, > 4 stipes> 1 m, ≤ 4 stipes< 1 m
84
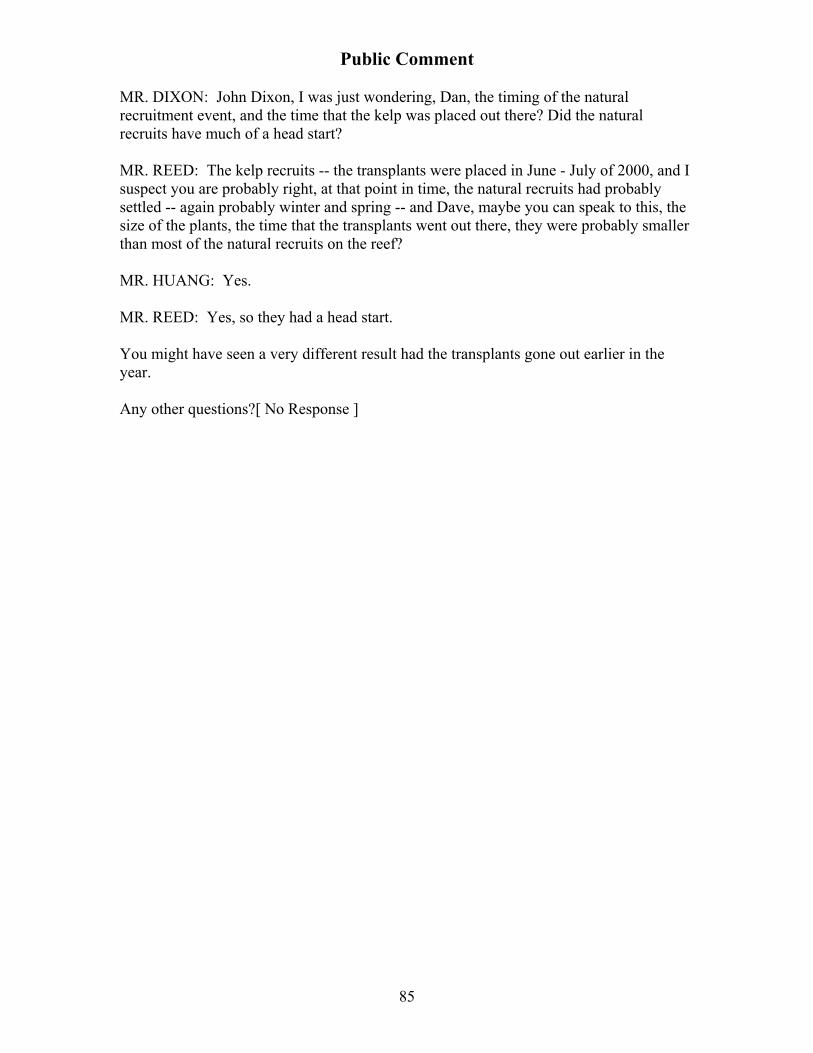
Public Comment MR. DIXON: John Dixon, I was just wondering, Dan, the timing of the natural recruitment event, and the time that the kelp was placed out there? Did the natural recruits have much of a head start? MR. REED: The kelp recruits -- the transplants were placed in June - July of 2000, and I suspect you are probably right, at that point in time, the natural recruits had probably settled -- again probably winter and spring -- and Dave, maybe you can speak to this, the size of the plants, the time that the transplants went out there, they were probably smaller than most of the natural recruits on the reef? MR. HUANG: Yes. MR. REED: Yes, so they had a head start. You might have seen a very different result had the transplants gone out earlier in the year. Any other questions?[ No Response ]
85

KELP FOREST BENTHIC COMMUNITY
Steve Schroeter Marine Science Instititute
University of California, Santa Barbara [email protected]
Mitigation requirement The SONGS permit specifies three performance standards for the kelp forest benthic community (invertebrates and understory algae) on the mitigation reef. These are: 1) The benthic community shall have coverage (i.e. percent cover) or density and number of species similar to natural reefs within the region. 2) The benthic community shall provide food-chain support for fish similar to natural reefs within the region, and 3) the important functions of the reef shall not be impaired by undesirable or invasive benthic species. This summary focuses on the first of the three permit performance standards. Methods Abundance of algae and invertebrates is estimated as counts per unit area and percent cover. Large invertebrates (e.g. sea stars, sea urchins, and lobsters) and algae (e.g. palm kelp, Pterygophora californica) are counted in replicate 40 m x 2 m band transects on the artificial reef modules of SCAR and at nearby reference reefs (Barn kelp bed and San Mateo kelp bed). Smaller invertebrates are counted in replicate 1m x 1m quadrats on each band transect. Abundances of colonial organisms (e.g. compound or colonial tunicates) or organisms for which individuals are difficult to distinguish (e.g. foliose red or brown algae) were measured as percent cover. Percent cover was estimated by noting the identity and vertical position of all organisms under 20 uniformly placed points within each 1m x 1m quadrat, giving a total of 120 points per transect. Species richness was estimated by combining the count and percent cover data.
The benthic community is sampled once per year (summer) in permanently located 40 m x 2 m transects and 1m x 1m quadrats on the artificial reef modules of SCAR and at the nearby reference reefs, Barn kelp bed and San Mateo kelp bed. All transects are marked with lead line anchored to the bottom with stakes. There are four transects on each of the 56 artificial reef modules and nine transects at each of the two reference sites. There are six uniformly spaced 1m x 1m quadrats on each transect. A pair of divers swimming on opposite sides of the 40 m long lead line counts large algae and invertebrates in a 1 m swath. Each diver counts individual algae invertebrates in 3 1m x 1m quadrats as well as estimates the percent cover of algae and invertebrates difficult to count as individuals. Results Algae sampled as counts rapidly colonized SCAR, and by July 2000, abundances were higher on all artificial reef treatments than at reference sites. On concrete modules, abundances were lower on the 17% than on the 34% and 67% coverage treatments but did not differ among coverage treatments on quarry rock modules. Abundances declined significantly on SCAR between July 2000 and July 2001 and increased slightly on the
86

reference reefs so that the differences between SCAR and the reference reefs were small in 2001 (Figure 1). In July, 2001 abundances were similar on all reef designs.
In July 2001, sixteen months after the construction of SCAR, species composition of algae sampled as counts, although similar on rock and concrete modules, differed markedly between SCAR and the reference reefs (Figure 2). The difference between SCAR and the reference reefs reflected the fact that SCAR was dominated by the understory algae Laminaria farlowii, whereas Cystoseira osmundacea and Pterygophora californica, absent on SCAR, were abundant on the reference reefs.
By contrast with algal counts, there was a clear positive relationship between the percent cover algae and the amount of artificial hard substrate, suggesting substrate limitation (Figure 3). This relationship was qualitatively similar on rock and concrete. As with algal counts, the percent cover of algae decreased on SCAR between July 2000 and July 2001, whereas the percent cover of algae increased sharply on the reference reefs. These changes in opposite direction resulted in the percent cover of algae on SCAR bracketing that on the reference reefs in July 2001.
Algal species composition was similar on rock and concrete treatments on SCAR in July 2001 and differed from the species composition on the reference reefs (Figure 4). Filamentous and small fleshy red algae dominated on both rock and concrete treatments on SCAR, whereas several species of long-lived red algae (e.g. crustose coralline algae and Osmundea sp.) were abundant on the reference reefs but absent on SCAR.
Algal species richness was similar among treatments on SCAR in both July 2000 and July 2001. In both years, richness was lower on SCAR than on the reference reefs (Figure 5). A slight decline in richness on SCAR coupled with a large increase in richness on the reference reefs between July 2000 and July 2001 resulted in there being about 1/3 fewer species on SCAR than on the reference reefs in July 2001.
Invertebrate counts on SCAR in July 2000 were much lower on all reef designs than on the reference reefs. The data from the first year’s sampling suggested that counts were higher on reef designs with greater amounts of artificial substrate, but the relationship varied between rock and concrete modules (Figure 6). By contrast, in July 2000 there was a strong positive relationship between invertebrate counts and the amount of artificial hard substrate on both rock and concrete modules on SCAR in July 2001 (Figure 6). Counts on SCAR increased substantially between July 2000 and July 2001 and declined on the reference reefs resulting in greater similarity in July 2001. Invertebrate counts on SCAR were still lower than those on the reference reefs in July 2001.
Species composition of invertebrates sampled as counts was similar on rock and concrete treatments on SCAR in July 2001 and differed from species composition on the reference reefs (Figure 7). SCAR was dominated by the solitary tunicate, Styela montereyensis and the tube worm Diopatra ornata whereas the distribution of relative abundance was more uniform on the reference reefs and contained abundant species that were absent on SCAR (e.g. sea urchins, Strongylocentrotus sp.; sea fans, Muricea californica, and a solitary anemone, Epiactis proliferata).
Similar to the pattern seen for percent cover or algae, there was clear positive relationship between the percent cover of invertebrates and the amount of artificial hard substrate, on both concrete and quarry rock modules, suggesting substrate limitation (Figure 8). In July 2000, invertebrate percent cover on the lowest coverage treatment on SCAR was similar to that on the reference reefs. The percent cover of invertebrates increased on the
87

two lower coverage treatments on SCAR between July 2000 and July 2001, and decreased on the highest coverage treatment. Percent cover on the reference reefs increased markedly. As a result, in July 2001, the percent cover of invertebrates on the reference reef bracketed the percent cover of invertebrates on SCAR.
In July 2001 the distributions of relative abundances of invertebrates sampled by percent cover were similar on rock and concrete modules on SCAR and differed markedly from the distributions on the reference reefs (Figure 9). SCAR modules were dominated by the small tunicate, Chelyosoma productum and the endoproct, Pedicellina cernua, both of which were the principal colonizers of SCAR during the July 2000 survey. By contrast, relative abundances on the reference reefs were much more uniform, and several species or groups of species were abundant which were not present on SCAR. These included the sand tube worm Phragmatopoma californica and several species of bryozoans.
As with algae, invertebrate species richness was similar among treatments on SCAR in both July 2000 and July 2001 and changed little between the two surveys. In both years, richness was lower on SCAR than on the reference reefs, but because of a large decrease in richness on the reference reefs between July 2000 and July 2001, species richness was more similar on SCAR and the reference reefs on the latter survey (Figure 10).
The percent cover of bare space was similar among reef designs on SCAR and the reference reefs (about 20%) in July 2000, and changed little from July 2000 to July 2001 (Figre 11). This pattern suggests that the total biological coverage (both algae and invertebrates) converged rapidly on SCAR to levels found the reference reefs. It also indicates that total biological coverage increases as a function of the amount of hard substrate. Summary
• Algal abundance was generally higher on the artificial reef than on the reference reefs. The percent cover of algae increased with the amount of artificial substrate, whereas the counts the counts of algae did not, suggesting substrate limitation for the former. Algal counts and percent cover both declined on SCAR between July 2000 and July 2001, but increased slightly on the reference reefs; consequently the percent cover and counts of algae on SCAR were more similar to those on the reference reefs on the latter survey.
• Invertebrate counts on SCAR were lower than on the reference reefs during both
the July 2000 and July 2001 surveys. Counts were tended to be positively related to the amount of artificial substrate and patterns were similar on both rock and concrete modules. Percent cover of invertebrates was also lower on SCAR than on the reference reefs and positively related to the amount of hard substrate. This pattern was stronger in July 2000 than in July 2001. With the exception of the highest coverage treatment on SCAR, invertebrate counts and percent cover increased between July 2000 and July 2001. By contrast, counts and percent cover of invertebrates decreased on the reference reefs, resulting in greater similarity between SCAR and the reference reefs on the latter survey.
• Species richness of both algae and invertebrates was generally lower on SCAR
than on the reference reefs. Similarity in species richness between SCAR and the
88

reference reefs decreased for algae and increased for invertebrates between July 2000 and July 2001.
• Species composition of algae and invertebrates differed markedly between SCAR
and the reference reefs in July 2001. Similar species were abundant or dominant on SCAR in July 2000 and July 2001, suggesting persistent effects of early colonization.
• There was little difference between rock and concrete with respect to species
abundance, species number, and species composition of algae and invertebrates in July 2001.
• The total coverage of reef biota (algae and invertebrates) is was between 80% -
90% on both July 2000 and July 2001 surveys, regardless of the amount or type (e.g. concrete, quarry rock, or natural rock) of hard substrate. This indicates that total biological coverage increases with the amount of hard substrate.
89

Figure 1. Abundance of kelp forest algae sampled as counts on the six reef designs on SCAR (two substrate types and three substrate coverages) and on the average of the two reference reefs (Barn and San Mateo kelp beds) immediately after reef construction (October, 1999) and in July 2000 and July 2001.
17% 67%34% Reference17% 67%34% Reference
Year
Abu
ndan
ce (n
umbe
r m-2
)
99 00 01 02 03 040
5
10
15
20
99 00 01 02 03 040
5
10
15
20
Rock Concrete
90

Figure 2. Species composition (relative abundance) of kelp forest algae sampled as counts on the six reef designs on SCAR (two substrate types and three substrate coverages) and on the average of the two reference reefs (Barn and San Mateo kelp beds) in July 2001.
ConcreteRock Reference
Laminaria
Desmarestia
Egregia
Pterygophora
Cystoseira
Eisenia
0.0 0.5 1.00.0 0.5 1.0 0.0 0.5 1.0
91

Figure 3. Abundance of kelp forest algae sampled as percent cover on the six reef designs on SCAR (two substrate types and three substrate coverages) and on the average of the two reference reefs (Barn and San Mateo kelp beds) immediately after reef construction (October, 1999) and in July 2000 and July 2001.
17% 67%34% Reference17% 67%34% Reference
Concrete
99 00 01 02 03 040
20
40
60
80Rock
99 00 01 02 03 040
20
40
60
80
Perc
ent C
over
Year
92

Figure 4. Species composition (relative abundance) of kelp forest algae sampled as percent cover on the six reef designs on SCAR (two substrate types and three substrate coverages) and on the average of the two reference reefs (Barn and San Mateo kelp beds) in July 2001.
0.0 0.2 0.40.0 0.2 0.4 0.0 0.2
ConcreteRock Referenc
Polysiph. Reds
Juv. Fleshy Reds
Nienburgia
Ovate Fleshy Reds
Rhodymenia
Chondracanthus
Filamentous Browns
Callophyllis
Sarcodiotheca
Acrosorium
Crustose corallines
Osmundea
0.4
Relative Abundance
e
93

Figure 5. Species richness of kelp forest algae on the six reef designs on SCAR (two substrate types and three substrate coverages) and on the average of the two reference reefs (Barn and San Mateo kelp beds) immediately after reef construction (October, 1999) and in July 2000 and July 2001.
Num
ber o
f Spe
cies
17% 67%34% Reference
Concrete
99 00 01 02 03 040
10
20
30
40
50
60Rock
99 00 01 02 03 040
10
20
30
40
50
60
Year
94
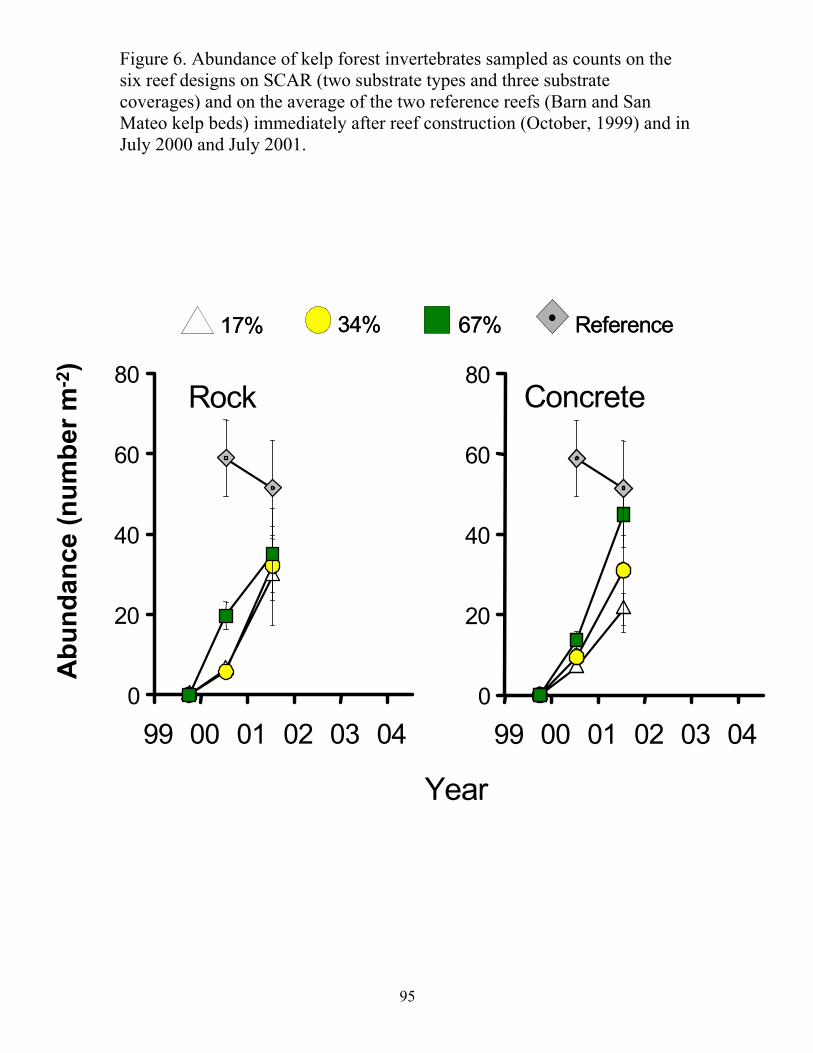
Figure 6. Abundance of kelp forest invertebrates sampled as counts on the six reef designs on SCAR (two substrate types and three substrate coverages) and on the average of the two reference reefs (Barn and San Mateo kelp beds) immediately after reef construction (October, 1999) and in July 2000 and July 2001.
17% 67%34% Reference17% 67%34% Reference
Rock Concrete
Abu
ndan
ce (n
umbe
r m-2
)
99 00 01 02 03 040
20
40
60
80
99 00 01 02 03 040
20
40
60
80
Year
95

Figure 7. Species composition (relative abundance) of kelp forest invertebrates sampled as counts on the six reef designs on SCAR (two substrate types and three substrate coverages) and on the average of the two reference reefs (Barn and San Mateo kelp beds) in July 2001.
ChelyosomaPedicellina
LeucillaBugula c.
DidemnumHydroidsBugula n.
Enc. SpongesAglaophenia
Balanus p.PhragmatopomaThalamoporellaEnc. Bryozoans
Cellaria
ConcreteRock Referenc
0.0 0.2 0.40.0 0.2 0.4 0.0 0.2 0.4
Relative Abundance
e
96

Figure 8. Abundance of kelp forest invertebrates sampled as percent cover on the six reef designs on SCAR (two substrate types and three substrate coverages) and on the average of the two reference reefs (Barn and San Mateo kelp beds) immediately after reef construction (October, 1999) and in July 2000 and July 2001.
99 00 01 02 03 040
20
40
60
80
99 00 01 02 03 040
20
40
60
80
Year
Per
cent
Cov
er
17% 67%34% Reference17% 67%34% Reference
Rock Concrete
97
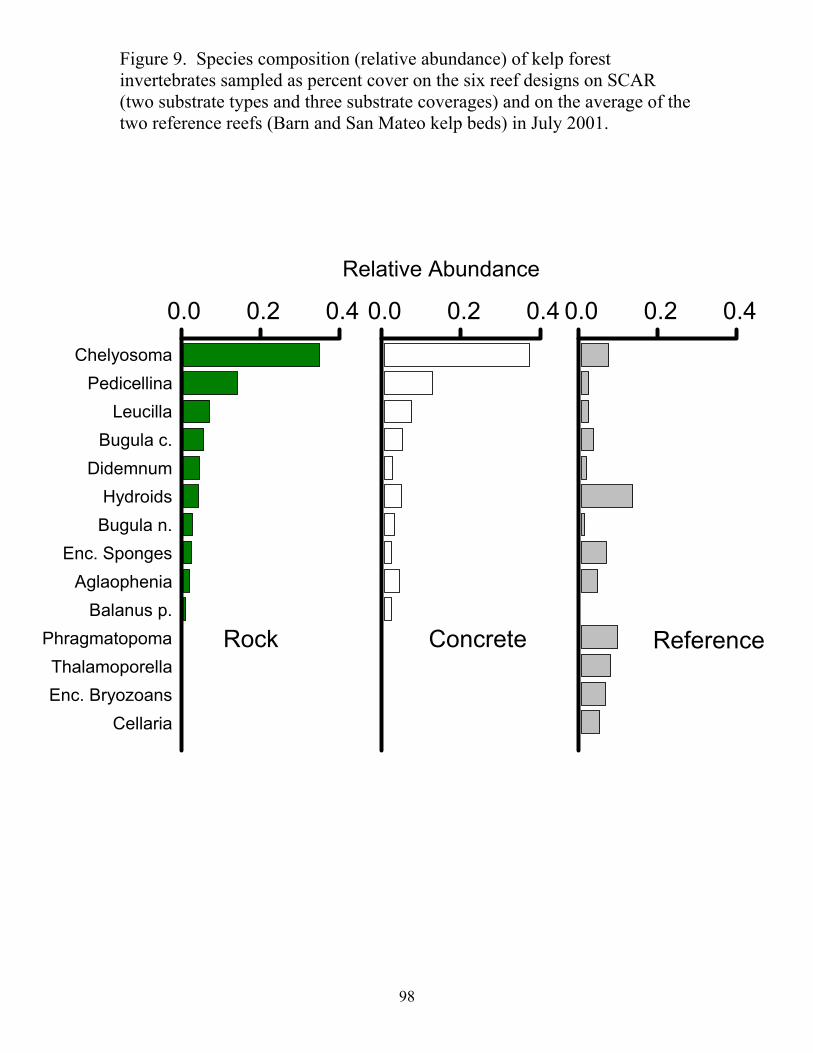
Figure 9. Species composition (relative abundance) of kelp forest invertebrates sampled as percent cover on the six reef designs on SCAR (two substrate types and three substrate coverages) and on the average of the two reference reefs (Barn and San Mateo kelp beds) in July 2001.
0.0 0.2 0.40.0 0.2 0.4 0.0 0.2 0.4
Relative Abundance
ChelyosomaPedicellina
LeucillaBugula c.
DidemnumHydroids
Bugula n.Enc. Sponges
AglaopheniaBalanus p.
PhragmatopomaThalamoporellaEnc. Bryozoans
Cellaria
ConcreteRock Reference
98
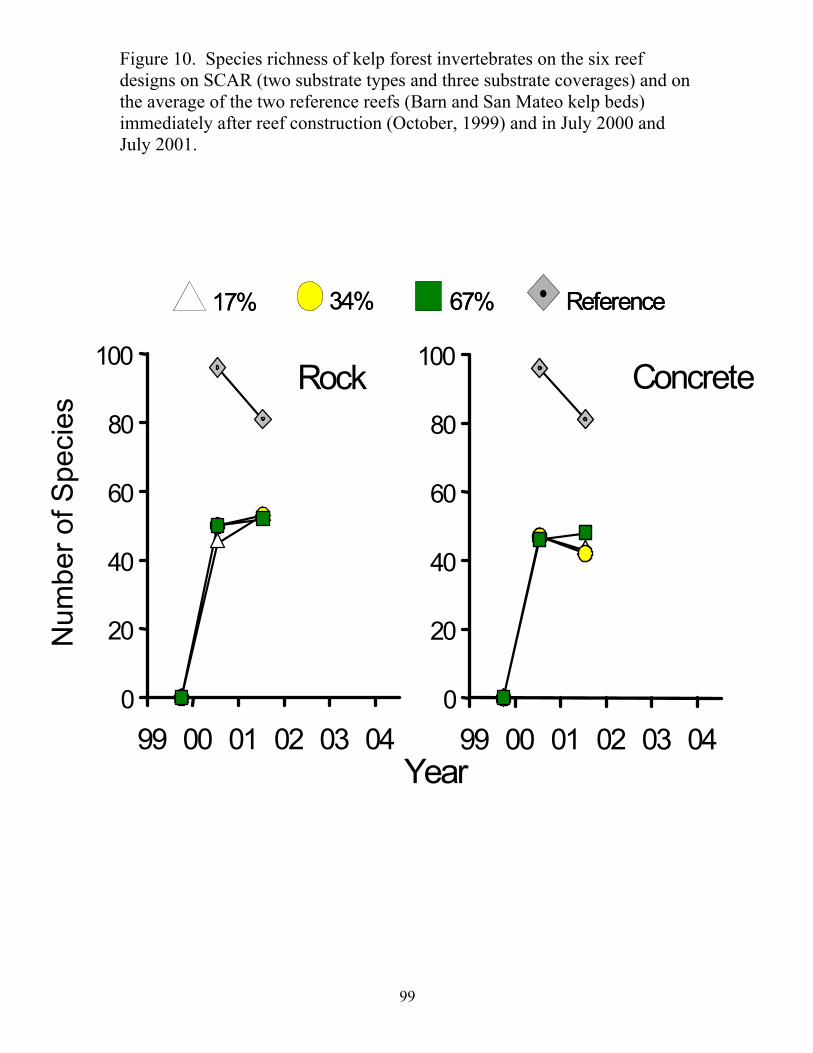
Figure 10. Species richness of kelp forest invertebrates on the six reef designs on SCAR (two substrate types and three substrate coverages) and on the average of the two reference reefs (Barn and San Mateo kelp beds) immediately after reef construction (October, 1999) and in July 2000 and July 2001.
99 00 01 02 03 040
20
40
60
80
100
99 00 01 02 03 040
20
40
60
80
100
Year
Num
ber o
f Spe
cies
17% 67%34% Reference17% 67%34% Reference
Rock Concrete
99

Figure 11. Percent cover of bare space on the six reef designs on SCAR (two substrate types and three substrate coverages) and on the average of the two reference reefs (Barn and San Mateo kelp beds) immediately after reef construction (October, 1999) and in July 2000 and July 2001.
99 00 01 02 03 04 0
20
40
60
80
100
99 00 01 02 03 04 0
20
40
60
80
100
Year
Per
cent
Cov
er
Rock Concrete
17% 67%34% Reference
100

Public Comment MR. HELVY: Mark Helvy, National Marine Fisheries. Steve, any sign of abalone recruitment? MR. SCHROETER: No. Yes. UNIDENTIFIED SPEAKER: How about lobster. MR. SCHROETER: We have lobster out there. Dave, lobsters. MR. HUANG: They are actually fairly abundant, is that what you wanted to know? MR. SCHROETER: He just wanted to know what the abundance was. MR. HUANG: I'm sorry, I was trying to do this at the same time. What was your question? UNIDENTIFIED SPEAKER: I just wondered if they were recruited, and if they were fairly abundant? MR. HUANG: Well, the answer to that is, yes. I don't know about recruits, but we do have lots of larger lobsters. I don't know whether they were from, you know, the nearby reef, or where they exactly came from, but they are fairly abundant. UNIDENTIFIED SPEAKER: Are people putting traps out yet? MR. HUANG: Yes, there are usually, like on average one trap per module. You know, one fit per square, I guess. MR. RAIMONDI: Pete Raimondi. A lot of the relationships you showed up there were sort of asymptotic for the last two years, like species richness on the artificial reefs, and I was wondering whether that was because you had the same species, between 2001 - 2002? or, whether it was the same number, but the species were switching all over the place? Sort of indicating what the trajectory might be for the next three years.
101

MR. SCHROETER: Right, you know, I think I can certainly speak to that for the algae and the invertebrate percent cover, and I think they are the same. They tend to be the same species of stuff that, you know, came in, and they are persisting. And, so you are right. It sort of does have some asymptote and if that is the case, if it is eventually going to kind of get up to the reference reef, that suggests it may take a long time, yes. Other questions? MR. SCHREICHENBERGER: My question is similar about the artificial reef. This morning, my question about San Dieguito things, what is the cost? and the benefits? But, it is unfortunate to answer Mr. Helvy from the National Marine Fisheries, he said he does not care about the cost, if I understood what well, sir. You are going to answer me. But, if I understood very well, your answer to my question is that you don't care about the cost. You just care about the benefits, and the benefits you mentioned this morning, that the community is pleased with that. So, I don't know if this is an official answer from the National Marine Fisheries, but Mr. Helvy -- and this should be of interest to everybody -- I would like to know the official position of National Marine Fisheries about the use, and the good, of an analysis of cost and benefits on every environmental program? If you cannot submit to me, well, about the cost do you have something? MR. HELVY: Well, I would actually like to defer the cost to either David Kay, or Mike Hertel, from Southern California Edison. MR. KAY: Forty million. MR. HELVY: Forty million, okay. MR. KAY: To the end. MR. HELVY: Okay. MR. STREICHENBERGER: Forty million to the end for all of the program for the artificial reef? MR. HELVY: Yes. MR. STREICHENBERGER: Thank you for the information about benefits. MR. HELVY: Yes, for the next 30 years.
102

MR. STREICHENBERGER: For the next -- for the next years from now? MR. HELVY: No, I -- MR. STREICHENBERGER: I would like -- MR. HELVY: I assume this is the cost of the reef mitigation over the operating life of SONGS, correct, and beyond that, it is still going to be out there forever, pretty much. MR. STREICHENBERGER: Well, okay. MR. HELVY: So, it is going to be -- MR. STREICHENBERGER: My question -- MR. HELVY: -- 150 acres in -- MR. STREICHENBERGER: -- I take this information now -- MR. HELVY: -- perpetuity. MR. STREICHENBERGER: -- and of course I am interested in that, so I am going to work on this. Thank you, Mr. Helvy. MR. HELVY: Thank you. I probably should have our economist talk to you. I think that would be more appropriate. I don't even know if this is the right forum for the National Marine Fisheries to address this question. But I can just add that when you talk about costs, you need to look at all of the particulars. There is fisheries. There is benefit to fisheries. There are aesthetic values, and all of these things, I don't have the expertise to add up, but when you look at the bigger picture, you are looking at just dollar value. I think, as a resource agency, we are looking at much larger than that -- benefits to the population, and benefits to the ecosystem. MR. STREICHENBERGER: I would be very pleased to have this information, especially from the National Marine Fisheries. I want to thank you for the amount. MR. DEAN: Tom Dean, and I had a couple of questions. It looked like there was a very strong founder of fact on the reef, as you indicated, sort of what got in there early on, is what persisted.
103
And, it brought to mind some of the earlier stuff that Rick Osmond did back in the early days of the MRC, and I wondered if, first of all, you had gone back and looked at any of the things that Rick had done, in those days, to see if there were any similarities to the kinds of patterns you are seeing, in terms of the invertebrate communities, especially. MR. SCHROETER: No, we haven't, but that is a good idea, yes. MR. DEAN: And, my second question was it looks as if that -- there is this very strong founder effect with respect to algae, and especially Laminaria. My impression, from looking at these data was that there is much more Laminaria around now, even on the natural reefs, than there was 10 - 15 years ago, and that is a very interesting trend, in itself, I think, but it also may be that what you are seeing, in the differences in the large algae especially, is that Pterygophora and things like that, that are more abundant on the natural reefs are sort of plants that have been there for a long period of time, and what we are seeing now is a slow replacement of those with Laminaria on the natural reefs. And, on the artificial reefs there weren't any Pterygophora there to begin with, so all of the new recruits appear to be Laminaria I mean, it is pretty interesting pattern. It would be interesting to go back and look at some of your data, and other people's data, from the historical perspective to see what that increase in Laminaria has been over time. MR. SCHROETER: Yes, yes. Actually, you know, I didn't show -- in last year's data, we kind of emphasized this -- and there was a, you know, from Dan's talk there was a very clear spatial pattern so you got a lot more Macrocystis on the blocks from 1 to 5, and then from 6 and 7 there were a lot more Laminaria. I mean, there is sort of inverse relationship, you didn't get very much Laminaria near -- and it may have been, like a timing thing, probably, I would think, and maybe that is the case also with Pterygophora. You know, I don't know, I know that Macrocystis just -- the reef was built at just the right time for Macrocystis because it was right before it was releasing spores. Others?[ No Response ]
104

KELP-BED FISHES
Todd W. Anderson Department of Biology
San Diego State University [email protected]
Mitigation Requirement The performance standard for kelp-bed fishes on San Clemente Artificial Reef (SCAR) is that adult and young-of-year fish assemblages are similar in species richness and density to reference reefs within the region (Criterion 3). In addition, both fish production and fish reproductive rates at SCAR shall be similar to natural reefs in the region. Methods A protocol for surveying fishes at SCAR and the reference reefs has been adopted to ensure kelp-bed fishes will be sampled sufficiently. Two surveys are completed from late summer and fall of each year. For a given survey, a block of modules (n = 8) is surveyed on a given day, along with the reference reefs; seven days of surveys are required to complete a survey. Fishes are recorded along transects at three depth strata: the surface / kelp canopy region (2 m depth below the water surface), the midwater region (approximately 7 m depth between the surface and bottom), and the bottom substratum (14-15 m). At SCAR, two transects, beginning at the 15 m and 25 m marks along the north side of a module, are completed in each stratum, with transect dimensions of 2 m wide x 2 m high x 40 m long for a total volume of 160 m3. To avoid disturbance of fishes by air bubbles expelled from divers, the surface stratum is sampled first, followed sequentially by the midwater and bottom strata. Cryptic fishes such as the blackeye goby and the California scorpionfish are then recorded along an additional two bottom transects by searching and swimming more slowly as divers return along the 15 m and 25 m lead lines to the north side of the module. At the reference reefs, two transects at each of the three depth strata are completed in the same manner. For each fish recorded along transects, observers estimate its size to the nearest centimeter (total length). For numerous individuals of aggregating species such as the blacksmith, the number and size of groups of individuals are recorded. Results Several fishes occurred along transects at the reef modules. Surface and midwater fishes included, among others, the kelp bass, Paralabrax clathratus, the blacksmith, Chromis punctipinnis, the senorita, Oxyjulis californica, and the kelp perch, Brachyistius frenatus. Common fishes on the bottom include the garibaldi, Hypsypops rubicundus, the sand bass, Paralbrax nebulifer, the blackeye goby, Coryphopterus nicholsii, and the California scorpionfish, Scorpaena guttata. Resident Fish
105
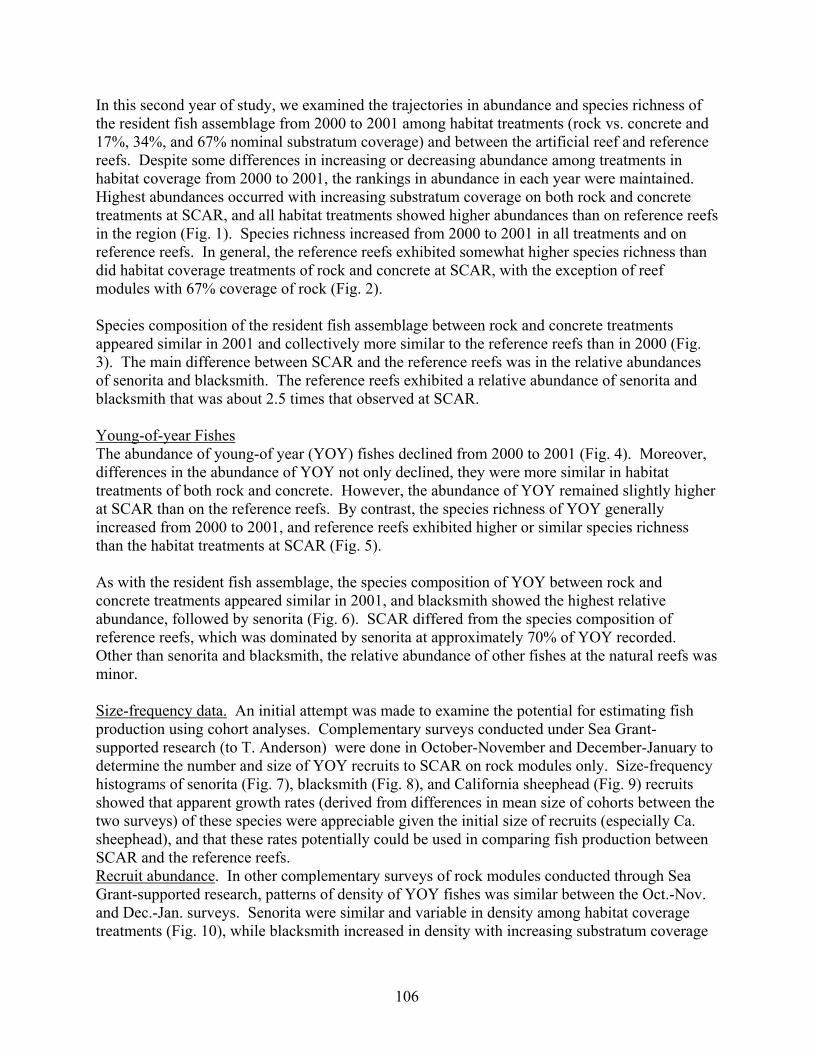
In this second year of study, we examined the trajectories in abundance and species richness of the resident fish assemblage from 2000 to 2001 among habitat treatments (rock vs. concrete and 17%, 34%, and 67% nominal substratum coverage) and between the artificial reef and reference reefs. Despite some differences in increasing or decreasing abundance among treatments in habitat coverage from 2000 to 2001, the rankings in abundance in each year were maintained. Highest abundances occurred with increasing substratum coverage on both rock and concrete treatments at SCAR, and all habitat treatments showed higher abundances than on reference reefs in the region (Fig. 1). Species richness increased from 2000 to 2001 in all treatments and on reference reefs. In general, the reference reefs exhibited somewhat higher species richness than did habitat coverage treatments of rock and concrete at SCAR, with the exception of reef modules with 67% coverage of rock (Fig. 2). Species composition of the resident fish assemblage between rock and concrete treatments appeared similar in 2001 and collectively more similar to the reference reefs than in 2000 (Fig. 3). The main difference between SCAR and the reference reefs was in the relative abundances of senorita and blacksmith. The reference reefs exhibited a relative abundance of senorita and blacksmith that was about 2.5 times that observed at SCAR. Young-of-year Fishes The abundance of young-of year (YOY) fishes declined from 2000 to 2001 (Fig. 4). Moreover, differences in the abundance of YOY not only declined, they were more similar in habitat treatments of both rock and concrete. However, the abundance of YOY remained slightly higher at SCAR than on the reference reefs. By contrast, the species richness of YOY generally increased from 2000 to 2001, and reference reefs exhibited higher or similar species richness than the habitat treatments at SCAR (Fig. 5). As with the resident fish assemblage, the species composition of YOY between rock and concrete treatments appeared similar in 2001, and blacksmith showed the highest relative abundance, followed by senorita (Fig. 6). SCAR differed from the species composition of reference reefs, which was dominated by senorita at approximately 70% of YOY recorded. Other than senorita and blacksmith, the relative abundance of other fishes at the natural reefs was minor. Size-frequency data. An initial attempt was made to examine the potential for estimating fish production using cohort analyses. Complementary surveys conducted under Sea Grant-supported research (to T. Anderson) were done in October-November and December-January to determine the number and size of YOY recruits to SCAR on rock modules only. Size-frequency histograms of senorita (Fig. 7), blacksmith (Fig. 8), and California sheephead (Fig. 9) recruits showed that apparent growth rates (derived from differences in mean size of cohorts between the two surveys) of these species were appreciable given the initial size of recruits (especially Ca. sheephead), and that these rates potentially could be used in comparing fish production between SCAR and the reference reefs. Recruit abundance. In other complementary surveys of rock modules conducted through Sea Grant-supported research, patterns of density of YOY fishes was similar between the Oct.-Nov. and Dec.-Jan. surveys. Senorita were similar and variable in density among habitat coverage treatments (Fig. 10), while blacksmith increased in density with increasing substratum coverage
106

(Fig. 11). Black surfperch also showed highest densities on 67% coverage of rock substratum (Fig. 12), but Ca. Sheephead (Fig. 13) exhibited highest densities on 34% rock substratum. Summary
• The abundance of resident fishes appeared higher at SCAR than at the reference reefs in the region, although the reference reefs showed somewhat higher species richness.
• The species composition of the resident fish assemblage at SCAR was similar in ranking
to the reference reefs, but there were differences in the relative abundance of the two numerically dominant species, the senorita and blacksmith.
• The abundance of young-of-year fishes was lower in 2001 than in 2000, but nominally
higher than on the reference reefs. The reference reefs showed somewhat higher species richness.
• The species composition of young-of-year fishes at SCAR and the reference reefs differed mainly in the relative abundance of blacksmith and senorita, with very low abundances of other species at the reference reefs.
• Prospects for comparing fish production among reef designs by cohort analysis (size-
frequency data) might be promising for some species.
• Differences in recruitment of fishes to SCAR showed species-dependent patterns.
107

Figure 1. Abundance (fish / 100 m3) of resident fish at San Clemente Artificial Reef and at reference reefs in the region. Symbols denote nominal percentage cover of rock and recycled concrete on reef modules.
0
50
100
150
200
250
300
Abu
ndan
ce (f
ish/
100m
3 )
Year
17% 67%34% Reference
Rock Concrete
99 00 01 02 03 0499 00 01 02 03 04 99 00 01 02 03 0499 00 01 02 03 04
108

Figure 2. Species richness of resident fish at San Clemente Artificial Reef and at reference reefs in the region. Symbols denote nominal percentage cover of rock and recycled concrete on reef modules.
0
5
10
15
20
25
30
Num
ber o
f Spe
cies
Year
17% 67%34% Reference
Rock Concrete
99 00 01 02 03 0499 00 01 02 03 04 99 00 01 02 03 0499 00 01 02 03 04
109

Figure 3. Species composition of resident fish for rock and recycled concrete modules at San Clemente Artificial Reef and at reference reefs in the region.
0.0 0.3 0.60.0 0.3 0.6 0.0 0.3 0.6
Rock Concrete
Relative Abundance
SenoritaBlacksmith
Blackeye GobyKelp Bass
SalemaWhite SurfperchBlack Surfperch
HalfmoonSheephead
Barred Sand BassSargo
Rock WrasseRainbow Perch
Opaleye
Reference
110
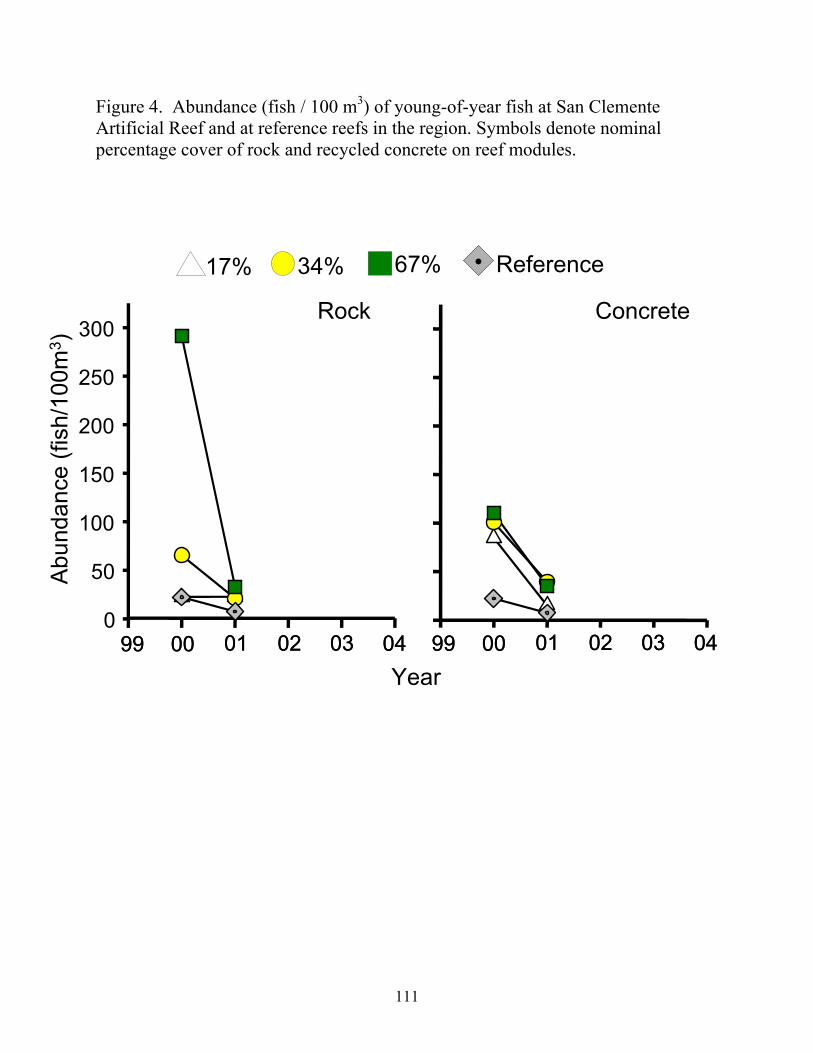
Figure 4. Abundance (fish / 100 m3) of young-of-year fish at San Clemente Artificial Reef and at reference reefs in the region. Symbols denote nominal percentage cover of rock and recycled concrete on reef modules.
0
50
100
150
200
250
300
Abu
ndan
ce (f
ish/
100m
3 )
Year
17% 67%34% Reference
Rock Concrete
99 00 01 02 03 0499 00 01 02 03 04 99 00 01 02 03 0499 00 01 02 03 04
111

Figure 5. Species richness of young-of-year fish at San Clemente Artificial Reef and at reference reefs in the region. Symbols denote nominal percentage cover of rock and recycled concrete on reef modules.
3
4
5
6
7
8
9
Num
ber o
f Spe
cies
Year
17% 67%34% Reference
Rock Concrete
99 00 01 02 03 0499 00 01 02 03 04 99 00 01 02 03 0499 00 01 02 03 04
112

Figure 6. Species composition of young-of-year fish for rock and recycled concrete modules at San Clemente Artificial Reef and at reference reefs in the region.
0.0 0.4 0.8 0.0 0.40.0 0.4 0.8
Senorita
Blacksmith
White Surfperch
Pile Surfperch
Black Surfperch
Rainbow Surfperch
Kelp Bass
Ca. Sheephead
Blackeye Goby
Rock Concrete
Relative Abundance
Reference
0.8
Rock Wrasse
113

Figure 7. Size-frequency distributions of young-of year senorita on rock modules in Oct-Nov and Dec-Jan surveys at San Clemente Artificial Reef. X-bar denotes mean size of fish for each percentage cover of rock substrata in each survey.
114

Figure 8. Size-frequency distributions of young-of year blacksmith on rock modules in Oct-Nov and Dec-Jan surveys at San Clemente Artificial Reef. X-bar denotes mean size of fish for each percentage cover of rock substrata in each survey.
115

Figure 9. Size-frequency distributions of young-of year California sheephead on rock modules in Oct-Nov and Dec-Jan surveys at San Clemente Artificial Reef. X-bar denotes mean size of fish for each percentage cover of rock substrata in each survey.
116

Figure 10. Abundance (fish/100 m3) of young-of-year senorita on rock modules in Oct-Nov and Dec-Jan surveys at San Clemente Artificial Reef. Percentages denote the nominal percentage cover of rock substrata.
Abu
ndan
ce (f
ish/
100m
3 )
Treatment Treatment
17% 34% 67%0
5
10
15
20 Oct-Nov
17% 34% 67%0
5
10
15
20 Dec-Jan
117

Figure 11. Abundance (fish/100 m3) of young-of-year blacksmith on rock modules in Oct-Nov and Dec-Jan surveys at San Clemente Artificial Reef. Percentages denote the nominal percentage cover of rock substrata.
17% 34% 67%0
5
10
15
20
25
Plot 1
17% 34% 67%0
5
10
15
20
25Oct-Nov Dec-Jan
Abu
ndan
ce (f
ish/
100m
Treatment Treatment
3 )
118

Figure 12. Abundance (fish/100 m3) of young-of-year black surfperch on rock modules in Oct-Nov and Dec-Jan surveys at San Clemente Artificial Reef. Percentages denote the nominal percentage cover of rock substrata.
Oct-Nov Dec-Jan
Abu
ndan
ce (f
ish/
100m
3 )
Treatment Treatment
17% 34% 67%0
1
2 Oct-Nov
Plot 1
17% 34% 67%0
1
2 Dec-Jan
119
Figure 13. Abundance (fish/100 m3) of young-of-year California sheephead on rock modules in Oct-Nov and Dec-Jan surveys at San Clemente Artificial Reef. Percentages denote the nominal percentage cover of rock substrata.
Oct-Nov Dec-Jan
Abu
ndan
ce (f
ish/
100m
3 )
Treatment Treatment
17% 34% 67%0.0
0.5
1.0 Oct-Nov
Plot 1
17% 34% 67%0.0
0.5
1.0 Dec-Jan
120
Public Comment MR. ANDERSON: Pete. MR. RAIMONDI: Was there a distance affect? MR. ANDERSON: Between numbers of recruits away from San Mateo, or? MR. RAIMONDI: Yes, the only reason I bring that up is because there was such a strong kelp affect, and I wondered whether there was an linkage between the density of kelp and recruitment? MR. ANDERSON: We can sort of do that even as a regression analysis, but because senorita, which is numerically dominant and has a very close association with kelp, because they don't really show much in the way of coverage differences, I haven't actually looked at the block differences, but if I recall I don't think there was a consistent pattern, but I can certainly look at that. It is good point. Tom. MR. DEAN: Yes, Tom Dean. I wonder about using blacksmith as an indicator of production since they are primarily planktivorous, and may not really reflect local conditions of production relative to something like gobies or sheephead, or something. MR. ANDERSON: Yes, that is a really good point. We thought of that, in our cast of characters to try to do some of this has been limited, mainly because things like black-eyed gobi, which we thought would be an excellent candidate, turns out that because they spawn and recruit -- they are not as discreet in their recruitment. You can't really tease out a cohort very well. So, that is probably the best species that would be used, if we could, but it just won't be very good for cohort analysis. On the other hand, some of these other methods of fish production, which Steve is going to talk about in the work plan, like direct tagging, and growth measurements, maybe RNA:DNA ratios, other sorts of issues that Shauna Sharfey is going to be exploring as a graduate student -- which Pete, I don't think, likes, but anyway in terms of the RNA:DNA ratios is what I mean -- I am sure he would like you if he met you, Shauna. But, in any case, some of these other measures, part of the idea is to see how these different methods of production, how much correspondence there would be between them. But, you are right, you might not expect blacksmith to be a good model, in terms of its atrophic habits. John. MR. DIXON: With regards to that, my recollection is that the blacksmith were proportionally less represented on the natural reef than the artificial reef.
121

MR. ANDERSON: Yes. MR. DIXON: And, might that be an edge effect? MR. ANDERSON: No, I think it is more of a function -- I mean, I am speculating here, but I think it is more of a function of the fact that, because there is so much kelp at the natural reef, at senorita, proportionally more abundant there, and the fact that the natural reefs, I think in Dan's data, may bear this out, that they have more crevices and things for blacksmith to hole up in at night. So, I doubt it is more of an edge effect, as it is a function of just what I mentioned, yes. Anything else.[ No Response ] Thank you.
122
BEACH MONITORING NOVEMBER 2000 THROUGH OCTOBER 2001
Robert Grove
Environmental Affairs Southern California Edison Company
[email protected] Beach Monitoring Program: Objective and Purpose This is the second year of a six-year study of beach conditions at San Clemente. The object of this study is to routinely document kelp wrack and artificial reef building material, quarry rock and broken concrete, on the San Clemente beach that fronts the San Clemente Experimental Artificial Reef. The purpose of monitoring the San Clemente beach is to fulfill:
1. Condition 9 of the Coastal Development Permit, Number E-97-10, issued by the California Coastal Commission on July 26, 1999; and,
2. Conditions for beach monitoring as specified in Volume II, Appendix H, Section 3 - Geology, and Section 10 - Public Services and Utilities, in the Final Program Environmental Report for the Construction and Management of an Artificial Reef in the Pacific Ocean Near San Clemente, California , dated May 1999, (EIR).
A major goal of this effort, according to the EIR, is to collect data on the amount of kelp washing onto the beaches currently and establishing a baseline because the City of San Clemente and the California Department of Parks and Recreation do not collect this information. Methods Monitoring Obligations and Schedule The field effort consists of routine beach surveys on a twice-a-month basis from November through March and monthly from April through October. Edison monitors the “beach adjacent to the project site, from 1 km up coast to 1 km down coast from the project boundaries” (Coastal Development Permit, Condition 9). This area extends from 1 km north of the San Clemente pier and south for approximately 3.2 miles, to the mouth of San Mateo creek at the “Trestles” wooden railroad bridge. Monitoring includes:
“1) quantitative estimates of the amount of kelp (percent of beach covered and volume) on the beach [five five-hundred-foot stations are surveyed quantitatively];
2) a count of rocks and concrete pieces present, in the unlikely event of artificial reef material washing ashore [five five-hundred-foot stations are surveyed quantitatively], and;
3) documentation of beach clean-up activities by state or municipal agencies” (Coastal Development Permit, Condition 9).
This project is also responsible to remove any rocks or concrete washed ashore from the experimental reef (Coastal Development Permit, Condition 9; EIR, Vol. II, Appendix H, page 3). Monitoring began in October 1999 and is envisioned to continue through October 2005 (“for a period of 6 years or until the beginning of construction of the mitigation reef, whichever is earlier” - Coastal Development Permit, Condition 9).
123

Data Collection and Management Surveys are performed as close to the lower-low-tide as practical on each survey day, and the survey days are scheduled for the more extreme lower-low-tides of each month as practical. Qualitative observations of kelp wrack, hard substrate along the sandy beach, and general beach conditions are recorded for each bi-monthly (winter) and monthly (summer) low tide beach survey. Quantitatively, five permanent transects (Table 1) and standard data collection procedures were established during the November 1999 surveys to record estimates of the amount of kelp, in cubic feet, the percent of beach covered by kelp, and the count of concrete and rocks present. For this quantitative analysis of kelp wrack in the study area, five 500-foot stations were established in accordance with past kelp wrack assessment in the area (ZoBell, 1959). The amount of seaweed, in cubic feet, on the 500-foot length of beach was estimated so that the results could be comparable over time and with historical results. All information is recorded on standard data sheets. The five transects are each 500 feet long, parallel to the water’s edge, and are located (from south to north) at: 1. San Mateo Point: The south end of this transect is directly below a red and white navigation
marker (circular sign on post) positioned on the bluff above the beach. 2. State Beach: The San Clemente State Beach (off of Avenida Calafia). The north end of this
transect is out on the beach directly in front of the railroad track underpass at the State Beach camping grounds trail.
3. Calafia: The Calafia Park State Beach (this parking lot is operated by the City of San Clemente, but it is a State Beach), at the end of Avenida Calafia: The south end of the transect is directly out from the beach access point along the railroad track rip-rap.
4. San Clemente Pier: The City of San Clemente Municipal Pier: The south end of the transect is adjacent to a set of permanent picnic tables up on the beach, 250 feet south of the pier.
5. Buena Vista: El Portal Street beach access point along Avenue Buena Vista, 1 km north of the Municipal Pier: The north end of the transect is directly out on the beach from the small bridge that supports the railroad tracks and is a beach access point from a long, steep stairway down from Avenue Buena Vista near the cross street of El Portal.
Photographs of the beach are also taken during each survey. Photographs are taken at low tide looking up and/or down the beach. Any perceived unusual disturbances of the beach, materials on the beach, or algal wrack are also photographed and location noted during each 3.7-mile beach survey. Photographs of beach and kelp wrack conditions for each survey at San Clemente are on file at Edison and representative photographs are in the annual report (SCE, 2001; and SCE, 2002). Documentation of Beach Clean-Up Activities by State or Municipal Agencies Any beach clean-up activity that could be construed to be connected with or involving material or kelp from the San Clemente Experimental Artificial Reef is recorded and reported as part of this project. Typically, the State Beach is not cleaned, but the City Beach is routinely cleaned. The City does not keep historical or detailed records of their beach cleaning activities (Resource Insights, 1999).
124

Results Quantitative Beach Surveys – Results from November 2000 – October 2001 Surveys Table 2 summarizes the beach seaweed wrack measured at the five quantitative beach survey stations, November 2000 through October 2001. The Pier area experienced the most kelp wrack quantity, on average, during the year; with about 22 cubic feet per survey. For individual surveys, the Pier Station saw significant amounts on April 5, 2001 (77 cubic feet) and on August 8, 2001 - after a storm - (99 cubic feet). The amount of kelp wrack at the Pier station appeared to be influenced by the pier pilings, which snagged the large macrocystis fronds. The kelp wrack under the pier would end up wrapped around the pilings in clumps. The second largest amount of kelp wrack for the November 2000 to October 2001 survey year, on average, appeared at San Mateo Point (17 cubic feet per survey). San Mateo Point also had the most kelp for any single survey period, which occurred on November 28, 2000 (101 cubic feet). San Mateo also experienced large amounts of kelp on the beach during the February 22, 2001 survey (48 cubic feet). This is not unexpected, because of this survey station’s close proximity to the adjacent San Mateo Kelp Bed. By contrast, Calafia Beach, State Beach, and the Buena Vista Beach had smaller amounts of kelp on average for the year: 9, 13, and 10 cubic feet, respectively. These stations would see an occasional set of large clumps of kelp wrack during some of the surveys, up to 44 cubic feet at Calafia Beach on April 5, 2001, for example; and 33 cubic feet of kelp wrack on the Buena Vista Beach also on April 5, 2001. But, it was not uncommon that these three 500-foot survey areas had little or no kelp on them during other times of the year. The adult Macrocystis plants that appeared as wrack on the beach during the survey year were carefully observed for any scientific survey tags that would have indicated they came from the San Clemente Experimental Artificial Reef. The California Coastal Commission marine scientists conducting the monitoring of the Artificial Reef have tagged many of the adult kelp plants on the Reef as they have been established during 2000-2001. No kelp wrack with scientific tags still attached was observed during the beach surveys over this past year. Individual kelp wrack plants were also studied to see if the plant’s haptera, or holdfasts, indicated where the plants may have originated. Many holdfasts showed evidence of bleaching and/or continued growth (the strands of the hold fasts would not be flat or uniformly curved on their underside as though they had just ripped off of a rock or the bottom, but rather straggly and wildly curly) indicating they had been uprooted for a period of time and floating about on the ocean surface as a kelp patty. Chances are great that these plants did not come from the nearby San Clemente Artificial Reef, but from further away. Other kelp wrack holdfasts still incorporated the rock that they were anchored or attached to. Many of these rocks were of the mud-stone variety: soft stone, gray or black in color, and some with boring clam holes in them. This soft mud stone has been observed as ubiquitous at the San Mateo Kelp Bed over the years of studying this bed as part of the San Onofre Nuclear Generating Station marine monitoring program (Dr. Jake Patton, personal communication), and these type of rocks are also somewhat common in the surf zone as seen during this survey program. Other rocks still attached to the kelp wrack haptera were small to soft-ball sized smooth cobble. No attached rocks appeared to be sharp-edged quarry rock or broken concrete.
125

Kelp Wrack and Percent Cover of the Beach The percentage of the San Clemente beach typically covered by the seaweed wrack observed from November 2000 through October 2001 is less than 1%. The widths of the beaches at San Clemente are relatively wide at low tide, mostly between 100 – 200 feet. Observations of Quarry Rock and Concrete on the Beach No quarry rock or broken concrete that could have been from the San Clemente Experimental Artificial Reef was observed on the beach during this November 2000 to October 2001 survey period. At times, some chunks of granite (the Catalina Island quarry rock used in the Reef is not granite) were observed on the beach near the base of the back-beach shore-protection granite rip-rap (at the base of the railroad tracks). Further, patches of natural emergent rocks along the sandy beach were visible at the low tide surveys near the Buena Vista/El Portal survey station north of the Pier (many large clusters and many individual rocks), directly south of the Peir (a ridge of flat rocks perpendicular to the beach, and seen only during low sand – eroded - conditions), and between the State Beach and Calafia Beach survey stations. Beach Clean-Up Activities by State or Municipal Agencies Any beach clean-up activity that could be construed to be connected with or involving material or kelp from the San Clemente Experimental Artificial Reef is recorded and reported as part of this project. Typically, the State Beach is not cleaned, but the City Beach is routinely cleaned. No such project-related clean up was noted in 2000 or 2001. Bill Humphreys, Marine Safety Lieutenant, City of San Clemente (949) 361-8219 was contacted and asked about any unusual kelp wrack or possible rock clean-up activities for the year 2001. He noted none. Mike Morgan, Parks and Recreation Department, City of San Clemente (949) 279-5420) was contacted and asked about the City’s beach clean-up activities. He stated: generally the City of San Clemente does not keep kelp-wrack clean-up data. He added that his impression is that the last El Nino period of 1997-1998 had significantly higher levels of kelp wrack drifting onto the City beaches, and since that time, beach kelp wrack and beach clean up activities have been “average”. Further, he reiterated that the City’s beach clean up policy now is to allow any kelp wrack that has appeared on the beach a chance to migrate to the higher (upper, back-beach) areas of the beach for a couple of days before they pick it up and haul it away. Discussion Dr. Claude E. ZoBell of the Scripps Institution of Oceanography performed an eleven-year study of drift kelp washing up on 29 beaches in San Diego County. His is the definitive work on this subject (ZoBell, 1959). He concluded that large amounts of drift seaweed on beaches result from heavy storms, strong winds, and/or high waves. The quantity of seaweed littering a beach is influenced by the supply of seaweeds in offshore waters, water movements, and by beach conditions. Supply is a function primarily of the quantity, kind, and condition of seaweeds growing relatively nearby. With advancing age or maturity, most kinds of seaweeds slough off, thereby contributing to the supply in the surf and on the beach. Throughout ZoBell’s investigations, attempts were made to find correlations between the amounts of seaweeds on the beaches with sand levels, season, surf action, kelp harvesting operations, and other concurrent phenomena or conditions. Positive correlations were apparently found only for high surf action and for high sand levels on the beaches.
126

One of ZoBell’s 500-foot survey stations was on San Clemente Pier, frequented twice per month from mid-1954 through 1956. Table 3 describes the average monthly amount (1954-1956) of drift seaweeds observed in cubic feet for the total 500-foot beach section. Table 4 describes other representative beaches surveyed by ZoBell in the same 1954 to1956 time frame. Where ZoBell found 92 cubic feet of kelp on the San Clemente Pier beach, this 2000-2001 San Clemente survey shows 4 cubic feet of seaweed wrack per 500-feet of beach front at the same San Clemente pier. And, San Clemente appears to be on the low end of the range of seaweed wrack, according to the ZoBell data. Obviously, many local kelp beds have changed in size, most getting smaller since 1954-1956, but ZoBell’s is the only comparative seaweed-wrack data available. These data do show the north San Diego and south Orange County beaches have experience large amounts of kelp wrack, historically. This November 2000 to October 2001 annual report covers the second year of a planned six-year study. Comparisons with the first-year study, October 1999 – October 2001 (SCE, 2001), shows similar results, but there are some differences are already being observed in kelp wrack amounts between the two years, too. Table 5, compares monthly kelp wrack volume at the San Clemente Pier station for each year of this study to the ZoBell data for San Clemente from 1954-1956. Table 6 compares monthly kelp wrack volume averaged over the five kelp wrack study stations for each year to the ZoBell monthly data. This second year of kelp wrack data show that kelp quantities per 500-foot length of beach have increased overall about three times (14 cubic feet in the second year) compared to the first year (5 cubic feet), but are still much less than the amounts of kelp wrack seen in the 1950’s by ZoBell at San Clemente (92 cubic feet). The monthly amounts specifically at the pier are 7.5 times greater in the second year (29 cubic feet) than the relative amount of kelp at the pier in the first year of study (4 cubic feet). Further, in the first year, kelp quantities at the pier (4 cubic feet) were less than the kelp wrack averaged over all 5 stations (5 cubic feet); while in the second year, the pier station kelp (29 cubic feet) was almost twice are prevalent as the average of the second year (14 cubic feet overall average). In the second year of this study, there were two significance developments that could have influenced kelp wrack amounts seen at the San Clemente beach. First, the 56 San Clemente Experimental Artificial Reef modules were supporting dense kelp stands that by early 2001 were visible from aerial surveys. And second, the City of San Clemente was influenced to some degree by a well publicized ecological concern in San Diego County that routine beach clean-up activities of kelp wrack could cause unnecessary ecological harm (San Diego Union-Tribune, July 12, 2001; and Los Angeles Times, July 22, 2001). The City of San Diego stopped their routine daily clean-up activities along their 17 miles of beaches, and the City of San Clemente apparently reduced their clean-up activities, too. Mr. Mike Morgan (personal communication, November 29, 2001) did state that the City is now allowing kelp to age a bit and migrate up higher on the beach before it is routinely picked up
127

Summary The second year, November 2000-October 2001, beach monitoring study found that:
• The monthly amount of kelp wrack ranged from 0 to 101 cubic feet of seaweed material per 500-foot survey area.
• The monthly average for all five 500-foot stations was 14 cubic feet of seaweed; up from 5 cubic feet for the 1999-2000 survey year.
• The average monthly range was 9 to 22 cubic feet of seaweed material, up from the 2 to 6 cubic feet of seaweed at the five stations in 1999-2000.
• The most significant increases in kelp wrack in this second year compared to the first year were seen at the San Clemente Pier. This may have been the result of altered beach clean-up activities to protect the grunion as devised in mid-2001.
• These two years of data from this study compared to the monthly average of 92 cubic feet and a range of 10 to 225 cubic feet of wrack as observed in the only other quantitative seaweed wrack study performed at San Clemente, a two-year study at one 500-foot survey station at the San Clemente Pier, 1954-1956 (ZoBell, 1959).
These second-year beach monitoring kelp wrack observations at San Clemente were not unexpected, because:
• There is still not a substantial amount of natural kelp in the area at San Mateo Point and San Onofre at this time.
• The kelp that is naturally present at San Mateo Point is still relatively young, having mostly established since the severe stormy seasons of the 1997-98 El Nino. ZoBell states that it is the older kelps and kelp weakened from parasite attack, high temperatures, and/or disease that seem to tear away more prevalently and end up on the local beaches.
• The kelp growing on the San Clemente Experimental Artificial Reef is also young, since the reef was not installed until September 1999; and the Artificial Reef kelp, from all indications, appears healthy.
• Both the 1999-2000-winter storm season and the 2000-2001-winter storm season were relatively mild. It is the large, more El Nino-type storms, that typically drive kelp up onto the beaches and create the most wrack from the local beds.
• The kelp plants present on the San Clemente Experimental Artificial Reef have reached the surface, but are not as dense over the surface as to be overly vulnerable to intense storm-wave activity.
The overall conclusions of this second year of study are:
1. No artificial reef substrate material, either quarry rock or broken concrete appears to be washing up on the beaches at San Clemente.
2. Seaweed wrack does not appear to be substantial on the San Clemente beaches. 3. Kelp from the artificial reef modules does not appear to be making a substantial
contribution to the limited amount of seaweed wrack that does routinely appears on the San Clemente area beaches.
Acknowledgements Southern California Edison wishes to thank Dr. Steve Schroeter of the Californian Coastal Commission for assisting in some of the beach surveys and for his helpful advice during the field
128

efforts. We also wish to thank, posthumously, Mr. Karel Zabloudil of EcoSystems Management for his enthusiastic involvement in documenting the location of the survey positions on the beach for this study with accurate GPS positioning and for his assistance in performing some of this project’s early surveys until his untimely passing in July 2000. Mr. Tim Norrell of EcoSystems Management is also acknowledged for his assistance in verifying survey positioning and developing the mapping for this study. Finally, we thank Dr. Larry Deysher for his assistance in setting up the field study. References California Coastal Commission (CCC), 1999. Coastal Development Permit, Number E-97-10,
issued by the CCC, July 26, 1999. California Coastal Commission (CCC), 1997. Coastal Development Permit 6-81-330-A adopted
on April 9, 1997. Dawson, E.Y., and M.S. Foster. 1982. Seashore Plants of California. California Natural History
Guides: 47. Los Angeles: University of California Press. 226 p. Los Angeles Times, 2001. San Diego Hatches Plan to Protect Grunion Spawning Sites at
Beaches, July 22, 2001. MBC Applied Environmental Sciences (MBC), 2001. Status of the kelp beds of San Diego and
Orange Counties for the years 1990 to 2000. Prepared by: Dr. Wheeler J. North and MBC for the Region Nine Kelp Survey Consortium. November 2001. 89 pp.
Resource Insights, 1999. Final Program Environmental Report for the Construction and Management of an Artificial Reef in the Pacific Ocean Near San Clemente, California, dated
May 1999, (EIR). San Diego Union Tribune, 2001. San Diego calls off the rakes; kelp will be left from the surf to
tide line. By Terry Rodgers. July 12, 2001 Southern California Edison Company. 2001. San Clemente Experimental Artificial Reef, San
Onofre Kelp Mitigation Project, First Annual Beach Monitoring Report, October 1999 through October 2000. January 31, 2001.
Southern California Edison Company. 2002. San Clemente Experimental Artificial Reef, San Onofre Kelp Mitigation Project, Second Annual Beach Monitoring Report, November 2000 through October 2001. January 31, 2002.
ZoBell, C.E. 1959. Factors affecting drift seaweeds on some San Diego beaches. IMR Reference No. 59-3. La Jolla, California: University of California, Institute of Marine Resources. 1 January 1959. 116 p.
129

Table 1. San Clemente Beach Monitoring Project, locations of the five 500-footquantitative survey stations (north and south end points). Survey Station
#
Station Location
North End of Survey Station
South End of Survey Station
Lat. Long. Lat. Long.
1 San Mateo Point 33 33 392 117 35 870 33 23 275 117 35 811
2 State Beach, Camping Access
33 24 091 117 36 260 33 24 024 117 36 205
3 State Beach, Califia Parking Lot
33 24 370 117 36 483 33 24 304 117 36 420
4 San Clemente City Pier
33 25 209 117 37 260 33 25 127 117 37 196
5 Buena Vista/El Portal Avenues
33 25 533 117 37 625 33 25 606 117 37 714
Table 2. Seaweed wrack on San Clemente beach, at five 500-foot stations, November 2000 through October 2001. Volume in cubic feet per 500-foot station. Station 1 2 3 4 5 Average Date Amount of seaweed wrack in cubic feet/500 feet of beach 11-23-00 17 2 6 3 7 7 11-28-00 101 15 27 8 3 31 12-11-00 2 0 2 7 1 2 12-26-00 14 5 2 2 1 5 1-9-01 14 7 4 15 3 9 1-12-01* 1 25 3 10 2 8 2-8-01 14 1 2 6 11 7 2-22-00 48 3 0 2 1 11 3-7-01* 3 0 0 1 0 1 3-21-01 7 4 14 11 1 7 4-5-01 19 2 44 77 33 35 5-9-01 10 11 26 46 14 22 6-8-01 18 16 19 13 1 13 7-24-01 0 3 9 10 12 7 8-8-01* 7 23 27 99 13 34 9-5-01 7 25 22 32 8 19 10-16-01 1 12 16 38 0 13 Average 17 9 13 22 10 14 * Survey taken within 24 hours of large storm with high waves.
130

Table 3. Average monthly kelp wrack at San Clemente Pier (1954-1956), in cubic feet per 500-foot beach section (from ZoBell, 1959).
Month
Average per month (1954-56) in cubic feet per 500-foot
length of beach
January; 55 February 10 March 10 April 10 May 10 June 65 July 206
August 73 September 98
October 128 November 225 December 82
Grand average per monthly period
for all observations
92
Table 4. Monthly range and monthly average amounts of drift seaweed on 14 northern San Diego County beaches, 1954-1956, as surveyed by ZoBell (1959).
500-Foot Station Location and Station #
Monthly range of seaweed wrack in cubic feet
Monthly average for seaweed wrack in cubic feet
Laguna Beach, 49 7 to 680 221 Dana Point, 48 10 to 410 87 Doheny Park Beach, 47 10 to 1,581 421 Capistrano Strand, 46 5 to 153 60 San Clemente Beach, 45 10 to 225 92 San Onofre Beach, 44 10 to 1,106 430 North Leucadia, 43 20 to 330 130 Moonlight – Encinitas, 42 33 to 631 233 N. Cardiff-by-the-Sea, 41 23 to 2,097 353 S. Cardiff-by-the-Sea, 40 100 to 628 336 N. Solana Beach, 39 8 to 467 108 S. Solana Beach, 38 10 to 407 168 Del Mar, 37 37 to 260 116 Torrey Pines, 36 25 to 292 119 Grand Monthly Average: 205
131
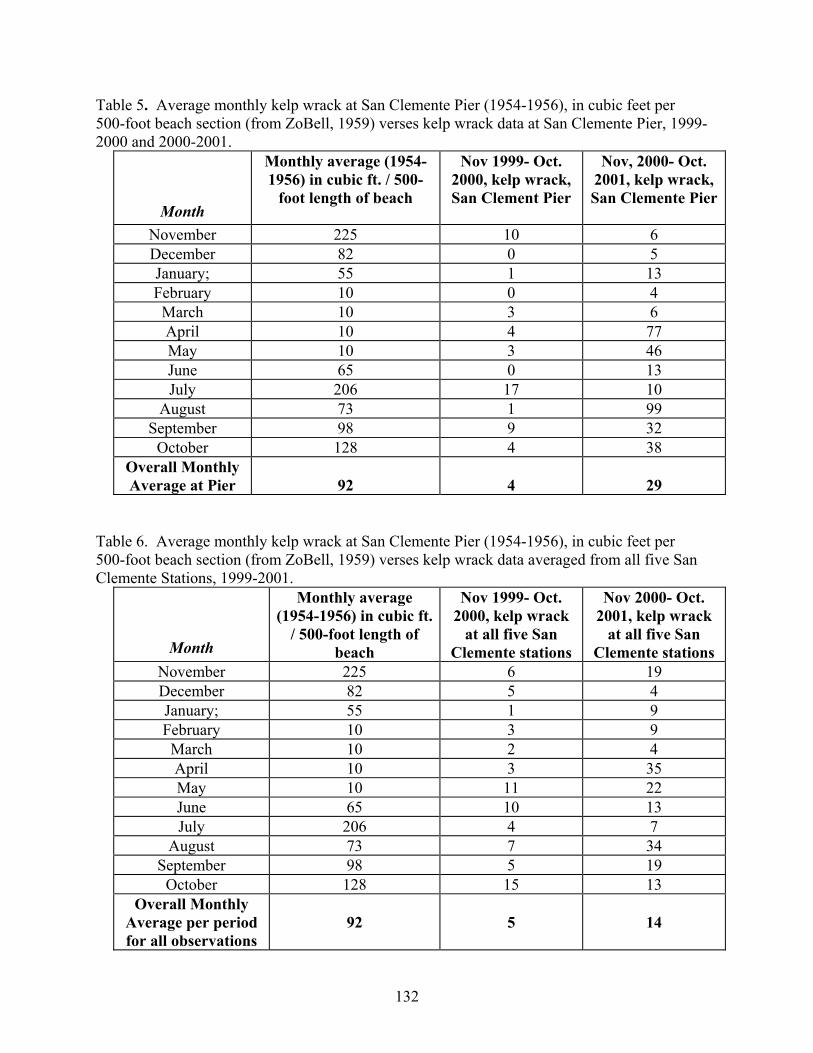
Table 5. Average monthly kelp wrack at San Clemente Pier (1954-1956), in cubic feet per 500-foot beach section (from ZoBell, 1959) verses kelp wrack data at San Clemente Pier, 1999-2000 and 2000-2001.
Month
Monthly average (1954-1956) in cubic ft. / 500-
foot length of beach
Nov 1999- Oct. 2000, kelp wrack, San Clement Pier
Nov, 2000- Oct. 2001, kelp wrack, San Clemente Pier
November 225 10 6 December 82 0 5 January; 55 1 13 February 10 0 4 March 10 3 6 April 10 4 77 May 10 3 46 June 65 0 13 July 206 17 10
August 73 1 99 September 98 9 32
October 128 4 38 Overall Monthly Average at Pier
92
4
29
Table 6. Average monthly kelp wrack at San Clemente Pier (1954-1956), in cubic feet per 500-foot beach section (from ZoBell, 1959) verses kelp wrack data averaged from all five San Clemente Stations, 1999-2001.
Month
Monthly average (1954-1956) in cubic ft.
/ 500-foot length of beach
Nov 1999- Oct. 2000, kelp wrack
at all five San Clemente stations
Nov 2000- Oct. 2001, kelp wrack
at all five San Clemente stations
November 225 6 19 December 82 5 4 January; 55 1 9 February 10 3 9 March 10 2 4 April 10 3 35 May 10 11 22 June 65 10 13 July 206 4 7
August 73 7 34 September 98 5 19
October 128 15 13 Overall Monthly
Average per period for all observations
92
5
14
132

Public Comment MR. DIXON: Have you ever seen any materials that you could ascribe to either reef type? MR. GROVE: Any? MR. DIXON: Have you ever seen any materials on the beach that you could ascribed as coming from one of the reef types? MR. GROVE: Yes, that is a good question. We were looking for tags, actually, because a lot of the kelp that is on the artificial reef have been tagged. We haven't seen any tags. There has been some that are the class size, yes, they could have come from the reef, yes. MR. DIXON: How about other materials? MR. GROVE: Well, there is concrete, and you can tell they are pretty worn down, you know, they don't look like they have been ours, and they are too old. There are a couple of chunks of quarry, of granite, you see on the beach, and we think that has slopped out from where the railroad riprap is. So, you can trip along the beach on rocks. You have to be careful, sometimes. MR. REED: Dan Reed. Bob, I was just curious, aside from tags on plants on the beach, how do you go about determining whether the plants on the beach come from the artificial reef versus nearby natural reefs? MR. GROVE: Only that, like I say, when you see these amazing haptera that are pretty big, and then you look at the haptera carefully, and the strands are just curling all around, and are bleached. If they came from the local bed, they have been locally circulating for a long time, or they came from somewhere else. And, if there is a big kelp paddy that has come in, and you have many cubic feet, we think that is not from the reef. The smaller ones, you know, if you see a haptera, you know, or the hold fast only about that big, and it is flat on the bottom, that could easily have come from the reef, and we see a bunch of those, but you know, a bunch might be 10 to 100 on one survey. You know, we are not seeing a lot of -- it doesn't really add too much to the biomass. That was a good question. Any others?[ No Response ] That it? Okay, thank you.
133

ARTIFICIAL REEF STUDIES PLANNED FOR 2002
Steve Schroeter Marine Science Instititute
University of California, Santa Barbara [email protected]
Introduction Work on the artificial reef (SCAR) planned for 2002 falls into two main categories: 1) Monitoring of physical and biological variables to evaluate the performance criteria for the different reef designs, and 2) Process studies (consisting of focused sampling and experiments) to aid in predicting which reef designs will best meet the performance criteria on the larger mitigation reef. Process studies are necessary for two reasons. First, the duration of the experimental phase of the reef studies is short (i.e. 5 years) relative to the time required for the development of a sustained kelp forest community. Second, the spatial scale of the experimental reef modules are small (0.4 acres) relative to the size of the mitigation reef (150 acres). Changes in monitoring task
Conducting the most effective experimental reef study requires optimally dividing effort between monitoring and process studies. To this end, the monitoring tasks were thoroughly reviewed to determine how much they could be reduced and still achieve the monitoring goals. This review determined that the following changes could be made without compromising the goals of our study:
(1) Side scan sonar surveys of the area of artificial substrate on the different reef designs will be suspended until the fifth and final year of the experimental reef study, unless large changes in substrate area are detected during monitoring of kelp and invertebrates and algae. This change was made based analysis of the data showing little change in area of hard substrate over a two year period following an increase immediately after the reef was constructed.
(2) Monitoring of the 14 kelp transplant modules will be discontinued. This decision was based upon transplantation experiment providing information on the practical details of kelp transplantation which could be used to evaluate the relative cost effectiveness of kelp transplantation as a remediation method in the event that the mitigation reef failed to comply with the kelp mitigation standard of the SONGS permit. A second goal of the kelp transplantation studies, insuring sufficient kelp recruits to test the effectiveness of the different reef designs, was moot, since there was heavy natural kelp recruitment in the spring of 2000 following the reef construction in September and October of 2000.
(3) Summer surveys of adult kelp will no longer be conducted, since annual surveys are sufficient to determine the effects of the different reef designs on adult kelp growth, mortality and fecundity, and
(4) Sampling intensity during the summer surveys of kelp bed invertebrates and algae were reduced by 50%. This reduction was based on power analyses which determined how many 40m x 2m transects (each of which has 6 1m x 1m quadrats) that could be eliminated on each experimental reef module while maintaining the power to detect differences among reef designs achieved using 4 transects per module (Table 1).
134

Table 1. Minimum number of transects per module (= reef design replicate) required to detect treatment differences on SCAR for each of six taxonomic categories.
Taxonomic Category Minimum Number of Transects
Kelp Density 2 Invertebrate Density 2 Invertebrate % Cover 2 Invertebrate Richness 2 Algal Density 2 Algal % Cover 2
Process studies to be conducted in 2002 Five process studies are planned for 2002. All are designed to estimate parameters required to determine whether the mitigation reef will comply with the conditions of the SONGS permit. They include:
1. Studies to estimate fish Reproductive Rates. These studies will focus on two approaches. The first will be to sample surfperch young of year (YOY) per adult at the time of parturition. The second will be to collect species with sedentary adults (e.g. gobies, clinids, and cottids) and sample their gonads. Both approaches focus on stages that have ranges of movement small enough to ensure that the process of interest (production of live young per adult for surfperch or gonad development for sedentary benthic species) will have resulted from residence on a particular module (and therefore a particular reef design).
2. Fish Production. Studies of fish production will have two goals. The first involves studies to determine differences among designs on the experimental reef. These need to involve life stages or behaviors which will be limited to the scale of a single reef module. These include: a) cohort analysis of young of year of selected species (e.g. sheephead, black surfperch, senoritas, black-eyed gobies, and blacksmith). B) Assessment of gut fullness and composition in indicator species that represent different feeding modes. The second kind of fish production estimates will focus on developing techniques that can be used on the larger mitigation reef. We will explore the use of RNA:DNA ratio and otoliths to assess short-term and both short and long-term growth, respectively, and will seek advice from experts.
3. Benthic Food Chain Support. The SONGS permit requires that “the benthic community shall provide food-chain support for fish similar to natural reefs within the region”. We will evaluate this criterion by using gut composition data collected as a part of fish production study to compare the quantity and type of food eaten by fish on SCAR and the two reference reefs
4. Invasive Species (e.g. Muricea). The SONGS permit states that “the important functions of the reef shall not be impaired by undesirable or invasive benthic species”. Sea fans (Muricea spp.) are a long-lived species that typically appear on artificial reefs in the region within 5 – 10 years. A limited amount of experimental evidence (Patton, pers. comm.) suggests that sea fans may achieve densities sufficient to inhibit a sustained
135
population of giant kelp. We will take two approaches to assess the possible adverse effects of sea fans. First we will conduct field surveys to determine whether there are sufficient densities of young of year sea fans to make transplantation experiments feasible. Second, we will use existing information to determine threshold densities and sizes of reef substrate at which Muricea inhibits kelp and other reef biota.
5. Finally, studies will be done to determine the mechanisms underlying differences in species composition between SCAR and the reference reefs in July 2000. Although the differences have diminished to varying degrees, the artificial reef still looks quite different from the natural reference reefs. The goal of these studies will be to determine
• Whether the differences are due to succession, that is, whether the reef community on SCAR reflects an early successional stage which may be normal for the region and will therefore come to resemble the reference reefs in time.
• Whether the observed differences reflect differences in the available species to settle at the time of initial colonization, or
• Whether the differences were caused with factors related to SCAR’s location, and finally
• Whether the differences were due to differences in artificial and natural substrates.
A reciprocal transplant experiment will be conducted to assess the effects of location (reference vs. SCAR), substrate type (concrete, quarry rock, natural boulders), and history (scraped vs. non-scraped) using a reciprocal transplant experiment. Community development will be compared on undisturbed control boulders in SCAR and SMK to natural or artificial substrates from which all plants and animals are removed. These latter substrates will be either returned to their place of origin (transplant controls) or transplanted to a distant site (disturbed artificial substrates will be moved from SCAR to SMK and disturbed natural substrates will be moved from SMK to SCAR). Ten replicate boulders will be used for each combination of location, substrate, and history.
136
Public Comment
MR. HELVY: Steve, back to monitoring, are you tracking the fishing pressure on the reef? MR. SCHROETER: No, we are not. MR. HELVY: Could that -- that is an external factor. Is that something that could play into your analysis down the line, when you are looking at your reference reefs? MR. SCHROETER: It would be interesting, and Dan was just pointing out, the whole idea of this is, this is going to be sort of in the matrix of normal use, so we are adding a kelp reef. And, the idea is -- fishing is allowed on the artificial reef, and as it is on the natural reefs, so the idea would be that there wouldn't be a difference. But, it would be nice to know what that is. We also have done some discussions with, you know, local trap fishermen, or people that work with trap fishermen, to try and get a handle on one kind of fishing, and that is trap fishing, and so far we haven't really followed through on that, but that is a good suggestion. MR. STREICHENBERGER: Well, you want to adventure yourself in some one or two other substrate, that's good, good plan. Did you think about trying, as the reef balls? It is a very well known material, extremely successful, and it is not a provocative idea, because it is a very well known material. I don't ask you today to advance you more than that, if you would go to more adventure, as you know, we could propose many other things, too. But, please for next year, why don't you try some reef balls. MR. SPECKER: John Specker. Are you going to offer programs to any of the universities when you get done with this program, of your reef? MR. SCHROETER: Excuse me? MR. SPECKER: Are you going to offer any programs to, like to the universities, to be doing experiments? MR. SCHROETER: One of the -- actually one of -- I am sorry, Rodolphe, I wasn't thinking, but you know these two question are actually related. I mean, one of the things -- I don't know if you got it from Todd's talk, but Todd Anderson is a professor at San Diego State, a fish ecologist, and he is using the reef now as a resource for his Sea Grant research, and we welcome the use of this for, you know, university researchers, or other scientists that are interested in doing this, the work, that this provides.
137
This is a huge experiment. It is unprecedented, and we encourage, you know, anybody who can to take advantage of it. MR. STREICHENBERGER: Reef ball? MR. SCHROETER: Reef ball, well, if you want to do reef ball, I am not sure how it would be implemented, but I mean, we are not looking at reef balls, that's for sure. The other thing that I want to make clear is we are really interested in evaluating these different reef designs that Edison has come up with. I mean, they have decided that this is the way that they want to build a reef that is going to meet the performance standards. And, we as scientists, working for the Coastal Commission, had some input in evaluating these designs, and making suggestions, but we in no way dictated to them how they had to do this, okay? Yes, right, and it is the permit, right. It is the permit requirement. But, anyway, our job is to use the resources that we have to evaluate, you know, what is out there now, and what is the best design to produce the permit, the stuff that is required by the permit. MS. HANSCH: Susan Hansch. One of the goals to the permit conditions is to try to recreate the original reef that was damaged, as much as possible. And, that was one of the goals that Edison, and the Commission, came up with, and that is what the design tries to do. So, even if Rodolphe's idea might have some value, it is a wholly different kind of an experiment than trying to recreate what was damaged. MR. SCHROETER: That's a good point, yes. MS. MORRIS: Wendy Morris, with the Surfrider Foundation. I just have a comment I would like to make for the record, is that, we haven't had any significant surf or storm events since the reef was put in. MR. SCHROETER: You know, actually, we had some significant storms the year after it was put in, because you recall from Dan's talk, the increase in the percent cover, because of, clearly, redistribution, and before those, the storms, we put out all of these transect lines, on every single module. We put out four transect lines, and these things got severely torn up because of, presumably, storm related movement of the substrates, and we had to replace, you know, like 80 percent of them, or something like that. So, something happened. We did not get the big el nino storms, like we get in '83, or '89, but they were substantial, and you know, I hope we get a big storm. That would be really great, you
138

know, because it would kind of push the experiment. It would be a really fortunate thing to happen. MS. MORRIS: I was really referring to the possibility of some of this artificial material washing up on the shore, and saying in just a short amount of time that this reef has been in place, we really haven't had, say, an El Nino event, any, in my opinion, most significant events, so there hasn't been that much movement. There hasn't been any appearance of it on the shore, and that is what I was referring to. MR. SCHROETER: You are right, yes. UNIDENTIFIED SPEAKER: Are you going to be using this reef for recreational and research purposes? MR. SCHROETER: We are going to use it for -- I mean, it is a public, you know, it is part of State Lands. It is a public resource, and so, yes, and fishing, and commercial, as well, yes. Anymore? MS. ORD: My name is Lucy Ord, O-r-d. I have a question. I am wondering what happened to the reef in the first place? Did we ever have a natural reef? What happened to it? Why it is not there? Why we are having to replace it? and that sort of thing. MR. SCHROETER: Okay. The location for this reef was very carefully chosen. It is an area that by and large there is at least 150 acres of habitat that is overlain by about a half-meter of sand, or sandy substrate, and then it has got various kinds of bedrock, and impermeable stuff below that. And, then sort of scattered around in there is low relief hard substrate, particularly up to the north. And, it was specifically chosen because the idea was that we wanted to build -- one of the design criteria for the reef was that it would be a low relief reef, and the reason for this is that there has been a long history artificial reefs in California, where just to prevent the reef from sinking down into the sand, the California Fish and Game, for example, have had to pile up lots of rocks. And, what happens is you get these islands of high relief, and they attract fish, and they look like they are conducive to the settlement of long-lived invertebrates, like these sea fans, and so forth. And, oftentimes, what you get is the flush of kelp recruitment, after the reef was put in, but it seems not to persist because either it is grazed off by grazing fish that are attracted to the reef, or its space is preempted by other invertebrates. So, one of the big design criteria for this reef was that it be low relief. Well, in order to have low relief, you can't be piling up a lot of stuff, and so you need to put it in a place where it is eventually going to scour down and sink, and so we had to, you know, SCE searched diligently
139

to find places that had a very thin veneer of soft substrate. So, this place was, you know, it was targeted. And, it didn't have a, you know, a reef like is going to be put in, when we put it in. MS. HANSCH: Steve, she may not have been here this morning, but I thought I explained why there were impacts from the SONGS plant, and why there had to be a reef. MR. SCHROETER: Okay. MS. HANSCH: I think that was the other element of the question. MR. SCHROETER: I'm sorry, yes. Why the reef? There was an extensive study that was done to evaluate the possible environmental impacts of San Onofre, and there are impacts of discharge, impacts of intakes, and one of the discharge impacts was the creation of -- because the diffusers were very well designed to get rid of heat. That was a primary engineering problem. But, an unforeseen consequence of that was that there were turbidity plumes created, which reduced light getting down to the sea floor and the San Onofre kelp bed, and the net effect of that reduction in light, was a reduction in about 180 acres of giant kelp. So, one of the permit mitigation requirements of SCE's permit is that they build a artificial reef that will replace the kelp that was lost due to the impact of the power plant. And, the idea was to put it as close as we could to the location where the resource was lost, and so there were -- in addition to all of this stuff that I was talking about, blathering on about, the other thing was that it be, you know, as close as possible to the San Onofre kelp, and so this stretch of coast between San Mateo Point and the San Clemente Pier fills the bill on those two counts. Anyone else?[ No Response ] Okay, I want to thank all of you for coming, and see you next year.* *[ Whereupon the workshop concluded at 3:45p.m. ]
140