Embed Size (px)
Citation preview


Aquifer Testing Results Associated with FS
H:\78300\783019 - Large Scale Aquifer Test\Report\Aquifer Test Report.doc
September 3, 2009
i
TABLE OF CONTENTS
1. INTRODUCTION .............................................................................................................. 1
2. DESIGN BASIS.................................................................................................................. 3
3. AQUIFER TEST METHODS AND PROCEDURES........................................................ 5
3.1 Groundwater Extraction.......................................................................................... 5
3.2 Observation Well Monitoring ................................................................................. 7
4. RESULTS AND INTERPRETATION .............................................................................. 9
4.1 Leaky Confined Aquifer Solution......................................................................... 12
4.2 Unconfined Aquifer with Delayed Gravity Response Solution............................ 13
4.3 Evaluation of Aquifer Vertical Horizons.............................................................. 13
4.4 Comparison to Aquifer Parameters Used in Site Numerical Model..................... 14
5. DISCUSSION AND CONCLUSIONS ............................................................................ 15
6. REFERENCES ................................................................................................................. 17
7. LIMITATIONS................................................................................................................. 19
TABLES
1 Production Well Construction Summary
2 Extraction Well Pumping History
3 Observation Well Completion Summary
4 Test Well Information Summary
5 Summary of Aquifer Parameter Estimates (geographical subsets)
6 Summary of Aquifer Parameter Estimates (vertical unit subsets)
FIGURES
1 Proposed Feasibility Study (Alternative 5) Extraction Well Locations
2 Aquifer Test Well Locations
3 Extraction Well Pumping Rate vs. Time
4 Pumped Wells (ESP-1 and ESP-3) Drawdown vs. Elapsed Time
5 Change in Water Level at Observation Wells vs. Elapsed Time
6 Observed vs. Calculated Drawdown Leaky Solution (CW-7, MO-2007-3B, and MH-26C)
7 Observed vs. Calculated Drawdown Leaky Solution (ESP-2 and MH-25B)
8 Observed vs. Calculated Drawdown Leaky Solution (CW-8, MO-2007-4C, ESP-4, and
MH-12)
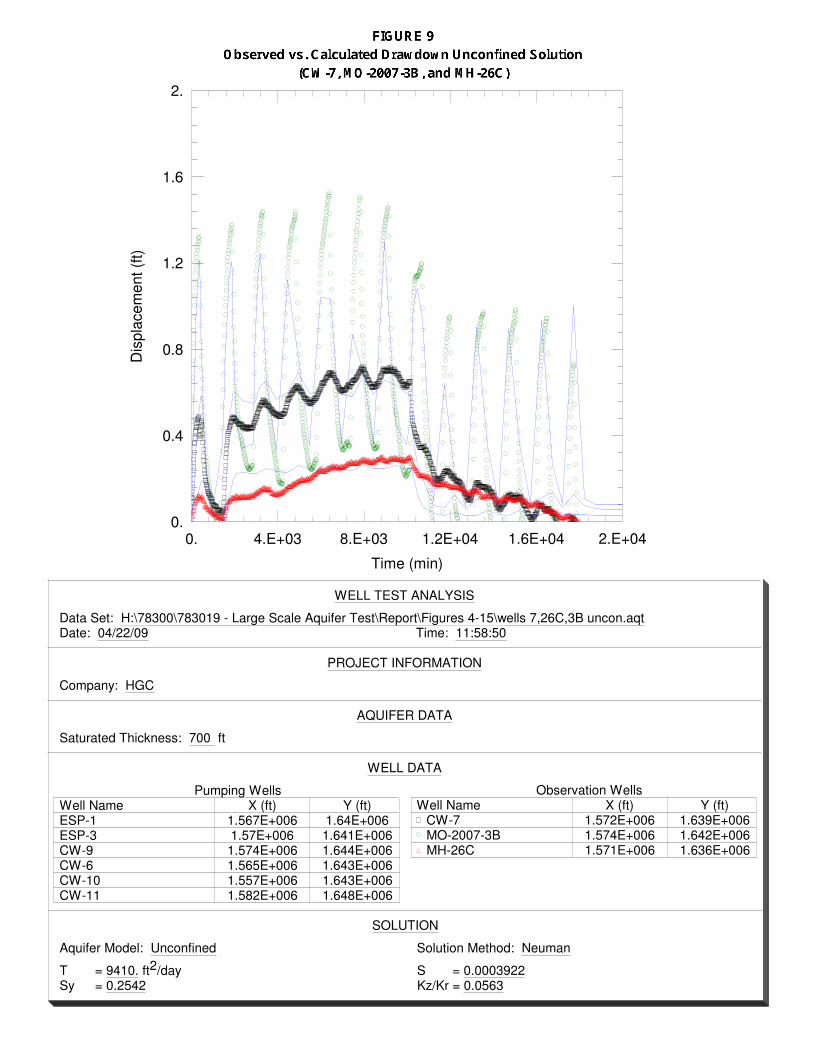
9 Observed vs. Calculated Drawdown Unconfined Solution (CW-7, MO-2007-3B, and
MH-26C)
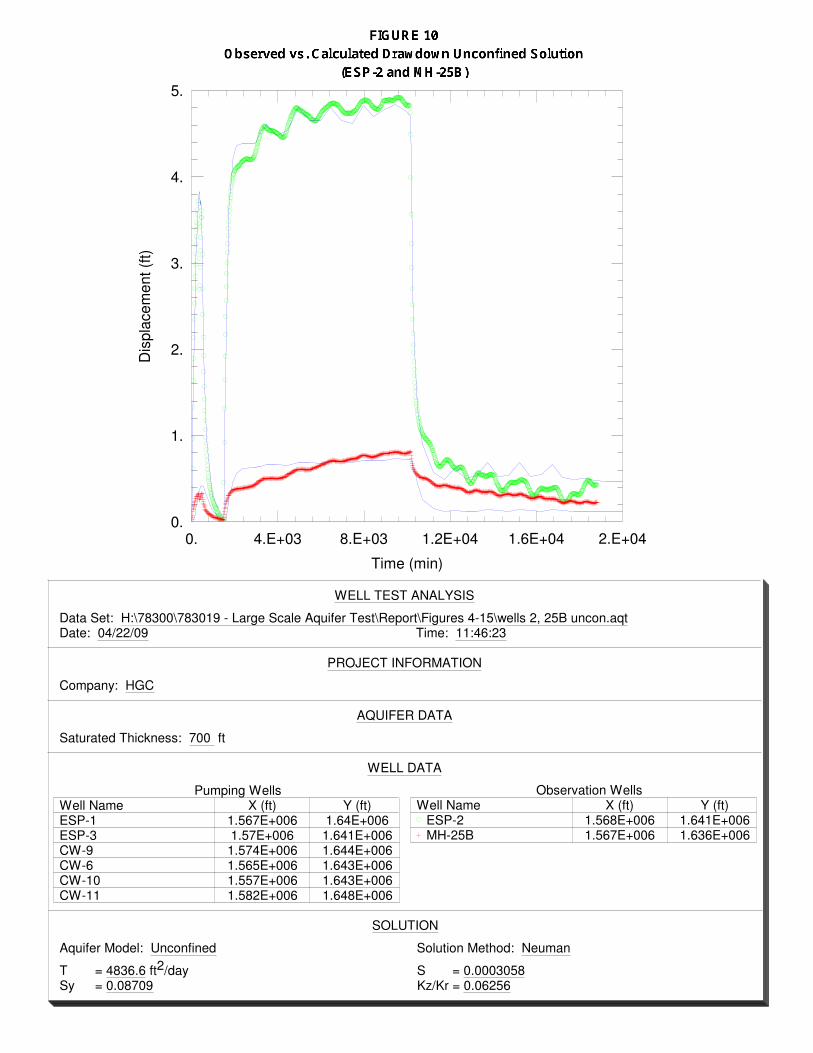
10 Observed vs. Calculated Drawdown Unconfined Solution (ESP-2 and MH-25B)
Aquifer Testing Results Associated with FS
H:\78300\783019 - Large Scale Aquifer Test\Report\Aquifer Test Report.doc
September 3, 2009
ii
TABLE OF CONTENTS (Continued)
FIGURES (Continued)
11 Observed vs. Calculated Drawdown Unconfined Solution (CW-8, MO-2007-4C, ESP-4,
and MH-12)
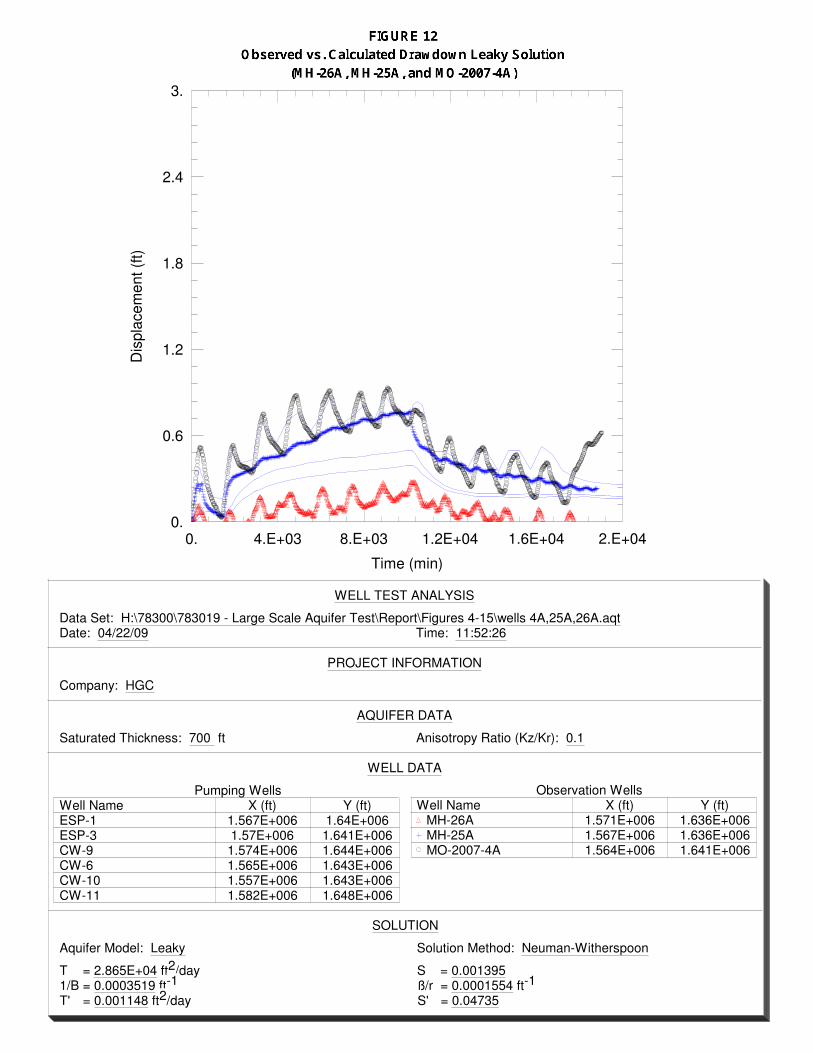
12 Observed vs. Calculated Drawdown Leaky Solution (MH-26A, MH-25A, and
MO-2007-4A)
13 Observed vs. Calculated Drawdown Leaky Solution (MO-2007-4B, MH-26B, and
MH-25B)
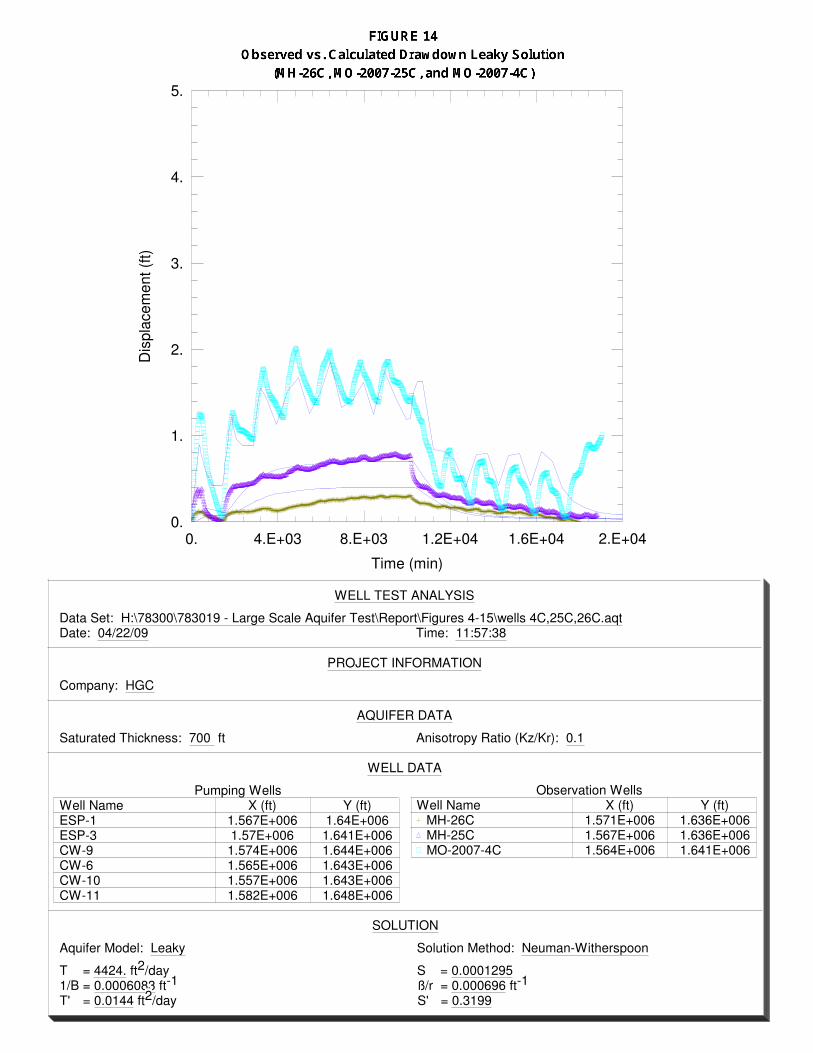
14 Observed vs. Calculated Drawdown Leaky Solution (MH-26C, MO-2007-25C, and
MO-2007-4C)
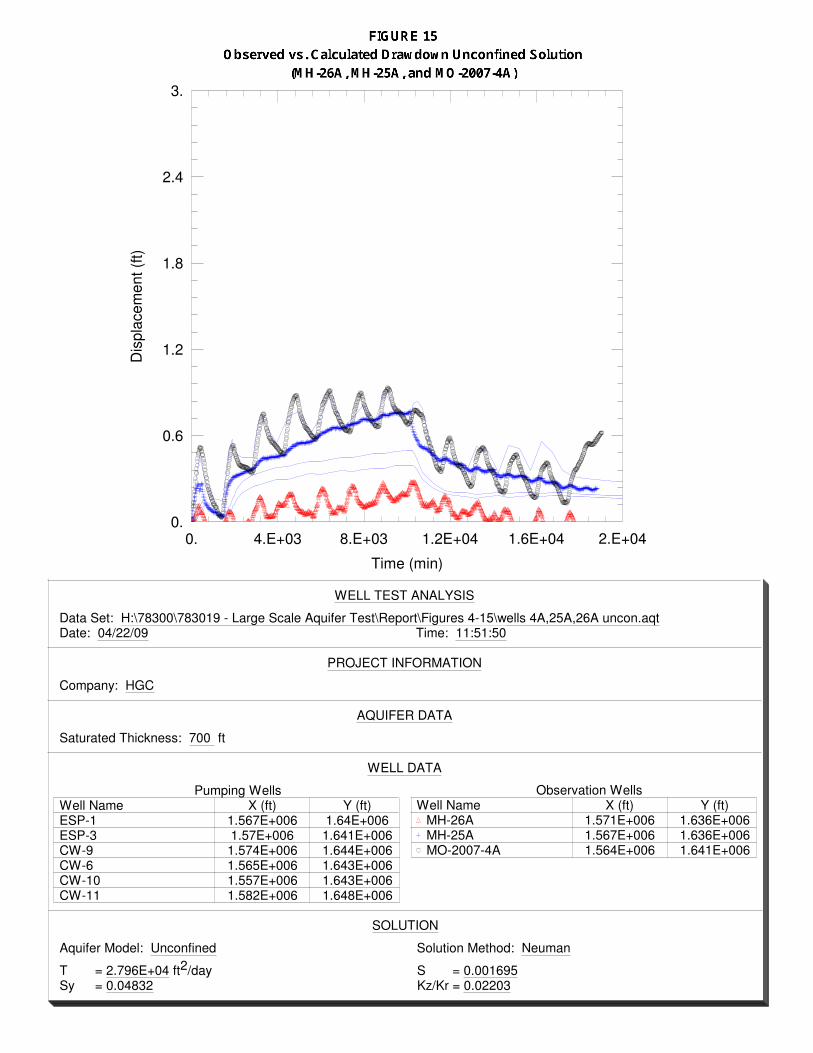
15 Observed vs. Calculated Drawdown Unconfined Solution (MH-26A, MH-25A, and
MO-2007-4A)
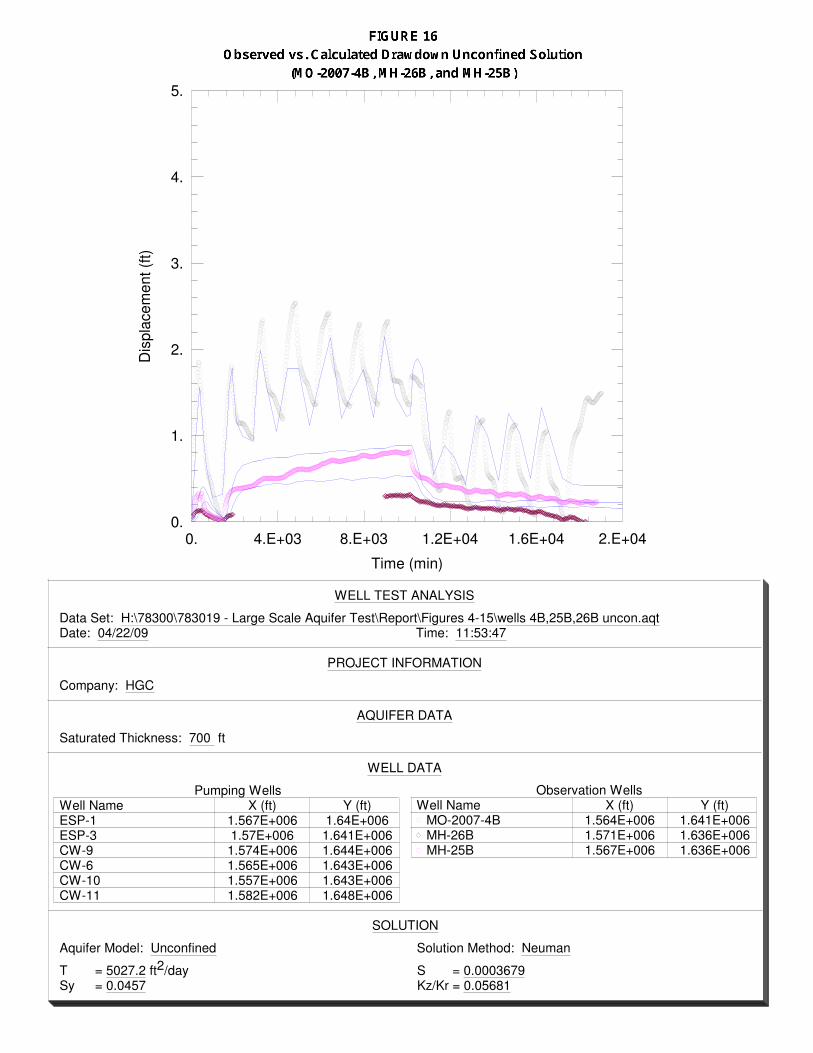
16 Observed vs. Calculated Drawdown Unconfined Solution (MO-2007-4B, MH-26B, and
MH-25B)
17 Observed vs. Calculated Drawdown Unconfined Solution (MH-26C, MO-2007-25C, and
MO-2007-4C)
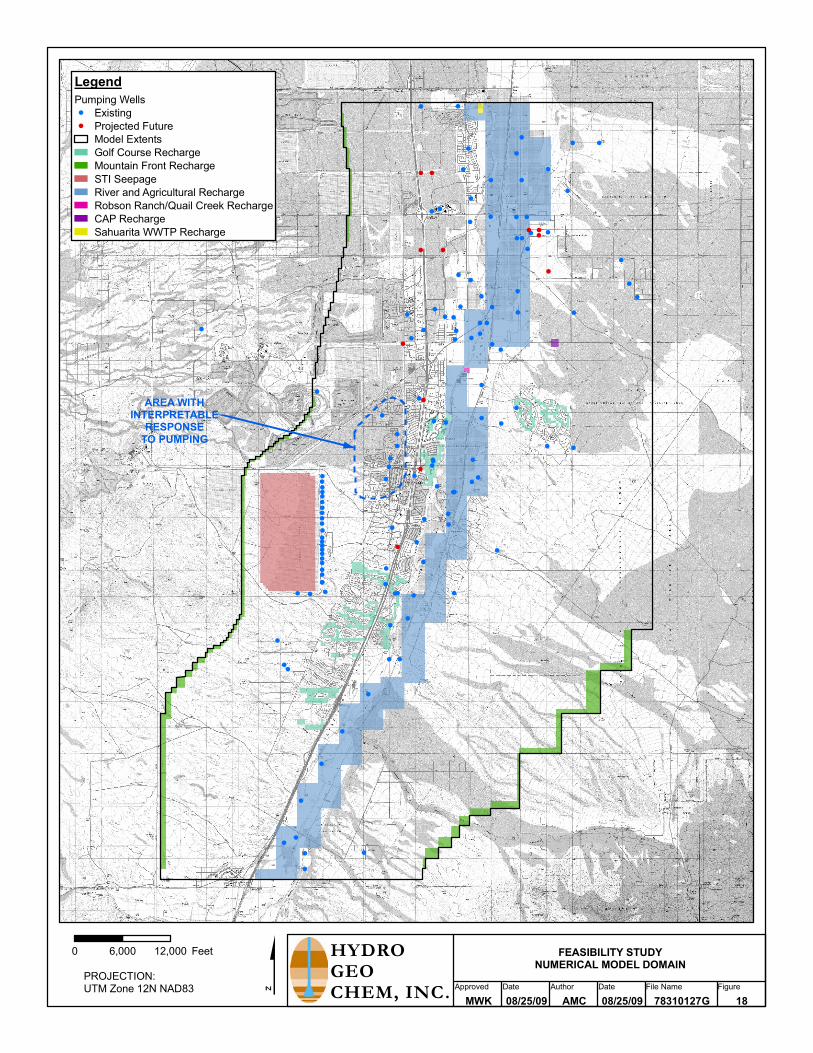
18 Feasibility Study Numerical Model Domain
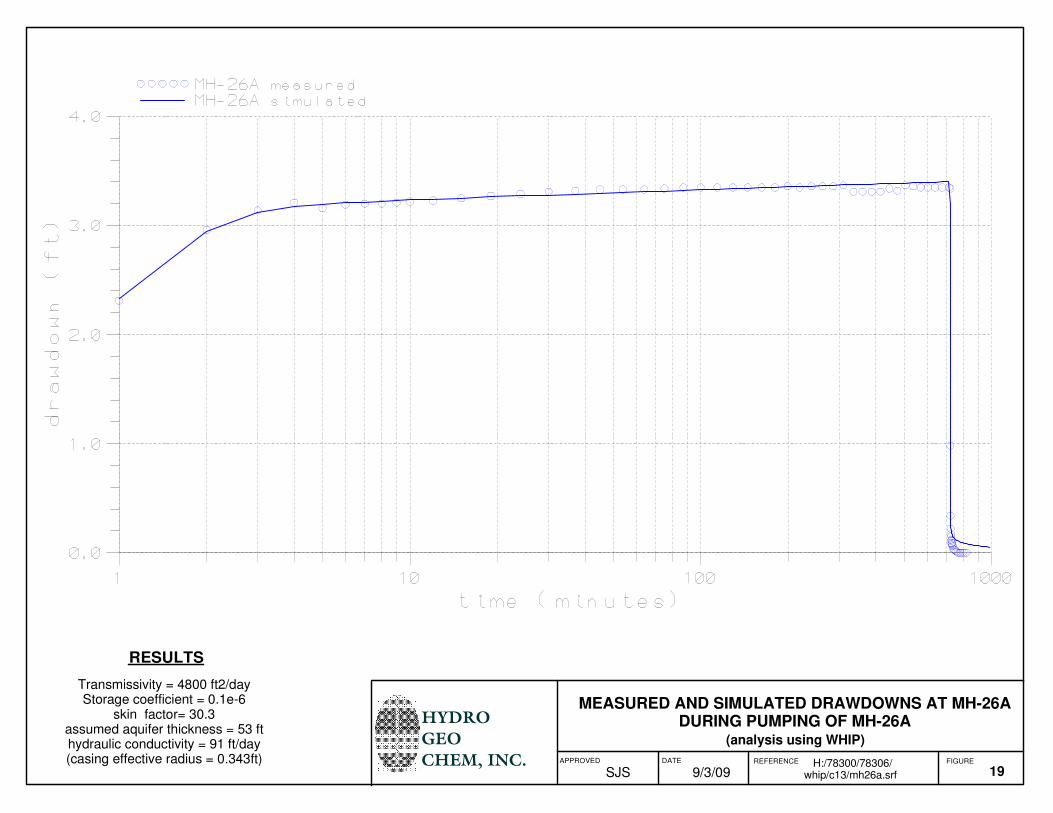
19 Measured and Simulated Drawdowns at MH-26A During Pumping of MH-26A (analysis
using WHIP)
20 Measured and Simulated Drawdowns at MH-25A During Pumping of MH-25A (analysis
using WHIP)
APPENDICES
A Community Water Company Pumping Records
B Water Level above Transducer Data, Elapsed Time, Barometric Pressure-Corrected Water
Levels, and Calculated Drawdowns
Aquifer Testing Results Associated with FS
H:\78300\783019 - Large Scale Aquifer Test\Report\Aquifer Test Report.doc
September 3, 2009
1
1. INTRODUCTION
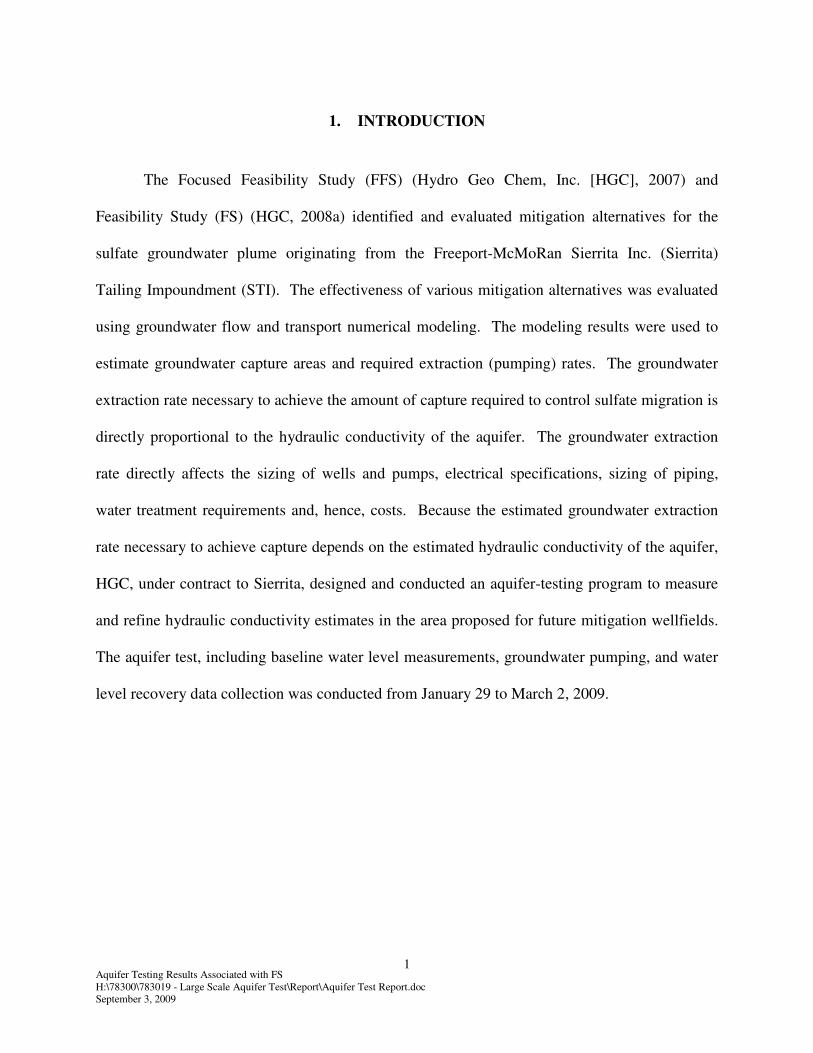
The Focused Feasibility Study (FFS) (Hydro Geo Chem, Inc. [HGC], 2007) and
Feasibility Study (FS) (HGC, 2008a) identified and evaluated mitigation alternatives for the
sulfate groundwater plume originating from the Freeport-McMoRan Sierrita Inc. (Sierrita)
Tailing Impoundment (STI). The effectiveness of various mitigation alternatives was evaluated
using groundwater flow and transport numerical modeling. The modeling results were used to
estimate groundwater capture areas and required extraction (pumping) rates. The groundwater
extraction rate necessary to achieve the amount of capture required to control sulfate migration is
directly proportional to the hydraulic conductivity of the aquifer. The groundwater extraction
rate directly affects the sizing of wells and pumps, electrical specifications, sizing of piping,
water treatment requirements and, hence, costs. Because the estimated groundwater extraction
rate necessary to achieve capture depends on the estimated hydraulic conductivity of the aquifer,
HGC, under contract to Sierrita, designed and conducted an aquifer-testing program to measure
and refine hydraulic conductivity estimates in the area proposed for future mitigation wellfields.
The aquifer test, including baseline water level measurements, groundwater pumping, and water
level recovery data collection was conducted from January 29 to March 2, 2009.

Aquifer Testing Results Associated with FS
H:\78300\783019 - Large Scale Aquifer Test\Report\Aquifer Test Report.doc
September 3, 2009
2
Aquifer Testing Results Associated with FS
H:\78300\783019 - Large Scale Aquifer Test\Report\Aquifer Test Report.doc
September 3, 2009
3
2. DESIGN BASIS
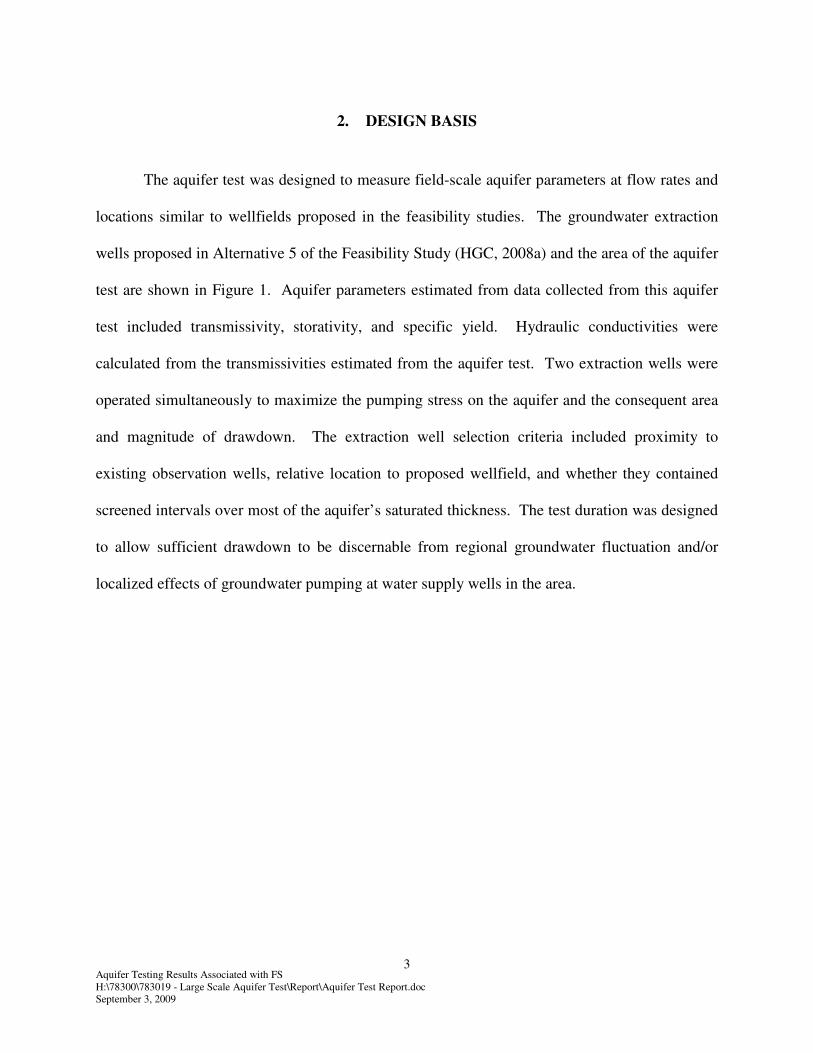
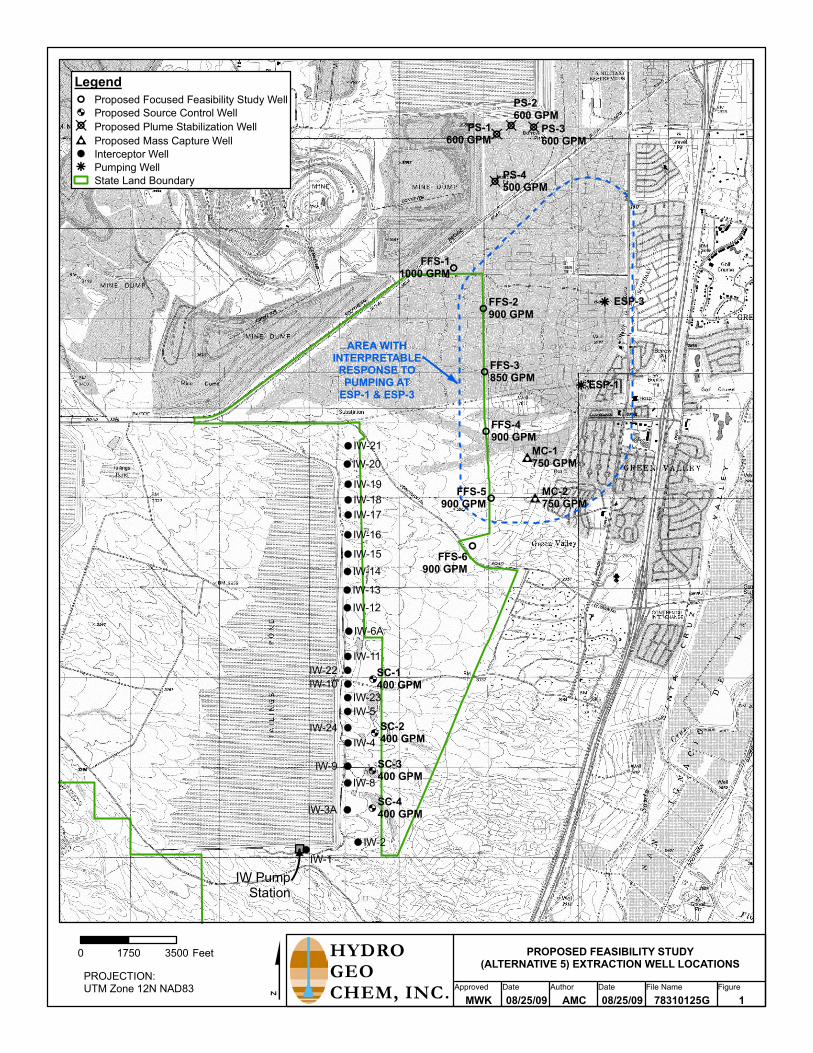
The aquifer test was designed to measure field-scale aquifer parameters at flow rates and
locations similar to wellfields proposed in the feasibility studies. The groundwater extraction
wells proposed in Alternative 5 of the Feasibility Study (HGC, 2008a) and the area of the aquifer
test are shown in Figure 1. Aquifer parameters estimated from data collected from this aquifer
test included transmissivity, storativity, and specific yield. Hydraulic conductivities were
calculated from the transmissivities estimated from the aquifer test. Two extraction wells were
operated simultaneously to maximize the pumping stress on the aquifer and the consequent area
and magnitude of drawdown. The extraction well selection criteria included proximity to
existing observation wells, relative location to proposed wellfield, and whether they contained
screened intervals over most of the aquifer’s saturated thickness. The test duration was designed
to allow sufficient drawdown to be discernable from regional groundwater fluctuation and/or
localized effects of groundwater pumping at water supply wells in the area.

Aquifer Testing Results Associated with FS
H:\78300\783019 - Large Scale Aquifer Test\Report\Aquifer Test Report.doc
September 3, 2009
4
Aquifer Testing Results Associated with FS
H:\78300\783019 - Large Scale Aquifer Test\Report\Aquifer Test Report.doc
September 3, 2009
5
3. AQUIFER TEST METHODS AND PROCEDURES
A detailed field operations plan (FOP) was prepared prior to implementation of the
proposed aquifer test (HGC, 2009). The FOP described field operation methods and procedures,
the schedule of field tasks, data collection procedures, field instrumentation instructions,
calibration procedures, field data sheets, the site-specific health and safety plan, the quality
assurance/quality control plan, project/client contacts, and emergency contacts and procedures.
3.1 Groundwater Extraction
Two existing Esperanza production wells, ESP-1 and ESP-3 as shown in Figure 2, were
utilized for pumping during the aquifer test. Both wells are in excess of 1,000 feet in depth and
are completed with nearly 700 feet of well screen. Construction summaries for each production
well are provided in Table 1. Existing vertical turbine pump capacities are 1,380 gpm for ESP-1
and 840 gpm for ESP-3.
Flow rates were maintained at approximately 935 gpm and 770 gpm for ESP-1 and
ESP-3, respectively, for approximately 7 days. Water from both ESP-1 and ESP-3 was pumped
back to the mine for use or discharged into existing drainage under Sierrita’s existing De
Minimus permit. Both ESP-1 and ESP-3 are currently classified by ADEQ as drinking water
facilities and, therefore, did not require confirmation sampling and analysis. Eight hours after
starting the test, pumping was stopped for approximately 7.5 hours due to an equipment failure.
Pumping resumed after the equipment was repaired. Existing flow control equipment and flow

Aquifer Testing Results Associated with FS
H:\78300\783019 - Large Scale Aquifer Test\Report\Aquifer Test Report.doc
September 3, 2009
6
rate instrumentation were utilized to monitor and maintain flow rates. Verification of flow rates
was accomplished using an independent portable Fuji ultrasonic, transit-time flowmeter, Model
F-200-FLCS1. Flow rates, totalizer flow readings, and hour meter reading were taken
periodically to enable accurate accounting of pump operation. A summary of each extraction
well’s pumping during the test is provided in Table 2 and graphically shown in Figure 3.
Water levels in pumped wells were monitored through existing 1-inch sounding ports.
ESP-3 was measured with an electric sounder and ESP-1 using an In-Situ Level TROLL,
Model-500, 30-pounds per square inch (psi) pressure transducer. The calibration of this
transducer was field checked by raising the transducer 2 feet, after its installation in the
extraction well, and verifying the transducer reading with the handheld data logger.
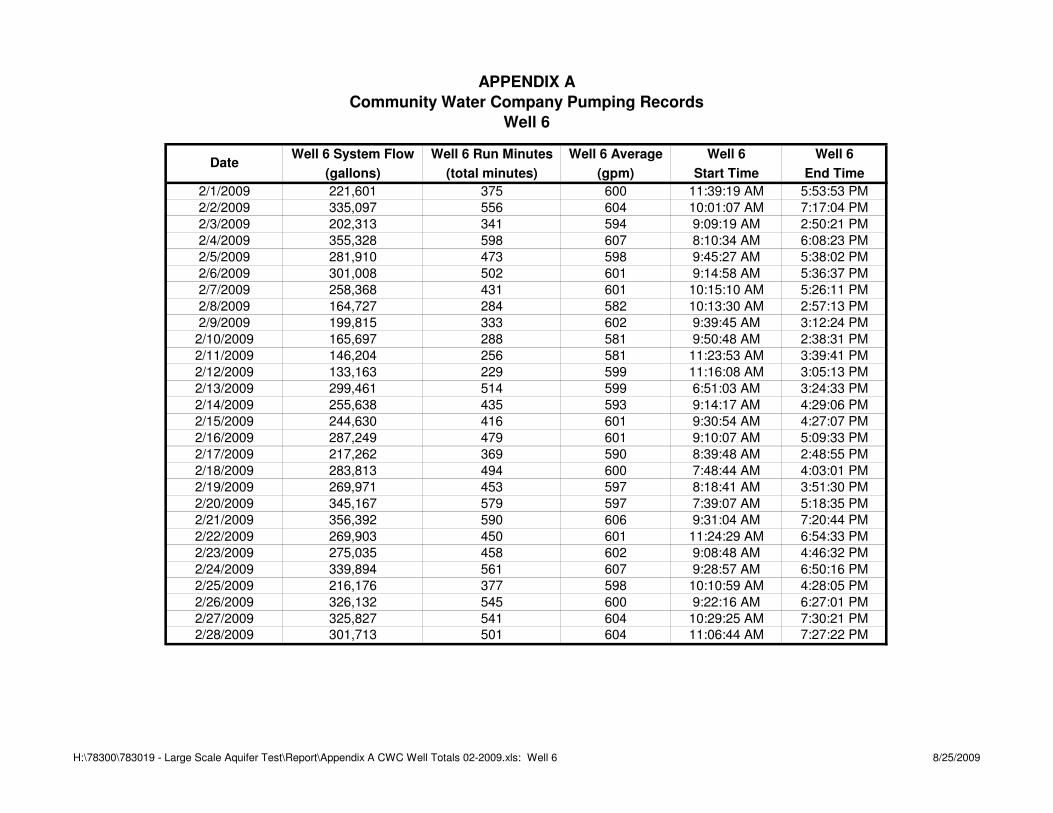
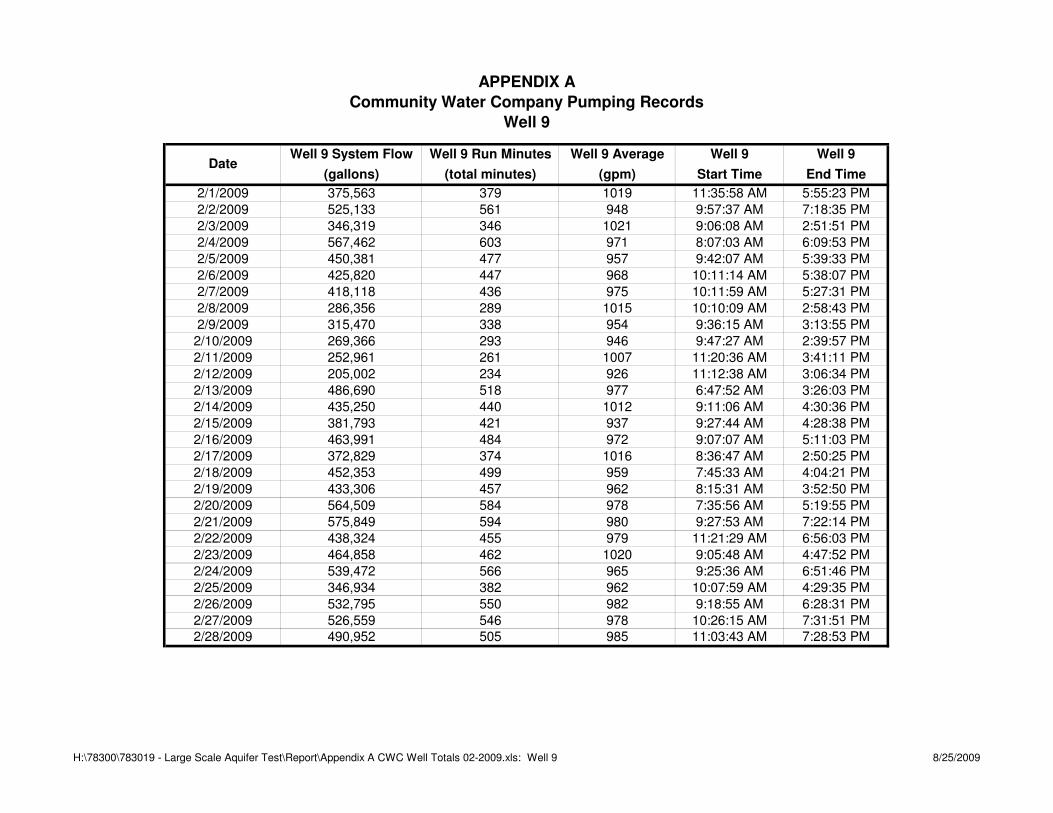
Pumping times and rates for other wells in the area were attempted to be gathered from
various sources and incorporated into interpretation of results. Major water users (Community
Water Company, Green Valley Domestic Water Improvement District, and Farmers Investment
Company [FICO]) were contacted in advance to request pumping records. At the time of the
writing of this report only Community Water Company has provided a record of pumping at
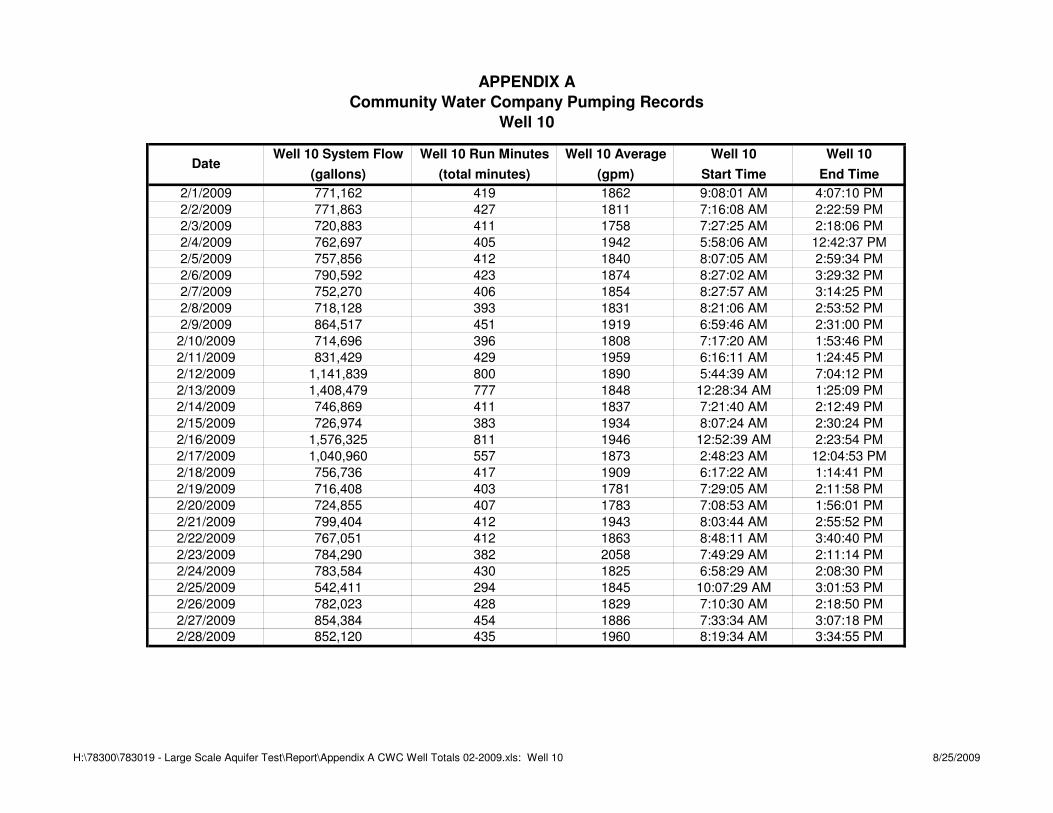
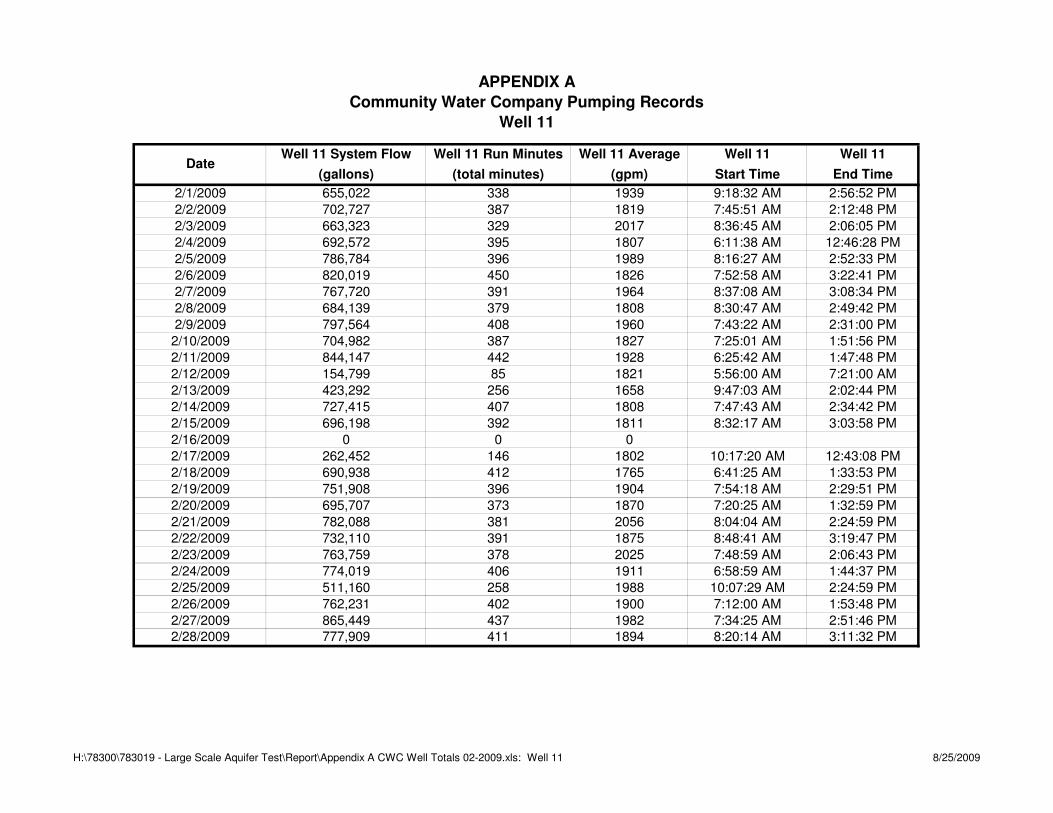
wells CW-6, 9, 10, and 11. Fortunately, these were the only wells in the area that were critical to
the interpretation of the aquifer test. Other groundwater withdrawals in the area had minor
impacts as reflected in the baseline and drawdown water level data. Additionally, FICO’s
irrigation pumping did not begin until after the completion of this aquifer test. The pumping
record submitted for the Community Water Company wells is provided in Appendix A and
included with the pumping well rate plots presented in Figure 3.

Aquifer Testing Results Associated with FS
H:\78300\783019 - Large Scale Aquifer Test\Report\Aquifer Test Report.doc
September 3, 2009
7
3.2 Observation Well Monitoring
Twenty-two existing wells were utilized as observation wells during the aquifer test
(CW-7, CW-8, ESP-2, ESP-4, ESP-5, MH-11, MH-12, MH-13A, MH-13B, MH-13C, MH-25A,
MH-25B, MH-25C, MH-26A, MH-26B, MH-26C, MO-2007-3B, MO-2007-3C, MO-2007-4A,
MO-2007-4B, MO-2007-4C, and NP-2). Figure 2 shows the location of each monitoring well.
Well completion data for the observation wells are provided in Table 3. The distance between an
observation well and the closest pumped well ranged from approximately 1,000 to greater than
9,000 feet. The well coordinates, depth to water in the fourth quarter of 2008, and distances to
pumped wells are summarized in Table 4.
Monitoring of each of the observation wells was accomplished using In-Situ Level
TROLL Model-500 vented pressure transducers and a handheld In-Situ Rugged Reader data
logger. Pressure transducer full scale ranges varied from 0-5 psi to 0-15 psi. The pressure rating
of the transducer deployed at an observation well depended on predicted water level responses at
that well. Transducer range and transducer submergence depth for each well are provided in
Table 4. Field calibration checks were conducted on each transducer by raising each transducer
2 feet in the well and verifying the response on the data logger.
Prior to start of pumping, water level data from each well were logged for a period of 2
weeks on a 15 minute interval. During the 7 days of pumping at ESP-1 and ESP-3, water levels
continued to be logged every 15 minutes. Following shutting down of the pumped wells (ESP-1
and ESP-3), groundwater recovery in each of the pumping and observation wells was monitored

Aquifer Testing Results Associated with FS
H:\78300\783019 - Large Scale Aquifer Test\Report\Aquifer Test Report.doc
September 3, 2009
8
for a period of 6 days at 15-minute intervals. Monitoring of water level recovery was conducted
using the same data acquisition systems used for measurement of drawdowns.
Barometric pressure was measured and recorded at 15-minute intervals using an In-Situ
Baro-TROLL. Barometric pressure measurements were used to correct the effect of atmospheric
pressure variations on readings collected by the pressure transducers. The Baro-TROLL
pressure transducer was installed in well ESP-2 at a depth of 10 feet to minimize temperature
fluctuations.
Aquifer Testing Results Associated with FS
H:\78300\783019 - Large Scale Aquifer Test\Report\Aquifer Test Report.doc
September 3, 2009
9
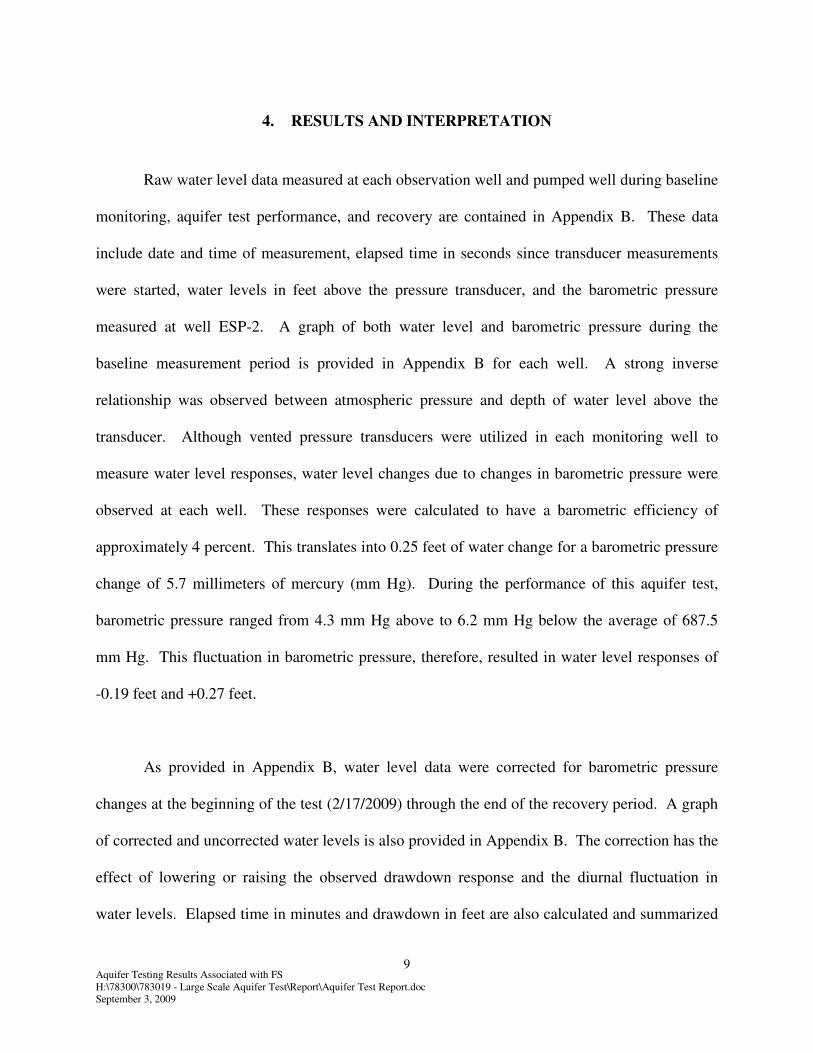
4. RESULTS AND INTERPRETATION
Raw water level data measured at each observation well and pumped well during baseline
monitoring, aquifer test performance, and recovery are contained in Appendix B. These data
include date and time of measurement, elapsed time in seconds since transducer measurements
were started, water levels in feet above the pressure transducer, and the barometric pressure
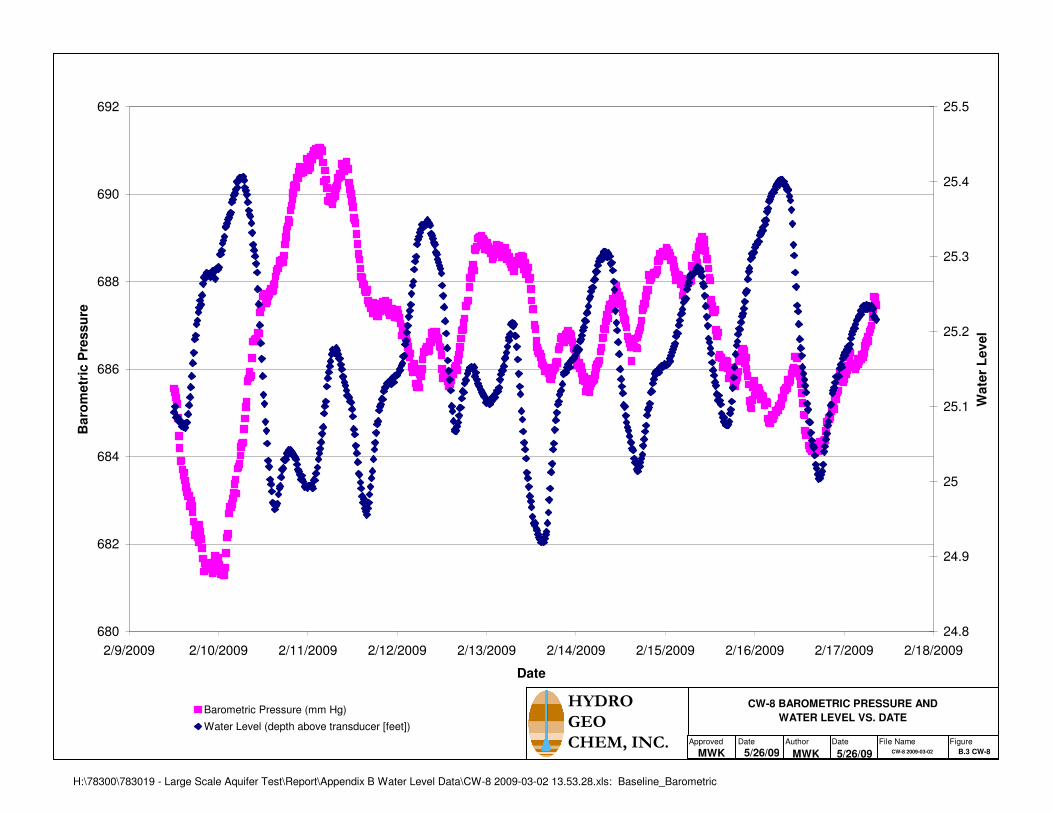
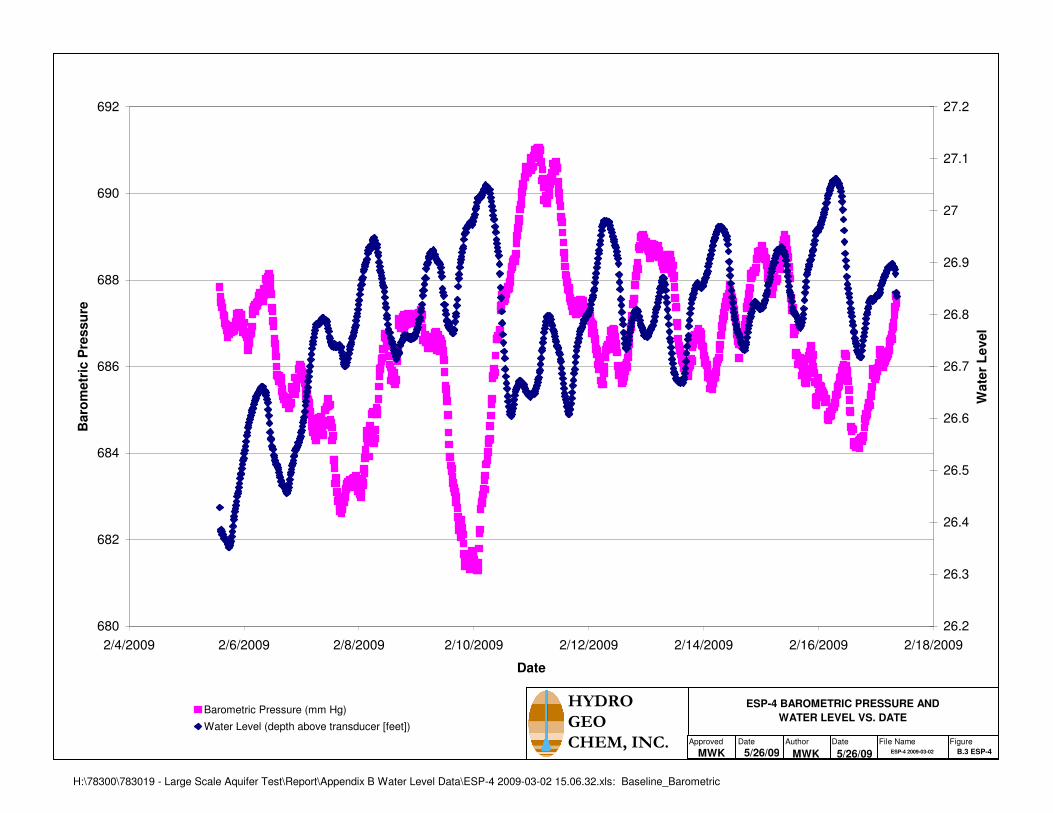
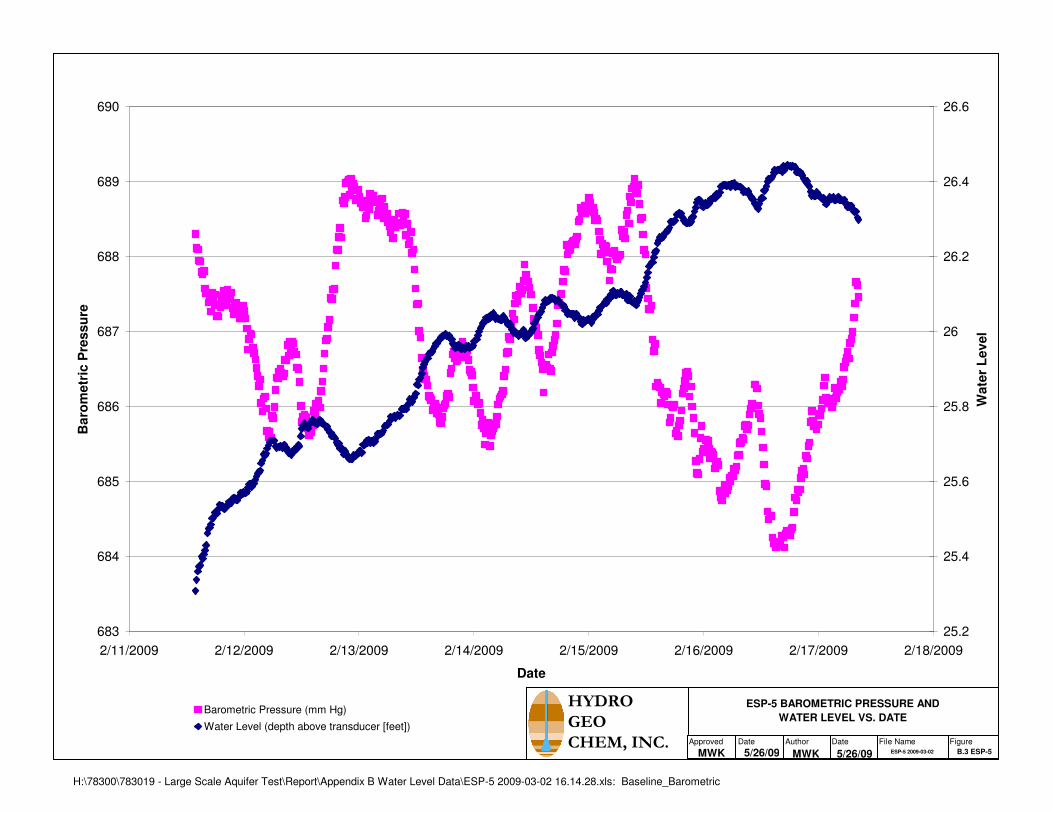
measured at well ESP-2. A graph of both water level and barometric pressure during the
baseline measurement period is provided in Appendix B for each well. A strong inverse
relationship was observed between atmospheric pressure and depth of water level above the
transducer. Although vented pressure transducers were utilized in each monitoring well to
measure water level responses, water level changes due to changes in barometric pressure were
observed at each well. These responses were calculated to have a barometric efficiency of
approximately 4 percent. This translates into 0.25 feet of water change for a barometric pressure
change of 5.7 millimeters of mercury (mm Hg). During the performance of this aquifer test,
barometric pressure ranged from 4.3 mm Hg above to 6.2 mm Hg below the average of 687.5
mm Hg. This fluctuation in barometric pressure, therefore, resulted in water level responses of
-0.19 feet and +0.27 feet.
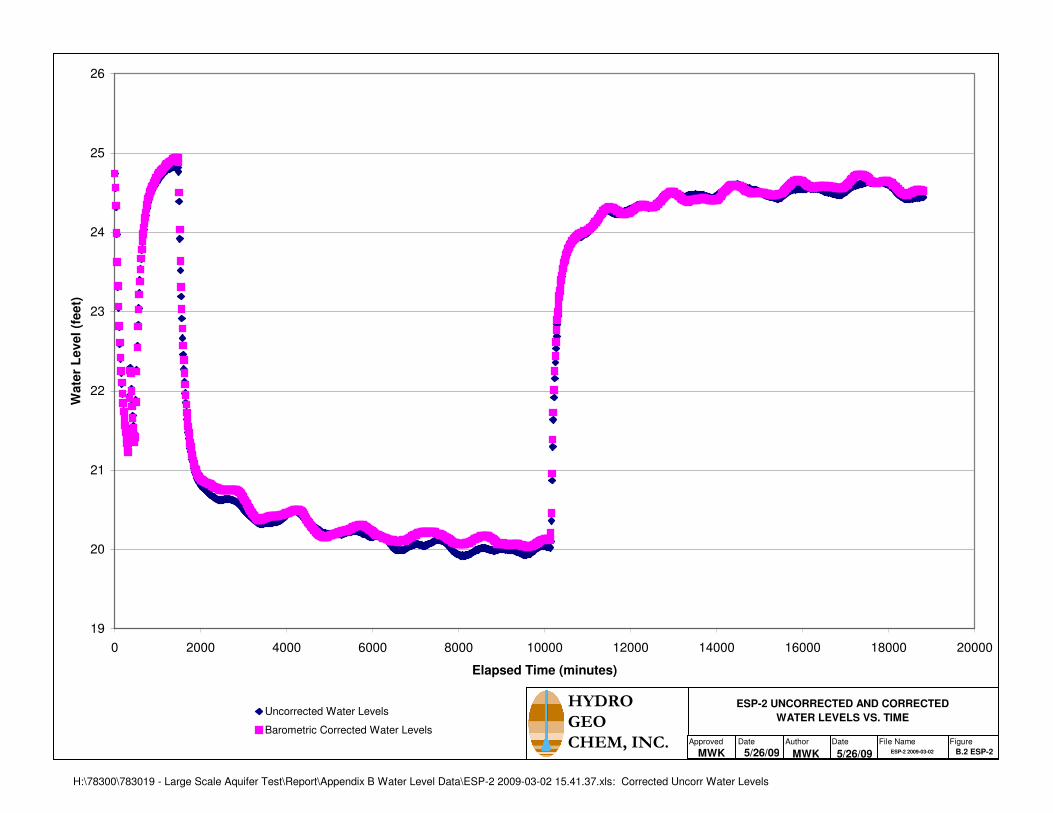
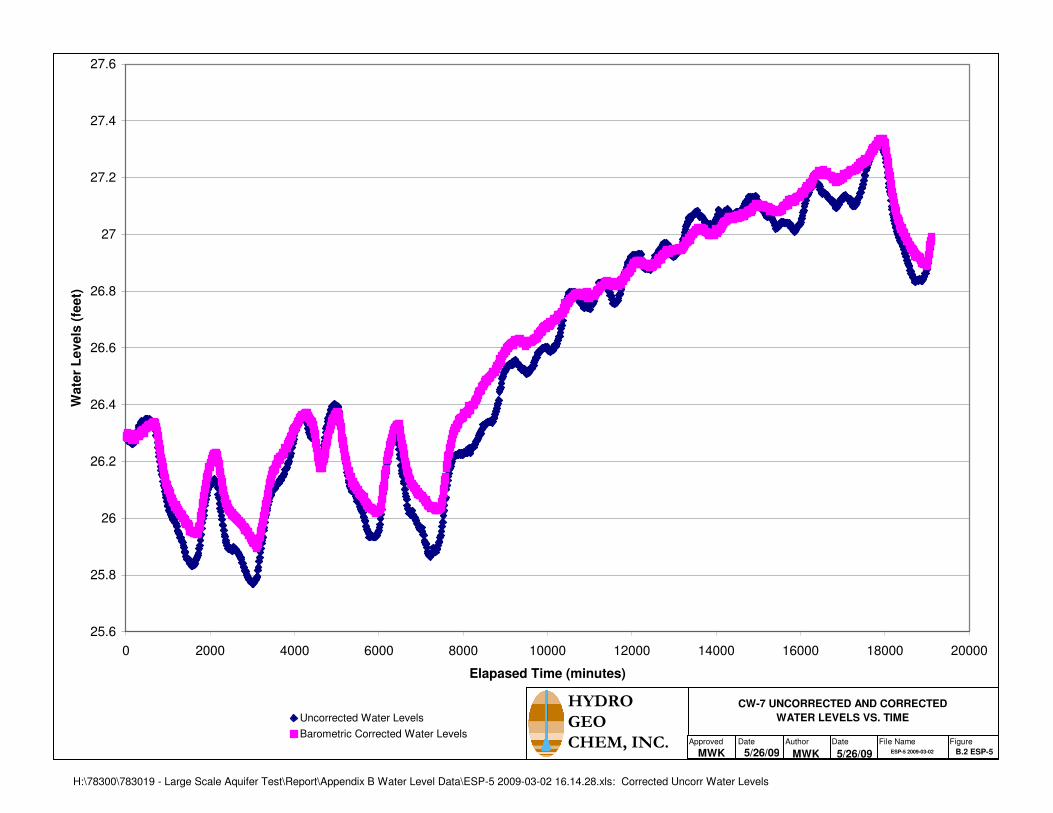
As provided in Appendix B, water level data were corrected for barometric pressure
changes at the beginning of the test (2/17/2009) through the end of the recovery period. A graph
of corrected and uncorrected water levels is also provided in Appendix B. The correction has the
effect of lowering or raising the observed drawdown response and the diurnal fluctuation in
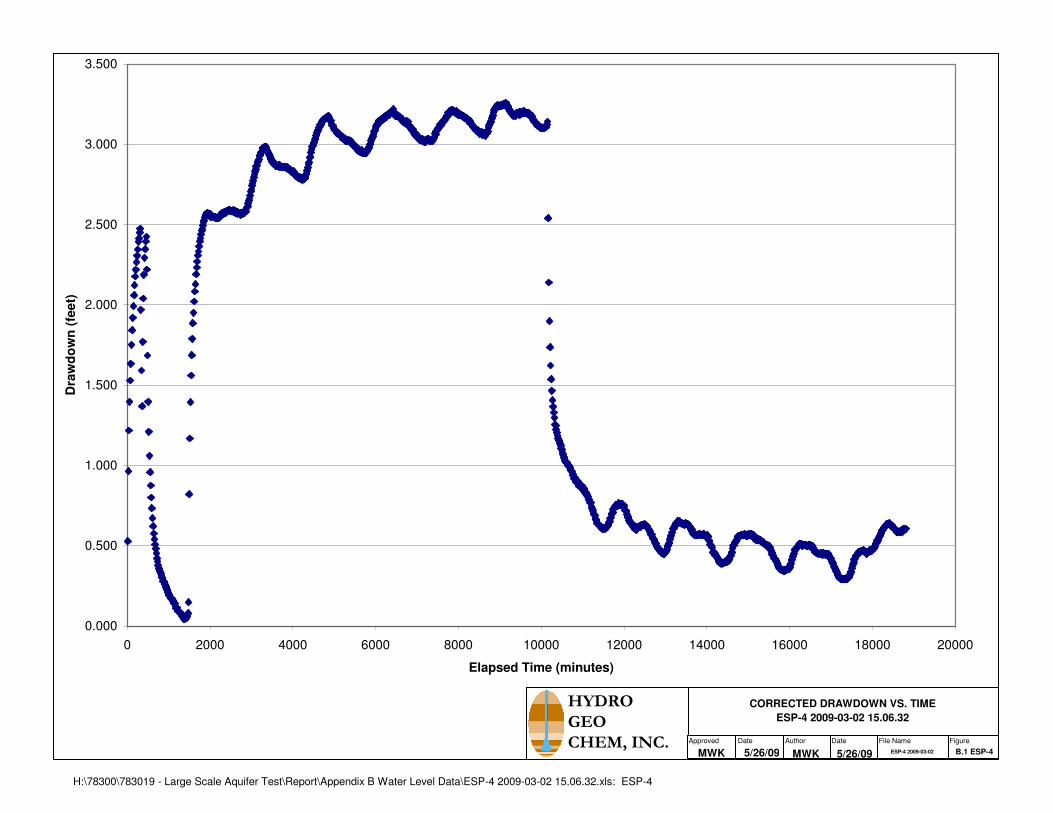
water levels. Elapsed time in minutes and drawdown in feet are also calculated and summarized
Aquifer Testing Results Associated with FS
H:\78300\783019 - Large Scale Aquifer Test\Report\Aquifer Test Report.doc
September 3, 2009
10
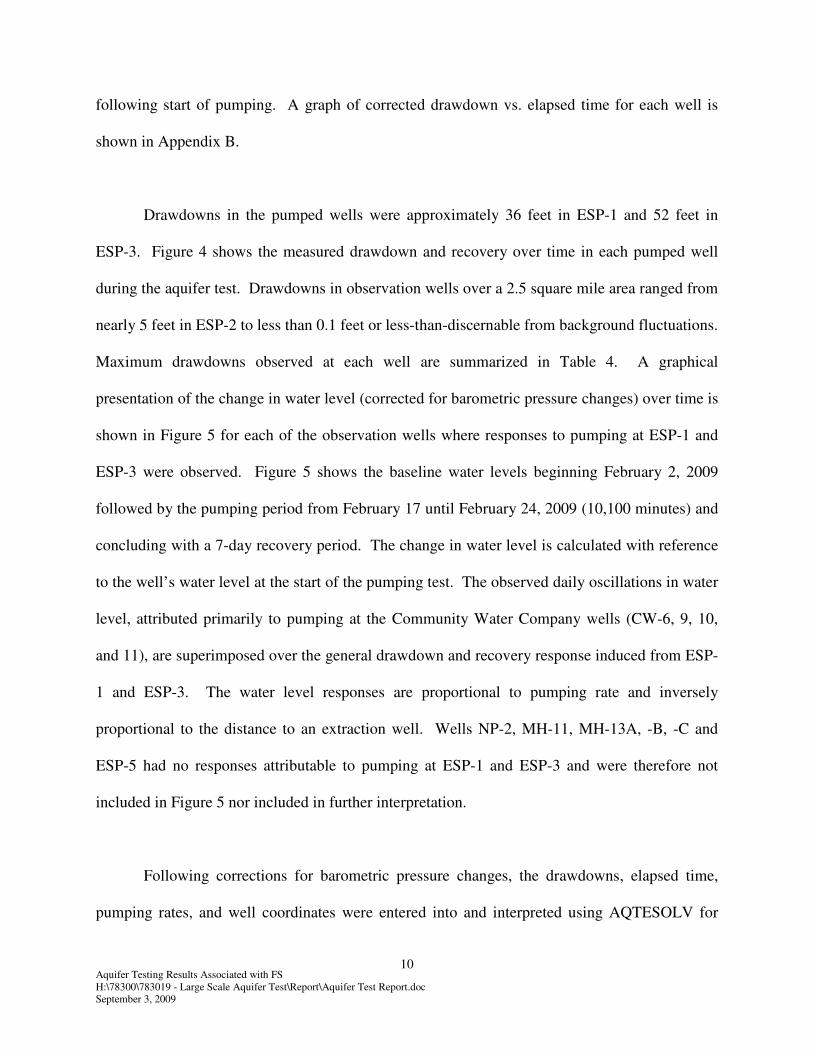
following start of pumping. A graph of corrected drawdown vs. elapsed time for each well is
shown in Appendix B.
Drawdowns in the pumped wells were approximately 36 feet in ESP-1 and 52 feet in
ESP-3. Figure 4 shows the measured drawdown and recovery over time in each pumped well
during the aquifer test. Drawdowns in observation wells over a 2.5 square mile area ranged from
nearly 5 feet in ESP-2 to less than 0.1 feet or less-than-discernable from background fluctuations.
Maximum drawdowns observed at each well are summarized in Table 4. A graphical
presentation of the change in water level (corrected for barometric pressure changes) over time is
shown in Figure 5 for each of the observation wells where responses to pumping at ESP-1 and
ESP-3 were observed. Figure 5 shows the baseline water levels beginning February 2, 2009
followed by the pumping period from February 17 until February 24, 2009 (10,100 minutes) and
concluding with a 7-day recovery period. The change in water level is calculated with reference
to the well’s water level at the start of the pumping test. The observed daily oscillations in water
level, attributed primarily to pumping at the Community Water Company wells (CW-6, 9, 10,
and 11), are superimposed over the general drawdown and recovery response induced from ESP-
1 and ESP-3. The water level responses are proportional to pumping rate and inversely
proportional to the distance to an extraction well. Wells NP-2, MH-11, MH-13A, -B, -C and
ESP-5 had no responses attributable to pumping at ESP-1 and ESP-3 and were therefore not
included in Figure 5 nor included in further interpretation.
Following corrections for barometric pressure changes, the drawdowns, elapsed time,
pumping rates, and well coordinates were entered into and interpreted using AQTESOLV for
Aquifer Testing Results Associated with FS
H:\78300\783019 - Large Scale Aquifer Test\Report\Aquifer Test Report.doc
September 3, 2009
11
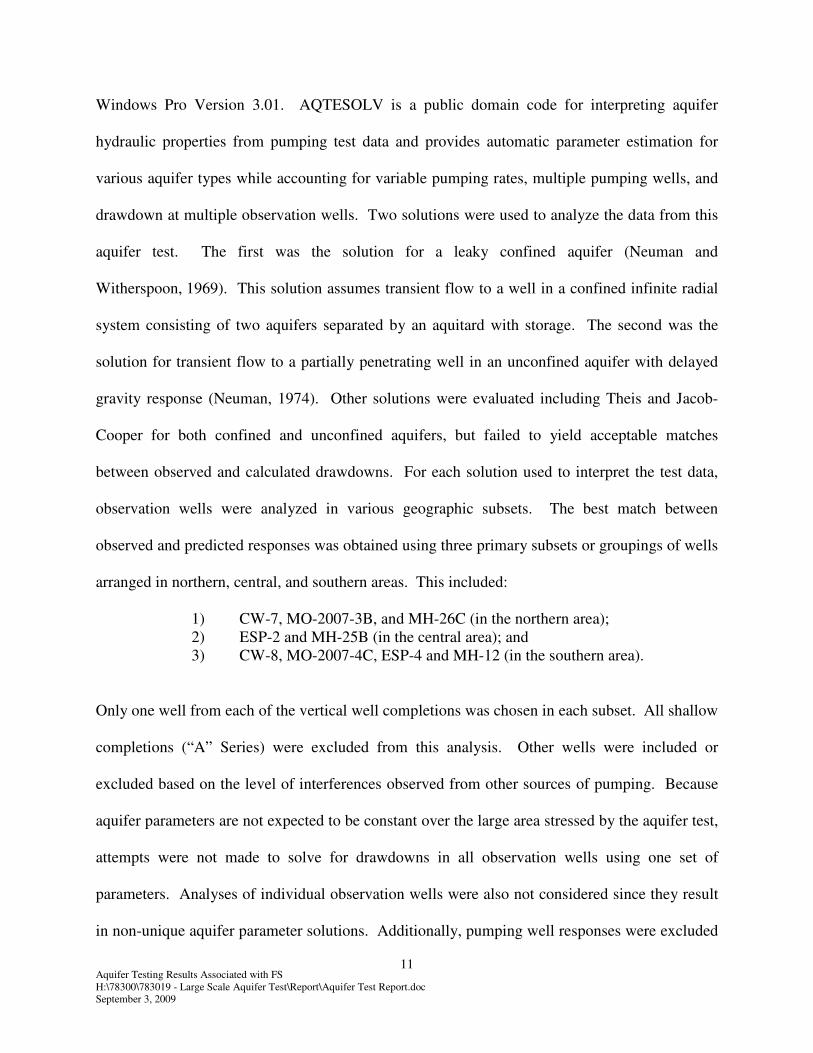
Windows Pro Version 3.01. AQTESOLV is a public domain code for interpreting aquifer
hydraulic properties from pumping test data and provides automatic parameter estimation for
various aquifer types while accounting for variable pumping rates, multiple pumping wells, and
drawdown at multiple observation wells. Two solutions were used to analyze the data from this
aquifer test. The first was the solution for a leaky confined aquifer (Neuman and
Witherspoon, 1969). This solution assumes transient flow to a well in a confined infinite radial
system consisting of two aquifers separated by an aquitard with storage. The second was the
solution for transient flow to a partially penetrating well in an unconfined aquifer with delayed
gravity response (Neuman, 1974). Other solutions were evaluated including Theis and Jacob-
Cooper for both confined and unconfined aquifers, but failed to yield acceptable matches
between observed and calculated drawdowns. For each solution used to interpret the test data,
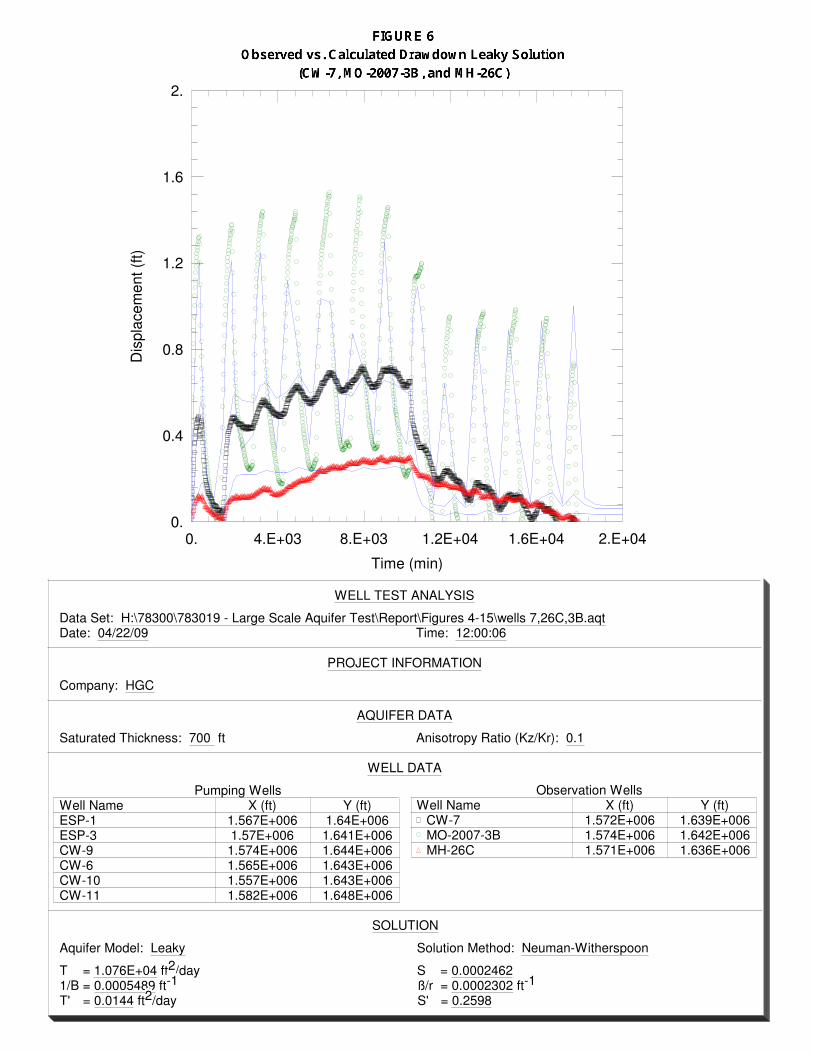
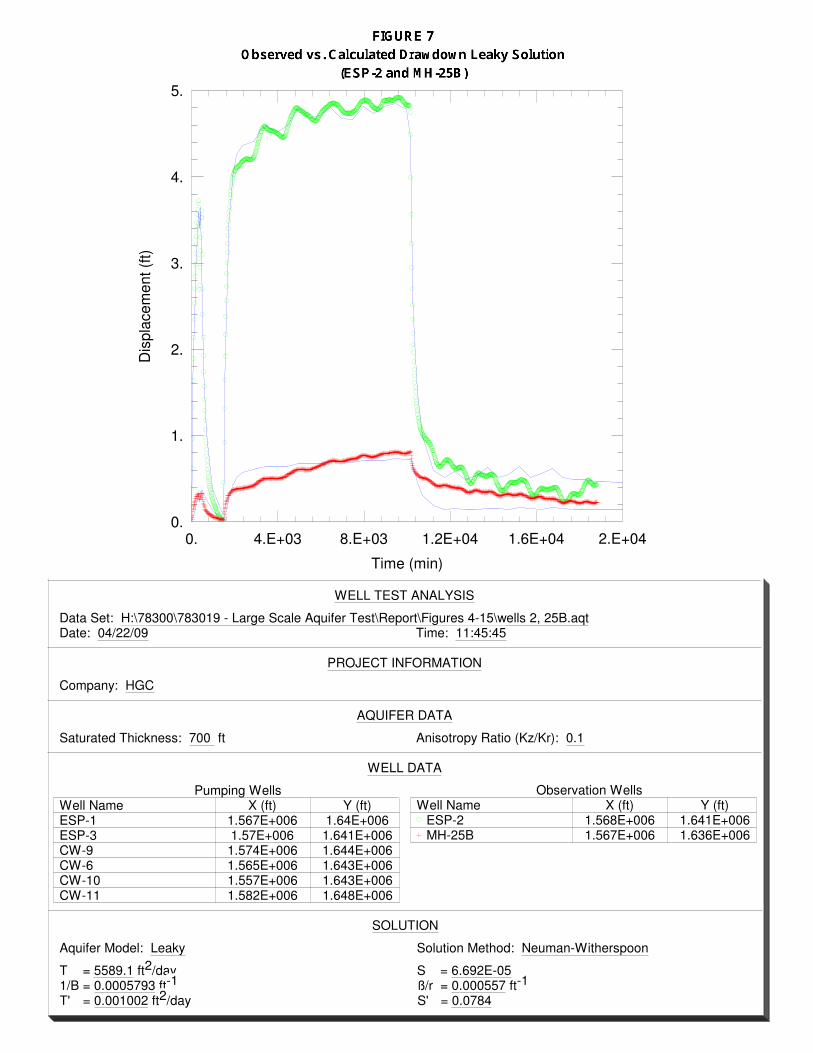
observation wells were analyzed in various geographic subsets. The best match between
observed and predicted responses was obtained using three primary subsets or groupings of wells
arranged in northern, central, and southern areas. This included:
1) CW-7, MO-2007-3B, and MH-26C (in the northern area);
2) ESP-2 and MH-25B (in the central area); and
3) CW-8, MO-2007-4C, ESP-4 and MH-12 (in the southern area).
Only one well from each of the vertical well completions was chosen in each subset. All shallow
completions (“A” Series) were excluded from this analysis. Other wells were included or
excluded based on the level of interferences observed from other sources of pumping. Because
aquifer parameters are not expected to be constant over the large area stressed by the aquifer test,
attempts were not made to solve for drawdowns in all observation wells using one set of
parameters. Analyses of individual observation wells were also not considered since they result
in non-unique aquifer parameter solutions. Additionally, pumping well responses were excluded
Aquifer Testing Results Associated with FS
H:\78300\783019 - Large Scale Aquifer Test\Report\Aquifer Test Report.doc
September 3, 2009
12
from interpretation because well inefficiencies and borehole storage effects make hydraulic
parameter estimates from pumping well data less reliable than from observation well data.
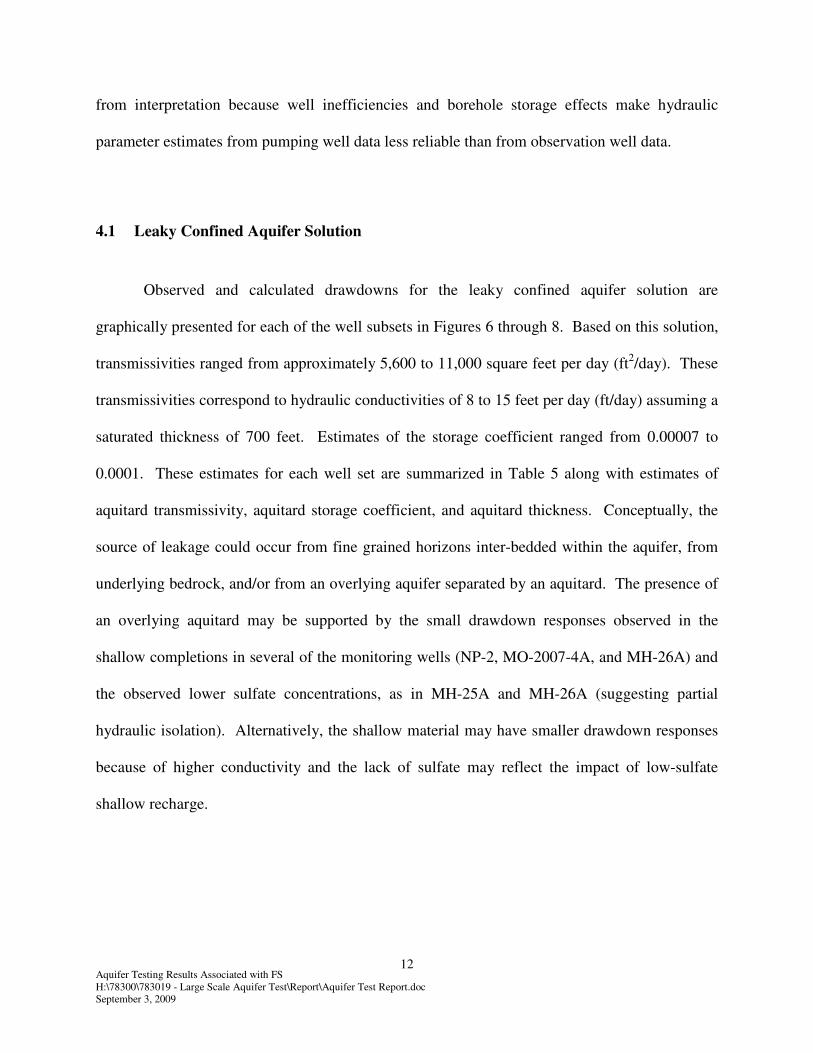
4.1 Leaky Confined Aquifer Solution
Observed and calculated drawdowns for the leaky confined aquifer solution are
graphically presented for each of the well subsets in Figures 6 through 8. Based on this solution,
transmissivities ranged from approximately 5,600 to 11,000 square feet per day (ft2/day). These
transmissivities correspond to hydraulic conductivities of 8 to 15 feet per day (ft/day) assuming a
saturated thickness of 700 feet. Estimates of the storage coefficient ranged from 0.00007 to
0.0001. These estimates for each well set are summarized in Table 5 along with estimates of
aquitard transmissivity, aquitard storage coefficient, and aquitard thickness. Conceptually, the
source of leakage could occur from fine grained horizons inter-bedded within the aquifer, from
underlying bedrock, and/or from an overlying aquifer separated by an aquitard. The presence of
an overlying aquitard may be supported by the small drawdown responses observed in the
shallow completions in several of the monitoring wells (NP-2, MO-2007-4A, and MH-26A) and
the observed lower sulfate concentrations, as in MH-25A and MH-26A (suggesting partial
hydraulic isolation). Alternatively, the shallow material may have smaller drawdown responses
because of higher conductivity and the lack of sulfate may reflect the impact of low-sulfate
shallow recharge.
Aquifer Testing Results Associated with FS
H:\78300\783019 - Large Scale Aquifer Test\Report\Aquifer Test Report.doc
September 3, 2009
13
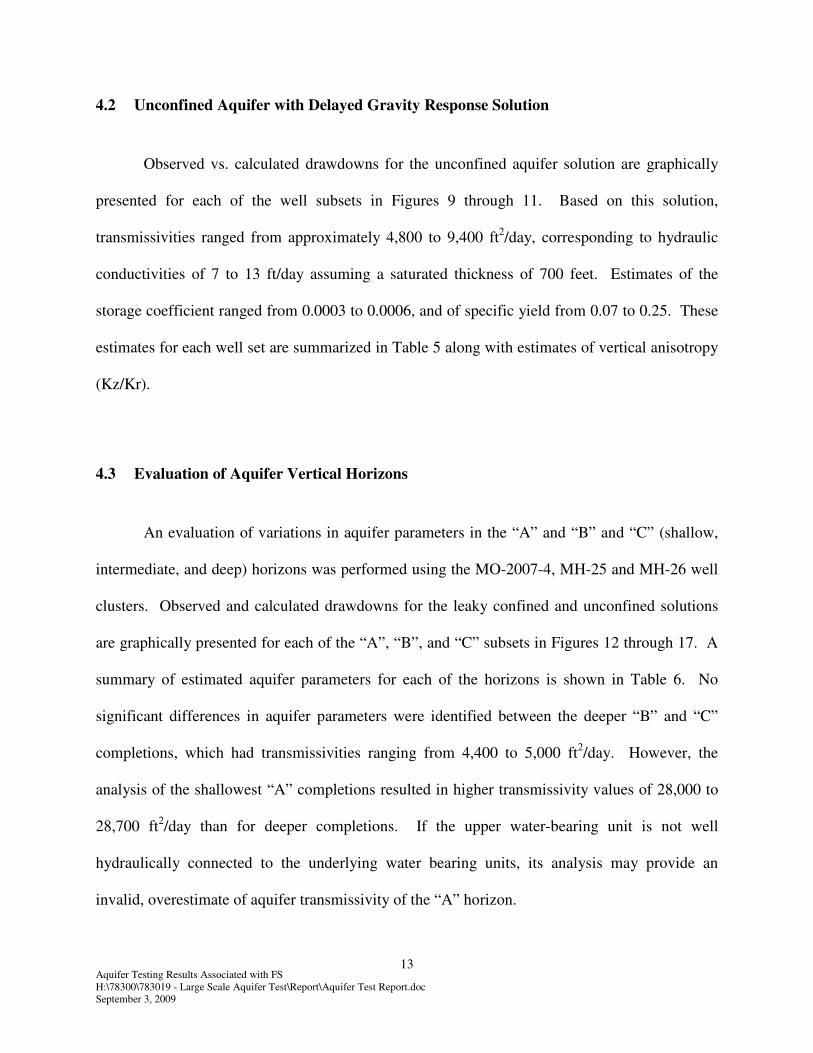
4.2 Unconfined Aquifer with Delayed Gravity Response Solution
Observed vs. calculated drawdowns for the unconfined aquifer solution are graphically
presented for each of the well subsets in Figures 9 through 11. Based on this solution,
transmissivities ranged from approximately 4,800 to 9,400 ft2/day, corresponding to hydraulic
conductivities of 7 to 13 ft/day assuming a saturated thickness of 700 feet. Estimates of the
storage coefficient ranged from 0.0003 to 0.0006, and of specific yield from 0.07 to 0.25. These
estimates for each well set are summarized in Table 5 along with estimates of vertical anisotropy
(Kz/Kr).
4.3 Evaluation of Aquifer Vertical Horizons
An evaluation of variations in aquifer parameters in the “A” and “B” and “C” (shallow,
intermediate, and deep) horizons was performed using the MO-2007-4, MH-25 and MH-26 well
clusters. Observed and calculated drawdowns for the leaky confined and unconfined solutions
are graphically presented for each of the “A”, “B”, and “C” subsets in Figures 12 through 17. A
summary of estimated aquifer parameters for each of the horizons is shown in Table 6. No
significant differences in aquifer parameters were identified between the deeper “B” and “C”
completions, which had transmissivities ranging from 4,400 to 5,000 ft2/day. However, the
analysis of the shallowest “A” completions resulted in higher transmissivity values of 28,000 to
28,700 ft2/day than for deeper completions. If the upper water-bearing unit is not well
hydraulically connected to the underlying water bearing units, its analysis may provide an
invalid, overestimate of aquifer transmissivity of the “A” horizon.

Aquifer Testing Results Associated with FS
H:\78300\783019 - Large Scale Aquifer Test\Report\Aquifer Test Report.doc
September 3, 2009
14
4.4 Comparison to Aquifer Parameters Used in Site Numerical Model
The aquifer test area was within the west central portion of the domain of the site
numerical groundwater flow and transport model (HGC, 2008) as shown in Figure 18. Hydraulic
conductivities used in the model within the test area ranged from approximately 6 ft/day to 88
ft/day. Most of the pumping and observation wells were within areas of the model having
hydraulic conductivities ranging from approximately 6 ft/day to 39 ft/day. The highest model
conductivities, ranging from approximately 39 to 88 ft/day, are within a partially isolated zone
centered approximately on the MH-26 well nest. ESP-3 and the MH-25 well nest border this
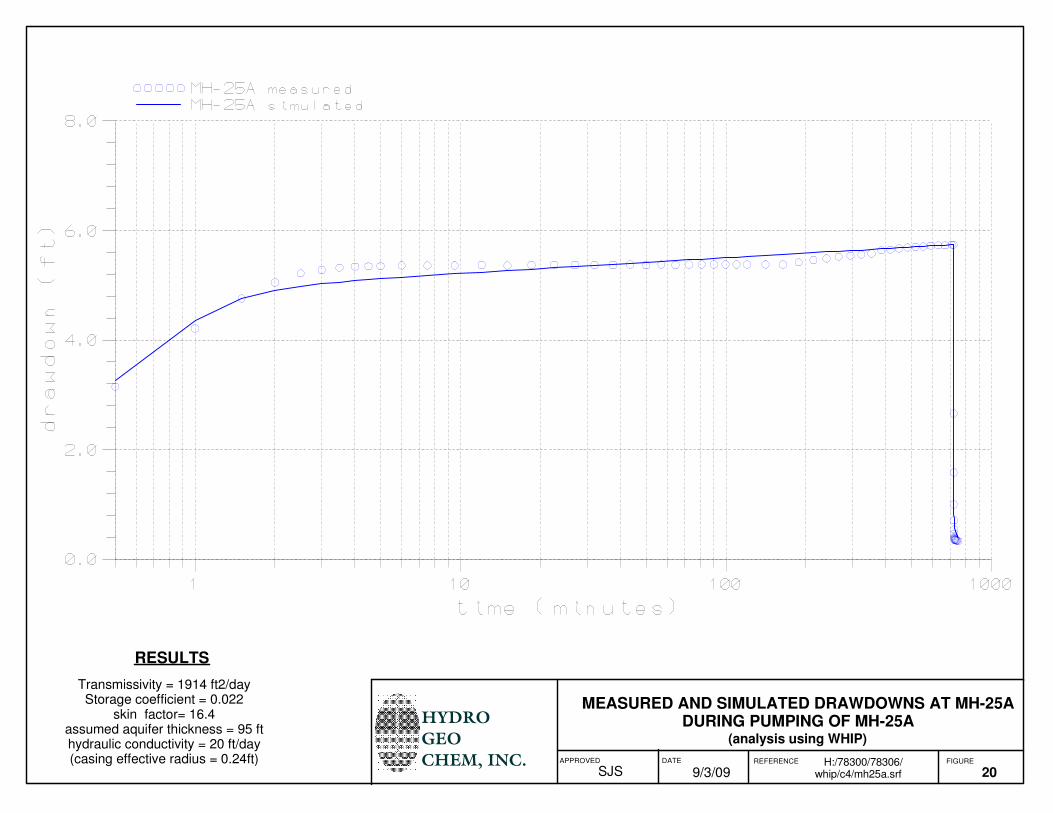
higher conductivity zone. Hydraulic conductivities of 91 ft/day and 20 ft/day were estimated by
HGC from test data collected at MH-26A and MH-25A, respectively, during constant rate
pumping tests conducted by Errol L. Montgomery and Associates (ELMA, 2006) as shown in
Figures 19 and 20. The specific yields used in the model within the area of the test vary from
approximately 0.125 to 0.2, and storage coefficient is constant at 0.0001.
Overall, the range of hydraulic conductivities derived from the test (ranging from 6 to 41
ft/day) are similar to those used in the model. However, if the results obtained from the shallow
screened (“A” series) observation wells are excluded, the test conductivities range from 6 to 15
ft/day, and fall within the lower range of conductivities used in the site numerical model. As
discussed in Section 4.3, conductivity estimates from the “A” series well data are not considered
as reliable as estimates from the “B” and “C” series well data. Storage coefficients and specific
yields derived from the test are similar to those used in the numerical model.

Aquifer Testing Results Associated with FS
H:\78300\783019 - Large Scale Aquifer Test\Report\Aquifer Test Report.doc
September 3, 2009
15
5. DISCUSSION AND CONCLUSIONS
Hydraulic conductivities derived from the aquifer test range from 6 to 41 ft/day, storage
coefficients range from 7.0 x 10⁻⁵
to 6.1 x 10⁻⁴
, and specific yields range from 0.07 to 0.25. The
estimated storage properties of the aquifer are typical of semi-confined to unconfined conditions.
The ability of the Neuman and Witherspoon (1969) confined leaky aquifer and Neuman (1974)
unconfined aquifer solutions, to provide interpretations of near equal quality, suggests that
aquifer behavior is between confined and unconfined conditions.
Hydraulic conductivities derived from the aquifer test (ranging from 6 to 41 ft/day) are
similar to those used in the site numerical groundwater flow and transport model, which ranged
from approximately 6 to 88 ft/day within the portion of the model corresponding to the test area
(Figure 18). However, the results of the aquifer test considered the most reliable ranged from
approximately 6.3 to 15 ft/day, and fall within the low end of the range used in the model. This
range is based on data derived from well completed in the “B” and “C” horizons representing
intermediate and deep levels in the basin fill aquifer. The hydraulic properties of the “B” and
“C” horizons are likely representative of the bulk of the aquifer material encompassing the
sulfate plume.
Direct comparison of test-derived and model-derived hydraulic conductivities is
complicated by the inability of the analytical solutions used in interpreting the test data to
account for lateral heterogeneity and boundaries. These conditions are represented in the
numerical model. For the aquifer test to characterize some of the large-scale heterogeneities
Aquifer Testing Results Associated with FS
H:\78300\783019 - Large Scale Aquifer Test\Report\Aquifer Test Report.doc
September 3, 2009
16
represented in the model, the test would require the use of more widely distributed pumping
wells, higher pumping rates, or a longer pumping duration. As an example, to identify and
characterize the partially isolated high conductivity zone defined by conductivities of 88 ft/day in
the model would require both pumping and observation wells to be located within this zone.
While the MH-26 well nest is located within this model zone, the pumping wells ESP-1 and
ESP-3 are not. Furthermore, when using the analytical solutions, the aquifer must be represented
as having a constant thickness but the site numerical model accounts for the thinning and
pinching out of the aquifer westward from the pumping wells. Although these heterogeneities
and boundaries likely have a relatively small impact on the ability of the analytical solutions to
predict average aquifer properties, the model-derived properties are based on fewer assumptions
and have the advantage of a long calibration time period.
Overall, the results of the aquifer testing indicate that the aquifer properties used in the
model are reasonable. If the highest model conductivity is excluded and the test-derived
conductivities from the “A” series wells are included, the model-derived and test-derived
conductivity ranges are nearly identical. Because the model conductivities are on average
higher, use of the model to predict capture will be conservative in that capture effectiveness is
more likely to be under- rather than over-predicted. Use of the model is, therefore, likely to
result in an effective capture wellfield design.

Aquifer Testing Results Associated with FS
H:\78300\783019 - Large Scale Aquifer Test\Report\Aquifer Test Report.doc
September 3, 2009
17
6. REFERENCES
Errol L. Montgomery & Associates (ELMA). 2006. Unpublished Pumping Test Data for
MH-13, MH-25, and MH-26.
HGC. 2007. Focused Feasibility Study for the Northern Portion of the Interceptor Wellfield,
Phelps Dodge Sierrita Tailings Impoundment, Mitigation Order on Consent Docket
No. P-50-06. December 28, 2007.
HGC. 2008a. Feasibility Study for Sulfate with Respect to Drinking Water Supplies in the
Vicinity of the Phelps Dodge Sierrita, Inc. Mine Tailing Impoundment, Mitigation Order
on Consent Docket No. P-50-06. October 22, 2008.
HGC. 2008b. Forth Quarter 2008 Groundwater Monitoring Report, Task 2.2 of Aquifer
Characterization Plan. Mitigation Order on Consent Docket No. P-50-06.
December 18, 2008.
HGC. 2009. Field Operations Plan for Aquifer Testing Associated with Feasibility Studies
Sierrita Tailing Impoundment. Mitigation Order on Consent Docket No. P-50-06.
February 11, 2009.
Neuman, S.P. and P.A. Witherspoon. 1969. Theory of Flow in a Confined Two Aquifer System,
Water Resources Research, Vol. 5, No. 4, pp 803-816.
Neuman, S. P. 1974. Effect of Partial Penetration on Flow in Unconfined Aquifers Considering
Delay Gravity Response, Water Resources Research, Vol. 10, No. 2, pp 303-312.

Aquifer Testing Results Associated with FS
H:\78300\783019 - Large Scale Aquifer Test\Report\Aquifer Test Report.doc
September 3, 2009
18
Aquifer Testing Results Associated with FS
H:\78300\783019 - Large Scale Aquifer Test\Report\Aquifer Test Report.doc
September 3, 2009
19
7. LIMITATIONS
The information and conclusions presented in this report are based upon the scope of
services and information obtained through the performance of the services, as agreed upon by
HGC and the party for whom this report was originally prepared. Results of any investigations,
tests, or findings presented in this report apply solely to conditions existing at the time HGC’s
investigative work was performed and are inherently based on and limited to the available data
and the extent of the investigation activities. No representation, warranty, or guarantee, express
or implied, is intended or given. HGC makes no representation as to the accuracy or
completeness of any information provided by other parties not under contract to HGC to the
extent that HGC relied upon that information. This report is expressly for the sole and exclusive
use of the party for whom this report was originally prepared and for the particular purpose that
it was intended. Reuse of this report, or any portion thereof, for other than its intended purpose,
or if modified, or if used by third parties, shall be at the sole risk of the user.

Aquifer Testing Results Associated with FS
H:\78300\783019 - Large Scale Aquifer Test\Report\Aquifer Test Report.doc
September 3, 2009
20

TABLES
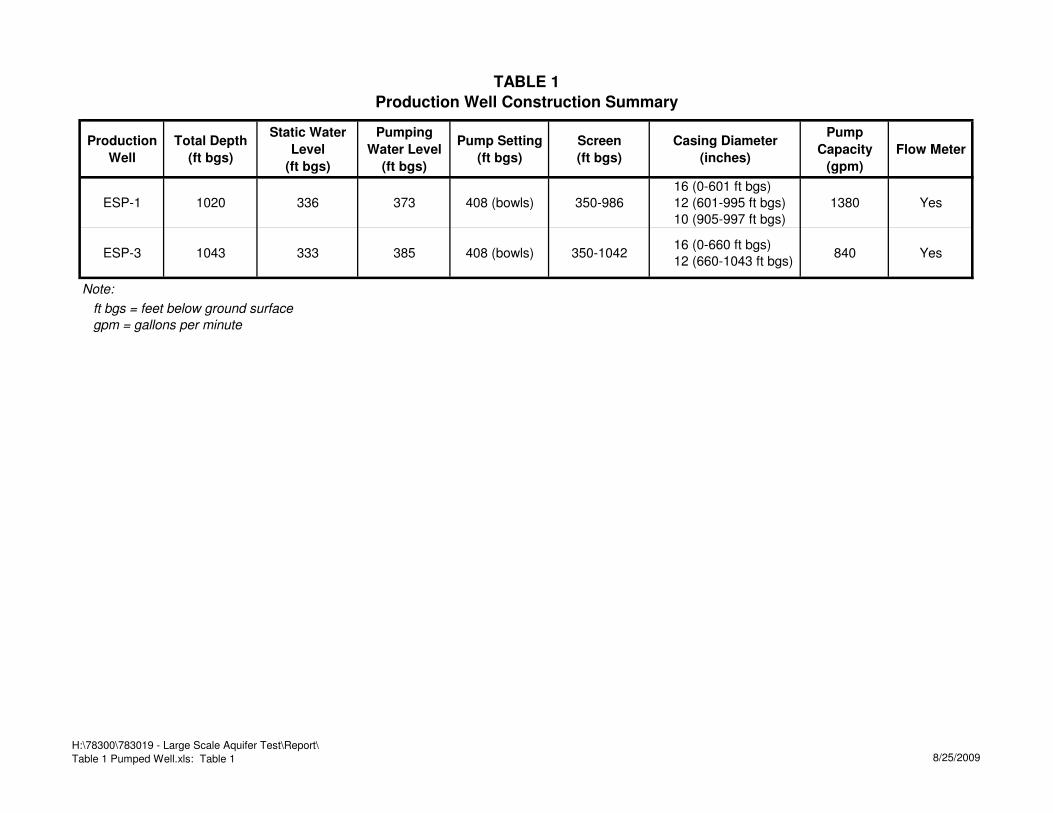
TABLE 1
Production Well Construction Summary
Production
Well
Total Depth
(ft bgs)
Static Water
Level
(ft bgs)
Pumping
Water Level
(ft bgs)
Pump Setting
(ft bgs)
Screen
(ft bgs)
Casing Diameter
(inches)
Pump
Capacity
(gpm)
Flow Meter
ESP-1 1020 336 373 408 (bowls) 350-98616 (0-601 ft bgs)12 (601-995 ft bgs)10 (905-997 ft bgs)
1380 Yes
ESP-3 1043 333 385 408 (bowls) 350-104216 (0-660 ft bgs)12 (660-1043 ft bgs)
840 Yes
Note:
ft bgs = feet below ground surface
gpm = gallons per minute
H:\78300\783019 - Large Scale Aquifer Test\Report\
Table 1 Pumped Well.xls: Table 1 8/25/2009
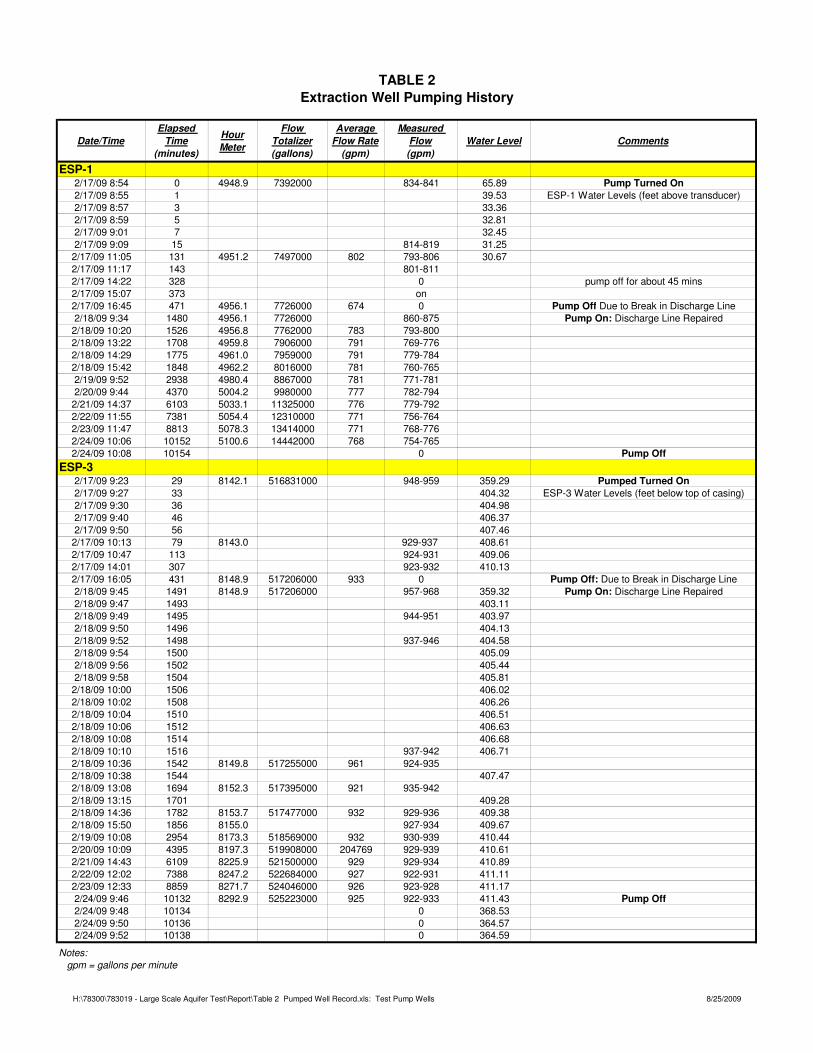
TABLE 2
Extraction Well Pumping History
Date/Time
Elapsed
Time
(minutes)
Hour
Meter
Flow
Totalizer
(gallons)
Average
Flow Rate
(gpm)
Measured
Flow
(gpm)
Water Level Comments
ESP-12/17/09 8:54 0 4948.9 7392000 834-841 65.89 Pump Turned On2/17/09 8:55 1 39.53 ESP-1 Water Levels (feet above transducer)2/17/09 8:57 3 33.362/17/09 8:59 5 32.812/17/09 9:01 7 32.452/17/09 9:09 15 814-819 31.252/17/09 11:05 131 4951.2 7497000 802 793-806 30.672/17/09 11:17 143 801-8112/17/09 14:22 328 0 pump off for about 45 mins2/17/09 15:07 373 on2/17/09 16:45 471 4956.1 7726000 674 0 Pump Off Due to Break in Discharge Line2/18/09 9:34 1480 4956.1 7726000 860-875 Pump On: Discharge Line Repaired2/18/09 10:20 1526 4956.8 7762000 783 793-8002/18/09 13:22 1708 4959.8 7906000 791 769-7762/18/09 14:29 1775 4961.0 7959000 791 779-7842/18/09 15:42 1848 4962.2 8016000 781 760-7652/19/09 9:52 2938 4980.4 8867000 781 771-7812/20/09 9:44 4370 5004.2 9980000 777 782-7942/21/09 14:37 6103 5033.1 11325000 776 779-7922/22/09 11:55 7381 5054.4 12310000 771 756-7642/23/09 11:47 8813 5078.3 13414000 771 768-7762/24/09 10:06 10152 5100.6 14442000 768 754-7652/24/09 10:08 10154 0 Pump Off
ESP-32/17/09 9:23 29 8142.1 516831000 948-959 359.29 Pumped Turned On2/17/09 9:27 33 404.32 ESP-3 Water Levels (feet below top of casing)2/17/09 9:30 36 404.982/17/09 9:40 46 406.372/17/09 9:50 56 407.462/17/09 10:13 79 8143.0 929-937 408.612/17/09 10:47 113 924-931 409.062/17/09 14:01 307 923-932 410.132/17/09 16:05 431 8148.9 517206000 933 0 Pump Off: Due to Break in Discharge Line2/18/09 9:45 1491 8148.9 517206000 957-968 359.32 Pump On: Discharge Line Repaired2/18/09 9:47 1493 403.112/18/09 9:49 1495 944-951 403.972/18/09 9:50 1496 404.132/18/09 9:52 1498 937-946 404.582/18/09 9:54 1500 405.092/18/09 9:56 1502 405.442/18/09 9:58 1504 405.812/18/09 10:00 1506 406.022/18/09 10:02 1508 406.262/18/09 10:04 1510 406.512/18/09 10:06 1512 406.632/18/09 10:08 1514 406.682/18/09 10:10 1516 937-942 406.712/18/09 10:36 1542 8149.8 517255000 961 924-9352/18/09 10:38 1544 407.472/18/09 13:08 1694 8152.3 517395000 921 935-9422/18/09 13:15 1701 409.282/18/09 14:36 1782 8153.7 517477000 932 929-936 409.382/18/09 15:50 1856 8155.0 927-934 409.672/19/09 10:08 2954 8173.3 518569000 932 930-939 410.442/20/09 10:09 4395 8197.3 519908000 204769 929-939 410.612/21/09 14:43 6109 8225.9 521500000 929 929-934 410.892/22/09 12:02 7388 8247.2 522684000 927 922-931 411.112/23/09 12:33 8859 8271.7 524046000 926 923-928 411.172/24/09 9:46 10132 8292.9 525223000 925 922-933 411.43 Pump Off2/24/09 9:48 10134 0 368.532/24/09 9:50 10136 0 364.572/24/09 9:52 10138 0 364.59
Notes:
gpm = gallons per minute
H:\78300\783019 - Large Scale Aquifer Test\Report\Table 2 Pumped Well Record.xls: Test Pump Wells 8/25/2009
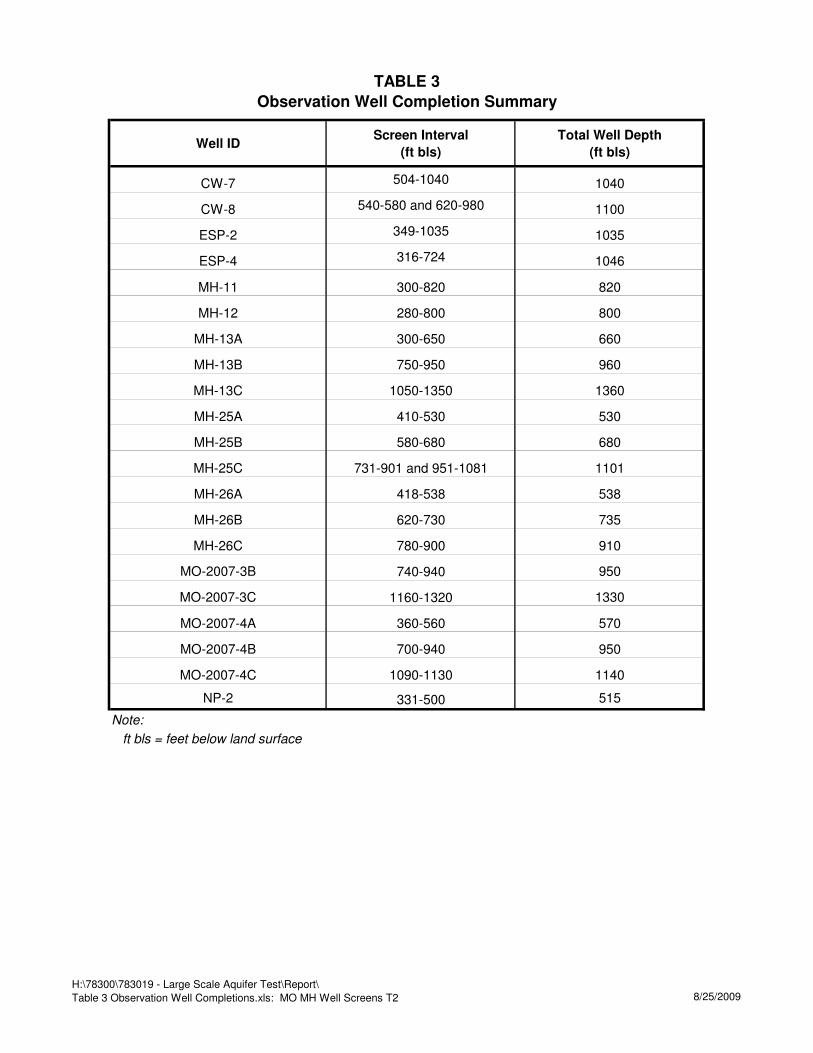
TABLE 3
Observation Well Completion Summary
Well IDScreen Interval
(ft bls)
Total Well Depth
(ft bls)
CW-7 504-1040 1040
CW-8 540-580 and 620-980 1100
ESP-2 349-1035 1035
ESP-4 316-724 1046
MH-11 300-820 820
MH-12 280-800 800
MH-13A 300-650 660
MH-13B 750-950 960
MH-13C 1050-1350 1360
MH-25A 410-530 530
MH-25B 580-680 680
MH-25C 731-901 and 951-1081 1101
MH-26A 418-538 538
MH-26B 620-730 735
MH-26C 780-900 910
MO-2007-3B 740-940 950
MO-2007-3C 1160-1320 1330
MO-2007-4A 360-560 570
MO-2007-4B 700-940 950
MO-2007-4C 1090-1130 1140
NP-2 331-500 515
Note:
ft bls = feet below land surface
H:\78300\783019 - Large Scale Aquifer Test\Report\
Table 3 Observation Well Completions.xls: MO MH Well Screens T2 8/25/2009
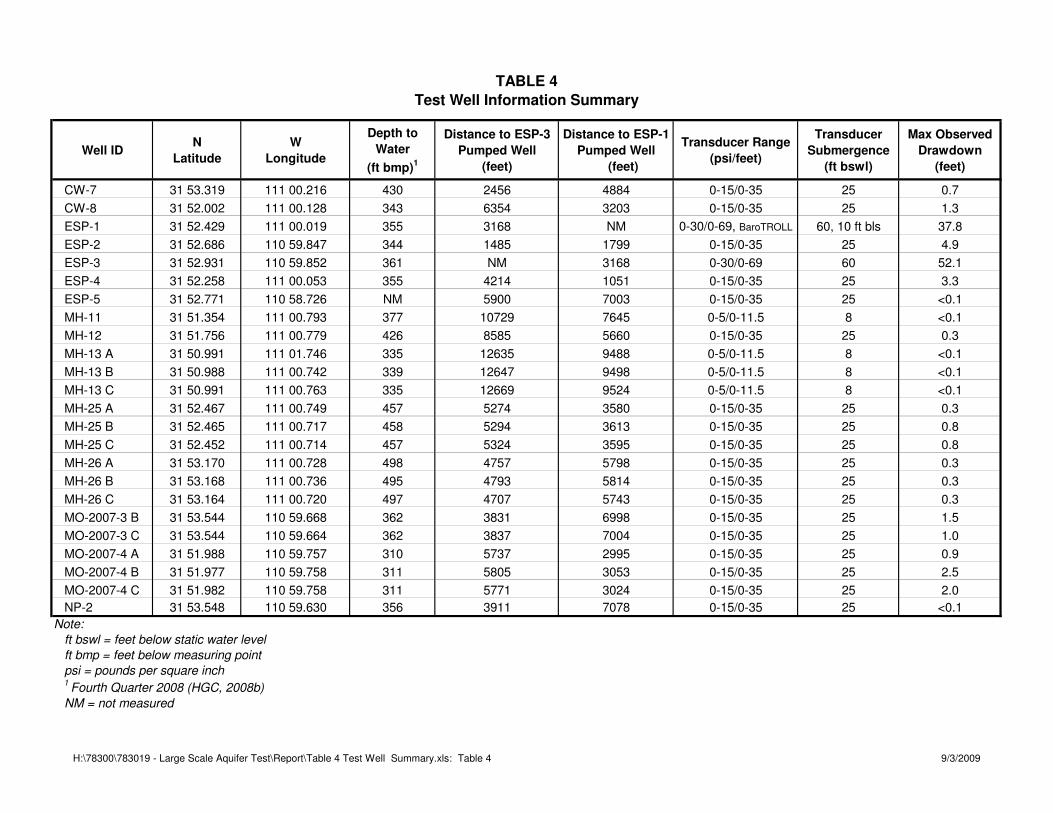
TABLE 4
Test Well Information Summary
Well IDN
Latitude
W
Longitude
Depth to
Water
(ft bmp)1
Distance to ESP-3
Pumped Well
(feet)
Distance to ESP-1
Pumped Well
(feet)
Transducer Range
(psi/feet)
Transducer
Submergence
(ft bswl)
Max Observed
Drawdown
(feet)
CW-7 31 53.319 111 00.216 430 2456 4884 0-15/0-35 25 0.7
CW-8 31 52.002 111 00.128 343 6354 3203 0-15/0-35 25 1.3
ESP-1 31 52.429 111 00.019 355 3168 NM 0-30/0-69, BaroTROLL 60, 10 ft bls 37.8
ESP-2 31 52.686 110 59.847 344 1485 1799 0-15/0-35 25 4.9
ESP-3 31 52.931 110 59.852 361 NM 3168 0-30/0-69 60 52.1
ESP-4 31 52.258 111 00.053 355 4214 1051 0-15/0-35 25 3.3
ESP-5 31 52.771 110 58.726 NM 5900 7003 0-15/0-35 25 <0.1
MH-11 31 51.354 111 00.793 377 10729 7645 0-5/0-11.5 8 <0.1
MH-12 31 51.756 111 00.779 426 8585 5660 0-15/0-35 25 0.3
MH-13 A 31 50.991 111 01.746 335 12635 9488 0-5/0-11.5 8 <0.1
MH-13 B 31 50.988 111 00.742 339 12647 9498 0-5/0-11.5 8 <0.1
MH-13 C 31 50.991 111 00.763 335 12669 9524 0-5/0-11.5 8 <0.1
MH-25 A 31 52.467 111 00.749 457 5274 3580 0-15/0-35 25 0.3
MH-25 B 31 52.465 111 00.717 458 5294 3613 0-15/0-35 25 0.8
MH-25 C 31 52.452 111 00.714 457 5324 3595 0-15/0-35 25 0.8
MH-26 A 31 53.170 111 00.728 498 4757 5798 0-15/0-35 25 0.3
MH-26 B 31 53.168 111 00.736 495 4793 5814 0-15/0-35 25 0.3
MH-26 C 31 53.164 111 00.720 497 4707 5743 0-15/0-35 25 0.3
MO-2007-3 B 31 53.544 110 59.668 362 3831 6998 0-15/0-35 25 1.5
MO-2007-3 C 31 53.544 110 59.664 362 3837 7004 0-15/0-35 25 1.0
MO-2007-4 A 31 51.988 110 59.757 310 5737 2995 0-15/0-35 25 0.9
MO-2007-4 B 31 51.977 110 59.758 311 5805 3053 0-15/0-35 25 2.5
MO-2007-4 C 31 51.982 110 59.758 311 5771 3024 0-15/0-35 25 2.0
NP-2 31 53.548 110 59.630 356 3911 7078 0-15/0-35 25 <0.1
Note:
ft bswl = feet below static water level
ft bmp = feet below measuring point
psi = pounds per square inch1Fourth Quarter 2008 (HGC, 2008b)
NM = not measured
H:\78300\783019 - Large Scale Aquifer Test\Report\Table 4 Test Well Summary.xls: Table 4 9/3/2009

TABLE 5
Summary of Aquifer Parameter Estimates
(geographical subsets)
Well Subset -CW-7,
MO-2007-3B, MH-26C
ESP-2, MH-25B
CW-8, MO-2007-4C,
ESP-4, MW-12
CW-7, MO-2007-3B,
MH-26CESP-2, MH-25B
CW-8, MO-2007-4C,
ESP-4, MW-12
Aquifer Transmissivity (ft2/day) - 10,800 5,600 10,000 9,400 4,800 9,000
Assumed Saturated Thickness (feet) - 700 700 700 700 700 700
Hydraulic Conductivity (ft/day) - 15.4 8.0 14.3 13.4 6.9 12.9
Aquifer Storage Coefficient (dimensionless) - 0.00025 0.00007 0.00015 0.00039 0.00031 0.00061
Aquitard Transmissivity (ft2/day) - 0.014 0.001 0.001 - - -
Aquitard Storage Coefficient (dimensionless) - 0.26 0.078 0.068 - - -
*Aquitard Thickness (feet) - 1.9 9.4 21.5 - - -
Specific Yield (dimensionless) - - - - 0.254 0.087 0.071
Kz/Kr (dimensionless) - - - - 0.06 0.06 0.03
Neuman-Witherspoon Leaky Confined
Aquifer Solution
Neuman Unconfined Aquifer with Gravity
Drainage Solution
H:\78300\783019 - Large Scale Aquifer Test\Report\Table 5 Aquifer Para.xls: Table 5 8/25/2009
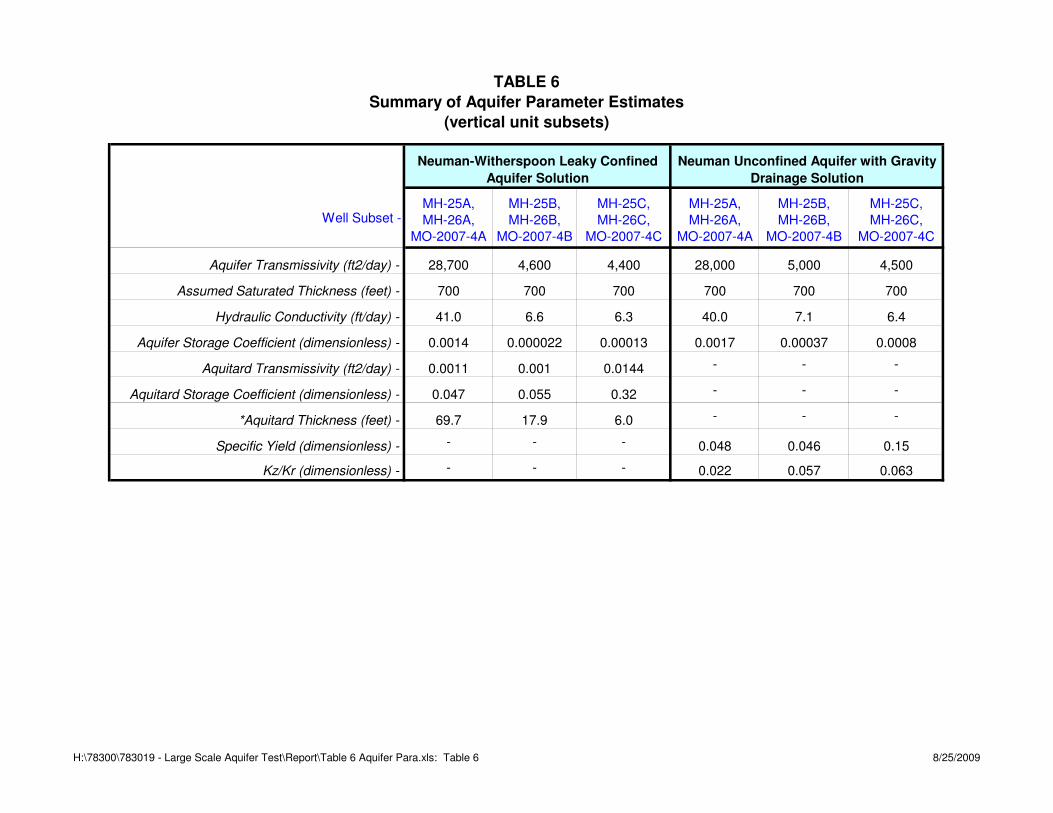
TABLE 6
Summary of Aquifer Parameter Estimates
(vertical unit subsets)
Well Subset -MH-25A, MH-26A,
MO-2007-4A
MH-25B, MH-26B,
MO-2007-4B
MH-25C, MH-26C,
MO-2007-4C
MH-25A, MH-26A,
MO-2007-4A
MH-25B, MH-26B,
MO-2007-4B
MH-25C, MH-26C,
MO-2007-4C
Aquifer Transmissivity (ft2/day) - 28,700 4,600 4,400 28,000 5,000 4,500
Assumed Saturated Thickness (feet) - 700 700 700 700 700 700
Hydraulic Conductivity (ft/day) - 41.0 6.6 6.3 40.0 7.1 6.4
Aquifer Storage Coefficient (dimensionless) - 0.0014 0.000022 0.00013 0.0017 0.00037 0.0008
Aquitard Transmissivity (ft2/day) - 0.0011 0.001 0.0144 - - -
Aquitard Storage Coefficient (dimensionless) - 0.047 0.055 0.32 - - -
*Aquitard Thickness (feet) - 69.7 17.9 6.0 - - -
Specific Yield (dimensionless) - - - - 0.048 0.046 0.15
Kz/Kr (dimensionless) - - - - 0.022 0.057 0.063
Neuman-Witherspoon Leaky Confined
Aquifer Solution
Neuman Unconfined Aquifer with Gravity
Drainage Solution
H:\78300\783019 - Large Scale Aquifer Test\Report\Table 6 Aquifer Para.xls: Table 6 8/25/2009

FIGURES
Approved Date Author Date File Name Figure
HYDRO
GEO
CHEM, INC.
���!(!(
!(
!(
!(
!(
!(
!(
!(
!(
!(
!(
!(
!(
!(
!(
!(
!(
!(
!(
!(
!(
!(
h
h
�
�
�
�
�
�
�
�
�
�
���� ��
��
�
�
ESP-1
ESP-3
IW-1
IW-10
IW-11
IW-12
IW-13
IW-14
IW-15
IW-16
IW-17
IW-18
IW-19
IW-2
IW-20
IW-21
IW-22
IW-23
IW-24
IW-3A
IW-4
IW-5
IW-6A
IW-8
IW-9
FFS-11000 GPM
FFS-2900 GPM
FFS-3850 GPM
FFS-4900 GPM
FFS-5900 GPM
FFS-6900 GPM
SC-1400 GPM
SC-2400 GPM
SC-3400 GPM
SC-4400 GPM
PS-1600 GPM
PS-2600 GPM
PS-4500 GPM
MC-1750 GPM
MC-2750 GPM
PS-3600 GPM
Legend
� Proposed Focused Feasibility Study Well
� Proposed Source Control Well
�D Proposed Plume Stabilization Well
� Proposed Mass Capture Well
!( Interceptor Well
h Pumping Well
State Land Boundary
PROPOSED FEASIBILITY STUDY(ALTERNATIVE 5) EXTRACTION WELL LOCATIONS
78310125G08/25/09MWK 108/25/09AMC
PROJECTION: UTM Zone 12N NAD83 $
IW PumpStation
0 1750 3500 Feet
AREA WITHINTERPRETABLERESPONSE TOPUMPING ATESP-1 & ESP-3

Approved Date Author Date File Name Figure
HYDRO
GEO
CHEM, INC.
!
!
!
!
!
!
!
!
!
!!
!
!
!
!
!
!
!
!
!
!
!
!!!
!!!
!!!
!!
!!!
!
CW-7
CW-8
ESP-2
ESP-4
ESP-5
MH-11
MH-12
MH-13A, 13B, 13C
MH-25A, 25B, 25C
MH-26A, 26B, 26C
MO-2007-4A, 4B, 4C
NP-2, MO-2007-3B, 3C
ESP-1
ESP-3
1350
C-4
CC of GV
CW-10
CW-3
CW-6
CW-9
E-5A
E-6
Haven Golf
M-20
MO-2007-5B, 5CLegend
! Monitoring Well
! Pumping Well
! Other Existing Well
AQUIFER TEST WELL LOCATIONS
78310126G08/25/09MWK 208/25/09AMC
PROJECTION: UTM Zone 12N, NAD 83
0 1,000 2,000 Feet
$

H:\78300\783019 - Large Scale Aquifer Test\Field Data\Final Aquifer Test Data\Flow Rate Plot.xls: Flow Rate
0
500
1000
1500
2000
2500
31-J
an
5-Feb
10-F
eb
15-F
eb
20-F
eb
25-F
eb
2-M
ar
Date
Pu
mp
Rate
(g
all
on
s p
er
min
ute
)
ESP-1 ESP-3 CW-6
CW-9 CW-10 CW-11
EXTRACTION WELL PUMPING RATE
VS. TIME
HYDRO
GEO
CHEM, INC. Approved FigureDateAuthorDate File Name
MWK 5/28/09 3Flow Rate5/28/09AMC

H:\78300\783019 - Large Scale Aquifer Test\Field Data\Final Aquifer Test Data\ESP--1, Pumping Well 2009-03-02 15.25.34.xls: Figure 4
0
10
20
30
40
50
60
0 2000 4000 6000 8000 10000 12000 14000 16000 18000 20000
Elapsed Time (minutes)
Dra
wd
ow
n (
feet)
ESP-1 ESP-3 PUMPED WELLS (ESP-1 AND ESP-3)
DRAWDOWN VS. ELAPSED TIME
HYDRO
GEO
CHEM, INC. Approved FigureDateAuthorDate File Name
MWK 4/16/09 4Figure 44/16/09MWK

H:\78300\783019 - Large Scale Aquifer Test\Field Data\Final Aquifer Test Data\New Fig 5\Obs Well_Drawdown.xls: Figure 5
-0.5
0.5
1.5
2.5
3.5
4.5
5.5
2-Feb 7-Feb 12-Feb 17-Feb 22-Feb 27-Feb
Date
Ch
an
ge
in
Wa
ter
Le
ve
l w
ith
Re
sp
ec
t to
Re
fere
nc
e L
ev
el (F
ee
t)
CW-7 CW-8 ESP-2 ESP-4
MH-12 MH-25A MH-25B MH-25C
MH-26A MH-26C MO-2007-3B MO-2007-3C
MO-2007-4A MO-2007-4B MO-2007-4C
CHANGE IN WATER LEVEL AT
OBSERVATION WELLS VS. ELAPSED TIME
HYDRO
GEO
CHEM, INC. Approved FigureDateAuthorDate File MWK 5/26/09 5Obs well_drawdown5/26/09MWK
End of Pumping at
ESP-1 and ESP-3
(2/24/09)
Start of Pumping at
ESP-1 and ESP-3
(2/17/09)
Pumping Duration
(10,100 minutes)
REFERENCE WATER LEVEL = Water Level at Start of Pumping
at ESP-1 and ESP-3 (2/17/09)
0. 4.E+03 8.E+03 1.2E+04 1.6E+04 2.E+040.
0.4
0.8
1.2
1.6
2.
Time (min)
Dis
pla
cem
ent (f
t)
WELL TEST ANALYSIS
Data Set: H:\78300\783019 - Large Scale Aquifer Test\Report\Figures 4-15\wells 7,26C,3B.aqtDate: 04/22/09 Time: 12:00:06
PROJECT INFORMATION
Company: HGC
AQUIFER DATA
Saturated Thickness: 700 ft Anisotropy Ratio (Kz/Kr): 0.1
WELL DATA
Pumping WellsWell Name X (ft) Y (ft)ESP-1 1.567E+006 1.64E+006ESP-3 1.57E+006 1.641E+006CW-9 1.574E+006 1.644E+006CW-6 1.565E+006 1.643E+006CW-10 1.557E+006 1.643E+006CW-11 1.582E+006 1.648E+006
Observation WellsWell Name X (ft) Y (ft)
CW-7 1.572E+006 1.639E+006MO-2007-3B 1.574E+006 1.642E+006MH-26C 1.571E+006 1.636E+006
SOLUTION
Aquifer Model: Leaky Solution Method: Neuman-Witherspoon
T = 1.076E+04 ft2/day S = 0.00024621/B = 0.0005489 ft-1 ß/r = 0.0002302 ft-1
T' = 0.0144 ft2/day S' = 0.2598
0. 4.E+03 8.E+03 1.2E+04 1.6E+04 2.E+040.
1.
2.
3.
4.
5.
Time (min)
Dis
pla
cem
ent (f
t)
WELL TEST ANALYSIS
Data Set: H:\78300\783019 - Large Scale Aquifer Test\Report\Figures 4-15\wells 2, 25B.aqtDate: 04/22/09 Time: 11:45:45
PROJECT INFORMATION
Company: HGC
AQUIFER DATA
Saturated Thickness: 700 ft Anisotropy Ratio (Kz/Kr): 0.1
WELL DATA
Pumping WellsWell Name X (ft) Y (ft)ESP-1 1.567E+006 1.64E+006ESP-3 1.57E+006 1.641E+006CW-9 1.574E+006 1.644E+006CW-6 1.565E+006 1.643E+006CW-10 1.557E+006 1.643E+006CW-11 1.582E+006 1.648E+006
Observation WellsWell Name X (ft) Y (ft)
ESP-2 1.568E+006 1.641E+006MH-25B 1.567E+006 1.636E+006
SOLUTION
Aquifer Model: Leaky Solution Method: Neuman-Witherspoon
T = 5589.1 ft2/day S = 6.692E-051/B = 0.0005793 ft-1 ß/r = 0.000557 ft-1
T' = 0.001002 ft2/day S' = 0.0784

0. 4.E+03 8.E+03 1.2E+04 1.6E+04 2.E+040.
0.8
1.6
2.4
3.2
4.
Time (min)
Dis
pla
cem
ent (f
t)
WELL TEST ANALYSIS
Data Set: H:\78300\783019 - Large Scale Aquifer Test\Report\Figures 4-15\wells 8,4C,4,12.aqtDate: 04/22/09 Time: 12:11:18
PROJECT INFORMATION
Company: HGC
AQUIFER DATA
Saturated Thickness: 700 ft Anisotropy Ratio (Kz/Kr): 0.1
WELL DATA
Pumping WellsWell Name X (ft) Y (ft)ESP-1 1.567E+006 1.64E+006ESP-3 1.57E+006 1.641E+006CW-9 1.574E+006 1.644E+006CW-6 1.565E+006 1.643E+006CW-10 1.557E+006 1.643E+006CW-11 1.582E+006 1.648E+006
Observation WellsWell Name X (ft) Y (ft)
CW-8 1.564E+006 1.639E+006MO-2007-4C 1.564E+006 1.641E+006ESP-4 1.566E+006 1.64E+006MH-12 1.563E+006 1.636E+006
SOLUTION
Aquifer Model: Leaky Solution Method: Neuman-Witherspoon
T = 1.001E+04 ft2/day S = 0.00014551/B = 0.0004376 ft-1 ß/r = 0.0004085 ft-1
T' = 0.001274 ft2/day S' = 0.0679
0. 4.E+03 8.E+03 1.2E+04 1.6E+04 2.E+040.
0.4
0.8
1.2
1.6
2.
Time (min)
Dis
pla
cem
ent (f
t)
WELL TEST ANALYSIS
Data Set: H:\78300\783019 - Large Scale Aquifer Test\Report\Figures 4-15\wells 7,26C,3B uncon.aqtDate: 04/22/09 Time: 11:58:50
PROJECT INFORMATION
Company: HGC
AQUIFER DATA
Saturated Thickness: 700 ft
WELL DATA
Pumping WellsWell Name X (ft) Y (ft)ESP-1 1.567E+006 1.64E+006ESP-3 1.57E+006 1.641E+006CW-9 1.574E+006 1.644E+006CW-6 1.565E+006 1.643E+006CW-10 1.557E+006 1.643E+006CW-11 1.582E+006 1.648E+006
Observation WellsWell Name X (ft) Y (ft)
CW-7 1.572E+006 1.639E+006MO-2007-3B 1.574E+006 1.642E+006MH-26C 1.571E+006 1.636E+006
SOLUTION
Aquifer Model: Unconfined Solution Method: Neuman
T = 9410. ft2/day S = 0.0003922Sy = 0.2542 Kz/Kr = 0.0563
0. 4.E+03 8.E+03 1.2E+04 1.6E+04 2.E+040.
1.
2.
3.
4.
5.
Time (min)
Dis
pla
cem
ent (f
t)
WELL TEST ANALYSIS
Data Set: H:\78300\783019 - Large Scale Aquifer Test\Report\Figures 4-15\wells 2, 25B uncon.aqtDate: 04/22/09 Time: 11:46:23
PROJECT INFORMATION
Company: HGC
AQUIFER DATA
Saturated Thickness: 700 ft
WELL DATA
Pumping WellsWell Name X (ft) Y (ft)ESP-1 1.567E+006 1.64E+006ESP-3 1.57E+006 1.641E+006CW-9 1.574E+006 1.644E+006CW-6 1.565E+006 1.643E+006CW-10 1.557E+006 1.643E+006CW-11 1.582E+006 1.648E+006
Observation WellsWell Name X (ft) Y (ft)
ESP-2 1.568E+006 1.641E+006MH-25B 1.567E+006 1.636E+006
SOLUTION
Aquifer Model: Unconfined Solution Method: Neuman
T = 4836.6 ft2/day S = 0.0003058Sy = 0.08709 Kz/Kr = 0.06256

0. 4.E+03 8.E+03 1.2E+04 1.6E+04 2.E+040.
0.8
1.6
2.4
3.2
4.
Time (min)
Dis
pla
cem
ent (f
t)
WELL TEST ANALYSIS
Data Set: H:\78300\783019 - Large Scale Aquifer Test\Report\Figures 4-15\wells 8,4C,4,12 uncon.aqtDate: 04/22/09 Time: 12:02:54
PROJECT INFORMATION
Company: HGC
AQUIFER DATA
Saturated Thickness: 700 ft
WELL DATA
Pumping WellsWell Name X (ft) Y (ft)ESP-1 1.567E+006 1.64E+006ESP-3 1.57E+006 1.641E+006CW-9 1.574E+006 1.644E+006CW-6 1.565E+006 1.643E+006CW-10 1.557E+006 1.643E+006CW-11 1.582E+006 1.648E+006
Observation WellsWell Name X (ft) Y (ft)
CW-8 1.564E+006 1.639E+006MO-2007-4C 1.564E+006 1.641E+006ESP-4 1.566E+006 1.64E+006MH-12 1.563E+006 1.636E+006
SOLUTION
Aquifer Model: Unconfined Solution Method: Neuman
T = 8996.6 ft2/day S = 0.0006057Sy = 0.07061 Kz/Kr = 0.03494
0. 4.E+03 8.E+03 1.2E+04 1.6E+04 2.E+040.
0.6
1.2
1.8
2.4
3.
Time (min)
Dis
pla
cem
ent (f
t)
WELL TEST ANALYSIS
Data Set: H:\78300\783019 - Large Scale Aquifer Test\Report\Figures 4-15\wells 4A,25A,26A.aqtDate: 04/22/09 Time: 11:52:26
PROJECT INFORMATION
Company: HGC
AQUIFER DATA
Saturated Thickness: 700 ft Anisotropy Ratio (Kz/Kr): 0.1
WELL DATA
Pumping WellsWell Name X (ft) Y (ft)ESP-1 1.567E+006 1.64E+006ESP-3 1.57E+006 1.641E+006CW-9 1.574E+006 1.644E+006CW-6 1.565E+006 1.643E+006CW-10 1.557E+006 1.643E+006CW-11 1.582E+006 1.648E+006
Observation WellsWell Name X (ft) Y (ft)
MH-26A 1.571E+006 1.636E+006MH-25A 1.567E+006 1.636E+006MO-2007-4A 1.564E+006 1.641E+006
SOLUTION
Aquifer Model: Leaky Solution Method: Neuman-Witherspoon
T = 2.865E+04 ft2/day S = 0.0013951/B = 0.0003519 ft-1 ß/r = 0.0001554 ft-1
T' = 0.001148 ft2/day S' = 0.04735

0. 4.E+03 8.E+03 1.2E+04 1.6E+04 2.E+040.
1.
2.
3.
4.
5.
Time (min)
Dis
pla
cem
ent (f
t)
WELL TEST ANALYSIS
Data Set: H:\78300\783019 - Large Scale Aquifer Test\Report\Figures 4-15\wells 4B,25B,26B.aqtDate: 04/22/09 Time: 11:54:46
PROJECT INFORMATION
Company: HGC
AQUIFER DATA
Saturated Thickness: 700 ft Anisotropy Ratio (Kz/Kr): 0.1
WELL DATA
Pumping WellsWell Name X (ft) Y (ft)ESP-1 1.567E+006 1.64E+006ESP-3 1.57E+006 1.641E+006CW-9 1.574E+006 1.644E+006CW-6 1.565E+006 1.643E+006CW-10 1.557E+006 1.643E+006CW-11 1.582E+006 1.648E+006
Observation WellsWell Name X (ft) Y (ft)
MO-2007-4B 1.564E+006 1.641E+006MH-26B 1.571E+006 1.636E+006MH-25B 1.567E+006 1.636E+006
SOLUTION
Aquifer Model: Leaky Solution Method: Neuman-Witherspoon
T = 4574.4 ft2/day S = 2.209E-051/B = 0.000595 ft-1 ß/r = 0.00118 ft-1
T' = 0.001 ft2/day S' = 0.0547
0. 4.E+03 8.E+03 1.2E+04 1.6E+04 2.E+040.
1.
2.
3.
4.
5.
Time (min)
Dis
pla
cem
ent (f
t)
WELL TEST ANALYSIS
Data Set: H:\78300\783019 - Large Scale Aquifer Test\Report\Figures 4-15\wells 4C,25C,26C.aqtDate: 04/22/09 Time: 11:57:38
PROJECT INFORMATION
Company: HGC
AQUIFER DATA
Saturated Thickness: 700 ft Anisotropy Ratio (Kz/Kr): 0.1
WELL DATA
Pumping WellsWell Name X (ft) Y (ft)ESP-1 1.567E+006 1.64E+006ESP-3 1.57E+006 1.641E+006CW-9 1.574E+006 1.644E+006CW-6 1.565E+006 1.643E+006CW-10 1.557E+006 1.643E+006CW-11 1.582E+006 1.648E+006
Observation WellsWell Name X (ft) Y (ft)
MH-26C 1.571E+006 1.636E+006MH-25C 1.567E+006 1.636E+006MO-2007-4C 1.564E+006 1.641E+006
SOLUTION
Aquifer Model: Leaky Solution Method: Neuman-Witherspoon
T = 4424. ft2/day S = 0.00012951/B = 0.0006083 ft-1 ß/r = 0.000696 ft-1
T' = 0.0144 ft2/day S' = 0.3199
0. 4.E+03 8.E+03 1.2E+04 1.6E+04 2.E+040.
0.6
1.2
1.8
2.4
3.
Time (min)
Dis
pla
cem
ent (f
t)
WELL TEST ANALYSIS
Data Set: H:\78300\783019 - Large Scale Aquifer Test\Report\Figures 4-15\wells 4A,25A,26A uncon.aqtDate: 04/22/09 Time: 11:51:50
PROJECT INFORMATION
Company: HGC
AQUIFER DATA
Saturated Thickness: 700 ft
WELL DATA
Pumping WellsWell Name X (ft) Y (ft)ESP-1 1.567E+006 1.64E+006ESP-3 1.57E+006 1.641E+006CW-9 1.574E+006 1.644E+006CW-6 1.565E+006 1.643E+006CW-10 1.557E+006 1.643E+006CW-11 1.582E+006 1.648E+006
Observation WellsWell Name X (ft) Y (ft)
MH-26A 1.571E+006 1.636E+006MH-25A 1.567E+006 1.636E+006MO-2007-4A 1.564E+006 1.641E+006
SOLUTION
Aquifer Model: Unconfined Solution Method: Neuman
T = 2.796E+04 ft2/day S = 0.001695Sy = 0.04832 Kz/Kr = 0.02203
0. 4.E+03 8.E+03 1.2E+04 1.6E+04 2.E+040.
1.
2.
3.
4.
5.
Time (min)
Dis
pla
cem
ent (f
t)
WELL TEST ANALYSIS
Data Set: H:\78300\783019 - Large Scale Aquifer Test\Report\Figures 4-15\wells 4B,25B,26B uncon.aqtDate: 04/22/09 Time: 11:53:47
PROJECT INFORMATION
Company: HGC
AQUIFER DATA
Saturated Thickness: 700 ft
WELL DATA
Pumping WellsWell Name X (ft) Y (ft)ESP-1 1.567E+006 1.64E+006ESP-3 1.57E+006 1.641E+006CW-9 1.574E+006 1.644E+006CW-6 1.565E+006 1.643E+006CW-10 1.557E+006 1.643E+006CW-11 1.582E+006 1.648E+006
Observation WellsWell Name X (ft) Y (ft)
MO-2007-4B 1.564E+006 1.641E+006MH-26B 1.571E+006 1.636E+006MH-25B 1.567E+006 1.636E+006
SOLUTION
Aquifer Model: Unconfined Solution Method: Neuman
T = 5027.2 ft2/day S = 0.0003679Sy = 0.0457 Kz/Kr = 0.05681

0. 4.E+03 8.E+03 1.2E+04 1.6E+04 2.E+040.
1.
2.
3.
4.
5.
Time (min)
Dis
pla
cem
ent (f
t)
WELL TEST ANALYSIS
Data Set: H:\78300\783019 - Large Scale Aquifer Test\Report\Figures 4-15\wells 4C,25C,26C uncon.aqt
Date: 04/22/09 Time: 11:56:21
PROJECT INFORMATION
Company: HGC
AQUIFER DATA
Saturated Thickness: 700 ft
WELL DATA
Pumping WellsWell Name X (ft) Y (ft)ESP-1 1.567E+006 1.64E+006ESP-3 1.57E+006 1.641E+006CW-9 1.574E+006 1.644E+006CW-6 1.565E+006 1.643E+006CW-10 1.557E+006 1.643E+006CW-11 1.582E+006 1.648E+006
Observation WellsWell Name X (ft) Y (ft)
MH-26C 1.571E+006 1.636E+006MH-25C 1.567E+006 1.636E+006MO-2007-4C 1.564E+006 1.641E+006
SOLUTION
Aquifer Model: Unconfined Solution Method: Neuman
T = 4542. ft2/day S = 0.0007957Sy = 0.1496 Kz/Kr = 0.06287
! !
! !
!
!
!
!
!
!
!
!
!
!
!
!
!
!
!
!
!
!
!
!
!
!
!
!
!
!
!
!
!
!
!
!
!
!
!
!
!
!
!
!
!
!
!
!
!!
!
!
!
!
!
!
!
!
!
!
!
!
!
!
!
!
!
!
!
!
!
!
!!!!
!
!!!
!
!!
!
!
!
!!
!
!
!
!
!!
!
!
!
!
!
!
!
!
!
!
!
!
!
!
!
!
!
!
!
!
!
!
!!
!
!
!
!
!
!
!
!
!
!
!
!
!! !!
!
!
!
!
!
!
!!
!
Legend
Pumping Wells! Existing! Projected Future
Model Extents
Golf Course Recharge
Mountain Front Recharge
STI Seepage
River and Agricultural Recharge
Robson Ranch/Quail Creek Recharge
CAP Recharge
Sahuarita WWTP Recharge
FEASIBILITY STUDYNUMERICAL MODEL DOMAIN
78310127G08/25/09MWK 1808/25/09AMC
PROJECTION: UTM Zone 12N NAD83 $ Approved Date Author Date File Name Figure
HYDRO
GEO
CHEM, INC.
AREA WITHINTERPRETABLERESPONSETO PUMPING
0 6,000 12,000 Feet
APPROVED DATE REFERENCE FIGURE
HYDRO
GEO
CHEM, INC.
RESULTS
Transmissivity = 4800 ft2/dayStorage coefficient = 0.1e-6
skin factor= 30.3assumed aquifer thickness = 53 fthydraulic conductivity = 91 ft/day(casing effective radius = 0.343ft)
MEASURED AND SIMULATED DRAWDOWNS AT MH-26ADURING PUMPING OF MH-26A
H:/78300/78306/whip/c13/mh26a.srf
(analysis using WHIP)
19SJS 9/3/09
APPROVED DATE REFERENCE FIGURE
HYDRO
GEO
CHEM, INC.
RESULTS
Transmissivity = 1914 ft2/dayStorage coefficient = 0.022
skin factor= 16.4assumed aquifer thickness = 95 fthydraulic conductivity = 20 ft/day(casing effective radius = 0.24ft)
MEASURED AND SIMULATED DRAWDOWNS AT MH-25ADURING PUMPING OF MH-25A
H:/78300/78306/whip/c4/mh25a.srf
(analysis using WHIP)
20SJS 9/3/09
APPENDIX A
COMMUNITY WATER COMPANY PUMPING RECORDS
APPENDIX A
Community Water Company Pumping Records
Well 6
Well 6 System Flow Well 6 Run Minutes Well 6 Average Well 6 Well 6
(gallons) (total minutes) (gpm) Start Time End Time
2/1/2009 221,601 375 600 11:39:19 AM 5:53:53 PM2/2/2009 335,097 556 604 10:01:07 AM 7:17:04 PM2/3/2009 202,313 341 594 9:09:19 AM 2:50:21 PM2/4/2009 355,328 598 607 8:10:34 AM 6:08:23 PM2/5/2009 281,910 473 598 9:45:27 AM 5:38:02 PM2/6/2009 301,008 502 601 9:14:58 AM 5:36:37 PM2/7/2009 258,368 431 601 10:15:10 AM 5:26:11 PM2/8/2009 164,727 284 582 10:13:30 AM 2:57:13 PM2/9/2009 199,815 333 602 9:39:45 AM 3:12:24 PM2/10/2009 165,697 288 581 9:50:48 AM 2:38:31 PM2/11/2009 146,204 256 581 11:23:53 AM 3:39:41 PM2/12/2009 133,163 229 599 11:16:08 AM 3:05:13 PM2/13/2009 299,461 514 599 6:51:03 AM 3:24:33 PM2/14/2009 255,638 435 593 9:14:17 AM 4:29:06 PM2/15/2009 244,630 416 601 9:30:54 AM 4:27:07 PM2/16/2009 287,249 479 601 9:10:07 AM 5:09:33 PM2/17/2009 217,262 369 590 8:39:48 AM 2:48:55 PM2/18/2009 283,813 494 600 7:48:44 AM 4:03:01 PM2/19/2009 269,971 453 597 8:18:41 AM 3:51:30 PM2/20/2009 345,167 579 597 7:39:07 AM 5:18:35 PM2/21/2009 356,392 590 606 9:31:04 AM 7:20:44 PM2/22/2009 269,903 450 601 11:24:29 AM 6:54:33 PM2/23/2009 275,035 458 602 9:08:48 AM 4:46:32 PM2/24/2009 339,894 561 607 9:28:57 AM 6:50:16 PM2/25/2009 216,176 377 598 10:10:59 AM 4:28:05 PM2/26/2009 326,132 545 600 9:22:16 AM 6:27:01 PM2/27/2009 325,827 541 604 10:29:25 AM 7:30:21 PM2/28/2009 301,713 501 604 11:06:44 AM 7:27:22 PM
Date
H:\78300\783019 - Large Scale Aquifer Test\Report\Appendix A CWC Well Totals 02-2009.xls: Well 6 8/25/2009
APPENDIX A
Community Water Company Pumping Records
Well 9
Well 9 System Flow Well 9 Run Minutes Well 9 Average Well 9 Well 9
(gallons) (total minutes) (gpm) Start Time End Time
2/1/2009 375,563 379 1019 11:35:58 AM 5:55:23 PM2/2/2009 525,133 561 948 9:57:37 AM 7:18:35 PM2/3/2009 346,319 346 1021 9:06:08 AM 2:51:51 PM2/4/2009 567,462 603 971 8:07:03 AM 6:09:53 PM2/5/2009 450,381 477 957 9:42:07 AM 5:39:33 PM2/6/2009 425,820 447 968 10:11:14 AM 5:38:07 PM2/7/2009 418,118 436 975 10:11:59 AM 5:27:31 PM2/8/2009 286,356 289 1015 10:10:09 AM 2:58:43 PM2/9/2009 315,470 338 954 9:36:15 AM 3:13:55 PM2/10/2009 269,366 293 946 9:47:27 AM 2:39:57 PM2/11/2009 252,961 261 1007 11:20:36 AM 3:41:11 PM2/12/2009 205,002 234 926 11:12:38 AM 3:06:34 PM2/13/2009 486,690 518 977 6:47:52 AM 3:26:03 PM2/14/2009 435,250 440 1012 9:11:06 AM 4:30:36 PM2/15/2009 381,793 421 937 9:27:44 AM 4:28:38 PM2/16/2009 463,991 484 972 9:07:07 AM 5:11:03 PM2/17/2009 372,829 374 1016 8:36:47 AM 2:50:25 PM2/18/2009 452,353 499 959 7:45:33 AM 4:04:21 PM2/19/2009 433,306 457 962 8:15:31 AM 3:52:50 PM2/20/2009 564,509 584 978 7:35:56 AM 5:19:55 PM2/21/2009 575,849 594 980 9:27:53 AM 7:22:14 PM2/22/2009 438,324 455 979 11:21:29 AM 6:56:03 PM2/23/2009 464,858 462 1020 9:05:48 AM 4:47:52 PM2/24/2009 539,472 566 965 9:25:36 AM 6:51:46 PM2/25/2009 346,934 382 962 10:07:59 AM 4:29:35 PM2/26/2009 532,795 550 982 9:18:55 AM 6:28:31 PM2/27/2009 526,559 546 978 10:26:15 AM 7:31:51 PM2/28/2009 490,952 505 985 11:03:43 AM 7:28:53 PM
Date
H:\78300\783019 - Large Scale Aquifer Test\Report\Appendix A CWC Well Totals 02-2009.xls: Well 9 8/25/2009
APPENDIX A
Community Water Company Pumping Records
Well 10
Well 10 System Flow Well 10 Run Minutes Well 10 Average Well 10 Well 10
(gallons) (total minutes) (gpm) Start Time End Time
2/1/2009 771,162 419 1862 9:08:01 AM 4:07:10 PM2/2/2009 771,863 427 1811 7:16:08 AM 2:22:59 PM2/3/2009 720,883 411 1758 7:27:25 AM 2:18:06 PM2/4/2009 762,697 405 1942 5:58:06 AM 12:42:37 PM2/5/2009 757,856 412 1840 8:07:05 AM 2:59:34 PM2/6/2009 790,592 423 1874 8:27:02 AM 3:29:32 PM2/7/2009 752,270 406 1854 8:27:57 AM 3:14:25 PM2/8/2009 718,128 393 1831 8:21:06 AM 2:53:52 PM2/9/2009 864,517 451 1919 6:59:46 AM 2:31:00 PM2/10/2009 714,696 396 1808 7:17:20 AM 1:53:46 PM2/11/2009 831,429 429 1959 6:16:11 AM 1:24:45 PM2/12/2009 1,141,839 800 1890 5:44:39 AM 7:04:12 PM2/13/2009 1,408,479 777 1848 12:28:34 AM 1:25:09 PM2/14/2009 746,869 411 1837 7:21:40 AM 2:12:49 PM2/15/2009 726,974 383 1934 8:07:24 AM 2:30:24 PM2/16/2009 1,576,325 811 1946 12:52:39 AM 2:23:54 PM2/17/2009 1,040,960 557 1873 2:48:23 AM 12:04:53 PM2/18/2009 756,736 417 1909 6:17:22 AM 1:14:41 PM2/19/2009 716,408 403 1781 7:29:05 AM 2:11:58 PM2/20/2009 724,855 407 1783 7:08:53 AM 1:56:01 PM2/21/2009 799,404 412 1943 8:03:44 AM 2:55:52 PM2/22/2009 767,051 412 1863 8:48:11 AM 3:40:40 PM2/23/2009 784,290 382 2058 7:49:29 AM 2:11:14 PM2/24/2009 783,584 430 1825 6:58:29 AM 2:08:30 PM2/25/2009 542,411 294 1845 10:07:29 AM 3:01:53 PM2/26/2009 782,023 428 1829 7:10:30 AM 2:18:50 PM2/27/2009 854,384 454 1886 7:33:34 AM 3:07:18 PM2/28/2009 852,120 435 1960 8:19:34 AM 3:34:55 PM
Date
H:\78300\783019 - Large Scale Aquifer Test\Report\Appendix A CWC Well Totals 02-2009.xls: Well 10 8/25/2009
APPENDIX A
Community Water Company Pumping Records
Well 11
Well 11 System Flow Well 11 Run Minutes Well 11 Average Well 11 Well 11
(gallons) (total minutes) (gpm) Start Time End Time
2/1/2009 655,022 338 1939 9:18:32 AM 2:56:52 PM2/2/2009 702,727 387 1819 7:45:51 AM 2:12:48 PM2/3/2009 663,323 329 2017 8:36:45 AM 2:06:05 PM2/4/2009 692,572 395 1807 6:11:38 AM 12:46:28 PM2/5/2009 786,784 396 1989 8:16:27 AM 2:52:33 PM2/6/2009 820,019 450 1826 7:52:58 AM 3:22:41 PM2/7/2009 767,720 391 1964 8:37:08 AM 3:08:34 PM2/8/2009 684,139 379 1808 8:30:47 AM 2:49:42 PM2/9/2009 797,564 408 1960 7:43:22 AM 2:31:00 PM2/10/2009 704,982 387 1827 7:25:01 AM 1:51:56 PM2/11/2009 844,147 442 1928 6:25:42 AM 1:47:48 PM2/12/2009 154,799 85 1821 5:56:00 AM 7:21:00 AM2/13/2009 423,292 256 1658 9:47:03 AM 2:02:44 PM2/14/2009 727,415 407 1808 7:47:43 AM 2:34:42 PM2/15/2009 696,198 392 1811 8:32:17 AM 3:03:58 PM2/16/2009 0 0 02/17/2009 262,452 146 1802 10:17:20 AM 12:43:08 PM2/18/2009 690,938 412 1765 6:41:25 AM 1:33:53 PM2/19/2009 751,908 396 1904 7:54:18 AM 2:29:51 PM2/20/2009 695,707 373 1870 7:20:25 AM 1:32:59 PM2/21/2009 782,088 381 2056 8:04:04 AM 2:24:59 PM2/22/2009 732,110 391 1875 8:48:41 AM 3:19:47 PM2/23/2009 763,759 378 2025 7:48:59 AM 2:06:43 PM2/24/2009 774,019 406 1911 6:58:59 AM 1:44:37 PM2/25/2009 511,160 258 1988 10:07:29 AM 2:24:59 PM2/26/2009 762,231 402 1900 7:12:00 AM 1:53:48 PM2/27/2009 865,449 437 1982 7:34:25 AM 2:51:46 PM2/28/2009 777,909 411 1894 8:20:14 AM 3:11:32 PM
Date
H:\78300\783019 - Large Scale Aquifer Test\Report\Appendix A CWC Well Totals 02-2009.xls: Well 11 8/25/2009

APPENDIX B
WATER LEVEL ABOVE TRANSDUCER DATA, ELAPSED TIME,
BAROMETRIC PRESSURE-CORRECTED WATER LEVELS, AND
CALCULATED DRAWDOWNS
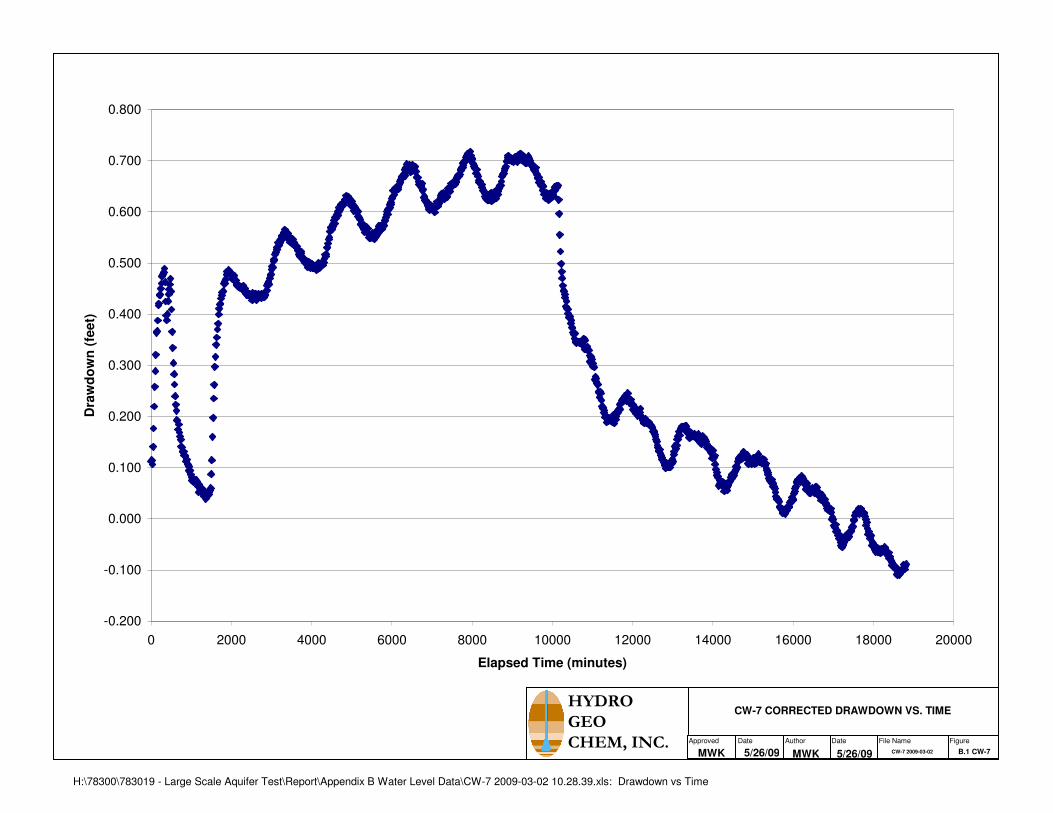
H:\78300\783019 - Large Scale Aquifer Test\Report\Appendix B Water Level Data\CW-7 2009-03-02 10.28.39.xls: Drawdown vs Time
-0.200
-0.100
0.000
0.100
0.200
0.300
0.400
0.500
0.600
0.700
0.800
0 2000 4000 6000 8000 10000 12000 14000 16000 18000 20000
Elapsed Time (minutes)
Dra
wd
ow
n (
feet)
CW-7 CORRECTED DRAWDOWN VS. TIMEHYDRO
GEO
CHEM, INC. Approved FigureDateAuthorDate File Name
MWK 5/26/09 B.1 CW-7CW-7 2009-03-025/26/09MWK
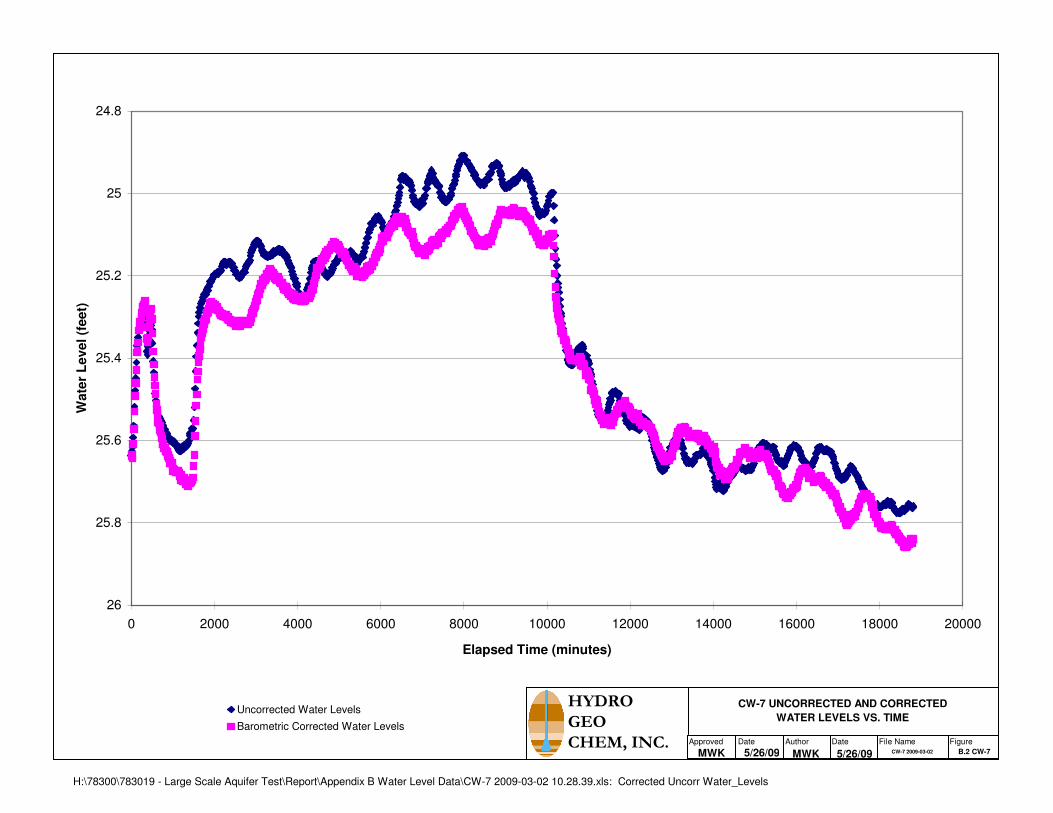
H:\78300\783019 - Large Scale Aquifer Test\Report\Appendix B Water Level Data\CW-7 2009-03-02 10.28.39.xls: Corrected Uncorr Water_Levels
24.8
25
25.2
25.4
25.6
25.8
26
0 2000 4000 6000 8000 10000 12000 14000 16000 18000 20000
Elapsed Time (minutes)
Wate
r L
evel (f
eet)
Uncorrected Water Levels
Barometric Corrected Water Levels
CW-7 UNCORRECTED AND CORRECTED
WATER LEVELS VS. TIME
HYDRO
GEO
CHEM, INC. Approved FigureDateAuthorDate File Name
MWK 5/26/09 B.2 CW-7CW-7 2009-03-025/26/09MWK

H:\78300\783019 - Large Scale Aquifer Test\Report\Appendix B Water Level Data\CW-7 2009-03-02 10.28.39.xls: Baseline_Barometric
683
684
685
686
687
688
689
690
691
692
2/10/2009 2/11/2009 2/12/2009 2/13/2009 2/14/2009 2/15/2009 2/16/2009 2/17/2009 2/18/2009
Date
Baro
metr
ic P
ressu
re
25
25.1
25.2
25.3
25.4
25.5
25.6
25.7
25.8
25.9
Wate
r L
evel
Barometric Pressure (mm Hg)
Water Level (depth above transducer [feet])
CW-7 BAROMETRIC PRESSURE AND
WATER LEVEL VS. DATE
HYDRO
GEO
CHEM, INC. Approved FigureDateAuthorDate File Name
MWK 5/26/09 B.3 CW-7CW-7 2009-03-025/26/09MWK

H:\78300\783019 - Large Scale Aquifer Test\Report\Appendix B Water Level Data\CW-8 2009-03-02 13.53.28.xls: CW-8
0.000
0.200
0.400
0.600
0.800
1.000
1.200
1.400
0 2000 4000 6000 8000 10000 12000 14000 16000 18000 20000
Elapsed Time (minutes)
Dra
wd
ow
n (
feet)
CW-8 CORRECTED DRAWDOWN VS. TIMEHYDRO
GEO
CHEM, INC. Approved FigureDateAuthorDate File Name
MWK 5/26/09 B.1 CW-8CW-8 2009-03-025/26/09MWK
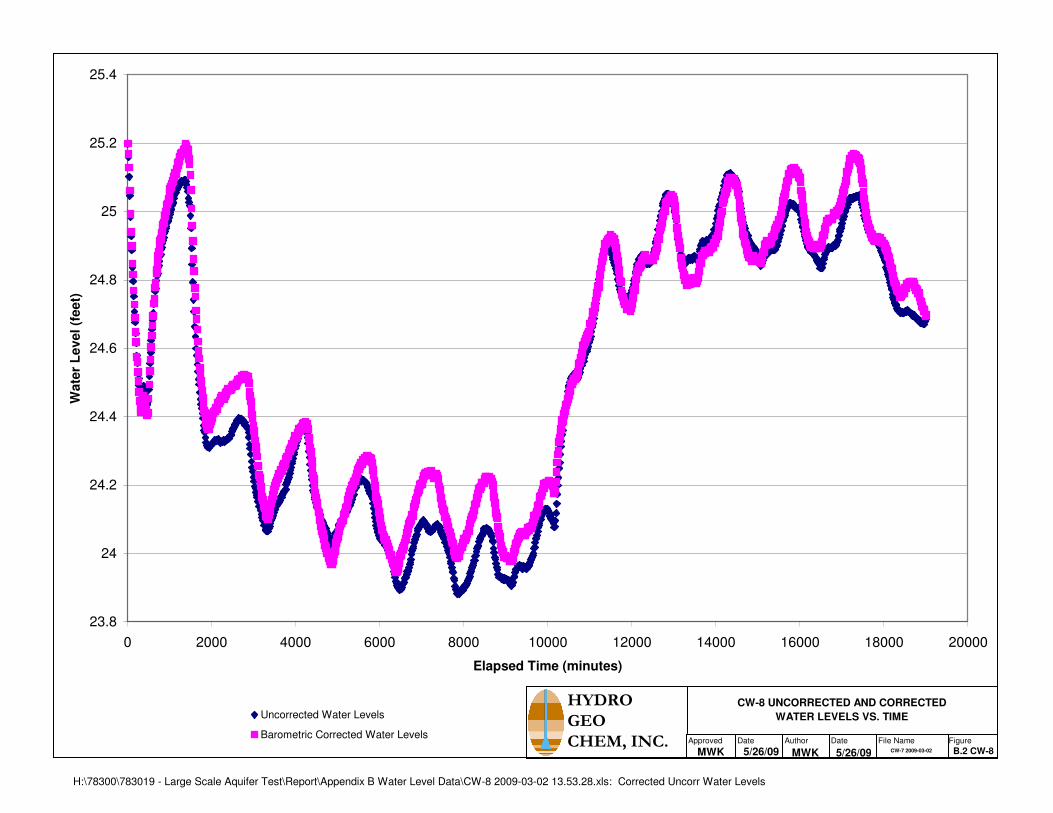
H:\78300\783019 - Large Scale Aquifer Test\Report\Appendix B Water Level Data\CW-8 2009-03-02 13.53.28.xls: Corrected Uncorr Water Levels
23.8
24
24.2
24.4
24.6
24.8
25
25.2
25.4
0 2000 4000 6000 8000 10000 12000 14000 16000 18000 20000
Elapsed Time (minutes)
Wate
r L
evel (f
eet)
Uncorrected Water Levels
Barometric Corrected Water Levels
CW-8 UNCORRECTED AND CORRECTED
WATER LEVELS VS. TIME
HYDRO
GEO
CHEM, INC. Approved FigureDateAuthorDate File Name
MWK 5/26/09 B.2 CW-8CW-7 2009-03-025/26/09MWK
H:\78300\783019 - Large Scale Aquifer Test\Report\Appendix B Water Level Data\CW-8 2009-03-02 13.53.28.xls: Baseline_Barometric
680
682
684
686
688
690
692
2/9/2009 2/10/2009 2/11/2009 2/12/2009 2/13/2009 2/14/2009 2/15/2009 2/16/2009 2/17/2009 2/18/2009
Date
Baro
metr
ic P
ressu
re
24.8
24.9
25
25.1
25.2
25.3
25.4
25.5
Wate
r L
evel
Barometric Pressure (mm Hg)
Water Level (depth above transducer [feet])
CW-8 BAROMETRIC PRESSURE AND
WATER LEVEL VS. DATE
HYDRO
GEO
CHEM, INC. Approved FigureDateAuthorDate File Name
MWK 5/26/09 B.3 CW-8CW-8 2009-03-025/26/09MWK

H:\78300\783019 - Large Scale Aquifer Test\Report\Appendix B Water Level Data\ESP-2 2009-03-02 15.41.37.xls: ESP-2
0.000
1.000
2.000
3.000
4.000
5.000
6.000
0 2000 4000 6000 8000 10000 12000 14000 16000 18000 20000
Elapsed Time (minutes)
Dra
wd
ow
n (
feet)
ESP-2 CORRECTED DRAWDOWN VS. TIMEHYDRO
GEO
CHEM, INC. Approved FigureDateAuthorDate File Name
MWK 5/26/09 B.1 ESP-2ESP-2 2009-03-025/26/09MWK
H:\78300\783019 - Large Scale Aquifer Test\Report\Appendix B Water Level Data\ESP-2 2009-03-02 15.41.37.xls: Corrected Uncorr Water Levels
19
20
21
22
23
24
25
26
0 2000 4000 6000 8000 10000 12000 14000 16000 18000 20000
Elapsed Time (minutes)
Wate
r L
evel
(feet)
Uncorrected Water Levels
Barometric Corrected Water Levels
ESP-2 UNCORRECTED AND CORRECTED
WATER LEVELS VS. TIME
HYDRO
GEO
CHEM, INC. Approved FigureDateAuthorDate File Name
MWK 5/26/09 B.2 ESP-2ESP-2 2009-03-025/26/09MWK

H:\78300\783019 - Large Scale Aquifer Test\Report\Appendix B Water Level Data\ESP-2 2009-03-02 15.41.37.xls: Baseline_Barometric
680
682
684
686
688
690
692
694
1/31/2009 2/2/2009 2/4/2009 2/6/2009 2/8/2009 2/10/2009 2/12/2009 2/14/2009 2/16/2009 2/18/2009 2/20/2009
Date
Baro
metr
ic P
ressu
re
24.2
24.4
24.6
24.8
25
25.2
Wate
r L
evel
Barometric Pressure (mm Hg)
Water Level (depth above transducer [feet])
ESP-2 BAROMETRIC PRESSURE AND
WATER LEVEL VS. DATE
HYDRO
GEO
CHEM, INC. Approved FigureDateAuthorDate File Name
MWK 5/26/09 B.3 ESP-2ESP-2 2009-03-025/26/09MWK
H:\78300\783019 - Large Scale Aquifer Test\Report\Appendix B Water Level Data\ESP-4 2009-03-02 15.06.32.xls: ESP-4
0.000
0.500
1.000
1.500
2.000
2.500
3.000
3.500
0 2000 4000 6000 8000 10000 12000 14000 16000 18000 20000
Elapsed Time (minutes)
Dra
wd
ow
n (
feet)
CORRECTED DRAWDOWN VS. TIME
ESP-4 2009-03-02 15.06.32
HYDRO
GEO
CHEM, INC. Approved FigureDateAuthorDate File Name
MWK 5/26/09 B.1 ESP-4ESP-4 2009-03-025/26/09MWK

H:\78300\783019 - Large Scale Aquifer Test\Report\Appendix B Water Level Data\ESP-4 2009-03-02 15.06.32.xls: Corrected Uncorr Water Levels
23
23.5
24
24.5
25
25.5
26
26.5
27
27.5
0 2000 4000 6000 8000 10000 12000 14000 16000 18000 20000
Elapsed Time (minutes)
Wate
r L
evel
(feet)
Uncorrected Water Levels
Barometric Corrected Water Levels
CW-7 UNCORRECTED AND CORRECTED
WATER LEVELS VS. TIME
HYDRO
GEO
CHEM, INC. Approved FigureDateAuthorDate File Name
MWK 5/26/09 B.2 ESP-4ESP-4 2009-03-025/26/09MWK
H:\78300\783019 - Large Scale Aquifer Test\Report\Appendix B Water Level Data\ESP-4 2009-03-02 15.06.32.xls: Baseline_Barometric
680
682
684
686
688
690
692
2/4/2009 2/6/2009 2/8/2009 2/10/2009 2/12/2009 2/14/2009 2/16/2009 2/18/2009
Date
Baro
metr
ic P
ressu
re
26.2
26.3
26.4
26.5
26.6
26.7
26.8
26.9
27
27.1
27.2
Wate
r L
evel
Barometric Pressure (mm Hg)
Water Level (depth above transducer [feet])
ESP-4 BAROMETRIC PRESSURE AND
WATER LEVEL VS. DATE
HYDRO
GEO
CHEM, INC. Approved FigureDateAuthorDate File Name
MWK 5/26/09 B.3 ESP-4ESP-4 2009-03-025/26/09MWK

H:\78300\783019 - Large Scale Aquifer Test\Report\Appendix B Water Level Data\ESP-5 2009-03-02 16.14.28.xls: ESP-5
-1.200
-1.000
-0.800
-0.600
-0.400
-0.200
0.000
0.200
0.400
0.600
0 2000 4000 6000 8000 10000 12000 14000 16000 18000 20000
Elapsed Time (minutes)
Dra
wd
ow
n (
feet)
CORRECTED DRAWDOWN VS. TIME
ESP-5 2009-03-02 16.14.28
HYDRO
GEO
CHEM, INC. Approved FigureDateAuthorDate File Name
MWK 4/21/09 B.1 ESP-5ESP-5 2009-03-024/21/09MWK
H:\78300\783019 - Large Scale Aquifer Test\Report\Appendix B Water Level Data\ESP-5 2009-03-02 16.14.28.xls: Corrected Uncorr Water Levels
25.6
25.8
26
26.2
26.4
26.6
26.8
27
27.2
27.4
27.6
0 2000 4000 6000 8000 10000 12000 14000 16000 18000 20000
Elapased Time (minutes)
Wate
r L
evels
(fe
et)
Uncorrected Water Levels
Barometric Corrected Water Levels
CW-7 UNCORRECTED AND CORRECTED
WATER LEVELS VS. TIME
HYDRO
GEO
CHEM, INC. Approved FigureDateAuthorDate File Name
MWK 5/26/09 B.2 ESP-5ESP-5 2009-03-025/26/09MWK
H:\78300\783019 - Large Scale Aquifer Test\Report\Appendix B Water Level Data\ESP-5 2009-03-02 16.14.28.xls: Baseline_Barometric
683
684
685
686
687
688
689
690
2/11/2009 2/12/2009 2/13/2009 2/14/2009 2/15/2009 2/16/2009 2/17/2009 2/18/2009
Date
Baro
metr
ic P
ressu
re
25.2
25.4
25.6
25.8
26
26.2
26.4
26.6
Wate
r L
evel
Barometric Pressure (mm Hg)
Water Level (depth above transducer [feet])
ESP-5 BAROMETRIC PRESSURE AND
WATER LEVEL VS. DATE
HYDRO
GEO
CHEM, INC. Approved FigureDateAuthorDate File Name
MWK 5/26/09 B.3 ESP-5ESP-5 2009-03-025/26/09MWK

H:\78300\783019 - Large Scale Aquifer Test\Report\Appendix B Water Level Data\ESP--1, Pumping Well 2009-03-02 15.25.34.xls: ESP-1_ESP-3
0
10
20
30
40
50
60
0 2000 4000 6000 8000 10000 12000 14000 16000 18000 20000
Elapsed Time (minutes)
Dra
wd
ow
n (
fee
t)
ESP-1 ESP-3PUMPED WELLS 2009-03-02 (ESP-1 & ESP-3)
DRAWDOWN VS. TIME
HYDRO
GEO
CHEM, INC. Approved FigureDateAuthorDate File Name
MWK 4/21/09 B.1 ESP-ESP-1_ESP-34/21/09MWK

H:\78300\783019 - Large Scale Aquifer Test\Report\Appendix B Water Level Data\MH-11 2009-03-02 12.08.34.xls: MH-11
-0.300
-0.250
-0.200
-0.150
-0.100
-0.050
0.000
0.050
0.100
0.150
0 2000 4000 6000 8000 10000 12000 14000 16000 18000 20000
Elapsed Time (minutes)
Dra
wd
ow
n (
feet)
MH-11 CORRECTED DRAWDOWN VS. TIMEHYDRO
GEO
CHEM, INC. Approved FigureDateAuthorDate File Name
MWK 4/21/09 B.1 MH-11MH-11 2009-03-024/21/09MWK
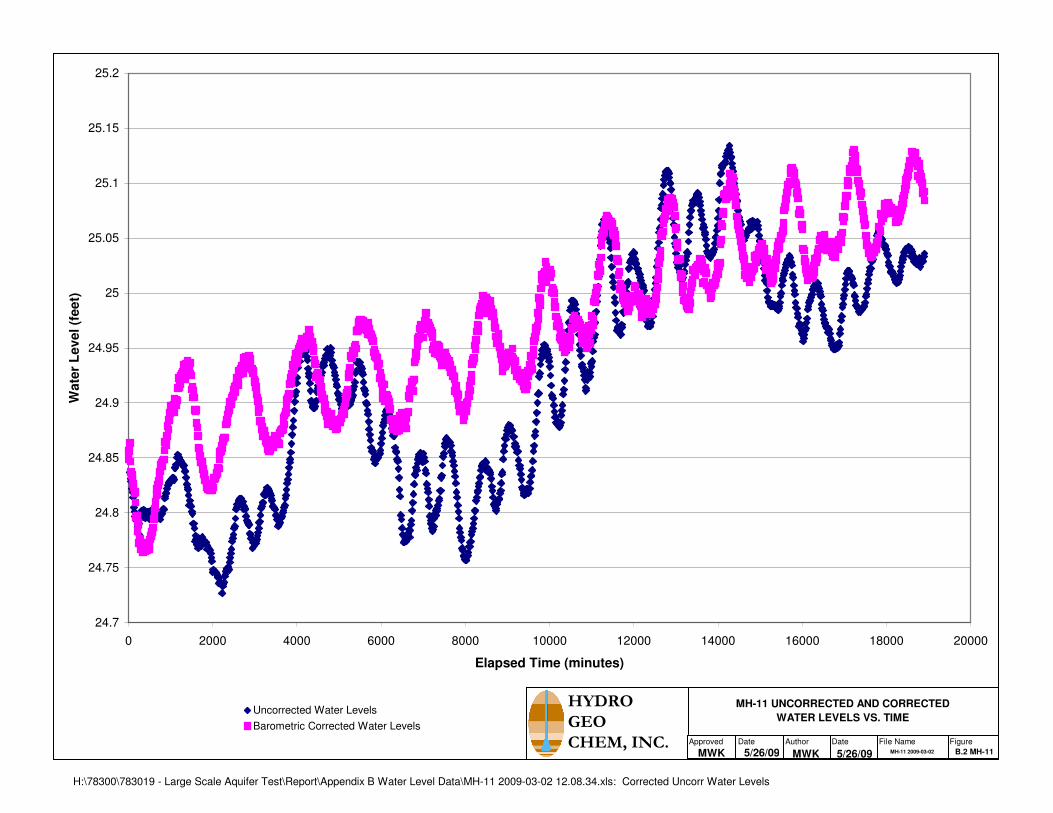
H:\78300\783019 - Large Scale Aquifer Test\Report\Appendix B Water Level Data\MH-11 2009-03-02 12.08.34.xls: Corrected Uncorr Water Levels
24.7
24.75
24.8
24.85
24.9
24.95
25
25.05
25.1
25.15
25.2
0 2000 4000 6000 8000 10000 12000 14000 16000 18000 20000
Elapsed Time (minutes)
Wate
r L
evel (f
eet)
Uncorrected Water Levels
Barometric Corrected Water Levels
MH-11 UNCORRECTED AND CORRECTED
WATER LEVELS VS. TIME
HYDRO
GEO
CHEM, INC. Approved FigureDateAuthorDate File Name
MWK 5/26/09 B.2 MH-11MH-11 2009-03-025/26/09MWK
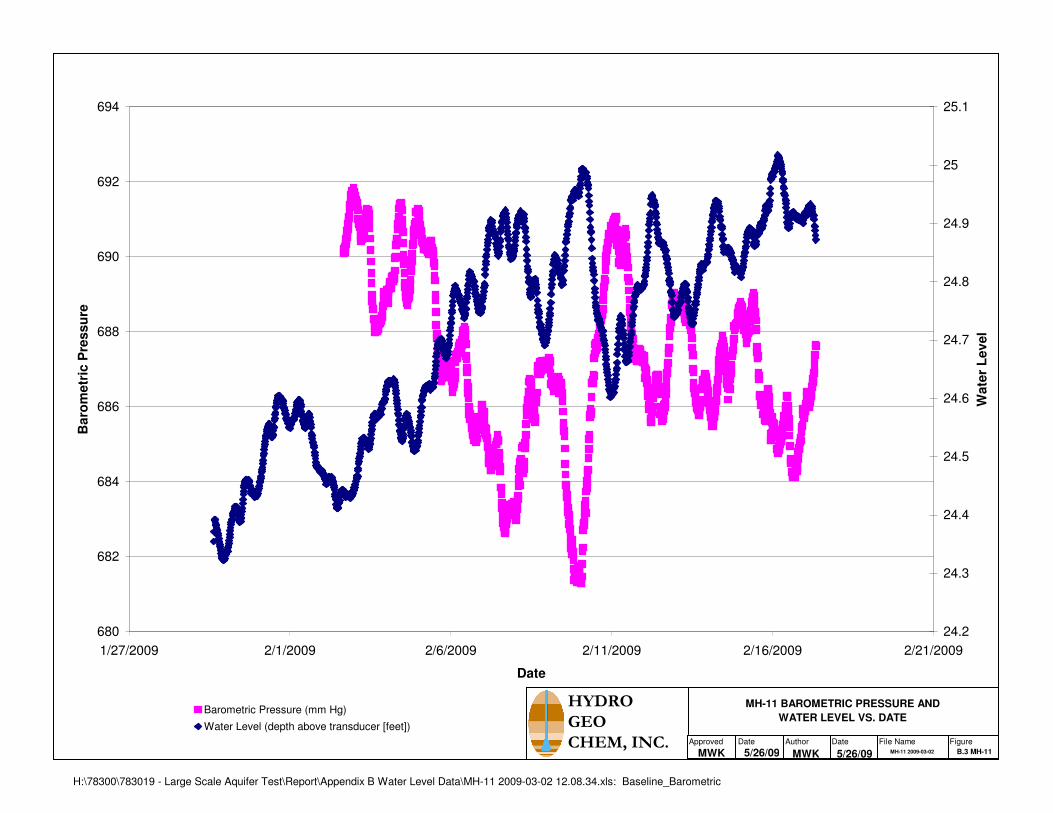
H:\78300\783019 - Large Scale Aquifer Test\Report\Appendix B Water Level Data\MH-11 2009-03-02 12.08.34.xls: Baseline_Barometric
680
682
684
686
688
690
692
694
1/27/2009 2/1/2009 2/6/2009 2/11/2009 2/16/2009 2/21/2009
Date
Baro
metr
ic P
ressu
re
24.2
24.3
24.4
24.5
24.6
24.7
24.8
24.9
25
25.1
Wate
r L
evel
Barometric Pressure (mm Hg)
Water Level (depth above transducer [feet])
MH-11 BAROMETRIC PRESSURE AND
WATER LEVEL VS. DATE
HYDRO
GEO
CHEM, INC. Approved FigureDateAuthorDate File Name
MWK 5/26/09 B.3 MH-11MH-11 2009-03-025/26/09MWK
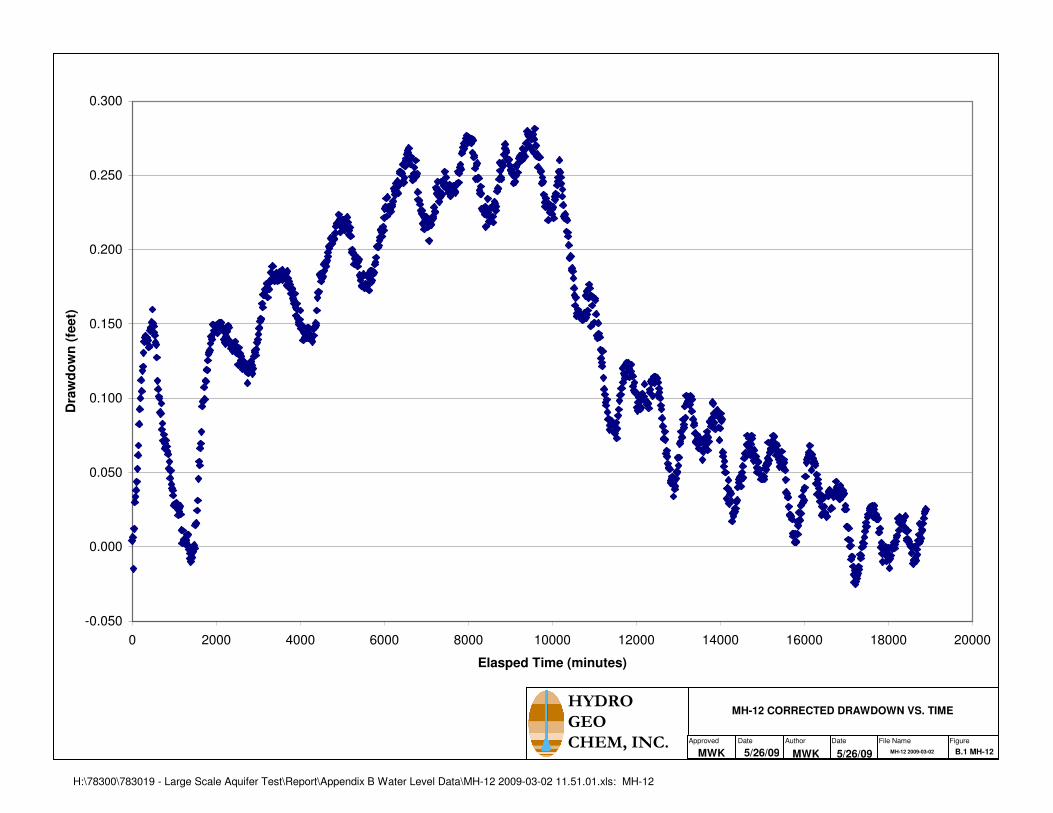
H:\78300\783019 - Large Scale Aquifer Test\Report\Appendix B Water Level Data\MH-12 2009-03-02 11.51.01.xls: MH-12
-0.050
0.000
0.050
0.100
0.150
0.200
0.250
0.300
0 2000 4000 6000 8000 10000 12000 14000 16000 18000 20000
Elasped Time (minutes)
Dra
wd
ow
n (
feet)
MH-12 CORRECTED DRAWDOWN VS. TIMEHYDRO
GEO
CHEM, INC. Approved FigureDateAuthorDate File Name
MWK 5/26/09 B.1 MH-12MH-12 2009-03-025/26/09MWK

H:\78300\783019 - Large Scale Aquifer Test\Report\Appendix B Water Level Data\MH-12 2009-03-02 11.51.01.xls: Corrected Uncorr Water Levels
24.45
24.5
24.55
24.6
24.65
24.7
24.75
24.8
24.85
24.9
24.95
25
0 2000 4000 6000 8000 10000 12000 14000 16000 18000 20000
Elapsed Time (minutes)
Wate
r L
evel
(feet)
Uncorrected Water Levels
Barometric Corrected Water Levels
MH-12 UNCORRECTED AND CORRECTED
WATER LEVELS VS. TIME
HYDRO
GEO
CHEM, INC. Approved FigureDateAuthorDate File Name
MWK 5/26/09 B.2 MH-12MH-12 2009-03-025/26/09MWK

H:\78300\783019 - Large Scale Aquifer Test\Report\Appendix B Water Level Data\MH-12 2009-03-02 11.51.01.xls: Baseline_Barometric
680
682
684
686
688
690
692
694
1/27/2009 2/1/2009 2/6/2009 2/11/2009 2/16/2009 2/21/2009
Date
Baro
metr
ic P
ressu
re
24
24.2
24.4
24.6
24.8
25
25.2
Wate
r L
evel
Barometric Pressure (mm Hg)
Water Level (depth above transducer [feet])
MH-12 BAROMETRIC PRESSURE AND
WATER LEVEL VS. DATE
HYDRO
GEO
CHEM, INC. Approved FigureDateAuthorDate File Name
MWK 5/26/09 B.3 MH-12MH-12 2009-03-025/26/09MWK
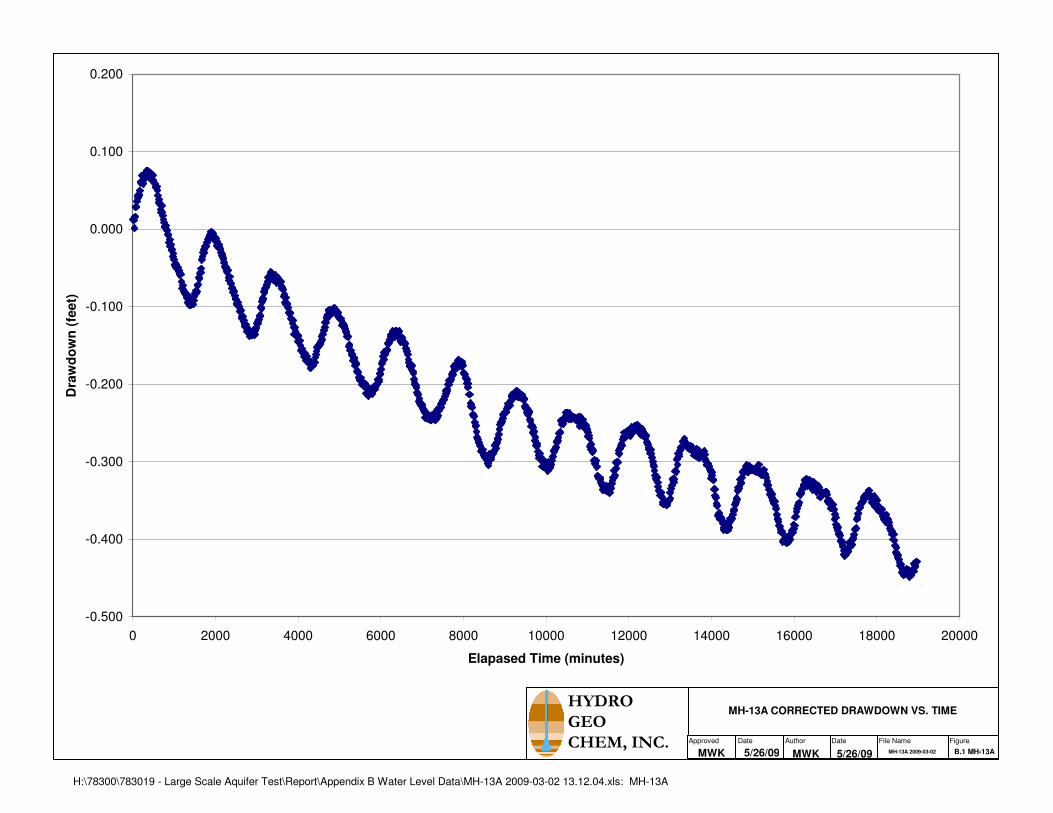
H:\78300\783019 - Large Scale Aquifer Test\Report\Appendix B Water Level Data\MH-13A 2009-03-02 13.12.04.xls: MH-13A
-0.500
-0.400
-0.300
-0.200
-0.100
0.000
0.100
0.200
0 2000 4000 6000 8000 10000 12000 14000 16000 18000 20000
Elapased Time (minutes)
Dra
wd
ow
n (
feet)
MH-13A CORRECTED DRAWDOWN VS. TIMEHYDRO
GEO
CHEM, INC. Approved FigureDateAuthorDate File Name
MWK 5/26/09 B.1 MH-13AMH-13A 2009-03-025/26/09MWK
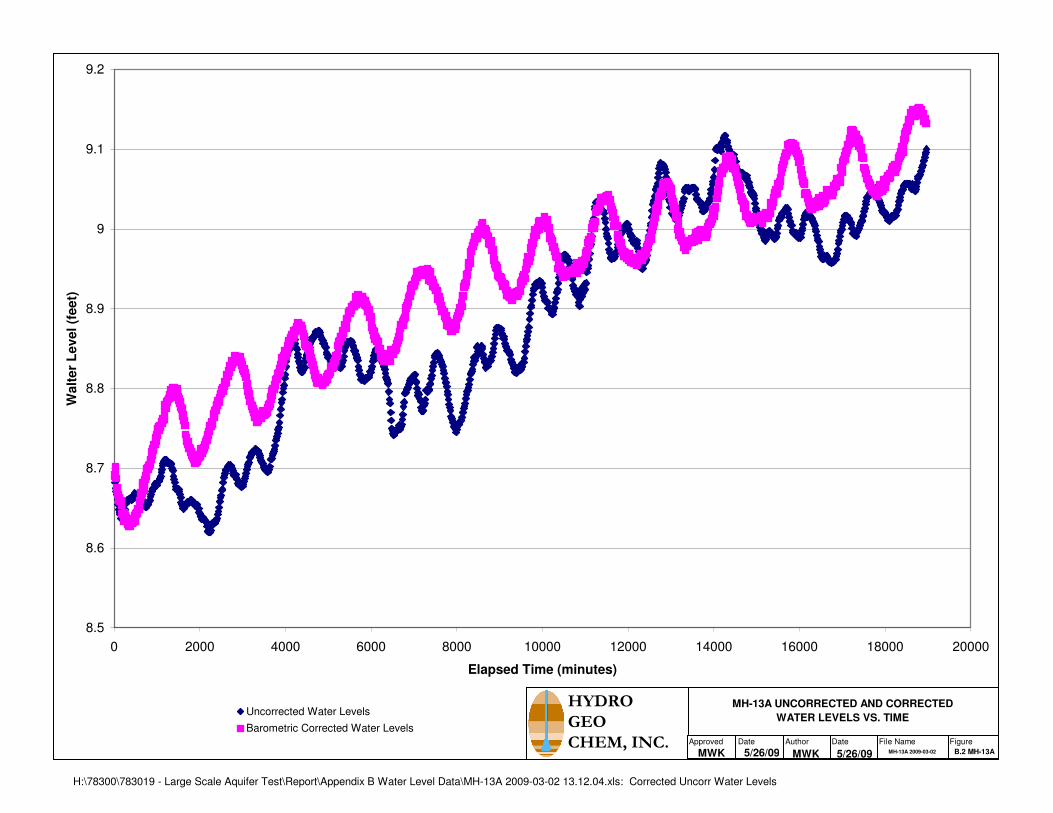
H:\78300\783019 - Large Scale Aquifer Test\Report\Appendix B Water Level Data\MH-13A 2009-03-02 13.12.04.xls: Corrected Uncorr Water Levels
8.5
8.6
8.7
8.8
8.9
9
9.1
9.2
0 2000 4000 6000 8000 10000 12000 14000 16000 18000 20000
Elapsed Time (minutes)
Walt
er
Level (f
eet)
Uncorrected Water Levels
Barometric Corrected Water Levels
MH-13A UNCORRECTED AND CORRECTED
WATER LEVELS VS. TIME
HYDRO
GEO
CHEM, INC. Approved FigureDateAuthorDate File Name
MWK 5/26/09 B.2 MH-13AMH-13A 2009-03-025/26/09MWK

H:\78300\783019 - Large Scale Aquifer Test\Report\Appendix B Water Level Data\MH-13A 2009-03-02 13.12.04.xls: Baseline_Barometric
680
682
684
686
688
690
692
694
1/29/2009 1/31/2009 2/2/2009 2/4/2009 2/6/2009 2/8/2009 2/10/2009 2/12/2009 2/14/2009 2/16/2009 2/18/2009 2/20/2009
Date
Baro
metr
ic P
ressu
re
7.9
8
8.1
8.2
8.3
8.4
8.5
8.6
8.7
8.8
8.9
9
Wate
r L
evel
Barometric Pressure (mm Hg)
Water Level (depth above transducer [feet])
MH-13A BAROMETRIC PRESSURE AND
WATER LEVEL VS. DATE
HYDRO
GEO
CHEM, INC. Approved FigureDateAuthorDate File Name
MWK 5/26/09 B.3 MH-13AMH-13A 2009-03-025/26/09MWK

H:\78300\783019 - Large Scale Aquifer Test\Report\Appendix B Water Level Data\MH-13B 2009-03-02 13.15.28.xls: MH-13B
-0.600
-0.500
-0.400
-0.300
-0.200
-0.100
0.000
0.100
0.200
0.300
0 2000 4000 6000 8000 10000 12000 14000 16000 18000 20000
Elapsed Time (minutes)
Dra
wd
ow
n (
feet)
MH-13B CORRECTED DRAWDOWN VS. TIMEHYDRO
GEO
CHEM, INC. Approved FigureDateAuthorDate File Name
MWK 5/26/09 B1 MH-13BMH-13B 2009-03-025/26/09MWK
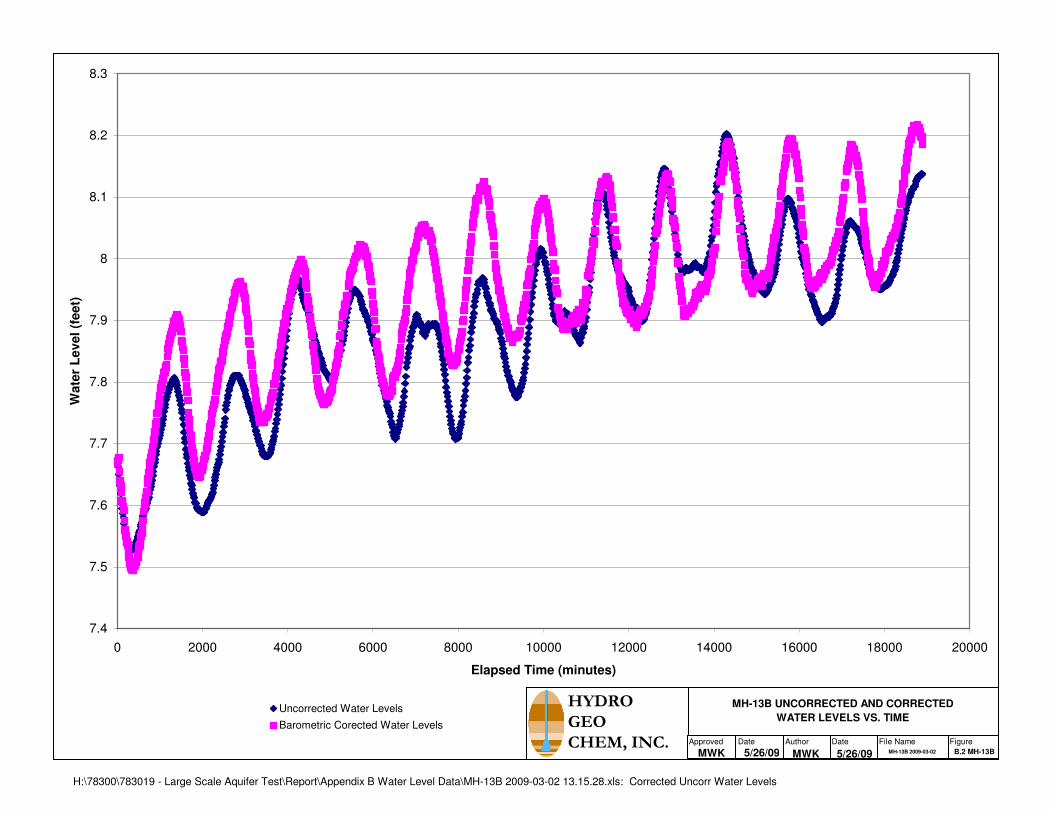
H:\78300\783019 - Large Scale Aquifer Test\Report\Appendix B Water Level Data\MH-13B 2009-03-02 13.15.28.xls: Corrected Uncorr Water Levels
7.4
7.5
7.6
7.7
7.8
7.9
8
8.1
8.2
8.3
0 2000 4000 6000 8000 10000 12000 14000 16000 18000 20000
Elapsed Time (minutes)
Wate
r L
evel
(feet)
Uncorrected Water Levels
Barometric Corected Water Levels
MH-13B UNCORRECTED AND CORRECTED
WATER LEVELS VS. TIME
HYDRO
GEO
CHEM, INC. Approved FigureDateAuthorDate File Name
MWK 5/26/09 B.2 MH-13BMH-13B 2009-03-025/26/09MWK
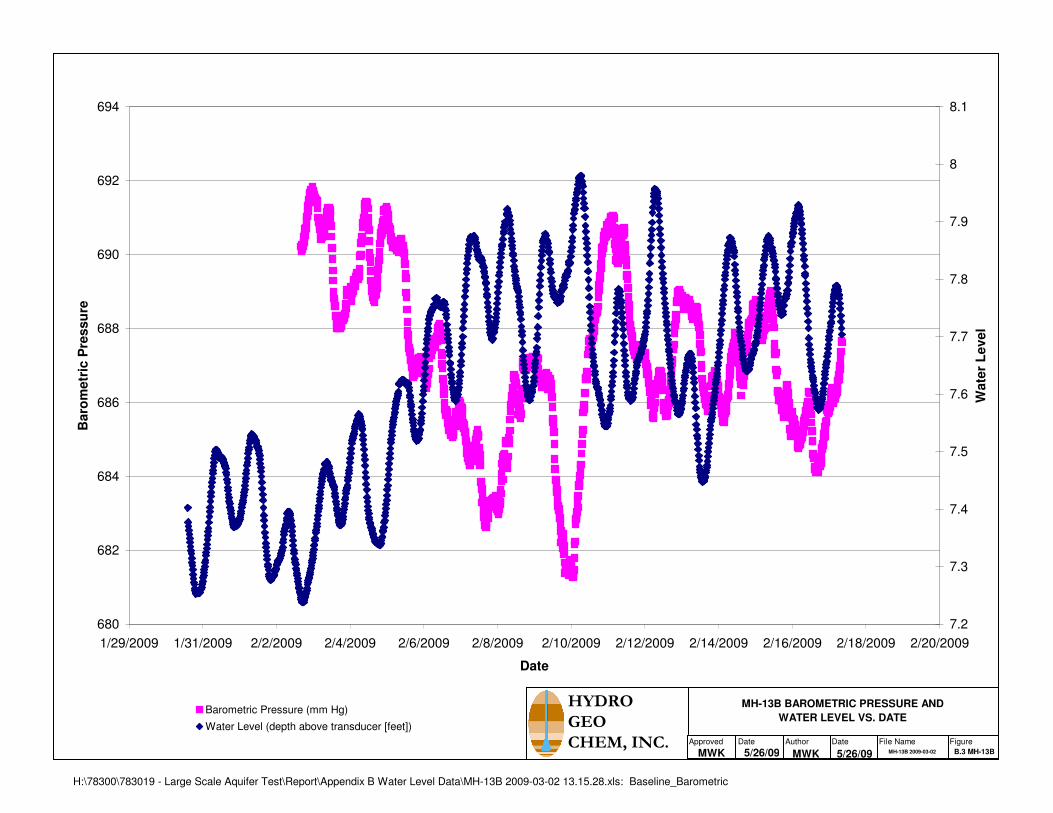
H:\78300\783019 - Large Scale Aquifer Test\Report\Appendix B Water Level Data\MH-13B 2009-03-02 13.15.28.xls: Baseline_Barometric
680
682
684
686
688
690
692
694
1/29/2009 1/31/2009 2/2/2009 2/4/2009 2/6/2009 2/8/2009 2/10/2009 2/12/2009 2/14/2009 2/16/2009 2/18/2009 2/20/2009
Date
Baro
metr
ic P
ressu
re
7.2
7.3
7.4
7.5
7.6
7.7
7.8
7.9
8
8.1
Wate
r L
evel
Barometric Pressure (mm Hg)
Water Level (depth above transducer [feet])
MH-13B BAROMETRIC PRESSURE AND
WATER LEVEL VS. DATE
HYDRO
GEO
CHEM, INC. Approved FigureDateAuthorDate File Name
MWK 5/26/09 B.3 MH-13BMH-13B 2009-03-025/26/09MWK
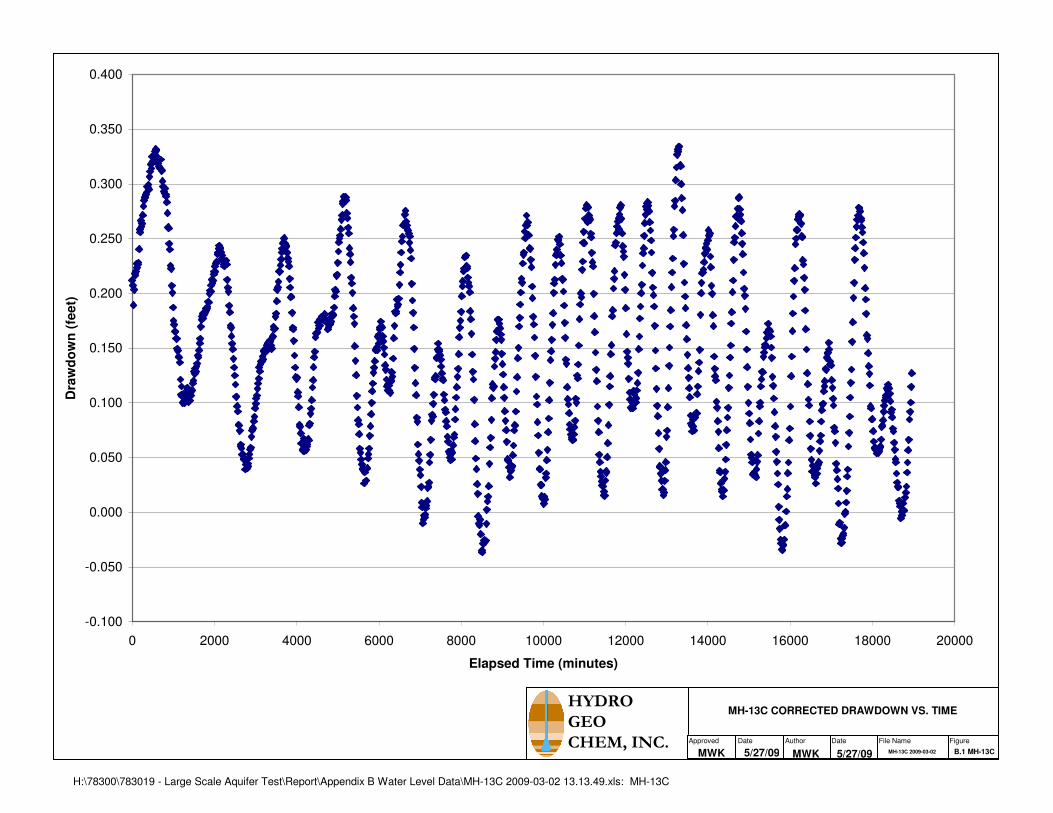
H:\78300\783019 - Large Scale Aquifer Test\Report\Appendix B Water Level Data\MH-13C 2009-03-02 13.13.49.xls: MH-13C
-0.100
-0.050
0.000
0.050
0.100
0.150
0.200
0.250
0.300
0.350
0.400
0 2000 4000 6000 8000 10000 12000 14000 16000 18000 20000
Elapsed Time (minutes)
Dra
wd
ow
n (
feet)
MH-13C CORRECTED DRAWDOWN VS. TIMEHYDRO
GEO
CHEM, INC. Approved FigureDateAuthorDate File Name
MWK 5/27/09 B.1 MH-13CMH-13C 2009-03-025/27/09MWK
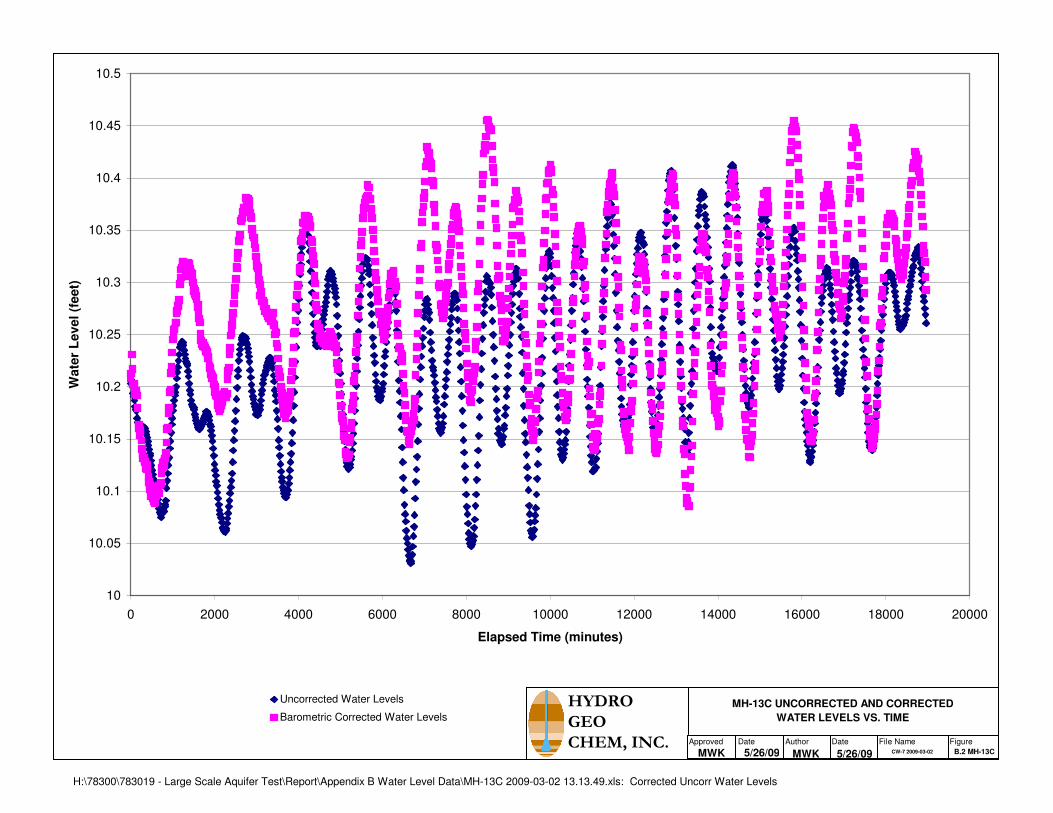
H:\78300\783019 - Large Scale Aquifer Test\Report\Appendix B Water Level Data\MH-13C 2009-03-02 13.13.49.xls: Corrected Uncorr Water Levels
10
10.05
10.1
10.15
10.2
10.25
10.3
10.35
10.4
10.45
10.5
0 2000 4000 6000 8000 10000 12000 14000 16000 18000 20000
Elapsed Time (minutes)
Wate
r L
evel
(feet)
Uncorrected Water Levels
Barometric Corrected Water Levels
MH-13C UNCORRECTED AND CORRECTED
WATER LEVELS VS. TIME
HYDRO
GEO
CHEM, INC. Approved FigureDateAuthorDate File Name
MWK 5/26/09 B.2 MH-13CCW-7 2009-03-025/26/09MWK
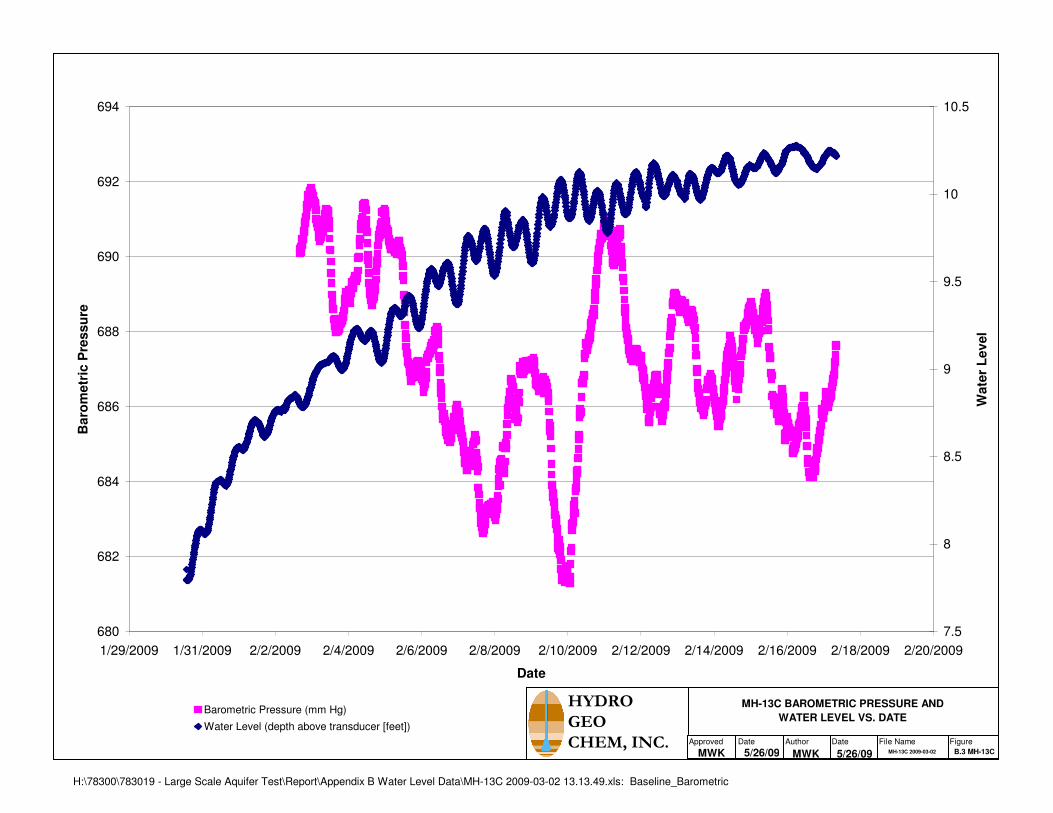
H:\78300\783019 - Large Scale Aquifer Test\Report\Appendix B Water Level Data\MH-13C 2009-03-02 13.13.49.xls: Baseline_Barometric
680
682
684
686
688
690
692
694
1/29/2009 1/31/2009 2/2/2009 2/4/2009 2/6/2009 2/8/2009 2/10/2009 2/12/2009 2/14/2009 2/16/2009 2/18/2009 2/20/2009
Date
Baro
metr
ic P
ressu
re
7.5
8
8.5
9
9.5
10
10.5
Wate
r L
evel
Barometric Pressure (mm Hg)
Water Level (depth above transducer [feet])
MH-13C BAROMETRIC PRESSURE AND
WATER LEVEL VS. DATE
HYDRO
GEO
CHEM, INC. Approved FigureDateAuthorDate File Name
MWK 5/26/09 B.3 MH-13CMH-13C 2009-03-025/26/09MWK

H:\78300\783019 - Large Scale Aquifer Test\Report\Appendix B Water Level Data\MH-25A 2009-03-02 10.47.24.xls: MH-25A
0.000
0.100
0.200
0.300
0.400
0.500
0.600
0.700
0.800
0.900
0 2000 4000 6000 8000 10000 12000 14000 16000 18000 20000
Elapsed Time (minutes)
Dra
wd
ow
n (
feet)
MH-25A CORRECTED DRAWDOWN VS. TIMEHYDRO
GEO
CHEM, INC. Approved FigureDateAuthorDate File Name
MWK 5/26/09 B.1 MH-25AMH-25A 2009-03-025/26/09MWK
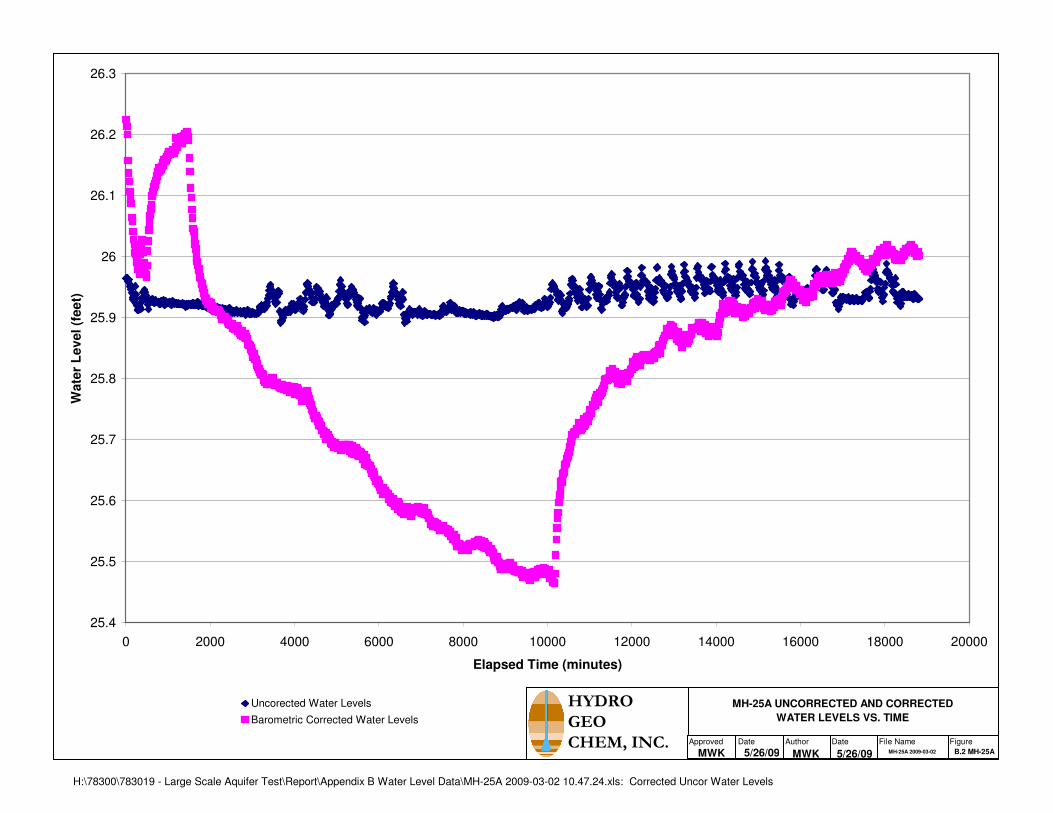
H:\78300\783019 - Large Scale Aquifer Test\Report\Appendix B Water Level Data\MH-25A 2009-03-02 10.47.24.xls: Corrected Uncor Water Levels
25.4
25.5
25.6
25.7
25.8
25.9
26
26.1
26.2
26.3
0 2000 4000 6000 8000 10000 12000 14000 16000 18000 20000
Elapsed Time (minutes)
Wate
r L
evel (f
eet)
Uncorected Water Levels
Barometric Corrected Water Levels
MH-25A UNCORRECTED AND CORRECTED
WATER LEVELS VS. TIME
HYDRO
GEO
CHEM, INC. Approved FigureDateAuthorDate File Name
MWK 5/26/09 B.2 MH-25AMH-25A 2009-03-025/26/09MWK
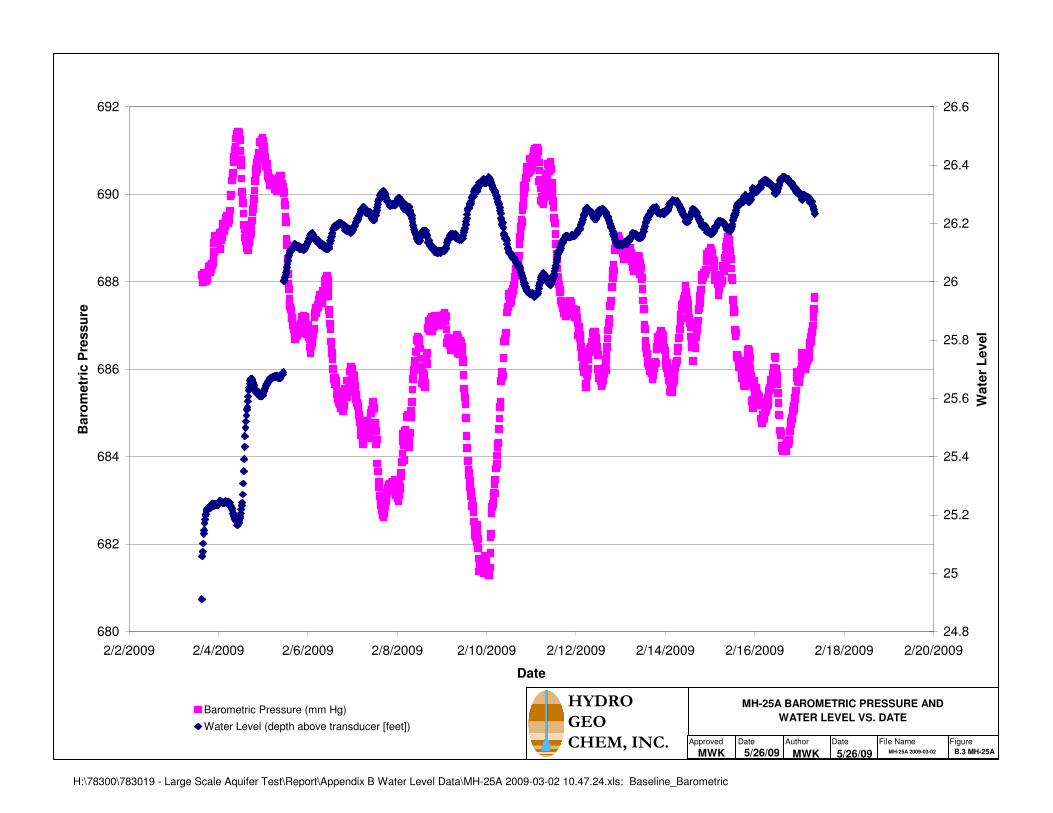
H:\78300\783019 - Large Scale Aquifer Test\Report\Appendix B Water Level Data\MH-25A 2009-03-02 10.47.24.xls: Baseline_Barometric
680
682
684
686
688
690
692
2/2/2009 2/4/2009 2/6/2009 2/8/2009 2/10/2009 2/12/2009 2/14/2009 2/16/2009 2/18/2009 2/20/2009
Date
Baro
metr
ic P
ressu
re
24.8
25
25.2
25.4
25.6
25.8
26
26.2
26.4
26.6
Wate
r L
evel
Barometric Pressure (mm Hg)
Water Level (depth above transducer [feet])
MH-25A BAROMETRIC PRESSURE AND
WATER LEVEL VS. DATE
HYDRO
GEO
CHEM, INC. Approved FigureDateAuthorDate File Name
MWK 5/26/09 B.3 MH-25AMH-25A 2009-03-025/26/09MWK
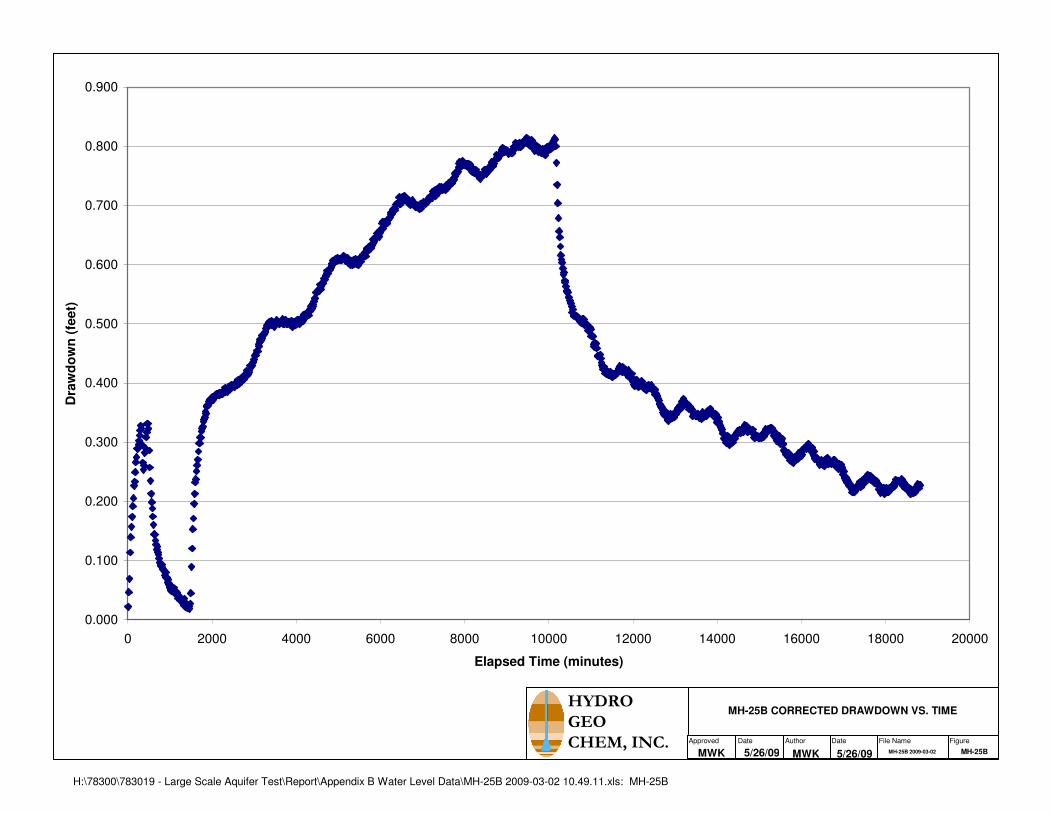
H:\78300\783019 - Large Scale Aquifer Test\Report\Appendix B Water Level Data\MH-25B 2009-03-02 10.49.11.xls: MH-25B
0.000
0.100
0.200
0.300
0.400
0.500
0.600
0.700
0.800
0.900
0 2000 4000 6000 8000 10000 12000 14000 16000 18000 20000
Elapsed Time (minutes)
Dra
wd
ow
n (
feet)
MH-25B CORRECTED DRAWDOWN VS. TIMEHYDRO
GEO
CHEM, INC. Approved FigureDateAuthorDate File Name
MWK 5/26/09 MH-25BMH-25B 2009-03-025/26/09MWK

H:\78300\783019 - Large Scale Aquifer Test\Report\Appendix B Water Level Data\MH-25B 2009-03-02 10.49.11.xls: Corrected Uncorr Water Levels
23.2
23.4
23.6
23.8
24
24.2
24.4
0 2000 4000 6000 8000 10000 12000 14000 16000 18000 20000
Elapsed Time (minutes)
Wate
r L
evel (f
eet)
Uncorrected Water Levels
Barometric Corrected Water LevelsMH-25B UNCORRECTED AND CORRECTED
WATER LEVELS VS. TIME
HYDRO
GEO
CHEM, INC. Approved FigureDateAuthorDate File Name
MWK 5/26/09 B.2 MH-25BMH-25B 2009-03-025/26/09MWK

H:\78300\783019 - Large Scale Aquifer Test\Report\Appendix B Water Level Data\MH-25B 2009-03-02 10.49.11.xls: Baseline_Barometric
680
682
684
686
688
690
692
694
1/27/2009 2/1/2009 2/6/2009 2/11/2009 2/16/2009 2/21/2009
Date
Baro
metr
ic P
ressu
re
23.8
23.9
24
24.1
24.2
24.3
24.4
24.5
Wate
r L
evel
Barometric Pressure (mm Hg)
Water Level (depth above transducer [feet])
MH-25B BAROMETRIC PRESSURE AND
WATER LEVEL VS. DATE
HYDRO
GEO
CHEM, INC. Approved FigureDateAuthorDate File Name
MWK 5/26/09 B.3 MH-25BMH-25B 2009-03-025/26/09MWK

H:\78300\783019 - Large Scale Aquifer Test\Report\Appendix B Water Level Data\MH-25C 2009-03-02 10.51.14.xls: MH-25C
-0.100
0.000
0.100
0.200
0.300
0.400
0.500
0.600
0.700
0.800
0.900
0 2000 4000 6000 8000 10000 12000 14000 16000 18000 20000
Elapsed Time (minutes)
Dra
wd
ow
n (
feet)
MH-25C CORRECTED DRAWDOWN VS. TIMEHYDRO
GEO
CHEM, INC. Approved FigureDateAuthorDate File Name
MWK 5/26/09 B.1 MH-25CMH-25C 2009-03-025/26/09MWK
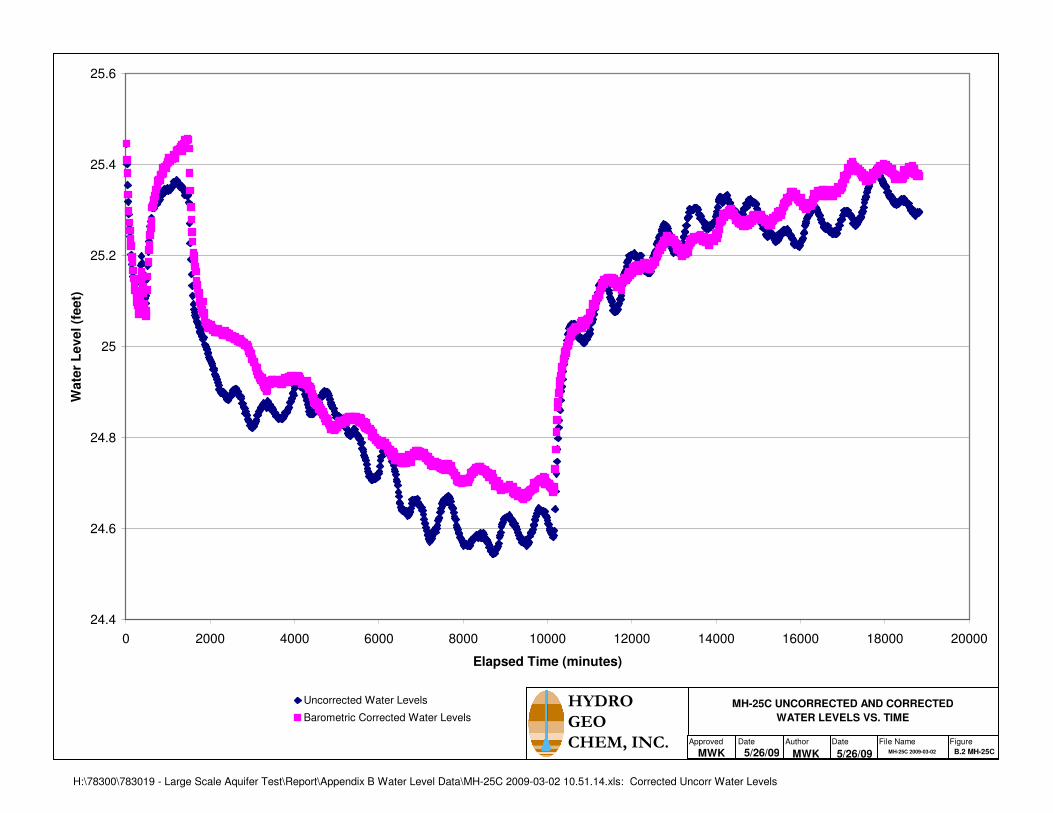
H:\78300\783019 - Large Scale Aquifer Test\Report\Appendix B Water Level Data\MH-25C 2009-03-02 10.51.14.xls: Corrected Uncorr Water Levels
24.4
24.6
24.8
25
25.2
25.4
25.6
0 2000 4000 6000 8000 10000 12000 14000 16000 18000 20000
Elapsed Time (minutes)
Wate
r L
evel (f
eet)
Uncorrected Water Levels
Barometric Corrected Water Levels
MH-25C UNCORRECTED AND CORRECTED
WATER LEVELS VS. TIME
HYDRO
GEO
CHEM, INC. Approved FigureDateAuthorDate File Name
MWK 5/26/09 B.2 MH-25CMH-25C 2009-03-025/26/09MWK
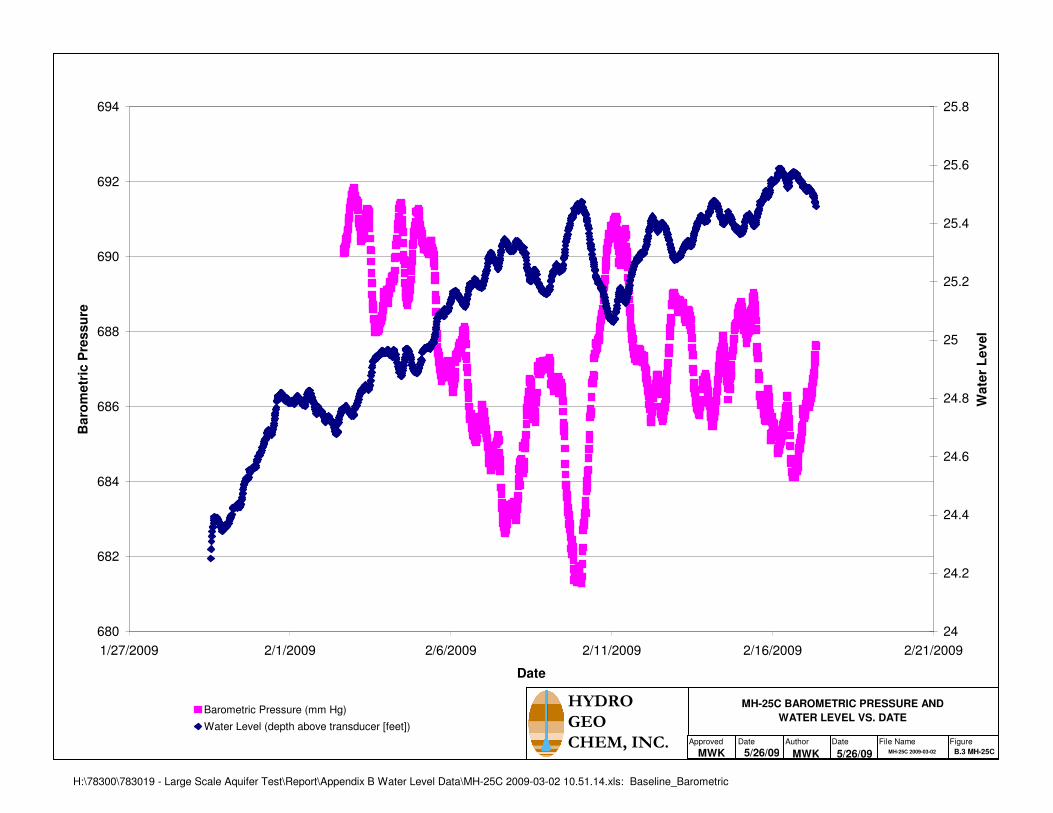
H:\78300\783019 - Large Scale Aquifer Test\Report\Appendix B Water Level Data\MH-25C 2009-03-02 10.51.14.xls: Baseline_Barometric
680
682
684
686
688
690
692
694
1/27/2009 2/1/2009 2/6/2009 2/11/2009 2/16/2009 2/21/2009
Date
Baro
metr
ic P
ressu
re
24
24.2
24.4
24.6
24.8
25
25.2
25.4
25.6
25.8
Wate
r L
evel
Barometric Pressure (mm Hg)
Water Level (depth above transducer [feet])
MH-25C BAROMETRIC PRESSURE AND
WATER LEVEL VS. DATE
HYDRO
GEO
CHEM, INC. Approved FigureDateAuthorDate File Name
MWK 5/26/09 B.3 MH-25CMH-25C 2009-03-025/26/09MWK
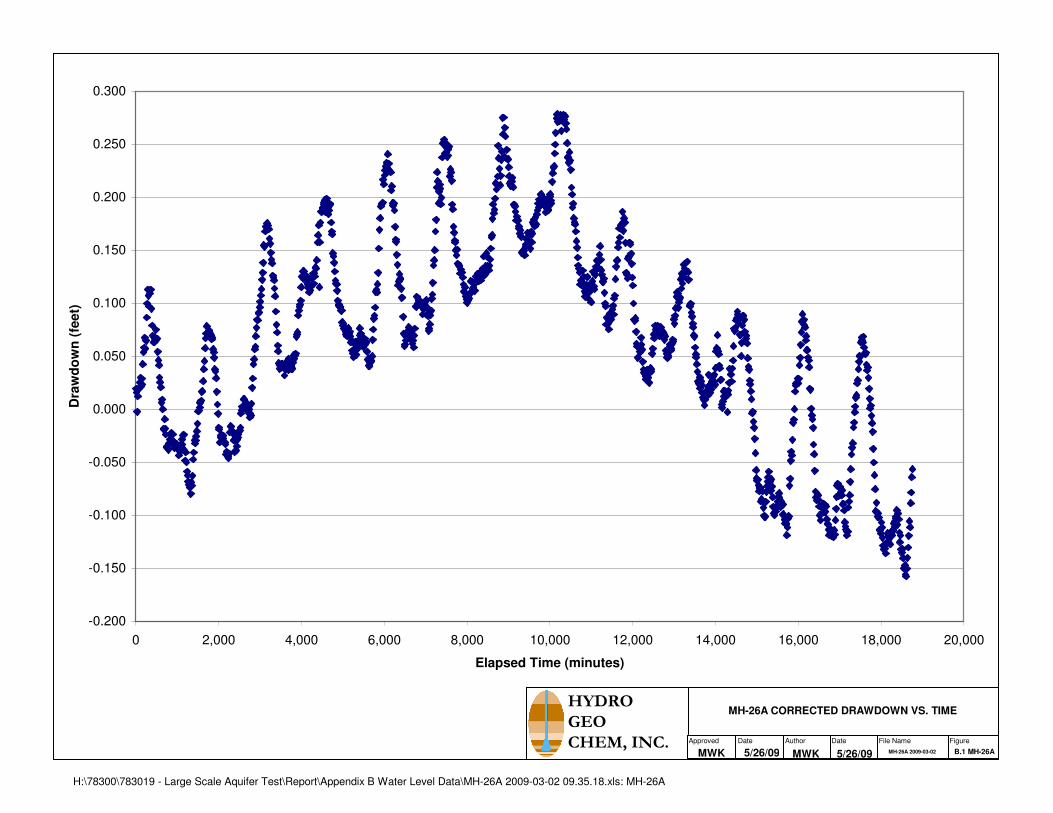
H:\78300\783019 - Large Scale Aquifer Test\Report\Appendix B Water Level Data\MH-26A 2009-03-02 09.35.18.xls: MH-26A
-0.200
-0.150
-0.100
-0.050
0.000
0.050
0.100
0.150
0.200
0.250
0.300
0 2,000 4,000 6,000 8,000 10,000 12,000 14,000 16,000 18,000 20,000
Elapsed Time (minutes)
Dra
wd
ow
n (
feet)
MH-26A CORRECTED DRAWDOWN VS. TIMEHYDRO
GEO
CHEM, INC. Approved FigureDateAuthorDate File Name
MWK 5/26/09 B.1 MH-26AMH-26A 2009-03-025/26/09MWK
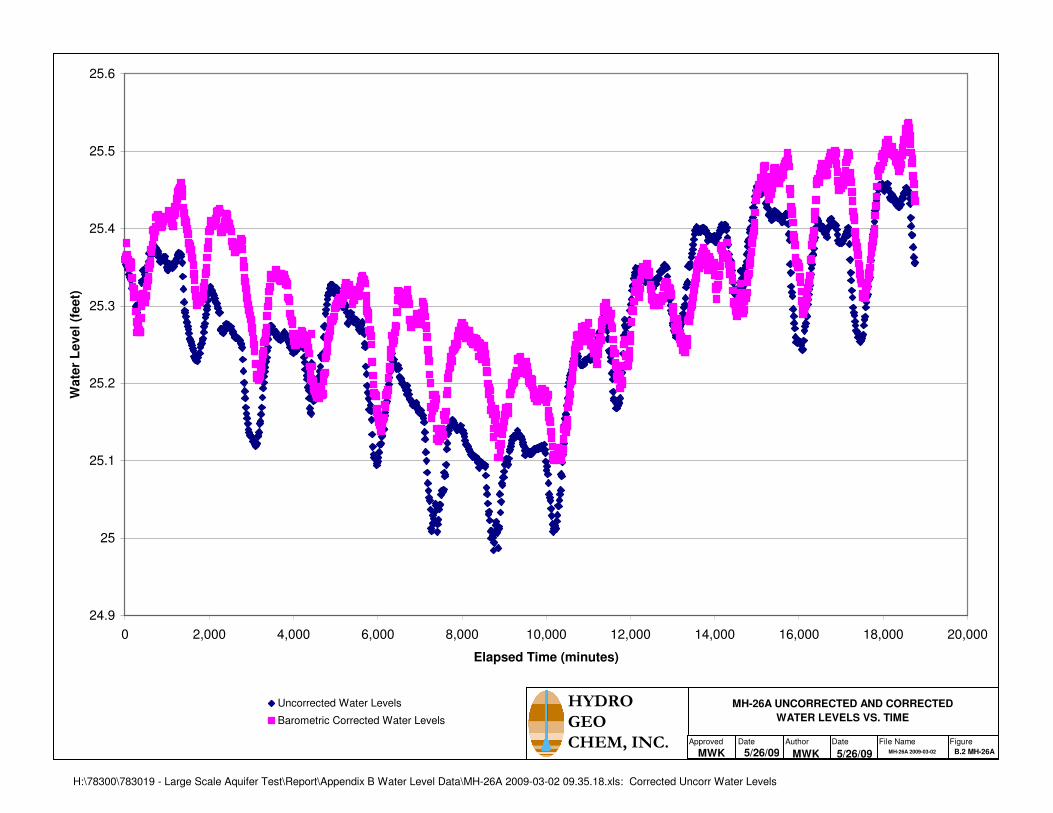
H:\78300\783019 - Large Scale Aquifer Test\Report\Appendix B Water Level Data\MH-26A 2009-03-02 09.35.18.xls: Corrected Uncorr Water Levels
24.9
25
25.1
25.2
25.3
25.4
25.5
25.6
0 2,000 4,000 6,000 8,000 10,000 12,000 14,000 16,000 18,000 20,000
Elapsed Time (minutes)
Wate
r L
evel
(feet)
Uncorrected Water Levels
Barometric Corrected Water Levels
MH-26A UNCORRECTED AND CORRECTED
WATER LEVELS VS. TIME
HYDRO
GEO
CHEM, INC. Approved FigureDateAuthorDate File Name
MWK 5/26/09 B.2 MH-26AMH-26A 2009-03-025/26/09MWK
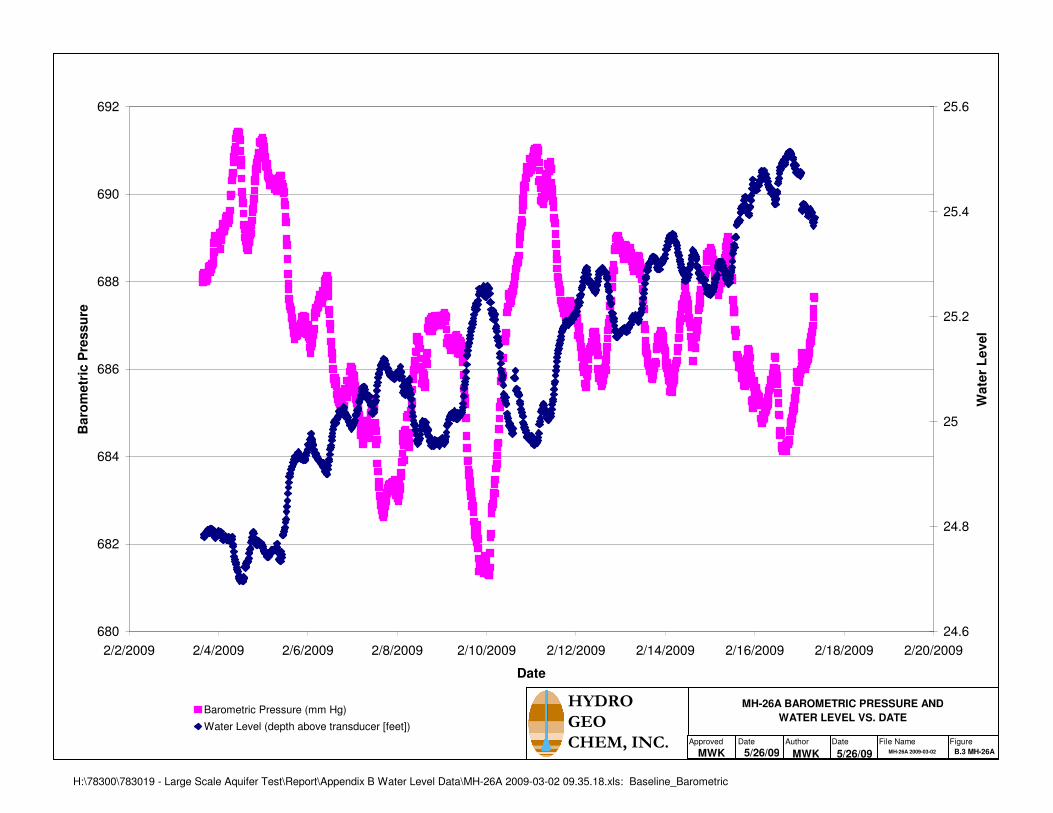
H:\78300\783019 - Large Scale Aquifer Test\Report\Appendix B Water Level Data\MH-26A 2009-03-02 09.35.18.xls: Baseline_Barometric
680
682
684
686
688
690
692
2/2/2009 2/4/2009 2/6/2009 2/8/2009 2/10/2009 2/12/2009 2/14/2009 2/16/2009 2/18/2009 2/20/2009
Date
Baro
metr
ic P
ressu
re
24.6
24.8
25
25.2
25.4
25.6
Wate
r L
evel
Barometric Pressure (mm Hg)
Water Level (depth above transducer [feet])
MH-26A BAROMETRIC PRESSURE AND
WATER LEVEL VS. DATE
HYDRO
GEO
CHEM, INC. Approved FigureDateAuthorDate File Name
MWK 5/26/09 B.3 MH-26AMH-26A 2009-03-025/26/09MWK
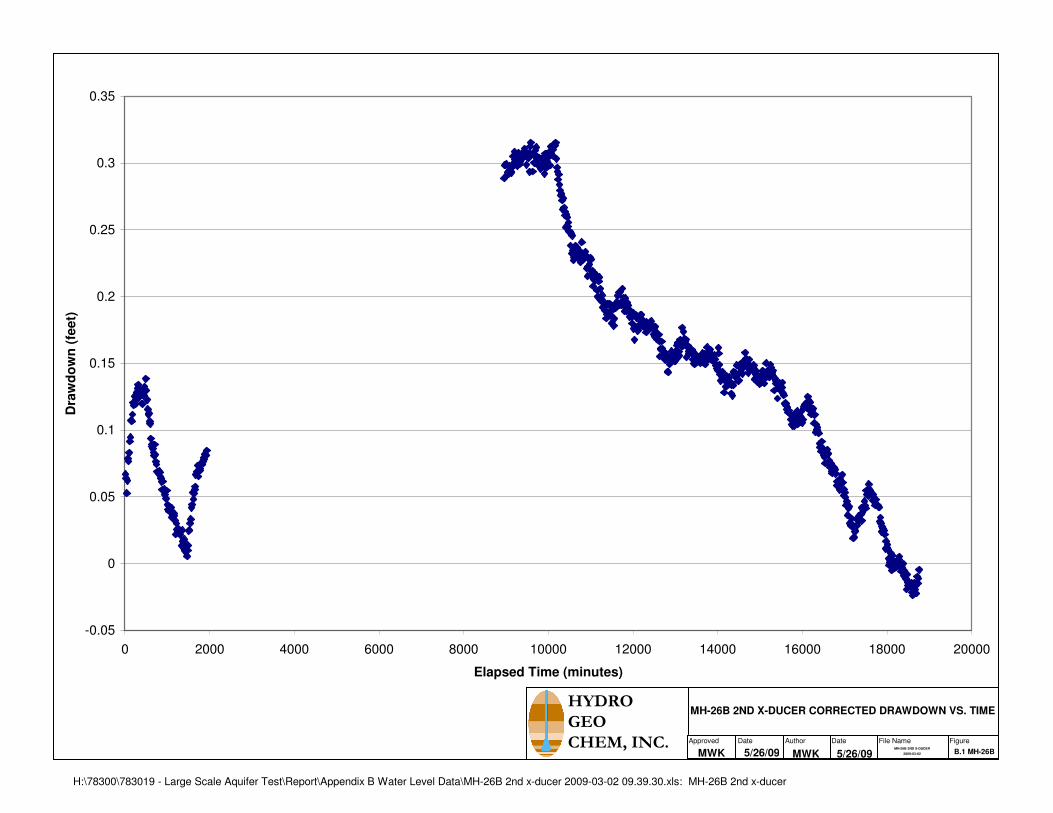
H:\78300\783019 - Large Scale Aquifer Test\Report\Appendix B Water Level Data\MH-26B 2nd x-ducer 2009-03-02 09.39.30.xls: MH-26B 2nd x-ducer
-0.05
0
0.05
0.1
0.15
0.2
0.25
0.3
0.35
0 2000 4000 6000 8000 10000 12000 14000 16000 18000 20000
Elapsed Time (minutes)
Dra
wd
ow
n (
feet)
MH-26B 2ND X-DUCER CORRECTED DRAWDOWN VS. TIMEHYDRO
GEO
CHEM, INC. Approved FigureDateAuthorDate File Name
MWK 5/26/09 B.1 MH-26BMH-26B 2ND X-DUCER
2009-03-025/26/09MWK
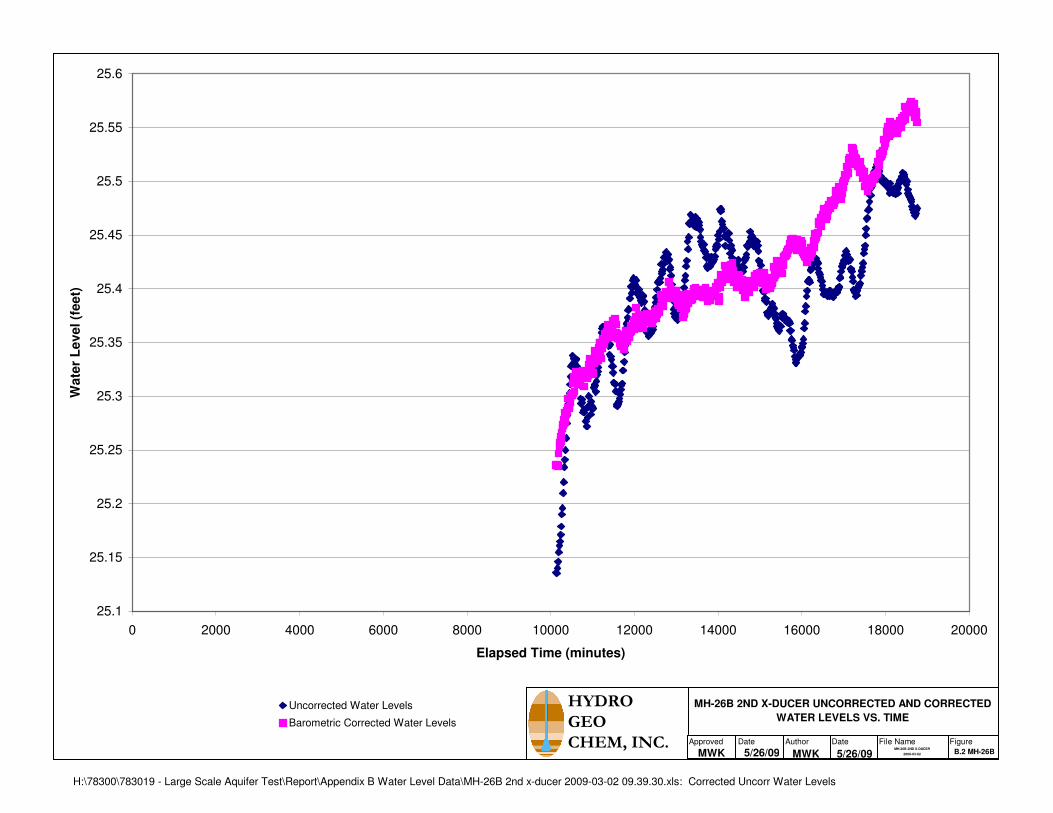
H:\78300\783019 - Large Scale Aquifer Test\Report\Appendix B Water Level Data\MH-26B 2nd x-ducer 2009-03-02 09.39.30.xls: Corrected Uncorr Water Levels
25.1
25.15
25.2
25.25
25.3
25.35
25.4
25.45
25.5
25.55
25.6
0 2000 4000 6000 8000 10000 12000 14000 16000 18000 20000
Elapsed Time (minutes)
Wate
r L
evel (f
eet)
Uncorrected Water Levels
Barometric Corrected Water Levels
MH-26B 2ND X-DUCER UNCORRECTED AND CORRECTED
WATER LEVELS VS. TIME
HYDRO
GEO
CHEM, INC. Approved FigureDateAuthorDate File Name
MWK 5/26/09 B.2 MH-26BMH-26B 2ND X-DUCER
2009-03-025/26/09MWK
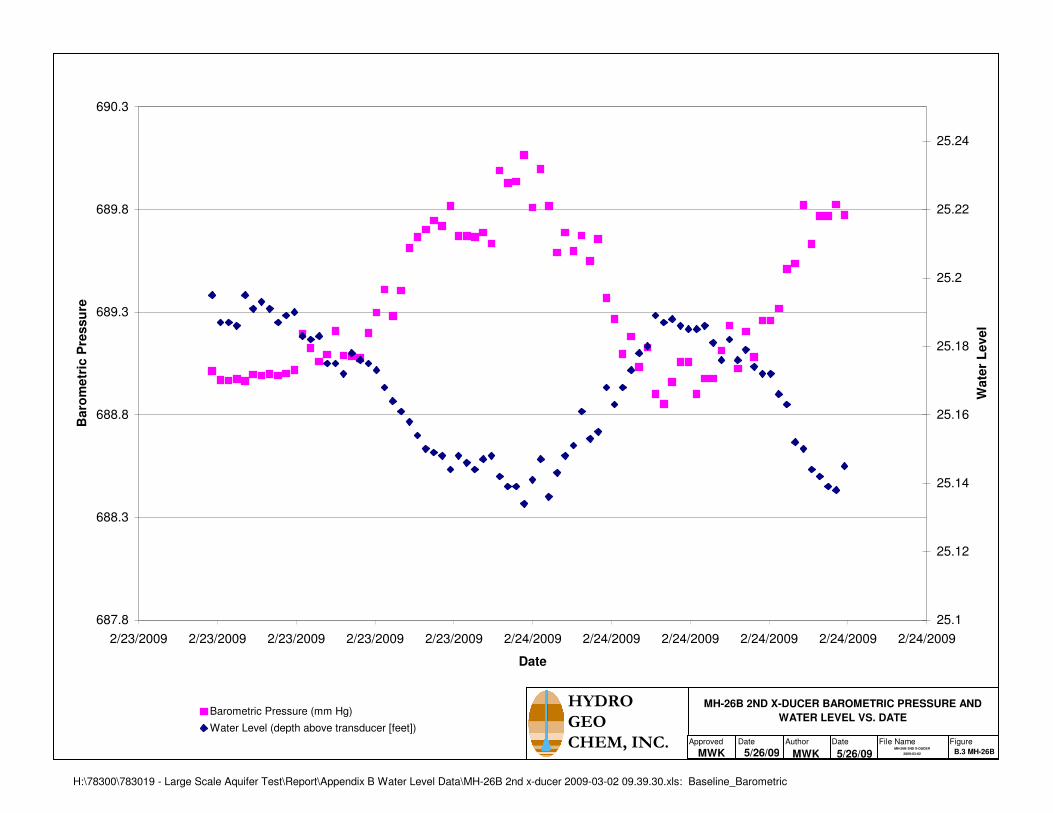
H:\78300\783019 - Large Scale Aquifer Test\Report\Appendix B Water Level Data\MH-26B 2nd x-ducer 2009-03-02 09.39.30.xls: Baseline_Barometric
687.8
688.3
688.8
689.3
689.8
690.3
2/23/2009 2/23/2009 2/23/2009 2/23/2009 2/23/2009 2/24/2009 2/24/2009 2/24/2009 2/24/2009 2/24/2009 2/24/2009
Date
Baro
metr
ic P
ressu
re
25.1
25.12
25.14
25.16
25.18
25.2
25.22
25.24
Wate
r L
evel
Barometric Pressure (mm Hg)
Water Level (depth above transducer [feet])
MH-26B 2ND X-DUCER BAROMETRIC PRESSURE AND
WATER LEVEL VS. DATE
HYDRO
GEO
CHEM, INC. Approved FigureDateAuthorDate File Name
MWK 5/26/09 B.3 MH-26BMH-26B 2ND X-DUCER
2009-03-025/26/09MWK
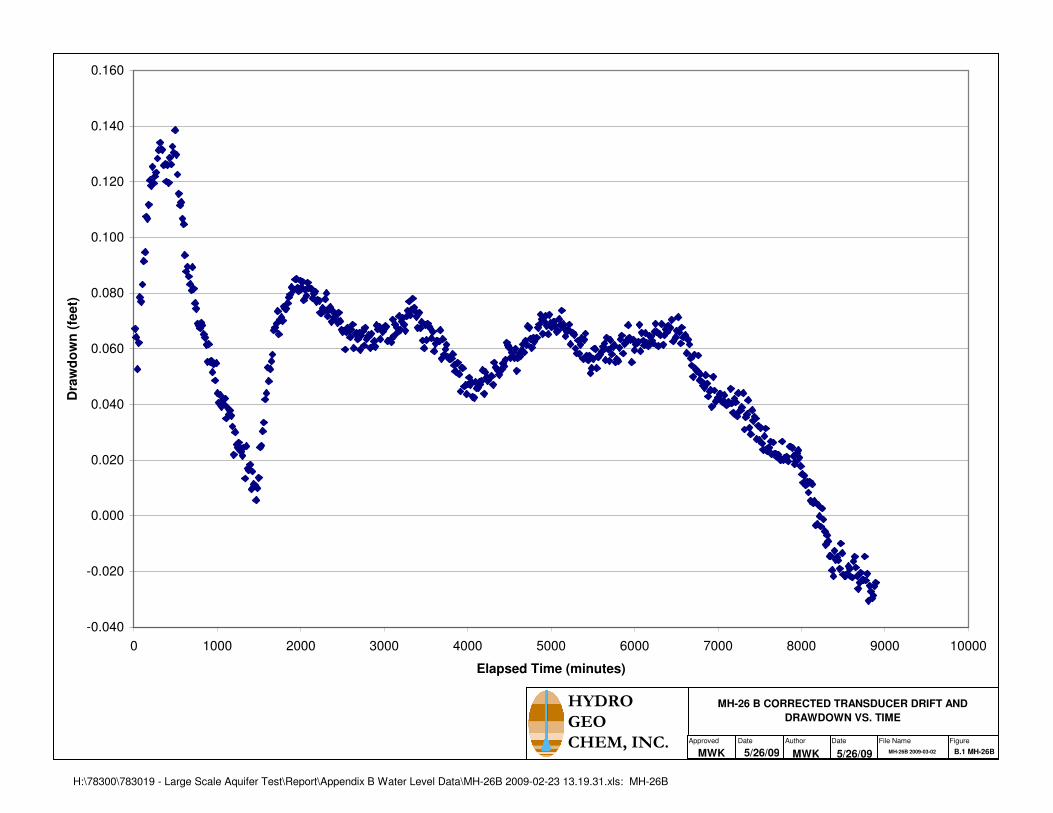
H:\78300\783019 - Large Scale Aquifer Test\Report\Appendix B Water Level Data\MH-26B 2009-02-23 13.19.31.xls: MH-26B
-0.040
-0.020
0.000
0.020
0.040
0.060
0.080
0.100
0.120
0.140
0.160
0 1000 2000 3000 4000 5000 6000 7000 8000 9000 10000
Elapsed Time (minutes)
Dra
wd
ow
n (
feet)
MH-26 B CORRECTED TRANSDUCER DRIFT AND
DRAWDOWN VS. TIME
HYDRO
GEO
CHEM, INC. Approved FigureDateAuthorDate File Name
MWK 5/26/09 B.1 MH-26BMH-26B 2009-03-025/26/09MWK
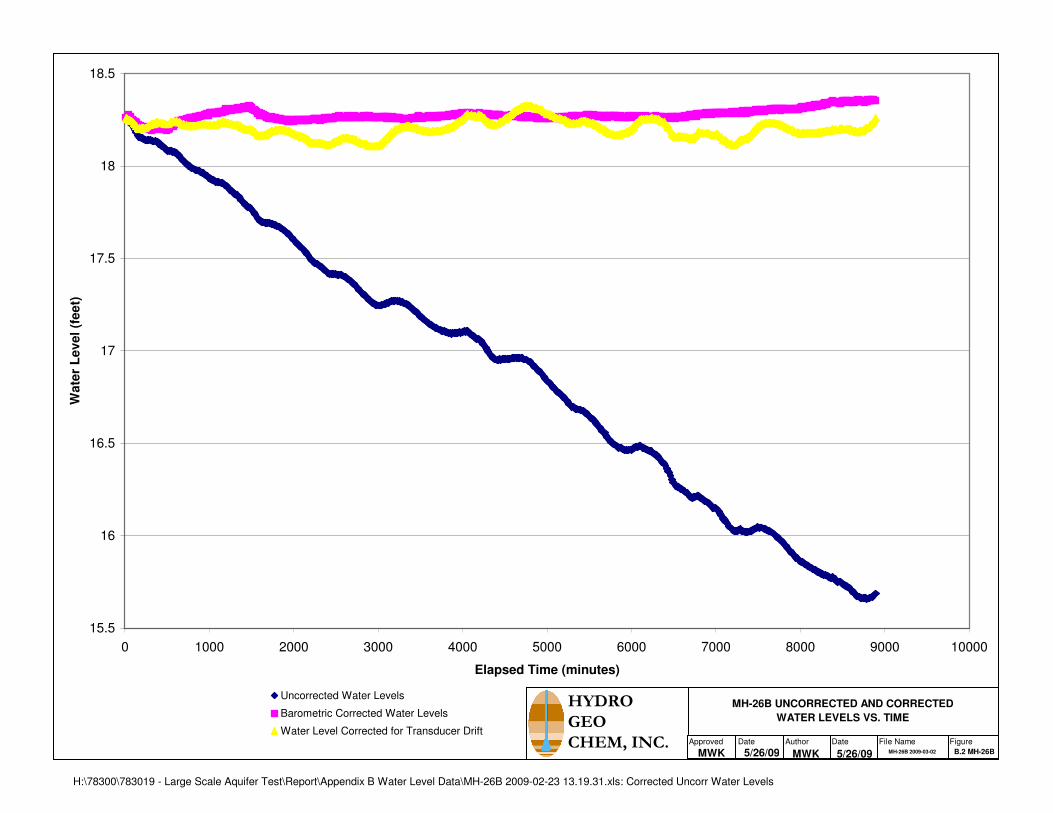
H:\78300\783019 - Large Scale Aquifer Test\Report\Appendix B Water Level Data\MH-26B 2009-02-23 13.19.31.xls: Corrected Uncorr Water Levels
15.5
16
16.5
17
17.5
18
18.5
0 1000 2000 3000 4000 5000 6000 7000 8000 9000 10000
Elapsed Time (minutes)
Wate
r L
evel
(feet)
Uncorrected Water Levels
Barometric Corrected Water Levels
Water Level Corrected for Transducer Drift
MH-26B UNCORRECTED AND CORRECTED
WATER LEVELS VS. TIME
HYDRO
GEO
CHEM, INC. Approved FigureDateAuthorDate File Name
MWK 5/26/09 B.2 MH-26BMH-26B 2009-03-025/26/09MWK
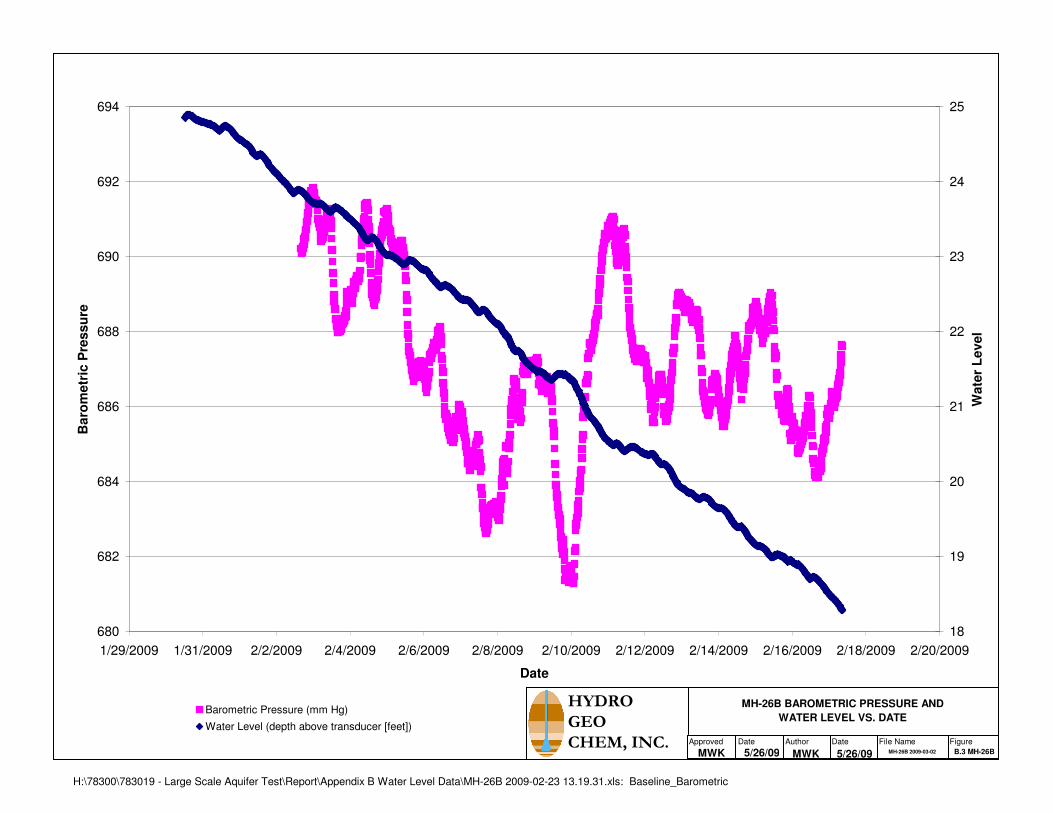
H:\78300\783019 - Large Scale Aquifer Test\Report\Appendix B Water Level Data\MH-26B 2009-02-23 13.19.31.xls: Baseline_Barometric
680
682
684
686
688
690
692
694
1/29/2009 1/31/2009 2/2/2009 2/4/2009 2/6/2009 2/8/2009 2/10/2009 2/12/2009 2/14/2009 2/16/2009 2/18/2009 2/20/2009
Date
Baro
metr
ic P
ressu
re
18
19
20
21
22
23
24
25
Wate
r L
evel
Barometric Pressure (mm Hg)
Water Level (depth above transducer [feet])
MH-26B BAROMETRIC PRESSURE AND
WATER LEVEL VS. DATE
HYDRO
GEO
CHEM, INC. Approved FigureDateAuthorDate File Name
MWK 5/26/09 B.3 MH-26BMH-26B 2009-03-025/26/09MWK
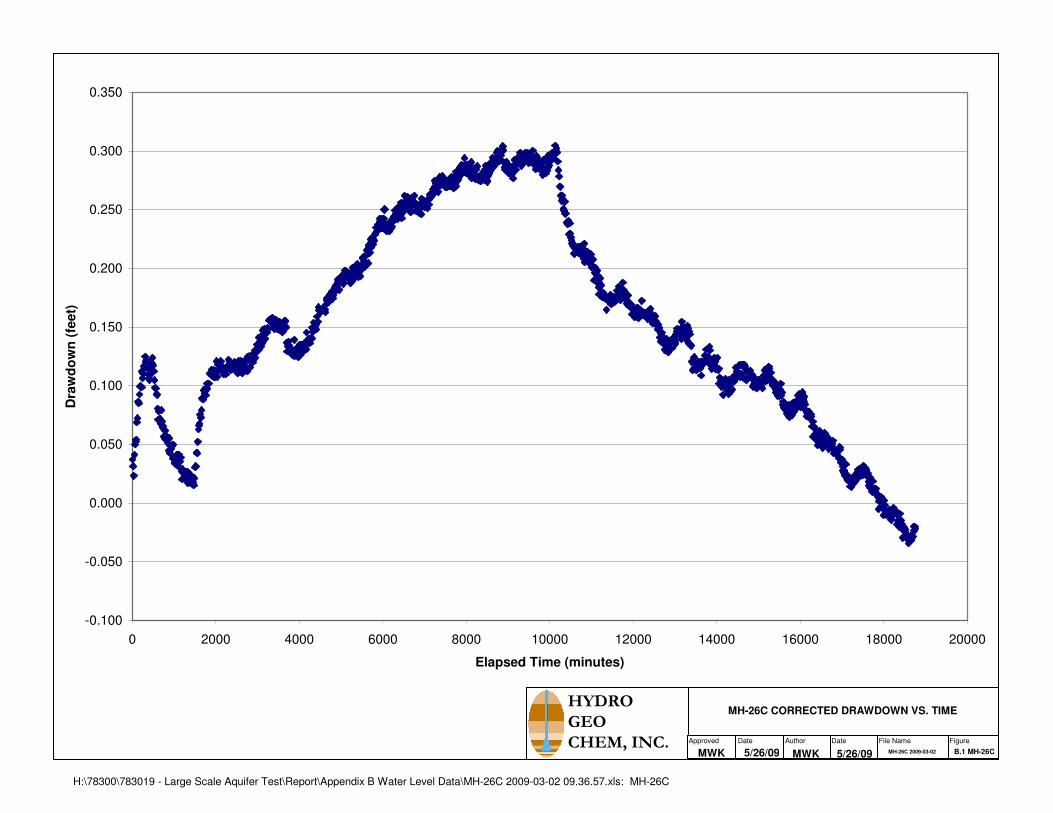
H:\78300\783019 - Large Scale Aquifer Test\Report\Appendix B Water Level Data\MH-26C 2009-03-02 09.36.57.xls: MH-26C
-0.100
-0.050
0.000
0.050
0.100
0.150
0.200
0.250
0.300
0.350
0 2000 4000 6000 8000 10000 12000 14000 16000 18000 20000
Elapsed Time (minutes)
Dra
wd
ow
n (
feet)
MH-26C CORRECTED DRAWDOWN VS. TIMEHYDRO
GEO
CHEM, INC. Approved FigureDateAuthorDate File Name
MWK 5/26/09 B.1 MH-26CMH-26C 2009-03-025/26/09MWK
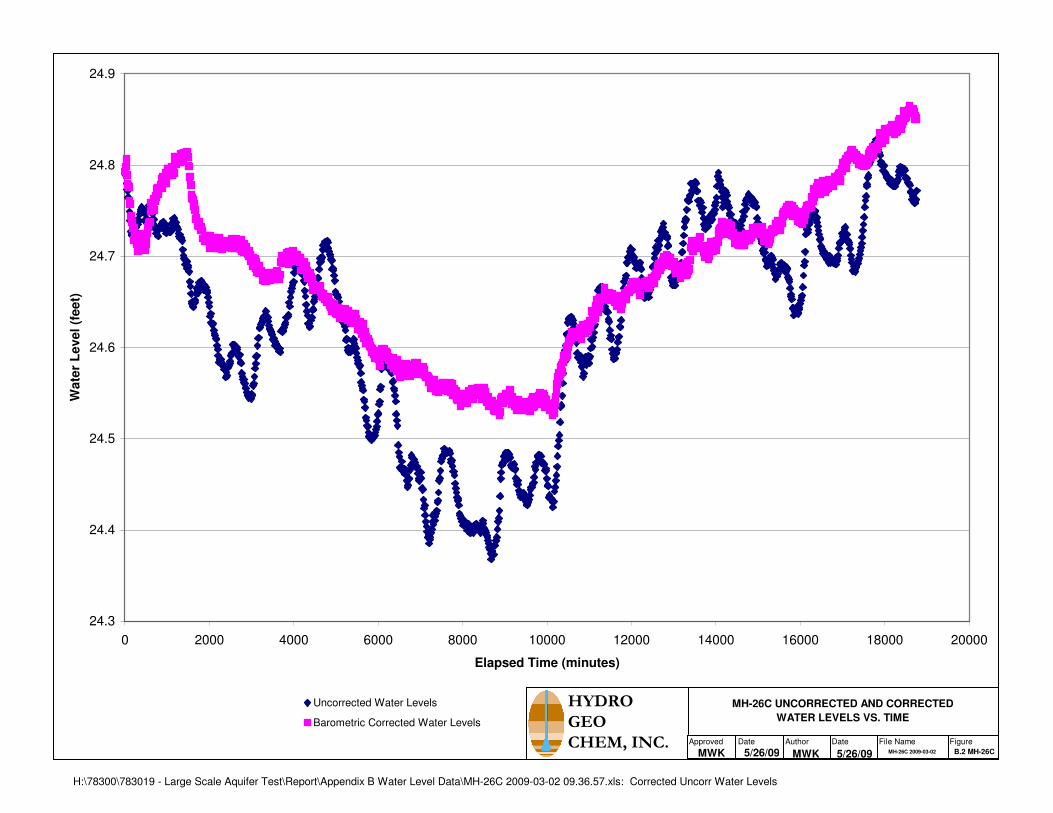
H:\78300\783019 - Large Scale Aquifer Test\Report\Appendix B Water Level Data\MH-26C 2009-03-02 09.36.57.xls: Corrected Uncorr Water Levels
24.3
24.4
24.5
24.6
24.7
24.8
24.9
0 2000 4000 6000 8000 10000 12000 14000 16000 18000 20000
Elapsed Time (minutes)
Wate
r L
evel
(feet)
Uncorrected Water Levels
Barometric Corrected Water Levels
MH-26C UNCORRECTED AND CORRECTED
WATER LEVELS VS. TIME
HYDRO
GEO
CHEM, INC. Approved FigureDateAuthorDate File Name
MWK 5/26/09 B.2 MH-26CMH-26C 2009-03-025/26/09MWK

H:\78300\783019 - Large Scale Aquifer Test\Report\Appendix B Water Level Data\MH-26C 2009-03-02 09.36.57.xls: Baseline_Barometric
680
682
684
686
688
690
692
694
1/29/2009 1/31/2009 2/2/2009 2/4/2009 2/6/2009 2/8/2009 2/10/2009 2/12/2009 2/14/2009 2/16/2009 2/18/2009 2/20/2009
Date
Baro
metr
ic P
ressu
re
24.2
24.3
24.4
24.5
24.6
24.7
24.8
24.9
25
Wate
r L
evel
Barometric Pressure (mm Hg)
Water Level (depth above transducer [feet])
MH-26C BAROMETRIC PRESSURE AND
WATER LEVEL VS. DATE
HYDRO
GEO
CHEM, INC. Approved FigureDateAuthorDate File Name
MWK 5/26/09 B.3 MH-26CMH-26C 2009-03-025/26/09MWK

H:\78300\783019 - Large Scale Aquifer Test\Report\Appendix B Water Level Data\MO-2007-3B 2009-03-02 08.45.24.xls: MO-2007-3B
-0.5
0
0.5
1
1.5
2
0 2000 4000 6000 8000 10000 12000 14000 16000 18000 20000
Elapsed Time (minutes)
Dra
wd
ow
n (
feet)
MO-2007-3B CORRECTED DRAWDOWN VS. TIMEHYDRO
GEO
CHEM, INC. Approved FigureDateAuthorDate File Name
MWK 5/26/09 B.1 MO-3BMO-2007-3B
2009-03-025/26/09MWK
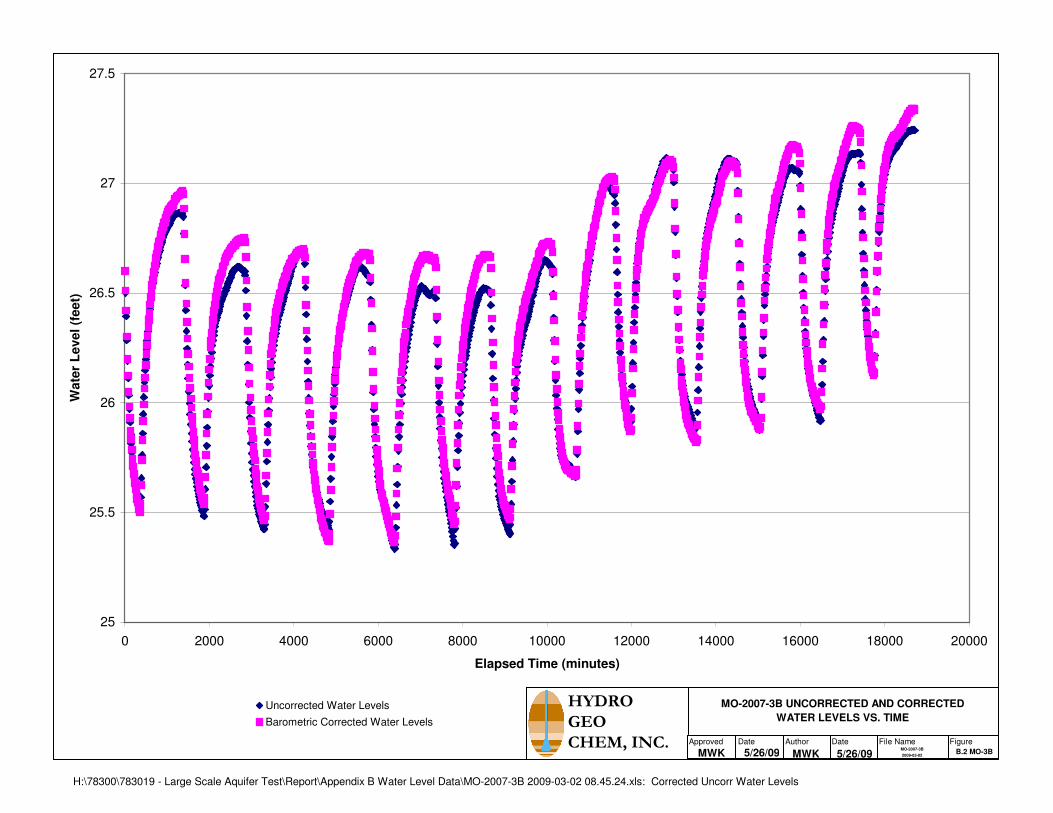
H:\78300\783019 - Large Scale Aquifer Test\Report\Appendix B Water Level Data\MO-2007-3B 2009-03-02 08.45.24.xls: Corrected Uncorr Water Levels
25
25.5
26
26.5
27
27.5
0 2000 4000 6000 8000 10000 12000 14000 16000 18000 20000
Elapsed Time (minutes)
Wate
r L
evel
(feet)
Uncorrected Water Levels
Barometric Corrected Water Levels
MO-2007-3B UNCORRECTED AND CORRECTED
WATER LEVELS VS. TIME
HYDRO
GEO
CHEM, INC. Approved FigureDateAuthorDate File Name
MWK 5/26/09 B.2 MO-3BMO-2007-3B
2009-03-025/26/09MWK

H:\78300\783019 - Large Scale Aquifer Test\Report\Appendix B Water Level Data\MO-2007-3B 2009-03-02 08.45.24.xls: Baseline_Barometric
680
682
684
686
688
690
692
694
1/29/2009 1/31/2009 2/2/2009 2/4/2009 2/6/2009 2/8/2009 2/10/2009 2/12/2009 2/14/2009 2/16/2009 2/18/2009 2/20/2009
Date
Baro
metr
ic P
ressu
re
24.5
25
25.5
26
26.5
27
27.5
Wate
r L
evel
Barometric Pressure (mm Hg)
Water Level (depth above transducer [feet])
MO-2007-3B BAROMETRIC PRESSURE AND
WATER LEVEL VS. DATE
HYDRO
GEO
CHEM, INC. Approved FigureDateAuthorDate File Name
MWK 5/26/09 B.3 MO-3BMO-2007-3B
2009-03-025/26/09MWK
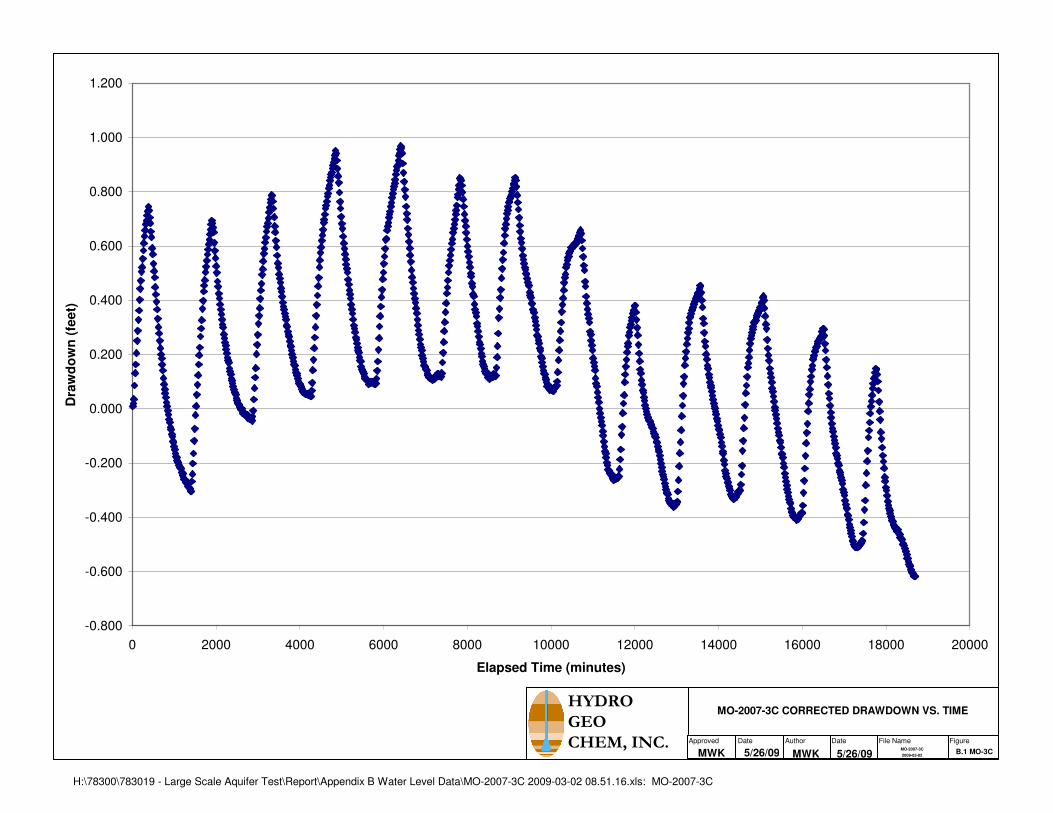
H:\78300\783019 - Large Scale Aquifer Test\Report\Appendix B Water Level Data\MO-2007-3C 2009-03-02 08.51.16.xls: MO-2007-3C
-0.800
-0.600
-0.400
-0.200
0.000
0.200
0.400
0.600
0.800
1.000
1.200
0 2000 4000 6000 8000 10000 12000 14000 16000 18000 20000
Elapsed Time (minutes)
Dra
wd
ow
n (
feet)
MO-2007-3C CORRECTED DRAWDOWN VS. TIMEHYDRO
GEO
CHEM, INC. Approved FigureDateAuthorDate File Name
MWK 5/26/09 B.1 MO-3CMO-2007-3C
2009-03-025/26/09MWK

H:\78300\783019 - Large Scale Aquifer Test\Report\Appendix B Water Level Data\MO-2007-3C 2009-03-02 08.51.16.xls: Corrected Uncorr Water Levels
24.8
25
25.2
25.4
25.6
25.8
26
26.2
26.4
26.6
26.8
0 2000 4000 6000 8000 10000 12000 14000 16000 18000 20000
Elapsed Time (minutes)
Wate
r L
evel
(feet)
Uncorected Water Levels
Barometric Corrected Water Levels
MO-2007-3C UNCORRECTED AND CORRECTED
WATER LEVELS VS. TIME
HYDRO
GEO
CHEM, INC. Approved FigureDateAuthorDate File Name
MWK 5/26/09 B.2 MO-3CMO-2007-3C
2009-03-025/26/09MWK
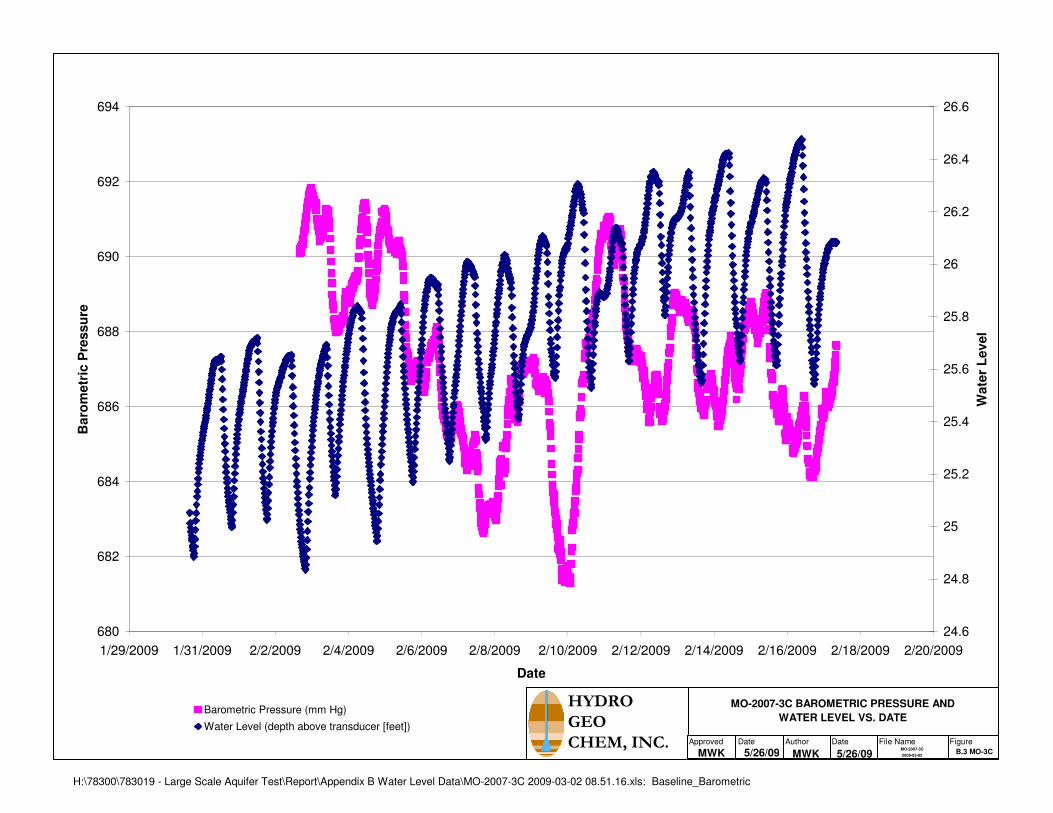
H:\78300\783019 - Large Scale Aquifer Test\Report\Appendix B Water Level Data\MO-2007-3C 2009-03-02 08.51.16.xls: Baseline_Barometric
680
682
684
686
688
690
692
694
1/29/2009 1/31/2009 2/2/2009 2/4/2009 2/6/2009 2/8/2009 2/10/2009 2/12/2009 2/14/2009 2/16/2009 2/18/2009 2/20/2009
Date
Baro
metr
ic P
ressu
re
24.6
24.8
25
25.2
25.4
25.6
25.8
26
26.2
26.4
26.6
Wate
r L
evel
Barometric Pressure (mm Hg)
Water Level (depth above transducer [feet])
MO-2007-3C BAROMETRIC PRESSURE AND
WATER LEVEL VS. DATE
HYDRO
GEO
CHEM, INC. Approved FigureDateAuthorDate File Name
MWK 5/26/09 B.3 MO-3CMO-2007-3C
2009-03-025/26/09MWK
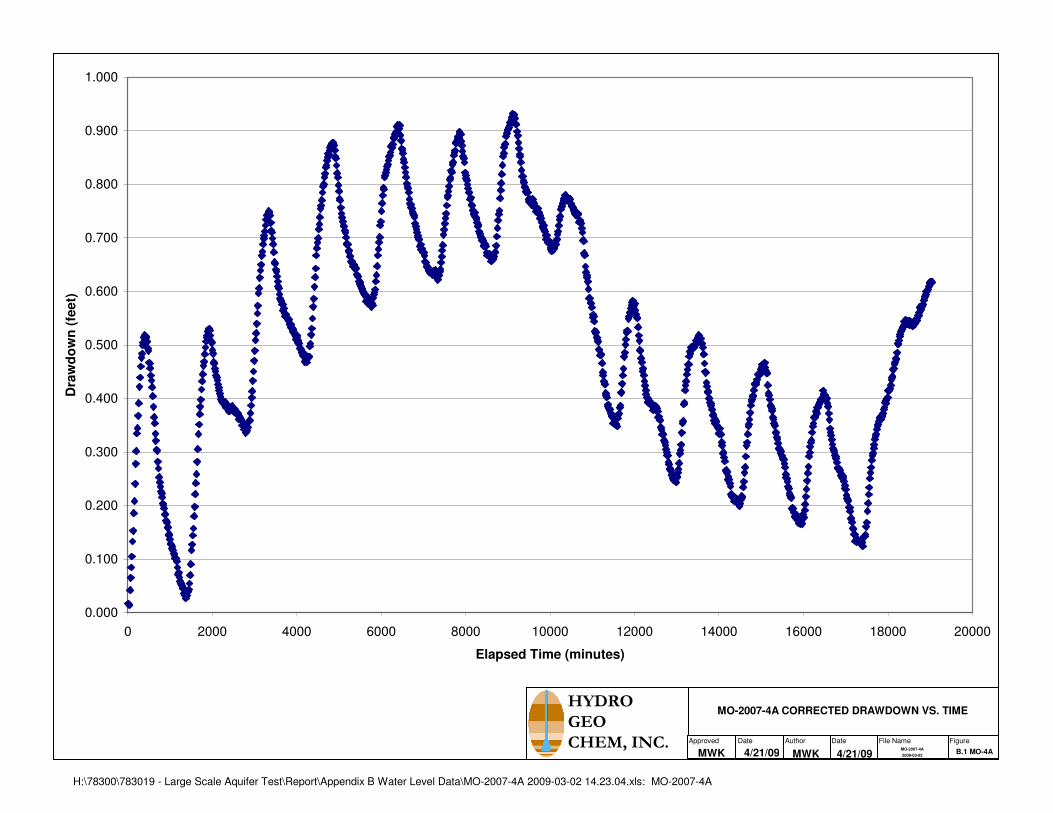
H:\78300\783019 - Large Scale Aquifer Test\Report\Appendix B Water Level Data\MO-2007-4A 2009-03-02 14.23.04.xls: MO-2007-4A
0.000
0.100
0.200
0.300
0.400
0.500
0.600
0.700
0.800
0.900
1.000
0 2000 4000 6000 8000 10000 12000 14000 16000 18000 20000
Elapsed Time (minutes)
Dra
wd
ow
n (
feet)
MO-2007-4A CORRECTED DRAWDOWN VS. TIMEHYDRO
GEO
CHEM, INC. Approved FigureDateAuthorDate File Name
MWK 4/21/09 B.1 MO-4AMO-2007-4A
2009-03-024/21/09MWK
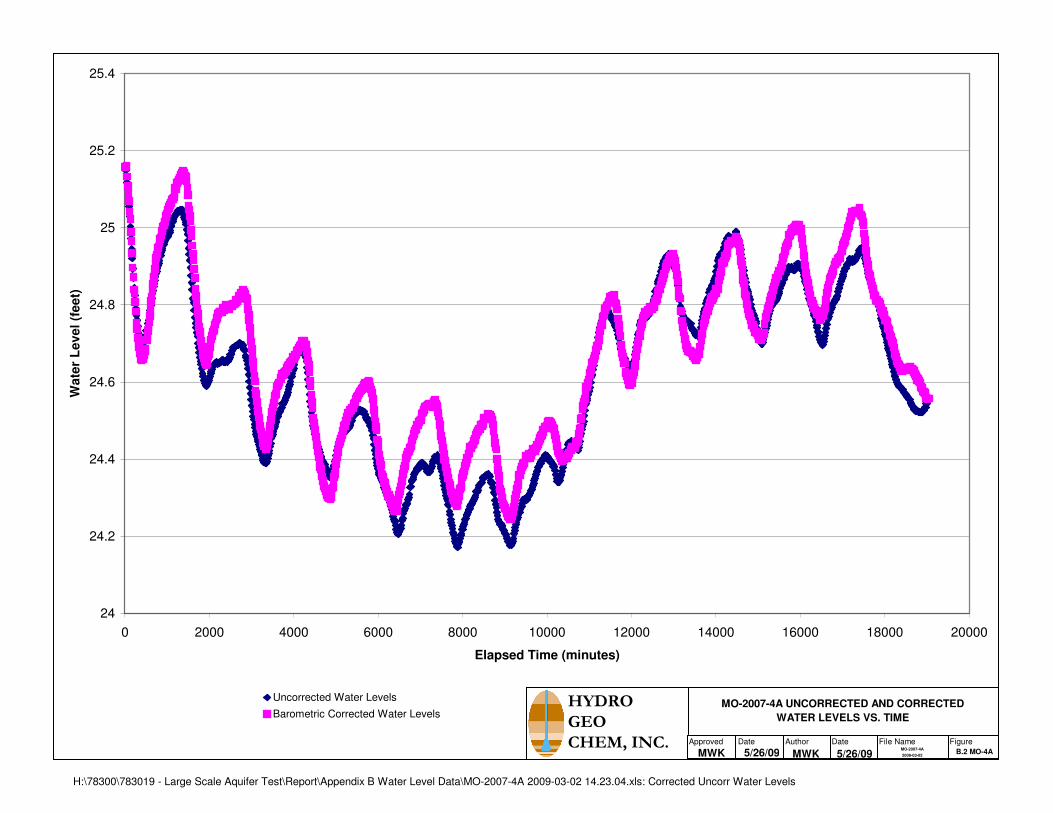
H:\78300\783019 - Large Scale Aquifer Test\Report\Appendix B Water Level Data\MO-2007-4A 2009-03-02 14.23.04.xls: Corrected Uncorr Water Levels
24
24.2
24.4
24.6
24.8
25
25.2
25.4
0 2000 4000 6000 8000 10000 12000 14000 16000 18000 20000
Elapsed Time (minutes)
Wate
r L
evel
(feet)
Uncorrected Water Levels
Barometric Corrected Water LevelsMO-2007-4A UNCORRECTED AND CORRECTED
WATER LEVELS VS. TIME
HYDRO
GEO
CHEM, INC. Approved FigureDateAuthorDate File Name
MWK 5/26/09 B.2 MO-4AMO-2007-4A
2009-03-025/26/09MWK
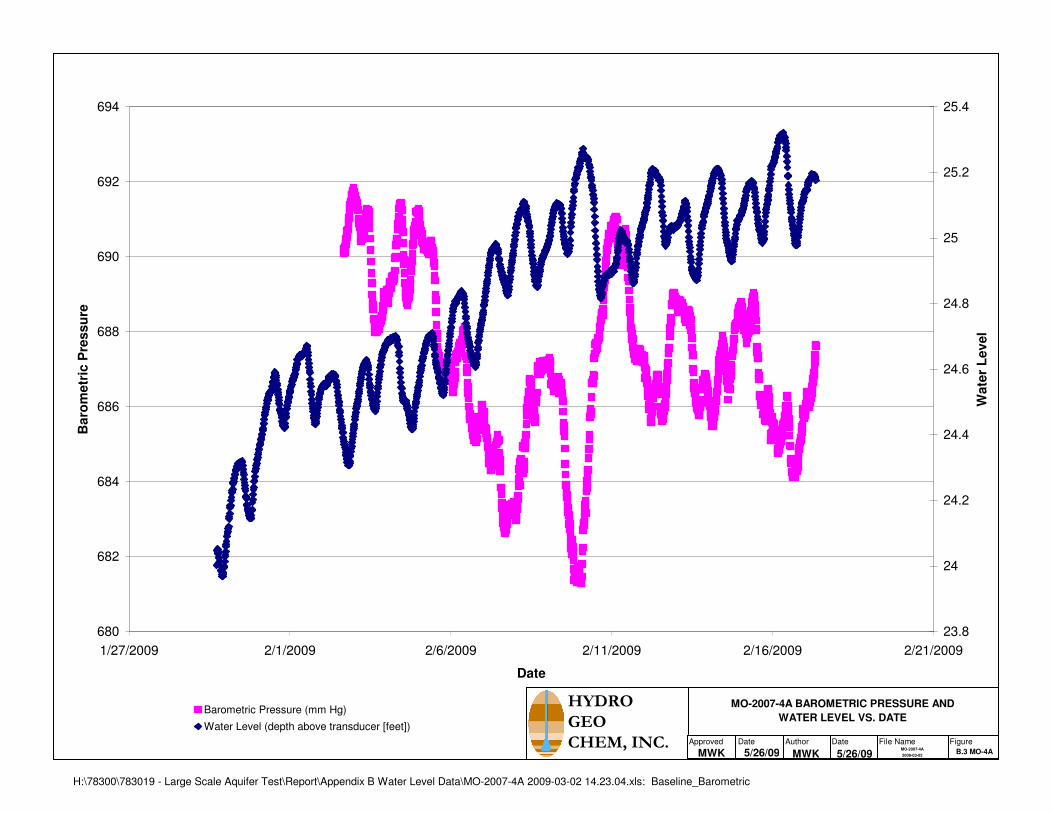
H:\78300\783019 - Large Scale Aquifer Test\Report\Appendix B Water Level Data\MO-2007-4A 2009-03-02 14.23.04.xls: Baseline_Barometric
680
682
684
686
688
690
692
694
1/27/2009 2/1/2009 2/6/2009 2/11/2009 2/16/2009 2/21/2009
Date
Baro
metr
ic P
ressu
re
23.8
24
24.2
24.4
24.6
24.8
25
25.2
25.4
Wate
r L
evel
Barometric Pressure (mm Hg)
Water Level (depth above transducer [feet])
MO-2007-4A BAROMETRIC PRESSURE AND
WATER LEVEL VS. DATE
HYDRO
GEO
CHEM, INC. Approved FigureDateAuthorDate File Name
MWK 5/26/09 B.3 MO-4AMO-2007-4A
2009-03-025/26/09MWK
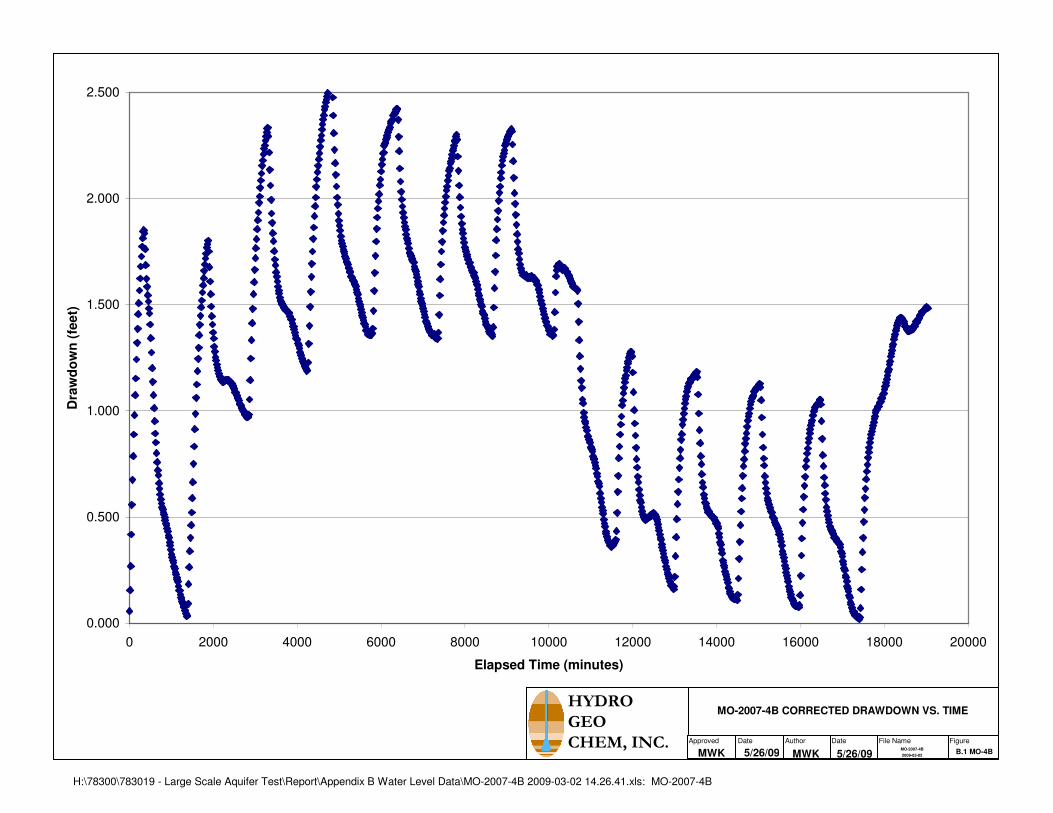
H:\78300\783019 - Large Scale Aquifer Test\Report\Appendix B Water Level Data\MO-2007-4B 2009-03-02 14.26.41.xls: MO-2007-4B
0.000
0.500
1.000
1.500
2.000
2.500
0 2000 4000 6000 8000 10000 12000 14000 16000 18000 20000
Elapsed Time (minutes)
Dra
wd
ow
n (
feet)
MO-2007-4B CORRECTED DRAWDOWN VS. TIMEHYDRO
GEO
CHEM, INC. Approved FigureDateAuthorDate File Name
MWK 5/26/09 B.1 MO-4BMO-2007-4B
2009-03-025/26/09MWK

H:\78300\783019 - Large Scale Aquifer Test\Report\Appendix B Water Level Data\MO-2007-4B 2009-03-02 14.26.41.xls: Corrected Uncorr Water Levels
22
22.5
23
23.5
24
24.5
25
0 2000 4000 6000 8000 10000 12000 14000 16000 18000 20000
Elapsed Time (minutes)
Wate
r L
evel
(feet)
Uncorected Water Levels
Barometric Corrected Water Levels
MO-2007-4B UNCORRECTED AND CORRECTED
WATER LEVELS VS. TIME
HYDRO
GEO
CHEM, INC. Approved FigureDateAuthorDate File Name
MWK 5/26/09 B.2 MO-4BMO-2007-4B
2009-03-025/26/09MWK
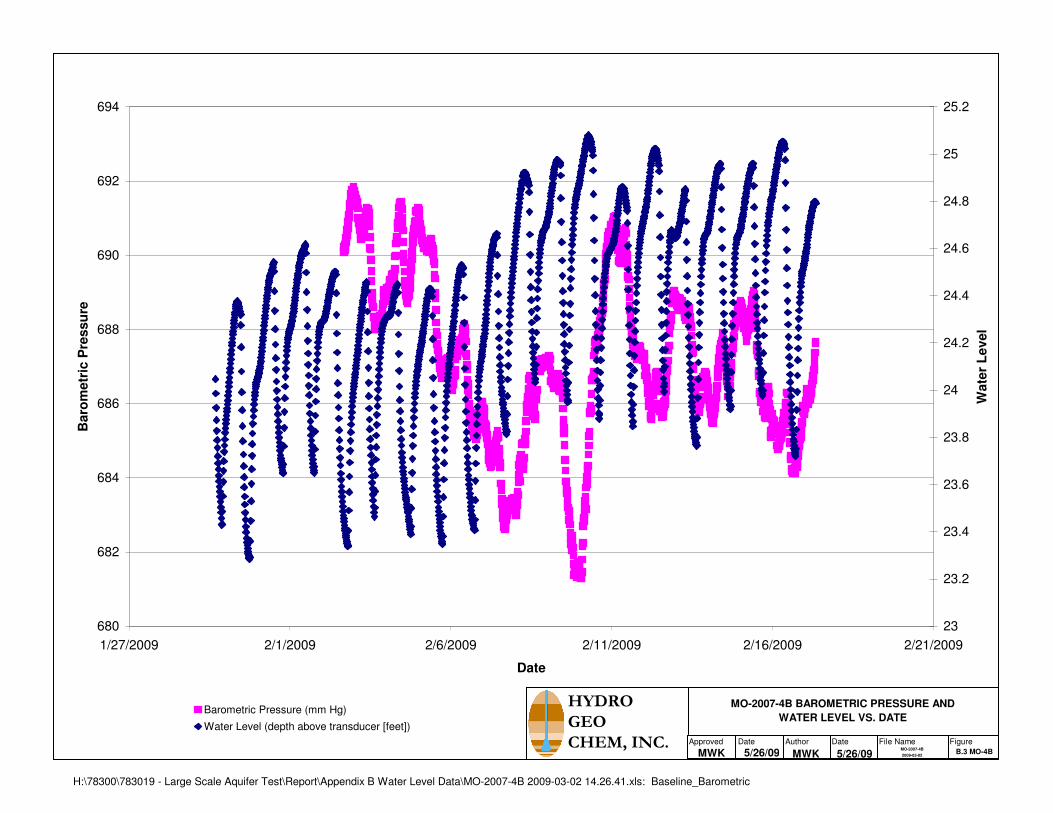
H:\78300\783019 - Large Scale Aquifer Test\Report\Appendix B Water Level Data\MO-2007-4B 2009-03-02 14.26.41.xls: Baseline_Barometric
680
682
684
686
688
690
692
694
1/27/2009 2/1/2009 2/6/2009 2/11/2009 2/16/2009 2/21/2009
Date
Baro
metr
ic P
ressu
re
23
23.2
23.4
23.6
23.8
24
24.2
24.4
24.6
24.8
25
25.2
Wate
r L
evel
Barometric Pressure (mm Hg)
Water Level (depth above transducer [feet])
MO-2007-4B BAROMETRIC PRESSURE AND
WATER LEVEL VS. DATE
HYDRO
GEO
CHEM, INC. Approved FigureDateAuthorDate File Name
MWK 5/26/09 B.3 MO-4BMO-2007-4B
2009-03-025/26/09MWK

H:\78300\783019 - Large Scale Aquifer Test\Report\Appendix B Water Level Data\MO-2007-4C 2009-03-02 14.24.48.xls: MO-2007-4C
0.000
0.500
1.000
1.500
2.000
2.500
0 2000 4000 6000 8000 10000 12000 14000 16000 18000 20000
Elapsed Time (minutes)
Dra
wd
ow
n (
feet)
MO-2007-4C CORRECTED DRAWDOWN VS. TIMEHYDRO
GEO
CHEM, INC. Approved FigureDateAuthorDate File Name
MWK 5/26/09 B.1 MO-4CMO-2007-4C
2009-3-025/26/09MWK
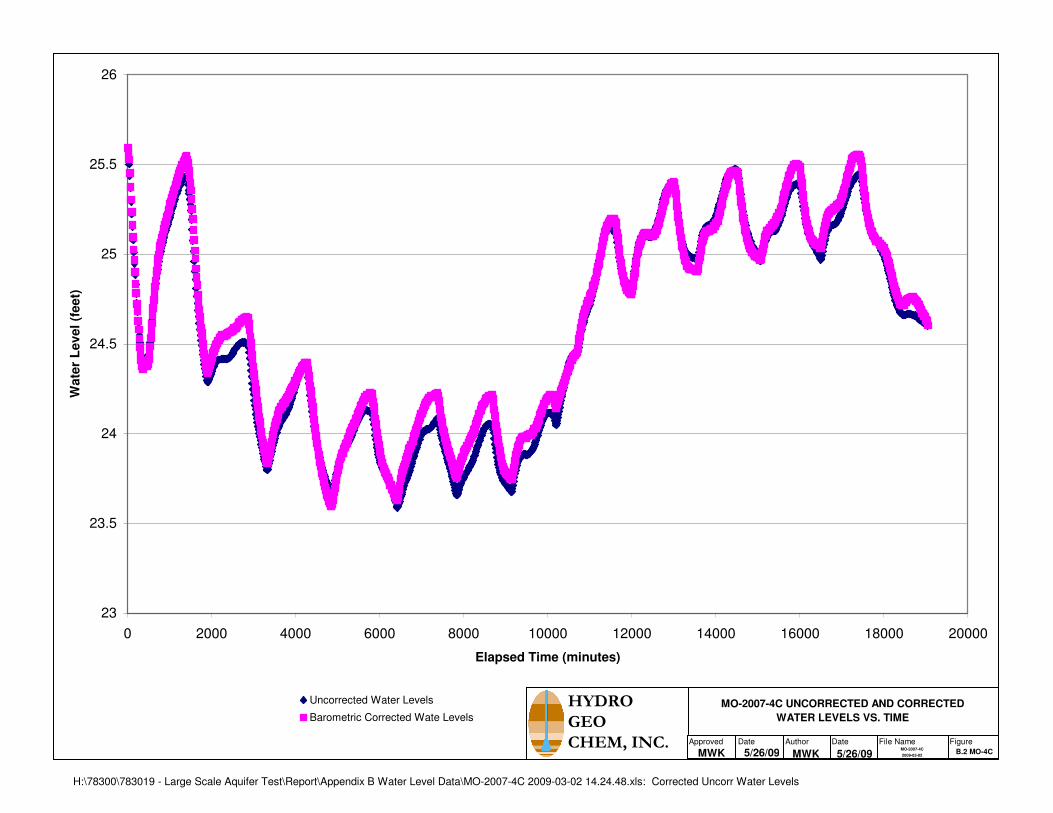
H:\78300\783019 - Large Scale Aquifer Test\Report\Appendix B Water Level Data\MO-2007-4C 2009-03-02 14.24.48.xls: Corrected Uncorr Water Levels
23
23.5
24
24.5
25
25.5
26
0 2000 4000 6000 8000 10000 12000 14000 16000 18000 20000
Elapsed Time (minutes)
Wate
r L
evel
(feet)
Uncorrected Water Levels
Barometric Corrected Wate Levels
MO-2007-4C UNCORRECTED AND CORRECTED
WATER LEVELS VS. TIME
HYDRO
GEO
CHEM, INC. Approved FigureDateAuthorDate File Name
MWK 5/26/09 B.2 MO-4CMO-2007-4C
2009-03-025/26/09MWK
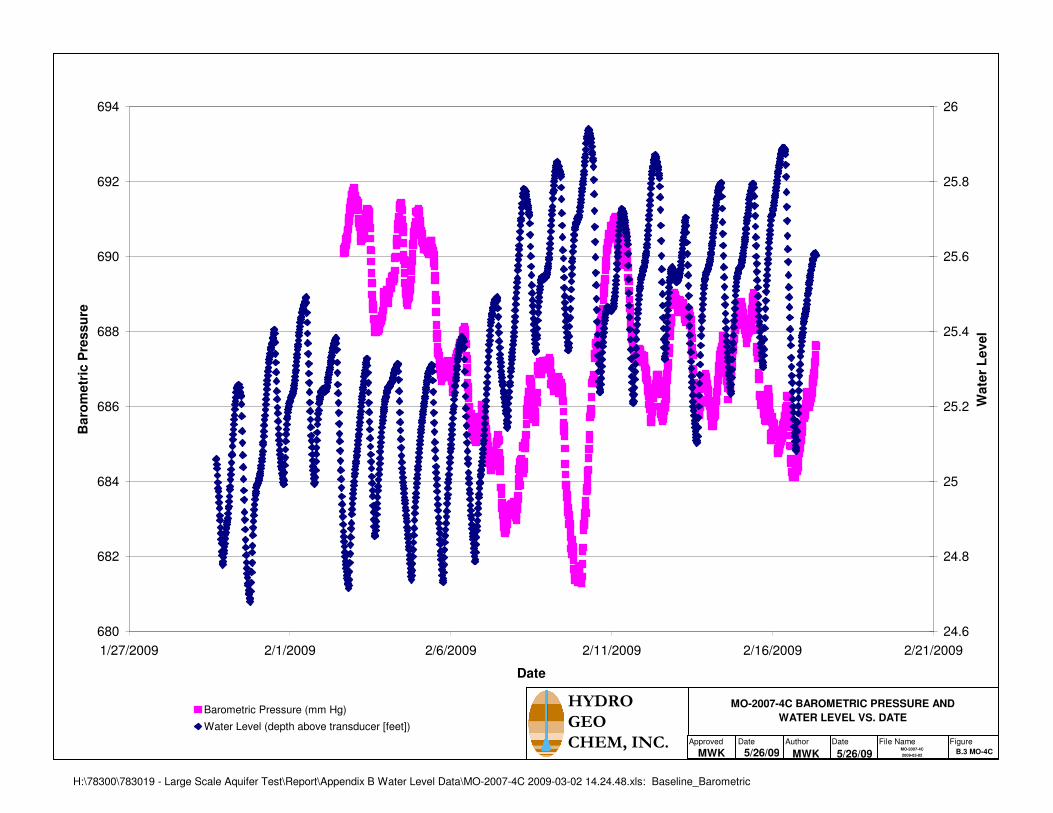
H:\78300\783019 - Large Scale Aquifer Test\Report\Appendix B Water Level Data\MO-2007-4C 2009-03-02 14.24.48.xls: Baseline_Barometric
680
682
684
686
688
690
692
694
1/27/2009 2/1/2009 2/6/2009 2/11/2009 2/16/2009 2/21/2009
Date
Baro
metr
ic P
ressu
re
24.6
24.8
25
25.2
25.4
25.6
25.8
26
Wate
r L
evel
Barometric Pressure (mm Hg)
Water Level (depth above transducer [feet])
MO-2007-4C BAROMETRIC PRESSURE AND
WATER LEVEL VS. DATE
HYDRO
GEO
CHEM, INC. Approved FigureDateAuthorDate File Name
MWK 5/26/09 B.3 MO-4CMO-2007-4C
2009-03-025/26/09MWK

H:\78300\783019 - Large Scale Aquifer Test\Report\Appendix B Water Level Data\NP-2 2009-03-02 09.13.17.xls: NP-2
-0.400
-0.300
-0.200
-0.100
0.000
0.100
0.200
0 2000 4000 6000 8000 10000 12000 14000 16000 18000 20000
Elapsed Time (minutes)
Dra
wd
ow
n (
feet)
NP-2 CORRECTED DRAWDOWN VS. TIMEHYDRO
GEO
CHEM, INC. Approved FigureDateAuthorDate File Name
MWK 5/26/09 B.1 NP-2NP-2 2009-03-025/26/09MWK
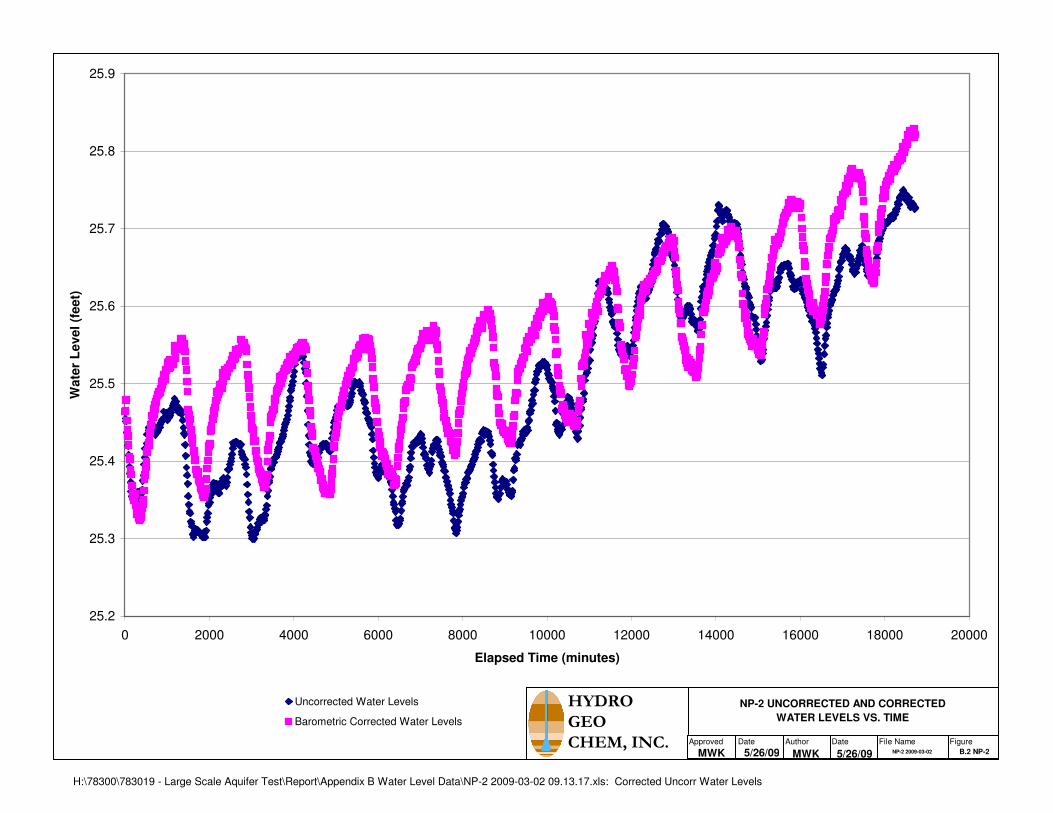
H:\78300\783019 - Large Scale Aquifer Test\Report\Appendix B Water Level Data\NP-2 2009-03-02 09.13.17.xls: Corrected Uncorr Water Levels
25.2
25.3
25.4
25.5
25.6
25.7
25.8
25.9
0 2000 4000 6000 8000 10000 12000 14000 16000 18000 20000
Elapsed Time (minutes)
Wate
r L
evel
(feet)
Uncorrected Water Levels
Barometric Corrected Water Levels
NP-2 UNCORRECTED AND CORRECTED
WATER LEVELS VS. TIME
HYDRO
GEO
CHEM, INC. Approved FigureDateAuthorDate File Name
MWK 5/26/09 B.2 NP-2NP-2 2009-03-025/26/09MWK

H:\78300\783019 - Large Scale Aquifer Test\Report\Appendix B Water Level Data\NP-2 2009-03-02 09.13.17.xls: Baseline_Barometric
680
682
684
686
688
690
692
694
1/29/2009 1/31/2009 2/2/2009 2/4/2009 2/6/2009 2/8/2009 2/10/2009 2/12/2009 2/14/2009 2/16/2009 2/18/2009 2/20/2009
Date
Baro
metr
ic P
ressu
re
24.4
24.6
24.8
25
25.2
25.4
25.6
25.8
Wate
r L
evel
Barometric Pressure (mm Hg)
Water Level (depth above transducer [feet])
NP-2 BAROMETRIC PRESSURE AND
WATER LEVEL VS. DATE
HYDRO
GEO
CHEM, INC. Approved FigureDateAuthorDate File Name
MWK 5/26/09 B.3 NP-2NP-2 2009-03-025/26/09MWK