Embed Size (px)
Citation preview
Kansas State University Libraries Kansas State University Libraries
New Prairie Press New Prairie Press
Conference on Applied Statistics in Agriculture 2009 - 21st Annual Conference Proceedings
PROC REPORT IN STYLE PROC REPORT IN STYLE
Wendy Boberg
Follow this and additional works at httpsnewprairiepressorgagstatconference
Part of the Agriculture Commons and the Applied Statistics Commons
This work is licensed under a Creative Commons Attribution-Noncommercial-No Derivative Works 40 License
Recommended Citation Recommended Citation Boberg Wendy (2009) PROC REPORT IN STYLE Conference on Applied Statistics in Agriculture httpsdoiorg1041482475-77721087
This is brought to you for free and open access by the Conferences at New Prairie Press It has been accepted for inclusion in Conference on Applied Statistics in Agriculture by an authorized administrator of New Prairie Press For more information please contact cadsk-stateedu
Page 1 of 15
PROC REPORT IN STYLE
Wendy Boberg Arkansas Foundation for Medical Care Little Rock Arkansas
ABSTRACT
I would like to demonstrate how you can create colorful PDF files using ODS (Output Delivery
System) with different predefined style templates for the layout and color scheme of both tables
and graphs There are a few different ways you can customize your reports in the Report
Procedure Traffic lighting is a very popular technique and can be achieved by changing the font
andor the background colors I prefer to customize my reports by adding background color to
highlight a row column andor cell in a table
I will share my favorite styles and show you how to look at your tables in the different styles
available I will briefly explain how you can create your own style by changing the color scheme
of an existing style so that it can be used for all of your reports I will explain how I used the
pieces of code to get the table with a row a column and individual cells highlighted with several
different colors I will focus on creating PDF files using ODS but these methods can be used
with other output destinations
This paper is for beginner to intermediate level SASreg programmers with experience creating
tables with Report procedure
Keywords REPORT ODS ODS PDF STYLE TEMPLATE CALL DEFINE DEFINE
BACKGROUND STOPLIGHT
1 INTRODUCTION
This paper provides examples for creating PDF files using ODS but these methods can be used
with other output destinations I will share what styles I like to use and how you can edit styles
to change the appearance of your reports In addition I will discuss a couple of different methods
to customize reports by adding colors with the STYLE option This paper is for beginner to
intermediate level programmers with experience creating tables with the Report procedure
2 THE STYLE OPTION
If you use the ODS to create a PDF file make sure you specify a STYLE If you do not know
what styles will work for you ask yourself these questions 1) Is there a particular color scheme
that should be used or avoided 2) Are you only creating a stand-alone table or are you creating
a report that consists of a table and graphs 3) If you also have a graph should the table have the
same color scheme as the graph 4) How will the report be used 5) Will the report be viewed
electronically 6) Will the report be printed in black and white 7) Will the report be inserted
into a presentation
I recommend that you take some time to look at different styles to determine your favorite ones
There are several styles available To get a list run this PROC TEMPLATE
Conference on Applied Statistics in AgricultureKansas State University
New Prairie Presshttpsnewprairiepressorgagstatconference2009proceedings16
Page 2 of 15
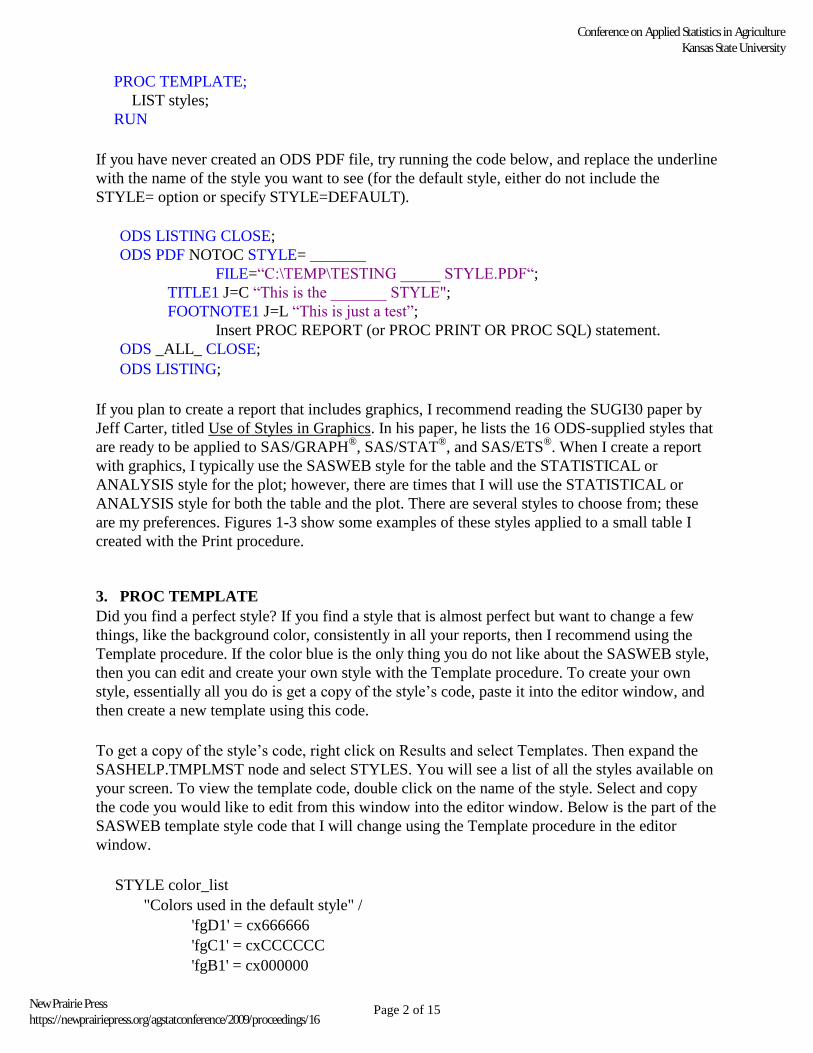
PROC TEMPLATE
LIST styles
RUN
If you have never created an ODS PDF file try running the code below and replace the underline
with the name of the style you want to see (for the default style either do not include the
STYLE= option or specify STYLE=DEFAULT)
ODS LISTING CLOSE
ODS PDF NOTOC STYLE= _______
FILE=ldquoCTEMPTESTING _____ STYLEPDFldquo
TITLE1 J=C ldquoThis is the _______ STYLE
FOOTNOTE1 J=L ldquoThis is just a testrdquo
Insert PROC REPORT (or PROC PRINT OR PROC SQL) statement
ODS _ALL_ CLOSE
ODS LISTING
If you plan to create a report that includes graphics I recommend reading the SUGI30 paper by
Jeff Carter titled Use of Styles in Graphics In his paper he lists the 16 ODS-supplied styles that
are ready to be applied to SASGRAPHreg SASSTAT
reg and SASETS
reg When I create a report
with graphics I typically use the SASWEB style for the table and the STATISTICAL or
ANALYSIS style for the plot however there are times that I will use the STATISTICAL or
ANALYSIS style for both the table and the plot There are several styles to choose from these
are my preferences Figures 1-3 show some examples of these styles applied to a small table I
created with the Print procedure
3 PROC TEMPLATE
Did you find a perfect style If you find a style that is almost perfect but want to change a few
things like the background color consistently in all your reports then I recommend using the
Template procedure If the color blue is the only thing you do not like about the SASWEB style
then you can edit and create your own style with the Template procedure To create your own
style essentially all you do is get a copy of the style‟s code paste it into the editor window and
then create a new template using this code
To get a copy of the style‟s code right click on Results and select Templates Then expand the
SASHELPTMPLMST node and select STYLES You will see a list of all the styles available on
your screen To view the template code double click on the name of the style Select and copy
the code you would like to edit from this window into the editor window Below is the part of the
SASWEB template style code that I will change using the Template procedure in the editor
window
STYLE color_list
Colors used in the default style
fgD1 = cx666666
fgC1 = cxCCCCCC
fgB1 = cx000000
Conference on Applied Statistics in AgricultureKansas State University
New Prairie Presshttpsnewprairiepressorgagstatconference2009proceedings16
Page 3 of 15
bgA1 = cx6495ED
fgA = cx003399
bgA = cxffffff
The bgA1 = cx6495ED is the background blue color and the fgA = cx003399 is the blue font
color in the SASWEB style I used the Web site httpwwwcolorschemercomonlinehtml to
determine what these cx colors look like on my computer To create a new style from the
SASWEB style use the code below Edit the cx values for a custom color combination The code
below will only change the blue font and blue background to shades of purple without changing
the other colors I selected these shades of purple from the Colorschemer Web site This Web
site is a convenient way to get HEX numbers The Template procedure allows you to name your
new custom style with the DEFINE statement The name I chose for this new style is
SASWEB_PURPLE After running the Template procedure below the SASWEB_PURPLE style
will be available to use on your computer
PROC TEMPLATE DEFINE STYLE StylesSASWEB_PURPLE
PARENT = StylesSASWEB
REPLACE color_list
fgD1bdquo=cx666666
fgC1=cxCCCCCC
fgB1=cx000000
bgA1=cxBD64ED
fgA=cx660099
bgA =cxffffff
end
run
Figure 4 gives an example of this SASWEB_PURPLE style as it is specified in the Template
procedure above
To learn more about the Template procedure I recommend reading the SUGI30 paper by Lauren
Haworth titled SASreg with Style Creating your own ODS Style Template for PDF Output
4 PROC REPORT
There are different ways to change the colors in the Report procedure This paper only shows
examples of two methods I used to create customized PDF reports with different background
colors The COMPUTE statement using the CALL DEFINE statement and the style option in
the DEFINE statement Other than the BACKGROUND style attribute which changes the
background color there is the FOREGROUND style attribute that will change the color of the
text Other style attributes that affect the layout like OUTPUTWIDTH can be edited using these
methods For more examples of how to use the Report procedure for creating PDF output I
recommend reading the SAS Global Forum 2008 Paper 033-2008 by Pete Lund titled PDF Can
be Pretty Darn Fancy Tips and Tricks for the ODS PDF Destination
401 THE CALL DEFINE STATEMENT
Conference on Applied Statistics in AgricultureKansas State University
New Prairie Presshttpsnewprairiepressorgagstatconference2009proceedings16
Page 4 of 15
My favorite use of the compute statement is to change the colors of rows columns and
individual cells on my table with the CALL DEFINE statement I will demonstrate how to
change the color of a row then a column and then a cell The following example is taken from a
complex report (see Figure 5) I created to monitor quality measures for home health agencies
Below is an explanation of the code I used
Figure 5 has two rows highlighted in light green and the last five columns highlighted in light
pink white and light blue using compute blocks
40101 APPLY STYLES TO ROWS
First let us look at how to highlight the background color of a row This example is based on a
report I created where possibly two or three rows need to be highlighted in light green
(HONEYDEW) The COLUMN statement lists the order the report variables need to be
processed
COLUMN Add_poa Outcome Outcome_type BaselineRA monthRiskAdj ip_goal
(HHA rank rank_May07_tie)
(STAR star_target1_report star_target2_report start2_date)
The default is for each variable listed in the COLUMN statement to be displayed in the output
therefore to keep a variable from being displayed in the DEFINE statement use the NOPRINT
option
DEFINE Add_poa NOPRINT GROUP MISSING Additional POA
DEFINE Outcome NOPRINT GROUP MISSING Outcome Measure
DEFINE Outcome_type GROUP MISSING Outcome Desc (Type)
Use a separate COMPUTE statement for each report-item variable that you want to customize
Conditional variables that are used to change the color (highlight) of the desired rows must be
listed before the COMPUTE report-item variable in the COLUMN statement Notice that the
first two variables are necessary to indicate which rows will be highlighted and neither variable
is displayed on the table The third variable listed is labeled bdquoOutcome Desc (Type)‟ on the table
In the CALL DEFINE statement below _ROW_ indicates that the entire row should have the
style changed
COMPUTE Outcome_type
IF Add_poa = Yes
or Outcome in(Acute Care Hospitalization
Improvement in Management of Oral Medications)
THEN CALL DEFINE(_ROW_ style STYLE=[BACKGROUND=HONEYDEW])
ENDCOMP
40102 APPLY STYLES TO COLUMNS
Now let us look at how to highlight the background color of the columns This example is based
on a report where the background colors of the columns are changed for different sections of the
Conference on Applied Statistics in AgricultureKansas State University
New Prairie Presshttpsnewprairiepressorgagstatconference2009proceedings16
Page 5 of 15
table The variable ip_goal is a light pink (LAVENDERBLUSH) the variable for the rank is
white (SNOW) which needs to be specified since I do not want any of the rows to be green in
this column and the last section of the table labeled STAR is light blue (ALICEBLUE) In the
CALL DEFINE statement _COL_ indicates the entire column should have the style changed
COMPUTE ip_goal
CALL DEFINE(_COL_ style STYLE=[BACKGROUND=LAVENDERBLUSH])
ENDCOMP
COMPUTE rank_May07_tie
CALL DEFINE(_COL_ style STYLE =[BACKGROUND=SNOW])
ENDCOMP
COMPUTE star_target1_report
CALL DEFINE(_COL_ style STYLE =[BACKGROUND=ALICEBLUE])
ENDCOMP
COMPUTE star_target2_report
CALL DEFINE(_COL_ style STYLE =[BACKGROUND=ALICEBLUE])
ENDCOMP
COMPUTE start2_date
CALL DEFINE(_COL_ style STYLE =[BACKGROUND=ALICEBLUE])
ENDCOMP
40103 APPLY STYLES TO CELLS
What if you decide not to highlight the last three columns in light blue but want to highlight
cells in these three columns depending on their values Use the CALL DEFINE statements
shown above where the _COL_ indicates the entire column should have the style changed but
add a conditional statement in the COMPUTE block so that the style of a cell is changed only if
that cell meets the requirement specified To change the BACKGROUND style of a non-blank
cell to light blue use the code below
COMPUTE star_target1_report
IF star_target1_report ^=
THEN CALL DEFINE(_COL_ style STYLE=[BACKGROUND=ALICEBLUE])
ENDCOMP
COMPUTE star_target2_report
IF star_target2_report ^=
THEN CALL DEFINE(_COL_ style STYLE=[BACKGROUND=ALICEBLUE])
ENDCOMP
COMPUTE start2_date
IF start2_date ^=
THEN CALL DEFINE(_COL_ style STYLE=[BACKGROUND=ALICEBLUE])
ENDCOMP
40104 APPLY STYLES TO ROWS AND CELLS IN COLUMNS
Conference on Applied Statistics in AgricultureKansas State University
New Prairie Presshttpsnewprairiepressorgagstatconference2009proceedings16
Page 6 of 15
Take a simple table such as the one in Figure 4 and update it with more staff members
Highlight new rows and change the font style in the second column if the title information was
recently updated The resulting table can be found in Figure 6
The code used to create a PDF file with this table is below Look at the two compute blocks that
were added to the Report procedure one for the variable that determines whether the row should
be highlighted (name) and one for the variable that determines whether the column should have a
different font style and font weight (title)
ODS LISTING CLOSE
ODS PDF NOTOC STYLE=SASWEB_PURPLE FILE=CTEMPFigure6 examplepdf
Title1 j=c This is the SASWEB_PURPLE STYLE
Footnote1 j=l This is just a test
PROC REPORT DATA=person NOWD
COLUMNS name title
DEFINE name order Analytic Staff
DEFINE title display Title
COMPUTE name
IF name not in(Wendy Amy)
THEN CALL DEFINE(_ROW_ style
STYLE=[BACKGROUND=cxF7EDFD])
ENDCOMP
COMPUTE title
IF title in(Statistician - Data Mining Team Leader
Statistician - Survey Team Leader
Director of Analytical Services)
THEN CALL DEFINE(_COL_ style
STYLE=[FONT_STYLE=italic
FONT_WEIGHT=bold])
ENDCOMP
RUN
ODS _ALL_ CLOSE
ODS LISTING
40103 APPLY STYLES TO CELLS (CONTINUED)
In Figure 7 instead of highlighting a few rows all in one color each cell with a monthly rate is
highlighted depending on a performance variable (perform) I call Figure 7 my STOPLIGHT
report since a cell is colored red if the rate is worse than baseline yellow if the rate is better than
baseline but has not met the goal yet and green if the rate is better than the goal
Notice in the COLUMN statement that the ACROSS variable (month) is followed by a comma
and the variable(s) with values that depend on each unit of the ACROSS variable are listed after
the comma As in this example when there are multiple variables list all of them in parentheses
after the comma The months are displayed left to right across the page the rate () is the value
Conference on Applied Statistics in AgricultureKansas State University
New Prairie Presshttpsnewprairiepressorgagstatconference2009proceedings16
Page 7 of 15
of the RiskAdj variable displayed in the cells and the background color of these cells depend on
the value of the perform variable The COLUMN statement used for this STOPLIGHT example
is shown here
COLUMN Add_poa Outcome Outcome_type BaselineRA month(perform RiskAdj)
ip_goal
(HHA rank rank_May07_tie)
(STAR star_target1_report star_target2_report start2_date)
Notice that the conditional variable needed in the COMPUTE statement (perform) is listed
before the COMPUTE report-item variable (RiskAdj) The order in the COLUMN statement is
important since it specifies the order that the Report procedure processes the data This example
is more complex since the variable Riskadj is under the ACROSS variable (month) Therefore
the CALL DEFINE statement will not have the generic _COL_ which indicates that the style is
to be applied to the RiskAdj variable column There is more than one column with rates There is
a set of columns for each of the two variables listed under the ACROSS variable (perform and
RiskAdj) for each value of the ACROSS variable (month) In the example code below the
variables used in the compute blocks to determine what style is applied are not printed in the
table Note that all these have the NOPRINT option in the DEFINE statement but I do
recommend checking the style by printing the variables (do not use the NOPRINT option until
you know that your code is working correctly)
DEFINE Add_poa NOPRINT GROUP MISSING Additional POA
DEFINE Outcome NOPRINT GROUP MISSING Outcome Measure
DEFINE Outcome_type GROUP MISSING Outcome Desc (Type)
DEFINE BaselineRA GROUP MISSING Jul04 Baseline FORMAT=42
DEFINE month ACROSS Period Ending ORDER=INTERNAL
FORMAT=MONYY5
DEFINE perform NOPRINT GROUP MISSING bdquostoplight colors
hellip
The Report procedure only processes the data cell by cell in the order specified therefore the
basic IF-THEN logic using the name of the variable (perform) to condition on cannot be used in
the COMPUTE block A unique IF-THEN conditional statement will be needed for each column
displayed under the ACROSS variable (month) There also needs to be a conditional statement
for each possible background color Use _Cxx_ to identify the column where xx is the column
number Use the COLUMN statement to determine column numbers Count every variable in the
COLUMN statement except the ACROSS variable whether or not it is displayed in the report
In this example the first set of conditional statements reference columns 5 (for the perform
value) and column 6 (for the RiskAdj value) under the first month value (JUL06) and the second
set of conditional statements reference columns 7 and 8 for the second month value (AUG06)
The pattern is continued for all columns created under the ACROSS variable The last set of
conditional statements in this compute block reference columns 25 and 26 for the column labeled
MAY07 The colors used in this Stoplight report are red (lightRED) yellow (cxFFFF99) green
(lightGREEN) or white (SNOW) depending on the value of the perform variable
Conference on Applied Statistics in AgricultureKansas State University
New Prairie Presshttpsnewprairiepressorgagstatconference2009proceedings16
Page 8 of 15
Figure 7 has the STOPLIGHT colors described above in the columns under the bdquoPeriod Ending‟
Section (columns 6 8 10 12 14 16 18 20 22 24 and 26 in this example) Notice that bdquoPeriod
Ending‟ is the label for the across variable month in the DEFINE statement
COMPUTE RiskAdj
IF _c5_=WORSE THAN BASELINE
THEN CALL DEFINE(_c6_ style STYLE=[BACKGROUND=lightRED])
IF _c5_=GOAL NOT MET
THEN CALL DEFINE(_c6_ style STYLE=[BACKGROUND=cxFFFF99])
IF _c5_=GOAL MET
THEN CALL DEFINE(_c6_ style STYLE=[BACKGROUND=lightGREEN])
IF _c5_ in(NO DATA )
THEN CALL DEFINE(_c6_ style STYLE=[BACKGROUND=SNOW])
IF _c7_=WORSE THAN BASELINE
THEN CALL DEFINE(_c8_ style STYLE=[BACKGROUND=lightRED])
IF _c7_=GOAL NOT MET
THEN CALL DEFINE(_c8_ style STYLE=[BACKGROUND=cxFFFF99])
IF _c7_=GOAL MET
THEN CALL DEFINE(_c8_ style STYLE=[BACKGROUND=lightGREEN])
IF _c7_ in(NO DATA )
THEN CALL DEFINE(_c8_ style STYLE=[BACKGROUND=SNOW])
hellip
IF _c25_=WORSE THAN BASELINE
THEN CALL DEFINE(_c26_ style STYLE=[BACKGROUND=lightRED])
IF _c25_=GOAL NOT MET
THEN CALL DEFINE(_c26_ style STYLE=[BACKGROUND=cxFFFF99])
IF _c25_=GOAL MET
THEN CALL DEFINE(_c26_ style STYLE=[BACKGROUND=lightGREEN])
IF _c25_ in(NO DATA )
THEN CALL DEFINE(_c26_ style STYLE=[BACKGROUND=SNOW])
ENDCOMP
402 THE DEFINE STATEMENT APPLY STYLES TO CELLS
Another way to change the background color of an individual cell is to use the STYLE option in
the DEFINE statement of PROC REPORT To do this you will need to create a user-defined
format
Here are two example formats The first one called color_fmt is for a variable that has a YesNo
response coded as text (either a Y or N) and the plan is to change the background color to red if
the response is bdquoN‟
The second format defined below is for a numeric variable that is a ratio For this one the plan is
to change the background color depending on the value of the variable
Conference on Applied Statistics in AgricultureKansas State University
New Prairie Presshttpsnewprairiepressorgagstatconference2009proceedings16
Page 9 of 15
PROC FORMAT
VALUE $ color_fmt
Y = SNOW
N = RED
VALUE c_ratio
LOW ndashlt 0 = RED
0 -lt 1 = YELLOW
1 ndash HIGH = GREEN
OTHER = SNOW
RUN
As the user-defined format c_ratio is written above the color red would be for values that are
less than zero the color yellow would be for values greater than or equal to zero and less than
one and the color green would be for values greater than or equal to one Note that if any large
values are not acceptable then the HIGH option should not be used and if any small (including
negative) numbers are not acceptable then the LOW option should not be used You might want
to add a color for errors (unreasonable values) but this would take away from the stoplight
effect The color snow which is a white would be for any value not included in the other
conditions (a missing value in this example)
Unlike the previous example where the color applied to a variable is dependent on another
variable when using the DEFINE statement the color depends on the value of the DEFINE
report-item variable
DEFINE flagifnotsame DISPLAY MISSING CENTER Same
STYLE=BACKGROUND=$color_fmt
DEFINE ratio DISPLAY MISSING Ratio
STYLE=BACKGROUND=c_ratio
Only the cells in the column of the DEFINE variable that have the STYLE option will be affected
by the attribute set to a user-defined format This can be seen in Figures 8 and 9
Use the STYLE options in the DEFINE statement of the Report procedure to highlight cells that
are of interest by changing the background color (BACKGROUND) the font including the color
(FONT_STYLE FONT_WEIGHT FOREGROUND hellip) and even the column width
(OUTPUTWIDTH) If the style you want to apply depends on the value of your variable then a
user-defined format is needed In this next example I have added bold font to the values in red
and green and made the yellow values italic The user-defined format is below
PROC FORMAT
VALUE FW_ratio
LOW -lt 0 = BOLD
1 - HIGH = BOLD
VALUE FS_ratio
0 -lt 1 = ITALIC
Conference on Applied Statistics in AgricultureKansas State University
New Prairie Presshttpsnewprairiepressorgagstatconference2009proceedings16
Page 10 of 15
RUN
Notice how these user-defined formats are being utilized in the style option of the DEFINE
statement in the Report procedure below Multiple style attributes can be used
ODS LISTING CLOSE
ODS PDF NOTOC STYLE=SASWEB_PURPLE
FILE=CTEMPDEFINE STATEMENT EXAMPLE 10pdf
PROC REPORT DATA=CKDAT NOWD
COLUMNS name ratio
DEFINE name order Analytic Staff CENTER
STYLE=OUTPUTWIDTH=10
DEFINE ratio DISPLAY MISSING Ratio CENTER
STYLE=BACKGROUND=c_ratio
FONT_WEIGHT=FW_RATIO
FONT_STYLE=FS_RATIO
OUTPUTWIDTH=5
RUN
ODS _ALL_ CLOSE
ODS LISTING
The resulting table in Figure 10 has the same background color as the table in Figure 9 but the
font weight and font style are different The column width is also different since the
OUTPUTWIDTH style attribute was used
5 SUMMARY
If your resources allow for the use of color in either printed or electronic format I challenge you
to find the STYLE(s) that works best for you The colors used in this paper display as expected in
the PDF files I created but if you are using another ODS output designation like HTML then
you are more limited in the colors that you can use Always verify that your color choices will be
displayed as expected before finalizing your code If you get a gray were another color is
expected then select another color since the one you specified could not be displayed I prefer to
customize the background color but there are other ways to highlight information in a table
Other Style attributes like FOREGROUND can be used Now go show everyone what your
STYLE looks like
Conference on Applied Statistics in AgricultureKansas State University
New Prairie Presshttpsnewprairiepressorgagstatconference2009proceedings16
Page 11 of 15
6 FIGURES
FIGURE 1 SASWEB
FIGURE 2 STATISTICAL
FIGURE 3 ANALYSIS
FIGURE 4 SASWEB_PURPLE
Conference on Applied Statistics in AgricultureKansas State University
New Prairie Presshttpsnewprairiepressorgagstatconference2009proceedings16
Page 12 of 15
FIGURE 5 CHANGE COLOR OF ROWS AND COLUMNS
FIGURE 6 CHANGING BACKGROUND STYLE FOR ADDITIONAL ROWS
AND FONT STYLE FOR UPDATED COLUMNS
Conference on Applied Statistics in AgricultureKansas State University
New Prairie Presshttpsnewprairiepressorgagstatconference2009proceedings16
Page 13 of 15
FIGURE 7 CHANGE COLOR OF CELLS
FIGURE 8 CHANGE COLOR OF CELLS BASED ON USER-DEFINED FORMAT
$COLOR_FMT
6 Column 3 4 8 26 10 12 14 16 18 20 22 24
Conference on Applied Statistics in AgricultureKansas State University
New Prairie Presshttpsnewprairiepressorgagstatconference2009proceedings16
Page 14 of 15
FIGURE 9 CHANGE COLOR OF CELLS BASED ON USER-DEFINED FORMAT
C_RATIO
FIGURE 10 CHANGE COLOR OF CELLS
BASED ON USER-DEFINED FORMAT C_RATIO
AND CHANGE FONT OF SOME CELLS
BASED ON THE USER-DEFINED FORMATS FW_ RATIO AND FS_ RATIO
7 ACKNOWLEDGMENTS
Special thanks to everyone at AFMC for all their helpful advice and support
The content of this publication does not necessarily reflect the views or policies of Arkansas
Foundation for Medical Care (AFMC) The author assumes full responsibility for the accuracy
and completeness of the ideas presented
For more information about quality measures in the home health setting go to the Home Health
Compare Web site
Conference on Applied Statistics in AgricultureKansas State University
New Prairie Presshttpsnewprairiepressorgagstatconference2009proceedings16
Page 15 of 15
httpwwwmedicaregovHHCompareHomeaspdest=NAV|Home|AboutTabTop
8 REFERENCES
Carter Jeff 2005 Use of Styles in Graphics Proceedings of the thirtieth annual SASreg
Users
Group International Conference Philadelphia PA
httpsupportsascomrnddatavisualizationpaperssugi30GraphStylespdf
Code extract from SAS 913 Service Pack 4 Copyright (c) 2002-2003 by SAS Institute Inc
Cary NC USA
Colorschemer Online v2 httpwwwcolorschemercomonlinehtml Accessed 12282006
Haworth Lauren 2005 SASreg with Style Creating your own ODS Style Template for PDF
Output Proceedings of the thirtieth annual SAS Users Group International Conference
Philadelphia PA 132-30 httpwww2sascomproceedingssugi30132-30pdf
Lund Pete 2008 ldquoPDF Can be Pretty Darn Fancy Tips and Tricks for the ODS PDF
Destinationrdquo Proceedings of the SAS Global Forum 2008 San Antonio TX 033-2008
httpwww2sascomproceedingsforum2008033-2008pdf
The data displayed in the examples are fictitious and should only be used for report layout
examples
9 CONTACT INFORMATION
Your comments and questions are valued and encouraged Contact the author at
Wendy Boberg
Sr Statistician
Arkansas Foundation for Medical Care (AFMC)
401 W Capitol Ave Suite 410
Little Rock AR 72201
Phone 501-212-8716
Fax 501-375-1201
E-mail wbobergafmcorg
Web httpwwwafmcorg
SAS and all other SAS Institute Inc product or service names are registered trademarks or
trademarks of SAS Institute Inc in the USA and other countries reg indicates USA registration
Other brand and product names are trademarks of their respective companies
Conference on Applied Statistics in AgricultureKansas State University
New Prairie Presshttpsnewprairiepressorgagstatconference2009proceedings16
Page 1 of 15
PROC REPORT IN STYLE
Wendy Boberg Arkansas Foundation for Medical Care Little Rock Arkansas
ABSTRACT
I would like to demonstrate how you can create colorful PDF files using ODS (Output Delivery
System) with different predefined style templates for the layout and color scheme of both tables
and graphs There are a few different ways you can customize your reports in the Report
Procedure Traffic lighting is a very popular technique and can be achieved by changing the font
andor the background colors I prefer to customize my reports by adding background color to
highlight a row column andor cell in a table
I will share my favorite styles and show you how to look at your tables in the different styles
available I will briefly explain how you can create your own style by changing the color scheme
of an existing style so that it can be used for all of your reports I will explain how I used the
pieces of code to get the table with a row a column and individual cells highlighted with several
different colors I will focus on creating PDF files using ODS but these methods can be used
with other output destinations
This paper is for beginner to intermediate level SASreg programmers with experience creating
tables with Report procedure
Keywords REPORT ODS ODS PDF STYLE TEMPLATE CALL DEFINE DEFINE
BACKGROUND STOPLIGHT
1 INTRODUCTION
This paper provides examples for creating PDF files using ODS but these methods can be used
with other output destinations I will share what styles I like to use and how you can edit styles
to change the appearance of your reports In addition I will discuss a couple of different methods
to customize reports by adding colors with the STYLE option This paper is for beginner to
intermediate level programmers with experience creating tables with the Report procedure
2 THE STYLE OPTION
If you use the ODS to create a PDF file make sure you specify a STYLE If you do not know
what styles will work for you ask yourself these questions 1) Is there a particular color scheme
that should be used or avoided 2) Are you only creating a stand-alone table or are you creating
a report that consists of a table and graphs 3) If you also have a graph should the table have the
same color scheme as the graph 4) How will the report be used 5) Will the report be viewed
electronically 6) Will the report be printed in black and white 7) Will the report be inserted
into a presentation
I recommend that you take some time to look at different styles to determine your favorite ones
There are several styles available To get a list run this PROC TEMPLATE
Conference on Applied Statistics in AgricultureKansas State University
New Prairie Presshttpsnewprairiepressorgagstatconference2009proceedings16
Page 2 of 15
PROC TEMPLATE
LIST styles
RUN
If you have never created an ODS PDF file try running the code below and replace the underline
with the name of the style you want to see (for the default style either do not include the
STYLE= option or specify STYLE=DEFAULT)
ODS LISTING CLOSE
ODS PDF NOTOC STYLE= _______
FILE=ldquoCTEMPTESTING _____ STYLEPDFldquo
TITLE1 J=C ldquoThis is the _______ STYLE
FOOTNOTE1 J=L ldquoThis is just a testrdquo
Insert PROC REPORT (or PROC PRINT OR PROC SQL) statement
ODS _ALL_ CLOSE
ODS LISTING
If you plan to create a report that includes graphics I recommend reading the SUGI30 paper by
Jeff Carter titled Use of Styles in Graphics In his paper he lists the 16 ODS-supplied styles that
are ready to be applied to SASGRAPHreg SASSTAT
reg and SASETS
reg When I create a report
with graphics I typically use the SASWEB style for the table and the STATISTICAL or
ANALYSIS style for the plot however there are times that I will use the STATISTICAL or
ANALYSIS style for both the table and the plot There are several styles to choose from these
are my preferences Figures 1-3 show some examples of these styles applied to a small table I
created with the Print procedure
3 PROC TEMPLATE
Did you find a perfect style If you find a style that is almost perfect but want to change a few
things like the background color consistently in all your reports then I recommend using the
Template procedure If the color blue is the only thing you do not like about the SASWEB style
then you can edit and create your own style with the Template procedure To create your own
style essentially all you do is get a copy of the style‟s code paste it into the editor window and
then create a new template using this code
To get a copy of the style‟s code right click on Results and select Templates Then expand the
SASHELPTMPLMST node and select STYLES You will see a list of all the styles available on
your screen To view the template code double click on the name of the style Select and copy
the code you would like to edit from this window into the editor window Below is the part of the
SASWEB template style code that I will change using the Template procedure in the editor
window
STYLE color_list
Colors used in the default style
fgD1 = cx666666
fgC1 = cxCCCCCC
fgB1 = cx000000
Conference on Applied Statistics in AgricultureKansas State University
New Prairie Presshttpsnewprairiepressorgagstatconference2009proceedings16
Page 3 of 15
bgA1 = cx6495ED
fgA = cx003399
bgA = cxffffff
The bgA1 = cx6495ED is the background blue color and the fgA = cx003399 is the blue font
color in the SASWEB style I used the Web site httpwwwcolorschemercomonlinehtml to
determine what these cx colors look like on my computer To create a new style from the
SASWEB style use the code below Edit the cx values for a custom color combination The code
below will only change the blue font and blue background to shades of purple without changing
the other colors I selected these shades of purple from the Colorschemer Web site This Web
site is a convenient way to get HEX numbers The Template procedure allows you to name your
new custom style with the DEFINE statement The name I chose for this new style is
SASWEB_PURPLE After running the Template procedure below the SASWEB_PURPLE style
will be available to use on your computer
PROC TEMPLATE DEFINE STYLE StylesSASWEB_PURPLE
PARENT = StylesSASWEB
REPLACE color_list
fgD1bdquo=cx666666
fgC1=cxCCCCCC
fgB1=cx000000
bgA1=cxBD64ED
fgA=cx660099
bgA =cxffffff
end
run
Figure 4 gives an example of this SASWEB_PURPLE style as it is specified in the Template
procedure above
To learn more about the Template procedure I recommend reading the SUGI30 paper by Lauren
Haworth titled SASreg with Style Creating your own ODS Style Template for PDF Output
4 PROC REPORT
There are different ways to change the colors in the Report procedure This paper only shows
examples of two methods I used to create customized PDF reports with different background
colors The COMPUTE statement using the CALL DEFINE statement and the style option in
the DEFINE statement Other than the BACKGROUND style attribute which changes the
background color there is the FOREGROUND style attribute that will change the color of the
text Other style attributes that affect the layout like OUTPUTWIDTH can be edited using these
methods For more examples of how to use the Report procedure for creating PDF output I
recommend reading the SAS Global Forum 2008 Paper 033-2008 by Pete Lund titled PDF Can
be Pretty Darn Fancy Tips and Tricks for the ODS PDF Destination
401 THE CALL DEFINE STATEMENT
Conference on Applied Statistics in AgricultureKansas State University
New Prairie Presshttpsnewprairiepressorgagstatconference2009proceedings16
Page 4 of 15
My favorite use of the compute statement is to change the colors of rows columns and
individual cells on my table with the CALL DEFINE statement I will demonstrate how to
change the color of a row then a column and then a cell The following example is taken from a
complex report (see Figure 5) I created to monitor quality measures for home health agencies
Below is an explanation of the code I used
Figure 5 has two rows highlighted in light green and the last five columns highlighted in light
pink white and light blue using compute blocks
40101 APPLY STYLES TO ROWS
First let us look at how to highlight the background color of a row This example is based on a
report I created where possibly two or three rows need to be highlighted in light green
(HONEYDEW) The COLUMN statement lists the order the report variables need to be
processed
COLUMN Add_poa Outcome Outcome_type BaselineRA monthRiskAdj ip_goal
(HHA rank rank_May07_tie)
(STAR star_target1_report star_target2_report start2_date)
The default is for each variable listed in the COLUMN statement to be displayed in the output
therefore to keep a variable from being displayed in the DEFINE statement use the NOPRINT
option
DEFINE Add_poa NOPRINT GROUP MISSING Additional POA
DEFINE Outcome NOPRINT GROUP MISSING Outcome Measure
DEFINE Outcome_type GROUP MISSING Outcome Desc (Type)
Use a separate COMPUTE statement for each report-item variable that you want to customize
Conditional variables that are used to change the color (highlight) of the desired rows must be
listed before the COMPUTE report-item variable in the COLUMN statement Notice that the
first two variables are necessary to indicate which rows will be highlighted and neither variable
is displayed on the table The third variable listed is labeled bdquoOutcome Desc (Type)‟ on the table
In the CALL DEFINE statement below _ROW_ indicates that the entire row should have the
style changed
COMPUTE Outcome_type
IF Add_poa = Yes
or Outcome in(Acute Care Hospitalization
Improvement in Management of Oral Medications)
THEN CALL DEFINE(_ROW_ style STYLE=[BACKGROUND=HONEYDEW])
ENDCOMP
40102 APPLY STYLES TO COLUMNS
Now let us look at how to highlight the background color of the columns This example is based
on a report where the background colors of the columns are changed for different sections of the
Conference on Applied Statistics in AgricultureKansas State University
New Prairie Presshttpsnewprairiepressorgagstatconference2009proceedings16
Page 5 of 15
table The variable ip_goal is a light pink (LAVENDERBLUSH) the variable for the rank is
white (SNOW) which needs to be specified since I do not want any of the rows to be green in
this column and the last section of the table labeled STAR is light blue (ALICEBLUE) In the
CALL DEFINE statement _COL_ indicates the entire column should have the style changed
COMPUTE ip_goal
CALL DEFINE(_COL_ style STYLE=[BACKGROUND=LAVENDERBLUSH])
ENDCOMP
COMPUTE rank_May07_tie
CALL DEFINE(_COL_ style STYLE =[BACKGROUND=SNOW])
ENDCOMP
COMPUTE star_target1_report
CALL DEFINE(_COL_ style STYLE =[BACKGROUND=ALICEBLUE])
ENDCOMP
COMPUTE star_target2_report
CALL DEFINE(_COL_ style STYLE =[BACKGROUND=ALICEBLUE])
ENDCOMP
COMPUTE start2_date
CALL DEFINE(_COL_ style STYLE =[BACKGROUND=ALICEBLUE])
ENDCOMP
40103 APPLY STYLES TO CELLS
What if you decide not to highlight the last three columns in light blue but want to highlight
cells in these three columns depending on their values Use the CALL DEFINE statements
shown above where the _COL_ indicates the entire column should have the style changed but
add a conditional statement in the COMPUTE block so that the style of a cell is changed only if
that cell meets the requirement specified To change the BACKGROUND style of a non-blank
cell to light blue use the code below
COMPUTE star_target1_report
IF star_target1_report ^=
THEN CALL DEFINE(_COL_ style STYLE=[BACKGROUND=ALICEBLUE])
ENDCOMP
COMPUTE star_target2_report
IF star_target2_report ^=
THEN CALL DEFINE(_COL_ style STYLE=[BACKGROUND=ALICEBLUE])
ENDCOMP
COMPUTE start2_date
IF start2_date ^=
THEN CALL DEFINE(_COL_ style STYLE=[BACKGROUND=ALICEBLUE])
ENDCOMP
40104 APPLY STYLES TO ROWS AND CELLS IN COLUMNS
Conference on Applied Statistics in AgricultureKansas State University
New Prairie Presshttpsnewprairiepressorgagstatconference2009proceedings16
Page 6 of 15
Take a simple table such as the one in Figure 4 and update it with more staff members
Highlight new rows and change the font style in the second column if the title information was
recently updated The resulting table can be found in Figure 6
The code used to create a PDF file with this table is below Look at the two compute blocks that
were added to the Report procedure one for the variable that determines whether the row should
be highlighted (name) and one for the variable that determines whether the column should have a
different font style and font weight (title)
ODS LISTING CLOSE
ODS PDF NOTOC STYLE=SASWEB_PURPLE FILE=CTEMPFigure6 examplepdf
Title1 j=c This is the SASWEB_PURPLE STYLE
Footnote1 j=l This is just a test
PROC REPORT DATA=person NOWD
COLUMNS name title
DEFINE name order Analytic Staff
DEFINE title display Title
COMPUTE name
IF name not in(Wendy Amy)
THEN CALL DEFINE(_ROW_ style
STYLE=[BACKGROUND=cxF7EDFD])
ENDCOMP
COMPUTE title
IF title in(Statistician - Data Mining Team Leader
Statistician - Survey Team Leader
Director of Analytical Services)
THEN CALL DEFINE(_COL_ style
STYLE=[FONT_STYLE=italic
FONT_WEIGHT=bold])
ENDCOMP
RUN
ODS _ALL_ CLOSE
ODS LISTING
40103 APPLY STYLES TO CELLS (CONTINUED)
In Figure 7 instead of highlighting a few rows all in one color each cell with a monthly rate is
highlighted depending on a performance variable (perform) I call Figure 7 my STOPLIGHT
report since a cell is colored red if the rate is worse than baseline yellow if the rate is better than
baseline but has not met the goal yet and green if the rate is better than the goal
Notice in the COLUMN statement that the ACROSS variable (month) is followed by a comma
and the variable(s) with values that depend on each unit of the ACROSS variable are listed after
the comma As in this example when there are multiple variables list all of them in parentheses
after the comma The months are displayed left to right across the page the rate () is the value
Conference on Applied Statistics in AgricultureKansas State University
New Prairie Presshttpsnewprairiepressorgagstatconference2009proceedings16
Page 7 of 15
of the RiskAdj variable displayed in the cells and the background color of these cells depend on
the value of the perform variable The COLUMN statement used for this STOPLIGHT example
is shown here
COLUMN Add_poa Outcome Outcome_type BaselineRA month(perform RiskAdj)
ip_goal
(HHA rank rank_May07_tie)
(STAR star_target1_report star_target2_report start2_date)
Notice that the conditional variable needed in the COMPUTE statement (perform) is listed
before the COMPUTE report-item variable (RiskAdj) The order in the COLUMN statement is
important since it specifies the order that the Report procedure processes the data This example
is more complex since the variable Riskadj is under the ACROSS variable (month) Therefore
the CALL DEFINE statement will not have the generic _COL_ which indicates that the style is
to be applied to the RiskAdj variable column There is more than one column with rates There is
a set of columns for each of the two variables listed under the ACROSS variable (perform and
RiskAdj) for each value of the ACROSS variable (month) In the example code below the
variables used in the compute blocks to determine what style is applied are not printed in the
table Note that all these have the NOPRINT option in the DEFINE statement but I do
recommend checking the style by printing the variables (do not use the NOPRINT option until
you know that your code is working correctly)
DEFINE Add_poa NOPRINT GROUP MISSING Additional POA
DEFINE Outcome NOPRINT GROUP MISSING Outcome Measure
DEFINE Outcome_type GROUP MISSING Outcome Desc (Type)
DEFINE BaselineRA GROUP MISSING Jul04 Baseline FORMAT=42
DEFINE month ACROSS Period Ending ORDER=INTERNAL
FORMAT=MONYY5
DEFINE perform NOPRINT GROUP MISSING bdquostoplight colors
hellip
The Report procedure only processes the data cell by cell in the order specified therefore the
basic IF-THEN logic using the name of the variable (perform) to condition on cannot be used in
the COMPUTE block A unique IF-THEN conditional statement will be needed for each column
displayed under the ACROSS variable (month) There also needs to be a conditional statement
for each possible background color Use _Cxx_ to identify the column where xx is the column
number Use the COLUMN statement to determine column numbers Count every variable in the
COLUMN statement except the ACROSS variable whether or not it is displayed in the report
In this example the first set of conditional statements reference columns 5 (for the perform
value) and column 6 (for the RiskAdj value) under the first month value (JUL06) and the second
set of conditional statements reference columns 7 and 8 for the second month value (AUG06)
The pattern is continued for all columns created under the ACROSS variable The last set of
conditional statements in this compute block reference columns 25 and 26 for the column labeled
MAY07 The colors used in this Stoplight report are red (lightRED) yellow (cxFFFF99) green
(lightGREEN) or white (SNOW) depending on the value of the perform variable
Conference on Applied Statistics in AgricultureKansas State University
New Prairie Presshttpsnewprairiepressorgagstatconference2009proceedings16
Page 8 of 15
Figure 7 has the STOPLIGHT colors described above in the columns under the bdquoPeriod Ending‟
Section (columns 6 8 10 12 14 16 18 20 22 24 and 26 in this example) Notice that bdquoPeriod
Ending‟ is the label for the across variable month in the DEFINE statement
COMPUTE RiskAdj
IF _c5_=WORSE THAN BASELINE
THEN CALL DEFINE(_c6_ style STYLE=[BACKGROUND=lightRED])
IF _c5_=GOAL NOT MET
THEN CALL DEFINE(_c6_ style STYLE=[BACKGROUND=cxFFFF99])
IF _c5_=GOAL MET
THEN CALL DEFINE(_c6_ style STYLE=[BACKGROUND=lightGREEN])
IF _c5_ in(NO DATA )
THEN CALL DEFINE(_c6_ style STYLE=[BACKGROUND=SNOW])
IF _c7_=WORSE THAN BASELINE
THEN CALL DEFINE(_c8_ style STYLE=[BACKGROUND=lightRED])
IF _c7_=GOAL NOT MET
THEN CALL DEFINE(_c8_ style STYLE=[BACKGROUND=cxFFFF99])
IF _c7_=GOAL MET
THEN CALL DEFINE(_c8_ style STYLE=[BACKGROUND=lightGREEN])
IF _c7_ in(NO DATA )
THEN CALL DEFINE(_c8_ style STYLE=[BACKGROUND=SNOW])
hellip
IF _c25_=WORSE THAN BASELINE
THEN CALL DEFINE(_c26_ style STYLE=[BACKGROUND=lightRED])
IF _c25_=GOAL NOT MET
THEN CALL DEFINE(_c26_ style STYLE=[BACKGROUND=cxFFFF99])
IF _c25_=GOAL MET
THEN CALL DEFINE(_c26_ style STYLE=[BACKGROUND=lightGREEN])
IF _c25_ in(NO DATA )
THEN CALL DEFINE(_c26_ style STYLE=[BACKGROUND=SNOW])
ENDCOMP
402 THE DEFINE STATEMENT APPLY STYLES TO CELLS
Another way to change the background color of an individual cell is to use the STYLE option in
the DEFINE statement of PROC REPORT To do this you will need to create a user-defined
format
Here are two example formats The first one called color_fmt is for a variable that has a YesNo
response coded as text (either a Y or N) and the plan is to change the background color to red if
the response is bdquoN‟
The second format defined below is for a numeric variable that is a ratio For this one the plan is
to change the background color depending on the value of the variable
Conference on Applied Statistics in AgricultureKansas State University
New Prairie Presshttpsnewprairiepressorgagstatconference2009proceedings16
Page 9 of 15
PROC FORMAT
VALUE $ color_fmt
Y = SNOW
N = RED
VALUE c_ratio
LOW ndashlt 0 = RED
0 -lt 1 = YELLOW
1 ndash HIGH = GREEN
OTHER = SNOW
RUN
As the user-defined format c_ratio is written above the color red would be for values that are
less than zero the color yellow would be for values greater than or equal to zero and less than
one and the color green would be for values greater than or equal to one Note that if any large
values are not acceptable then the HIGH option should not be used and if any small (including
negative) numbers are not acceptable then the LOW option should not be used You might want
to add a color for errors (unreasonable values) but this would take away from the stoplight
effect The color snow which is a white would be for any value not included in the other
conditions (a missing value in this example)
Unlike the previous example where the color applied to a variable is dependent on another
variable when using the DEFINE statement the color depends on the value of the DEFINE
report-item variable
DEFINE flagifnotsame DISPLAY MISSING CENTER Same
STYLE=BACKGROUND=$color_fmt
DEFINE ratio DISPLAY MISSING Ratio
STYLE=BACKGROUND=c_ratio
Only the cells in the column of the DEFINE variable that have the STYLE option will be affected
by the attribute set to a user-defined format This can be seen in Figures 8 and 9
Use the STYLE options in the DEFINE statement of the Report procedure to highlight cells that
are of interest by changing the background color (BACKGROUND) the font including the color
(FONT_STYLE FONT_WEIGHT FOREGROUND hellip) and even the column width
(OUTPUTWIDTH) If the style you want to apply depends on the value of your variable then a
user-defined format is needed In this next example I have added bold font to the values in red
and green and made the yellow values italic The user-defined format is below
PROC FORMAT
VALUE FW_ratio
LOW -lt 0 = BOLD
1 - HIGH = BOLD
VALUE FS_ratio
0 -lt 1 = ITALIC
Conference on Applied Statistics in AgricultureKansas State University
New Prairie Presshttpsnewprairiepressorgagstatconference2009proceedings16
Page 10 of 15
RUN
Notice how these user-defined formats are being utilized in the style option of the DEFINE
statement in the Report procedure below Multiple style attributes can be used
ODS LISTING CLOSE
ODS PDF NOTOC STYLE=SASWEB_PURPLE
FILE=CTEMPDEFINE STATEMENT EXAMPLE 10pdf
PROC REPORT DATA=CKDAT NOWD
COLUMNS name ratio
DEFINE name order Analytic Staff CENTER
STYLE=OUTPUTWIDTH=10
DEFINE ratio DISPLAY MISSING Ratio CENTER
STYLE=BACKGROUND=c_ratio
FONT_WEIGHT=FW_RATIO
FONT_STYLE=FS_RATIO
OUTPUTWIDTH=5
RUN
ODS _ALL_ CLOSE
ODS LISTING
The resulting table in Figure 10 has the same background color as the table in Figure 9 but the
font weight and font style are different The column width is also different since the
OUTPUTWIDTH style attribute was used
5 SUMMARY
If your resources allow for the use of color in either printed or electronic format I challenge you
to find the STYLE(s) that works best for you The colors used in this paper display as expected in
the PDF files I created but if you are using another ODS output designation like HTML then
you are more limited in the colors that you can use Always verify that your color choices will be
displayed as expected before finalizing your code If you get a gray were another color is
expected then select another color since the one you specified could not be displayed I prefer to
customize the background color but there are other ways to highlight information in a table
Other Style attributes like FOREGROUND can be used Now go show everyone what your
STYLE looks like
Conference on Applied Statistics in AgricultureKansas State University
New Prairie Presshttpsnewprairiepressorgagstatconference2009proceedings16
Page 11 of 15
6 FIGURES
FIGURE 1 SASWEB
FIGURE 2 STATISTICAL
FIGURE 3 ANALYSIS
FIGURE 4 SASWEB_PURPLE
Conference on Applied Statistics in AgricultureKansas State University
New Prairie Presshttpsnewprairiepressorgagstatconference2009proceedings16
Page 12 of 15
FIGURE 5 CHANGE COLOR OF ROWS AND COLUMNS
FIGURE 6 CHANGING BACKGROUND STYLE FOR ADDITIONAL ROWS
AND FONT STYLE FOR UPDATED COLUMNS
Conference on Applied Statistics in AgricultureKansas State University
New Prairie Presshttpsnewprairiepressorgagstatconference2009proceedings16
Page 13 of 15
FIGURE 7 CHANGE COLOR OF CELLS
FIGURE 8 CHANGE COLOR OF CELLS BASED ON USER-DEFINED FORMAT
$COLOR_FMT
6 Column 3 4 8 26 10 12 14 16 18 20 22 24
Conference on Applied Statistics in AgricultureKansas State University
New Prairie Presshttpsnewprairiepressorgagstatconference2009proceedings16
Page 14 of 15
FIGURE 9 CHANGE COLOR OF CELLS BASED ON USER-DEFINED FORMAT
C_RATIO
FIGURE 10 CHANGE COLOR OF CELLS
BASED ON USER-DEFINED FORMAT C_RATIO
AND CHANGE FONT OF SOME CELLS
BASED ON THE USER-DEFINED FORMATS FW_ RATIO AND FS_ RATIO
7 ACKNOWLEDGMENTS
Special thanks to everyone at AFMC for all their helpful advice and support
The content of this publication does not necessarily reflect the views or policies of Arkansas
Foundation for Medical Care (AFMC) The author assumes full responsibility for the accuracy
and completeness of the ideas presented
For more information about quality measures in the home health setting go to the Home Health
Compare Web site
Conference on Applied Statistics in AgricultureKansas State University
New Prairie Presshttpsnewprairiepressorgagstatconference2009proceedings16
Page 15 of 15
httpwwwmedicaregovHHCompareHomeaspdest=NAV|Home|AboutTabTop
8 REFERENCES
Carter Jeff 2005 Use of Styles in Graphics Proceedings of the thirtieth annual SASreg
Users
Group International Conference Philadelphia PA
httpsupportsascomrnddatavisualizationpaperssugi30GraphStylespdf
Code extract from SAS 913 Service Pack 4 Copyright (c) 2002-2003 by SAS Institute Inc
Cary NC USA
Colorschemer Online v2 httpwwwcolorschemercomonlinehtml Accessed 12282006
Haworth Lauren 2005 SASreg with Style Creating your own ODS Style Template for PDF
Output Proceedings of the thirtieth annual SAS Users Group International Conference
Philadelphia PA 132-30 httpwww2sascomproceedingssugi30132-30pdf
Lund Pete 2008 ldquoPDF Can be Pretty Darn Fancy Tips and Tricks for the ODS PDF
Destinationrdquo Proceedings of the SAS Global Forum 2008 San Antonio TX 033-2008
httpwww2sascomproceedingsforum2008033-2008pdf
The data displayed in the examples are fictitious and should only be used for report layout
examples
9 CONTACT INFORMATION
Your comments and questions are valued and encouraged Contact the author at
Wendy Boberg
Sr Statistician
Arkansas Foundation for Medical Care (AFMC)
401 W Capitol Ave Suite 410
Little Rock AR 72201
Phone 501-212-8716
Fax 501-375-1201
E-mail wbobergafmcorg
Web httpwwwafmcorg
SAS and all other SAS Institute Inc product or service names are registered trademarks or
trademarks of SAS Institute Inc in the USA and other countries reg indicates USA registration
Other brand and product names are trademarks of their respective companies
Conference on Applied Statistics in AgricultureKansas State University
New Prairie Presshttpsnewprairiepressorgagstatconference2009proceedings16
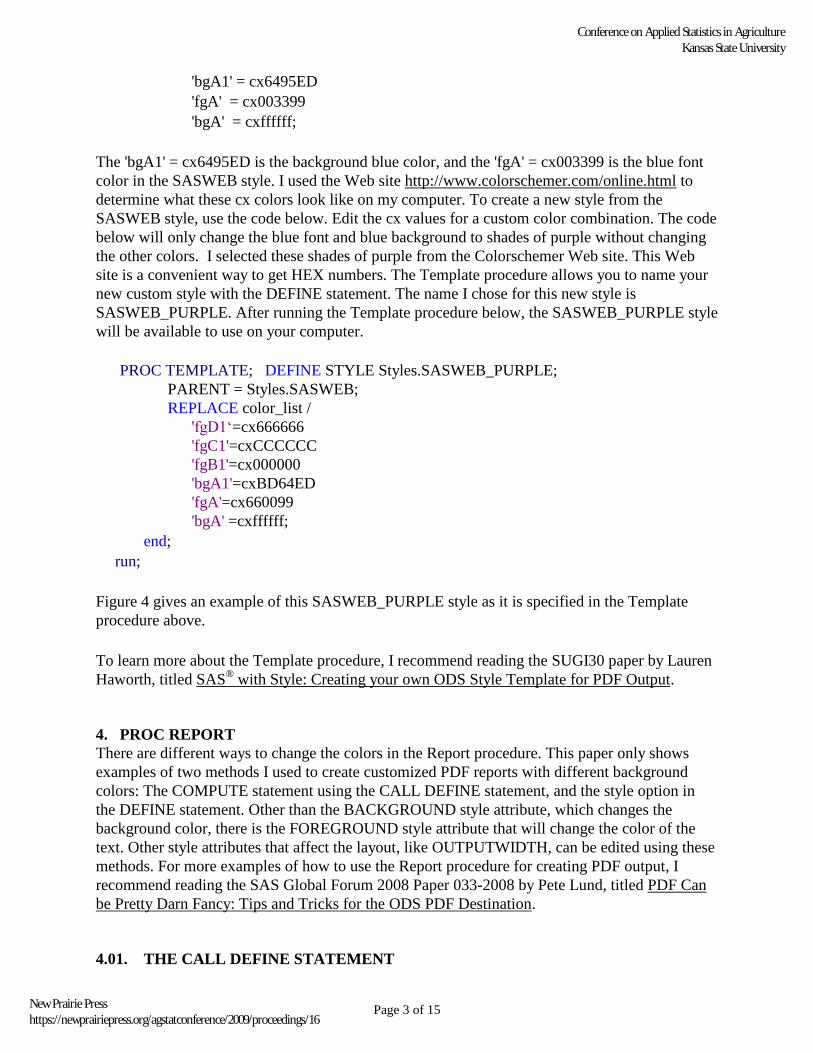
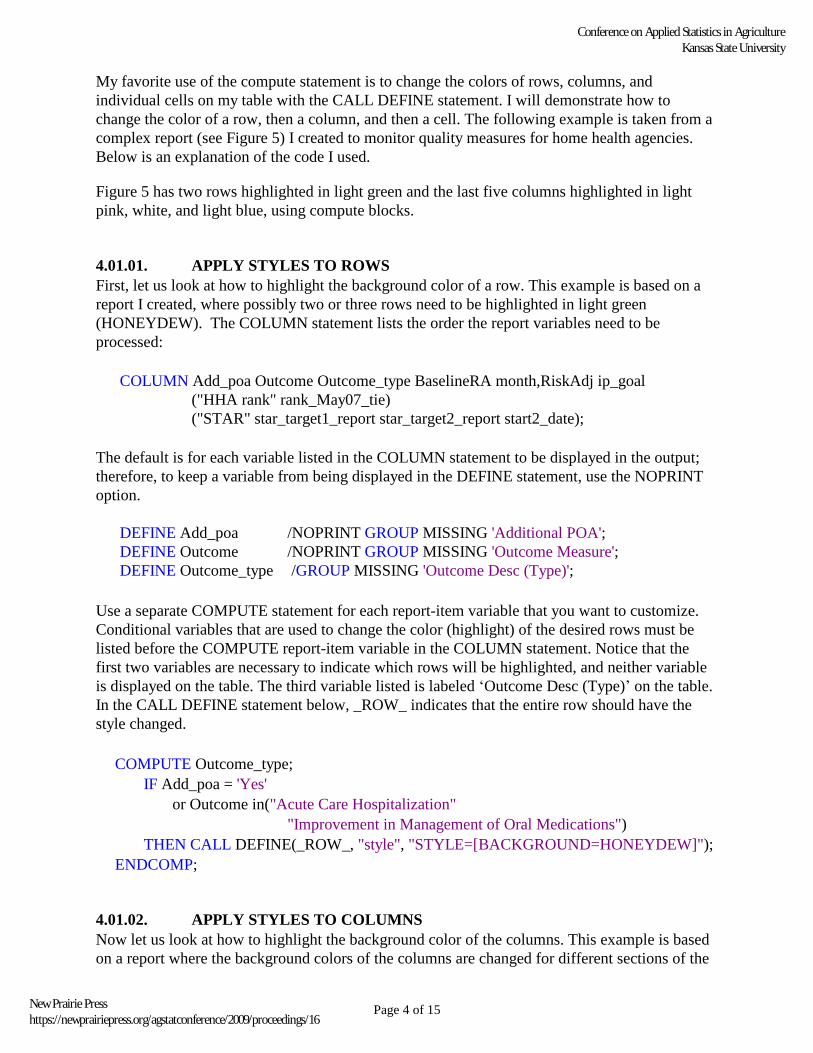
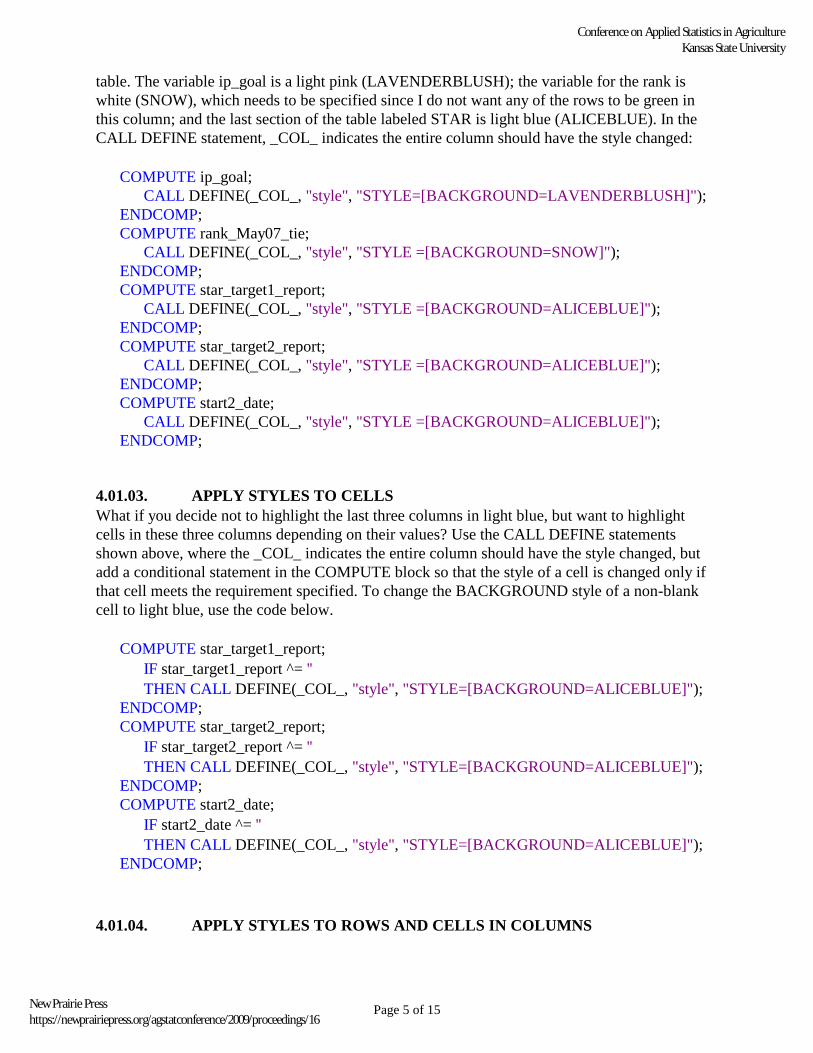
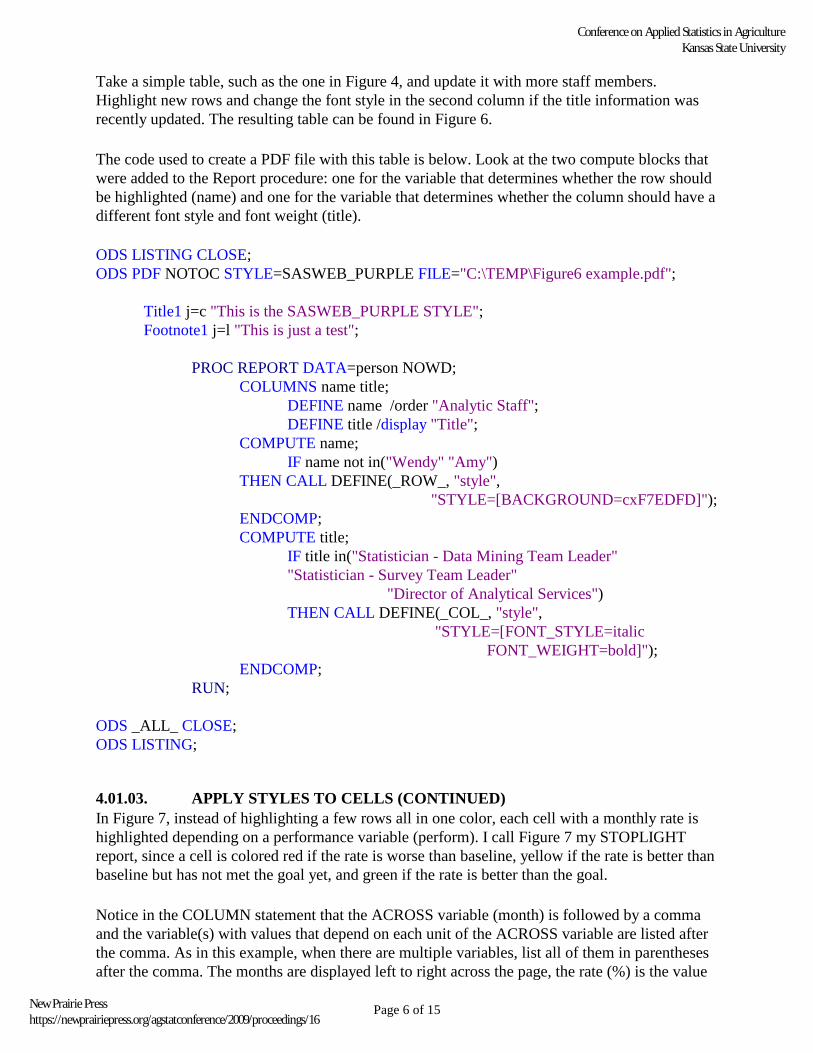
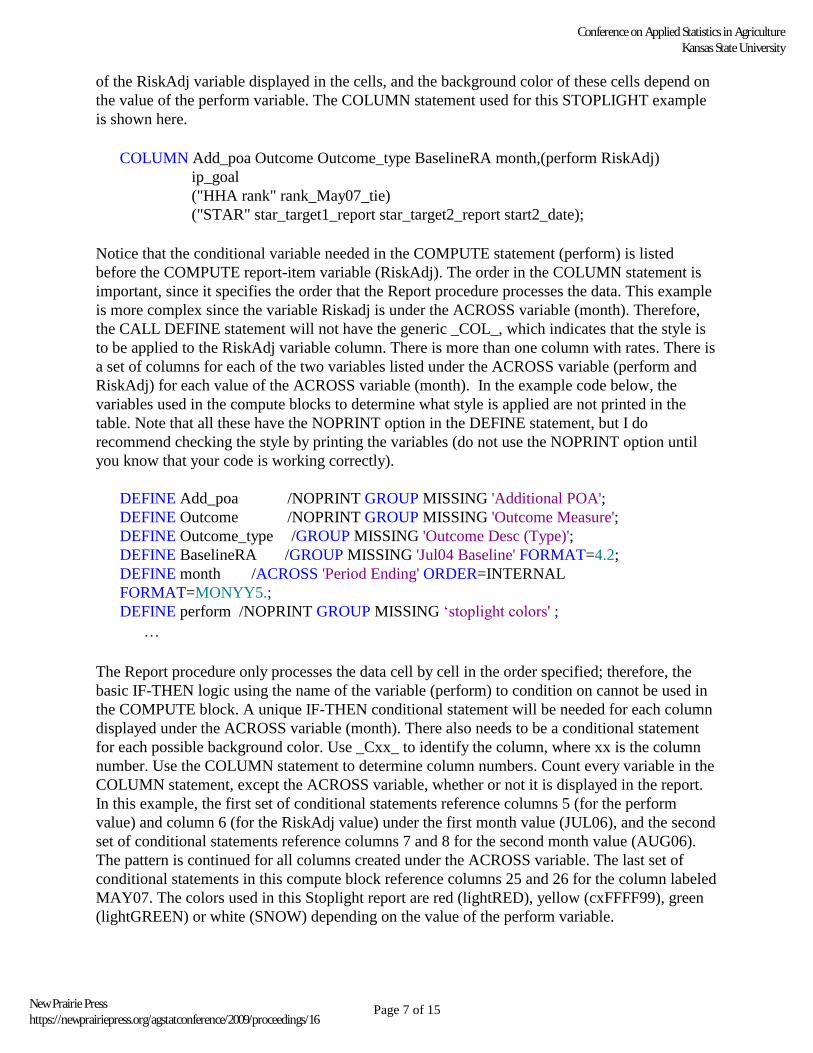
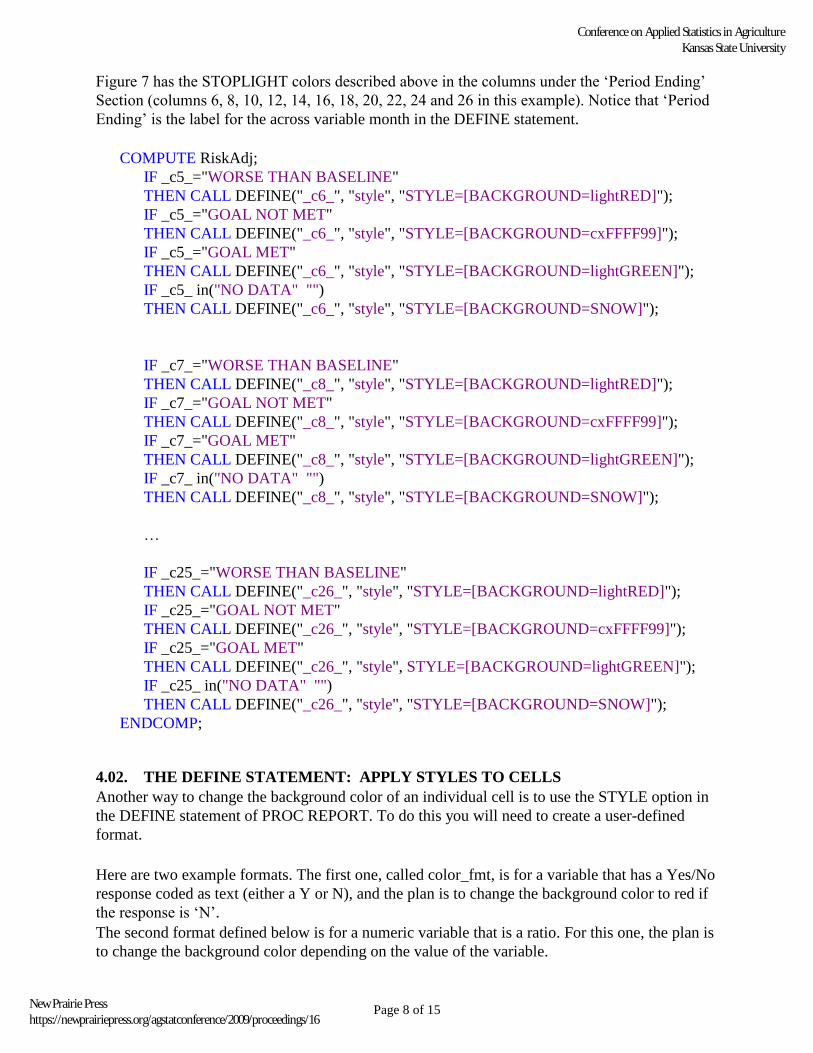
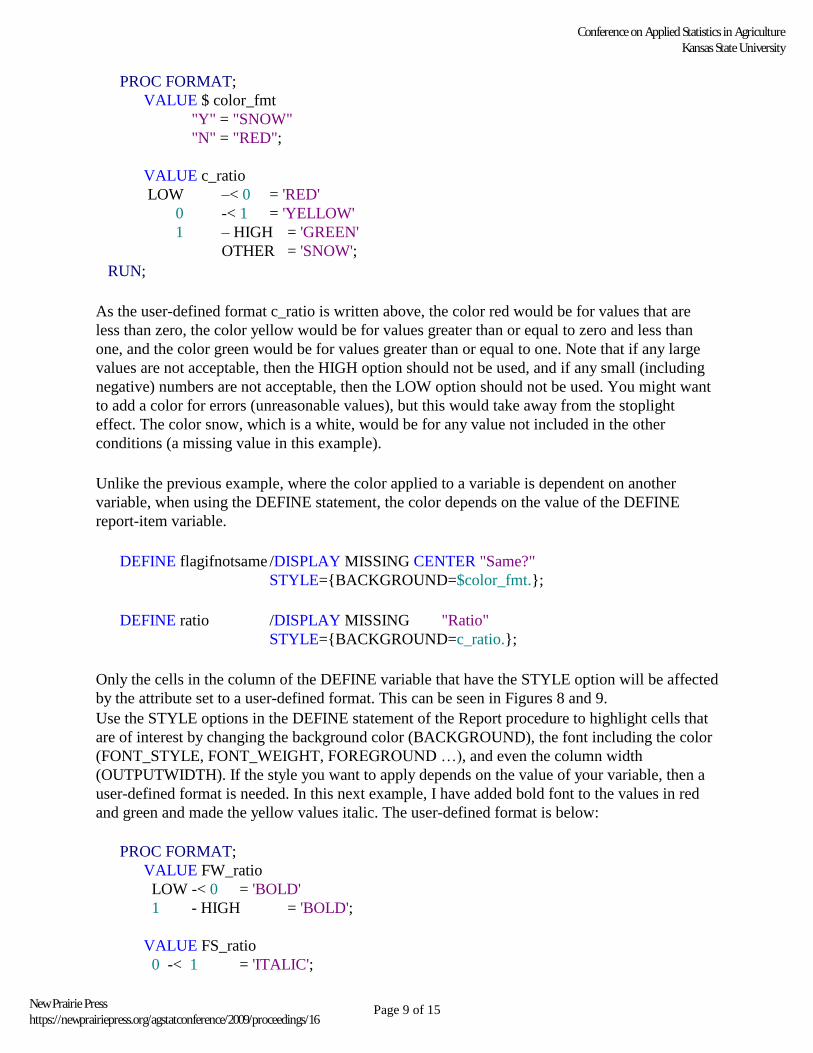
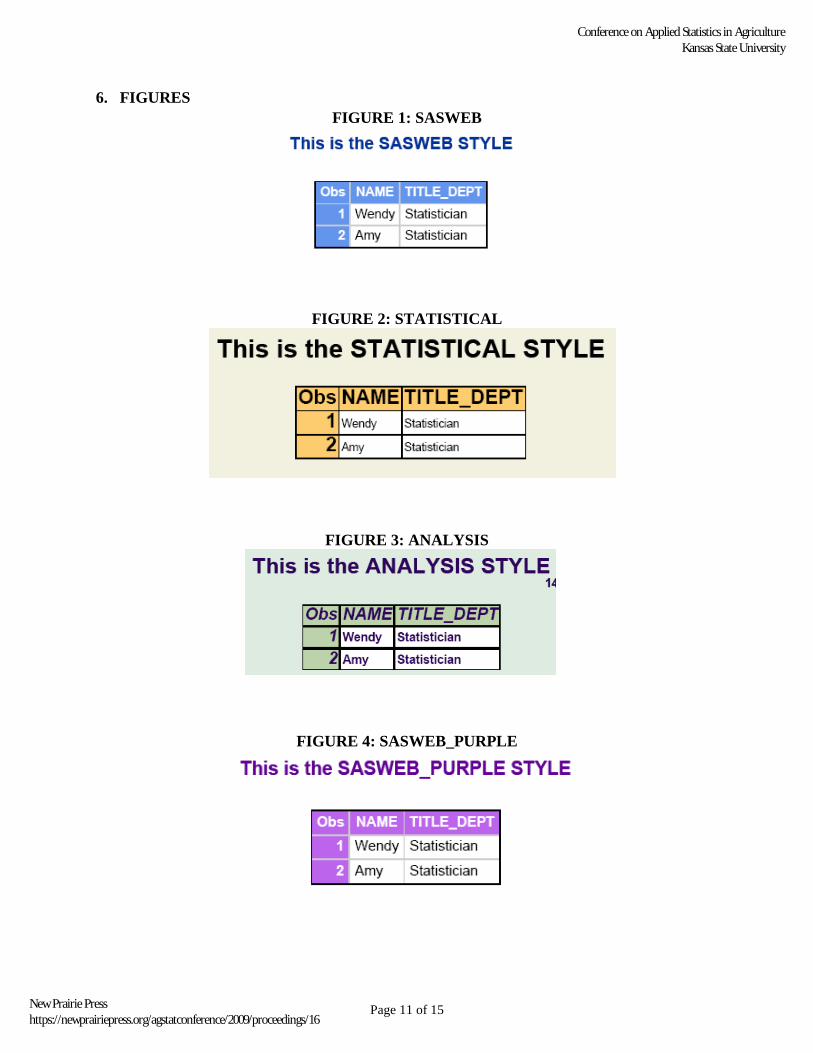
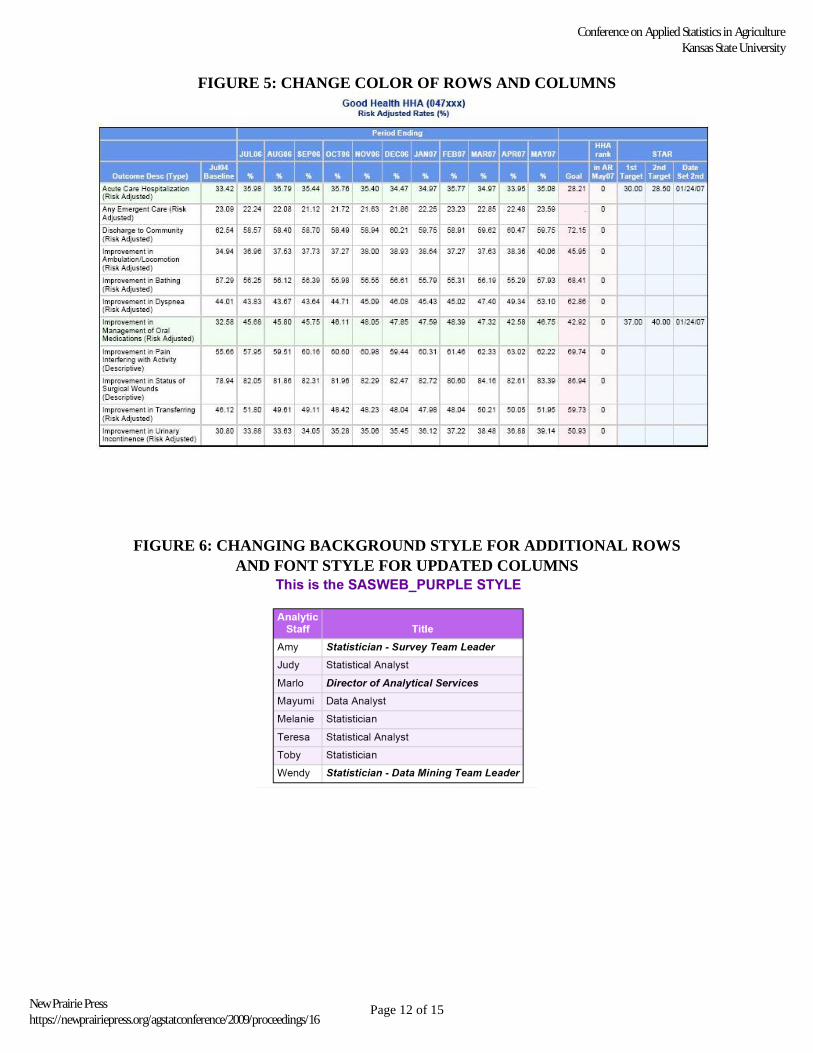
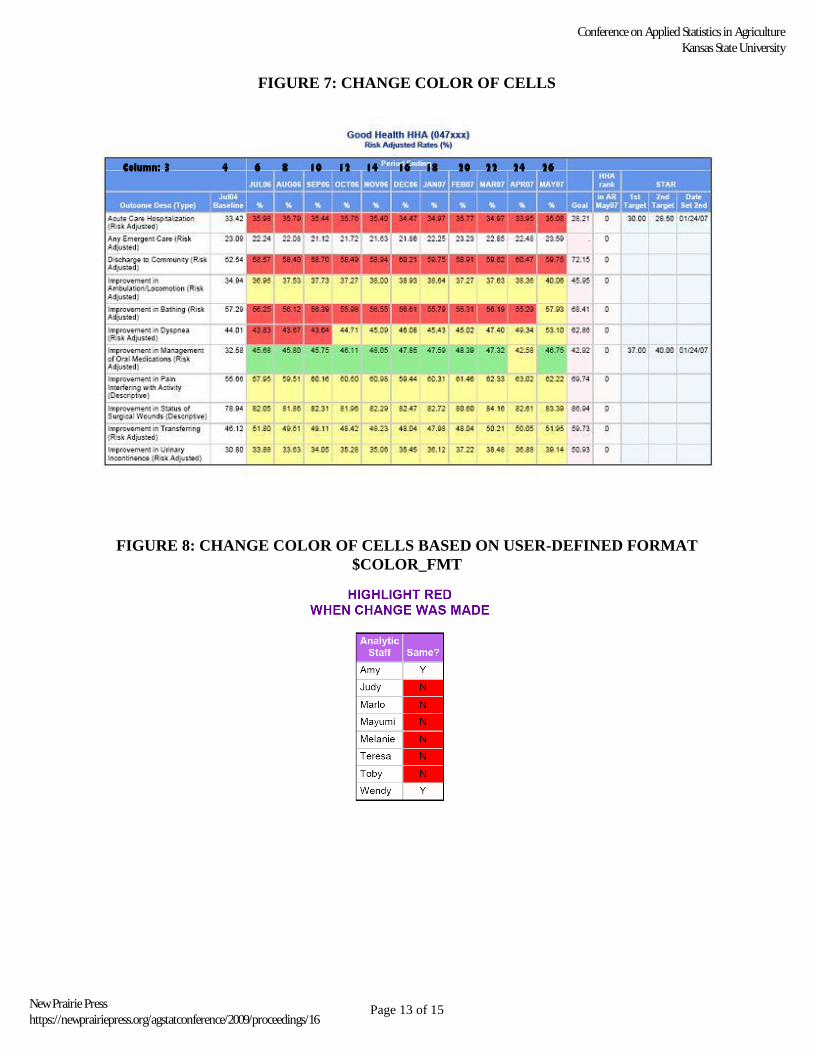
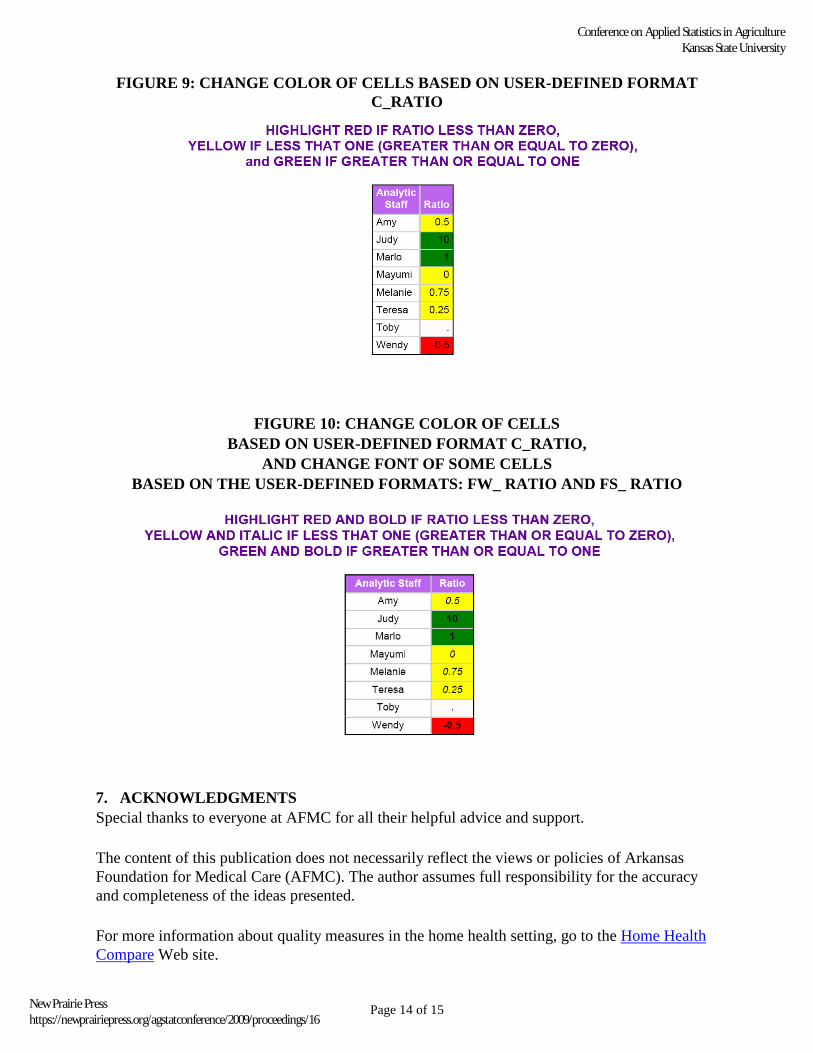
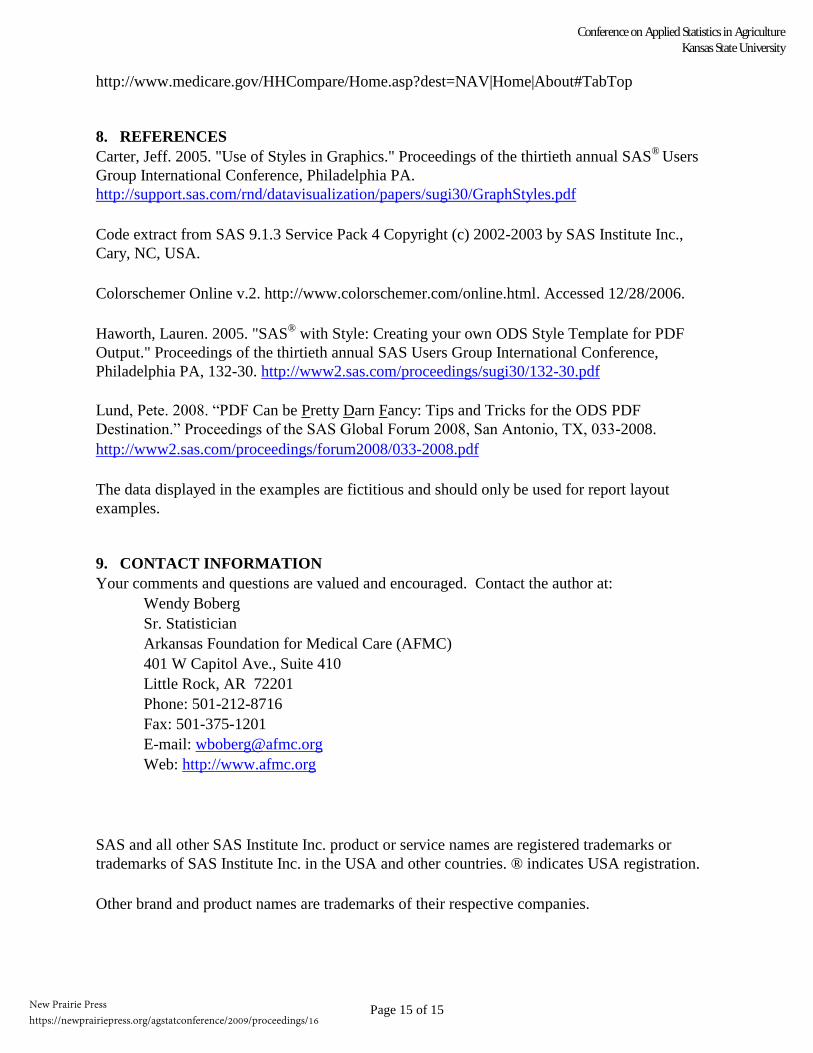