Embed Size (px)
Citation preview

International Fertiliser Society
THE CARBON FOOTPRINT OF FERTILISER PRODUCTION: REGIONAL REFERENCE VALUES
by
Antione Hoxha1 and Bjarne Christensen2 1 Fertilizers Europe, Brussels, Belgium. 2 Chem Technic Consulting, Denmark.
Proceedings 805
Paper presented to the International Fertiliser Society at a Conference in Prague, Czech Republic, on 8th May 2018.
www.fertiliser-society.org
© 2019 International Fertiliser Society ISBN 978-0-85310-442-1
(ISSN 1466-1314)

2
SUMMARY. Fertilizers Europe as the representative of the EU fertiliser industry has commissioned a calculator for assessing the greenhouse gas emissions of the production of fertilisers. The Carbon Footprint Calculator is a cradle to plant gate calculator for fertiliser products. It is freely available on-line and can be used to evaluate the footprint of a given fertiliser produced in a specific plant. For comparison purposes, it also contains reference values for the main regions in the world.
The paper provides tables with regional reference values for the main fertilisers (urea, AN, CAN, UAN).
RELATED PROCEEDINGS OF THE SOCIETY. 183, (1979), Energy Conservation in a Large Chemical Company,
G V Ellis. 191, (1980), New Concept Ammonia Process with Higher Efficiency,
W F van Weenen, J Tielrooy. 338, (1993), Energy Balance in an Ammonium Nitrate-Nitric Acid Plant,
M Saigne. 434, (1999), Environment and Energy - A Business Opportunity for Fertiliser
Producers?, J J B Ward, M S Morrell. 479, (2001), Energy Conservation: Key to Survival for Fertiliser Producers,
W D Verduijn, J J de Wit. 484, (2001), Energy Audits of Fertiliser Production Plants,
I R Barton, J Hunns. 509, (2003), Energy Consumption and Greenhouse Gas Emissions in Fertiliser
Production, T K Jenssen, G Kongshaug. 601, (2007), Ammonia Production: Energy Efficiency, CO2 Balances and
Environmental Impact, J D Pach. 602, (2007), Ammonia Plant Energy-saving Project: Design and
Implementation, W T Nobel, R B J Waggeveld, M J Walton, P A Sharp.
639, (2008), GHG Emissions and Energy Efficiency in European Nitrogen Fertiliser Production and Use, F Bentrup, C Pallière.
643, (2009), EU Climate Policy and Emission Trading: Challenges for the European Fertiliser Industry, R Zwiers, J A M van Balken, E Y E Härmälä, C Pallière, M Cryans.
687, (2011), LCA to Assess the Environmental Impact of Different Fertilisers and Agricultural Systems, F Brentrup, J Lammel.
751, (2014), Assessing the Carbon Footprint of Fertilisers, at Production and Full LCA, B Christensen, F Bentrup, L Six, C Pallière, A Hoxha.

3
CONTENTS
Summary 2
Related Proceedings of the Society 2
1. Introduction 4
2. Calculation of Carbon Footprint 5
3. Data built into the Fertilizers Europe Calculator 6
3.1. Energy sources 6
3.2. Plant specific energy and emission data 8
4. Carbon Footprint comparison of regional nitrogen fertilisers 10
5. Reference 20
Keywords: greenhouse gases, carbon footprint, fertilisers, Carbon Footprint
Calculator.

4
1. INTRODUCTION. Fertilizers Europe has commissioned a tool for estimating the carbon footprint related to the production of selected fertiliser products. The calculator estimates the emission factor (tonnes CO2 equivalent [CO2eq] per tonne product) related to the production of fertilisers. All emissions with GWP (Global Warming Potential) are included. The calculator includes direct and indirect emissions from all materials related to the production of the particular final product delivered in the final product storage at the production site. The Calculator also includes the estimated emissions related to exploitation and transport of energy from the source to the user. The online Carbon Footprint Calculator (web-CFC) is freely available through the Fertilizers Europe web-site1. The Calculator provides options for selecting and inserting the basic assumptions related to raw materials, transportation, energy and production specific data. The tool has been developed to calculate and provide reference values for carbon emissions for selected
fertilisers based on EU average (ammonia and nitric acid), EU BAT (ammonia and nitric acid) as well as other defined references.
calculate emission factors required in the LCA (Life Cycle Assessment) calculator for agriculture, such as the CoolFarmTool or other similar tools for calculating the LCA for food products and from agriculture.
provide regional data (North America, Latin America, Africa, Middle East, CIS, South East Asia, South Asia, Oceania, China) for ammonia and nitric acid for inclusion in the Calculator for reference calculation of emission factors. The goal is to obtain carbon emission averages for the selected fertilisers in the above regions, to be used as reference points for global comparisons. The regional averages can also be used as an input for LCA calculators (such as Cool Farm Tool).
The tool is also intended to be used by fertiliser manufacturers to calculate their own emission factors for internal company reference purposes. Provided that the data are verified by an external auditor (The Carbon Trust has been appointed by Fertilizers Europe as such auditor) fertiliser producers can use the calculator for: the purpose of legal reporting and/or sustainability and CSR reports. the purpose of communicating with local or national authorities
concerning energy and environmental issues. 1 https://www.fertilizerseurope.com

5
2. CALCULATION OF CARBON FOOTPRINT. The Calculator is divided into four main parts: • Defining the fertilisers to be calculated. • Energy sources using either built-in average data or own specified data. • Components part for specifying imported materials and own produced
intermediates. • Summary part showing the calculated CO2eq for the selected fertilisers. • A detailed pdf report containing all the details can be generated and down-
loaded. The main structure in the calculations is based on the principles described by Kongshaug, (1998), as shown in Figure 1.
Figure 1: Principles of carbon footprint calculator for fertiliser products.

6
3. DATA BUILT INTO THE FERTILIZERS EUROPE CALCULATOR. To improve the ease of use of the calculator a large amount of data has been built into it. This enables products produced in different regions to be compared. 3.1. Energy sources. In this section this regional data on energy sources is shown. Table 1 covers fossil sources of fuel and feedstock carbon. Table 1: Fossil fuels. Source: IPCC guidelines 2006 (Fuel carbon factor).
Thinkstep, GaBi database (energy supply). CF supply is the additional Carbon Factor of the exploration and transport of the energy source to the end user.
Carbon factor GaBi: CF supply
kg CO2eq/GJ kg CO2eq/GJ
Natural Gas, EU-27 56.1 11.4
LPG, Liq. Petroleum Gas 63.1 16.9
Heavy Fuel Oil (HFO) 77.4 11.2
High Viscosity Residue (HVR) 80.7 0.0
Coal (Bituminous), EU-27 94.6 10.9
Natural Gas, North America 56.1 15.3
Natural Gas, Latin America 56.1 5.7
Natural Gas, Africa 56.1 8.7
Natural Gas, Middle East 56.1 5.3
Natural Gas, CIS (Russia Commonwealth) 56.1 11.6
Natural Gas, South East Asia 56.1 7.4
Natural Gas, South Asia 56.1 12.2
Natural Gas, Oceania 56.1 7.9
Natural Gas, China 56.1 13.5
Coal (Bituminous), China 94.6 11.2
Own data optional optional

7
Table 2 shows the regional model data for electricity. Table 2: Electricity. Source: IEA, Carbon factors for electricity generation,
2011. CF supply is the additional Carbon Factor of the exploration and transport of the energy source to the end user.
Carbon factor GaBi: CF supply
kg CO2eq/GJ kg CO2eq/GJ
EU-27 average1 97.8 31.5
Conventional coal (EU-27) 238.9 27.3
North America1 113.4 25.4
Latin America1 113.2 68.1
Africa1 149.7 48.3
Middle East1 176.2 49.6
CIS (Russian Commonwealth)1 128.0 57.3
South East Asia1 192.1 64.9
South Asia1 212.7 101.9
Oceania1 212.2 41.4
China1 212.2 58.9
Own data optional optional
1 These data are from the International Energy Agency (IEA), 2011.
8
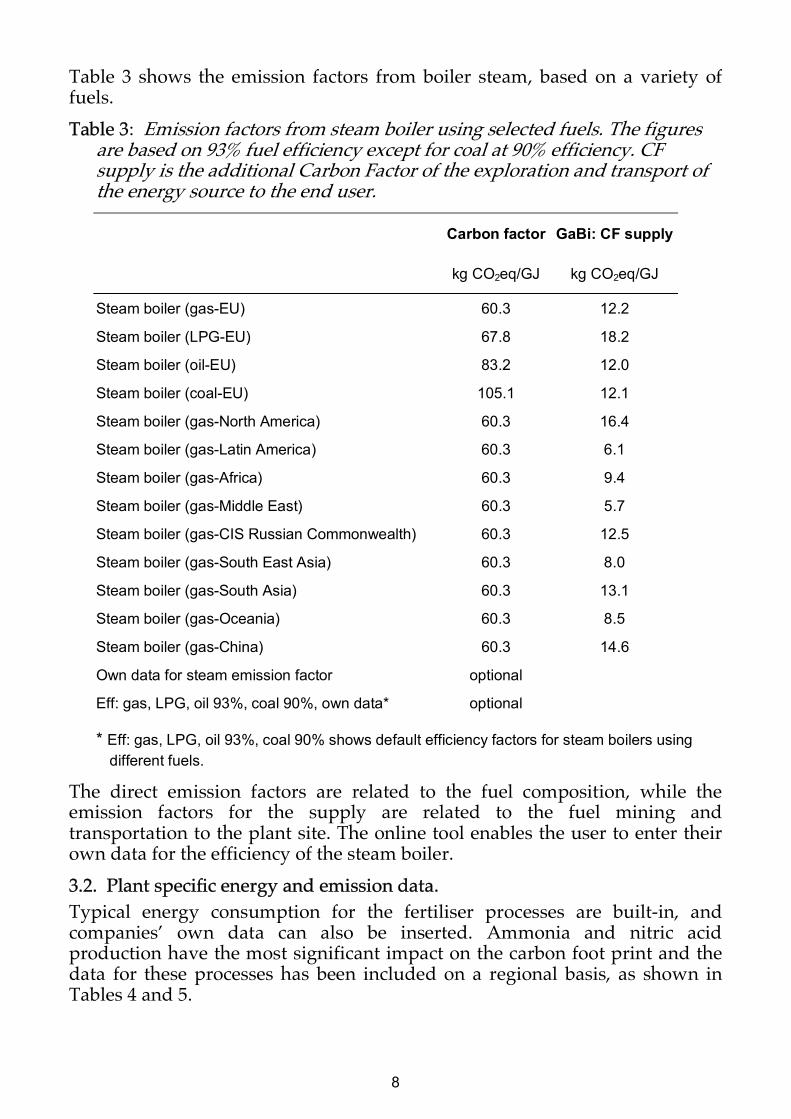
Table 3 shows the emission factors from boiler steam, based on a variety of fuels. Table 3: Emission factors from steam boiler using selected fuels. The figures
are based on 93% fuel efficiency except for coal at 90% efficiency. CF supply is the additional Carbon Factor of the exploration and transport of the energy source to the end user.
Carbon factor GaBi: CF supply
kg CO2eq/GJ kg CO2eq/GJ
Steam boiler (gas-EU) 60.3 12.2
Steam boiler (LPG-EU) 67.8 18.2
Steam boiler (oil-EU) 83.2 12.0
Steam boiler (coal-EU) 105.1 12.1
Steam boiler (gas-North America) 60.3 16.4
Steam boiler (gas-Latin America) 60.3 6.1
Steam boiler (gas-Africa) 60.3 9.4
Steam boiler (gas-Middle East) 60.3 5.7
Steam boiler (gas-CIS Russian Commonwealth) 60.3 12.5
Steam boiler (gas-South East Asia) 60.3 8.0
Steam boiler (gas-South Asia) 60.3 13.1
Steam boiler (gas-Oceania) 60.3 8.5
Steam boiler (gas-China) 60.3 14.6
Own data for steam emission factor optional
Eff: gas, LPG, oil 93%, coal 90%, own data* optional
* Eff: gas, LPG, oil 93%, coal 90% shows default efficiency factors for steam boilers using different fuels.
The direct emission factors are related to the fuel composition, while the emission factors for the supply are related to the fuel mining and transportation to the plant site. The online tool enables the user to enter their own data for the efficiency of the steam boiler. 3.2. Plant specific energy and emission data. Typical energy consumption for the fertiliser processes are built-in, and companies’ own data can also be inserted. Ammonia and nitric acid production have the most significant impact on the carbon foot print and the data for these processes has been included on a regional basis, as shown in Tables 4 and 5.

9
Table 4: Energy consumption data in fertiliser processes for ammonia.
Product
Energy input, GJ per tonne product
Emissions kg/t product3
Feedstock and fuel
Steam Electricity N2O CH4
EU average 2013/141 34.03 -1.49 0.84 0
EU ETS benchmark 30.23 -3.6 1.2 0
EU BAT 31.6 -1.8 2.0 0
North America2 34.891 0 0 0
Latin America2 41.379 0 0 0
Africa2 36.705 0 0 0
Middle East2 35.745 0 0 0
CIS (Russian Commonwealth)2 39.491 0 0 0
South East Asia2 37.454 0 0 0
South Asia2 42.814 0 0 0
Oceania2 32.105 0 0 0
China, Coal based2 44.255 0 0 0
China, Gas based2 39.491 0 0 0
Own data insert insert insert 0
1 EU average 2013/14 is based on the PTAI Benchmarking of Fertilizers Europe ammonia plant 2013/14.
2 The energy data (feed and fuel) for this regions include steam and electricity based on PSI methodology. These data are from Integer Research, March 2016.
3 The online tool has options to include emissions of N2O and CH4, but these are seldom reported.

10
Table 5: Energy consumption data in fertiliser processes for nitric acid (100%).
Product
Energy input, GJ per tonne product
Emissions kg/tonne product
Feedstock and fuel
Steam Electricity N2O CH4
EU average 20141 -1.75 0.03 0.7 0
EU ETS benchmark2 -1.75 0.03 0.974 0
EU BAT, existing plants3 -1.75 0.03 1.85 0
North America4 -1.75 0.03 5.4 0
Latin America4 -1.75 0.03 4.7 0
Africa4 -1.75 0.03 4.7 0
Middle East4 -1.75 0.03 6.5 0
CIS (Russian Commonwealth)4 -1.75 0.03 5.6 0
South East Asia4 -1.75 0.03 5.9 0
South Asia4 -1.75 0.03 4.5 0
Oceania4 -1.75 0.03 5.2 0
China4 -1.75 0.03 7.4 0
Own data insert insert insert insert
1 The EU average 2014 is based on a survey done by Fertilizers Europe. 2 The EU ETS benchmark for nitric acid is set to 0.974 kg N2O/t 100% acid. 3 The EU BAT for existing plants is given as 0.12 – 1.85 kg N2O/t 100% acid. In the calculator
1.85 kg N2O/t 100% acid is used. The energy balance is given as typical and accepted by Fertilizers Europe Technical Committee.
4 These data are from Integer Research, March 2016. 4. CARBON FOOTPRINT COMPARISON OF REGIONAL
NITROGEN FERTILISERS. Fertilizers Europe commissioned Integer Research to estimate the emission factors from ammonia and nitric acid plant in various global regions (North America, Latin America, Africa, Middle East, CIS (Russia Commonwealth), South East Asia, South Asia, Oceania and China). The emission factors are shown in the tables in the previous section. The regional emission data and regional energy supply data have been used to calculate the carbon footprint of the following four nitrogen fertilisers: ammonium nitrate, calcium ammonium nitrate, urea and the liquid fertiliser UAN-30.
11
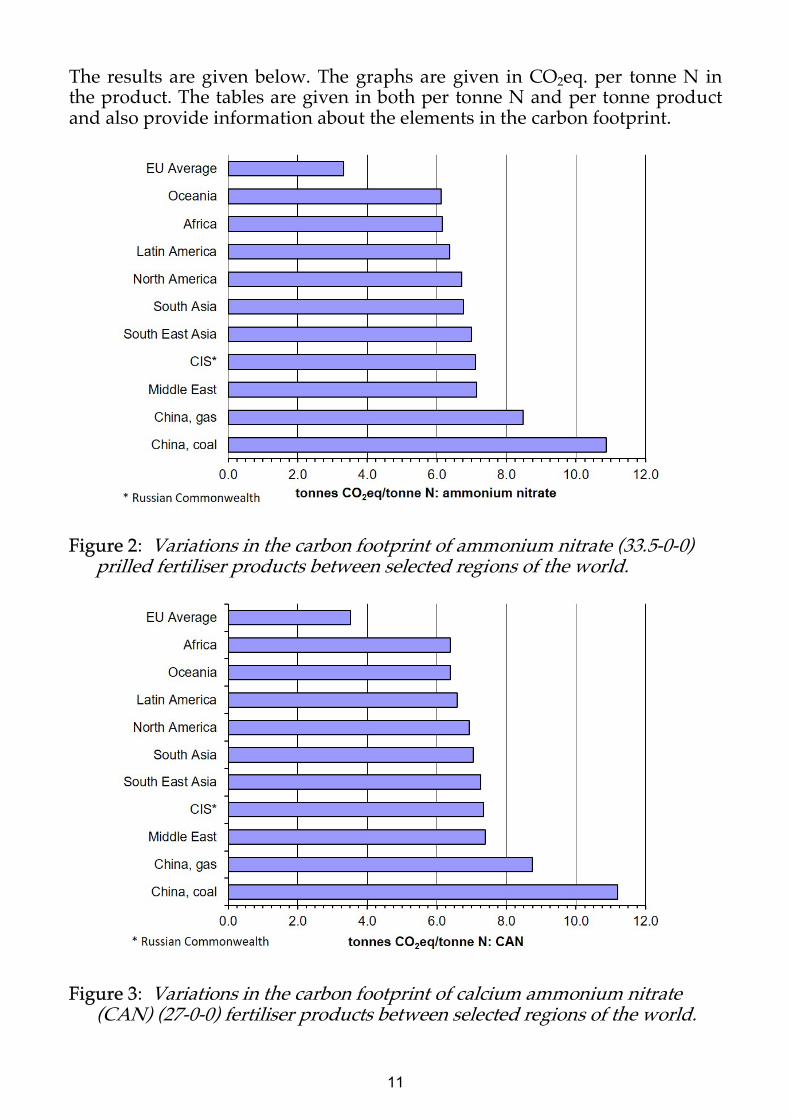
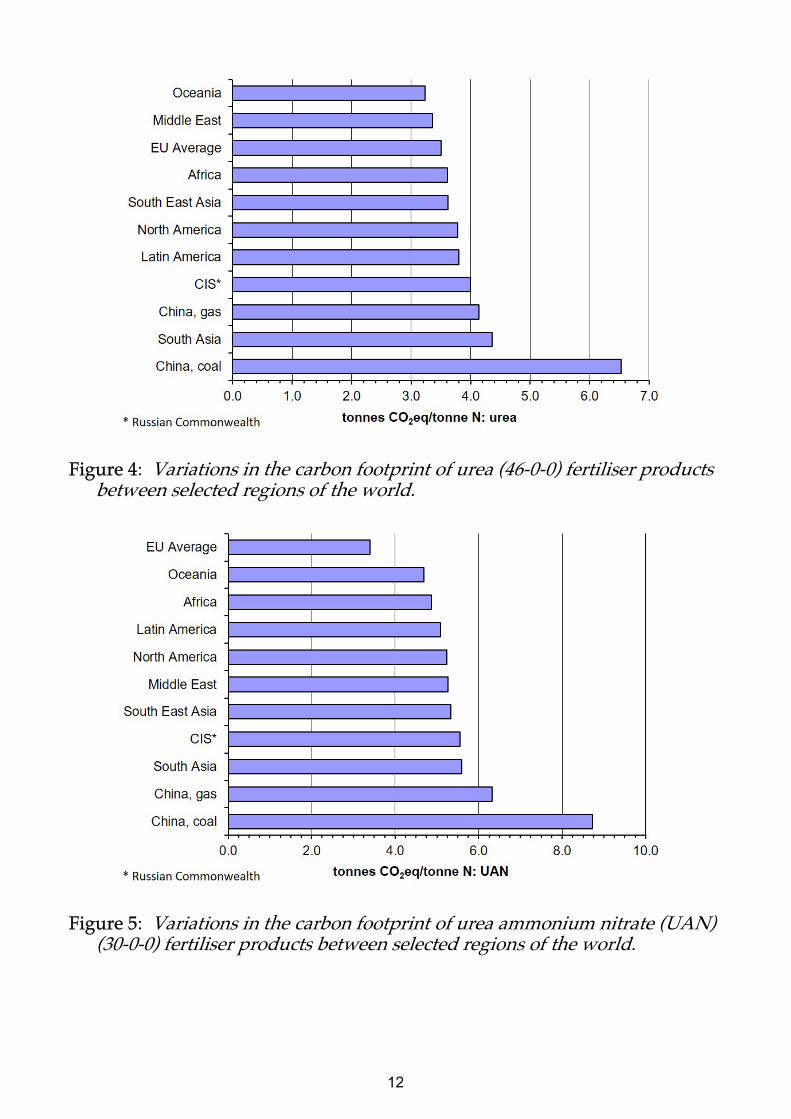
The results are given below. The graphs are given in CO2eq. per tonne N in the product. The tables are given in both per tonne N and per tonne product and also provide information about the elements in the carbon footprint.
Figure 2: Variations in the carbon footprint of ammonium nitrate (33.5-0-0)
prilled fertiliser products between selected regions of the world.
Figure 3: Variations in the carbon footprint of calcium ammonium nitrate
(CAN) (27-0-0) fertiliser products between selected regions of the world.
12
Figure 4: Variations in the carbon footprint of urea (46-0-0) fertiliser products
between selected regions of the world.
Figure 5: Variations in the carbon footprint of urea ammonium nitrate (UAN)
(30-0-0) fertiliser products between selected regions of the world.
13
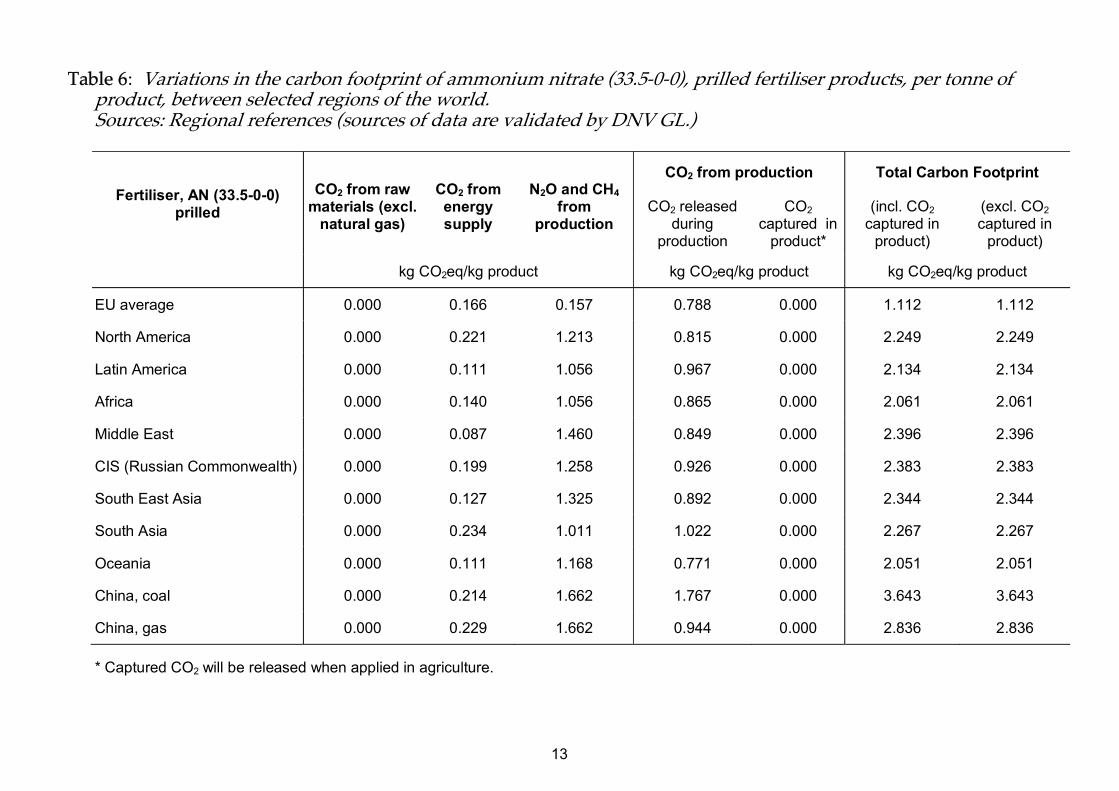
Table 6: Variations in the carbon footprint of ammonium nitrate (33.5-0-0), prilled fertiliser products, per tonne of product, between selected regions of the world. Sources: Regional references (sources of data are validated by DNV GL.)
Fertiliser, AN (33.5-0-0) prilled
CO2 from raw materials (excl.
natural gas)
CO2 from energy supply
N2O and CH4 from
production
CO2 from production Total Carbon Footprint
CO2 released during
production
CO2 captured in
product*
(incl. CO2 captured in
product)
(excl. CO2 captured in
product)
kg CO2eq/kg product kg CO2eq/kg product kg CO2eq/kg product
EU average 0.000 0.166 0.157 0.788 0.000 1.112 1.112
North America 0.000 0.221 1.213 0.815 0.000 2.249 2.249
Latin America 0.000 0.111 1.056 0.967 0.000 2.134 2.134
Africa 0.000 0.140 1.056 0.865 0.000 2.061 2.061
Middle East 0.000 0.087 1.460 0.849 0.000 2.396 2.396
CIS (Russian Commonwealth) 0.000 0.199 1.258 0.926 0.000 2.383 2.383
South East Asia 0.000 0.127 1.325 0.892 0.000 2.344 2.344
South Asia 0.000 0.234 1.011 1.022 0.000 2.267 2.267
Oceania 0.000 0.111 1.168 0.771 0.000 2.051 2.051
China, coal 0.000 0.214 1.662 1.767 0.000 3.643 3.643
China, gas 0.000 0.229 1.662 0.944 0.000 2.836 2.836
* Captured CO2 will be released when applied in agriculture.
14
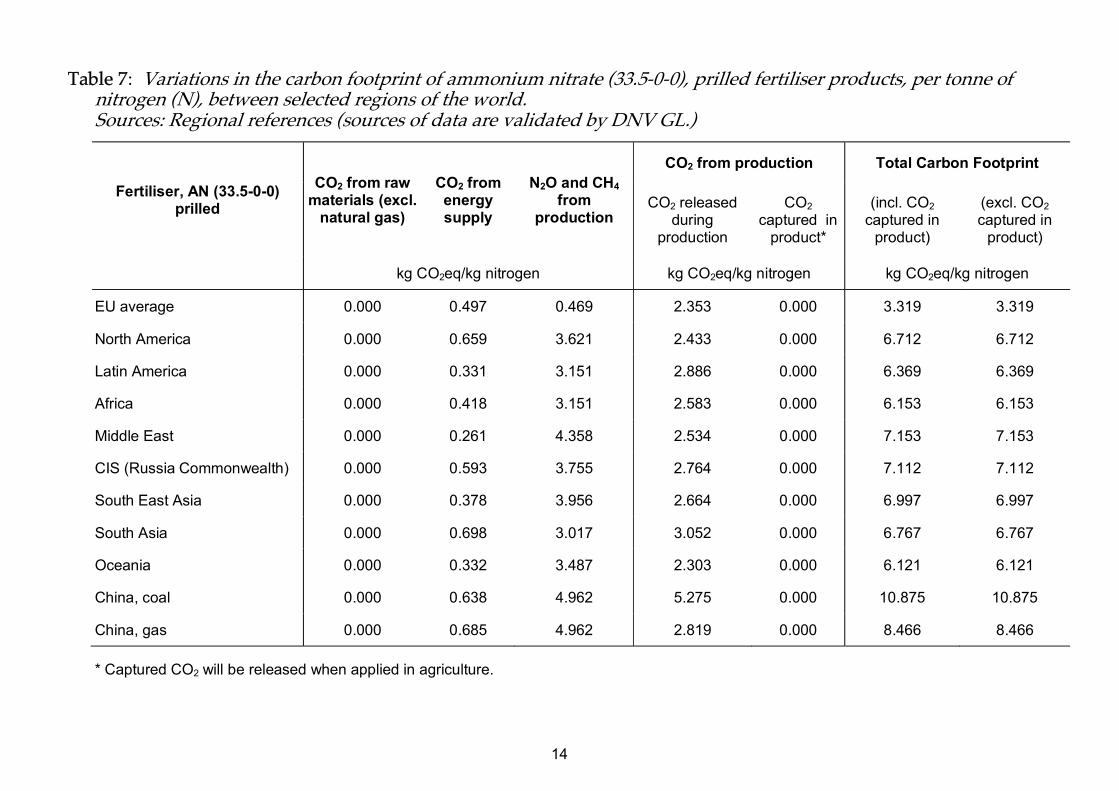
Table 7: Variations in the carbon footprint of ammonium nitrate (33.5-0-0), prilled fertiliser products, per tonne of nitrogen (N), between selected regions of the world. Sources: Regional references (sources of data are validated by DNV GL.)
Fertiliser, AN (33.5-0-0) prilled
CO2 from raw materials (excl.
natural gas)
CO2 from energy supply
N2O and CH4 from
production
CO2 from production Total Carbon Footprint
CO2 released during
production
CO2 captured in
product*
(incl. CO2 captured in
product)
(excl. CO2 captured in
product)
kg CO2eq/kg nitrogen kg CO2eq/kg nitrogen kg CO2eq/kg nitrogen
EU average 0.000 0.497 0.469 2.353 0.000 3.319 3.319
North America 0.000 0.659 3.621 2.433 0.000 6.712 6.712
Latin America 0.000 0.331 3.151 2.886 0.000 6.369 6.369
Africa 0.000 0.418 3.151 2.583 0.000 6.153 6.153
Middle East 0.000 0.261 4.358 2.534 0.000 7.153 7.153
CIS (Russia Commonwealth) 0.000 0.593 3.755 2.764 0.000 7.112 7.112
South East Asia 0.000 0.378 3.956 2.664 0.000 6.997 6.997
South Asia 0.000 0.698 3.017 3.052 0.000 6.767 6.767
Oceania 0.000 0.332 3.487 2.303 0.000 6.121 6.121
China, coal 0.000 0.638 4.962 5.275 0.000 10.875 10.875
China, gas 0.000 0.685 4.962 2.819 0.000 8.466 8.466
* Captured CO2 will be released when applied in agriculture.

15
Table 8: Variations in the carbon footprint of calcium ammonium nitrate(CAN) (27-0-0) fertiliser products, per tonne of product, between selected regions of the world. Sources: Regional references (sources of data are validated by DNV GL.)
Fertiliser, CAN (27-0-0) CO2 from raw
materials (excl. natural gas)
CO2 from energy supply
N2O and CH4 from
production
CO2 from production Total Carbon Footprint
CO2 released during
production
CO2 captured in
product*
(incl. CO2 captured in
product)
(excl. CO2 captured in
product)
kg CO2eq/kg product kg CO2eq/kg product kg CO2eq/kg product
EU average 0.016 0.142 0.127 0.667 0.000 0.951 0.951
North America 0.016 0.186 0.978 0.690 0.000 1.870 1.870
Latin America 0.016 0.100 0.851 0.813 0.000 1.779 1.779
Africa 0.016 0.122 0.851 0.735 0.000 1.724 1.724
Middle East 0.016 0.078 1.177 0.725 0.000 1.996 1.996
CIS (Russia Commonwealth) 0.016 0.171 1.014 0.781 0.000 1.982 1.982
South East Asia 0.016 0.112 1.068 0.762 0.000 1.958 1.958
South Asia 0.016 0.205 0.815 0.869 0.000 1.905 1.905
Oceania 0.016 0.097 0.941 0.667 0.000 1.721 1.721
China, coal 0.016 0.183 1.340 1.485 0.000 3.023 3.023
China, gas 0.016 0.197 1.340 0.806 0.000 2.358 2.358
* Captured CO2 will be released when applied in agriculture.

16
Table 9: Variations in the carbon footprint of calcium ammonium nitrate(CAN) (27-0-0) fertiliser products, per tonne of nitrogen (N), between selected regions of the world. Sources: Regional references (sources of data are validated by DNV GL.)
Fertiliser, CAN (27-0-0) CO2 from raw
materials (excl. natural gas)
CO2 from energy supply
N2O and CH4 from
production
CO2 from production Total Carbon Footprint
CO2 released during
production
CO2 captured in
product*
(incl. CO2 captured in
product)
(excl. CO2 captured in
product)
kg CO2eq/kg nitrogen kg CO2eq/kg nitrogen kg CO2eq/kg nitrogen
EU average 0.058 0.526 0.469 2.470 0.000 3.523 3.523
North America 0.058 0.690 3.621 2.557 0.000 6.926 6.926
Latin America 0.058 0.369 3.151 3.010 0.000 6.588 6.588
Africa 0.058 0.451 3.151 2.723 0.000 6.384 6.384
Middle East 0.058 0.290 4.358 2.685 0.000 7.391 7.391
CIS (Russian Commonwealth) 0.058 0.634 3.755 2.894 0.000 7.341 7.341
South East Asia 0.058 0.416 3.956 2.822 0.000 7.252 7.252
South Asia 0.058 0.759 3.017 3.219 0.000 7.054 7.054
Oceania 0.058 0.360 3.487 2.470 0.000 6.375 6.375
China, coal 0.058 0.678 4.962 5.500 0.000 11.198 11.198
China, gas 0.058 0.729 4.962 2.987 0.000 8.735 8.735
* Captured CO2 will be released when applied in agriculture.

17
Table 10: Variations in the carbon footprint of urea (46-0-0) fertiliser products, per tonne of product, between selected regions of the world. Sources: Regional references (sources of data are validated by DNV GL.)
Fertiliser, Urea (46-0-0) CO2 from raw
materials (excl. natural gas)
CO2 from energy supply
N2O and CH4 from
production
CO2 from production Total Carbon Footprint
CO2 released during
production
CO2 captured in
product*
(incl. CO2 captured in
product)
(excl. CO2 captured in
product)
kg CO2eq/kg product kg CO2eq/kg product kg CO2eq/kg product
EU average 0.000 0.278 0.000 0.600 0.733 1.611 0.878
North America 0.000 0.371 0.000 0.635 0.733 1.739 1.006
Latin America 0.000 0.172 0.000 0.841 0.733 1.746 1.013
Africa 0.000 0.228 0.000 0.700 0.733 1.661 0.928
Middle East 0.000 0.139 0.000 0.675 0.733 1.547 0.814
CIS (Russia Commonwealth) 0.000 0.321 0.000 0.784 0.733 1.838 1.105
South East Asia 0.000 0.201 0.000 0.732 0.733 1.667 0.934
South Asia 0.000 0.367 0.000 0.907 0.733 2.007 1.274
Oceania 0.000 0.185 0.000 0.566 0.733 1.484 0.751
China, coal 0.000 0.350 0.000 1.918 0.733 3.002 2.269
China, gas 0.000 0.372 0.000 0.801 0.733 1.905 1.172
* Captured CO2 will be released when applied in agriculture.

18
Table 11: Variations in the carbon footprint of urea (46-0-0) fertiliser products, per tonne of nitrogen (N), between selected regions of the world. Sources: Regional references (sources of data are validated by DNV GL.)
Fertiliser, Urea (46-0-0) CO2 from raw
materials (excl. natural gas)
CO2 from energy supply
N2O and CH4 from
production
CO2 from production Total Carbon Footprint
CO2 released during
production
CO2 captured in
product*
(incl. CO2 captured in
product)
(excl. CO2 captured in
product)
kg CO2eq/kg nitrogen kg CO2eq/kg nitrogen kg CO2eq/kg nitrogen
EU average 0.000 0.605 0.000 1.304 1.593 3.502 1.909
North America 0.000 0.807 0.000 1.380 1.593 3.781 2.187
Latin America 0.000 0.373 0.000 1.829 1.593 3.795 2.202
Africa 0.000 0.495 0.000 1.521 1.593 3.610 2.016
Middle East 0.000 0.303 0.000 1.466 1.593 3.363 1.770
CIS (Russia Commonwealth) 0.000 0.697 0.000 1.704 1.593 3.995 2.401
South East Asia 0.000 0.438 0.000 1.591 1.593 3.623 2.029
South Asia 0.000 0.798 0.000 1.971 1.593 4.362 2.769
Oceania 0.000 0.403 0.000 1.230 1.593 3.226 1.633
China, coal 0.000 0.761 0.000 4.171 1.593 6.525 4.932
China, gas 0.000 0.808 0.000 1.741 1.593 4.142 2.549
* Captured CO2 will be released when applied in agriculture.

19
Table 12: Variations in the carbon footprint of urea ammonium nitrate (UAN) (30-0-0) fertiliser products, per tonne of product, between selected regions of the world. Sources: Regional references (sources of data are validated by DNV GL.)
Fertiliser, UAN (30-0-0) CO2 from raw
materials (excl. natural gas)
CO2 from energy supply
N2O and CH4 from
production
CO2 from production Total Carbon Footprint
CO2 released during
production
CO2 captured in
product*
(incl. CO2 captured in
product)
(excl. CO2 captured in
product)
kg CO2eq/kg product kg CO2eq/kg product kg CO2eq/kg product
EU average 0.000 0.165 0.070 0.546 0.239 1.021 0.782
North America 0.000 0.219 0.543 0.570 0.239 1.571 1.332
Latin America 0.000 0.109 0.473 0.705 0.239 1.526 1.287
Africa 0.000 0.138 0.473 0.616 0.239 1.466 1.227
Middle East 0.000 0.087 0.654 0.602 0.239 1.581 1.342
CIS (Russian Commonwealth) 0.000 0.195 0.563 0.669 0.239 1.666 1.427
South East Asia 0.000 0.125 0.593 0.641 0.239 1.598 1.359
South Asia 0.000 0.228 0.453 0.757 0.239 1.677 1.438
Oceania 0.000 0.111 0.523 0.534 0.239 1.407 1.168
China, coal 0.000 0.211 0.744 1.420 0.239 2.615 2.376
China, gas 0.000 0.225 0.744 0.688 0.239 1.896 1.657
* Captured CO2 will be released when applied in agriculture.
20
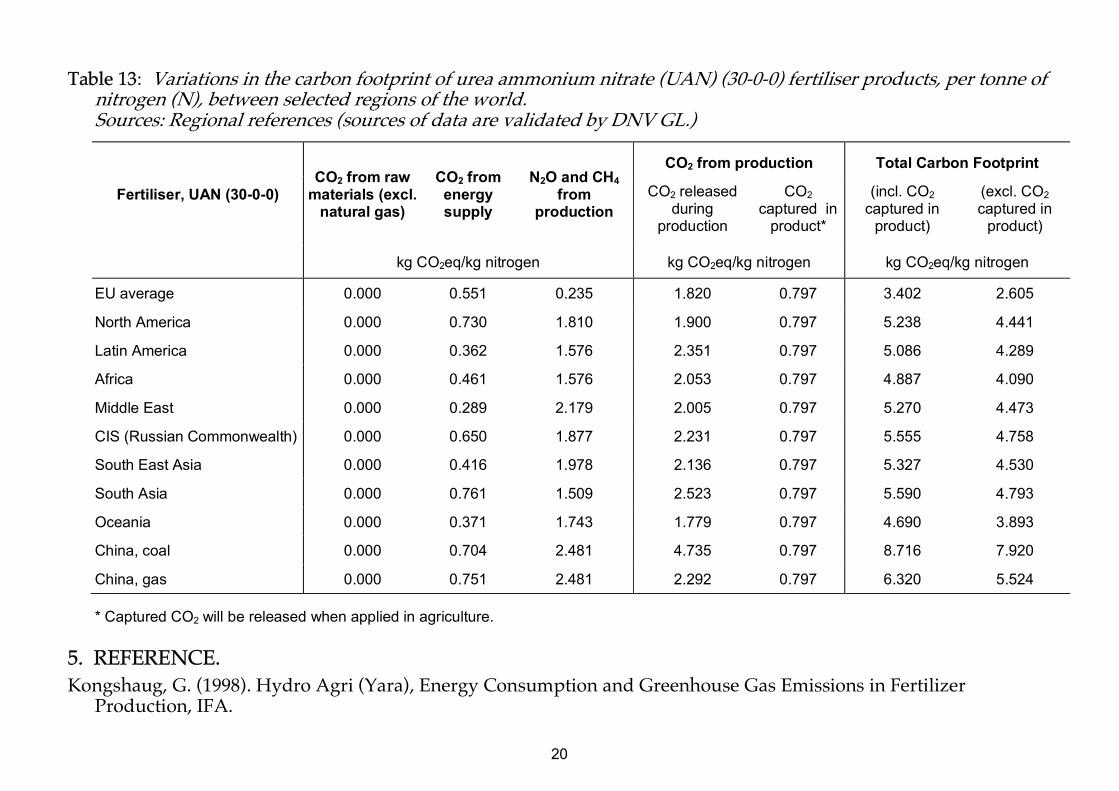
Table 13: Variations in the carbon footprint of urea ammonium nitrate (UAN) (30-0-0) fertiliser products, per tonne of nitrogen (N), between selected regions of the world. Sources: Regional references (sources of data are validated by DNV GL.)
Fertiliser, UAN (30-0-0) CO2 from raw
materials (excl. natural gas)
CO2 from energy supply
N2O and CH4 from
production
CO2 from production Total Carbon Footprint
CO2 released during
production
CO2 captured in
product*
(incl. CO2 captured in
product)
(excl. CO2 captured in
product)
kg CO2eq/kg nitrogen kg CO2eq/kg nitrogen kg CO2eq/kg nitrogen
EU average 0.000 0.551 0.235 1.820 0.797 3.402 2.605
North America 0.000 0.730 1.810 1.900 0.797 5.238 4.441
Latin America 0.000 0.362 1.576 2.351 0.797 5.086 4.289
Africa 0.000 0.461 1.576 2.053 0.797 4.887 4.090
Middle East 0.000 0.289 2.179 2.005 0.797 5.270 4.473
CIS (Russian Commonwealth) 0.000 0.650 1.877 2.231 0.797 5.555 4.758
South East Asia 0.000 0.416 1.978 2.136 0.797 5.327 4.530
South Asia 0.000 0.761 1.509 2.523 0.797 5.590 4.793
Oceania 0.000 0.371 1.743 1.779 0.797 4.690 3.893
China, coal 0.000 0.704 2.481 4.735 0.797 8.716 7.920
China, gas 0.000 0.751 2.481 2.292 0.797 6.320 5.524
* Captured CO2 will be released when applied in agriculture. 5. REFERENCE. Kongshaug, G. (1998). Hydro Agri (Yara), Energy Consumption and Greenhouse Gas Emissions in Fertilizer
Production, IFA.
International Fertiliser Society
The International Fertiliser Society is a scientific Society founded in 1947, with members in approximately 50 countries worldwide. Its main objectives are:
To provide an international forum for discussion and dissemination of knowledge of scientific, technical, environmental, economic and safety aspects of the production, marketing, use and application of fertilisers.
Copies of past Proceedings can be obtained via the website or from the Secretary at £12.50 each.
INTERNATIONAL FERTILISER SOCIETY
e-mail: [email protected]
www.fertiliser-society.org