Embed Size (px)
Citation preview

Problems with SurgicalReport Cards
Frank Harrell Jr, PhD
Division of Biostatistics and Epidemiology
Dept. of Health Evaluation Sciences
University of Virginia School of [email protected]
UVa Surgery Grand Rounds
25 Mar 1998
Outline
• Overview of how statistical models are usedto examine variations in patient outcomes
• Which patient descriptors should be used,which should be avoided
• Methods for developing risk models
• Measuring a model’s accuracy
Outline, Continued
• Regression to the mean, or why todisbelieve some of the data
• Why risk-adjusted mortality estimatescannot be used to reliably rank surgeons
• Best measures to use in a provider reportcard
• Why it’s not a good idea to refuse to operateon high-risk patients
Overview of StatisticalModels
• Choose a set of relevant patientmeasurements
• Relate these and surgeon effects toindividual patient outcomes (30 day vitalstatus)
• Subtract the effects of patient measurementson outcome
• What’s left (imprecisely) measures effectsof surgeons (level playing field)
Which Patient Measurements?
• Continuous measurements (age, heartpumping efficiency, weight, height) havemany advantages
• Subjective assessments should be avoided ifpossible
• Classifications such as urgent or emergentsurgery vary too much across surgeons
• Surgeons are tempted to engage in “codingcreep”
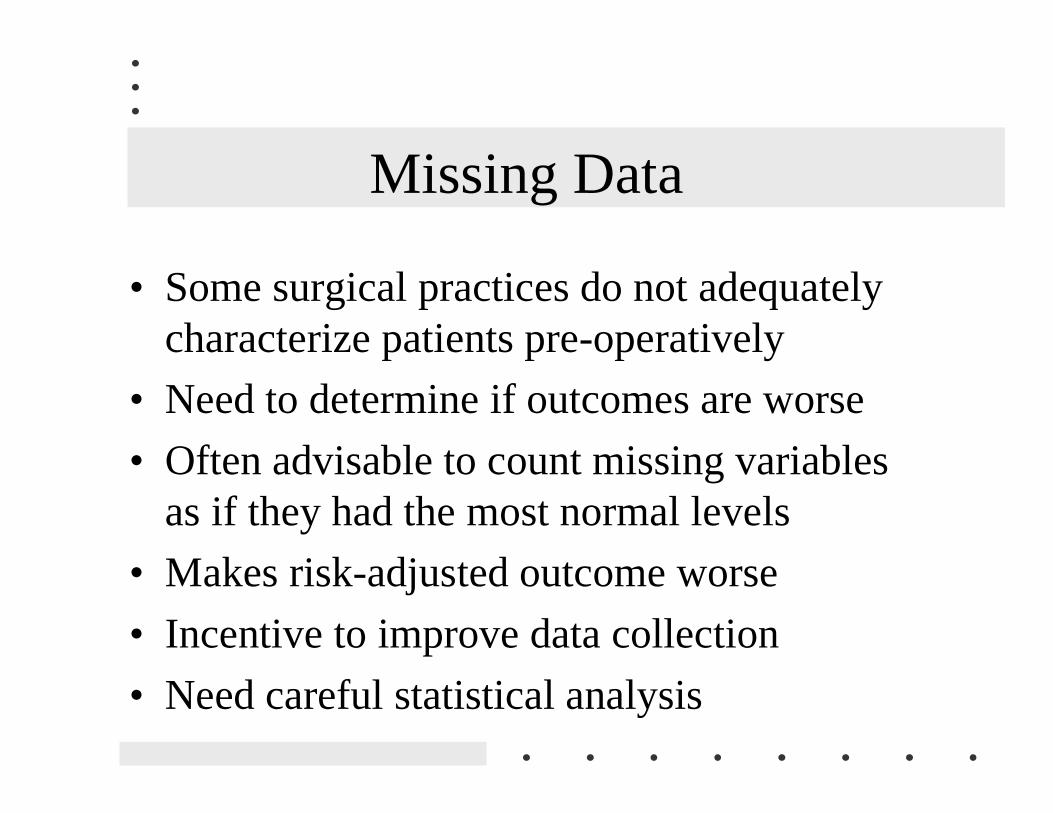
Missing Data
• Some surgical practices do not adequatelycharacterize patients pre-operatively
• Need to determine if outcomes are worse
• Often advisable to count missing variablesas if they had the most normal levels
• Makes risk-adjusted outcome worse
• Incentive to improve data collection
• Need careful statistical analysis
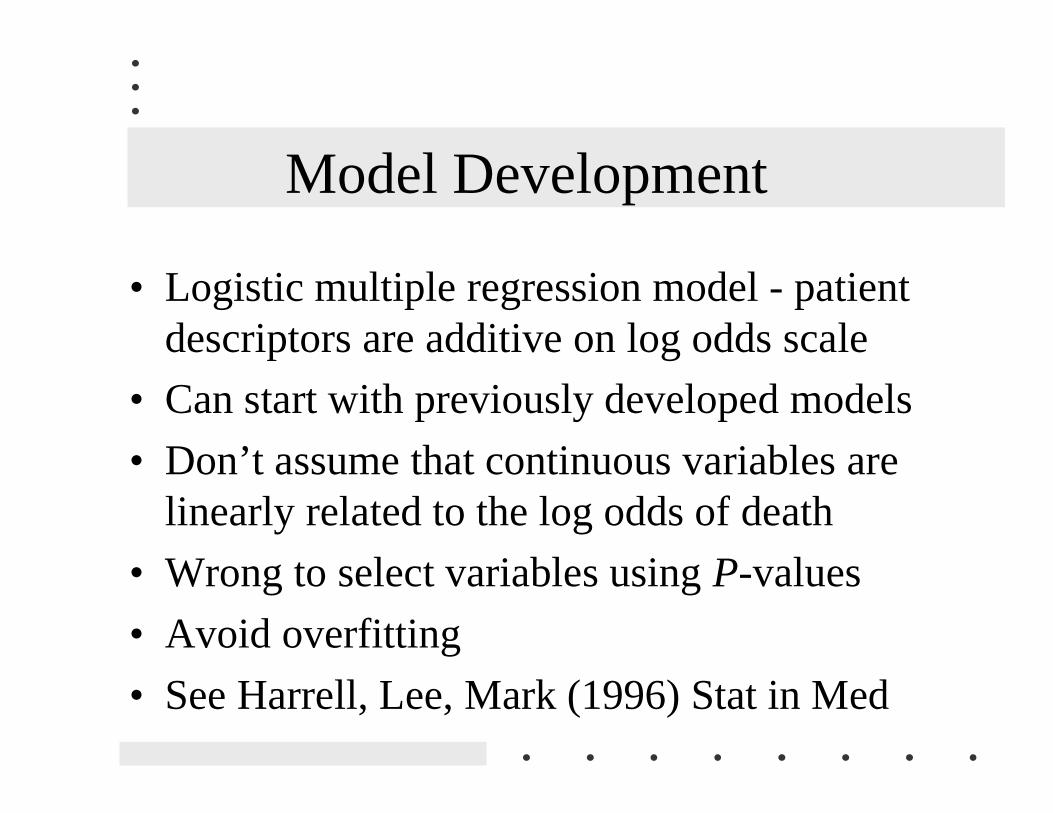
Model Development
• Logistic multiple regression model - patientdescriptors are additive on log odds scale
• Can start with previously developed models
• Don’t assume that continuous variables arelinearly related to the log odds of death
• Wrong to select variables using P-values
• Avoid overfitting
• See Harrell, Lee, Mark (1996) Stat in Med

Estimating Shape of Relationshipwith Outcome
Spanos et al. (1989) JAMA
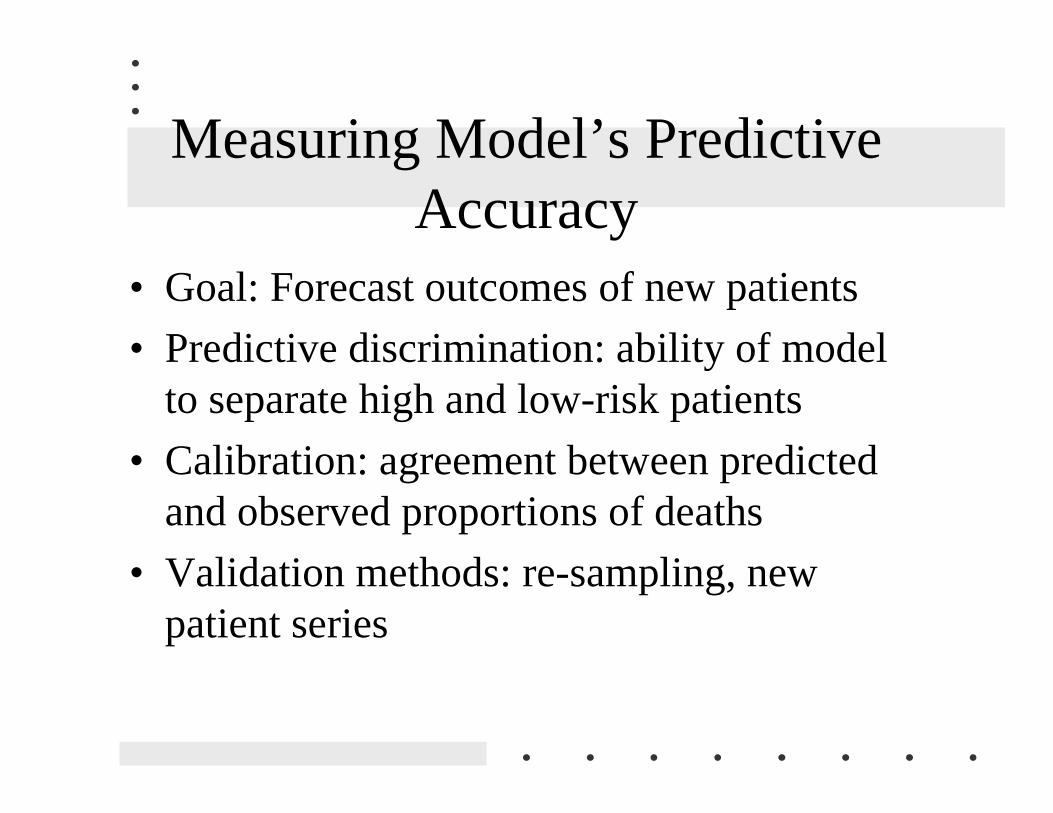
Measuring Model’s PredictiveAccuracy
• Goal: Forecast outcomes of new patients
• Predictive discrimination: ability of modelto separate high and low-risk patients
• Calibration: agreement between predictedand observed proportions of deaths
• Validation methods: re-sampling, newpatient series
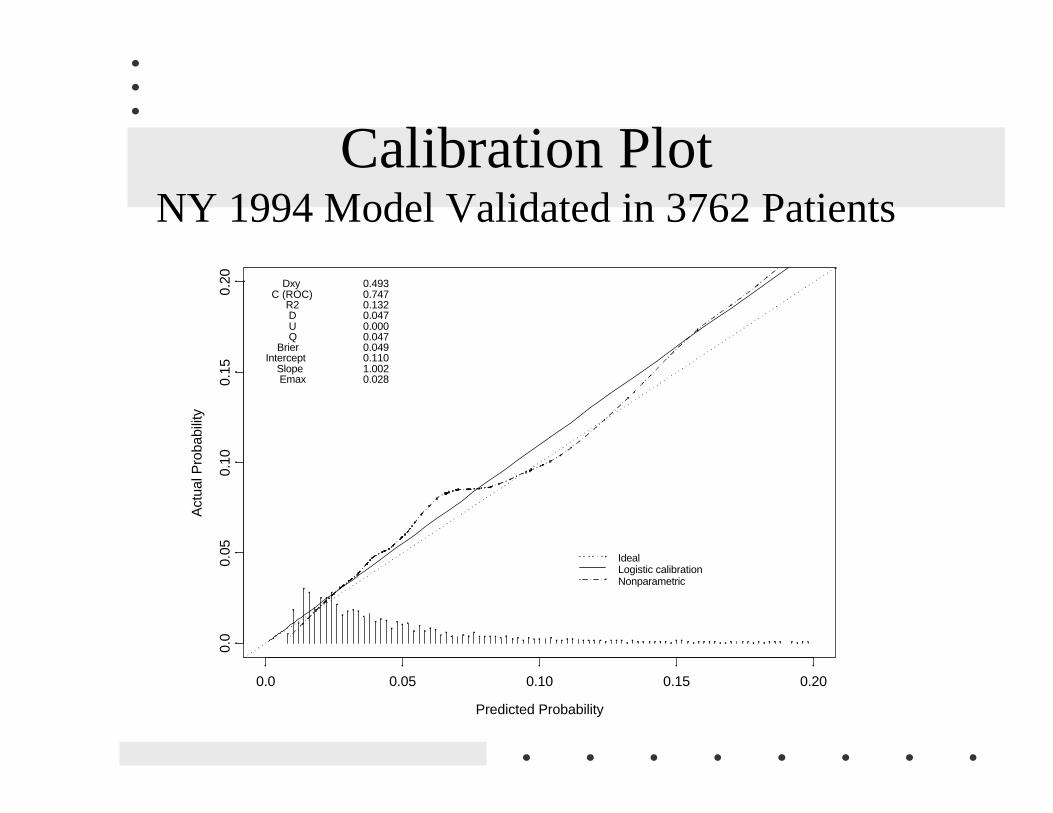
Calibration PlotNY 1994 Model Validated in 3762 Patients
Predicted Probability
Act
ual P
roba
bilit
y
0.0 0.05 0.10 0.15 0.20
0.0
0.05
0.10
0.15
0.20
IdealLogistic calibrationNonparametric
Dxy C (ROC) R2 D U Q BrierIntercept Slope Emax
0.4930.7470.1320.0470.0000.0470.0490.1101.0020.028
Shrinkage - Disbelieving Someof the Data
• Road intersection with Ç fatalities
• Make any engineering change
• Fewer fatalities next year
• See John Adams (1995) Risk
• Identify surgeon by Ç or È mortality, nextyear her op. mort. will be closer to mean
• REGRESSION TO THE MEAN
Shrinkage, Continued
• Can also affect predictive accuracy of riskmodels: Predict patient has 0.2 chance ofdying, 0.15 of similar new pts. die
• Build discounting (shrinkage) intopredictions

1970 Batting AveragesEfron & Morris, Scientific American 1977
0.15
0.20
0.25
0.30
0.35
0.40
First 45 ABs Shrunken Estimates Rest of Season
Roberto Clemente
Frank Robinson
Frank Howard
Jay Johnstone
Ken Berry, Jim Spencer
Don Kessinger
Luis Alvarado
Ron Santo, Ron Swoboda
Del Unser, Billy Williams, George ScottRico Petrocelli, Ellie Rodriguez
Bert Campaneris
Thurman Munson
Max Alvis
Shrinkage, Continued
• Can estimate one surgeon’s outcomes moreaccurately by pulling to grand mean
• Pull more towards mean when– Surgeon patient volume is low
– Less variation in outcomes across surgeons
• Don’t base practice changes on past noise
• Base changes on outcome patterns that willreplicate
Surgeons Cannot be RankedReliably
• Ranking mortality is splitting hairs
• True probability that surgeon with best(worst) results is really the best (worst) islow
• Goldstein & Spiegelhalter (1996): J RoyalStat Soc A
• NY 1990-1992 CABG, sample of 17 out of87 surgeons, risk-adjusted
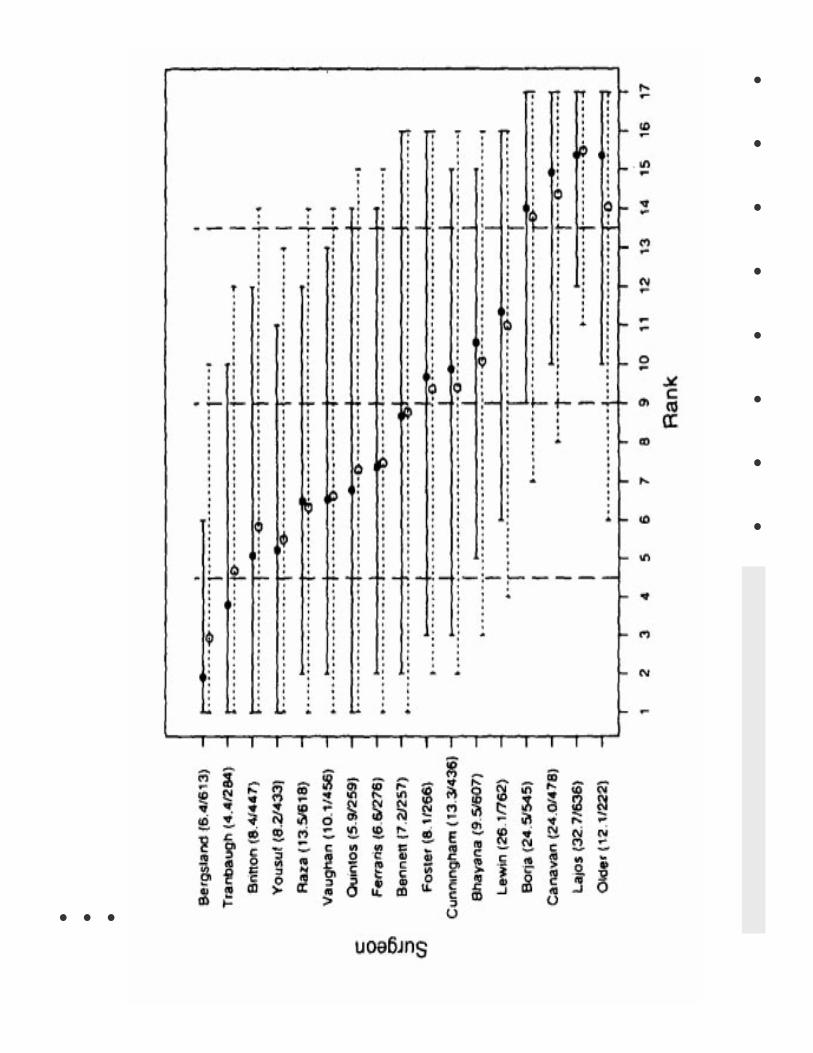
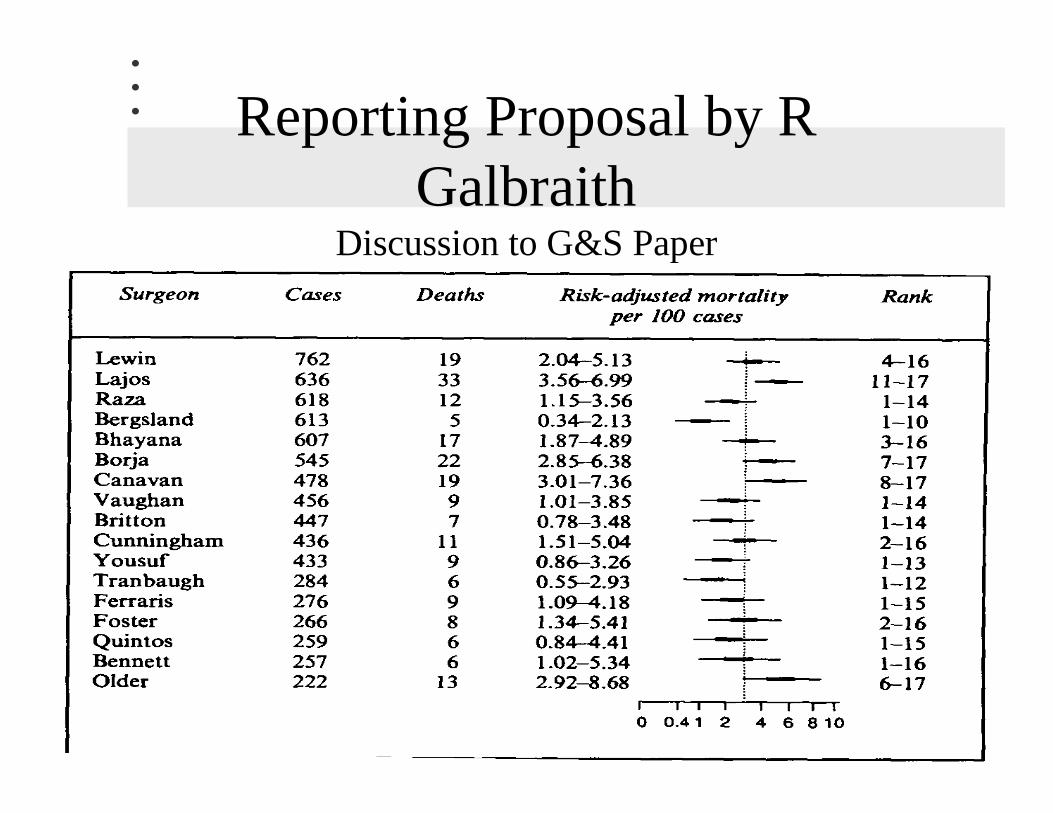
Reporting Proposal by RGalbraith
Discussion to G&S Paper
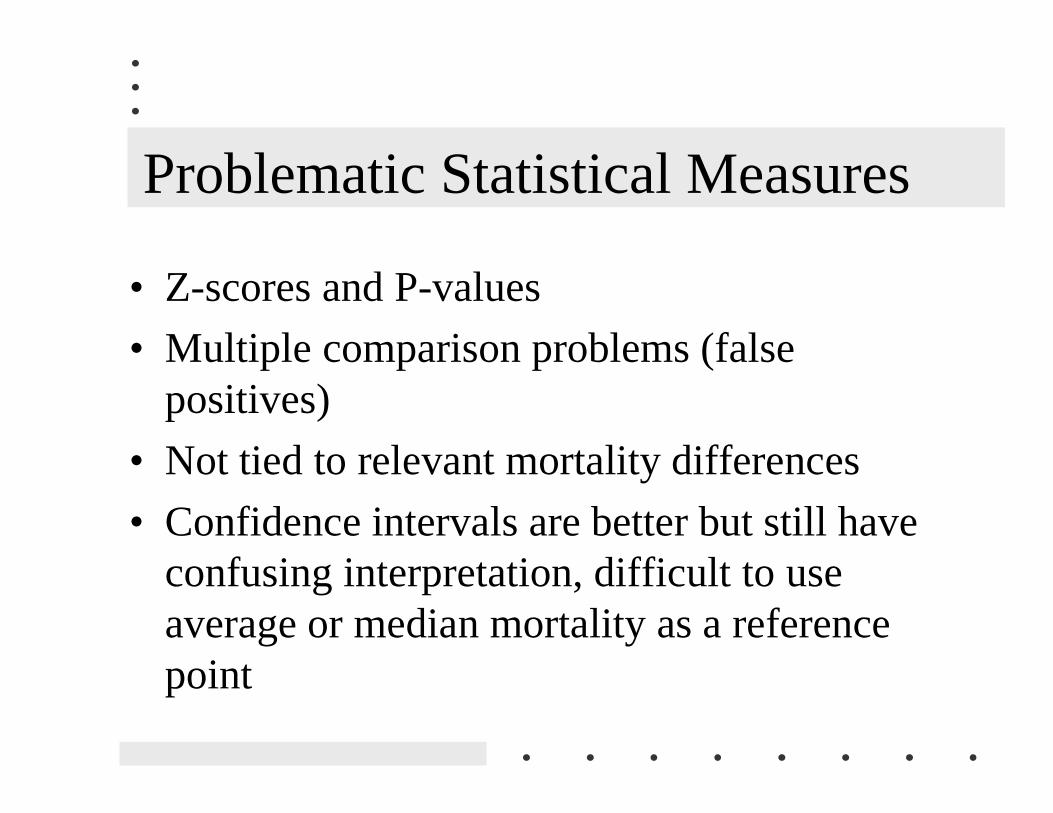
Problematic Statistical Measures
• Z-scores and P-values
• Multiple comparison problems (falsepositives)
• Not tied to relevant mortality differences
• Confidence intervals are better but still haveconfusing interpretation, difficult to useaverage or median mortality as a referencepoint
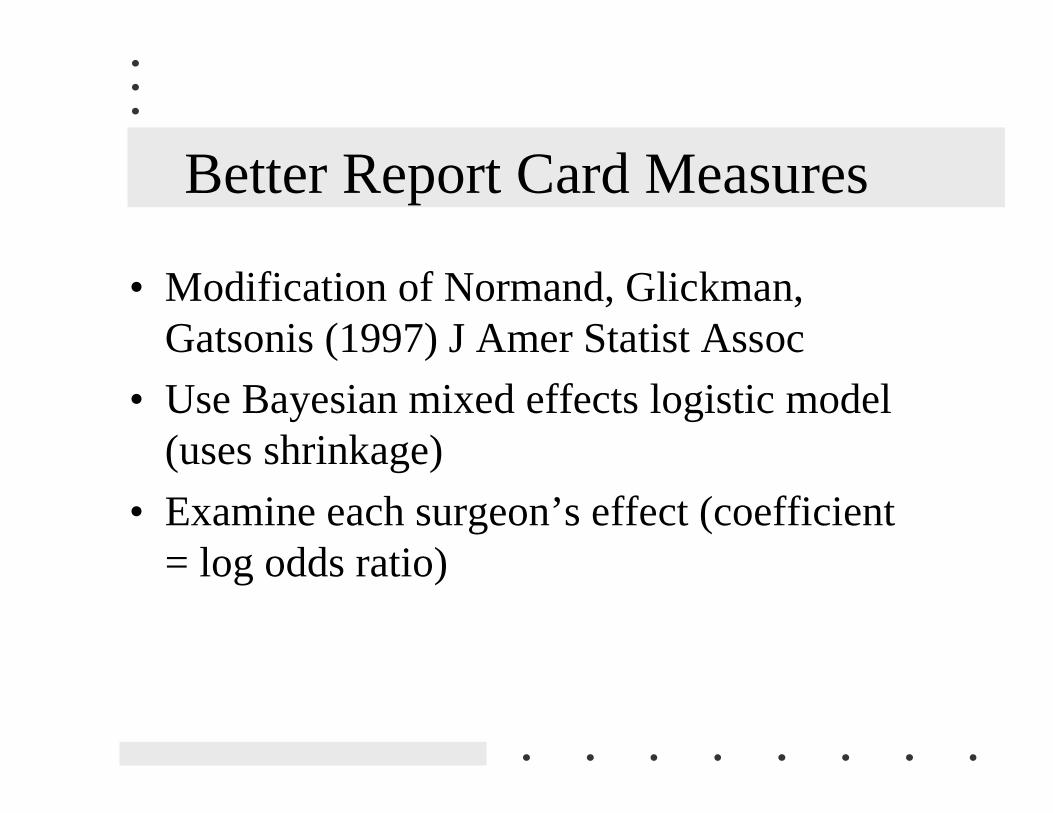
Better Report Card Measures
• Modification of Normand, Glickman,Gatsonis (1997) J Amer Statist Assoc
• Use Bayesian mixed effects logistic model(uses shrinkage)
• Examine each surgeon’s effect (coefficient= log odds ratio)
Better Report Cards
• Estimate surgeon’s odds of death relative toodds of death for “median” surgeon
• Compute Prob[odds ratio > 1.5]
• Concern if this probability > .9
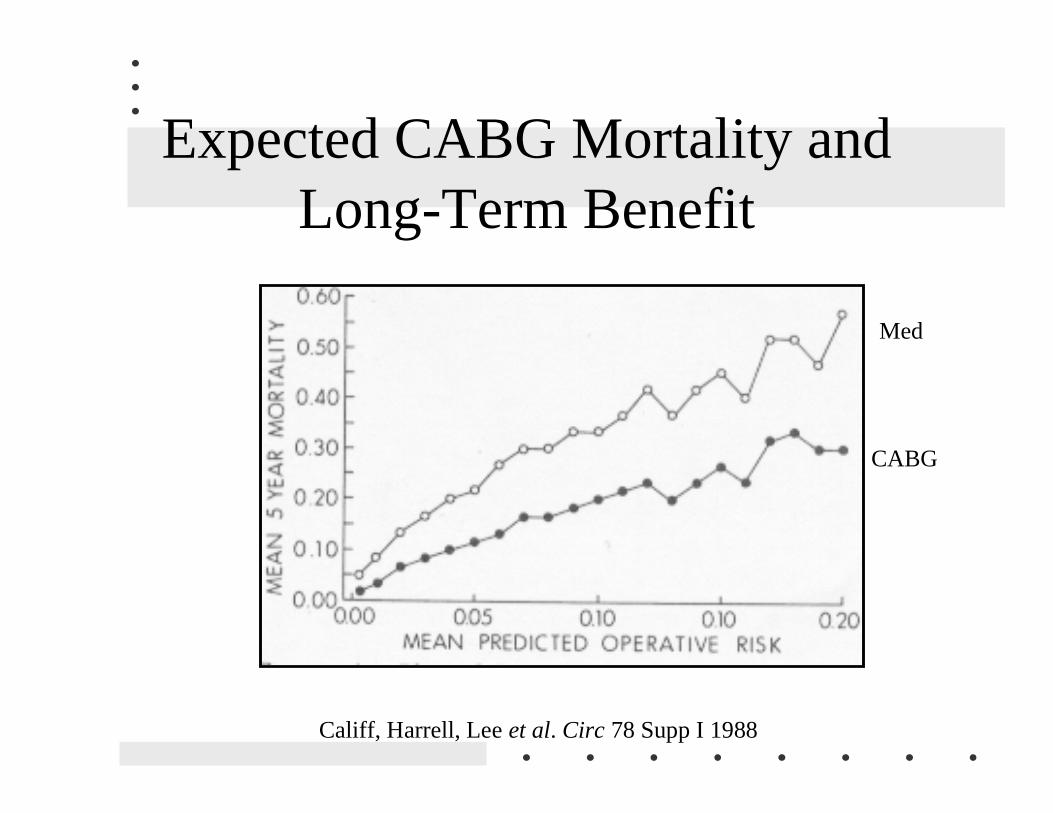
Expected CABG Mortality andLong-Term Benefit
Califf, Harrell, Lee et al. Circ 78 Supp I 1988
Med
CABG
Summary
• Choose patient descriptors carefully toincrease data quality, minimize gaming,maximize discrimination
• Risk models must be derived carefully;avoid fitting noise
• Regression to the mean is a dominant effectin operative mortality
Summary, Continued
• Shrinkage of risk-adjusted mortalityestimates is necessary
• Almost futile to rank fine differences
• Identify problems by the probability of alarge relative odds of death
• Not operating on high-risk patients may notbenefit a surgeon’s risk-adjusted mortalityor the patient