Embed Size (px)
Citation preview

Growing Like China
Wei Chen

PROBLEMS
Return to Capital Remain High.
Saving Rate Remain High.
Foreign Surplus growth fast.
Contradict
How to Solve This Puzzle ?
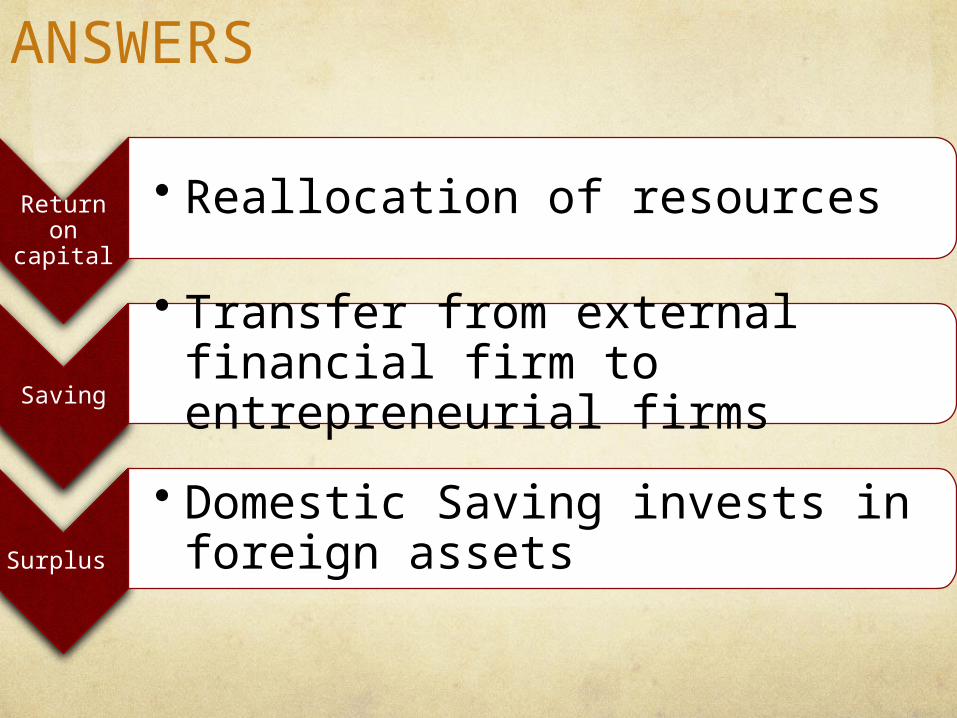
ANSWERS
Return on
capital
• Reallocation of resources
Saving
• Transfer from external financial firm to entrepreneurial firms
Surplus
• Domestic Saving invests in foreign assets

HISTORY BACKGROUND
Video: History background1
1. Cameron D’AngeloChina’s, Economic Growth, <http://www.youtube.com/watch?v=7TT8uHVZWBY>
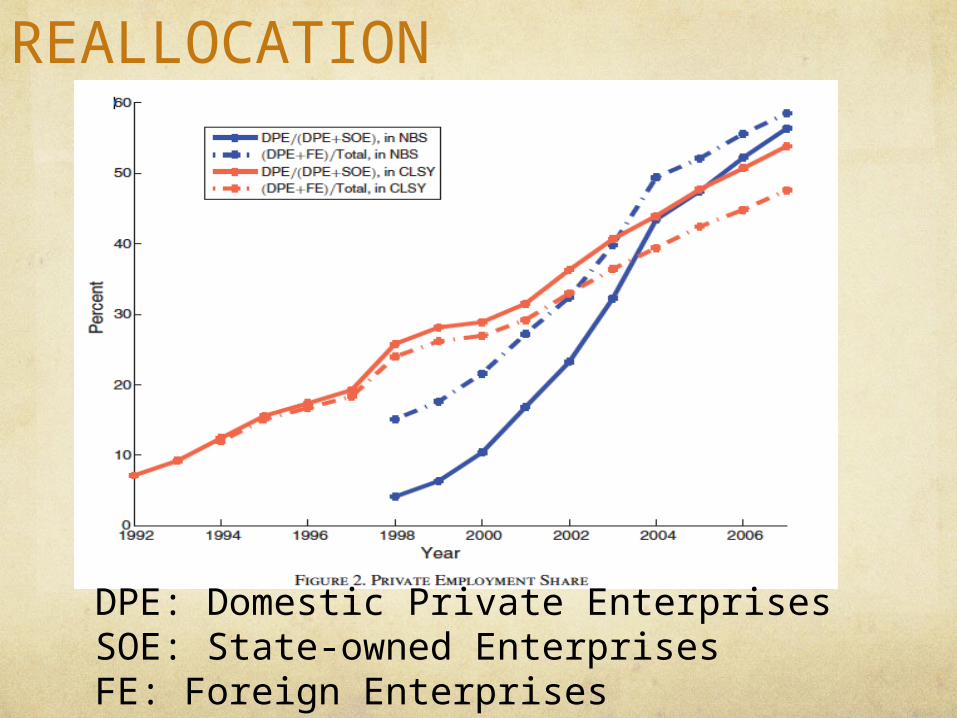
REALLOCATION
DPE: Domestic Private EnterprisesSOE: State-owned EnterprisesFE: Foreign Enterprises
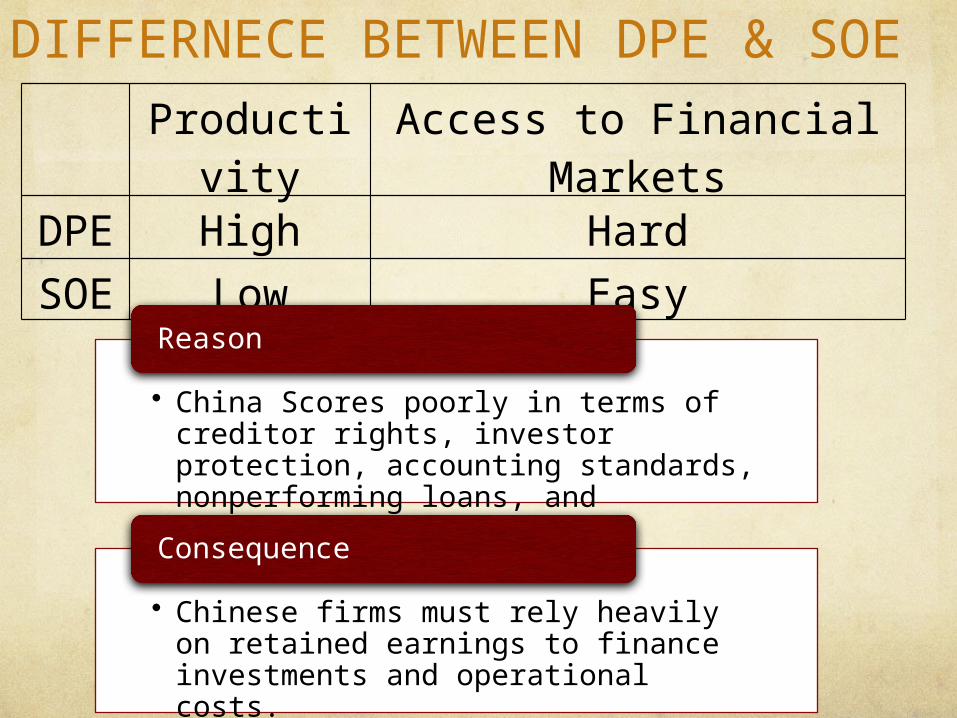
DIFFERNECE BETWEEN DPE & SOEProductivi
tyAccess to Financial
Markets
DPE High Hard
SOE Low Easy
• China Scores poorly in terms of creditor rights, investor protection, accounting standards, nonperforming loans, and corruption
Reason
• Chinese firms must rely heavily on retained earnings to finance investments and operational costs.
Consequence
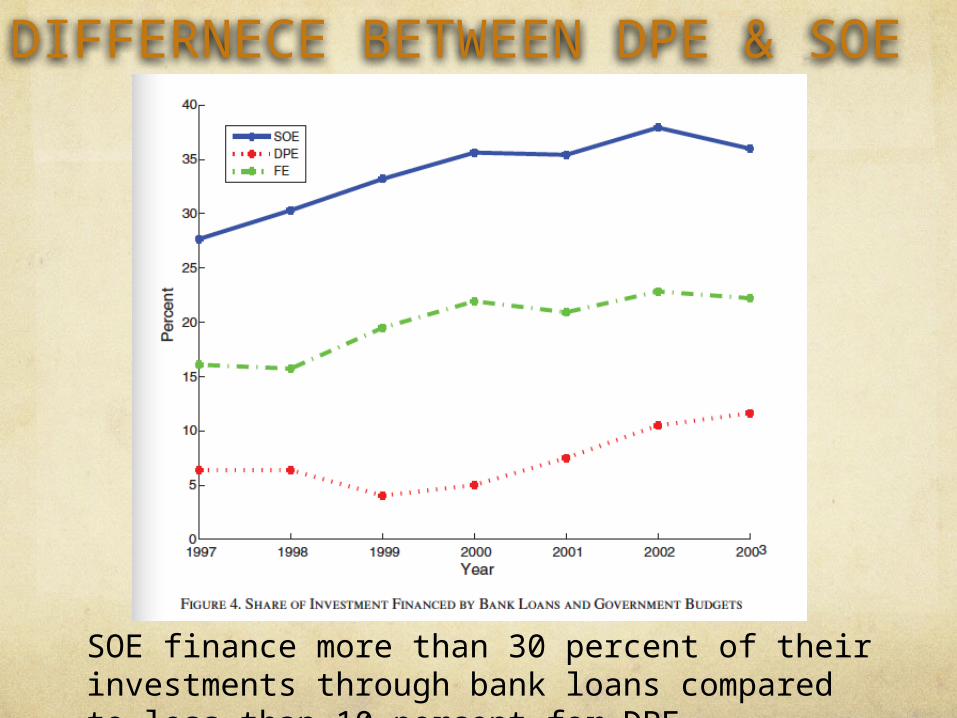
DIFFERNECE BETWEEN DPE & SOE
SOE finance more than 30 percent of their investments through bank loans compared to less than 10 percent for DPE
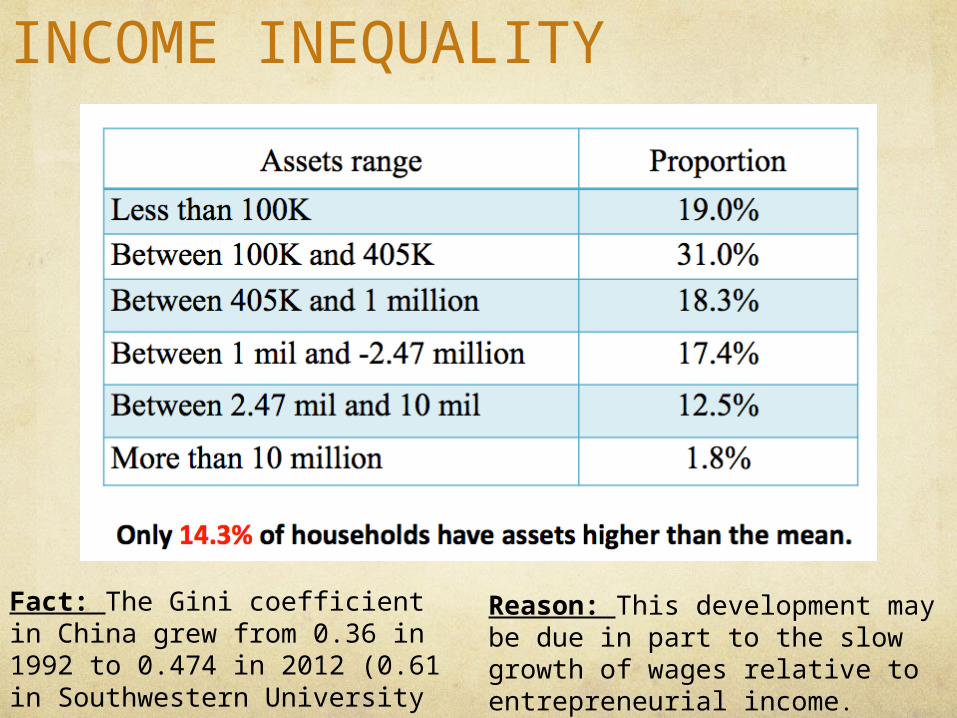
INCOME INEQUALITY
Fact: The Gini coefficient in China grew from 0.36 in 1992 to 0.474 in 2012 (0.61 in Southwestern University of Finance and Economics’ report )
Reason: This development may be due in part to the slow growth of wages relative to entrepreneurial income.

A. Preference, Technology, and Market 1
1. Two Periods Model: the first period and live off savings in the second period.
2. Utility Function:
3. Workers: N t+1 = (1 + ν) N t .
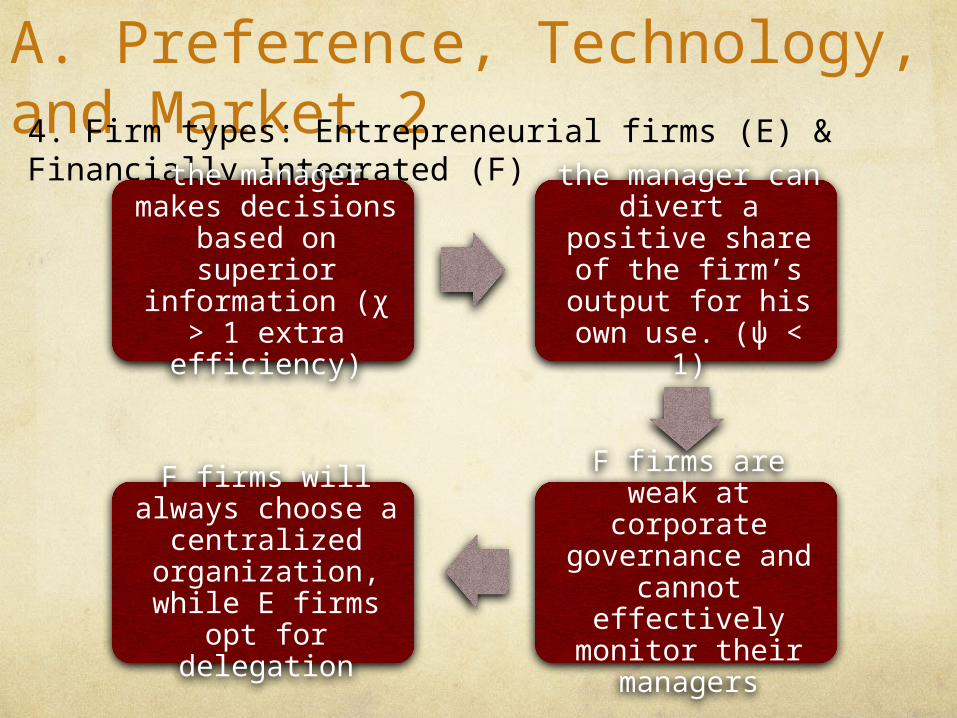
A. Preference, Technology, and Market 24. Firm types: Entrepreneurial firms (E) & Financially Integrated (F)
the manager makes decisions
based on superior information (χ > 1 extra efficiency)
the manager can divert a positive
share of the firm’s output for his own
use. (ψ < 1)
F firms are weak at corporate
governance and cannot effectively
monitor their managers
F firms will always choose a
centralized organization,
while E firms opt for delegation
A. Preference, Technology, and Market 3
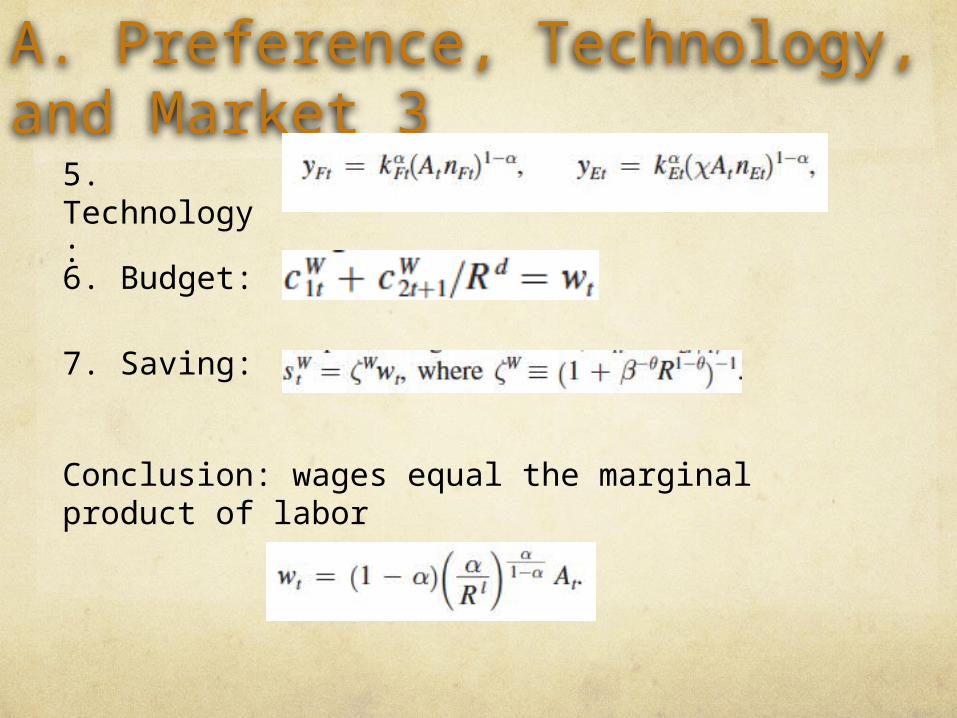
5. Technology:
6. Budget:
7. Saving:
Conclusion: wages equal the marginal product of labor
A. Preference, Technology, and Market 4
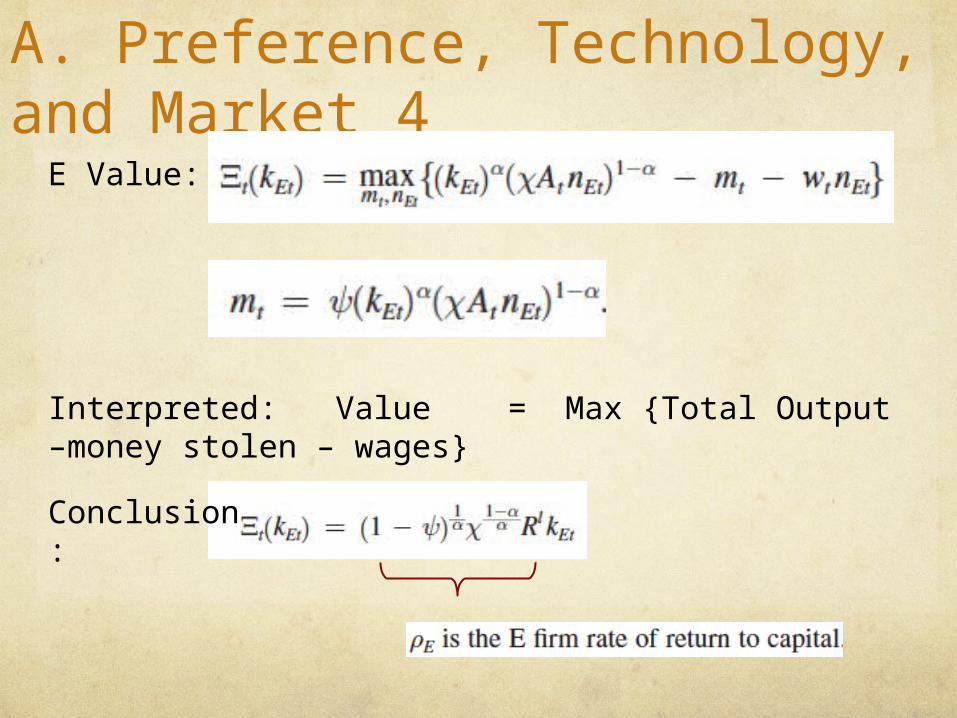
E Value:
Interpreted: Value = Max {Total Output –money stolen – wages}
Conclusion:
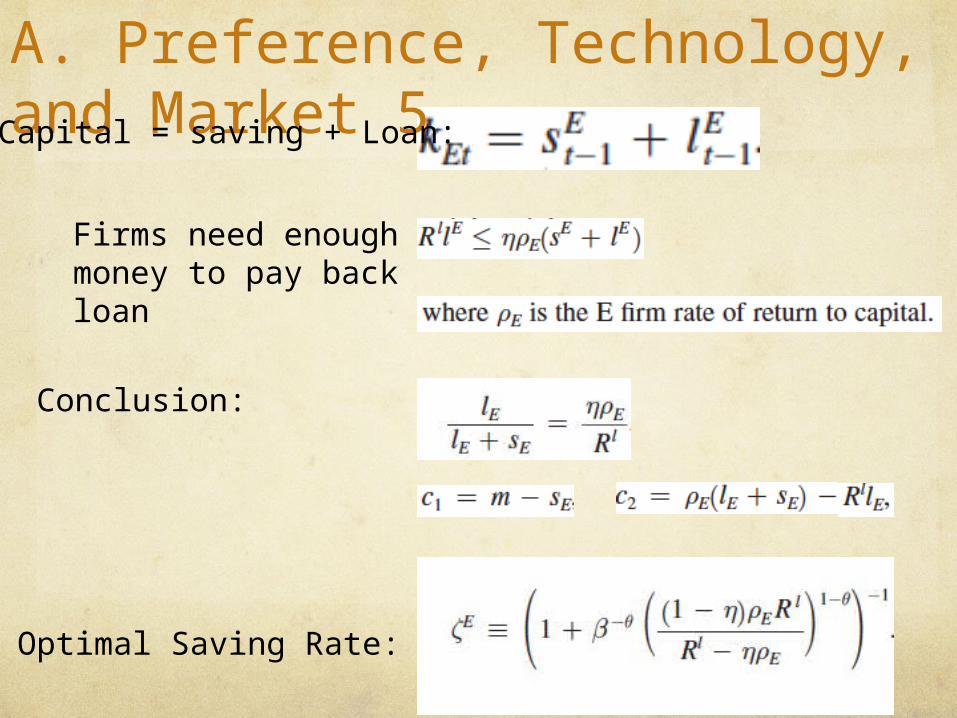
A. Preference, Technology, and Market 5Capital = saving + Loan:
Firms need enough money to pay back loan
Conclusion:
Optimal Saving Rate:

B. Discussion of Assumptions
SOE
Weak Corporate Government
Less Productive
Easy Borrow Money
DPE
Manager related
High productive
Hard Borrow Money
Result :Hard for money to flow to high productive DPE firms
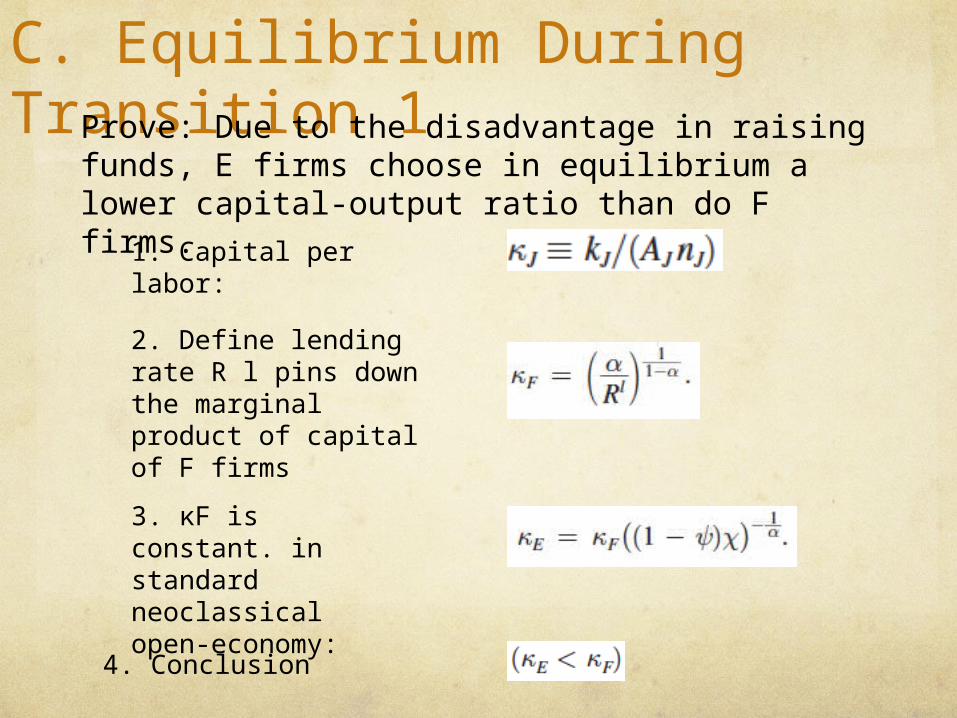
C. Equilibrium During Transition 1 Prove: Due to the disadvantage in raising funds,
E firms choose in equilibrium a lower capital-output ratio than do F firms.
1. Capital per labor:
2. Define lending rate R l pins down the marginal product of capital of F firms
3. κF is constant. in standard neoclassical open-economy:
4. Conclusion
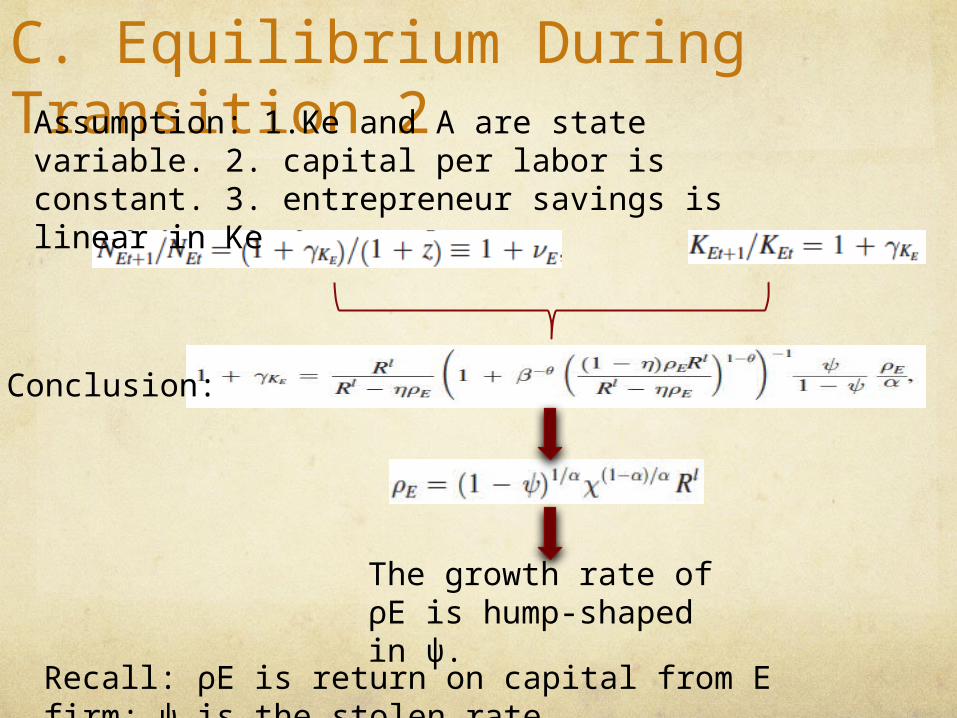
C. Equilibrium During Transition 2
The growth rate of ρE is hump-shaped in ψ.
Recall: ρE is return on capital from E firm; ψ is the stolen rate
Assumption: 1.Ke and A are state variable. 2. capital per labor is constant. 3. entrepreneur savings is linear in Ke
Conclusion:
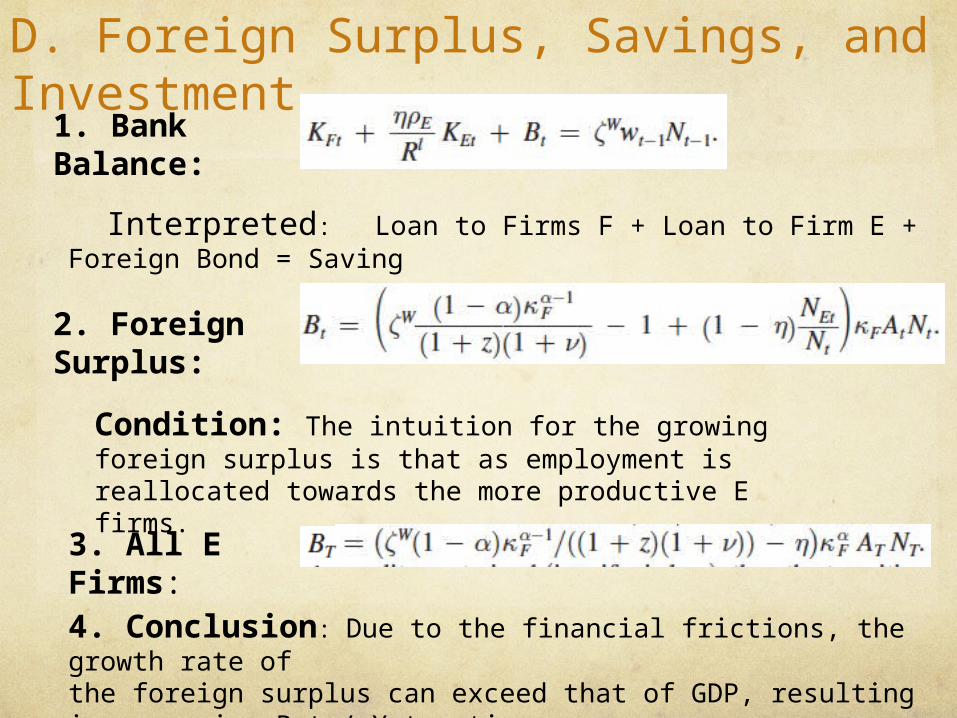
D. Foreign Surplus, Savings, and Investment
1. Bank Balance:
Interpreted: Loan to Firms F + Loan to Firm E + Foreign Bond = Saving
2. Foreign Surplus:
Condition: The intuition for the growing foreign surplus is that as employment is reallocated towards the more productive E firms.
3. All E Firms:
4. Conclusion: Due to the financial frictions, the growth rate ofthe foreign surplus can exceed that of GDP, resulting in a growing B t / Y t ratio
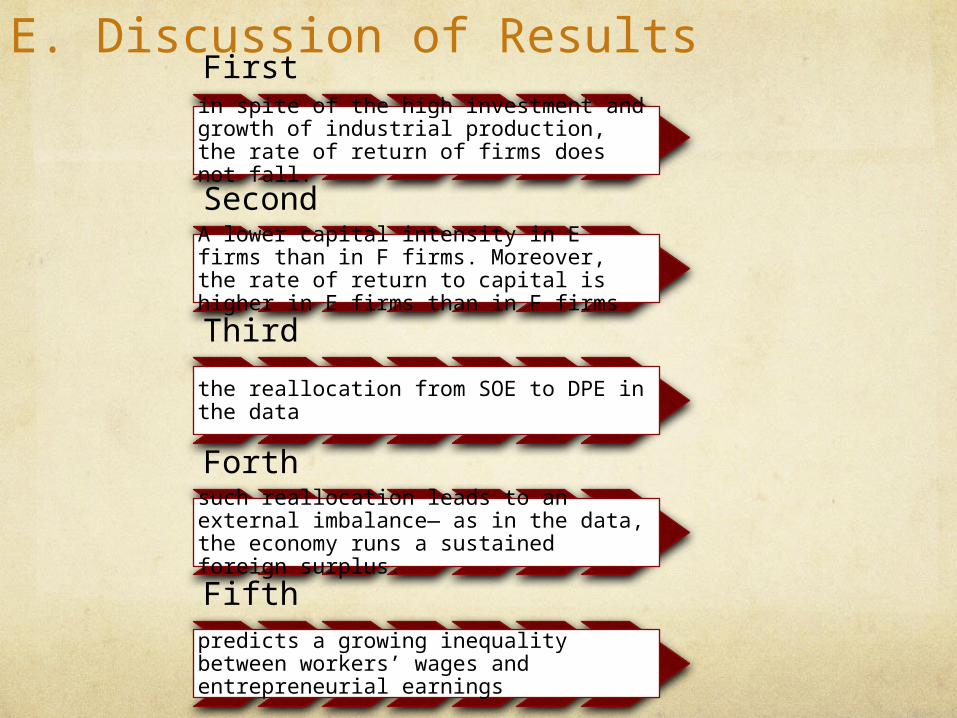
E. Discussion of Results Firstin spite of the high investment and growth of industrial production, the rate of return of firms does not fall.
SecondA lower capital intensity in E firms than in F firms. Moreover, the rate of return to capital is higher in E firms than in F firms
Third
the reallocation from SOE to DPE in the data
Forthsuch reallocation leads to an external imbalance— as in the data, the economy runs a sustained foreign surplus.
Fifthpredicts a growing inequality between workers’ wages and entrepreneurial earnings
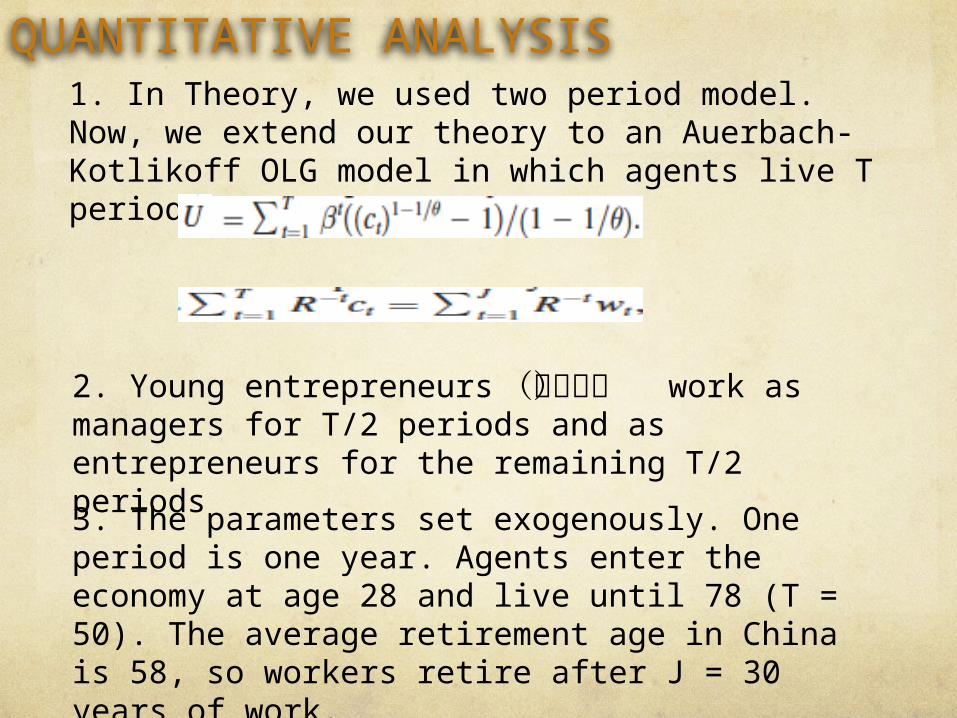
QUANTITATIVE ANALYSIS1. In Theory, we used two period model. Now, we extend our theory to an Auerbach-Kotlikoff OLG model in which agents live T periods.
2. Young entrepreneurs (富二代) work as managers for T/2 periods and as entrepreneurs for the remaining T/2 periods
3. The parameters set exogenously. One period is one year. Agents enter the economy at age 28 and live until 78 (T = 50). The average retirement age in China is 58, so workers retire after J = 30 years of work.
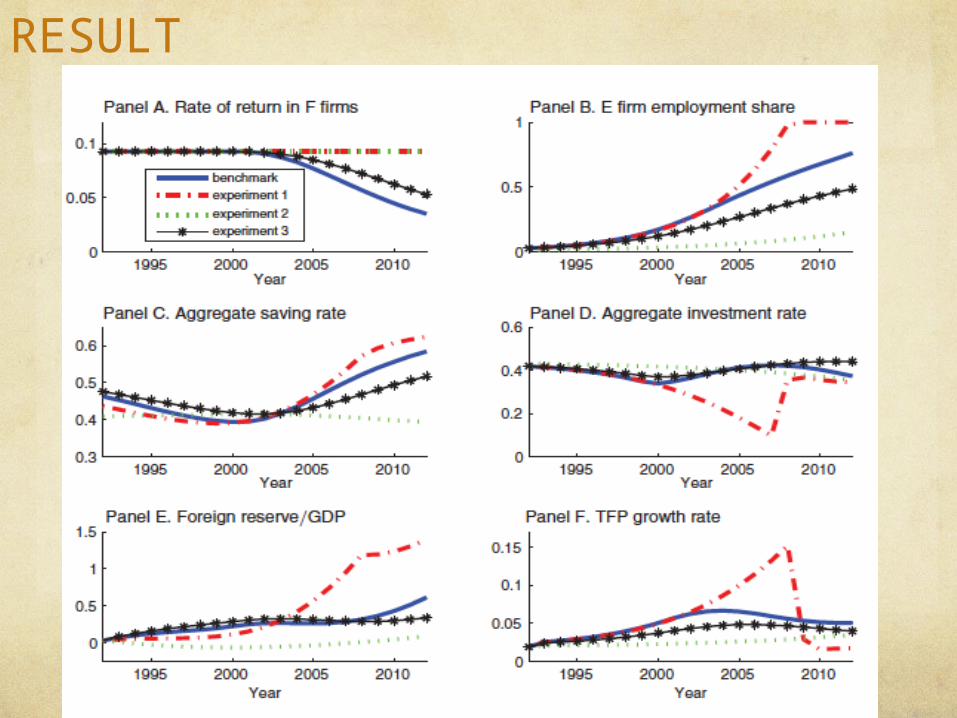
RESULT
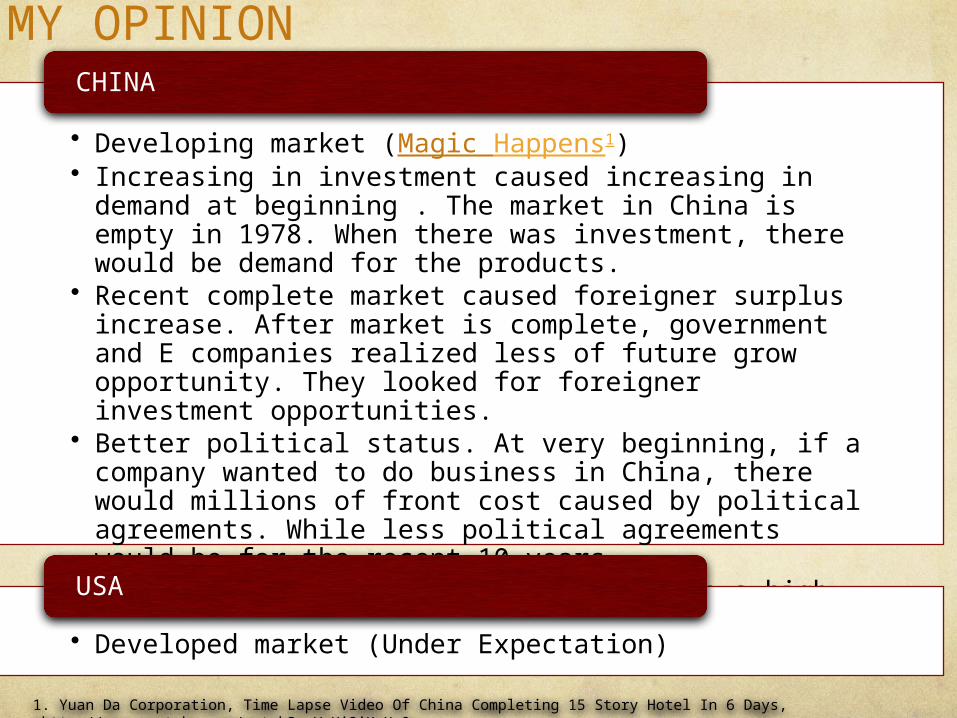
MY OPINION
• Developing market (Magic Happens1) • Increasing in investment caused increasing in demand at
beginning . The market in China is empty in 1978. When there was investment, there would be demand for the products.
• Recent complete market caused foreigner surplus increase. After market is complete, government and E companies realized less of future grow opportunity. They looked for foreigner investment opportunities.
• Better political status. At very beginning, if a company wanted to do business in China, there would millions of front cost caused by political agreements. While less political agreements would be for the recent 10 years.
• Begin from 2008, F firms grew fast with a high rate of return than E firms.
CHINA
• Developed market (Under Expectation)
USA
1. Yuan Da Corporation, Time Lapse Video Of China Completing 15 Story Hotel In 6 Days, <http://www.youtube.com/watch?v=VgXi2iKpX_0>

Thanks for listening!