Embed Size (px)
Citation preview

www.rsc.org/advances
RSC Advances
This is an Accepted Manuscript, which has been through the Royal Society of Chemistry peer review process and has been accepted for publication.
Accepted Manuscripts are published online shortly after acceptance, before technical editing, formatting and proof reading. Using this free service, authors can make their results available to the community, in citable form, before we publish the edited article. This Accepted Manuscript will be replaced by the edited, formatted and paginated article as soon as this is available.
You can find more information about Accepted Manuscripts in the Information for Authors.
Please note that technical editing may introduce minor changes to the text and/or graphics, which may alter content. The journal’s standard Terms & Conditions and the Ethical guidelines still apply. In no event shall the Royal Society of Chemistry be held responsible for any errors or omissions in this Accepted Manuscript or any consequences arising from the use of any information it contains.
View Article OnlineView Journal
This article can be cited before page numbers have been issued, to do this please use: R. Vyas, P. Kumar,
J. Dwivedi, S. Sharma, S. Khan, D. Ramachandran, A. Anshul, K. Sachdev, S. K. Sharma and B. K. GUPTA,
RSC Adv., 2014, DOI: 10.1039/C4RA08586H.

Journal Name RSC Advances Cite this: DOI: 10.1039/c0xx00000x www.rsc.org/xxxxxx
Dynamic Article Links►
ARTICLE TYPE
This journal is © The Royal Society of Chemistry [year] [journal], [year], [vol], 00–00 |1
Probing on luminescent Fe-doped ZnO nanowires for high-performance oxygen
gas sensing application†
Rishi Vyasa, b,
*, Pawan Kumarc, Jaya Dwivedi
c, Sarla Sharma
d, Shabana Khan
e, R. Dibakar
f, Avneesh Anshul
c,g, K.
Sachdevb, S. K. Sharma
a, Bipin Kumar Gupta
c,*
5
Received (in XXX, XXX) Xth XXXXXXXXX 20XX, Accepted Xth XXXXXXXXX 20XX
DOI: 10.1039/b000000x
Herein, we demonstrate the growth of Fe-doped ZnO nanowires using a typical vapour phase transport process for oxygen gas sensing application. The morphogenesis of these nanowires have been evaluated by high-resolution transmission electron microscopy, which confirms the formation of ZnO nanowires having diameter 20-50 nm with d-spacing of ~0.270 nm corresponding to (002) planes. The 10
energy dispersive x-ray analysis result reveals the presence of Fe, Zn and O elements in 9 wt % Fe –doped ZnO nanowires. The Raman and photoluminescence spectroscopy results explore the oxygen deficient structure of these nanowires with Fe ion occupying tetrahedral sites in ZnO lattice along with some interstitial Zn and Fe ions. Furthermore, these nanowires arrays illustrate a sensitivity of 23 and 31 with fast response/recovery time of about 38s/46s and 11s/11s at operating temperatures of 100°C and 140°C, respectively. The obtained results established that these luminescent ZnO nanowires could be an excellent choice for high-performance oxygen gas sensing 15
application. 1. Introduction
Nanoscale zinc oxides (ZnO) are futuristic material for their outstanding physical properties and potential strategic 20
applications. One-dimensional (1D) nanostructures like quantum wires are ideal system to be used as functional components in the fabrications of nanoscale electronic devices. ZnO nanowire exhibits high surface to volume ratio which provides a suitable platform for the development of high-performance gas sensing 25
devices.1,2 Transition metal doping in ZnO is a popular approach for achieving better performance for device applications and therefore, Fe-doped ZnO nanowires are expected to address several problems viz. high response/recovery time, low sensitivity and high operating temperature over their thin film 30
counterpart.3-6 Electronic charge transfer in n-type ZnO gas sensor can be tuned by altering the doping levels for increased sensitivity towards oxidizing gases such as oxygen.7,8 The Fe-doping induces disorder in ZnO lattice which in turn affects charge transfer to ions absorbed at surface states of ZnO 35
nanowires.9 The change in electronic properties due to modified density of states facilitated by addition of Fe enhances the conductivity of ZnO nanowires.7 Oxygen gets adsorbed as O- and O2- ions at metal oxide nanowire surface sites that exhibit both Fe and Zn ion sites, which results in modification of electronic 40
transfer through the Fe ions.10 The interaction of gas molecule with Fe ions leads to a change in conductivity that plays an important role to determine the sensitivity, response time and operating temperature of Fe-doped ZnO nanowire sensor.11
45
Furthermore, it is also interesting to explore the optical
properties (photoluminescence) of Fe-doped ZnO nanowires. In general, the semiconductor having large band gap such as ZnO 50
are widely studied for optical and opto-electronic applications. The ZnO nanowires have a lower threshold with radiative recombination occurring near the band edges due to the carrier confinement.12 Emission near band edges is highly dependent on the structural defects. The doping of Fe in ZnO nanowires 55
reduces radiative recombination by incorporation of Fe2+/Fe3+ ions, which modifies the carrier concentration.9, 13 The photo-generated carrier transit time and response time for effective gas sensing, both are subsequently reduced. Moreover, the pristine ZnO acts as an intrinsic semiconductor with empty Zn 4s2 orbital 60
along with oxygen 2p6 orbital. The transition metal doping and oxygen deficiency increase the effective zinc 4s2 electrons that can be easily ionised.14 Consequently, the performance of ZnO nanowire based sensors can be modified by concentration of defect.2 Moreover, the band-to-band electronic transitions are 65
enhanced by Fe-doping at lattice sites for reducing charge trapping.15 a Department of Physics, School of Basic Sciences, Jaipur National
University, Jaipur- 302017 (INDIA). E-mail: [email protected] 70 bDepartment of Physics, Malaviya National Institute of Technology, Jaipur-302017 (INDIA) cCSIR- National Physical Laboratory (CSIR) Dr K S Krishnan Road, New
Delhi 110012,India ; E-mail:[email protected] dDepartment of Physics, Jagan Nath Gupta Institute of Engineering and 75
Technology, Jaipur-302022 (INDIA) eMechanical Metallurgy Division, Bhabha Atomic Research Centre, Mumbai 400085 (INDIA) f Physical Metallurgy Group (MMG), Indira Gandhi Centre for Atomic
Research, Kalpakkam-603102 80 gCSIR -Advanced Materials and Process Institute, Bopal, 462026, India.
Page 1 of 10 RSC Advances
RS
CA
dvan
ces
Acc
epte
dM
anus
crip
t
Publ
ishe
d on
07
Oct
ober
201
4. D
ownl
oade
d by
Bos
ton
Uni
vers
ity o
n 07
/10/
2014
11:
34:2
5.
View Article OnlineDOI: 10.1039/C4RA08586H
2| Journal Name, [year], [vol], 00–00 This journal is © The Royal Society of Chemistry [year]
In the present work, luminescent Fe-doped ZnO nanowire
based oxygen gas sensor has been investigated for fast response/recovery time. The ZnO nanowires were synthesized by employing an alternative approach using Fe and Zn as starting 5
materials in a controlled environment for growth of free standing Fe-doped ZnO nanowires in contrast to the catalyst coated substrates used for obtaining ZnO nanowires during a typical vapour phase transport process.16,17 The morphology of synthesized ZnO nanowire was examined by using transmission 10
electron microscopy (TEM). The micro-chemical analysis was carried out by energy dispersive x-ray spectroscopy (EDAX) for the estimation of elemental proportion of Fe, Zn and O in the sample. The structural and optical properties of ZnO nanowire have been investigated using x-ray diffraction (XRD), selective 15
area electron diffraction pattern (SAED), Raman scattering and photoluminescence (PL) as well as time-resolved spectroscopy. The photoluminescence investigations results also support the cause for enhancement of high-performance gas sensing for Fe-doped ZnO nanowires. Because, Fe-doping enhances the oxygen 20
vacancies which is clearly observed from the strong green PL emission intensity. These vacancies highly desired to create more active sites to absorb oxygen gas. The current-voltage (I-V) and oxygen sensing measurements demonstrate the high sensitivity and fast response/recovery time at lower operating temperatures. 25
2. Experimental
2.1 Synthesis of Fe doped ZnO nanowires and plausible growth
mechanism 30
In the present investigation, the precursor materials Zn and Fe fine power (99.99% purity, 50nm grain size) were purchased from Sigma-Aldrich Corp. to grow Fe-doped ZnO nanowires. One gram of metallic Zn power was mixed with different concentrations (1, 4, 7, 9 and 10 wt% ) of Fe powder and the 35
mixture was placed in an alumina boat to load at the centre of the 2 inch diameter quartz tube in split furnace for growth of the Fe-doped ZnO nanowires. Prior to synthesis experiment, initially the quartz tube was maintained under rotary vacuum ~ 10-2 torr to remove moisture and then purged with continues nitrogen flow 40
up to 900°C at 1 atm pressure. The furnace is then programmed to rise temperature from 25 to 900 °C in 3 hrs, to maintain 900°C for 30 minutes and then cooled down from 900 to 25°C in 5 hrs. Quartz tube was purged with argon flow (500 sccm) till it reached to 100°C while a constant flow of 500 sccm containing 5% 45
oxygen in argon was maintained from 400°C onwards till it cooled down to 400°C. The outlet of furnace was passed through a 500 ml water bottle filled with deionised water to keep the excess ZnO vapor density high on the cool end of the tube. At 900°C formation of web like structure was seen at the end of the 50
tube (which is at room temperature) that becomes denser as the reaction progressed. The part of web was collected with the help of twizzer on a quartz substrate and drops of silver paste were used to place this nanowire bundle firmly from its ends. This silver paste was further used to make contacts for obtaining gas 55
sensing and current-voltage (I-V) characteristics. Some part of
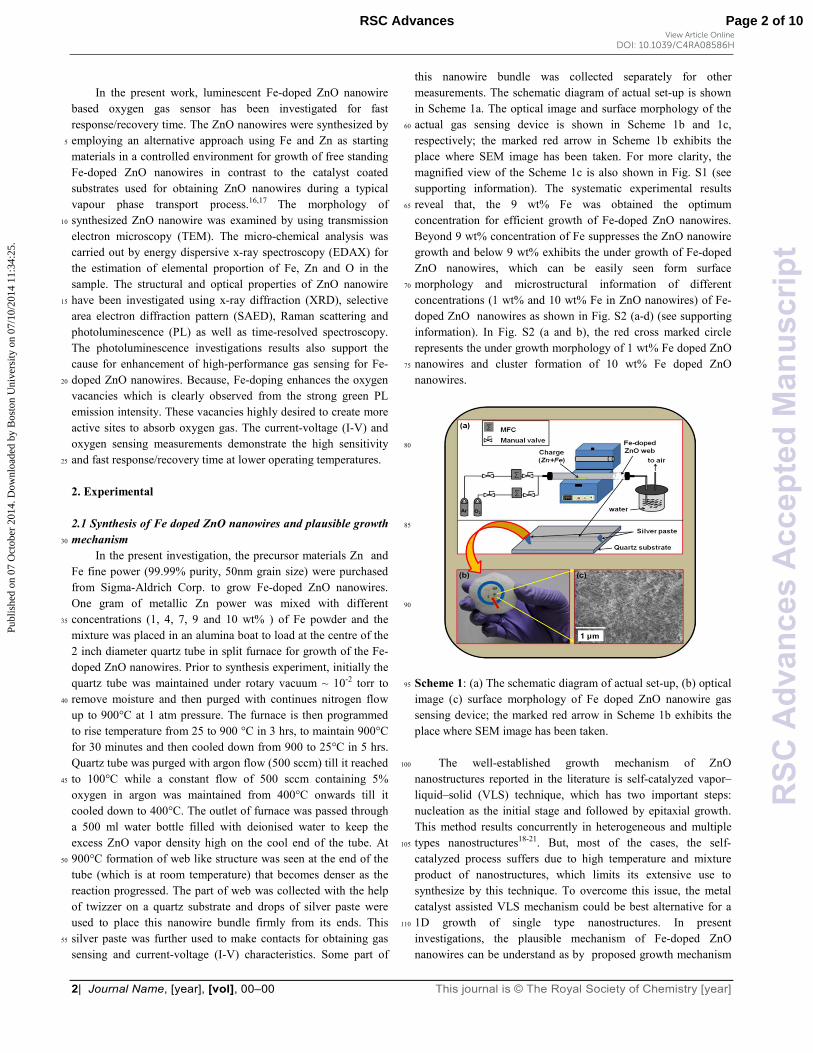
this nanowire bundle was collected separately for other measurements. The schematic diagram of actual set-up is shown in Scheme 1a. The optical image and surface morphology of the actual gas sensing device is shown in Scheme 1b and 1c, 60
respectively; the marked red arrow in Scheme 1b exhibits the place where SEM image has been taken. For more clarity, the magnified view of the Scheme 1c is also shown in Fig. S1 (see supporting information). The systematic experimental results reveal that, the 9 wt% Fe was obtained the optimum 65
concentration for efficient growth of Fe-doped ZnO nanowires. Beyond 9 wt% concentration of Fe suppresses the ZnO nanowire growth and below 9 wt% exhibits the under growth of Fe-doped ZnO nanowires, which can be easily seen form surface morphology and microstructural information of different 70
concentrations (1 wt% and 10 wt% Fe in ZnO nanowires) of Fe- doped ZnO nanowires as shown in Fig. S2 (a-d) (see supporting information). In Fig. S2 (a and b), the red cross marked circle represents the under growth morphology of 1 wt% Fe doped ZnO nanowires and cluster formation of 10 wt% Fe doped ZnO 75
nanowires.
80
85
90
Scheme 1: (a) The schematic diagram of actual set-up, (b) optical 95
image (c) surface morphology of Fe doped ZnO nanowire gas
sensing device; the marked red arrow in Scheme 1b exhibits the place where SEM image has been taken.
The well-established growth mechanism of ZnO 100
nanostructures reported in the literature is self-catalyzed vapor–liquid–solid (VLS) technique, which has two important steps: nucleation as the initial stage and followed by epitaxial growth. This method results concurrently in heterogeneous and multiple types nanostructures18-21. But, most of the cases, the self-105
catalyzed process suffers due to high temperature and mixture product of nanostructures, which limits its extensive use to synthesize by this technique. To overcome this issue, the metal catalyst assisted VLS mechanism could be best alternative for a 1D growth of single type nanostructures. In present 110
investigations, the plausible mechanism of Fe-doped ZnO nanowires can be understand as by proposed growth mechanism
Page 2 of 10RSC Advances
RS
CA
dvan
ces
Acc
epte
dM
anus
crip
t
Publ
ishe
d on
07
Oct
ober
201
4. D
ownl
oade
d by
Bos
ton
Uni
vers
ity o
n 07
/10/
2014
11:
34:2
5.
View Article OnlineDOI: 10.1039/C4RA08586H
This journal is © The Royal Society of Chemistry [year] Journal Name, [year], [vol], 00–00 | 3
where, Fe metal catalyst forms liquid alloy droplets at a high temperature by adsorbing vapor components. During the growth process, the fluctuation of temperature or vapor pressure originates at intermediate stage and the Fe-Zn-O alloy becomes a solution in which the actual concentration of the components is 5
higher than the equilibrium concentration. Then, it drives the precipitation of the component at the liquid–solid interface to achieve minimum free energy of the alloy system Fe-Zn-O. As a result, the 1D crystal growth begins, and it continues as long as the vapor components are offered. Because vapor (carries solid 10
components), liquid (catalyst alloy), and solid (precipitated one-dimensional structures) phases are involved. Metal catalysts are essential in the VLS mechanism, but not all metals can work. The metal should meet the following requirements as22: (a) It must form a liquid solution with a component of the solid 15
phase; the solubility limit of the catalyst component in the liquid phase must be much higher than that in the solid phase. Under this condition, the catalyst easily leads to the formulation of the liquid alloy with little contamination in the solid phase. (b) The vapor pressure (Vp) of the catalyst component over the 20
liquid alloy should be small. Otherwise, the catalyst will evaporate and eventually disappear in the course of growth. (c) It must be inert to chemical reactions. Otherwise, a reaction could deprive it of its catalytic function. (d) It must not make an intermediate solid. 25
Additionally, the doping of Fe catalyst ZnO improves the active sites for gas sensing applications, which is further evidenced and discussed in PL spectroscopy and gas sensing sections. 30
2.2 Characterizations of Fe-doped ZnO nanowires
For phase identification, the structural characterization was performed using XRD (Rigaku: MiniFlex, Cu Kα1; λ = 1.5406 A° ). The Raman spectrum was measured with the incident light 35
being normal to the sample surface and all the results have been obtained by the subtraction of signal from Si substrate used for placing ZnO nanowire bundles using 363.8 nm UV line of argon laser. High resolution TEM/TEM (Philips CM-200 TEM) confirms the formation of nanowires. The room temperature 40
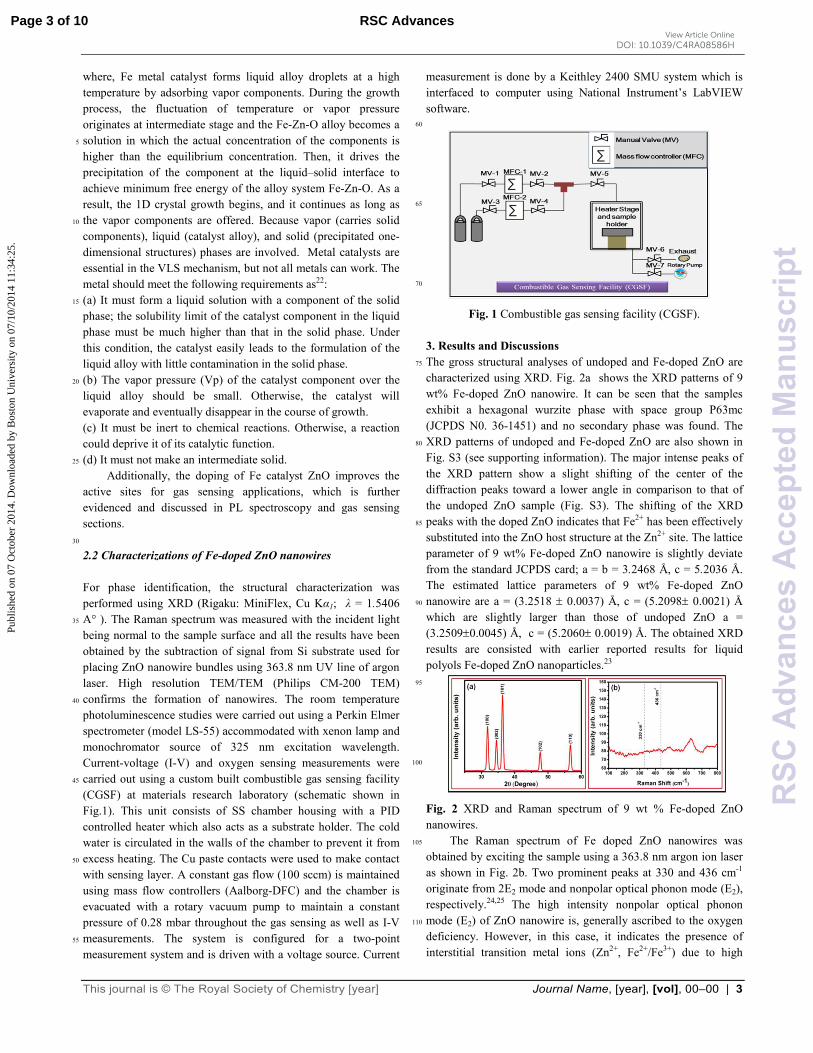
photoluminescence studies were carried out using a Perkin Elmer spectrometer (model LS-55) accommodated with xenon lamp and monochromator source of 325 nm excitation wavelength. Current-voltage (I-V) and oxygen sensing measurements were carried out using a custom built combustible gas sensing facility 45
(CGSF) at materials research laboratory (schematic shown in Fig.1). This unit consists of SS chamber housing with a PID controlled heater which also acts as a substrate holder. The cold water is circulated in the walls of the chamber to prevent it from excess heating. The Cu paste contacts were used to make contact 50
with sensing layer. A constant gas flow (100 sccm) is maintained using mass flow controllers (Aalborg-DFC) and the chamber is evacuated with a rotary vacuum pump to maintain a constant pressure of 0.28 mbar throughout the gas sensing as well as I-V measurements. The system is configured for a two-point 55
measurement system and is driven with a voltage source. Current
measurement is done by a Keithley 2400 SMU system which is interfaced to computer using National Instrument’s LabVIEW software. 60
65
70
Fig. 1 Combustible gas sensing facility (CGSF). 3. Results and Discussions
The gross structural analyses of undoped and Fe-doped ZnO are 75
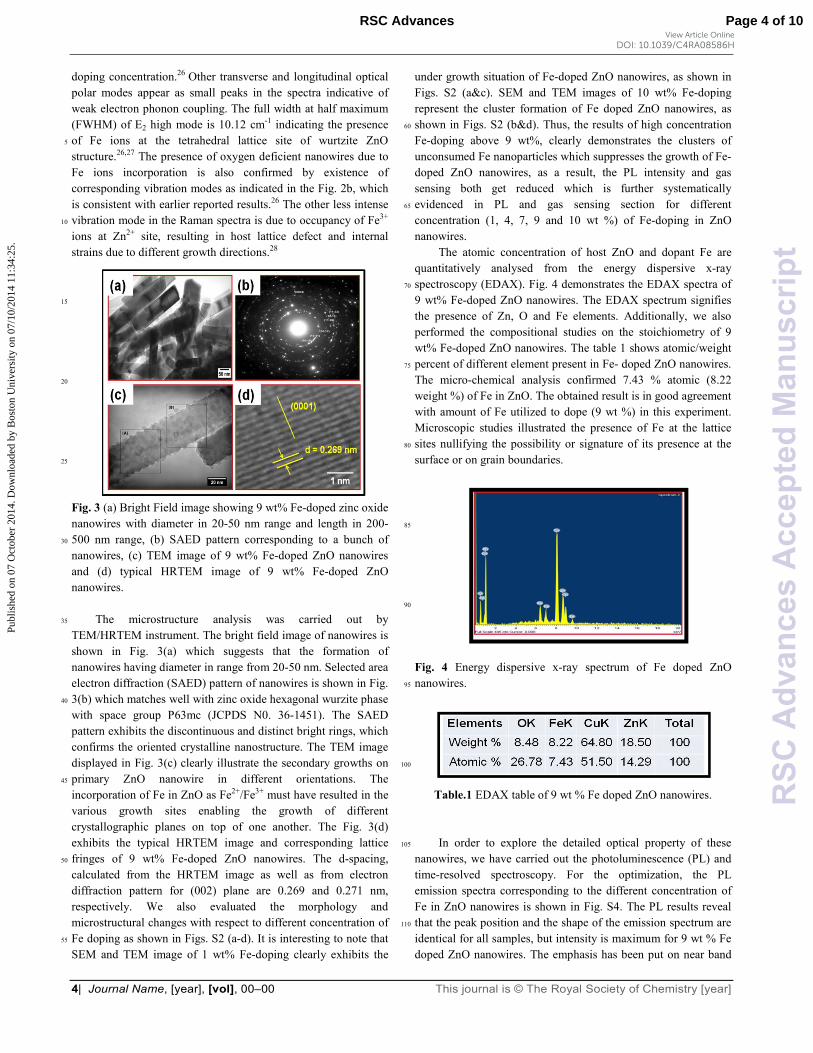
characterized using XRD. Fig. 2a shows the XRD patterns of 9 wt% Fe-doped ZnO nanowire. It can be seen that the samples exhibit a hexagonal wurzite phase with space group P63mc (JCPDS N0. 36-1451) and no secondary phase was found. The XRD patterns of undoped and Fe-doped ZnO are also shown in 80
Fig. S3 (see supporting information). The major intense peaks of the XRD pattern show a slight shifting of the center of the diffraction peaks toward a lower angle in comparison to that of the undoped ZnO sample (Fig. S3). The shifting of the XRD peaks with the doped ZnO indicates that Fe2+ has been effectively 85
substituted into the ZnO host structure at the Zn2+ site. The lattice parameter of 9 wt% Fe-doped ZnO nanowire is slightly deviate from the standard JCPDS card; a = b = 3.2468 Å, c = 5.2036 Å. The estimated lattice parameters of 9 wt% Fe-doped ZnO nanowire are a = (3.2518 ± 0.0037) Å, c = (5.2098± 0.0021) Å 90
which are slightly larger than those of undoped ZnO a = (3.2509±0.0045) Å, c = (5.2060± 0.0019) Å. The obtained XRD results are consisted with earlier reported results for liquid polyols Fe-doped ZnO nanoparticles.23 95
100
Fig. 2 XRD and Raman spectrum of 9 wt % Fe-doped ZnO nanowires.
The Raman spectrum of Fe doped ZnO nanowires was 105
obtained by exciting the sample using a 363.8 nm argon ion laser as shown in Fig. 2b. Two prominent peaks at 330 and 436 cm-1 originate from 2E2 mode and nonpolar optical phonon mode (E2), respectively.24,25 The high intensity nonpolar optical phonon mode (E2) of ZnO nanowire is, generally ascribed to the oxygen 110
deficiency. However, in this case, it indicates the presence of interstitial transition metal ions (Zn2+, Fe2+/Fe3+) due to high
Page 3 of 10 RSC Advances
RS
CA
dvan
ces
Acc
epte
dM
anus
crip
t
Publ
ishe
d on
07
Oct
ober
201
4. D
ownl
oade
d by
Bos
ton
Uni
vers
ity o
n 07
/10/
2014
11:
34:2
5.
View Article OnlineDOI: 10.1039/C4RA08586H
4| Journal Name, [year], [vol], 00–00 This journal is © The Royal Society of Chemistry [year]
doping concentration.26 Other transverse and longitudinal optical polar modes appear as small peaks in the spectra indicative of weak electron phonon coupling. The full width at half maximum (FWHM) of E2 high mode is 10.12 cm-1 indicating the presence of Fe ions at the tetrahedral lattice site of wurtzite ZnO 5
structure.26,27 The presence of oxygen deficient nanowires due to Fe ions incorporation is also confirmed by existence of corresponding vibration modes as indicated in the Fig. 2b, which is consistent with earlier reported results.26 The other less intense vibration mode in the Raman spectra is due to occupancy of Fe3+ 10
ions at Zn2+ site, resulting in host lattice defect and internal strains due to different growth directions.28
15
20
25
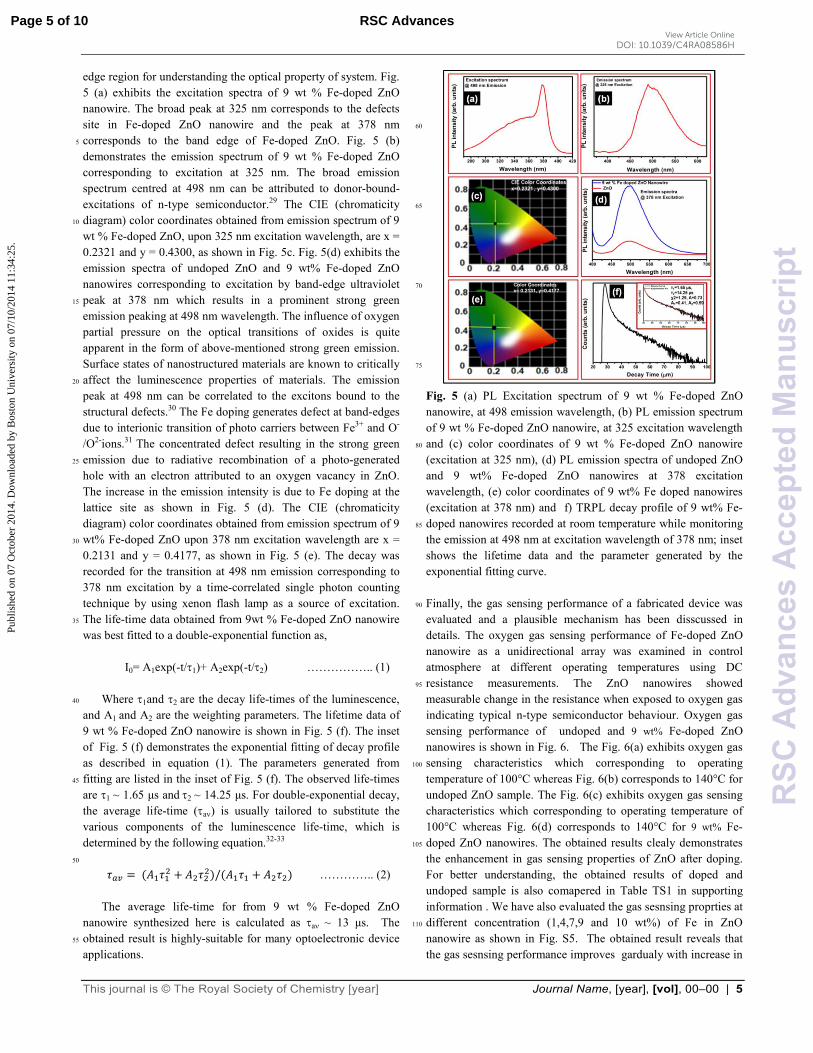
Fig. 3 (a) Bright Field image showing 9 wt% Fe-doped zinc oxide nanowires with diameter in 20-50 nm range and length in 200-500 nm range, (b) SAED pattern corresponding to a bunch of 30
nanowires, (c) TEM image of 9 wt% Fe-doped ZnO nanowires and (d) typical HRTEM image of 9 wt% Fe-doped ZnO nanowires.
The microstructure analysis was carried out by 35
TEM/HRTEM instrument. The bright field image of nanowires is shown in Fig. 3(a) which suggests that the formation of nanowires having diameter in range from 20-50 nm. Selected area electron diffraction (SAED) pattern of nanowires is shown in Fig. 3(b) which matches well with zinc oxide hexagonal wurzite phase 40
with space group P63mc (JCPDS N0. 36-1451). The SAED pattern exhibits the discontinuous and distinct bright rings, which confirms the oriented crystalline nanostructure. The TEM image displayed in Fig. 3(c) clearly illustrate the secondary growths on primary ZnO nanowire in different orientations. The 45
incorporation of Fe in ZnO as Fe2+/Fe3+ must have resulted in the various growth sites enabling the growth of different crystallographic planes on top of one another. The Fig. 3(d) exhibits the typical HRTEM image and corresponding lattice fringes of 9 wt% Fe-doped ZnO nanowires. The d-spacing, 50
calculated from the HRTEM image as well as from electron diffraction pattern for (002) plane are 0.269 and 0.271 nm, respectively. We also evaluated the morphology and microstructural changes with respect to different concentration of Fe doping as shown in Figs. S2 (a-d). It is interesting to note that 55
SEM and TEM image of 1 wt% Fe-doping clearly exhibits the
under growth situation of Fe-doped ZnO nanowires, as shown in Figs. S2 (a&c). SEM and TEM images of 10 wt% Fe-doping represent the cluster formation of Fe doped ZnO nanowires, as shown in Figs. S2 (b&d). Thus, the results of high concentration 60
Fe-doping above 9 wt%, clearly demonstrates the clusters of unconsumed Fe nanoparticles which suppresses the growth of Fe-doped ZnO nanowires, as a result, the PL intensity and gas sensing both get reduced which is further systematically evidenced in PL and gas sensing section for different 65
concentration (1, 4, 7, 9 and 10 wt %) of Fe-doping in ZnO nanowires.
The atomic concentration of host ZnO and dopant Fe are quantitatively analysed from the energy dispersive x-ray spectroscopy (EDAX). Fig. 4 demonstrates the EDAX spectra of 70
9 wt% Fe-doped ZnO nanowires. The EDAX spectrum signifies the presence of Zn, O and Fe elements. Additionally, we also performed the compositional studies on the stoichiometry of 9 wt% Fe-doped ZnO nanowires. The table 1 shows atomic/weight percent of different element present in Fe- doped ZnO nanowires. 75
The micro-chemical analysis confirmed 7.43 % atomic (8.22 weight %) of Fe in ZnO. The obtained result is in good agreement with amount of Fe utilized to dope (9 wt %) in this experiment. Microscopic studies illustrated the presence of Fe at the lattice sites nullifying the possibility or signature of its presence at the 80
surface or on grain boundaries.
85
90
Fig. 4 Energy dispersive x-ray spectrum of Fe doped ZnO nanowires. 95
100
Table.1 EDAX table of 9 wt % Fe doped ZnO nanowires.
In order to explore the detailed optical property of these 105
nanowires, we have carried out the photoluminescence (PL) and time-resolved spectroscopy. For the optimization, the PL emission spectra corresponding to the different concentration of Fe in ZnO nanowires is shown in Fig. S4. The PL results reveal that the peak position and the shape of the emission spectrum are 110
identical for all samples, but intensity is maximum for 9 wt % Fe doped ZnO nanowires. The emphasis has been put on near band
Page 4 of 10RSC Advances
RS
CA
dvan
ces
Acc
epte
dM
anus
crip
t
Publ
ishe
d on
07
Oct
ober
201
4. D
ownl
oade
d by
Bos
ton
Uni
vers
ity o
n 07
/10/
2014
11:
34:2
5.
View Article OnlineDOI: 10.1039/C4RA08586H
This journal is © The Royal Society of Chemistry [year] Journal Name, [year], [vol], 00–00 | 5
edge region for understanding the optical property of system. Fig. 5 (a) exhibits the excitation spectra of 9 wt % Fe-doped ZnO nanowire. The broad peak at 325 nm corresponds to the defects site in Fe-doped ZnO nanowire and the peak at 378 nm corresponds to the band edge of Fe-doped ZnO. Fig. 5 (b) 5
demonstrates the emission spectrum of 9 wt % Fe-doped ZnO corresponding to excitation at 325 nm. The broad emission spectrum centred at 498 nm can be attributed to donor-bound-excitations of n-type semiconductor.29 The CIE (chromaticity diagram) color coordinates obtained from emission spectrum of 9 10
wt % Fe-doped ZnO, upon 325 nm excitation wavelength, are x = 0.2321 and y = 0.4300, as shown in Fig. 5c. Fig. 5(d) exhibits the emission spectra of undoped ZnO and 9 wt% Fe-doped ZnO nanowires corresponding to excitation by band-edge ultraviolet peak at 378 nm which results in a prominent strong green 15
emission peaking at 498 nm wavelength. The influence of oxygen partial pressure on the optical transitions of oxides is quite apparent in the form of above-mentioned strong green emission. Surface states of nanostructured materials are known to critically affect the luminescence properties of materials. The emission 20
peak at 498 nm can be correlated to the excitons bound to the structural defects.30 The Fe doping generates defect at band-edges due to interionic transition of photo carriers between Fe3+ and O-
/O2-ions.31 The concentrated defect resulting in the strong green emission due to radiative recombination of a photo-generated 25
hole with an electron attributed to an oxygen vacancy in ZnO. The increase in the emission intensity is due to Fe doping at the lattice site as shown in Fig. 5 (d). The CIE (chromaticity diagram) color coordinates obtained from emission spectrum of 9 wt% Fe-doped ZnO upon 378 nm excitation wavelength are x = 30
0.2131 and y = 0.4177, as shown in Fig. 5 (e). The decay was recorded for the transition at 498 nm emission corresponding to 378 nm excitation by a time-correlated single photon counting technique by using xenon flash lamp as a source of excitation. The life-time data obtained from 9wt % Fe-doped ZnO nanowire 35
was best fitted to a double-exponential function as,
I0= A1exp(-t/τ1)+ A2exp(-t/τ2) …………….. (1)
Where τ1and τ2 are the decay life-times of the luminescence, 40
and A1 and A2 are the weighting parameters. The lifetime data of 9 wt % Fe-doped ZnO nanowire is shown in Fig. 5 (f). The inset of Fig. 5 (f) demonstrates the exponential fitting of decay profile as described in equation (1). The parameters generated from fitting are listed in the inset of Fig. 5 (f). The observed life-times 45
are τ1 ~ 1.65 µs and τ2 ~ 14.25 µs. For double-exponential decay, the average life-time (τaν) is usually tailored to substitute the various components of the luminescence life-time, which is determined by the following equation.32-33
50
��� � ����� ��
�/����� ��� ………….. (2)
The average life-time for from 9 wt % Fe-doped ZnO nanowire synthesized here is calculated as τaν ~ 13 µs. The obtained result is highly-suitable for many optoelectronic device 55
applications.
60
65
70
75
Fig. 5 (a) PL Excitation spectrum of 9 wt % Fe-doped ZnO nanowire, at 498 emission wavelength, (b) PL emission spectrum of 9 wt % Fe-doped ZnO nanowire, at 325 excitation wavelength and (c) color coordinates of 9 wt % Fe-doped ZnO nanowire 80
(excitation at 325 nm), (d) PL emission spectra of undoped ZnO and 9 wt% Fe-doped ZnO nanowires at 378 excitation wavelength, (e) color coordinates of 9 wt% Fe doped nanowires (excitation at 378 nm) and f) TRPL decay profile of 9 wt% Fe-doped nanowires recorded at room temperature while monitoring 85
the emission at 498 nm at excitation wavelength of 378 nm; inset shows the lifetime data and the parameter generated by the exponential fitting curve. Finally, the gas sensing performance of a fabricated device was 90
evaluated and a plausible mechanism has been disscussed in details. The oxygen gas sensing performance of Fe-doped ZnO nanowire as a unidirectional array was examined in control atmosphere at different operating temperatures using DC resistance measurements. The ZnO nanowires showed 95
measurable change in the resistance when exposed to oxygen gas indicating typical n-type semiconductor behaviour. Oxygen gas sensing performance of undoped and 9 wt% Fe-doped ZnO nanowires is shown in Fig. 6. The Fig. 6(a) exhibits oxygen gas sensing characteristics which corresponding to operating 100
temperature of 100°C whereas Fig. 6(b) corresponds to 140°C for undoped ZnO sample. The Fig. 6(c) exhibits oxygen gas sensing characteristics which corresponding to operating temperature of 100°C whereas Fig. 6(d) corresponds to 140°C for 9 wt% Fe-doped ZnO nanowires. The obtained results clealy demonstrates 105
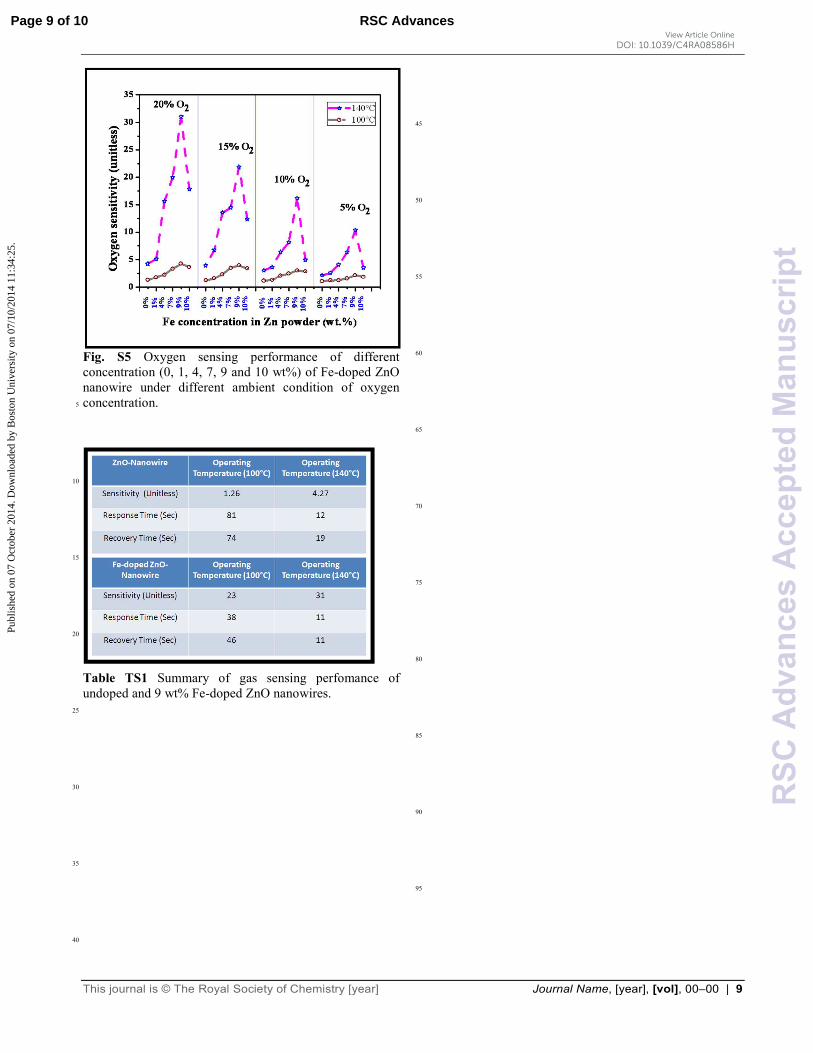
the enhancement in gas sensing properties of ZnO after doping. For better understanding, the obtained results of doped and undoped sample is also comapered in Table TS1 in supporting information . We have also evaluated the gas sesnsing proprties at different concentration (1,4,7,9 and 10 wt%) of Fe in ZnO 110
nanowire as shown in Fig. S5. The obtained result reveals that the gas sesnsing performance improves gardualy with increase in
Page 5 of 10 RSC Advances
RS
CA
dvan
ces
Acc
epte
dM
anus
crip
t
Publ
ishe
d on
07
Oct
ober
201
4. D
ownl
oade
d by
Bos
ton
Uni
vers
ity o
n 07
/10/
2014
11:
34:2
5.
View Article OnlineDOI: 10.1039/C4RA08586H

6| Journal Name, [year], [vol], 00–00 This journal is © The Royal Society of Chemistry [year]
concentration up to 9 wt % Fe doping . Beyound 9wt % , it has been observed that the gas sensing performance decreases furhter at higher concentration. The decreasement in PL and gas sesnsing performance after 9wt % origantes due to unconsumed Fe aprticle during growth of Fe-doped ZnO nanowire. In presence of unused 5
Fe clusters quenches the luminescence and also produce blocking effect on gas sensing performance. The obtained result consitent with our microstructural results.
The oxygen sensitivity of ZnO nanowires was measured in terms of resistance offered by nanowires in the presence of 10
known concentration of oxygen in nitrogen and in pure nitrogen. Response and recovery time from 9 wt% Fe-doped ZnO nanowire was measured as (38±1)s and (46±1)s at 100⁰C to (11±1)s and (11±1)s at 140⁰C, respectively . The current- voltage (I-V) characteristics exhibited ohmic nature within the full range of 15
applied voltage and current ranges measured at 100°C and 140°C. While, response and recovery time from undoped ZnO was measured as (81±1)s and (74±1)s at 100⁰C to (12±1)s and (19±1)s at 140⁰C, respectively. 20
25
30
35
Fig. 6 (a &b) Oxygen sensing characteristics for undoped ZnO at operating temperatures 100°C and 140°C respectively. (c &d) oxygen sensing characteristics for 9 wt% Fe-doped ZnO nanowire at operating temperatures 100°C and 140°C respectively. 40
The outcome of a typical potential sensor device primarily depends on the interaction of test gas and sensing layer. The high surface to volume ratio and 9 wt% Fe-doping is capable of enhancing gas sensing capacity and response/recovery time of 45
sensors by increasing the effective number of active sites for gas interaction at the given operating temperature. On oxygen exposure to the sensing layer, the oxygen atoms diffuse into the sample and get adsorbed at the active sites. The adsorbed oxygen atoms at the surface compensates surface vacancies which 50
instantaneously increases the resistance of nanowires.10 The oxygen deficiency and defects on the surface act as oxygen absorption sites.34 The lattice distortion due to presence of mixed state of Fe2+ and Fe3+ ions modifies the band structure and Fermi level.7 The increase in electron density and active surface states 55
with increased temperature leads to fast response at higher
temperature which explains the fast response/recovery time and high sensitivity at an operating temperature of 140⁰C compared to 100⁰C. Further, 9 wt % Fe in the lattice provides the carrier electrons a quantum mechanical path for current flow by electron 60
hopping between Fe3+ and Fe2+ similar to the ferrites which also contributed to the fast response/recovery of 9 wt % Fe-doped nanowire sensor. The problem of charge trapping at oxygen band gap in the conventional oxygen gas sensor devices can also be addressed by Fe doping. In the spinal lattice, Fe3+ electrostatic 65
interaction, Zn deficiency and other disorder giving rise to Fe2+ ions leads to deviations from ferrite stoichiometry.35 Thus, the facile strategy to synthesized Fe-doped nanwire provides an economic viable route for large scale synthesis. Furthermore, the obtained high-performance gas sensing 70
characteristics of 9 wt % Fe-doped ZnO nanowire promises its potential use in making portable gas sensing devices which is highly comparable with reported gas sensors for other materials.36
4. Conclusions 75
We have systematically investigated the structural and optical properties of as-synthesised 9 wt % Fe- doped ZnO nanowires. The Fe doped ZnO nanowires were concluded to possess Fe2+/Fe3+ ions at tetrahedral and interstitial sites of ZnO lattice giving origin to oxygen deficiency in these nanowires. The 80
interaction of oxygen ions with modified active sites due to presence of Fe2+/Fe3+ ions sites modified the charge transport between the ion-adsorbed oxygen and bulk of the ZnO nanowire resulting in fast response/recovery time with high sensitivity at lower operating temperatures. Hence, the obtain gas sensing 85
results of luminescent Fe-doped ZnO nanowire rationalize its potential application in high-performance gas sensing applications. Acknowledgments 90
Authors are thankful to University Grant Commission (UGC) for finnanicial help.
References
1. L. Liao, H. B. Lu, J. C. Li, C. Liu, D. J. Fu and Y. L. Liu, Appl. Phys.
Lett., 2007, 91 173110. 95
2. M. W. Ahn, K. S. Park, J. H. Heo, J. G. Park, D. W. Kim, K. J. Choi,
J. H. Lee and S. H. Hong, Appl. Phys. Lett., 2008, 93, 263103.
3. S. J. Pearton, D. P. Norton, M. P. Ivill, A. F. Hebard, J. M. Zavada,
W. M. Chen and I. A. Buyanova, IEEE Trans. Electron Devices,
2007, 54, 1040-1048. 100
4. S. Park, S. An, H. Ko, C. Jin and C. Lee, ACS Appl. Mater.
Interfaces., 2012, 4, 3650-3656.
5. J. Y. Park, Y. K. Park and S. S. Kim, Mater. Lett., 2011, 65, 2755-
2757.
6. J. Y. Park, S. W. Choi and S. S. Kim, J. Am. Ceram. Soc., 2011, 94, 105
3922-3926.
7. S. Gautam, S. Kumar, P. Thakur, K. H. Chae, R. Kumar, B. H. Koo
and C. G. Lee, J. Phy. D: Appl. Phys., 2009, 42, 175406-175412.
Page 6 of 10RSC Advances
RS
CA
dvan
ces
Acc
epte
dM
anus
crip
t
Publ
ishe
d on
07
Oct
ober
201
4. D
ownl
oade
d by
Bos
ton
Uni
vers
ity o
n 07
/10/
2014
11:
34:2
5.
View Article OnlineDOI: 10.1039/C4RA08586H

This journal is © The Royal Society of Chemistry [year] Journal Name, [year], [vol], 00–00 | 7
8. S. Hasegawa, Y. Susaki and S. Matasuri, Sens. Actuators, B: Chem.,
1993, 14, 509-510.
9. G. Chen, J. J. Peng, C. Song, F. Zeng and F. Pan, J. Appl. Phys.,
2013, 113, 104503.
10. F. H. Ramirez, J. D. Prades, A. Tarancon, S. Barth, O. Casals, R. J. 5
Diaz, E. Pellicer, J. Rodriguez, J. R. Morante, M. A. Juli, S. Mathur
and A. R. Rodriguez, Adv. Fun. Mater., 2008, 18, 2990-2994.
11. R. K. Sharma, M. C. Bhatnagar and G. L. Sharma,
Sens. Actuators, B: Chem., 1998, 46, 194-201.
12. D. Banergee, J. Y. Lao, D. Z. Wang, J. Y. Huang, D. Steeves, B. 10
Kimball and Z. F. Ren, Nanotechnol., 2004, 15, 404-409.
13. K. W. Liu, R. Chen, G. Z. Xing, T. Wu and H. D. Sun, Appl. Phys.
Lett., 2010, 96, 023111.
14. S. Sen, D. Chowdhary and N. A. Kouklin, Appl. Phys. Lett., 2007,
91, 093125. 15
15. N. Kouklin, M. Omari and A. Gupta, Transition Metal-Doped ZnO
Nanowires: En Route Towards Multi-colour Light Sensing and
Emission Applications, Nanowires Science and Technology, ed. N.
Lupu, INTECH, Croatia, 2010, ch. 17.
16. Z. Zhu, T. L. Chen, Y. Gu, J. Warren and R. M. Osgood, Chem. 20
Mater., 2005, 17, 4227-4234.
17. H. Qi, E. R. Glaser, J. D. Caldwell and S. M. Prokes, J. Nanomater.,
2012, 2012, 260687.
18. Z. L. Wang, J. Phys.: Condens. Matter, 2004, 16, R829–R858.
19. P. Yang, H. Yan, S. Mao, R. Russo, J. Johnson, R. Saykally, N. 25
Morris, J. Pham, R. He and H. J. Choi, Adv. Funct. Mater., 2002, 12,
323-331.
20. B. K. Gupta, D. Haranath, S. Chawla, H. Chander, V. N. Singh and
V. Shanker, Nanotechnol., 2010, 21, 225709.
21. Y. H. Yang, B. Wang and G. W.Yang, Nanotechnol., 2006, 17, 5556-30
5560.
22. H. J. Choi, Semiconductor Nanostructures for Optoelectronic
Devices, NanoScience and Technology, G. C. Yi, Springer, Verlag
Berlin, Heidelberg, 2012, ch. 1.
23. J.Wang, J. Wan and K. Chen, Mater. Lett., 2010, 64, 2373-2375. 35
24. C. Bundesmann, N. Ashkenov, M. Schubert, D. Spemann, T. Butz, E.
M. Kaidashev, M. Lorenz and M. Grundmann, Appl. Phys. Lett.,
2003, 83, 1974.
25. H. C. Hsu, C. S. Cheng, C. C. Chang, S. Yang, C. S. Chang and W.
F. Hsieh, Nanotechnol., 2005, 16, 297-301. 40
26. P. Jiang, J. J. Zhou, H. F. Fang, C. Y. Wang, Z. L., Wang and S. S.
Xie, Adv. Func. Mater., 2007, 17, 1303-1310.
27. J. B. Wang, G. J. Huang, X. L. Zhong, L. Z. Sun, Y. C. Zhou and E.
H. Liu, Appl. Phys. Lett., 2006, 88, 252502.
28. Z. Bin, Z. S. Min, W. H. Wei and D. U. Z. Liang, Chin. Sci. Bull., 45
2008, 53, 1639-1643.
29. A. Dev, J. P. Richters, J. Sartor, H. Kalt, J. Gutowski and T. Voss,
Appl. Phys. Lett., 2011, 98, 131111.
30. K. Vanheusden, C. H. Seager, W. L. Warren, D. R. Tallant and J. A.
Voigt, Appl. Phys. Lett.,1995, 68, 403. 50
31. B. Alemán, Y. Ortega, J. Á. García, P. Fernández and J. Piqueras, J.
Appl. Phys., 2011, 110, 014317.
32. B. K.Gupta, V.Rathee, T. N. Narayanan, P. Thanikaivelan, A.Saha,
Govind, S. P. Singh, V. Shanker, A. A. Marti, P. M. Ajayan, Small
2011, 7, 1767–1773. 55
33. B. K. Gupta, P. Thanikaivelan, T. N. Narayanan, L. Song, W. Gao, T.
Hayashi, A. L. M.Reddy, A. Saha, V. Shanker, M. Endo, A. A. Marti,
P. M. Ajayan, Nano Lett. 2011, 11, 5227-5233.
34. S. K. Gupta, A. Joshi and M. Kaur, J. Chem. Sci., 2010, 1, 57-62.
35. V. D. Kapse, S. A. Ghosh, F. C. Raghuwanshi, S. D. Kapse, U. S. 60
Khandekar, Talanta, 2009, 78, 19-25.
36. B. Wang, L. F. Zhu, Y. H. Yang, N. S. Xu and G. W. Yang, J. Phys.
Chem. C, 2008, 112, 6643-6647.
65
70
75
80
85
90
95
100
105
Page 7 of 10 RSC Advances
RS
CA
dvan
ces
Acc
epte
dM
anus
crip
t
Publ
ishe
d on
07
Oct
ober
201
4. D
ownl
oade
d by
Bos
ton
Uni
vers
ity o
n 07
/10/
2014
11:
34:2
5.
View Article OnlineDOI: 10.1039/C4RA08586H

8| Journal Name, [year], [vol], 00–00 This journal is © The Royal Society of Chemistry [year]
† Electronic Supplementary Information
(ESI)
5
10
15
Fig. S1 The magnified view of the surface morphology of 9 wt % Fe-doped ZnO nanowires based film which is shown in Scheme 1c. 20
25
30
35
Fig. S2 (a &b) represent the SEM images of 1wt% and 10 wt% Fe-doped ZnO nanowires respectively. (c &d) represent the TEM images of 1wt% and 10 wt% Fe-doped 40
ZnO nanowires respectively. It can be easily noticed from micrographs (a & c) that 1 wt% Fe-doped ZnO nanowires shows the under growth morphology of Fe-doped ZnO nanowires which is marked by red cross circle and (b & d) 10 wt% Fe-doped ZnO nanowires exhibits the cluster 45
formation of unconsumed Fe during nanowire growth process.
50
55
60
65
Fig. S3 XRD patterns of undoped and 9 wt% Fe-doped 70
ZnO nanowires. 75
80
85
90
Fig. S4 PL spectra of different concentration (0, 1, 4, 7, 9 and 10 wt%) of Fe doped ZnO nanowires.
95
100
105
Page 8 of 10RSC Advances
RS
CA
dvan
ces
Acc
epte
dM
anus
crip
t
Publ
ishe
d on
07
Oct
ober
201
4. D
ownl
oade
d by
Bos
ton
Uni
vers
ity o
n 07
/10/
2014
11:
34:2
5.
View Article OnlineDOI: 10.1039/C4RA08586H
This journal is © The Royal Society of Chemistry [year] Journal Name, [year], [vol], 00–00 | 9
Fig. S5 Oxygen sensing performance of different concentration (0, 1, 4, 7, 9 and 10 wt%) of Fe-doped ZnO nanowire under different ambient condition of oxygen concentration. 5
10
15
20
Table TS1 Summary of gas sensing perfomance of undoped and 9 wt% Fe-doped ZnO nanowires.
25
30
35
40
45
50
55
60
65
70
75
80
85
90
95
Page 9 of 10 RSC Advances
RS
CA
dvan
ces
Acc
epte
dM
anus
crip
t
Publ
ishe
d on
07
Oct
ober
201
4. D
ownl
oade
d by
Bos
ton
Uni
vers
ity o
n 07
/10/
2014
11:
34:2
5.
View Article OnlineDOI: 10.1039/C4RA08586H

10| Journal Name, [year], [vol], 00–00 This journal is © The Royal Society of Chemistry [year]
Table of Contents (TOC)
5
10
15
Succesful demonstration of Fe-doped ZnO nanowires using a facile vapour phase transport synthesis method for high-20
performance oxygen gas sensing application.
Page 10 of 10RSC Advances
RS
CA
dvan
ces
Acc
epte
dM
anus
crip
t
Publ
ishe
d on
07
Oct
ober
201
4. D
ownl
oade
d by
Bos
ton
Uni
vers
ity o
n 07
/10/
2014
11:
34:2
5.
View Article OnlineDOI: 10.1039/C4RA08586H