Embed Size (px)
Citation preview
Probing Large Protein Adhesin Molecules on
Pseudomonas fluorescens with Atomic Force Microscopy
A Major Qualifying Project submitted to the faculty of Worcester
Polytechnic Institute in partial fulfillment of the requirements for the
Degree of Bachelor of Science
Mary Schwartz
Advised by:
Professor Terri A. Camesano
December 19, 2013
Probing Large Protein Adhesin Molecules on Pseudomonas fluorescens with Atomic Force
Microscopy
A Major Qualifying Project
Submitted to the Faculty of
WORCESTER POLYTECHNIC INSTITUTE
Professor Terri A. Camesano, Advisor
by
___________________________
Mary Elizabeth Schwartz
December 19, 2013
Approval:
_______________________
Terri A. Camesano, Advisor
Abstract Protein adhesins are an important type of surface structure, and are components of some
Gram-negative bacterial outer membranes, such as Pseudomonas fluorescens. The LapA adhesin
is a major surface protein on this bacterium, which is required for irreversible adhesion and the
initiation of biofilm formation. Atomic force microscopy (AFM) was used to characterize
surface structures of P. fluorescens Pf0-1. The wild-type and three genetically modified strains
were studied, namely a strain consisting of a single cross-over knockout mutation disrupting the
lapA gene, a strain consisting of a single cross-over knockout mutation disrupting the lapB gene,
(LapA is maintained in the cytoplasm and not transported to the cell surface), and lapG (LapA is
unable to be cleaved from the cell surface). AFM data was modeled using the Alexander - de
Gennes (A-dG) relation for steric repulsion. We calculated the equilibrium layer thickness of the
surface structures as well as spacing between adhesins. The wild-type strain and the lapA and
lapB mutants all showed similar spacing for surface proteins. The strain lacking LapG had the
smallest spacing between molecules. This suggests that the absence of the LapG protease
allowed the LapA protein to accumulate, thus decreasing the overall molecular spacing of the
protein on the bacterial surface compared to the wild-type strain. We found that the lapG mutant
strain of P. fluorescens behaved like a classical polymer brush, in which the spacing between
molecules was very small (3.3 nm), which would allow intermolecular interactions between
protein units. Recent work has shown that the lapG mutant has greater adhesion and biofilm
formation than the wild-type, lapA, and lapB strains, and exhibits stiffer conformation of LapA
due to higher protein density and aggregation. Taken together, our results and these recent
studies support the finding that LapA adhesin conformation is related to irreversible bacterial
adhesion.
Acknowledgements
I would like to thank my project advisor, Professor Terri A. Camesano, Department of
Chemical Engineering at Worcester Polytechnic Institute for providing so much opportunity
through research and mentorship as well as supporting me through the writing of a journal article
and national conference. I would also like to thank Professor Camesano’s graduate students
Rebecca Gaddis, Lindsay Lozeau, Todd Alexander, Kathleen Wang, Elaheh Kamaloo as well as
Gawain Thomas for their insight and support. Additionally, this research could not have been
done without the collaboration with Professor George A. O’Toole and student Chelsea D. Boyd,
and the help of Ivan Ivanov, Samantha O’Connor, and Professor Nancy Burnham.
Authorship
Materials and Methods, Results and Discussion and Conclusions sections of this Major
Qualifying Project are taken from a paper in review from the editors of the Journal of
Bionanoscience for which I was the primary author. The contents of this report are a
representation of the work done by the main author. Contributions to these sections also were
made by Ph.D. students Samantha O’Connor and Rebecca Gaddis in the department of physics at
Worcester Polytechnic Institute. They were very helpful in the development of the MATLAB
program. Dr. George A. O’Toole and Dr. Chelsea D. Boyd of Dartmouth College contributed in
the development and characterization of the bacterial strains.
Contents 1.0 Introduction .......................................................................................................................... 1
2.0 Background ............................................................................................................................... 3
2.1 Bacterial Biofilms ................................................................................................................. 3
2.2 Pseudomonas fluorescens Pf0-1 ........................................................................................... 5
2.3 Atomic Force Microscopy .................................................................................................... 7
2.4 MATLAB Programing for Data Analysis ............................................................................. 8
2.5 Steric Modeling ..................................................................................................................... 9
3.0 Materials and Methods ............................................................................................................ 10
3.1Bacterial Preparation ............................................................................................................ 10
3.2 AFM Calibration ................................................................................................................. 11
3.3 Steric Modeling ................................................................................................................... 12
3.4Data Analysis and Computation .......................................................................................... 13
4.0 Results and Discussion ........................................................................................................... 15
4.1 Spacing and Length of Protein Molecules on P. fluorescens ............................................. 15
4.2 Polymer Conformation on the Surface of P. fluorescens ................................................... 17
4.3 Relationship of Protein Conformation to Bacterial Adhesion ............................................ 20
5.0 Conclusions ............................................................................................................................. 22
References Cited ........................................................................................................................... 23
1
1.0 Introduction
Bacteria are found in most environments and often form biofilms, or surface-attached
communities, which provide a protective environment for the microbes and make infections very
difficult to treat (Mulcahy, Isabella, & Lewis, 2013). The process of bacterial attachment and
biofilm development are highly regulated (G.A. O'Toole & R. Kolter, 1998). Efforts are
underway to study bacterial adhesion and biofilm formation from multiple aspects, and the
combination of genetic studies with nanoscale-studies represents a promising approach that is
currently being pursued (El-Kirat-Chatel, Beaussart, Boyd, O’Toole, & Dufrêne, 2013; Ivanov et
al., 2012; Ivanov et al., 2011).
Biofilm formation begins with the initial bacterial adhesion phase in which bacteria
reversibly adhere to a conditioned surface under favorable conditions, followed by irreversible
adhesion. Exopolysaccharides, proteins, pili and receptor-specific ligands initiate this latter phase
(P. D. Newell, Monds, & O'Toole, 2009; O'Toole, Kaplan, & Kolter, 2000). P. fluorescens utilizes
these protein adhesins for irreversible surface attachment, as a biological control agent on a variety
of crops, by preventing colonization of detrimental bacteria (Hinsa, Espinosa-Urgel, Ramos, &
O'Toole, 2003). P. fluorescens has a large adhesive protein (LapA) of ~520 kDa, which is present
in the cytoplasm and exported to the cell surfaces by an ABC transporter, encoded by the lapEBC
genes, and is required for irreversible attachment of the bacterium (Peter D. Newell, Boyd,
Sondermann, & O'Toole, 2011). P. fluorescens Pf0-1 cells in which the lapG gene has been deleted
accumulate LapA on the surface, and these cells form a very robust biofilm (Boyd, Chatterjee,
Sondermann, & O'Toole, 2012; Peter D. Newell et al., 2011).
2
While the overall function of surface organelles and proteins of many common microbes
when assembled in a biofilm are understood macroscopically, research on the molecular and
nanoscale properties of the individual organelles and initial adhesion is ongoing (Ivanov et al.,
2012; Pranzetti et al., 2013; Tripathi et al., 2013). This information is extremely important because
it is the initial adhesion of a few bacteria that leads to biofilm development.
Atomic force microscopy (AFM) is useful for providing more detailed information on
bacterial adhesion and surface molecules. With AFM, bacterial surface structures are probed, and
intermolecular forces are studied in real time (Dupres, Alsteens, Andre, & Dufrêne, 2010; Joshua
Strauss, Nancy A. Burnham, & Terri A. Camesano, 2009). Application of modeling to AFM data
allows for the characterization of physiochemical properties of bacterial surface molecules.
Previous AFM measurements were reported for P. fluorescens Pf0-1 (Ivanov et al., 2012). AFM
with a silicon nitride tip was used to describe how different genes affected LapA function and
overall adhesion of the bacteria. For the lapG mutant strain, adhesion forces measured with an
AFM tip were roughly twice the force observed between the wild-type strain and the AFM tip,
presumably due to the lapG mutant strain expressing more LapA protein on the surface than the
wild-type strain (Boyd et al., 2012). A recent AFM study showed that under conditions that
induce biofilm formation, including growth in a phosphate-rich medium or when the gene
encoding LapG was deleted, adhesion of P. fluorescens was greater towards both hydrophobic
and hydrophilic substrates (El-Kirat-Chatel et al., 2013).
As an extension of prior work, we applied a model accounting for steric interactions to
AFM data. When two surfaces, at least one of which is covered with grafted polymers, are brought
into close contact with each other, the interactions between the two plates cause changes in the
conformation of the polymers. Steric models of the form developed by Alexander - de Gennes (A-
3
dG model) have been used to characterize molecules on bacterial surfaces including
lipopolysaccharides (LPS), extracellular polymeric substances, and surface polymers (de Gennes,
1987; Oh et al., 2012; Taylor & Lower, 2008). Therefore, the objective of this study was to apply
the steric model to AFM data, and characterize the physical characteristics of the LapA protein of
P. fluorescens.
2.0 Background
2.1 Bacterial Biofilms
Bacteria are found in environments across the world and may form surface-bound
communities, called biofilms, in which the individual bacterium are able to interact. These
biofilm formations can be pathogenic or beneficial; able to kill cells or necessary for survival of
entire ecosystems (Friedlander et al., 2013; G. A. O'Toole & R. Kolter, 1998). Upon forming a
surface-bound biofilm, groups of micro-organisms undergo a physical change from a planktonic
(or group-like) state to a multicellular and symbiotic population. This change is essential for
quorum sensing, bacterial survival, and ultimately, pathogenesis (Potera, 2012). When Bacteria
aggregate they become physically connected through production of an extracellular matrix with
many different types of extracellular polymeric substances (EPS) including various proteins and
polysaccharides. Bacteria have illustrated an increased resistance to antibiotics when they are in
this biofilm formation and can often withstand very high doses of antibiotics which would kill
planktonic cells, however the mechanism by which this occurs is not understood completely
(Bjarnsholt, 2013; George A. O'Toole & Roberto Kolter, 1998).
Bacterial biofilm formations can be detrimental and fatal causing diseases such as
bacterial endocarditis, catheter-related fungal nosocomial bloodstream infection, and cystic
4
fibrosis lung infections as well as many chronic infections(Parsek & Singh, 2003; Schinabeck et
al., 2004). These biofilms are difficult to prevent once colonized, as antibiotics often have little
or no effect on these bacteria (Bjarnsholt, 2013; Friedlander et al., 2013). The occurrence of
medical complications coming from hospital stays has been increasing, caused in part by
antibiotic-resistant bacteria such as methicillin-resistant Staphylococcus aureus (MRSA), and
multi-drug-resistant Mycobacterium tuberculosis (MDR-TB) which are becoming more often
integrated into these already difficult-to-treat biofilm communities (Ojha et al., 2008). Because
of their increasing resistance to antibiotics, treatment options are being severely limited. In 2007
alone there were 99,000 deaths associated with healthcare associated infections and an estimated
$5 billion dollars a year spent to combat these infections, a significant amount being biofilm
related(Bryers, 2008).
It is known that for initial bacterial attachment, a bacteria reversibly adheres to a
conditioned surface in favorable conditions to the particular strain of bacteria. Once there is initial
attachment, the bacteria undergo physiological changes to begin irreversible adhesion induced by
exopolysaccharides, proteins, pili, and receptor specific ligands (P. D. Newell et al., 2009; G. A.
O'Toole & R. Kolter, 1998; O'Toole et al., 2000). The bacteria are then in a maturation stage and
grow sub-populations in a 3-D structure, and finally some bacteria dis-attach to form other colonies
(Bjarnsholt, 2013; Coppadoro, Thomas, & Berra, 2013). In order to better understand biofilm
formation, the original attachment of the bacteria to the surface in the beginning stages of biofilm
formation must be better understood.
While the overall function of some surface organelles and proteins assembled in a biofilm
are understood macroscopically, the research into the microscopic properties of the individual
organelles controlling initial adhesion is only just beginning (Ivanov et al., 2012). A few of these
5
experiments include Lactic acid bacteria; Lactobacillus crispatus, Lactobacillus helveticus and
Lactobacillus johnsonii have been investigated to understand their adhesion to the intestinal
epithelium(Schaer-Zammaretti & Ubbink, 2003). Escherichia coli adhesion has been tested on
different surfaces, such as Teflon and hydrophobic and hydrophilic glass to determine biomaterial
surface interactions as well as with cranberry juice to study urinary tract infections(Y. Liu, M. A.
Black, L. Caron, & T. A. Camesano, 2006; Ong, Razatos, Georgiou, & Sharma, 1999) Massilia
timonae, Pseudomonas aeruginosa and Bacillus subtilis have been studied to determine adhesion
differences between gram-negative and gram-positive bacteria and physicochemical properties
analyses on the bacterial surfaces (Harimawan, Rajasekar, & Ting, 2011; Yatao Liu, Matthew A.
Black, Lizabeth Caron, & Terri A. Camesano, 2006; Ong et al., 1999; Schaer-Zammaretti &
Ubbink, 2003).
2.2 Pseudomonas fluorescens Pf0-1
The Pseudomonas genus contains bacteria which aerobic Gram-negative rods which are
non-sporulating and found in biofilm or planktonic forms. The genus encompasses a wide variety
of organisms from an enormous variety of environments. They can be found in soil, water, plants
and animals and are known for their vast metabolic diversity. They are able to metabolize a large
number of substrates including aromatic hydrocarbons and in some strains, their metabolites
have been shown to stimulate plant growth and inhibit plant pathogens(Moore et al., 2006; Ozen
& Ussery, 2012). They are medically and biotechnologically important due to the large variety of
niches they reside in and the pathogenic nature of some strains. Most which are pathogenic, are
pathogenic to plants, with several pathogenic to animals(Ozen & Ussery, 2012). Strains of
Pseudomonas are often resistant to antibiotics, disinfectants, detergents, and organic solvents and
because of this, have been of great interest in the biomedical field(Moore et al., 2006). As of
6
2012, there are 202 species in the genus Pseudomonas, classified by a combination of 16S
rRNA, analysis of cellular fatty acids and differentiating physiological and biochemical
tests(Moore et al., 2006; Ozen & Ussery, 2012).
The mechanisms by which bacteria adhere to surfaces and other cells are thought
to be the most significant in the quest for understanding transport and viability of bacteria in
various environments(Boyd et al., 2012; Rijnaarts, Norde, Bouwer, Lyklema, & Zehnder, 1995).
Pseudomonas fluorescens PF0-1 for example, has a large adhesive protein (LapA) which is used
for irreversible attachment. The bacteria are used as biological control agents for a variety of
crops as it colonizes and benefits roots by preventing colonization of detrimental bacteria.
Studying the initial adhesion of Pseudomonas fluorescens PF0-1, allows the assessment of a
fairly large adhesive protein, which is known to irreversibly attach to surfaces and promote the
growth of biofilms (Dunne, 2002; O'Toole et al., 2000). This ~520 kD LapA protein is essential
for stable surface attachment and irreversible adhesion of Pseudomonas fluorescens (Peter D.
Newell et al., 2011). Bis-(3’-5’) cyclic dimeric guanosine monophosphate (c-di-GMP) levels
within the cell fluctuate with the availability of the essential nutrient, inorganic phosphate and
regulate the cellular production of this surface attachment protein. When low inorganic
phosphate levels occur, cellular c-di-GMP levels are reduced, which through another pathway
utilizing the LapA targeted protease, LapG, allows the lapA protein to be released(Navarro et al.,
2011).
Previous AFM measurements were reported for P. fluorescens Pf0-1 (Ivanov et al.,
2012). AFM with a silicon nitride tip was used to describe how different genes affected LapA
function and overall adhesion of the bacteria. For the lapG mutant strain, adhesion forces
measured with an AFM tip were roughly twice the force observed between the wild-type strain
7
and the AFM tip, presumably due to the lapG mutant strain expressing more LapA protein on the
surface than the wild-type strain (Boyd et al., 2012). A recent AFM study showed that under
conditions that induce biofilm formation, including growth in a phosphate-rich medium or when
the gene encoding LapG was deleted, adhesion of P. fluorescens was greater towards both
hydrophobic and hydrophilic substrates (El-Kirat-Chatel et al., 2013).
2.3 Atomic Force Microscopy
Atomic force microscopy (AFM) does not use the traditional methods to obtain and analyze
images. Instead of using light and series of lenses, the AFM “views” a surface via differences in
heights. These differences are measured by a pointed or rounded tip, which is on the micron scale,
which is attached to a micro-cantilever. Often, a rounded tip is used for surfaces in which adhesion
forces are to be measured, or in cases which resolution is not important. When the imaging quality
is important, tips can be used to obtain resolution down to the nanometer scale and obtain images
1nm by 1nm in size. To obtain this image, a laser is centered on this tip and the change in surface
morphology results in change in the deflection of the laser on the tip. This deflection is measured
by differences of voltages on a photodiode. From these differences, an image is collected which
can be used to further study interactive forces between the tip and a surface.
This image can be obtained through several different modes, the two most common of
which are contact and tapping mode. In contact mode, the cantilever is brought to the surface, and
dragged across the surface. This method allows for topographical data to be collected, but may
also damage a sensitive or soft surface. This is typically not used for analysis of biological systems
or soft samples. Tapping mode is based on the vibration of the cantilever. The vibration is
controlled through electronics using resonance frequency and drive amplitude. After being brought
to the surface, the cantilever is vibrated to tap the sample at the bottom of each vibration phase.
8
This method of imaging allows for less contact between the tip and the surface, and thus less
possibility of damage to the surface. The drive amplitude must be monitored, however, to ensure
the tip is not contacting the surface too aggressively.
In addition to obtaining images, interactive forces can be obtained to study the adhesion
and repulsion between the tip and the sample. In the AFM software, the tip can be centered at any
location and from there, move towards said surface. As the tip moves towards the surface, there
are steric repulsive forces acted on the tip, which can be measured from the force data. Once on
the surface, the tip may dwell at a surface for an allotted time, allowing bonds to form between the
tip and the surface, and then retract away from the surface. A series of force verses separation data
curves, created by AFM data, are used to collect adhesion, elastic, steric and repulsive force
information.
Atomic force microscopy (AFM) is useful for providing more detailed information on
bacterial adhesion and surface molecules. With AFM, bacterial surface structures are probed, and
intermolecular forces are studied in real time and surfaces can be visualized at the nanometer level
(Dupres et al., 2010; Joshua Strauss et al., 2009). Application of modeling to AFM data allows for
the characterization of physiochemical properties of bacterial surface molecules. AFM has not
only allowed the visualization of the bacterium surface, but also has the ability to record adhesion
events. When the bacteria are mutated, characteristics of individual genes can be investigated
without the effect of signaling, interactions between bacterium in the biofilm.
2.4 MATLAB Programing for Data Analysis
MATLAB is a fourth generation programing language, often used to analyze or create
data. It operates using matrices and allows for matrix manipulations, creation of algorithms, and
plotting of functions among other abilities. MATLAB is developed by MathWorks and is utilized
9
in applications around the world. Users are able to write their own programs to analyze data or
upload previously gathered data for manipulation and analysis.
Previously, adhesion data had been analyzed through the use of a MATLAB script which
allowed the researcher to manually pick adhesion points. This resulted in a data collection system
which varied with the person analyzing the data. Because of this, and in order to automatically
apply the steric model to existing data sets in a time-efficient manner, a new MATLAB script has
been written to automate the process and achieve higher accuracy in the results.
2.5 Steric Modeling
As an extension of prior work, we applied a model accounting for steric interactions to
AFM data. When two surfaces, at least one of which is covered with grafted polymers, are brought
into close contact with each other, the interactions between the two plates cause changes in the
conformation of the polymers. Steric models of the form developed by Alexander - de Gennes (A-
dG model) have been used to characterize molecules on bacterial surfaces including
lipopolysaccharides (LPS), extracellular polymeric substances, and surface polymers(de Gennes,
1987; Oh et al., 2012; Taylor & Lower, 2008).
The Alexander and de Gennes model determines the force per unit area (F) between two
plates with grafted polymer brush surfaces by considering a constant monomer density throughout
the brush (Alexander, 1977; de Gennes, 1987). The original equation applies to interactions with
polymers on both the tip and the surface, but it has been shown that the same equation is applicable
to cases where the AFM probe is not coated with polymers. The equation is simply changed to
account for the spherical nature of the tip’s contact region instead of the flat planes that the original
equation was written for. The non-linear region on the AFM approach curve can be fitted to
determine the length and density of the polymers under various conditions. For steric modeling,
10
the point of zero distance is defined as the position where the polymer brush is compressed so
much by the tip that an additional increase of the force does not lead to further compression. The
point of zero force is the point where the surface exerts an initial repulsive force on the tip and the
region between these two points is approximately the size of the tip radius, and is used along with
the Alexander and de Gennes equation to determine three variables; the equilibrium layer thickness
of the polymer brush, spacing between molecules and the offset distance (Butt, 1999). Through
the application of the steric model to the AFM data, the physical characteristics of a surface may
be further understood.
3.0 Materials and Methods
3.1Bacterial Preparation
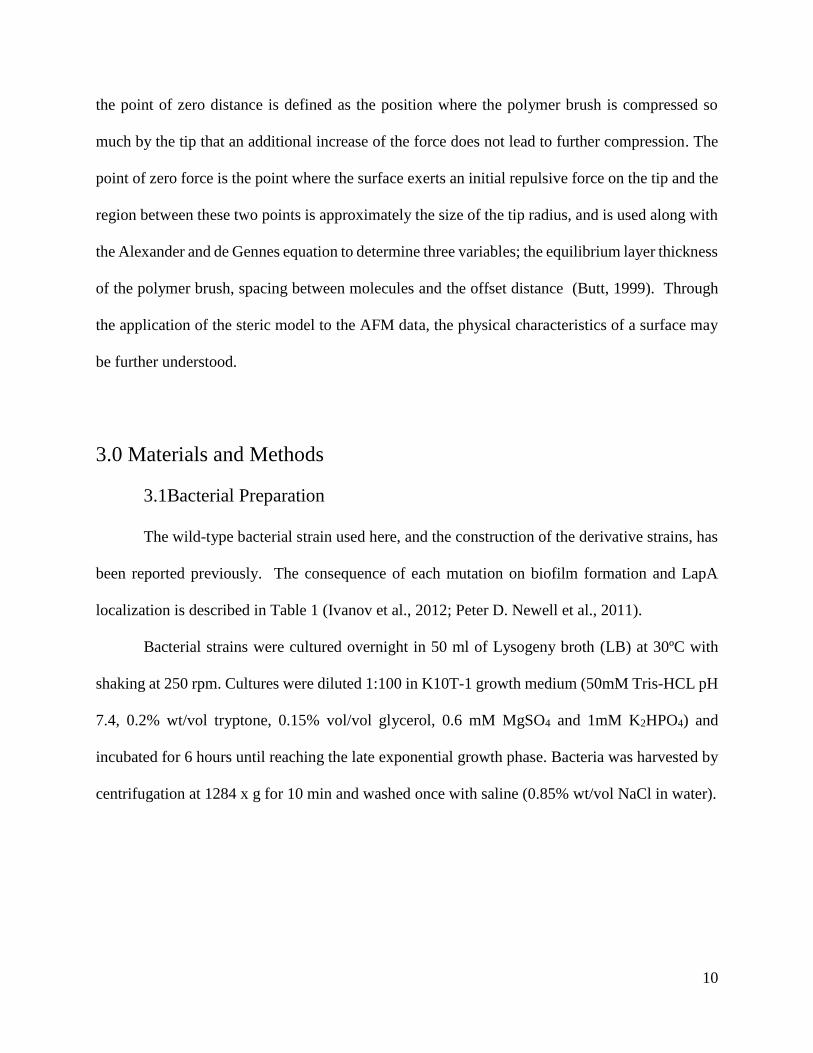
The wild-type bacterial strain used here, and the construction of the derivative strains, has
been reported previously. The consequence of each mutation on biofilm formation and LapA
localization is described in Table 1 (Ivanov et al., 2012; Peter D. Newell et al., 2011).
Bacterial strains were cultured overnight in 50 ml of Lysogeny broth (LB) at 30ºC with
shaking at 250 rpm. Cultures were diluted 1:100 in K10T-1 growth medium (50mM Tris-HCL pH
7.4, 0.2% wt/vol tryptone, 0.15% vol/vol glycerol, 0.6 mM MgSO4 and 1mM K2HPO4) and
incubated for 6 hours until reaching the late exponential growth phase. Bacteria was harvested by
centrifugation at 1284 x g for 10 min and washed once with saline (0.85% wt/vol NaCl in water).
11
Glass slides were
cleaned with 2% vol/vol
RBS-35 (Thermo Fisher
Scientific, Rockford,
IL) for 10 minutes
followed by rinsing
with copious amounts
of ultrapure water.
Cleaned slides were
rinsed with 100%
methanol and soaked with 30% vol/vol 3-aminopropyltrimethoxysilane (Sigma-Aldrich, St. Louis,
MO) in methanol for 20 min. Functionalized slides were rinsed with copious amounts of methanol
and ultrapure water. After centrifugation, bacterial cells were re-suspended in saline with an
addition of 300 μL of 100 mM 1-ethyl-3-[3-dimethylaminopropyl] carbodiimide hydrochloride
(Thermo Fisher Scientific, Rockford, IL) and 2.4 mM N-hydroxysulfosuccinimide (Thermo Fisher
Scientific, Rockford, IL) and poured over the functionalized glass slides. The slides were agitated
at 70 rpm for 2 hours to promote bacterial attachment. These slides were equilibrated with 0.5 ml
of phosphate buffered saline (PBS) for AFM measurements.
3.2 AFM Calibration
An MFP-3D Bio AFM (Asylum Research, Santa Barbara, CA) was calibrated in order to
reduce the effect of noise and to measure the cantilever spring constant. The silicon nitride probe
(DNP, Veeco Instruments Inc., Santa Barbara, CA) with resonance frequency of ~24 kHz had a
spring constant of approximately 0.12-0.15 N/m, which was calibrated before each experiment.
12
Optical sensitivity was determined in PBS on glass before testing the bacterium. At least 25
measurements per bacterium were obtained by probing the center top of the cell and each strain
was tested thrice. During experiments, there was a constant trigger threshold of 5 nN and a surface
dwell of 0.99 s. Deflection and z-sensor measurements obtained through AFM analysis were used
to calculate force and separation values needed to fit the A-dG model. The separation is equal to
deflection minus z-sensor values and force is equal to the spring constant of the cantilever
multiplied by the deflection.
3.3 Steric Modeling
The Alexander -de Gennes model determines the force F, as a function of separation
distance, D, between two surfaces, one of which contains a grafted polymer brush with a constant
monomer density throughout the brush (Alexander, 1977; de Gennes, 1987). When one surface is
a flat plate and the other is a spherical AFM probe, the force is given as
𝐹(𝐷) =8𝑘𝑇𝑅𝜋𝐿
35𝑠3[7 (
𝐿
𝐷)5/4
+ 5(𝐷
𝐿)7/4
− 12] (1)
where k is the Boltzmann constant, T the absolute temperature, s the spacing between molecules,
L the equilibrium layer thickness of the polymer brush, and D is the separation distance. This value,
D, was offset to account for the layer thickness at maximum applied force (Chang, Abu-Lail,
Guilak, Jay, & Zauscher, 2008).
The non-linear region on the AFM approach curve can be fitted using Equation 1 to
determine the layer thickness of the polymers in a brush form as well as the spacing of the polymers
under various conditions. AFM data were calibrated and processed with a MATLAB script, and
the steric model was applied to calculate L and s. The calculated L and s values were only used if
the function which fit the data resulted in a least-squares mean fit of 0.76 or greater. The fit
produced average least-squares mean fits of 0.97.
13
In order to compare data, whisker and box plots were created and statistical tests were
performed. L and s values of bacteria strains were compared using (P ≤ 0.050) to determine
statistically significant distances with the Kruskal-Wallis one-way analysis of variance on ranks
(Tukey’s Test for all pairwise multiple comparisons) in SigmaPlot 12.5 (Systat Software Inc.,
Chicago, IL).
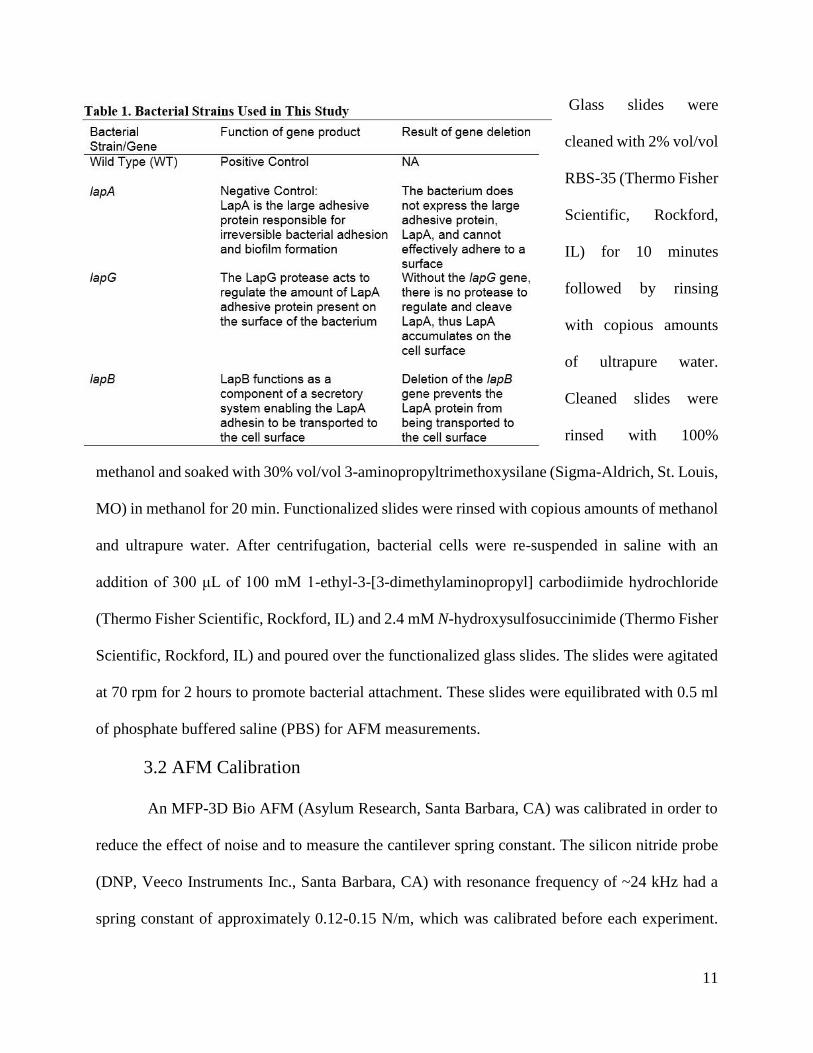
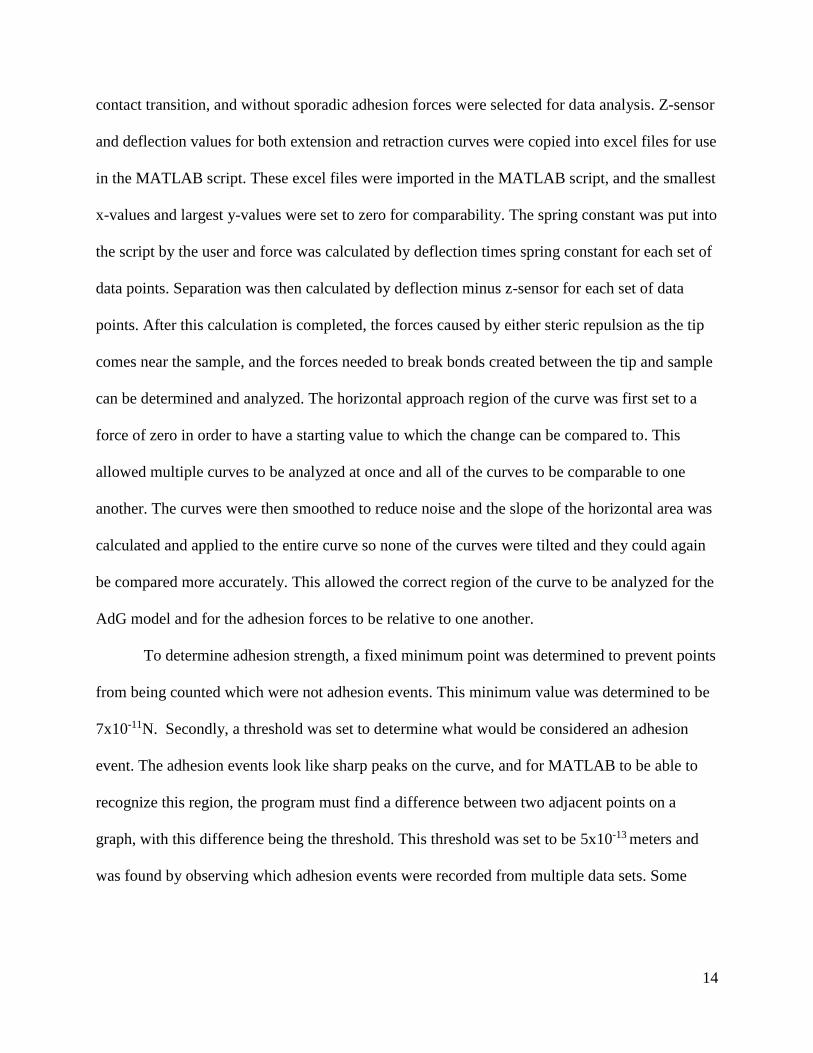
3.4Data Analysis and Computation
To obtain as much information as possible from the AdG model, AFM data needs to be
calibrated and processed in several ways. To do this, a MATLAB script was written to allow to
calibrate and crop and
then fit the data curves
to the curved function
of the AdG model. The
methods followed by
this script are
illustrated in Figure 1.
Igor software controls
the AFM and also
stores the data.
Through this program,
curves can be viewed
to see overall shape.
Curves which did not
have a sharp jump to
Figure 1: Flow diagram for the methods by which data is collected and
manipulated for analysis. First curves are obtained through the IGOR AFM
software and selected based on known characteristics of the bacterial surface.
This data is then modified to obtain force vs separation data and further
analyzed to obtain adhesion data and fit the Alexander and de Gennes model.
14
contact transition, and without sporadic adhesion forces were selected for data analysis. Z-sensor
and deflection values for both extension and retraction curves were copied into excel files for use
in the MATLAB script. These excel files were imported in the MATLAB script, and the smallest
x-values and largest y-values were set to zero for comparability. The spring constant was put into
the script by the user and force was calculated by deflection times spring constant for each set of
data points. Separation was then calculated by deflection minus z-sensor for each set of data
points. After this calculation is completed, the forces caused by either steric repulsion as the tip
comes near the sample, and the forces needed to break bonds created between the tip and sample
can be determined and analyzed. The horizontal approach region of the curve was first set to a
force of zero in order to have a starting value to which the change can be compared to. This
allowed multiple curves to be analyzed at once and all of the curves to be comparable to one
another. The curves were then smoothed to reduce noise and the slope of the horizontal area was
calculated and applied to the entire curve so none of the curves were tilted and they could again
be compared more accurately. This allowed the correct region of the curve to be analyzed for the
AdG model and for the adhesion forces to be relative to one another.
To determine adhesion strength, a fixed minimum point was determined to prevent points
from being counted which were not adhesion events. This minimum value was determined to be
7x10-11N. Secondly, a threshold was set to determine what would be considered an adhesion
event. The adhesion events look like sharp peaks on the curve, and for MATLAB to be able to
recognize this region, the program must find a difference between two adjacent points on a
graph, with this difference being the threshold. This threshold was set to be 5x10-13 meters and
was found by observing which adhesion events were recorded from multiple data sets. Some
15
curves had many adhesion events and some had none, all of which was recorded in a new excel
spreadsheet with all of the results.
The force and separation data require precise cropping and fitting parameters to fit the
steric model. The force curve must be cropped in order to obtain the region from where AFM tip
first comes in contact with the surface to the point where the tip begins to indent the bacteria.
This was estimated to be the length of the tip radius and is fit with the AdG function. Due to the
difficulty of finding the exact region to crop every one of the many curves, functions which gave
protein length values on the micron scale were discarded, as this would be one half the length of
the bacterium itself, or greater. Values were only used if they had least mean squares fit values of
.75 or greater, with average values of .95 or greater. The full procedure is represented in the
image below.
4.0 Results and Discussion
4.1 Spacing and Length of Protein Molecules on P. fluorescens
P. fluorescens Pf0-1 has evolved methods to adapt to changes in nutrient availability,
which in turn affects the bacterium’s ability to form biofilms. A critical protein for this process is
the large adhesin protein, LapA. An ABC transporter encoded by the lapEBC genes exports the
LapA adhesin to the cell surface and several other proteins are involved in the maintenance of
LapA on the cell surface. Most relevant to this study is the LapG protease, which promotes the
release of the LapA protein from the cell surface in conditions unfavorable for biofilm formation
(Boyd et al., 2012).
AFM force measurements were performed on individual bacterial cells in PBS. At least
75 measurements were made per bacterial strain, and the steric model was applied to each force
16
curve. The fitted parameters from the model were tabulated and statistical analyses were
performed.
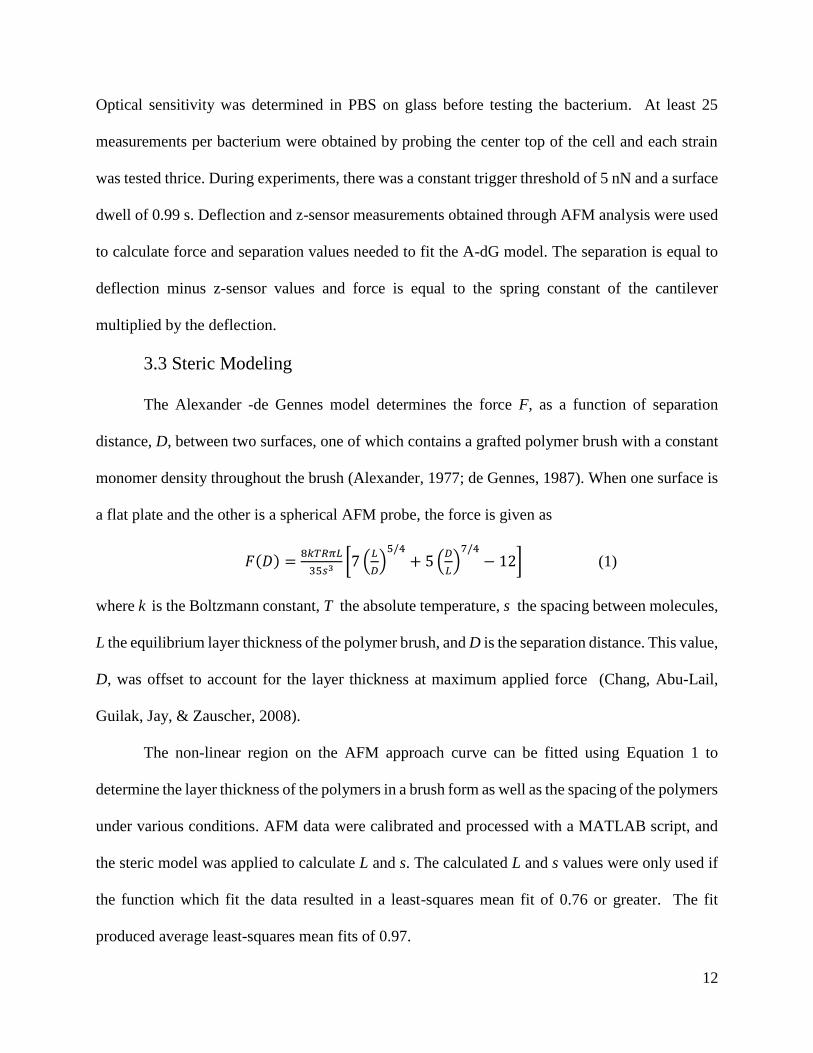
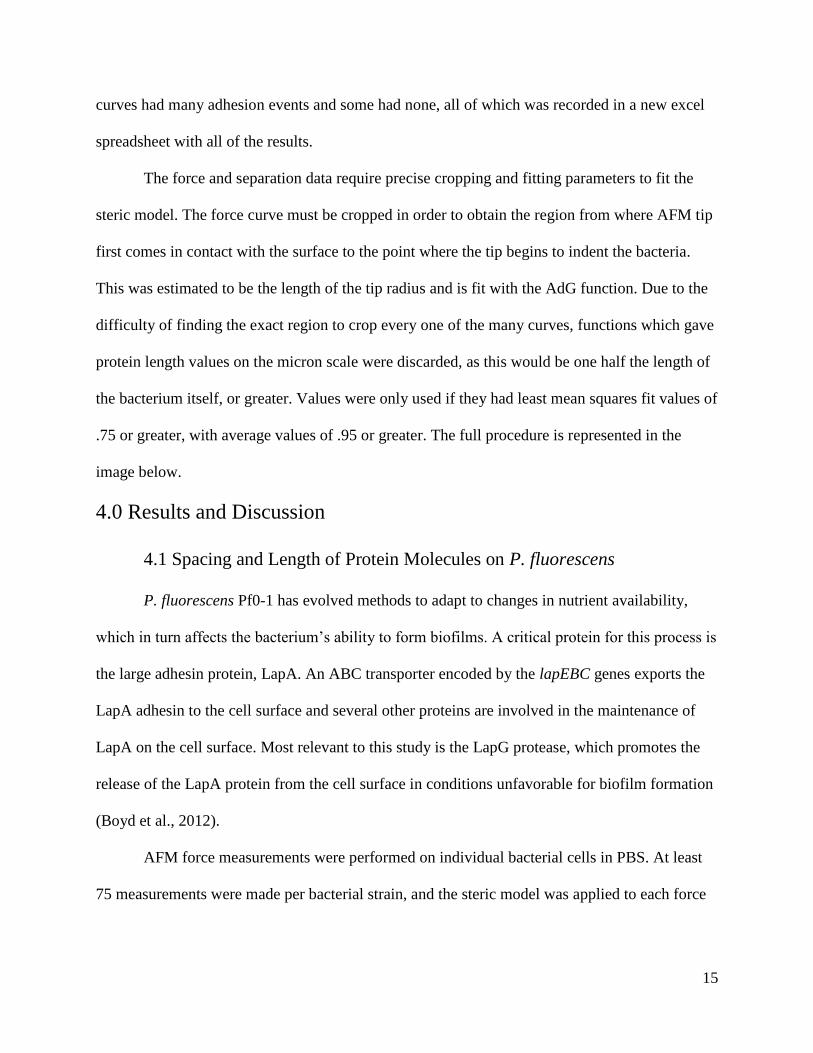
The key parameters obtained from the steric model are the layer thickness, L, and the
spacing between proteins, s. When the equilibrium layer thickness values were calculated, only
the value for the lapG mutant varied from the other strains, with the median L for the lapG
mutant was found to be 279 nm (Figure 2). This value was found to be statistically different from
the other three strains. The L values of the lapA and lapB mutants and wild type were 152 nm,
134 nm, and 134 nm, respectively, all of which were found to be statistically similar. This
indicates that elongated molecules were present on the surface of the lapG mutant compared to
the other three strains.
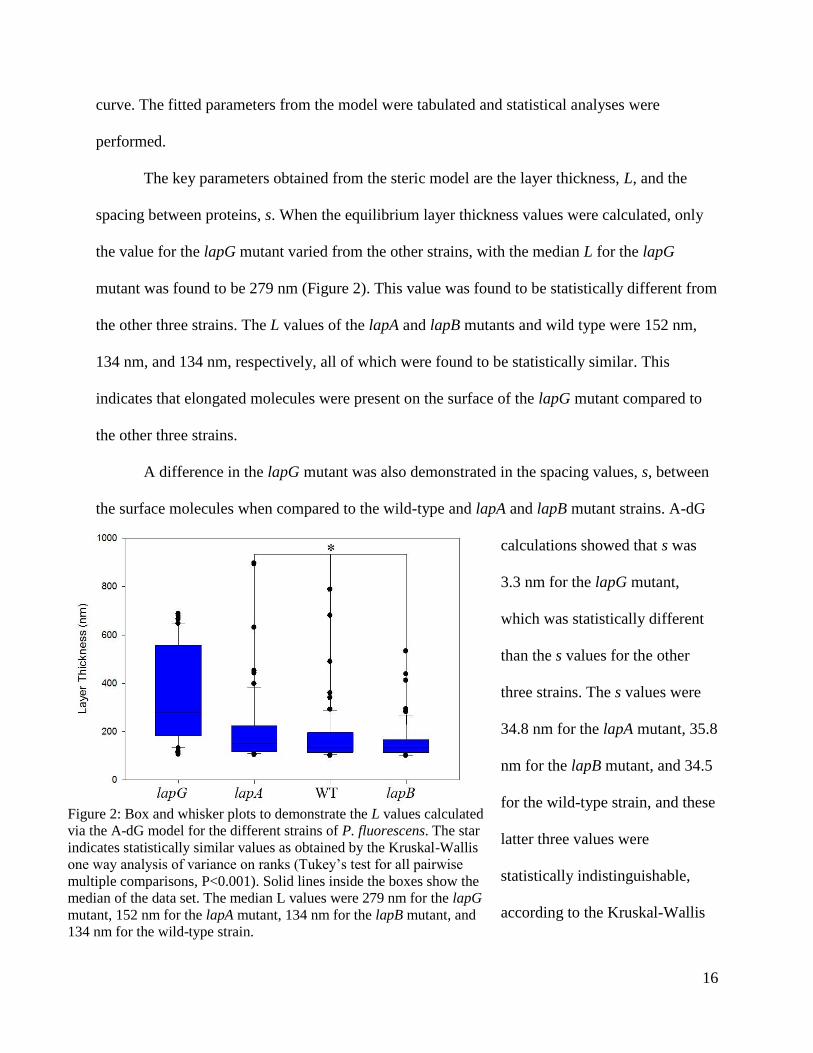
A difference in the lapG mutant was also demonstrated in the spacing values, s, between
the surface molecules when compared to the wild-type and lapA and lapB mutant strains. A-dG
calculations showed that s was
3.3 nm for the lapG mutant,
which was statistically different
than the s values for the other
three strains. The s values were
34.8 nm for the lapA mutant, 35.8
nm for the lapB mutant, and 34.5
for the wild-type strain, and these
latter three values were
statistically indistinguishable,
according to the Kruskal-Wallis
Figure 2: Box and whisker plots to demonstrate the L values calculated
via the A-dG model for the different strains of P. fluorescens. The star
indicates statistically similar values as obtained by the Kruskal-Wallis
one way analysis of variance on ranks (Tukey’s test for all pairwise
multiple comparisons, P<0.001). Solid lines inside the boxes show the
median of the data set. The median L values were 279 nm for the lapG
mutant, 152 nm for the lapA mutant, 134 nm for the lapB mutant, and
134 nm for the wild-type strain.
17
one-way analysis of variance on
ranks (Tukey’s test for all
pairwise multiple comparisons;
Figure 3).
4.2 Polymer Conformation
on the Surface of P.
fluorescens
Variations of the A-dG model
have been used to describe the
molecules on bacterial surfaces in a number of different systems. In the original form of the scaling
laws that were developed, when the surface polymer density was low, polymer height was
independent of the spacing between molecules, and this refers to a “mushroom” like regime for
surface coverage (Alexander, 1977; Dumont, Belmas, & Hess, 2013). However, at higher
coverage, the layer thickness of the polymer begins to scale with the third root of the grafting
density (inversely related to s in Equation 1), and the polymers behave like a “brush”. This
transition from a mushroom to a brush conformation of surface biopolymers can be observed
experimentally, as Wu et al. presented for grafted polyacrylamides (Wu, Efimenko, & Genzer,
2002). When the density of polymers on the surface is great enough, individual molecules may
start to interact with one another, and elongation of the polymer occurs to form a brush layer.
For a given spacing s between polymers, one can calculate the radius of gyration (RGT) of
a polymer that would have a mushroom conformation (which will be identical to that of an isolated
non-interacting polymer). This radius of gyration is calculated by equating s2 to the cross-sectional
Figure 3: Separation values as fit with the A-dG model. The star
represents statistical similarity as calculated by the Kruskal-Wallis
one way analysis on ranks (Tukey’s test for all pairwise multiple
comparisons, P<0.001). The median s value of lapG was 3.3 nm.
The median s values were 34.8 nm, 35.8 nm, and 34.5 nm for
strains lapA and lapB mutants, and the wild-type strain,
respectively.
18
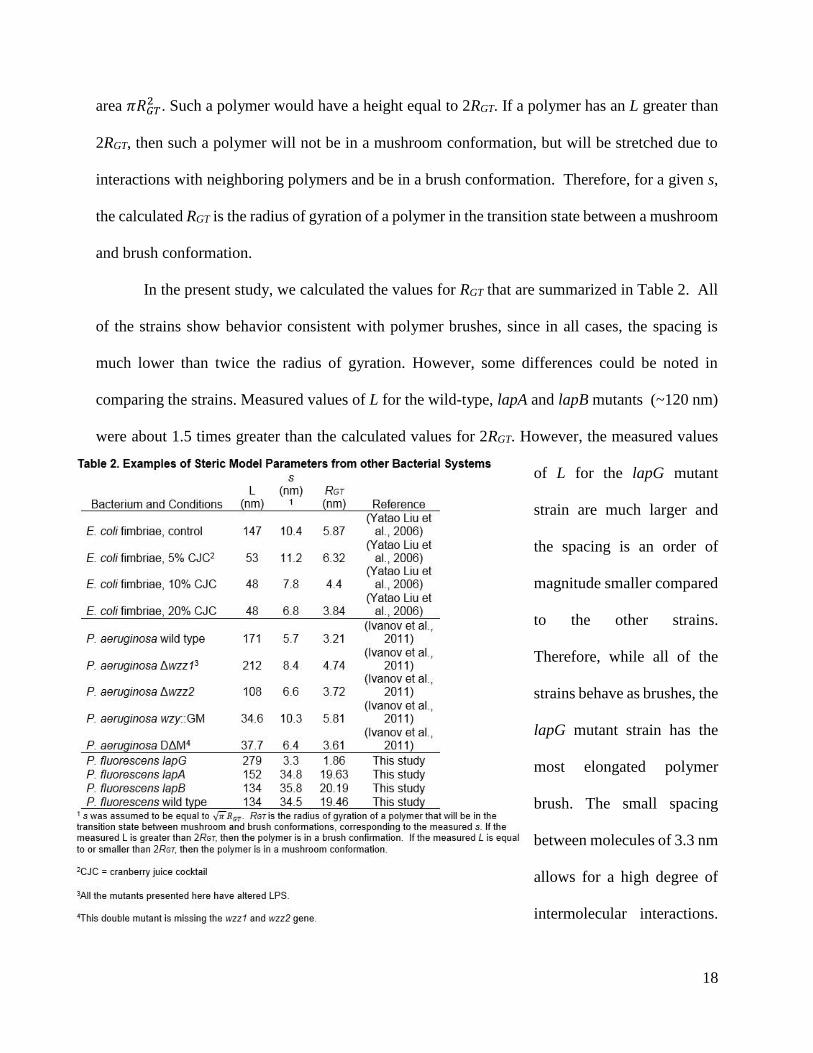
area 𝜋𝑅𝐺𝑇2 . Such a polymer would have a height equal to 2RGT. If a polymer has an L greater than
2RGT, then such a polymer will not be in a mushroom conformation, but will be stretched due to
interactions with neighboring polymers and be in a brush conformation. Therefore, for a given s,
the calculated RGT is the radius of gyration of a polymer in the transition state between a mushroom
and brush conformation.
In the present study, we calculated the values for RGT that are summarized in Table 2. All
of the strains show behavior consistent with polymer brushes, since in all cases, the spacing is
much lower than twice the radius of gyration. However, some differences could be noted in
comparing the strains. Measured values of L for the wild-type, lapA and lapB mutants (~120 nm)
were about 1.5 times greater than the calculated values for 2RGT. However, the measured values
of L for the lapG mutant
strain are much larger and
the spacing is an order of
magnitude smaller compared
to the other strains.
Therefore, while all of the
strains behave as brushes, the
lapG mutant strain has the
most elongated polymer
brush. The small spacing
between molecules of 3.3 nm
allows for a high degree of
intermolecular interactions.
19
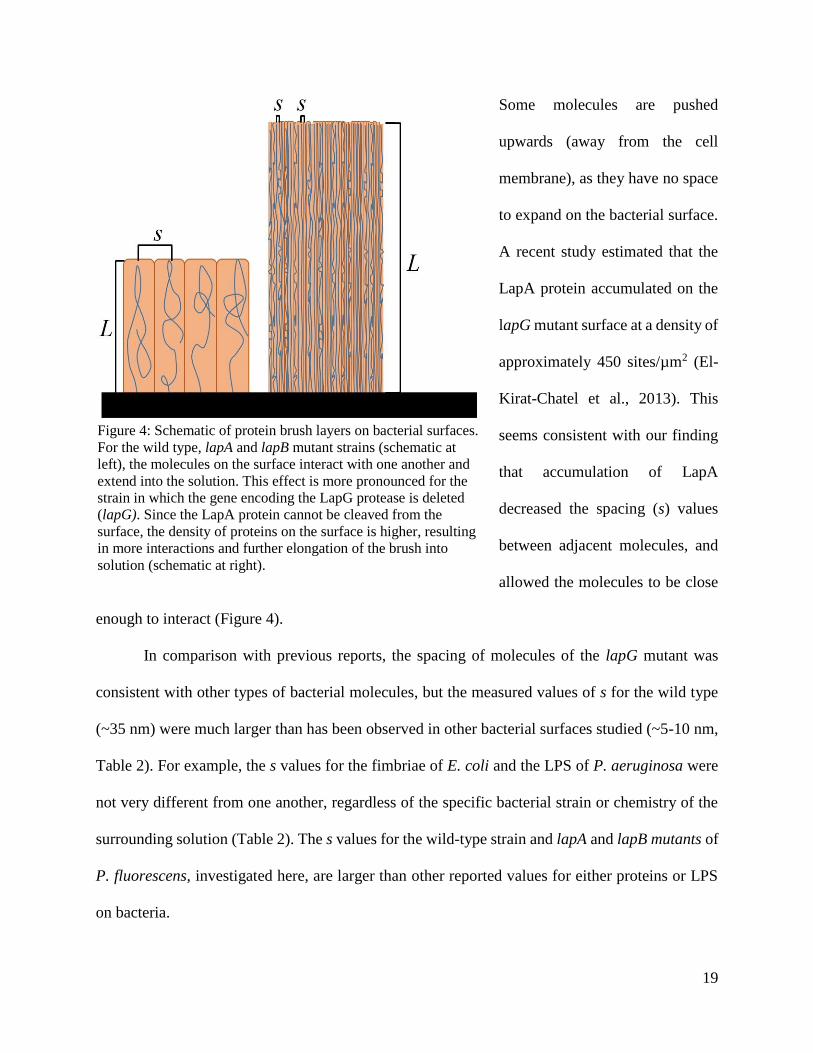
Some molecules are pushed
upwards (away from the cell
membrane), as they have no space
to expand on the bacterial surface.
A recent study estimated that the
LapA protein accumulated on the
lapG mutant surface at a density of
approximately 450 sites/µm2 (El-
Kirat-Chatel et al., 2013). This
seems consistent with our finding
that accumulation of LapA
decreased the spacing (s) values
between adjacent molecules, and
allowed the molecules to be close
enough to interact (Figure 4).
In comparison with previous reports, the spacing of molecules of the lapG mutant was
consistent with other types of bacterial molecules, but the measured values of s for the wild type
(~35 nm) were much larger than has been observed in other bacterial surfaces studied (~5-10 nm,
Table 2). For example, the s values for the fimbriae of E. coli and the LPS of P. aeruginosa were
not very different from one another, regardless of the specific bacterial strain or chemistry of the
surrounding solution (Table 2). The s values for the wild-type strain and lapA and lapB mutants of
P. fluorescens, investigated here, are larger than other reported values for either proteins or LPS
on bacteria.
Figure 4: Schematic of protein brush layers on bacterial surfaces.
For the wild type, lapA and lapB mutant strains (schematic at
left), the molecules on the surface interact with one another and
extend into the solution. This effect is more pronounced for the
strain in which the gene encoding the LapG protease is deleted
(lapG). Since the LapA protein cannot be cleaved from the
surface, the density of proteins on the surface is higher, resulting
in more interactions and further elongation of the brush into
solution (schematic at right).
20
Most of the prior applications of the A-dG model to bacterial surface data interpretation
have focused on flexible polymers, such as extracellular polysaccharides and LPS (Camesano &
Logan, 2000; J. Strauss, N. A. Burnham, & T. A. Camesano, 2009; Taylor & Lower, 2008; Vadillo-
Rodriguez et al., 2004). A few cases have examined proteins on bacterial surfaces, such as the
amyloid fibrils on Escherichia coli, known as curli. Curli fiber equilibrium lengths on E. coli were
reported to be 137 - 373 nm (Oh et al., 2012). The equilibrium length of proteinaceous fimbriae
on E. coli ranged from 125 – 272 nm (Yatao Liu et al., 2006) - comparable to the values measured
for the wild-type strain of P. fluorescens, and the lapA and lapB mutants (~120 nm). Some
additional examples are reviewed in Table 2.
Interpretation of L and s values can be described in terms of physicochemical phenomena.
L can change because of extension or compression. Polymer conformational changes from rigid to
flexible molecules were observed in other studies. For example, when the same bacterium was
exposed to solutions with different ionic strengths, pH, or other changes in solution chemistry, L
varied (Camesano & Logan, 2000; Yatao Liu et al., 2006). Our study did not make use of any
chemical differences, and the electrostatic interactions are expected to be similar among all studied
strains. However, hydrophobic interactions are likely to change because the small spacing of 3.3
nm for the lapG mutant strain, along with the large L value suggest that the protein is packed much
more closely and further extended on the surface. We suggest that when the tertiary structure of
the protein begins to disentangle, more hydrophobic regions are likely to be exposed, consistent
with another recent study that showed evidence of LapA unfolding in the lapG mutant strain, based
on AFM force measurements (El-Kirat-Chatel et al., 2013).
4.3 Relationship of Protein Conformation to Bacterial Adhesion
21
The LapA protein plays a role in bacterial adhesion via fostering surface interactions, a
critical first step in formation of a mature biofilm. Genetic studies first suggested that LapA acts
as an adhesin (Hinsa et al., 2003; Peter D. Newell et al., 2011). In our prior work, we used AFM
to demonstrate that the lapG mutant strain exhibited two-fold greater adhesion than the wild type
as measured by a hydrophilic silicon nitride AFM tip, thus providing supporting evidence of the
role of LapA as a protein adhesin (Ivanov et al., 2011). In the prior study, the mean adhesion
forces were largest for the lapG mutant strain (1.268 nN), and were lower for the wild type as
well as the lapA and lapB mutant strains. The mean adhesion forces for the lapA and lapB strains
were nearly identical, at 0.204 nN and 0.203 nN, respectively. The mean adhesion force of the
wild-type strain (0.272 nN) was significantly higher than for the lapA and lapB strains, but was
much lower than that of the strain lacking the LapG protease.
Recently, adhesion of P. fluorescens Pf0-1 wild-type and lapG mutant strains were
studied using single-molecule force spectroscopy with antibody-specific probes (El-Kirat-Chatel
et al., 2013). Adhesion of the lapG mutant strain was greater than the wild type, regardless of
whether a hydrophobic or hydrophilic AFM tip was used. This finding was attributed to multiple
domains of LapA, which have both hydrophilic and hydrophobic properties. Furthermore,
bacteria over-expressing LapA, and presumably allowing increased interactions among LapA
molecules, also showed a surface that was stiffer and with more elongated polymers compared to
the wild type (El-Kirat-Chatel et al., 2013) . We speculate that the very small spacing observed
between LapA molecules in the lapG mutant strain results in the tertiary structure of the protein
to unfold (El-Kirat-Chatel et al., 2013). When this unfolding occurs, hydrophobic domains begin
to be exposed, perhaps fostering adhesin-adhesin interaction. These interactions may expose
hydrophobic domains or facilitate the formation of supramolecular adhesion complexes, and thus
22
the result is greater adhesion and biofilm formation. Taken together, these results support the
strong role of LapA expression in influencing bacterial polymer conformation, bacterial
adhesion, and biofilm formation.
We expected a higher adhesion force for the wild-type strain than for the lapA and lapB
mutants, because the wild type is still capable of producing LapA. Fluorescence and super-
resolution imaging of the LapA protein, along with AFM studies, clearly demonstrated that there
is LapA on the cell surface, however it is also apparent that there is significantly less LapA on
the cell surface of the wild-type strain when compared to that of the lapG mutant (El-Kirat-
Chatel et al., 2013; Ivanov et al., 2012) . Perhaps for the wild-type strain, the contribution of
LapA on surface properties in masked by LPS and other surface proteins, such as porins and
secretins. It is only when LapA is present at high levels, for example in the lapG mutant or when
the bacteria are forming robust biofilms, that the full contribution of LapA to cell surface
properties can be detected.
5.0 Conclusions AFM experimental results, combined with application of the A-dG steric model, showed
that the LapA protein accumulates and becomes elongated on the surface of P. fluorescens. All
strains behave like classical polymer brushes, while the molecules on the lapG mutant strain are
the most elongated from the bacterial surface. The significantly small spacing observed for the
lapG mutant strain may be due to the partial unfolding of the tertiary conformation of the protein
LapA, exposing its hydrophobic domains and this could possibly be the origin of the observed
high adhesive and strong biofilm-forming characteristics of the lapG mutant strain.
23
References Cited Alexander, S. (1977). Adsorption of chain molecules with a polar head a scaling description. J. Phys.
France, 38(8), 983-987. Bjarnsholt, Thomas. (2013). The role of bacterial biofilms in chronic infections. APMIS, 121, 1-58. doi:
10.1111/apm.12099 Boyd, C. D., Chatterjee, D., Sondermann, H., & O'Toole, G. A. (2012). LapG, Required for Modulating
Biofilm Formation by Pseudomonas fluorescens Pf0-1, Is a Calcium-Dependent Protease. Journal of Bacteriology, 194(16), 4406-4414. doi: Doi 10.1128/Jb.00642-12
Bryers, J. D. (2008). Medical biofilms. Biotechnol Bioeng, 100(1), 1-18. doi: 10.1002/bit.21838 Butt, H.-J., Kappl, M., Mueller, H., Raiteri, R. (1999). Steric forces measured with the atomic force
microscope at various temperatures. Langmuir, 15, 2559-2565. Camesano, T. A., & Logan, B. E. (2000). Probing bacterial electrosteric interactions using atomic force
microscopy. Environmental Science & Technology, 34(16), 3354-3362. Chang, D. P., Abu-Lail, N. I., Guilak, F., Jay, G. D., & Zauscher, S. (2008). Conformational mechanics,
adsorption, and normal force interactions of lubricin and hyaluronic acid on model surfaces. Langmuir, 24(4), 1183-1193. doi: 10.1021/la702366t
Coppadoro, A, Thomas, JG, & Berra, L. (2013). Endotracheal Tube Biofilm and Ventilator-Associated Pneumonia Annual Update in Intensive Care and Emergency Medicine 2013 (pp. 579-587): Springer.
de Gennes, P. G. (1987). Polymers at an interface; a simplified view. Adv. Colloid Interface Sci. , 27(3-4), 189-209.
Dumont, Emmanuel L. P., Belmas, Herve, & Hess, Henry. (2013). Observing the Mushroom-to-Brush Transition for Kinesin Proteins. Langmuir. doi: 10.1021/la4030712
Dunne, W. M., Jr. (2002). Bacterial adhesion: seen any good biofilms lately? Clin Microbiol Rev, 15(2), 155-166.
Dupres, Vincent, Alsteens, David, Andre, Guillaume, & Dufrêne, Yves F. (2010). Microbial nanoscopy: a closer look at microbial cell surfaces. Trends in Microbiology, 18(9), 397-405. doi: http://dx.doi.org/10.1016/j.tim.2010.06.004
El-Kirat-Chatel, Sofiane, Beaussart, Audrey, Boyd, Chelsea D., O’Toole, George A., & Dufrêne, Yves F. (2013). Single-Cell and Single-Molecule Analysis Deciphers the Localization, Adhesion, and Mechanics of the Biofilm Adhesin LapA. ACS Chemical Biology. doi: 10.1021/cb400794e
Friedlander, Ronn S., Vlamakis, Hera, Kim, Philseok, Khan, Mughees, Kolter, Roberto, & Aizenberg, Joanna. (2013). Bacterial flagella explore microscale hummocks and hollows to increase adhesion. Proceedings of the National Academy of Sciences, 110(14), 5624-5629. doi: 10.1073/pnas.1219662110
Harimawan, Ardiyan, Rajasekar, Aruliah, & Ting, Yen-Peng. (2011). Bacteria attachment to surfaces – AFM force spectroscopy and physicochemical analyses. Journal of Colloid and Interface Science, 364(1), 213-218. doi: http://dx.doi.org/10.1016/j.jcis.2011.08.021
Hinsa, Shannon M., Espinosa-Urgel, Manuel, Ramos, Juan L., & O'Toole, George A. (2003). Transition from reversible to irreversible attachment during biofilm formation by Pseudomonas fluorescens WCS365 requires an ABC transporter and a large secreted protein. Molecular Microbiology, 49(4), 905-918. doi: 10.1046/j.1365-2958.2003.03615.x
Ivanov, I. E., Boyd, C. D., Newell, P. D., Schwartz, M. E., Turnbull, L., Johnson, M. S., . . . Camesano, T. A. (2012). Atomic force and super-resolution microscopy support a role for LapA as a cell-surface biofilm adhesin of Pseudomonas fluorescens. Res Microbiol, 163(9-10), 685-691. doi: 10.1016/j.resmic.2012.10.001
24
Ivanov, I. E., Kintz, E. N., Porter, L. A., Goldberg, J. B., Burnham, N. A., & Camesano, T. A. (2011). Relating the physical properties of Pseudomonas aeruginosa lipopolysaccharides to virulence by atomic force microscopy. J Bacteriol, 193(5), 1259-1266. doi: 10.1128/JB.01308-10
Liu, Y., Black, M. A., Caron, L., & Camesano, T. A. (2006). Role of cranberry juice on molecular-scale surface characteristics and adhesion behavior of Escherichia coli. Biotechnol Bioeng, 93(2), 297-305. doi: 10.1002/bit.20675
Liu, Yatao, Black, Matthew A., Caron, Lizabeth, & Camesano, Terri A. (2006). Role of cranberry juice on molecular-scale surface characteristics and adhesion behavior of Escherichia coli. Biotechnology and Bioengineering, 93(2), 297-305. doi: 10.1002/bit.20675
Moore, EdwardR B., Tindall, BrianJ, Santos, VitorA P., Pieper, DietmarH, Ramos, Juan-Luis, & Palleroni, NorbertoJ. (2006). Nonmedical: Pseudomonas. In M. Dworkin, S. Falkow, E. Rosenberg, K.-H. Schleifer & E. Stackebrandt (Eds.), The Prokaryotes (pp. 646-703): Springer New York.
Mulcahy, L. R., Isabella, V. M., & Lewis, K. (2013). Pseudomonas aeruginosa Biofilms in Disease. Microb Ecol. doi: 10.1007/s00248-013-0297-x
Navarro, M. V., Newell, P. D., Krasteva, P. V., Chatterjee, D., Madden, D. R., O'Toole, G. A., & Sondermann, H. (2011). Structural basis for c-di-GMP-mediated inside-out signaling controlling periplasmic proteolysis. PLoS Biol, 9(2), e1000588. doi: 10.1371/journal.pbio.1000588
Newell, P. D., Monds, R. D., & O'Toole, G. A. (2009). LapD is a bis-(3',5')-cyclic dimeric GMP-binding protein that regulates surface attachment by Pseudomonas fluorescens Pf0-1. Proc Natl Acad Sci U S A, 106(9), 3461-3466. doi: 10.1073/pnas.0808933106
Newell, Peter D., Boyd, Chelsea D., Sondermann, Holger, & O'Toole, George A. (2011). A c-di-GMP Effector System Controls Cell Adhesion by Inside-Out Signaling and Surface Protein Cleavage. PLoS Biol, 9(2), e1000587. doi: 10.1371/journal.pbio.1000587
O'Toole, G. A., & Kolter, R. (1998). Initiation of biofilm formation in Pseudomonas fluorescens WCS365 proceeds via multiple, convergent signalling pathways: a genetic analysis. Mol Microbiol, 28(3), 449-461.
O'Toole, G., Kaplan, H. B., & Kolter, R. (2000). Biofilm formation as microbial development. Annual Review of Microbiology, 54, 49-79. doi: DOI 10.1146/annurev.micro.54.1.49
O'Toole, G.A., & Kolter, R. (1998). Initiation of biofilm formation in Pseudomonas fluorescens WCS365 proceeds via multiple, convergent signalling pathways: a genetic analysis. Molecular Microbiology, 28, 449-461.
O'Toole, George A., & Kolter, Roberto. (1998). Initiation of biofilm formation in Pseudomonas fluorescens WCS365 proceeds via multiple, convergent signalling pathways: a genetic analysis. Molecular Microbiology, 28(3), 449-461. doi: 10.1046/j.1365-2958.1998.00797.x
Oh, Y. J., Cui, Y., Kim, H., Li, Y., Hinterdorfer, P., & Park, S. (2012). Characterization of curli A production on living bacterial surfaces by scanning probe microscopy. Biophys J, 103(8), 1666-1671. doi: 10.1016/j.bpj.2012.09.004
Ojha, Anil K., Baughn, Anthony D., Sambandan, Dhinakaran, Hsu, Tsungda, Trivelli, Xavier, Guerardel, Yann, . . . Hatfull, Graham F. (2008). Growth of Mycobacterium tuberculosis biofilms containing free mycolic acids and harbouring drug-tolerant bacteria. Molecular Microbiology, 69(1), 164-174. doi: 10.1111/j.1365-2958.2008.06274.x
Ong, Yea-Ling, Razatos, Anneta, Georgiou, George, & Sharma, Mukul M. (1999). Adhesion Forces between E. coli Bacteria and Biomaterial Surfaces. Langmuir, 15(8), 2719-2725. doi: 10.1021/la981104e
Ozen, A. I., & Ussery, D. W. (2012). Defining the Pseudomonas genus: where do we draw the line with Azotobacter? Microb Ecol, 63(2), 239-248. doi: 10.1007/s00248-011-9914-8
Parsek, Matthew R., & Singh, Pradeep K. (2003). Bacterial biofilms: an emerging link to disease pathogenesis. Annual Review of Microbiology, 57, 677+.
25
Potera, Carol. (2012). Quorum-sensing signal disperses bacteria from biofilms. Environmental Health Perspectives, 120, A420.
Pranzetti, Alice, Mieszkin, Sophie, Iqbal, Parvez, Rawson, Frankie J., Callow, Maureen E., Callow, James A., . . . Mendes, Paula M. (2013). An Electrically Reversible Switchable Surface to Control and Study Early Bacterial Adhesion Dynamics in Real-Time. Advanced Materials, 25(15), 2181-2185. doi: 10.1002/adma.201204880
Rijnaarts, Huub H. M., Norde, Willem, Bouwer, Edward J., Lyklema, Johannes, & Zehnder, Alexander J. B. (1995). Reversibility and mechanism of bacterial adhesion. Colloids and Surfaces B: Biointerfaces, 4(1), 5-22. doi: http://dx.doi.org/10.1016/0927-7765(94)01146-V
Schaer-Zammaretti, Prisca, & Ubbink, Job. (2003). Imaging of lactic acid bacteria with AFM—elasticity and adhesion maps and their relationship to biological and structural data. Ultramicroscopy, 97(1–4), 199-208. doi: http://dx.doi.org/10.1016/S0304-3991(03)00044-5
Schinabeck, M. K., Long, L. A., Hossain, M. A., Chandra, J., Mukherjee, P. K., Mohamed, S., & Ghannoum, M. A. (2004). Rabbit model of Candida albicans biofilm infection: liposomal amphotericin B antifungal lock therapy. Antimicrob Agents Chemother, 48(5), 1727-1732.
Strauss, J., Burnham, N. A., & Camesano, T. A. (2009). Atomic force microscopy study of the role of LPS O-antigen on adhesion of E. coli. J Mol Recognit, 22(5), 347-355.
Strauss, Joshua, Burnham, Nancy A., & Camesano, Terri A. (2009). Atomic force microscopy study of the role of LPS O-antigen on adhesion of E. coli. Journal of Molecular Recognition, 22(5), 347-355. doi: 10.1002/jmr.955
Taylor, E. S., & Lower, S. K. (2008). Thickness and surface density of extracellular polymers on Acidithiobacillus ferrooxidans. Appl Environ Microbiol, 74(1), 309-311. doi: 10.1128/AEM.01904-07
Tripathi, Prachi, Beaussart, Audrey, Alsteens, David, Dupres, Vincent, Claes, Ingmar, von Ossowski, Ingemar, . . . Dufrêne, Yves F. (2013). Adhesion and Nanomechanics of Pili from the Probiotic Lactobacillus rhamnosus GG. ACS Nano, 7(4), 3685-3697. doi: 10.1021/nn400705u
Vadillo-Rodriguez, V., Busscher, H. J., Norde, W., de Vries, J., Dijkstra, R. J. B., Stokroos, I., & van der Mei, H. C. (2004). Comparison of atomic force microscopy interaction forces between bacteria and silicon nitride substrata for three commonly used immobilization methods. Applied and Environmental Microbiology, 70(9), 5541-5546.
Wu, Tao, Efimenko, Kirill, & Genzer, Jan. (2002). Combinatorial Study of the Mushroom-to-Brush Crossover in Surface Anchored Polyacrylamide. Journal of the American Chemical Society, 124(32), 9394-9395. doi: 10.1021/ja027412n


![A Pseudomonas fluorescens type 6 secretion system is ...cens strains produce alginate or neutral and amino sugars which give a mucoid phenotype [28,29]. The P. fluorescens mucoid phenotype,](https://img.pdfslide.us/doc/110x75/6116bce58661033878375cf9/a-pseudomonas-fluorescens-type-6-secretion-system-is-cens-strains-produce-alginate.jpg)