Embed Size (px)
Citation preview
Journ
alof
Cell
Scie
nce
Probing cellular processes by long-term live imaging –historic problems and current solutions
Daniel L. Coutu and Timm Schroeder*ETH Zurich, Department of Biosystems Science and Engineering, 4058 Basel, Switzerland
*Author for correspondence ([email protected])
Journal of Cell Science 126, 1–11� 2013. Published by The Company of Biologists Ltddoi: 10.1242/jcs.118349
SummaryLiving organisms, tissues, cells and molecules are highly dynamic. The importance of their continuous and long-term observation has
been recognized for over a century but has been limited by technological hurdles. Improvements in imaging technologies, genetics,protein engineering and data analysis have more recently allowed us to answer long-standing questions in biology using quantitativecontinuous long-term imaging. This requires a multidisciplinary collaboration between scientists of various backgrounds: biologists
asking relevant questions, imaging specialists and engineers developing hardware, and informaticians and mathematicians developingsoftware for data acquisition, analysis and computational modeling. Despite recent improvements, there are still obstacles to beaddressed before this technology can achieve its full potential. This Commentary aims at providing an overview of currently availabletechnologies for quantitative continuous long-term single-cell imaging, their limitations and what is required to bring this field to the
next level. We provide an historical perspective on the development of this technology and discuss key issues in time-lapse imaging:keeping cells alive, using labels, reporters and biosensors, and hardware and software requirements. We highlight crucial and often non-obvious problems for researchers venturing into the field and hope to inspire experts in the field and from related disciplines to
contribute to future solutions.
Key words: Biosensors, Fluorescence, Hardware, Single-cell imaging, Software, Time-lapse microscopy
IntroductionOrganisms are composed of vast numbers of different molecules
and cells that interact spatially and temporally. Researchers have
access to a wide array of molecular and cellular assays to unravel
these interactions (see examples in Fig. 1). However, most
techniques are not sensitive enough to detect rare or transient
events. Moreover, these assays are typically designed to look at
cells or molecules at single time points and the complexity of
highly dynamic processes can hardly be captured by such
snapshot analyses (Kokkaliaris et al., 2012; Landecker, 2009;
Schroeder, 2008; Schroeder, 2011).
The necessity for continuous observation of biological
processes has long been recognized and can be traced back to
the works of pioneers such as Antonie van Leeuwenhoek (17th
century). van Leeuwenhoek used microscopes to look at
capillaries in living rabbit ears where he observed blood flow
and suggested that blood circulation is a closed system (Dunn and
Jones, 2004; Frischknecht et al., 2009). The development of
photography, microcinematography, fluorescence microscopy,
cell and tissue culture and other techniques in the 19th and 20th
centuries then made it possible to observe molecules in living
cells and organisms continuously over long periods. This has
been reflected by an almost exponential rise in studies using
time-lapse imaging in the recent scientific literature, which spans
most of the natural science fields. However, and although time-
lapse imaging is conceptually simple, researchers today still face
some of the same technical hurdles as they did in the early 1900s
when trying to continuously monitor living specimens over
extended periods of time.
The development of time-lapse microscopy was mainly fuelled
by experimental needs from embryologists and developmental
biologists who pioneered lineage tracing and fate mapping
experiments. Interestingly, the embryologists and stem cell
researchers of today still require such techniques to answer
long-standing biological questions. For instance, time-lapse
imaging has been successfully used to identify the asymmetric
self-renewing division mechanism of muscle satellite cells
(Kuang et al., 2007), to prove the existence of hemogenic
endothelium (Bertrand et al., 2010; Eilken et al., 2009; Kissa and
Herbomel, 2010), to demonstrate lineage instruction by cytokines
(Rieger et al., 2009), to investigate the mechanisms of germ layer
formation during gastrulation (Burtscher and Lickert, 2009), to
study neural stem cells and neurogenesis (Asami et al., 2011;
Costa et al., 2008; Costa et al., 2009; Costa et al., 2011), and
immunology (Henrickson et al., 2008; Junt et al., 2007; Sung
et al., 2012), to name a few.
Time-lapse microscopy is a multidisciplinary technique that
has been developed through the interactions between mechanical
engineers, chemists, physicists, biologists and, more recently,
computer scientists. The aim of this Commentary is to point out
some of the crucial points when designing time-lapse imaging
experiments for specific questions. Excellent reviews and online
resources already exist on transmitted light microscopy,
fluorescence microscopy, confocal and multiphoton microscopy
and live-cell imaging (Herman, 2002; Lichtman and Conchello,
2005; Piston, 1999; Stephens and Allan, 2003; Frigault et al.,
2009) and a basic knowledge about these techniques is expected.
For these reasons, we aim here to complement the literature
ARTICLE SERIES: Imaging Commentary 1
JCS Advance Online Article. Posted on 13 August 2013
Journ
alof
Cell
Scie
nce
by focusing on probing cellular processes using long-term
continuous single-cell imaging with an emphasis on stem cell
biology. Nevertheless, the concepts discussed here can be applied
to any cell population.
Unfortunately, and in contrast to what users venturing into the
field of long-term time-lapse microscopy would like to hear,
there is no single best way of how to do it right. Depending on the
specific question at hand and available materials (biological and
hardware), the multitude of involved parameters will typically
have to be adjusted to find the perfect compromise for each
project (Schroeder, 2011). We will thus focus on discussing
potential problems at the different steps involved in time-lapse
microscopy, including those the user will realize only long afterhaving committed to this approach, and their potential solutions.However, it is important to point out that there is no singleapproach available that suits all experiments, and users have to be
prepared to optimize the perfect combination of settings for eachnew question and cell type. Even in laboratories that specialize inthese approaches, and continuously incorporate the latest hard-
and software, each new project requires several rounds ofoptimizing settings and strategy.
Time-lapse microscopy – a historical perspectiveThe need for continuous observation of life
In the late 19th century, embryology pioneers such as Charles
Whitman, Edmund Wilson and E. G. Conklin looked at how earlydevelopment proceeded from a single fertilized egg to a complexorganism (Stent and Weisblat, 1985; Stern and Fraser, 2001).
These scientists used simple organisms, such as fresh waterleeches (Clepsine sp.), nematodes (Caenorhabditis elegans) andmarine filter feeders (tunicates) because their development was
rapid, spanning only a few hours. More complex organisms takelonger to develop and were difficult to keep alive under themicroscope for long enough. Moreover, it was easy to recreatethe native environment of the organisms using fresh or sea water
(Whitman, 1878). Microscopes were fitted with a drawing tubethat projected the image onto paper, which facilitated manualdrawing of the image by the observer (Paddock, 2001). This
method was limited by the observer’s bias and artistic skills.Nevertheless, the seminal studies by those scientists were the firstlineage-tracing experiments. Around the same time, and a few
years before the invention of cinematography by the Lumierebrothers, Etienne-Jules Marey was using his chronophotographicgun to study physiology and more specifically animal movement
such as the flight of birds (Landecker, 2006). He founded theMarey Institute with the goal to manufacture and standardizeinstruments, as an attempt to make physiology an exact science.Although there have been many technical improvements since
(Box 1), most core components of microscopes, and the problemsassociated with long-term live imaging, have remainedsurprisingly similar over the century.
How to keep your cells healthy for continuousimagingIn order to perform long-term time-lapse imaging of mammaliancells, the most critical parameter is to keep cells alive and
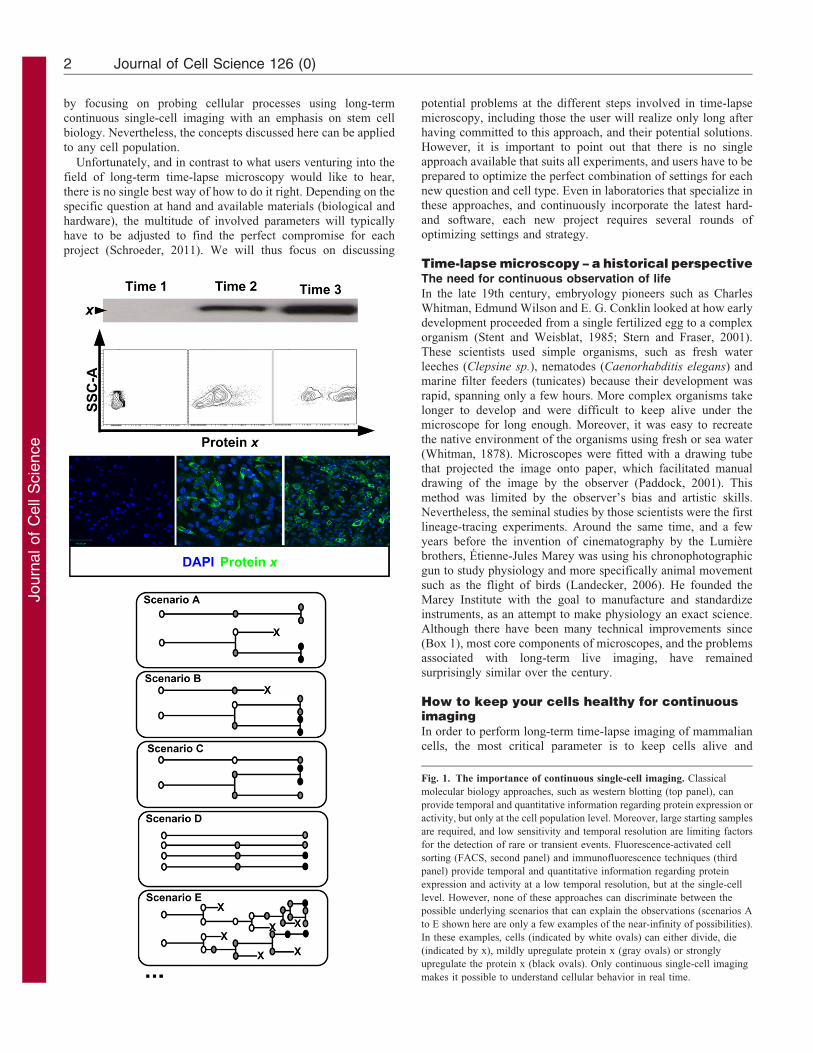
Fig. 1. The importance of continuous single-cell imaging. Classical
molecular biology approaches, such as western blotting (top panel), can
provide temporal and quantitative information regarding protein expression or
activity, but only at the cell population level. Moreover, large starting samples
are required, and low sensitivity and temporal resolution are limiting factors
for the detection of rare or transient events. Fluorescence-activated cell
sorting (FACS, second panel) and immunofluorescence techniques (third
panel) provide temporal and quantitative information regarding protein
expression and activity at a low temporal resolution, but at the single-cell
level. However, none of these approaches can discriminate between the
possible underlying scenarios that can explain the observations (scenarios A
to E shown here are only a few examples of the near-infinity of possibilities).
In these examples, cells (indicated by white ovals) can either divide, die
(indicated by x), mildly upregulate protein x (gray ovals) or strongly
upregulate the protein x (black ovals). Only continuous single-cell imaging
makes it possible to understand cellular behavior in real time.
Journal of Cell Science 126 (0)2
Journ
alof
Cell
Scie
nce
normal, that is to recreate as closely as possible their nativeenvironment. From the seminal work of Harry Eagle and othershalf of a century ago (see below), most biologists have a good
knowledge of what cells require when they are placed in culture:an appropriate culture medium supplying nutrients to the cells,temperature and pH control, oxygen and CO2 supply, as well as
maintenance of osmolarity. For time-lapse imaging, otherimportant factors are to reduce evaporation and phototoxicity toa minimum. In this section, we will discuss various means of how
to maintain optimal conditions long-term under the imagingsetup.
Culture media, CO2 and buffering systemsNearly all media are bicarbonate-based and require CO2 atconcentrations higher than atmospheric conditions to maintain a
physiological pH. The role of CO2 in cell culture extends beyondpH maintenance, as it is also required for many cellular processesincluding glucose metabolism and proper functioning of ion and
acid–base transporters (Bonarius et al., 1995; Kanaan et al.,2007). Most cell cultures today are maintained in humidified37 C incubators that are supplied with 5% CO2. However,
constant gas exchange in incubation chambers can lead to quick
evaporation of culture medium. Removal of the cells from theincubator results in rapid changes in pH that can adversely affectthe cells, even in the presence of bicarbonate. To avoid this, other
buffering agents can be used. The most common is HEPES [4-(2-hydroxyethyl)-1-piperazineethanesulfonic acid] at 25 mM, but asdemonstrated by Eagle, many other buffers can be used and arenon-toxic to most cell lines (Eagle, 1971). For primary cells,
however, each investigator should carefully test these buffers forside effects on their favorite cells types. Phenol Red is typicallyincluded to monitor pH changes in culture medium but should be
avoided in fluorescence time-lapse microscopy owing to itsfluorescent properties in the blue–yellow spectrum.
While running a time-lapse experiment, the easiest way tomaintain pH it to use a microscope equipped with an incubator
for which both temperature and CO2 can be adjusted andmonitored. A simple alternative is to saturate the culture mediumwith CO2 and use sealed incubation chambers. Although not
optimal for long-term imaging, which, depending on cell type, istypically longer than 4 days, this approach can be used when afew cells are being analyzed to generate data from single cells,
such as in a rare stem cell population. It must also be noted thatmost tissue culture plastic vessels are gas permeable and thatsome leakiness is to be expected. Because a large volume of
medium is required, ways to limit cells movement (thus limitingthe surface that needs to be covered by the microscope) need tobe designed, such as creating extracellular matrix protein islandsonto which cells adhere (Ravin et al., 2008), placing agarose,
hydrogel or silicone microwells (Gilbert et al., 2010; Lutolf et al.,2009a; Dykstra et al., 2006) in a larger well, or by use ofmicrofluidic devices (Lecault et al., 2011; Tay et al., 2010;
Taylor et al., 2009). The use of large volumes of medium avoidsevaporation issues and the need for a perfusion apparatus torefresh the medium continuously or periodically, but can
contribute to increased noise in fluorescence imaging.Evaporation changes the osmolarity and concentration of themedium components and is a problem in particular for very small
wells. This is especially true for large incubation chambers thatcannot be humidified to prevent damage to oxidation-sensitivemicroscope parts. Again, the use of sealed chambers, largevolumes of medium or covering the medium with water-vapor-
impermeable liquids (e.g. mineral oil) can be considered. Addingfluorocarbon oil to the medium to provide oxygen to the cellswhile removing excess CO2 (Sluder et al., 2007) should be
thoroughly tested on relevant cells before use. Commercial mediasuch as Leibovitz’s L-15 medium are also available that allowcell survival in atmospheric CO2 levels. However, in our hands
these media allow long-term primary bone marrow cell survivalin atmospheric air but without sustaining cell proliferation, evenwhen supplemented with HEPES and/or sodium bicarbonate(unpublished observations).
Phototoxicity
Phototoxicity is as major concern in long-term imaging.Although seemingly obvious, it is important to point out that
low-quality images of healthy cells are preferable over high-quality images of dying cells (Schroeder, 2011).
Phototoxicity is mainly caused by short-wavelength light that
reacts with cellular components or experimentally added dyes(Pattison and Davies, 2006). This results in the production ofreactive oxygen species and free radicals, and DNA damage
Box 1. Microcinematography – time-lapse imagingfrom its analog birth to its digital present
The first reported microcinematography device was assembled
by Marey and Lucien Bull in 1891 (Talbot, 1913). Several
improvements were implemented during the next decade by Bull,
James Williamson, Edmund J. Spitta and Antoine Pizon. These
modifications had the aim of reducing vibrations (using heavy oak
tables), improving contrast (by use of contrasting agents), keeping
the specimens alive by reducing heat from illumination sources
(through the use of lamps, shutters and filters). They also used
perfusion to refresh culture medium. Amazingly, these technical
hurdles are still at the heart of running a successful time-lapse
imaging experiment today.
The first published time-lapse microscopy movies were
produced at the Marey Institute by Pizon (Pizon, 1905) who
studied colony formation in the tunicate Botryllus. His first movie
represented 775 images taken at three images per hour, thus
spanning nearly 11 days. In 1908, Ries studied the fertilization and
early development of sea urchins (Ries, 1909). Almost
simultaneously, Chevroton and Vles were achieving the same at
the French marine biology station of Rostoff (Chevroton and Vles,
1909). Unfortunately, none of these early time-lapse microscopy
movies have survived to this day. The earliest movies still available
are at the Pasteur Institute in Paris and were taken by Jean
Comandon, who mounted a camera on a microscope to study
syphilis-causing bacteria (Spirochaetes) (Breithaupt, 2002;
Comandon, 1909; Frischknecht et al., 2009). To view
Comandon’s first movie, see supplementary movie 1 in Roux et
al. (Roux et al., 2004).
At the time of Pizon, Ries and Comandon, 35- or 16-mm film
cameras were used for micro-cinematography. Exposure times
had to be carefully monitored, film loss in failed experiments was
expensive and there were long waiting times before data could be
analyzed. Ways to transform optical images into electrical signals
have been developed since 1873 but only in 1934 did Zworykin
invent the first practical video camera (Inoue and Spring, 1997).
35- or 16-mm cameras remained the method of choice until the
1980s when they were largely replaced by monochrome video
cameras (Fink, 2011). Today, microscopes are equipped with
digital cameras (Hiraoka et al., 1987).
Long-term single-cell imaging 3
Journ
alof
Cell
Scie
nce
(Dixit and Cyr, 2003; Godley et al., 2005; Grzelak et al., 2001).
The most straightforward way to circumvent these issues is byminimizing illumination. Transmitted light images can berecorded at high temporal resolution to allow tracking of cells.
Fluorescence illumination should be used only when necessary,at low frequency and for low exposure times. Decreasingexcitation intensity and extending exposure times can be
helpful to reduce toxicity. At any time, the use of UV-excitabledyes should be avoided as much as possible, and red or far-reddyes should be preferred over green, yellow and blue ones.Furthermore, sensitive cameras and fast shutters should be used.
Shutter-free systems (e.g. with fast switchable LED excitation)can drastically reduce toxicity and improve temporal resolution,but commercial systems to be used off-the-shelf for the typical
biology user have not yet been developed.
Mimicking the in vivo microenvironment
One important caveat of in vitro imaging is the nearimpossibility to recreate the in vivo microenvironment of thecell type studied. Cells in normal tissues require a combination
of heterotypic cell interactions, paracrine and endocrine signals,adhesive cues from the extracellular matrix, signals from bloodvessels and neural stimulation, among others, most of which are
not fully understood. Many cell types do not behave normallywhen sorted to homogeneity and require interactions with othercell types. This can prove problematic when trying to generatesingle-cell data. The use of cell-type-specific reporters or
genetically encoded labels can greatly facilitate thediscrimination of the stem cells and their progeny from thesurrounding supporting cells. It is also possible to isolate the
cells of interest from a mouse line expressing a fluorescentprotein under a ubiquitous promoter and co-culturing them onnon-fluorescent feeder cells.
Recently, the bioengineering of artificial microenvironmentsrecapitulating the in vivo cellular niches of cells has muchimproved (Discher et al., 2009; Gobaa et al., 2011; Lin et al.,
2012; Lutolf et al., 2009b). These strategies are very promisingbut are typically not commercially available and remain difficultto integrate with long-term continuous imaging by typical users.
In the following section, we will describe in more detailsvarious approaches to label cells for continuous single-cellimaging as well as to probe cellular process non-invasively intime-lapse microscopy.
Tracking, probing and manipulating cellularprocesses continuouslyConcurrent with the nearly exponential increase in the use oftime-lapse imaging over the last two decades, many techniqueshave been developed or adapted to visualize, analyze and
manipulate living cells and molecules non-invasively. In thissection, we will discuss the main approaches used to visualizecells, molecules and organelles continuously in living cell as well
as methods used to analyze and manipulate molecularmachineries in real-time.
Fluorescent dyesThere is a wide variety of commercially available dyes that stainplasma membranes and thus allow the experimental tracking of
cells; PKH26, PKH67, CFSE and wheat germ agglutinin are goodexamples. The fluorescent carbodiimide dyes also come indifferent colors. These stable dyes are easy to use but are diluted
at each cell division, making them sub-optimal for long-termimaging of proliferating cells. Depending on the initial cell size,
they are typically diluted below detectable levels after four toeight cell divisions. There are also a variety of organelle-specificfluorescent dyes that can be used for live cell imaging and to
assess the subcellular localization of a protein. These dyes arespecific for endoplasmic reticulum (glibenclamide), Golgi(ceramide), lysosomes (dyes that become fluorescent in acidicconditions) and mitochondria, but these are also gradually diluted
with cell divisions. As some of these dyes can affect cell behaviorand metabolism, any potential effects on specific cell types haveto be carefully excluded before their use.
Labeling cell nuclei can also facilitate manual and automatedtracking of single cells. The DNA-staining agent Hoechst 33342dye can be used; however, since it requires excitation in the near-
UV it should be avoided. Other commercially available dyes,such as SYTO dyes and DRAQ5, are preferable, but in our handshave also proven cytotoxic in primary skeletal and marrow cells
(mesenchymal and hematopoietic stem/progenitor cells) andembryonic stem cells (unpublished observations). For thesereasons, the use of nuclear fluorescent proteins is preferable.
It is also possible to take advantage of the characteristics ofcertain cell types to label and track them. For instance,fluorescent-label-conjugated plant lectins or acetylated low-
density lipoproteins can be used to visualize endothelial cellsand/or macrophages (Eilken et al., 2009). Furthermore, anotheruseful dye for time-lapse microscopy is calcein acetoxymethyl
ester (calcein-AM). This non-fluorescent membrane-permeablecompound is modified in living cells by intracellular esterases,resulting in a green fluorescent product that becomes trapped inthe cytoplasm. Calcein-AM is thus useful not only as a tracking
dye but also to monitor cell viability during live imaging.
Finally, a simple, inexpensive and versatile way to detect cell
surface proteins on live cells is to use antibodies, similar to innormal flow cytometry or immunofluorescence staining (Eilkenet al., 2009). However, because antibodies can either block oractivate their targets, their use must be carefully controlled to not
influence cellular behavior (Eilken et al., 2010).
Fluorescent proteins and fusions
Prasher and colleagues (Prasher et al., 1992) reported the cloningof green fluorescent protein (GFP) from Aequorea victoria,
which was first purified and characterized some 30 years beforeby Shimomura and colleagues (Shimomura et al., 1962) and thenexpressed in heterologous organisms (Chalfie et al., 1994). In
1987, the laboratory of Martin Evans in Cambridge created thefirst genetically modified mouse line (Kuehn et al., 1987),leading to innumerable reporter mouse models that have been ofgreat use in live-cell imaging. The derivation of GFP variants of
different colors (Ai et al., 2007; Cubitt et al., 1995; Heim andTsien, 1996; Zhang et al., 2002) allows simultaneous labeling ofproteins, cells and even whole organisms with genetically
encoded fluorescent tags. Most of these proteins have beenextensively modified using targeted mutagenesis to optimizetheir color, brightness, maturation temperature and speed, and pH
sensitivity, among others (Kremers et al., 2011). A recent review(Newman et al., 2011) provides a non-exhaustive list of 76fluorescent proteins covering the entire visible spectrum (near-
UV, cyan, green, yellow, orange, red and far-red).Photoconvertible and photoactivatable fluorescent proteins arealso available (Bancaud et al., 2010). An exhaustive discussion of
Journal of Cell Science 126 (0)4
Journ
alof
Cell
Scie
nce
all these fluorescent proteins and their properties in beyond the
scope of this Commentary, but excellent recent reviews exist on
the subject (see above mentioned reviews and Lippincott-
Schwartz and Patterson, 2003; Muller-Taubenberger and
Anderson, 2007; Zhang et al., 2002). We will here discuss a
number of ways in which fluorescent proteins can be used in
time-lapse microscopy.
The choice of an appropriate fluorescent protein usually
depends primarily on its excitation and emission spectra, but
other important parameters include its brightness (molar extinction
coefficient and quantum yield; the efficiency of a fluorophore to
absorb and emit light, respectively), half-life, sensitivity to
photobleaching, maturation speed, tendency to form aggregates
(which might increase cytotoxicity) and usefulness in fusion
proteins (whether it renders its fusion partner non-functional,
affects its subcellular localization or modifies its half-life). There
are now a wide variety of mouse lines available that express
various fluorescent proteins either ubiquitously or in specific cell
types. Alternatively, fluorescent proteins can be delivered through,
for example, viral transduction. These genetically encoded labels
are inherited by all progeny and are thus superior to vital dyes for
long-term imaging of proliferating cells.
One important caveat in the use of the currently existing
fluorescent proteins is their broad excitation and emission
spectra. This usually causes significant bleed-through of
fluorescent signals in channels that could be used for additional
reporters or dyes. Although combinations of five or six
fluorescent proteins are possible (e.g. Kremers et al., 2011),
this is difficult to apply to long-term imaging (and remaining
bleed-through can require spectral linear unmixing). To
simultaneously image multiple reporters in single cells using a
more conventional technology, fluorescent proteins can be
targeted to distinct subcellular localizations. For instance,
fluorescent proteins can be targeted to the nucleus, nuclear
membrane, Golgi, mitochondria and chromatin by the addition of
peptide sequences (see Table 1; Fig. 2). This allows the
experimental discrimination between different reporters on the
basis of their location rather than their spectral properties. This
approach can be useful to minimize phototoxicity, since two
reporters can be viewed simultaneously in the same channel, thus
reducing repeated light exposure.
Biosensors
Many cellular processes rely on intracellular biochemical
changes (for instance kinase activity during signaling pathway
activation) that cannot be monitored using simple fluorescent
protein reporters. Several biosensors have been created to probe
these processes. Biosensors use fluorescent proteins and typically
fall into three categories: those based on intensity, localization
(or translocation) or Foerster resonance energy transfer (FRET).
Biosensors already exist that monitor a number of cellular
processes: promoter or protein dynamics; lipid dynamics [e.g.
PtdIns(3,4,5)P3, diacylglycerol (DAG) and phosphatidylserine];
halide, zinc and Ca2+ ion fluctuations; intracellular pH; redox
status; cAMP and cGMP concentrations; nitric oxide (NO)
production; presence of reactive oxygen species; ATP
concentration and ATP:ADP ratio; glutamate and sugar
concentrations; membrane potential; small G-protein
activation; kinase activation and activity; phosphatase and
protease activity; O-glycosylation; histone acetylation and
methylation; cell cycle status; actin cytoskeleton dynamics;
and mechanical strain. An exhaustive description of all these
biosensors is beyond the scope of this Commentary but the
interested reader should consult recent reviews (e.g. Newman
et al., 2011; Endele and Schroeder, 2012; Aoki et al., 2012, and
references therein). A potential pitfall associated with the use of
some biosensors is the fact that they can saturate binding sites
for the endogenous targets and thus affect the cellular processes
under study (Haugh, 2012). In addition, FRET-based biosensors
are difficult to deliver to primary cells by lentiviral transduction
owing to the propensity for recombination between the two
FRET partners (typically CFP and YFP) during reverse
transcription (Aoki et al., 2012).
Once a biological question that requires long-term continuous
imaging has been posed and the relevant cells, reporters and cell
culture methods have been identified, the next obvious
requirement is the choice of the appropriate image acquisition
hardware. Frigault et al. provide a flow chart to help choose the
appropriate imaging modality for various experimental needs
(Frigault et al., 2009), and this will not be discussed here.
Similarly, we have already discussed various incubation
apparatuses to keep cells alive on the imaging setup. In the
next section we will focus on microscope components and
computer requirements for long-term continuous imaging.
Imaging of your favorite cells – hardwarerequirementsVarious techniques have been described for in vivo three-
dimensional imaging of living cells, including magnetic
resonance imaging, confocal and multiphoton microscopy and
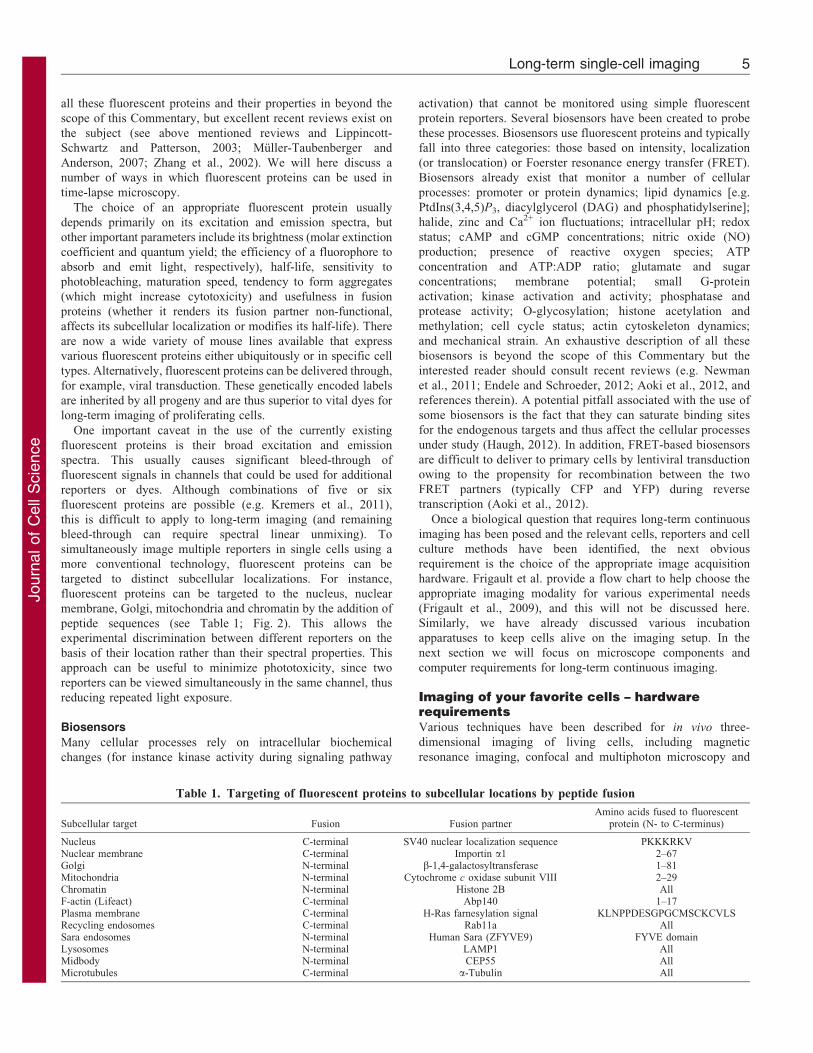
Table 1. Targeting of fluorescent proteins to subcellular locations by peptide fusion
Subcellular target Fusion Fusion partnerAmino acids fused to fluorescent
protein (N- to C-terminus)
Nucleus C-terminal SV40 nuclear localization sequence PKKKRKVNuclear membrane C-terminal Importin a1 2–67Golgi N-terminal b-1,4-galactosyltransferase 1–81Mitochondria N-terminal Cytochrome c oxidase subunit VIII 2–29Chromatin N-terminal Histone 2B AllF-actin (Lifeact) C-terminal Abp140 1–17Plasma membrane C-terminal H-Ras farnesylation signal KLNPPDESGPGCMSCKCVLSRecycling endosomes C-terminal Rab11a AllSara endosomes N-terminal Human Sara (ZFYVE9) FYVE domainLysosomes N-terminal LAMP1 AllMidbody N-terminal CEP55 AllMicrotubules C-terminal a-Tubulin All
Long-term single-cell imaging 5
Journ
alof
Cell
Scie
nce
opto-acoustic resonance tomography. However, these techniquesare currently all limited by either by their poor sensitivity, lack of
useful contrast agents, low temporal or spatial resolution,
insufficient tissue penetration, or the difficulty in keepinganimals alive and immobilized long-term on the imaging setup
(Schroeder, 2008; Schroeder, 2011). Therefore, short-term
imaging over a few hours and in small volumes is possible, butfor long-term continuous imaging of single cells, in vitro
techniques are still required. Confocal and multiphoton
microscopes can be used for in vitro imaging, but areexpensive and generally more phototoxic than epifluorescence
and should be used only when three-dimensional information is
absolutely required. In this case, multiphoton excitation, largepinhole size, low laser powers, high scan speed, low resolution
and high-speed resonance scanners should be used. As an
alternative, for imaging thick samples or fast moving molecules,single plane illumination microscopy (SPIM) can also be used(Huisken et al., 2004). In many cases however, wide-field
epifluorescence microscopy is sufficient. Current limitations ofthese techniques and some proposed solutions are summarized inFig. 3.
Microscope components
As a general rule, the light path of the microscope should be kept
as simple as possible. If possible, differential interferencecontrast (DIC) prisms, phase-contrast objectives, mirrors,beamsplitters, optivar lenses and superfluous filters should be
removed. Objectives with low magnification dramaticallyincrease the observed area and can help increase temporalresolution. Objectives with high numerical aperture should be
A
B G1 Entry into S
Lifeact–TagRFPVENUSnucmem
GFP–H2B LifeactCHERRY
VENUSmito LifeactCHERRY
Cytokinesis
C
0 min 10 min 20 min 30 min 40 min
PH-AKT–VENUS
D
0 min (+TNFα) 17 min 28 min 56 min 91 min
p65–GFP
i iiiiii
Leading edge
S and G2 M
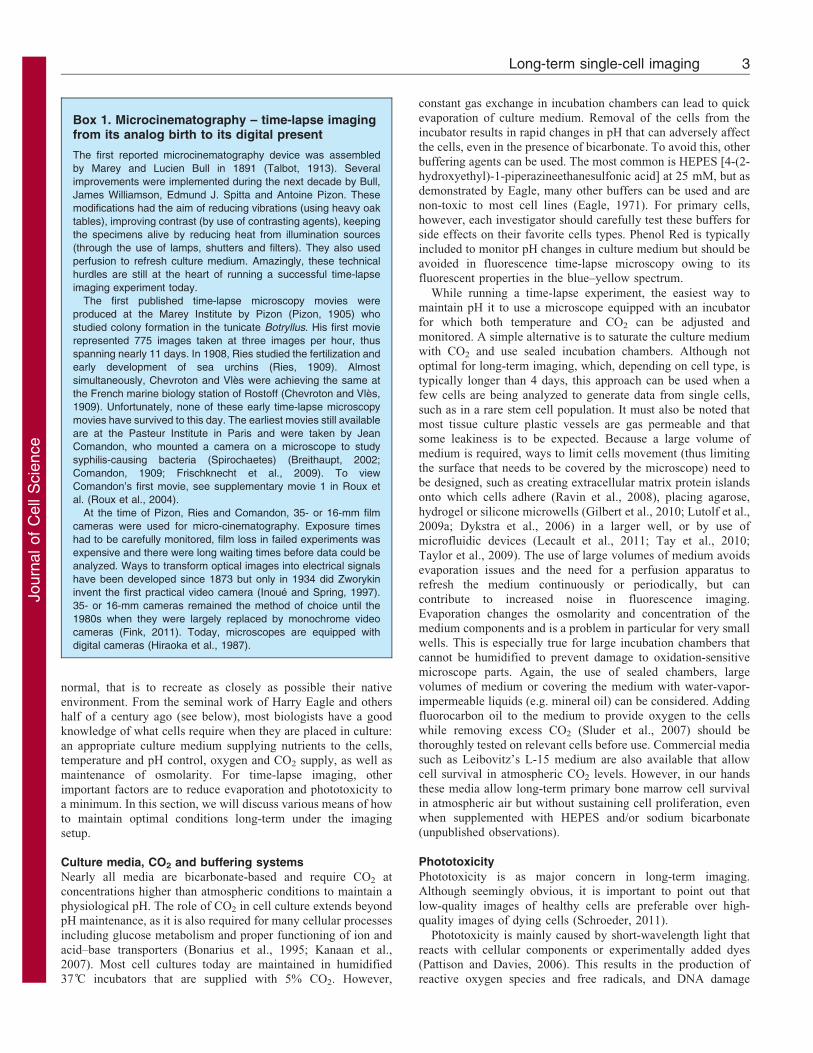
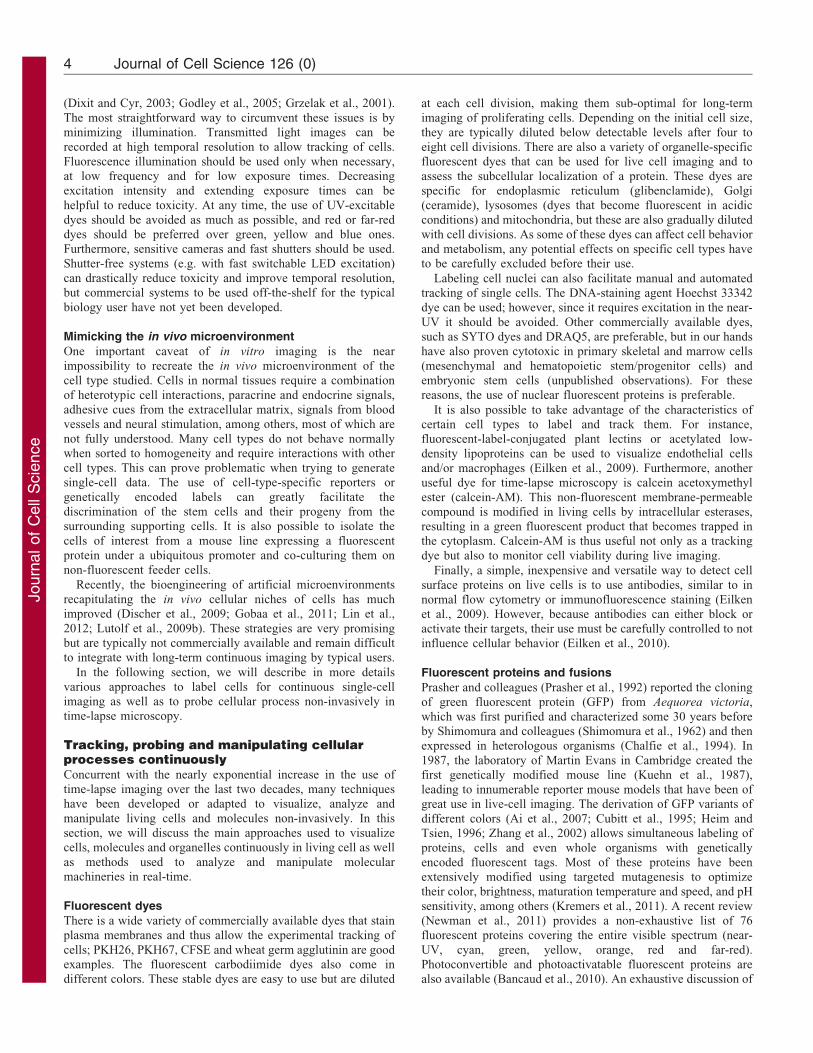
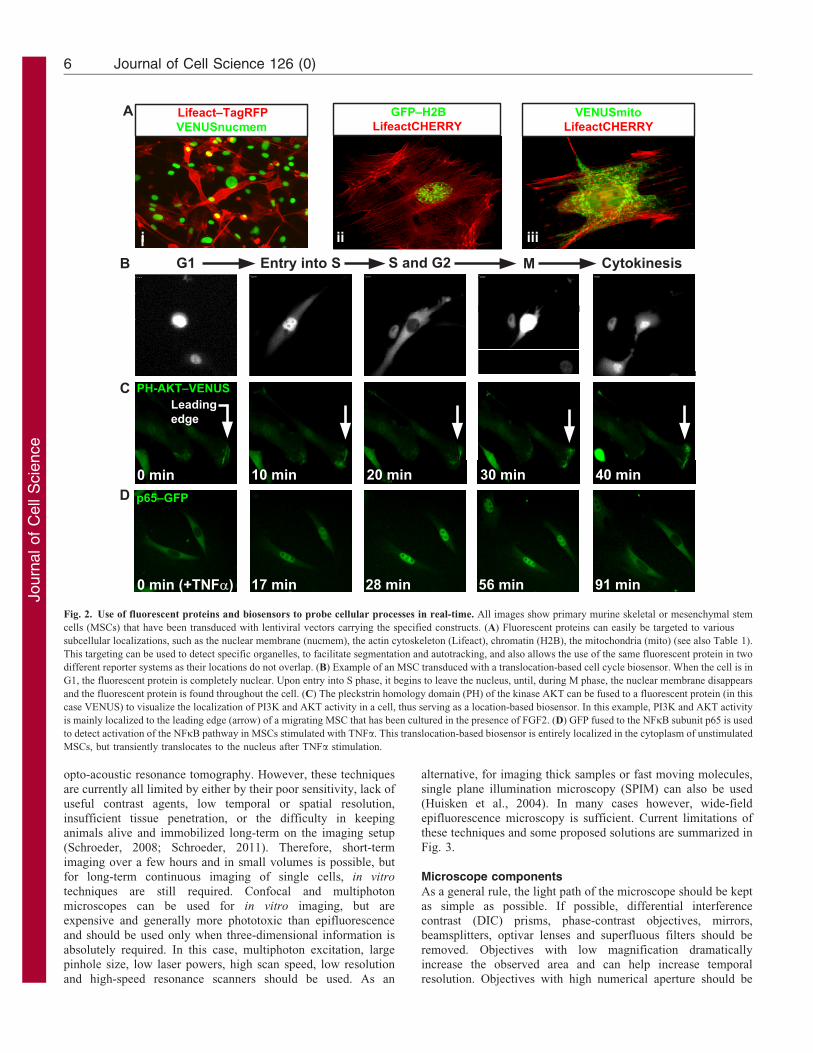
Fig. 2. Use of fluorescent proteins and biosensors to probe cellular processes in real-time. All images show primary murine skeletal or mesenchymal stem
cells (MSCs) that have been transduced with lentiviral vectors carrying the specified constructs. (A) Fluorescent proteins can easily be targeted to various
subcellular localizations, such as the nuclear membrane (nucmem), the actin cytoskeleton (Lifeact), chromatin (H2B), the mitochondria (mito) (see also Table 1).
This targeting can be used to detect specific organelles, to facilitate segmentation and autotracking, and also allows the use of the same fluorescent protein in two
different reporter systems as their locations do not overlap. (B) Example of an MSC transduced with a translocation-based cell cycle biosensor. When the cell is in
G1, the fluorescent protein is completely nuclear. Upon entry into S phase, it begins to leave the nucleus, until, during M phase, the nuclear membrane disappears
and the fluorescent protein is found throughout the cell. (C) The pleckstrin homology domain (PH) of the kinase AKT can be fused to a fluorescent protein (in this
case VENUS) to visualize the localization of PI3K and AKT activity in a cell, thus serving as a location-based biosensor. In this example, PI3K and AKT activity
is mainly localized to the leading edge (arrow) of a migrating MSC that has been cultured in the presence of FGF2. (D) GFP fused to the NFkB subunit p65 is used
to detect activation of the NFkB pathway in MSCs stimulated with TNFa. This translocation-based biosensor is entirely localized in the cytoplasm of unstimulated
MSCs, but transiently translocates to the nucleus after TNFa stimulation.
Journal of Cell Science 126 (0)6
Journ
alof
Cell
Scie
nce
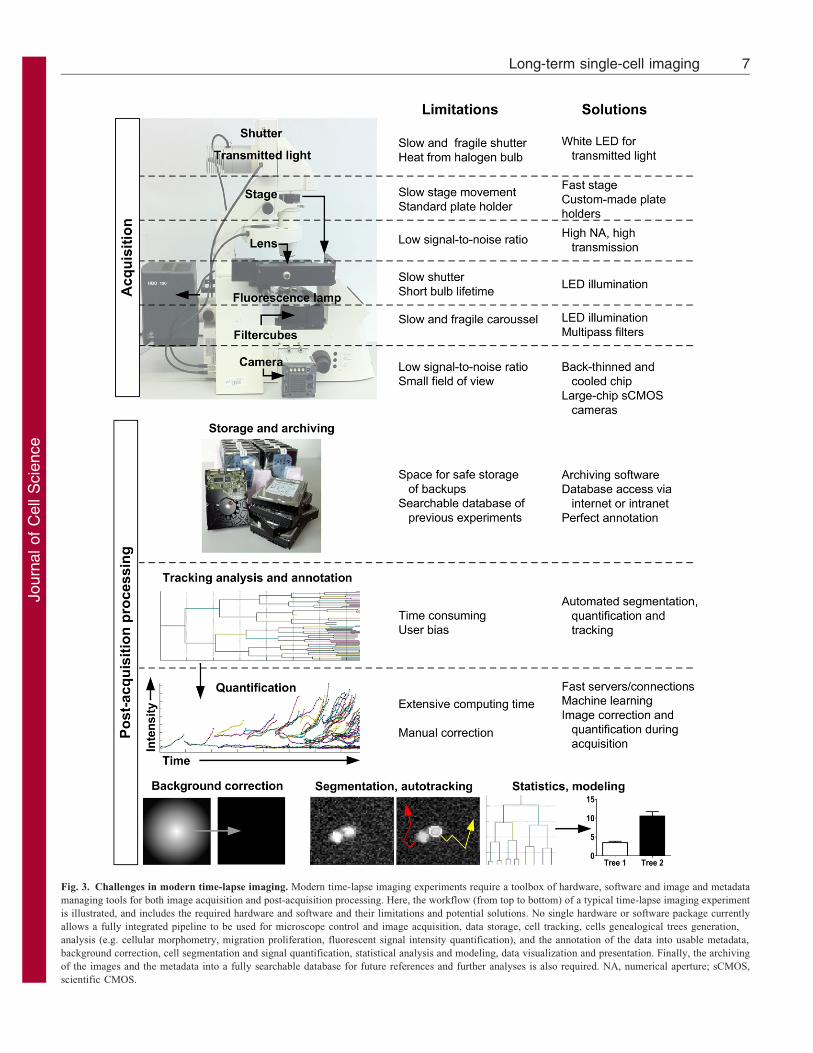
Fig. 3. Challenges in modern time-lapse imaging. Modern time-lapse imaging experiments require a toolbox of hardware, software and image and metadata
managing tools for both image acquisition and post-acquisition processing. Here, the workflow (from top to bottom) of a typical time-lapse imaging experiment
is illustrated, and includes the required hardware and software and their limitations and potential solutions. No single hardware or software package currently
allows a fully integrated pipeline to be used for microscope control and image acquisition, data storage, cell tracking, cells genealogical trees generation,
analysis (e.g. cellular morphometry, migration proliferation, fluorescent signal intensity quantification), and the annotation of the data into usable metadata,
background correction, cell segmentation and signal quantification, statistical analysis and modeling, data visualization and presentation. Finally, the archiving
of the images and the metadata into a fully searchable database for future references and further analyses is also required. NA, numerical aperture; sCMOS,
scientific CMOS.
Long-term single-cell imaging 7
Journ
alof
Cell
Scie
nce
used for weak fluorescent signals. High-end objectives arechromatically and spherically corrected for up to four wavelengths
and are also plan-corrected (ensuring the whole field of view is infocus at the same time) in addition to having large numericalapertures. However, highly corrected objectives usually favoroptical correction at the expense of light transmission (LoBiondo
et al., 2011). Thus, objectives that are specifically designed for highfluorescence transmission, and thus have lower exposure times areoften preferable (reduced phototoxicity) and cheaper, in particular
when imaging only one or two fluorescent channels.
For illumination, many options exist and choosing the rightlight source will affect experimental outcome. For fluorescence,
the most widely used light sources are mercury and metal-halidearc lamps. These lamps have a similar spectral output withemissions peaks at 365, 405, 436, 546 and 579 nm, but the energyoutput of metal halide lamps is slightly lower than that of
mercury lamps. However, metal halide bulbs usually last longerthan mercury bulbs. Xenon lamps are also sometimes used; theirspectral characteristics are more homogeneous across the visible
spectrum but their relative energy output is much lower than thatof mercury or metal halide lamps (Herman, 2002). Severalmanufacturers now offer LED illumination devices. LEDs are
smaller, produce less heat and can rapidly be switched on and off,thus eliminating the need for shutters (which are slow andextremely prone to mechanical malfunction – it must also be
noted that temporal resolution is usually limited by mechanicalparts such as shutters, filter wheels and stage) and allowing fasterimage acquisition and reduced phototoxicity. However, LEDsystems from various manufacturers are not comparable. In
addition, they currently all suffer from ‘teething’ problems andoften require self-developed software for useful hardwarecontrol. Novel LEDs with improved brightness and spectral
properties are beginning to appear on the market and might makeLED illumination the best choice for epifluorescent imaging inthe near future, but currently they require constant re-evaluation.
Although of obvious importance, choosing optimal filter setsfor the fluorochromes used is often neglected. The choice ofoptimal excitation and emission filters and dichroic mirrorcombinations is crucial for improved signal detection and
ensuing decreased exposure and phototoxicity. For single-colorimaging, short- or long-pass emission filters can be preferable.For multiple colors, separate filters optimal for each
fluorochrome should be used and images acquired sequentially.If the signals are strong enough, multi-bandpass filters can beused to speed up image acquisition.
As for objectives, illumination source and filters, there is nosingle camera that fulfills all experimental requirements, andcamera types need to be carefully assessed for individual needs.Modern microscope cameras are solid-state sensors that are either
complementary metal oxide sensors (CMOS) or charge-coupleddevices (CCDs). CCD cameras (including intensified, electronbombardment and electron multiplication; I-CCD, EB-CCD and
EM-CCD, respectively) are the most widely used because, untilrecently, they were more sensitive and had the lowest noiselevels. However recent scientific-grade CMOS cameras are now
available that out-compete CCD-type cameras. Importantproperties for long-term time-lapse microscopy includeexposure mode (for CCD cameras), spectral sensitivity or
quantum efficiency, noise, chip size, pixel or photodiode size(and combining the latter two, total number of pixels), full-wellcapacity (for CCD cameras if quantification of fluorescence is
required), dynamic range, bit depth and binning capacity. Adetailed description of the various types of cameras and theirproperties can be found in recent reviews (Joubert and Sharma,2011; Salmon and Waters, 2011).
Color cameras typically have a lower resolution and sensitivityowing to their design, so unless multiple wavelengths are viewed
at the same time, monochrome cameras should be used andchannels images taken sequentially (or simultaneously usingmultiple cameras on microscopes with beamsplitter lightpaths).
The quantum efficiency of a camera refers to the percentage ofphotons that are detected (transformed into photoelectrons) by asingle photodiode and is wavelength dependent. Back-thinned
CCD or CMOS chips have higher quantum efficiencies becausethe image can be focused on the chip on the opposite side fromthe electronics, but the thinning process is expensive and cancause variability across the chip. All cameras generate
background noise that can come from, for example, thermaldisturbances on the chip, which can be lowered by cooling thechip. The chip size determines the area of the view field that is
imaged by the chip. A larger chip size thus means that fewerpositions need to be imaged to cover a whole sample and thusallows higher data throughput and temporal resolution.
Recent automatic hardware focus systems have reachedsufficiently robust technological standards and can be helpful if
the imaging setups are in a room with frequent temperaturevariations.
Acquisition and analysis of imaging data –software requirementsAll current computer programs for image acquisition and analysishave their intrinsic strengths and weaknesses (Box 2 and Eliceiriet al., 2012; Schroeder, 2011; Walter et al., 2010), and these often
only become apparent after using them under experimentalconditions. It is therefore crucial to test them for the specific taskat hand before (financially) committing to one solution.
Image acquisition
Most commercial imaging hardware setups are sold withproprietary software that can be used for simple time-lapseexperiments. These include AxioVision (Zeiss), NIS-Elements
(Nikon) and cellSens (Olympus). Other commercial packagesinclude, among many others, Metamorph (Molecular Devices) andVolocity (Perkin-Elmer). The advantage of these packages is that
they are designed for the specific hardware used and thus shouldnot have any compatibility issues with hardware components.Their main disadvantage is their lack of flexibility. Indeed, their
use greatly limits custom changes made to an imaging hardwaresuch as the use of novel illumination sources. Thus, laboratoriesusing various hardware components that are self-assembled forspecific needs and with frequent changes in experimental designs
are limited by these packages. Therefore, researchers typicallyhave to write their own code to fulfill their needs.
One open-source package that can be used to control mostmicroscopy hardware components is mManager (Edelstein et al.,2010), which offers greater flexibility than typical commercial
software packages. It runs as an ImageJ plug-in (see below) thatcan perform most basic operations and is compatible with mostcommercial microscopes, cameras, stages, shutters, filter wheels
and illumination sources. An open-source package that usesdrivers from mManager for more complex acquisition protocols isYouScope (Lang et al., 2012).
Journal of Cell Science 126 (0)8
Journ
alof
Cell
Scie
nce
Time-lapse imaging typically generates massive amounts of
data. Although the whole human genome can be encoded in a fewgigabytes of data, even a single imaging experiment can yield athousand- to a million-fold more data. Adequate data storage,
backup and access systems typically overwhelm current ITservice departments at most institutions and dedicated solutionshave to be found that enable not only data acquisition, but also
their timely analysis.
Image analysis, quantification and display
After acquisition, the (often enormous amounts of) image data have
to be analyzed in a statistically meaningful way. Although obvious,the time required for this step is usually drastically underestimated.
For general image analysis functions such as visualization, co-localization and basic quantification, many commercial programsare available and include Imaris (Bitplane), Volocity (Perkin-
Elmer), ZEN (Zeiss), MetaMorph (Molecular Devices) andAmira (VSG). There are also an increasing number of open-source software applications and each one has its own particular
strengths. Again, as many packages have been developed toanswer a specific need, there is no software that will be perfectfor every researcher, and even smallest novel requirements will
typically require the use of programming skills.
One of the first open-source packages for analysis of
microscopy data was ImageJ, which was created over 25 yearsago by the National Institutes of Health (NIH) (Schneider et al.,2012). The ImageJ development team now numbers over 500
collaborators and the available plug-ins exceed this number. ButImageJ is also victim of its success, as so many plug-ins areavailable (many of them being redundant) that it becomes
difficult to choose the appropriate one. Furthermore, manylaboratories write their own plug-ins, which are not necessarilyavailable when the software is installed, although packages such as
Fiji (Schindelin et al., 2012) are trying to circumvent this issue byproviding a standard package of plug-ins which is automaticallyupdated from a central wiki-based website. Finally, ImageJ plug-
ins are not always written in a comprehensive manner that allowsother researchers to modify them when new technology becomesavailable. Nevertheless, many recent software packages still use
ImageJ or its plug-ins to perform basic analysis tasks. Some, suchas Icy (de Chaumont et al., 2012), also integrate mManager to allowcontrol of motorized microscopes components.
Other packages that can be useful for image analysis include(not exhaustively) BioImageXD (Kankaanpaa et al., 2012),
OMERO, Vaa3D, CellProfiler, Fluorender, ImageSurfer, 3DSlicer, Image Slicer, Reconstruct, OsiriX, IMOD, SIMIoBioCell(Ravin et al., 2008), TimeLapseAnalyzer (Huth et al., 2011),
TLM-Tracker (Klein et al., 2012) and TTT (Eilken et al., 2009;Rieger et al., 2009). All of these are specialized to accomplishspecific tasks in image analysis – and are optimized for images
with very specific properties. Some, such as CellProfiler and Icy,allow a user without programming skills to create pipelines forbatch-processing of images. However, none of these packages
provide all the necessary tools in one package to address allrequirements for generating single-cell data from continuouslong-term time-lapse experiments.
A typical time-lapse imaging experiment that requires datafrom single cells usually requires single-cell tracking, signal
quantification over time, morphometric measurements,genealogic tree generation (with the possibility of annotationfor signal intensity), gating, statistical analysis, display and
visualization flexibility, as well annotations of metadata. Mostlaboratories today use multiple software packages, but due to alack of common interfaces, this usually requires tedious data
conversions or even programming skills. For automated celltracking and signal quantification, cell segmentation and auto-tracking algorithms are required. Although many of thementioned software packages offer this functionality, their
everyday use is typically highly limited. Under conditionswhere cells migrate or divide rapidly, or touch each other,automated tracking algorithms become too error-prone. Manual
tracking, although time consuming, is still the only reliableoption in most long-term imaging experiments.
Presenting data derived from time-lapse imaging is alsoproblematic as most scientific publications display still images
in figures. Although journals now frequently publish movies assupplementary material, most readers still only carefully inspectthe main figures in a publication. Displaying multidimensional
data (such as multicolor staining in flow cytometry orimmunofluorescence) can be problematic and, when a temporaldimension is added, the complexity of the data makes it difficultto analyze and display it in a reader-friendly manner.
Taken together, there is an increasing effort in the imaging
community to develop integrated open-source, flexible andmultipurpose packages for image acquisition, storage,management, analysis and visualization. This aspect probably
will remain the major bottleneck in deriving meaningful datafrom multiparametric long-term continuous single-cell time-lapsemicroscopy for some time (Cardona and Tomancak, 2012;
Carpenter et al., 2012; Myers, 2012).
Conclusions and perspectivesIt has now been over 120 years since Jules-Etienne Marey andcolleagues invented the first time-lapse apparatus. These pioneers
Box 2. Useful internet resources
Basic microscopy and time-lapse imaging
N http://www.microscopyu.com/
N http://zeiss-campus.magnet.fsu.edu/
N http://www.olympusmicro.com/
N http://www.microscopy.info/
N http://cshprotocols.cshlp.org/cgi/collection/live_cell_imaging/
Fluorescent dyes and proteins spectra viewers
N http://www.invitrogen.com/site/us/en/home/support/Research-
Tools/Fluorescence-SpectraViewer.html
N http://www.bdbiosciences.com/research/multicolor/spectrum_
viewer/index.jsp
N http://www.evrogen.com/spectra-viewer/viewer.shtml
N http://www.ulbrich-lab.com/spectra/
Mouse models
N http://www.jax.org/
N http://www.findmice.org/
N http://www.knockoutmouse.org/
N http://nagy.mshri.on.ca/cre_new/
Microscopy software
N http://cismm.cs.unc.edu/resources/external-links/
N http://www.nitrc.org/
N http://rsbweb.nih.gov/ij/
N www.micro-manager.org/
N www.youscope.org/
Long-term single-cell imaging 9
Journ
alof
Cell
Scie
nce
were already addressing the technical hurdles we still face –
sample viability, system stability, optimization of illuminationand contrast. With the incremental development of microscopytechniques, cell purification and culture methods, genetic
manipulation of whole organisms, protein engineering andcomputer sciences, time-lapse microscopy has now reached apoint where it can become a standard approach to answer long-
standing biological questions. However, despite the evolution oftechniques and hardware, we still face some of the same technicalhurdles as Marey and colleagues did more than a century ago.Most importantly perhaps, the rapid evolution of hardware
components in the past decades allows the generation of terabytesof data per day or more, in a single laboratory. However, wecurrently lack integrated bioinformatics tools that allow us to
batch-process and analyze all of this data in a user friendly andmeaningful way. Although several software packages exist toperform basic analysis of microscopy data, none of these
integrate all aspects that are required, such as time-dependentsingle-cell segmentation, morphometric analysis, reporter signalquantification, genealogic tree generation, statistical analysis,
display and visualization options, and modeling, as well as theprecise annotation that can be used for archiving and searchingprevious datasets. In order for time-lapse microscopy to reach itsfull potential, these tools will have to be generated through a
close collaboration between biologists (the end users) andcomputer scientists. In some cases, it will even be necessarythat the biologist and the computers scientist are the same person.
Nevertheless, the field has reached an exciting point, as everyaspect of this technology is being rapidly developed. It should,however, be remembered that time-lapse imaging will remain a
multidisciplinary technique that requires either extensiveknowledge of all the fields it covers, or at least extensivecollaboration between various groups in order to be successful.
FundingThe work of our laboratory is supported by the German researchcouncil (DFG). D.L.C. is a Canadian Institutes of Health Researchpostdoctoral fellow.
ReferencesAi, H. W., Shaner, N. C., Cheng, Z., Tsien, R. Y. and Campbell, R. E. (2007).
Exploration of new chromophore structures leads to the identification of improvedblue fluorescent proteins. Biochemistry 46, 5904-5910.
Aoki, K., Komatsu, N., Hirata, E., Kamioka, Y. and Matsuda, M. (2012). Stableexpression of FRET biosensors: a new light in cancer research. Cancer Sci. 103, 614-619.
Asami, M., Pilz, G. A., Ninkovic, J., Godinho, L., Schroeder, T., Huttner, W. B. andGotz, M. (2011). The role of Pax6 in regulating the orientation and mode of celldivision of progenitors in the mouse cerebral cortex. Development 138, 5067-5078.
Bancaud, A., Huet, S., Rabut, G. and Ellenberg, J. (2010). Fluorescence perturbationtechniques to study mobility and molecular dynamics of proteins in live cells: FRAP,photoactivation, photoconversion, and FLIP. Cold Spring Harb. Protoc. 2010,pdb.top90.
Bertrand, J. Y., Chi, N. C., Santoso, B., Teng, S., Stainier, D. Y. R. and Traver,
D. (2010). Haematopoietic stem cells derive directly from aortic endothelium duringdevelopment. Nature 464, 108-111.
Bonarius, H. P., de Gooijer, C. D., Tramper, J. and Schmid, G. (1995).Determination of the respiration quotient in mammalian cell culture in bicarbonatebuffered media. Biotechnol. Bioeng. 45, 524-535.
Breithaupt, H. (2002). Rhythm ‘n’ biology: what happens if cell biology and technomusic meet? EMBO Rep. 3, 813-815.
Burtscher, I. and Lickert, H. (2009). Foxa2 regulates polarity and epithelialization inthe endoderm germ layer of the mouse embryo. Development 136, 1029-1038.
Cardona, A. and Tomancak, P. (2012). Current challenges in open-source bioimageinformatics. Nat. Methods 9, 661-665.
Carpenter, A. E., Kamentsky, L. and Eliceiri, K. W. (2012). A call for bioimagingsoftware usability. Nat. Methods 9, 666-670.
Chalfie, M., Tu, Y., Euskirchen, G., Ward, W. W. and Prasher, D. C. (1994). Greenfluorescent protein as a marker for gene expression. Science 263, 802-805.
Chevroton, L. and Vles, M. F. (1909). La cinematique de la segmentation de l’oeuf et
la chronophotographie du developpement de l’Oursin. C. R. Seances Acad. Sci. 149,
806-809.
Comandon, J. (1909). Cinematographie, a l’ultra-microscope, de microbes vivants et
des particules mobiles. C. R. Seances Acad. Sci. 149, 938-941.
Costa, M. R., Wen, G., Lepier, A., Schroeder, T. and Gotz, M. (2008). Par-complex
proteins promote proliferative progenitor divisions in the developing mouse cerebral
cortex. Development 135, 11-22.
Costa, M. R., Bucholz, O., Schroeder, T. and Gotz, M. (2009). Late origin of glia-
restricted progenitors in the developing mouse cerebral cortex. Cereb. Cortex 19
Suppl 1, i135-i143.
Costa, M. R., Ortega, F., Brill, M. S., Beckervordersandforth, R., Petrone, C.,
Schroeder, T., Gotz, M. and Berninger, B. (2011). Continuous live imaging of adult
neural stem cell division and lineage progression in vitro. Development 138, 1057-
1068.
Cubitt, A. B., Heim, R., Adams, S. R., Boyd, A. E., Gross, L. A. and Tsien,
R. Y. (1995). Understanding, improving and using green fluorescent proteins. Trends
Biochem. Sci. 20, 448-455.
de Chaumont, F., Dallongeville, S., Chenouard, N., Herve, N., Pop, S., Provoost, T.,
Meas-Yedid, V., Pankajakshan, P., Lecomte, T., Le Montagner, Y. et al. (2012).
Icy: an open bioimage informatics platform for extended reproducible research. Nat.
Methods 9, 690–696.
Discher, D. E., Mooney, D. J. and Zandstra, P. W. (2009). Growth factors, matrices,
and forces combine and control stem cells. Science 324, 1673-1677.
Dixit, R. and Cyr, R. (2003). Cell damage and reactive oxygen species production
induced by fluorescence microscopy: effect on mitosis and guidelines for non-
invasive fluorescence microscopy. Plant J. 36, 280-290.
Dunn, G. A. and Jones, G. E. (2004). Cell motility under the microscope: Vorsprung
durch Technik. Nat. Rev. Mol. Cell Biol. 5, 667-672.
Dykstra, B., Ramunas, J., Kent, D., McCaffrey, L., Szumsky, E., Kelly, L., Farn, K.,
Blaylock, A., Eaves, C. and Jervis, E. (2006). High-resolution video monitoring of
hematopoietic stem cells cultured in single-cell arrays identifies new features of self-
renewal. Proc. Natl. Acad. Sci. USA 103, 8185-8190.
Eagle, H. (1971). Buffer combinations for mammalian cell culture. Science 174, 500-
503.
Edelstein, A., Amodaj, N., Hoover, K., Vale, R. and Stuurman, N. (2010). Computer
control of microscopes using mManager. Curr. Protoc. Mol. Biol. 92, 14.20.1–
14.20.17.
Eilken, H. M., Nishikawa, S.-I. and Schroeder, T. (2009). Continuous single-cell
imaging of blood generation from haemogenic endothelium. Nature 457, 896-900.
Eilken, H., Rieger, M., Hoppe, P., Hermann, A., Smejkal, B., Drew, E., Thum, M.,
Ninkovic, J., Beckervordersandforth, R. and Schroeder, T. (2010). Continuous
long-term detection of live cell surface markers by ‘‘in culture’’ antibody staining.
Protoc. exch.. 2011, doi:10.1038.
Eliceiri, K. W., Berthold, M. R., Goldberg, I. G., Ibanez, L., Manjunath, B. S.,
Martone, M. E., Murphy, R. F., Peng, H., Plant, A. L., Roysam, B. et al. (2012).
Biological imaging software tools. Nat. Methods 9, 697-710.
Endele, M. and Schroeder, T. (2012). Molecular live cell bioimaging in stem cell
research. Ann. N. Y. Acad. Sci. 1266, 18-27.
Fink, R. (2011). A single frame: imaging live cells twenty-five years ago. Genesis 49,
484-487.
Frigault, M. M., Lacoste, J., Swift, J. L. and Brown, C. M. (2009). Live-cell
microscopy - tips and tools. J. Cell Sci. 122, 753-767.
Frischknecht, F., Gunzer, M. and Shorte, S. L. (2009). Retrospective: Birth of the
cool - imaging and microbiology from Ibn al-Haytham to Jean Comandon.
Biotechnol. J. 4, 787-790.
Gilbert, P. M., Havenstrite, K. L., Magnusson, K. E. G., Sacco, A., Leonardi, N. A.,
Kraft, P., Nguyen, N. K., Thrun, S., Lutolf, M. P. and Blau, H. M. (2010).
Substrate elasticity regulates skeletal muscle stem cell self-renewal in culture. Science
329, 1078-1081.
Gobaa, S., Hoehnel, S., Roccio, M., Negro, A., Kobel, S. and Lutolf, M. P. (2011).
Artificial niche microarrays for probing single stem cell fate in high throughput. Nat.
Methods 8, 949-955.
Godley, B. F., Shamsi, F. A., Liang, F.-Q., Jarrett, S. G., Davies, S. and Boulton,
M. (2005). Blue light induces mitochondrial DNA damage and free radical production
in epithelial cells. J. Biol. Chem. 280, 21061-21066.
Grzelak, A., Rychlik, B. and Bartosz, G. (2001). Light-dependent generation of
reactive oxygen species in cell culture media. Free Radic. Biol. Med. 30, 1418-1425.
Haugh, J. M. (2012). Live-cell fluorescence microscopy with molecular biosensors:
what are we really measuring? Biophys. J. 102, 2003-2011.
Heim, R. and Tsien, R. Y. (1996). Engineering green fluorescent protein for improved
brightness, longer wavelengths and fluorescence resonance energy transfer. Curr.
Biol. 6, 178-182.
Henrickson, S. E., Mempel, T. R., Mazo, I. B., Liu, B., Artyomov, M. N., Zheng, H.,
Peixoto, A., Flynn, M. P., Senman, B., Junt, T. et al. (2008). T cell sensing of
antigen dose governs interactive behavior with dendritic cells and sets a threshold for
T cell activation. Nat. Immunol. 9, 282-291.
Herman, B. (2002). Fluorescence microscopy. Curr. Protoc. Immunol. 4, 21.2.1–
21.2.10.
Hiraoka, Y., Sedat, J. W. and Agard, D. A. (1987). The use of a charge-coupled device
for quantitative optical microscopy of biological structures. Science 238, 36-41.
Journal of Cell Science 126 (0)10
Journ
alof
Cell
Scie
nce
Huisken, J., Swoger, J., Del Bene, F., Wittbrodt, J. and Stelzer, E. H. K. (2004).Optical sectioning deep inside live embryos by selective plane illuminationmicroscopy. Science 305, 1007-1009.
Huth, J., Buchholz, M., Kraus, J. M., Mølhave, K., Gradinaru, C., v Wichert, G.,
Gress, T. M., Neumann, H. and Kestler, H. A. (2011). TimeLapseAnalyzer: multi-target analysis for live-cell imaging and time-lapse microscopy. Comput. Methods
Programs Biomed. 104, 227-234.
Inoue, S. and Spring, K. R. (1997). Video Microscopy, The Fundamentals, 2nd edn.New York, NY: Plenum Press.
Joubert, J. and Sharma, D. (2011). Light microscopy digital imaging. Curr. Protoc.
Cytometry 58, 2.3.1–2.3.11.
Junt, T., Moseman, E. A., Iannacone, M., Massberg, S., Lang, P. A., Boes, M., Fink,K., Henrickson, S. E., Shayakhmetov, D. M., Di Paolo, N. C. et al. (2007).Subcapsular sinus macrophages in lymph nodes clear lymph-borne viruses andpresent them to antiviral B cells. Nature 450, 110-114.
Kanaan, A., Douglas, R. M., Alper, S. L., Boron, W. F. and Haddad, G. G. (2007).Effect of chronic elevated carbon dioxide on the expression of acid-base transportersin the neonatal and adult mouse. Am. J. Physiol. 293, R1294-R1302.
Kankaanpaa, P., Paavolainen, L., Tiitta, S., Karjalainen, M., Paivarinne, J.,
Nieminen, J., Marjomaki, V., Heino, J. and White, D. J. (2012). BioImageXD: anopen, general-purpose and high-throughput image-processing platform. Nat. Methods
9, 683-689.
Kissa, K. and Herbomel, P. (2010). Blood stem cells emerge from aortic endotheliumby a novel type of cell transition. Nature 464, 112-115.
Klein, J., Leupold, S., Biegler, I., Biedendieck, R., Munch, R. and Jahn, D. (2012).TLM-Tracker: software for cell segmentation, tracking and lineage analysis in time-lapse microscopy movies. Bioinformatics 28, 2276-2277.
Kokkaliaris, K. D., Loeffler, D. and Schroeder, T. (2012). Advances in trackinghematopoiesis at the single-cell level. Curr. Opin. Hematol. 19, 243-249.
Kremers, G.-J., Gilbert, S. G., Cranfill, P. J., Davidson, M. W. and Piston,D. W. (2011). Fluorescent proteins at a glance. J. Cell Sci. 124, 157-160.
Kuang, S., Kuroda, K., Le Grand, F. and Rudnicki, M. A. (2007). Asymmetric self-renewal and commitment of satellite stem cells in muscle. Cell 129, 999-1010.
Kuehn, M. R., Bradley, A., Robertson, E. J. and Evans, M. J. (1987). A potentialanimal model for Lesch-Nyhan syndrome through introduction of HPRT mutationsinto mice. Nature 326, 295-298.
Landecker, H. (2006). Microcinematography and the History of Science and Film. Isis
97, 121-132.
Landecker, H. (2009). Seeing things: from microcinematography to live cell imaging.Nat. Methods 6, 707-709.
Lang, M., Rudolf, F. and Stelling, J. (2012). Use of YouScope to implement systematicmicroscopy protocols. Curr. Protoc. Mol. Biol. 98, 14.21.1–14.21.23.
Lecault, V., Vaninsberghe, M., Sekulovic, S., Knapp, D. J. H. F., Wohrer, S.,
Bowden, W., Viel, F., McLaughlin, T., Jarandehei, A., Miller, M. et al. (2011).High-throughput analysis of single hematopoietic stem cell proliferation inmicrofluidic cell culture arrays. Nat. Methods 8, 581-586.
Lichtman, J. W. and Conchello, J.-A. (2005). Fluorescence microscopy. Nat. Methods
2, 910-919.
Lin, C.-H., Lee, J. K. and LaBarge, M. A. (2012). Fabrication and use ofmicroenvironment microarrays (MEArrays). J. Vis. Exp. 2012.
Lippincott-Schwartz, J. and Patterson, G. H. (2003). Development and use offluorescent protein markers in living cells. Science 300, 87-91.
LoBiondo, J., Abramowitz, M. and Friedman, M. M. (2011). Microscope objectives.Curr. Protoc Cytom. 58, 2.2.1-2.2, 15.
Lutolf, M. P., Doyonnas, R., Havenstrite, K., Koleckar, K. and Blau, H. M. (2009a).Perturbation of single hematopoietic stem cell fates in artificial niches. Integr. Biol.
(Camb) 1, 59-69.
Lutolf, M. P., Gilbert, P. M. and Blau, H. M. (2009b). Designing materials to directstem-cell fate. Nature 462, 433-441.
Muller-Taubenberger, A. and Anderson, K. I. (2007). Recent advances using greenand red fluorescent protein variants. Appl. Microbiol. Biotechnol. 77, 1-12.
Myers, G. (2012). Why bioimage informatics matters. Nat. Methods 9, 659-660.
Newman, R. H., Fosbrink, M. D. and Zhang, J. (2011). Genetically encodablefluorescent biosensors for tracking signaling dynamics in living cells. Chem. Rev.
111, 3614-3666.
Paddock, S. (2001). A brief history of time-lapse. Biotechniques 30, 283-286, 288-289.
Pattison, D. I. and Davies, M. J. (2006). Actions of ultraviolet light on cellularstructures. EXS 96, 131-157.
Piston, D. W. (1999). Imaging living cells and tissues by two-photon excitationmicroscopy. Trends Cell Biol. 9, 66-69.
Pizon, A. (1905). Une nouvelle application de la chronophotographie: laBiotachygraphie. In Comptes rendus des seances du sixieme Congres international
de zoologie tenu a Berne du 14 au 16 aout 1904, pp. 404–409. Berne: W. Kundig &Fils.
Prasher, D. C., Eckenrode, V. K., Ward, W. W., Prendergast, F. G. and Cormier,M. J. (1992). Primary structure of the Aequorea victoria green-fluorescent protein.Gene 111, 229-233.
Ravin, R., Hoeppner, D. J., Munno, D. M., Carmel, L., Sullivan, J., Levitt, D. L.,
Miller, J. L., Athaide, C., Panchision, D. M. and McKay, R. D. G. (2008). Potencyand fate specification in CNS stem cell populations in vitro. Cell Stem Cell 3, 670-680.
Rieger, M. A., Hoppe, P. S., Smejkal, B. M., Eitelhuber, A. C. and Schroeder,T. (2009). Hematopoietic cytokines can instruct lineage choice. Science 325, 217-218.
Ries, J. (1909). Kinematographie der Befruchtung und Zellteilung. Archiv fur
Mikroskopishe Anatomie 74, 1-31.Roux, P., Munter, S., Frischknecht, F., Herbomel, P. and Shorte, S. L. (2004).
Focusing light on infection in four dimensions. Cell. Microbiol. 6, 333-343.Salmon, W. C. and Waters, J. C. (2011). CCD cameras for fluorescence imaging of
living cells. Cold Spring Harb. Protoc. 2011, pdb.top113.Schindelin, J., Arganda-Carreras, I., Frise, E., Kaynig, V., Longair, M., Pietzsch,
T., Preibisch, S., Rueden, C., Saalfeld, S., Schmid, B. et al. (2012). Fiji: an open-source platform for biological-image analysis. Nat. Methods 9, 676-682.
Schneider, C. A., Rasband, W. S. and Eliceiri, K. W. (2012). NIH Image to ImageJ:25 years of image analysis. Nat. Methods 9, 671-675.
Schroeder, T. (2008). Imaging stem-cell-driven regeneration in mammals. Nature 453,345-351.
Schroeder, T. (2011). Long-term single-cell imaging of mammalian stem cells. Nat.
Methods 8 Suppl., S30-S35.Shimomura, O., Johnson, F. H. and Saiga, Y. O. (1962). Extraction, purification and
properties of aequorin, a bioluminescent protein from the luminous hydromedusan,Aequorea. J. Cell. Comp. Physiol. 59, 223-239.
Sluder, G., Nordberg, J. J., Miller, F. J. and Hinchcliffe, E. H. (2007). A sealedpreparation for long-term observations of cultured cells. CSH Protoc. 2007,pdb.prot4660.
Stent, G. S. and Weisblat, D. A. (1985). Cell lineage in the development of invertebratenervous systems. Annu. Rev. Neurosci. 8, 45-70.
Stephens, D. J. and Allan, V. J. (2003). Light microscopy techniques for live cellimaging. Science 300, 82-86.
Stern, C. D. and Fraser, S. E. (2001). Tracing the lineage of tracing cell lineages. Nat.
Cell Biol. 3, E216-E218.Sung, J. H., Zhang, H., Moseman, E. A., Alvarez, D., Iannacone, M., Henrickson,
S. E., de la Torre, J. C., Groom, J. R., Luster, A. D. and von Andrian, U. H.
(2012). Chemokine guidance of central memory T cells is critical for antiviral recallresponses in lymph nodes. Cell 150, 1249-1263.
Talbot, F. (1913). Practical Cinematography and its Applications. London: WilliamHeinemann.
Tay, S., Hughey, J. J., Lee, T. K., Lipniacki, T., Quake, S. R. and Covert,
M. W. (2010). Single-cell NF-kappaB dynamics reveal digital activation andanalogue information processing. Nature 466, 267-271.
Taylor, R. J., Falconnet, D., Niemisto, A., Ramsey, S. A., Prinz, S., Shmulevich, I.,Galitski, T. and Hansen, C. L. (2009). Dynamic analysis of MAPK signaling using ahigh-throughput microfluidic single-cell imaging platform. Proc. Natl. Acad. Sci.
USA 106, 3758-3763.Walter, T., Shattuck, D. W., Baldock, R., Bastin, M. E., Carpenter, A. E., Duce, S.,
Ellenberg, J., Fraser, A., Hamilton, N., Pieper, S. et al. (2010). Visualization ofimage data from cells to organisms. Nat. Methods 7 Suppl, S26-S41.
Whitman, C. O. (1878). The embryology of clepsine. Q. J. Microsc. Sci. s2-18, 215–315.
Zhang, J., Campbell, R. E., Ting, A. Y. and Tsien, R. Y. (2002). Creating newfluorescent probes for cell biology. Nat. Rev. Mol. Cell Biol. 3, 906-918.
Long-term single-cell imaging 11