Embed Size (px)
Citation preview

CONSIDEO
iMODELERProbably the most crucial app/thinking tool in the world
What is it for ?
The new iMODELER offers a revolutionary way to both visualize and analyze (through its unique insight matrix) complexity thus allowing for better planning, communication, and decision-making. It starts where our brain ends and leads to insights beyond our gut feeling or knowledge of best practice.
With the iMODELER you visualize cause and impact interconnections by the use of factors and connections:
Whenever you have to consider more than 4 factors you should model! The fields of application range from • Make your mind on something
• Facilitation of daily discussions
to business methods such as
• Strategy development, e.g. “balanced scorecard” (BSC)
• Knowledge management
• SWOT Analysis
• Change management
• Quality and lean management, e.g. Six Sigma
• Corporate forecasting
• Risk-analysis
• Project management
• Product development
• And much more.
The iMODELER is unique with its quick and easy to use features. When qualitatively modeling you will gain quick insights just from rough assumptions. It runs on any modern1 PC, Mac, Smartphone or Tablet-Computer as a web-based application (iMODELER-Service) or alternatively as an installed App Launcher for Win, Mac or Linux. You can use it as a personal decision making, brain storming and networking tool, or simultaneously with other users for Collaborative Modeling.
© Consideo GmbH 12/2012 (www.iMODELER.net)! 1 / 33
1 we have tested: Internet Explorer 9+, Safari 4+, Chrome 11+, Firefox 4+, Opera 11+, iOS Safari and Android Browser
Featuring the new,
quantitative iMODELER+

With the use of latest technologies (animations, multitouch and soon also 3D, voice control and more) modeling is fun and interactive!
The iMODELER+ offers quantitative modeling of scenarios, e.g. through system dynamics.
How 2 get it ?
Just visit www.imodeler.net !Try it on your browser* at (www.iMODELER.info), try the example models from our website, watch the video that shows almost every feature of the iMODELER or even visit one of our events.*we have tested: Internet Explorer 9+, Safari 4+, Chrome 11+, Firefox 4+, Opera 11+, iOS Safari and Android Browser
How 2 model ?
You can open and save existing models from both the iMODELER and also imported from the MODELER or, of course, build new models.
You will have no problems using MODELER models within the iMODELER. On the other hand, using iMODELER models in the MODELER will require some extra work to position factors and define submodels as the iMODELER does not use submodels and has no fixed positions for factors or connections.
But now let’s have a look at modeling within the iMODELER: Start a model
Click on the title to name your model:
Within the iMODELER you always start with a target factor, usually the central goal within your model. Click on this factor and then on the “i” to open its properties and name it.
© Consideo GmbH 12/2012 (www.iMODELER.net)! 2 / 33

You don’t need to save your model - it will be automatically saved within your app or your browser. However, nothing in the IT world is secure so you should make backups of your
models by exporting the files.
The model itself you can describe in the Model properties found in the Menu.
Build your model
Think of factors that directly influence your target, by either increasing (icon) or decreasing (icon) it:
• What leads to more of your target
• What leads to less of your target
• What may lead to more of your target in the future
• What may hinder your target in the future
Behind these simple questions lays the concept of the KNOW WHY Method from Kai Neumann. It helps to include the crucial factors to any challenge. As part of it you always ask for possible negative impacts as well as for possible future impacts. You identify whether a factor is integrated and developing, thus examining the evolutionary logic of existence for any factor (www.KNOW-WHY.net).
To define a new impact, type in a new factor name or choose an existing one or click on one you see in the background:
© Consideo GmbH 12/2012 (www.iMODELER.net)! 3 / 33

Repeat these questions for any factor in your model until you think you have included all decisive factors. You may alter these questions to fit your topic, for example: what is needed for..., what may happen..., what has to be done for..., what hinders..., what is technically/organizationally/psychologically/etc. necessary ...
Within the properties dialogue of a connections you can ask whether further connections between two factors exist. Also you can ask for a list of connections from any factor to the current center factor via Menu. In many cases we draw redundant connections that may lead to clouded results:
Alternatively you can look for a list of connections between two factors via the Menu item ‘Show connections’.
© Consideo GmbH 12/2012 (www.iMODELER.net)! 4 / 33

You will notice the automatic layout of the model that allows you to navigate through your model and change perspectives as later shown.
Hint: You can also use colors and description texts, through the properties dialogue of connections and factors. It is very useful to allocate the same colors to factors you want later to compare within the insight-matrix. You may even use different shades of the same color to indicate an additional dimension of information, e.g. the current state of a factor within a project or the likelihood of an incident. Then the insight-matrix shows that a factor is very import, and the intensity of the color you have chosen indicates whether this factor is likely or still to be done. Qualitative Modeling
Through Qualitative Modeling you can weight interconnections between factors by roughly estimating one factor’s influences on another factor as increasing or decreasing, weak, middle or strong, and immediate, middle-term or long-term. To do so open the properties dialogue of any connection by simply clicking/tapping on it:
© Consideo GmbH 12/2012 (www.iMODELER.net)! 5 / 33

Note that you can leave the properties dialogue open and simply click on other connections.
There are three ways to weight connections:
• Either quickly, with the attributes weak (10 impact scores), middle (17 impact scores) or strong (25 impact scores) taken from a simple comparison of influencing factors.
• Or by using quantitative values for the weights - e.g. to express weaker than weak (less than 10 impact scores), or stronger than strong (more than 25 impact scores).
• Or finally an analogy for real percentage values, or analog qualitative weighting.
You can see a weighting-matrix if you click on the figure to weight the connection:
The insights taken from qualitative modeling are gained through the insight-matrix, as shown later. Quantitative Modeling
See the second part of this paper at the end that features the new iMODELER+. With Quantitative Modeling we are looking at time series. Data and mathematical functions will define scenarios of the behavior of factors in our model. Qualitative modeling shows what is important, and quantitative modeling shows how something might develop.
Also available later in 2013 will be the possibility to define factor types to use the functionality of the PROCESS MODELER and the BI MODELER. Navigate and change perspectives
With the iMODELER, you can literally move the model in front of your eyes (drag it via mouse or touch). You will notice the distortion effect that allows you to see more of a larger model. In the middle of your screen, the factors are magnified.
If you want to put the current central factor back to the middle of the screen you can click/tap on:
© Consideo GmbH 12/2012 (www.iMODELER.net)! 6 / 33

You will notice that clicking/tapping on it the model shows just one level of connections of the central factor. Another click shows two levels and a third click shows all connections. © Consideo GmbH 12/2012 (www.iMODELER.net)! 7 / 33

This is a mighty feature as many models become very huge and difficult to read. With this feature you can literally tell a story around a factor that your viewers can follow far better than it would be possible if you had shown all the connections at once.
Maybe we should call this feature “iMODELER-storyteller”. What do you think?
To take different perspectives you can make any factor the central factor, allowing you to get a better look at what influences this factor and what this factor influences:
You may navigate back and forth through the perspectives you have taken and use “Search” to get to a factor:
Similar to how your brain makes associations, the iMODLER organizes a mess of ideas into interconnected chains of thought. Though, unlike your brain it does it right in front of your eyes, allowing you to keep track of arguments that you might have otherwise forgotten. With the iMODELER, you can jump from thought to thought and take different perspectives focusing on various parts of a comprehensive challenge. The iMODLER gives you the ability to jump back and forth and above all, analyze all the interconnections you have found!
By the way: with the scroll wheel of your mouse or the gesture on your trackpad or the short keys listed at the end of this manual you can zoom the model. Double click to reset the zoom.
With version 3.0 it is also possible to move the positions of factors temporarily, e.g. for presentation in the iMODELER Presenter or simply to have a better look at connections that are overlapping. The positions will reset as soon as you change the perspective again.
© Consideo GmbH 12/2012 (www.iMODELER.net)! 8 / 33
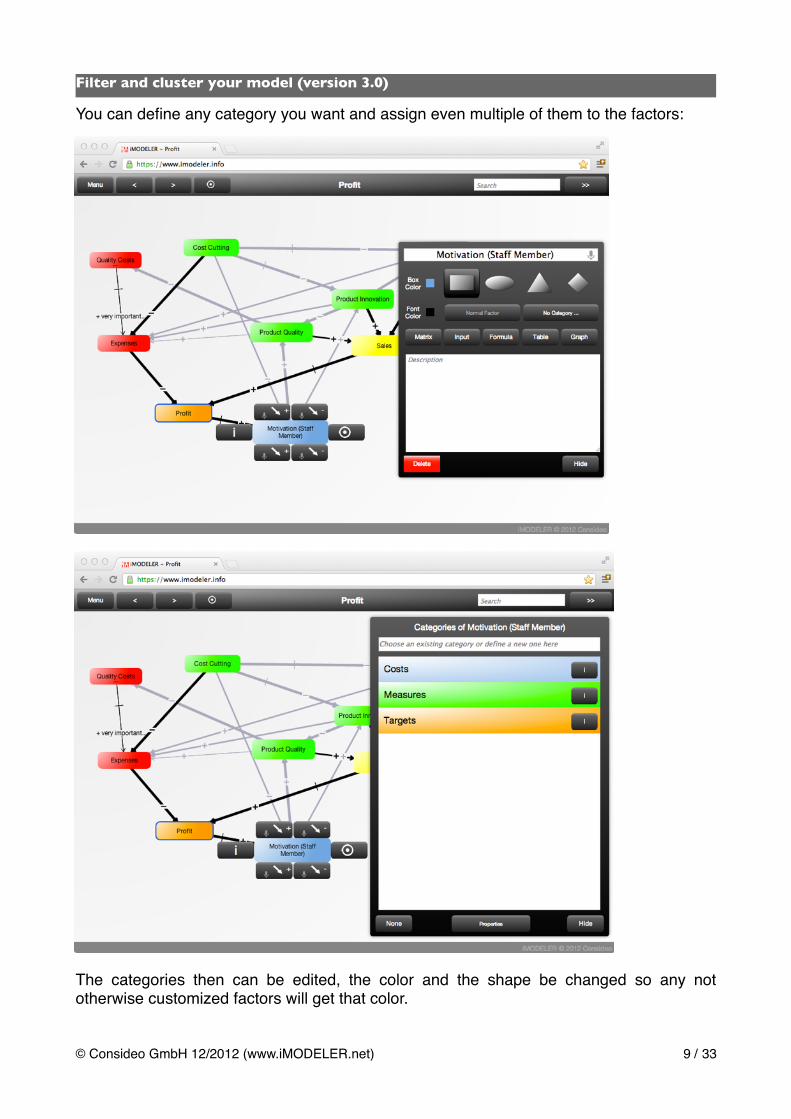
Filter and cluster your model (version 3.0)
You can define any category you want and assign even multiple of them to the factors:
The categories then can be edited, the color and the shape be changed so any not otherwise customized factors will get that color.
© Consideo GmbH 12/2012 (www.iMODELER.net)! 9 / 33

Having assigned categories we can choose the Menu … View … Filter/Cluster and select which factors you do not want to see in the model and hence filter, or which factors should be presented summed up as a cluster. For a cluster, e.g. the summary of factors representing measures and the summary of factors representing costs, we can even look at the sum of all its including factor’s impacts in the insight matrix.
The status bar at the bottom of the window indicates whether a cluster or a filter is used and the connections to and from clusters and between factors that are connected via factors that are filtered are dotted.
By the way: Filters and clusters work better than the concept of submodels from the classic MODELER.
Analyze your model qualitatively
After weighting your model, and possibly adding colors to comparable factors, you can look at any factor’s insight-matrix. You will get crucial insights beyond any gut feeling or knowledge of best practice from the past.
© Consideo GmbH 12/2012 (www.iMODELER.net)! 10 / 33
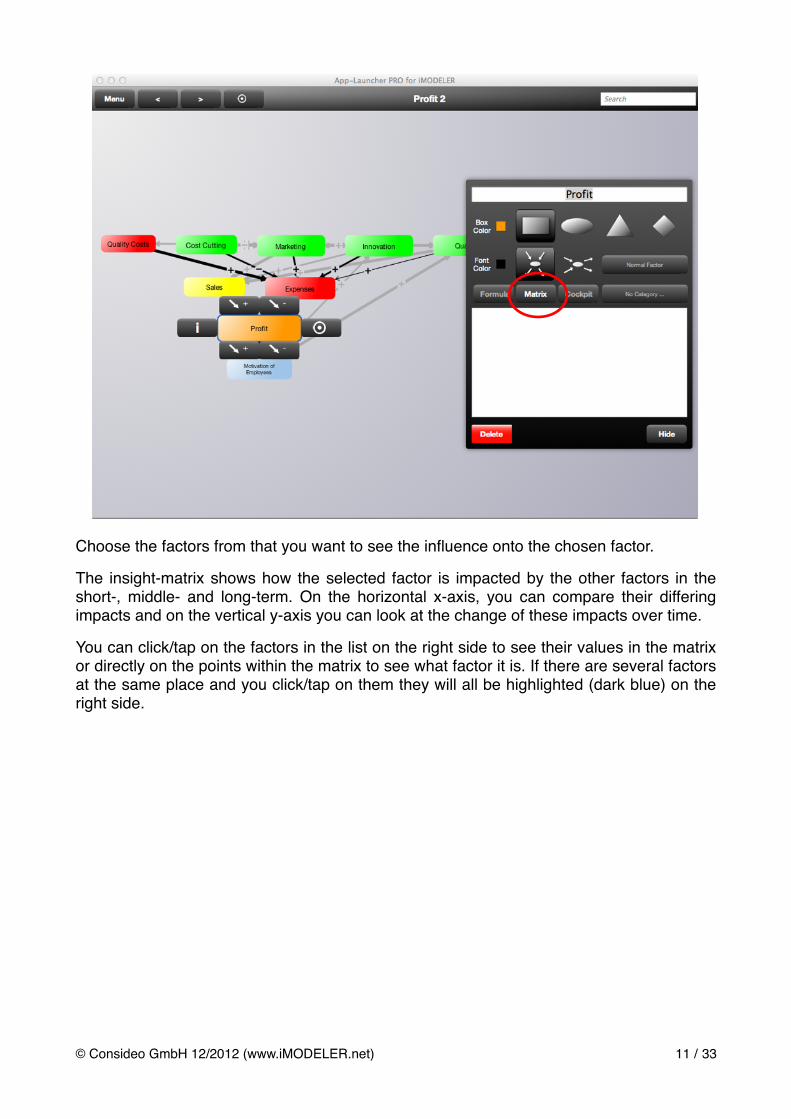
Choose the factors from that you want to see the influence onto the chosen factor.
The insight-matrix shows how the selected factor is impacted by the other factors in the short-, middle- and long-term. On the horizontal x-axis, you can compare their differing impacts and on the vertical y-axis you can look at the change of these impacts over time.
You can click/tap on the factors in the list on the right side to see their values in the matrix or directly on the points within the matrix to see what factor it is. If there are several factors at the same place and you click/tap on them they will all be highlighted (dark blue) on the right side.
© Consideo GmbH 12/2012 (www.iMODELER.net)! 11 / 33

You can also zoom areas of the matrix and move the zoomed area by dragging.
The insight-matrix cannot show you when something occurs or to what amount it results, but it allows you to identify large risks as well as crucial levers e.g. successful measures through comparison. This unique feature of the iMODELER/MODELER lets you to gain insight from rough assumptions. In many cases, those fuzzy, rough assumptions represent your gut-feelings and describe a situation better than any sophisticated formula could have.
© Consideo GmbH 12/2012 (www.iMODELER.net)! 12 / 33

Show loops
The dynamics of your model depends on the feedback loops you have identified.
There might be reinforcing feedback loops that lead to a somehow exponential growth of something or balancing feedback loops that lead to an either decreasing increase impact, or a decreasing decrease effect. One factor might influence the loop making it a vicious cycle while others influencing the same loop make it working as a virtuous cycle.
Quite often you will build models with more than 1.000 loops. Then the iMODELER shows just the shortest first 1.000 loops. In general only shorter loops should have a significant impact.
If you want to see in what loops a certain factor is involved you can use the Search box to filter the set of found loops.
© Consideo GmbH 12/2012 (www.iMODELER.net)! 13 / 33

The loops are then shown in your model with red colored connections for the reinforcing feedback loops, and blue connections for the balancing ones. Connections that are part of balancing and reinforcing feedback loops have both colors.
Of course, for some loops you need to change the perspectives of your view to see them completely.
© Consideo GmbH 12/2012 (www.iMODELER.net)! 14 / 33

Show impacts
The weighting you give to the connections you can choose to display as direct impacts:
Alternatively you can choose to show the indirect impacts the factors have on the current central factor of you model:
© Consideo GmbH 12/2012 (www.iMODELER.net)! 15 / 33

Model presenter (version 2.0)
Especially larger models offer a large number of insights from different perspectives onto the model, from different insight matrices. To show them live in front of an audience can be a challenge as you have to keep in mind what to show and have to wait until the calculations are computed. That inspired us to include an iMODELER Presenter. There you can collect views from your model and build a presentation of them:
© Consideo GmbH 12/2012 (www.iMODELER.net)! 16 / 33

You can change the order of the pictures via a button to move one picture one position up. Also you can show your presentation in full screen view:
Use your iMODELER-Cloud
© Consideo GmbH 12/2012 (www.iMODELER.net)! 17 / 33

For the iMODELER-Service you have to choose your email address and a password. You can test it for free for three days.
For the login into your account you can opt to save your password (e.g. on your personal devices) or to explicitly declare the current device you are using a non-trusted computer. In the latter case the models are not automatically saved in the database of the browser and solely saved to your iMODELER-Cloud.
The iMODELER-Cloud means that you can leave one device and if you open the iMODELER on another device (e.g. your smartphone on the go) it automatically opens the model that you have recently modeled. That is very comfortable.
Note: the models are saved automatically in your cloud and in the browser you are using (except you have named in a non trusted device). That means that you can model offline and when you log in or your internet connections is available again the iMODELER automatically synchronizes the models. If there is a version conflict from models that were changed on two devices without synchronizing via cloud the iMODELER asks you whether you want to overwrite one of them or make a copy to have two models.
Using the cloud you have two interesting features to search for models: You can choose to include all models from the cloud (“All”) and you can choose to look for models with factors that match your search term (“More”).
Alternatively to using the search function you can sort the table of models by clicking on the header of the iModel or Date column:
Share and backup your models
Via menu ‘Export model’ you can backup your model as an iMODELER-model or a MODELER-model.
With the iMODELER-Service via menu ‘Share’ you can generate read only links to you model. If you post them in the internet or send them via email to others they can click on © Consideo GmbH 12/2012 (www.iMODELER.net)! 18 / 33

the link the just need a modern browser to see your model with all the iMODELER’s functions to navigate, analyze, and even change the model. They just cannot save the changes.
Via menu ‘Import model’ you can load .imm models or .cons models into the iMODELER. With the iMODELER-Service there will be soon the complete functionality to open, save and share iMODELER and MODELER files.
Via menu ‘Export view’ you can save a picture file from the current view. Model collaboratively
Using the iMODELER-Service via menu ‘Share’ you can start a collaborative modeling session. Copy the link and send it to others that can either login to your session with their own iMODELER-Service account or as guest. For the guest only you have to have a sufficient number of licenses. You can either have up to three guests or up to 10 guests (see www.modeler-shop.com).
To model collaboratively means that every participant can work independently on the model while the changes are updated on the screens of the other participants dependent on the perspective of the model they have chosen.
To stop a collaborative modeling session just go to menu ‘Share’ again and stop it.
Hint: For a more efficient collaborative modeling session, users may define a new connection, but should discuss it before submitting it. Otherwise it can become too chaotic if everyone adds to the model without discussing it. You can use this technique even sitting in the same room with your guests. It can speed up workshops significantly because they don’t have to wait until the facilitator types their input.
© Consideo GmbH 12/2012 (www.iMODELER.net)! 19 / 33

Speech input
Via Google Chrome you can speed up you modeling using Speech input. In the Menu...Preferences you can activate it and then you can directly click or tap onto the microphone symbols of the buttons for the incoming our outgoing buttons of a factor. This is really cool. Of course you may also use the speech input that is offered by iOS or similar.
© Consideo GmbH 12/2012 (www.iMODELER.net)! 20 / 33

Short keys
Our developers have hidden some nice short keys. For some of them a factor or a connections needs to be selected:
L: ! ! ! ! ! show loopsP:! ! ! ! ! print viewI:! ! ! ! ! show info of factor or connectionC:! ! ! ! ! put selected factor into the centerD, Backspace, Delete: ! ! deleteM:! ! ! ! ! Insight MatrixCTRL+DOWN:! ! ! zoom OutCTRL+UP:! ! ! ! zoom InCTRL+0:! ! ! ! no zoom 100%ESC:! ! ! ! ! ESCN:! ! ! ! ! new modelO:! ! ! ! ! open modelSHIFT+S:! ! ! ! shareS:! ! ! ! ! search for factorsCTRL+LEFT:!! ! ! < change to the previous central factorCTRL+RIGHT:! ! ! > change to the following central factorSPACE:! ! ! ! toggle levels shown (the iMODELER-Storyteller)+:! ! ! ! ! new positive impact on the selected factor-:! ! ! ! ! new negative impact on the selected factorL:! ! ! ! ! show loopsF:! ! ! ! ! show filter and cluster dialogShift + P:! ! ! ! show presenterZ:! ! ! ! ! undoShift + Z:! ! ! ! redo
Part 2, quantitative modeling | | V
© Consideo GmbH 12/2012 (www.iMODELER.net)! 21 / 33

Quantitative modeling and the iMODELER+
While qualitative modeling goes fast and easy and yet in many cases provides the answers you were looking for, e.g. what measures are promising and what risks to take care of, quantitative modeling takes way more efforts. However, in some cases, especially when you need to know when something with what likelihood to what extent might happen, when you consider factors that are easy to measure, you may want to model quantitatively, running scenarios. That’s what you can do with the iMODELER+.
Soon there should be a video available.
Starting a quantitative model you should at first define the time unit for your simulation and the time period you want to run scenarios of. You can do this in the Menu …. Model Properties:
After that you have generally three ways to define a factor’s values:
© Consideo GmbH 12/2012 (www.iMODELER.net)! 22 / 33

1. You can have an input factor ….
….that is not defined by other factors from the model and hence needs to get its values over time directly, either by a constant you define in the formula field or by an input series that you can drag directly into the diagram, insert into the table or import from external data sources (coming with version 4.0):
© Consideo GmbH 12/2012 (www.iMODELER.net)! 23 / 33

2. You can use formula …
…. to describe the effect that incoming factors have onto the selected factor:
This way you define how the values of the other factors from each time step result in the value of the current factor at the same time step. The functions you can use are comparable to those from Excel or other tools. For each function you can see a description within the iMODELER. Soon a best practice book should offer additional information. Meanwhile you should use the www.modeler-forum.com to ask for assistance. (for the registration on the forum you need to know “urx” as an answer)In most cases you just need to click on an incoming factor’s name from the list and on the buttons from the calculator area or you may even use the so called power-functions, e.g. “Additive” or “Multiplicative”, that automatically propose a formula. You may even combine them and define that you want an additive formula the doesn’t get negative values. Also a power function is a “Stock” which you may know from system dynamics or as a “Level-Factor” from the classic MODELER. Using this you get a formula that sums up all its incoming factors with a delay of one time step, just as stocks in system dynamics do. The advantage is, that you can manipulate this formula and that you have no restrictions from the rules of system dynamics. (See e.g. Sterman “Business Dynamics …” for background information on system dynamics)Another power-function is “relative_quantification”. This one transforms the weightings from a qualitative model into a formula, e.g. combined with “additive” or “multiplicative”. This is a very mighty function that allows especially soft factors without a unit to be computed.As I mention units: Here you can also define the units for each factor and the interpolation of its values in the graphs in the cockpit.
© Consideo GmbH 12/2012 (www.iMODELER.net)! 24 / 33

3. You can define a factor’s values as a related to the values of another factor ….
…. by a graphical function or a table with relation values:
This is extremely useful if you have to relate a factor with for example currency values between 0 and 1000 with a soft factor, e.g. the motivation to spend money, that has no dimension and just value between 0 and 1.
© Consideo GmbH 12/2012 (www.iMODELER.net)! 25 / 33

The simulation of your model …
then is really easy. Just choose whether you want to look at a table or a graph, add up to 4 factors that you want to compare with a selected factor and then choose either to simulation the whole scenario (>) or just step after step (>|):
When you then select other factors their results will be right there. For more details choose Full screen and there you can even add parameters that you can use to alter the scenario:
© Consideo GmbH 12/2012 (www.iMODELER.net)! 26 / 33

To see whether your model is completely quantified and the formulas are correct you can choose the Menu...View… Quantitative validation.
© Consideo GmbH 12/2012 (www.iMODELER.net)! 27 / 33

Scenarios
In the full screen modus of the cockpit of each factor you can click on Scenario to save the current set of parameters of the model. This way you can quickly compare different scenarios. Note that just the parameters are saved - not changes of the model structure.
© Consideo GmbH 12/2012 (www.iMODELER.net)! 28 / 33

Monte-Carlo-Simulation
If you use random(), likelihood(), gaussrandom() or other random functions within you model the iMODELER asks how often you would like to simulate your model to come up with a range of possible outcomes.This is extremely useful to make your model more realistic as you probably cannot be sure on the value of certain parameters.
The result can be seen in the full screen modus of any factor’s cockpit. There you can click on MC/OR to see a spaghetti diagram. With the help of the zoom function you can click on any curve to choose the scenario that led to its values. When you have chosen a scenario all other factors show its values.When you switch to show a histogram you can choose to see the likelihood of certain outcomes at a certain point of time. Click on one bar and see to concrete likelihood.Note that you should run as many Monte Carlo simulation as needed to get a stable, representative result.
© Consideo GmbH 12/2012 (www.iMODELER.net)! 29 / 33

© Consideo GmbH 12/2012 (www.iMODELER.net)! 30 / 33

Range() Function
The range() function has at least two purposes. It allows you to automatically run a set of scenarios with parameters ranging from one value to another with a choosable step size. The first use is to see how robust your model is in a sense of a sensibility analysis. You will detect unrealistic escalations of your simulation results from extreme but still realistic parameter combinations.The second use is to identify optimal parameter combinations in the sense of Operations Research optimizations. Just define a range for each parameter and the iMODELER tries (brute force) all possible combinations. If you have restrictions to consider it is fairly simple to calculate only results that fit these restrictions.
In the full screen modus then you can click on the curve that shows the scenario you want. You can then look for the parameters of this scenario - your optimal solution.
© Consideo GmbH 12/2012 (www.iMODELER.net)! 31 / 33

© Consideo GmbH 12/2012 (www.iMODELER.net)! 32 / 33

There is much more to come:
- Import and export of data, e.g. from and to Excel (version 4 or even 3.5)- PROCESS MODELER features to ease the simulation of processes and projects where processes are dependent from the availability of resources (see Theory of Constraints) (probably version 4)
So there is more to come. Use to forum to ask for assistance or features and provide feedback.
Happy modeling :-)
© Consideo GmbH 12/2012 (www.iMODELER.net)! 33 / 33