Embed Size (px)
Citation preview

PROBABILITY
Probability
Probability is a measure of how likely something is to happen. If you flip a coin, the probability of the coin landing heads is 50%, meaning that you expect it to land heads 50 times out of every 100 flips. If you roll a die, the probability of the die landing on 4 is 1/6 (because a die has 6 faces), meaning that on average, you would roll a 4 once every 6 rolls.
Conditional Probability
Sometimes the probability of an event is increased or decreased by other events. The probability that there is no final for this class is very low. But IF I die, the probability is much higher. And IF Lingnan closes, the probability is much much higher. We say that the probability of P IF Q is the probability of P conditional on Q.
Representing Probabilities
We can represent probabilities using the symbol P(-). [This is a little confusing, because before we were using P to represent sentences.] For example:
P(H) = 50%
This might mean “the probability of the coin landing heads is 50%.”
So for example, before we learned that the probability of A happening is always greater than or equal to the probability of A and B happening. We can represent this truth as follows:
P(A) ≥ P(A & B)
Conditional Probabilities
We also have a way of representing conditional probabilities: P(A/B) means “the probability of A conditional on B” or “the probability that A will happen IF B happens.”
P(~F/C) > P(~F)The probability that there will be no final conditional on Lingnan closing is greater than the probability that there will be no final.
Review: Which of the following two statements is true?
1. P(Fido is an animal/ Fido is a dog) = 100%.
2. P(Fido is a dog/ Fido is an animal) = 100%.
Experiments
Scientific Method
Science proceeds by the hypothetico-deductive method, which consists of four steps:1. Formulate a hypothesis2. Generate testable predictions3. Gather data4. Check predictions against observations
Experiments
Today we’re going to talk about experiments and good experimental design.
How do we design experiments that can test our hypotheses? Experiments that can generate data that are relevant to our predictions?
Causation
Much of science is concerned with discovering the causal structure of the world.
We want to understand what causes what so we can predict, explain, and control the events around us.
Prediction
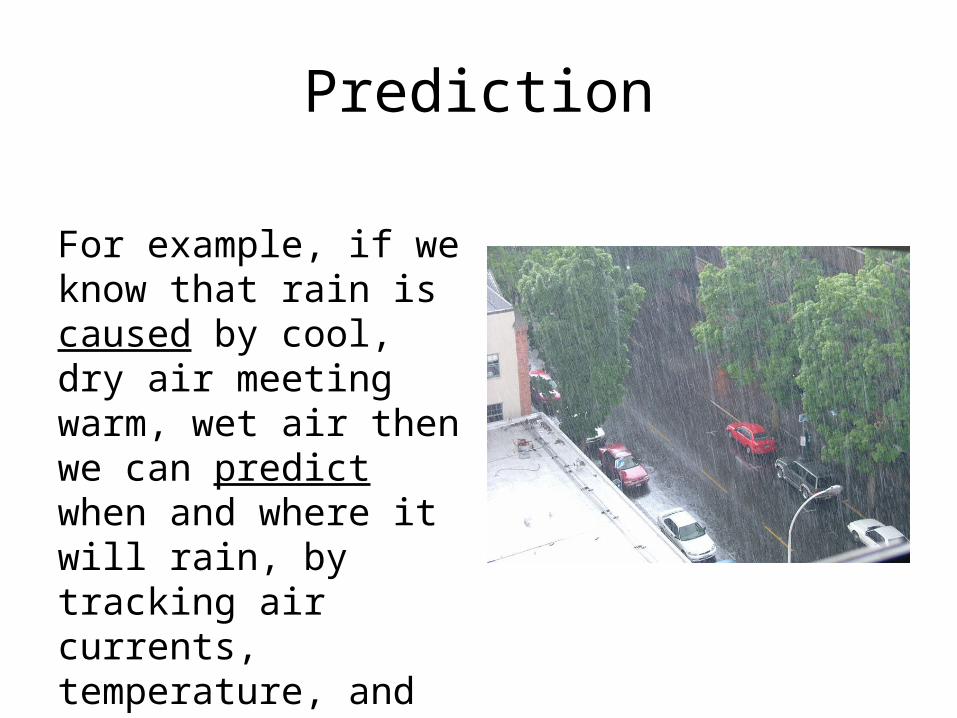
For example, if we know that rain is caused by cool, dry air meeting warm, wet air then we can predict when and where it will rain, by tracking air currents, temperature, and moisture.
Prediction
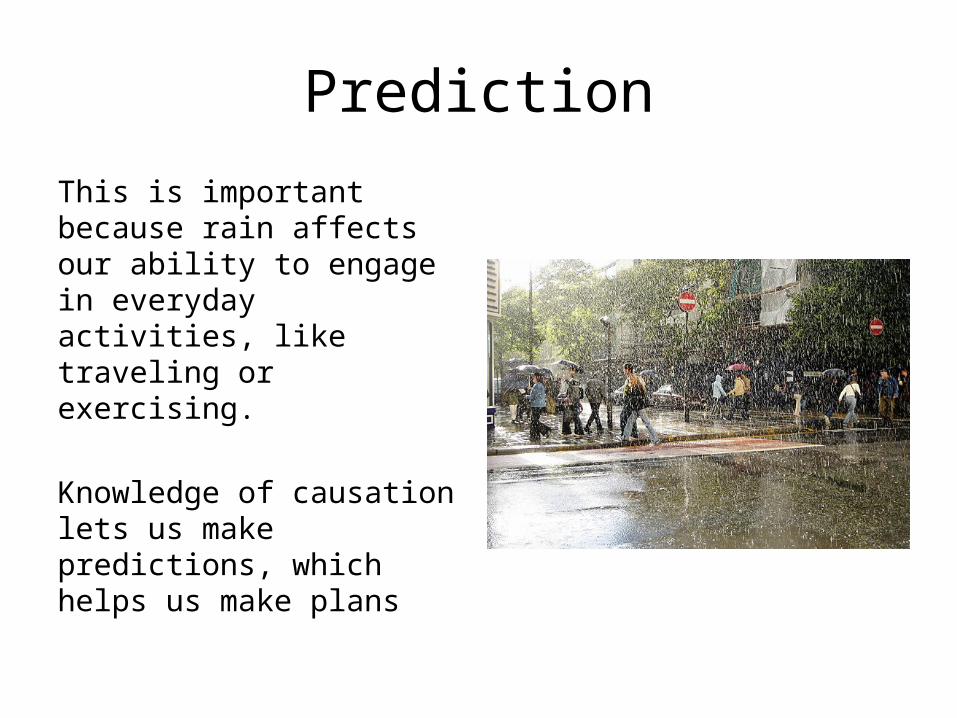
This is important because rain affects our ability to engage in everyday activities, like traveling or exercising.
Knowledge of causation lets us make predictions, which helps us make plans
Explanation
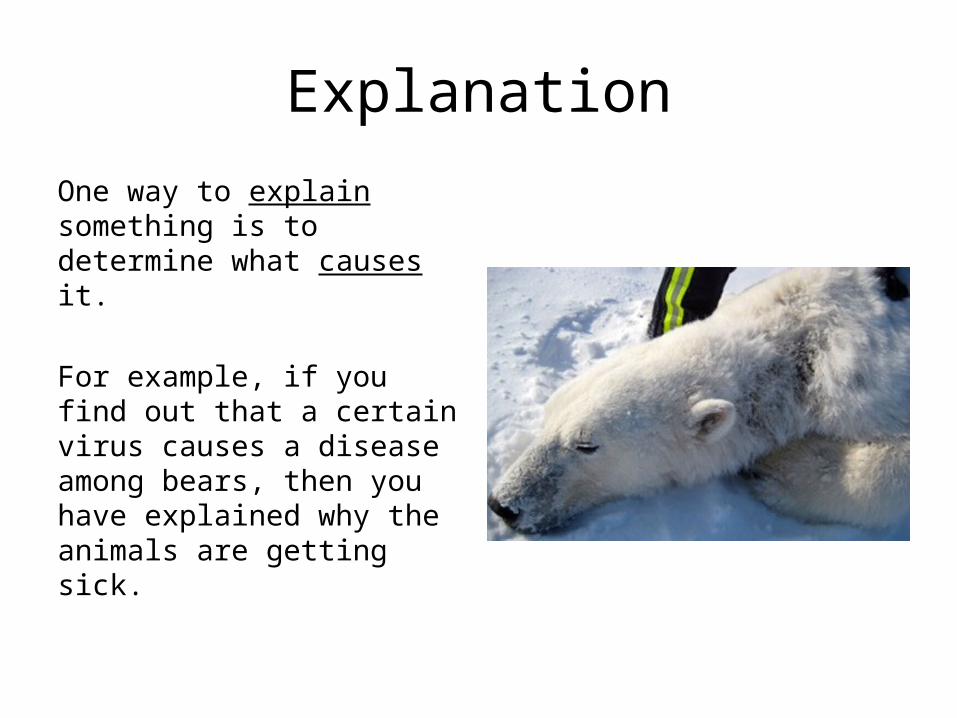
One way to explain something is to determine what causes it.
For example, if you find out that a certain virus causes a disease among bears, then you have explained why the animals are getting sick.
Explanation
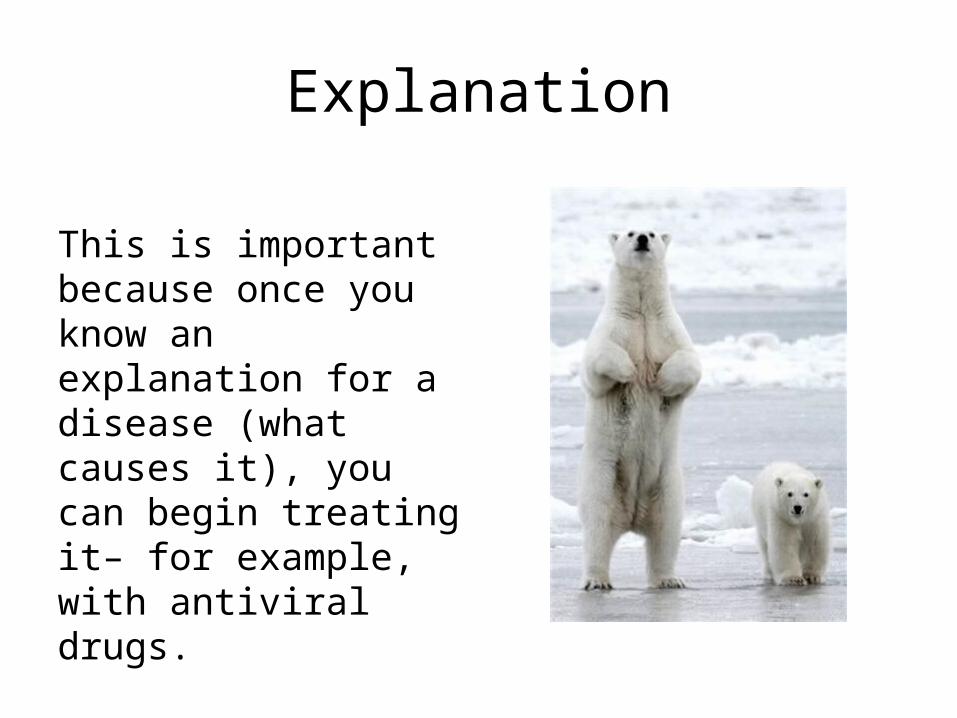
This is important because once you know an explanation for a disease (what causes it), you can begin treating it– for example, with antiviral drugs.
Control
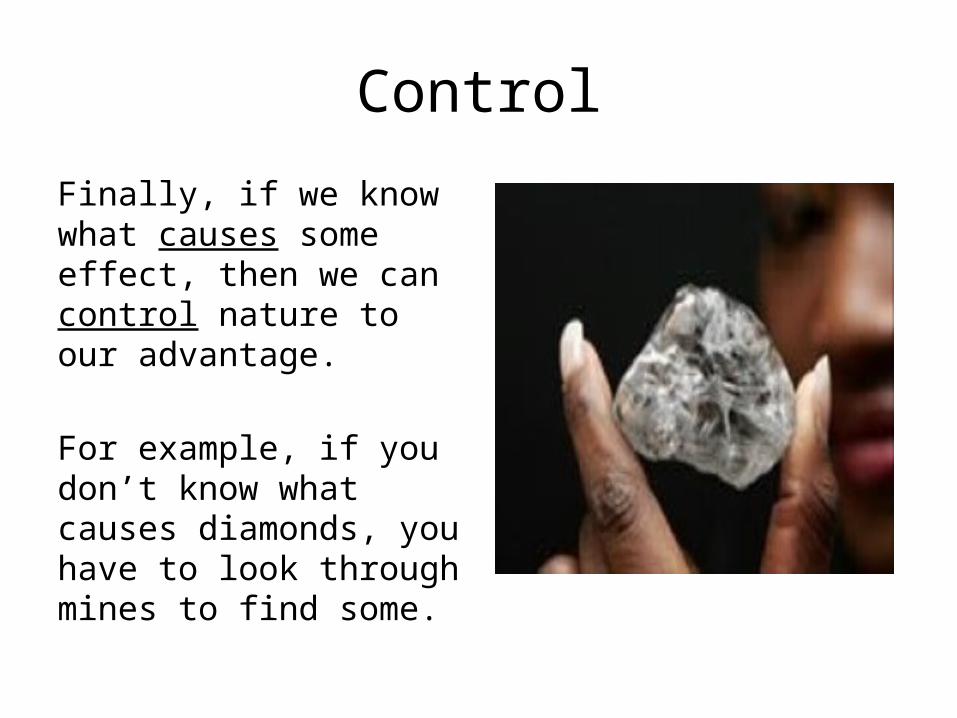
Finally, if we know what causes some effect, then we can control nature to our advantage.
For example, if you don’t know what causes diamonds, you have to look through mines to find some.
Control
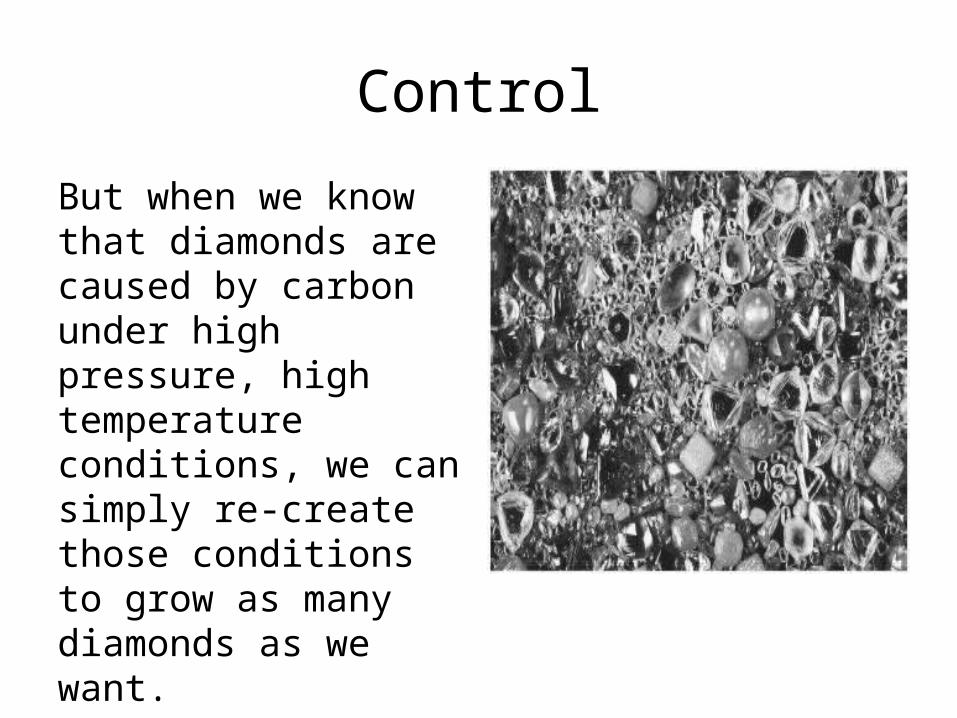
But when we know that diamonds are caused by carbon under high pressure, high temperature conditions, we can simply re-create those conditions to grow as many diamonds as we want.
CAUSATION VS. CORRELATION
Independence
In statistics, we say that two variables are independent when the value of one variable is completely unrelated to the other:
P(A/ B) = P(A) and P(B/ A) = P(B)
B happening does not make A any more likely to happen. (If that’s true, so is the reverse.)
Example
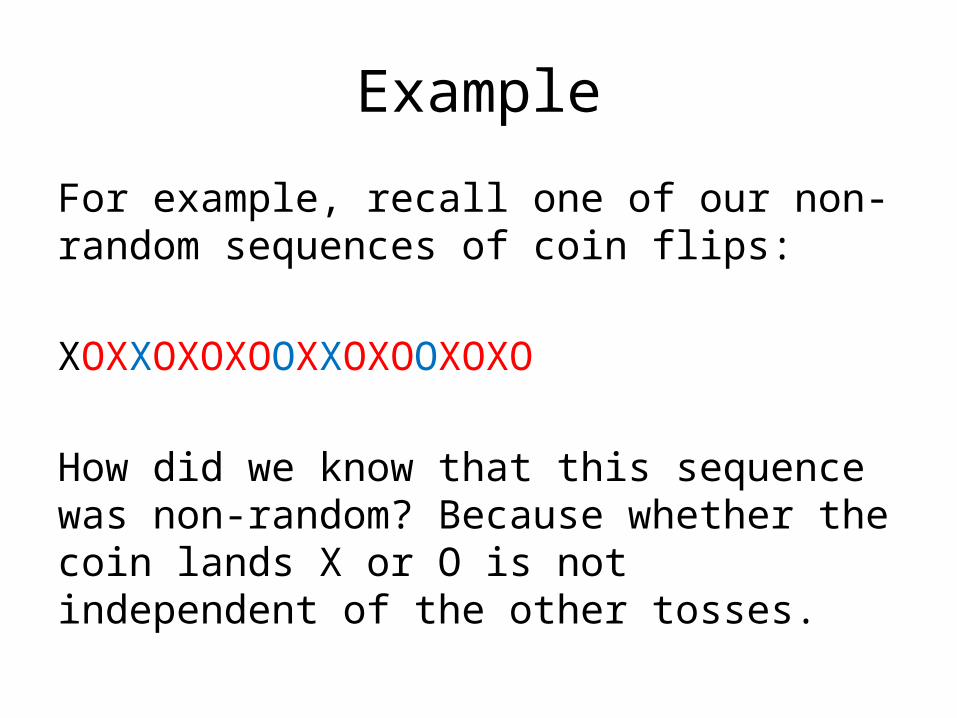
For example, recall one of our non-random sequences of coin flips:
XOXXOXOXOOXXOXOOXOXO
How did we know that this sequence was non-random? Because whether the coin lands X or O is not independent of the other tosses.
Example
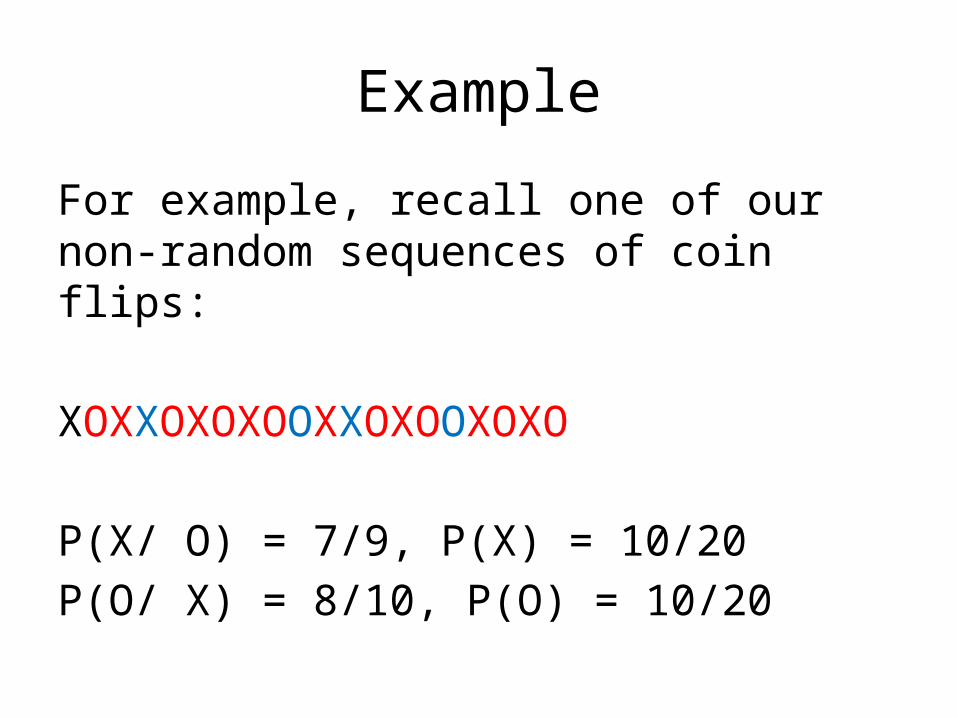
For example, recall one of our non-random sequences of coin flips:
XOXXOXOXOOXXOXOOXOXO
P(X/ O) = 7/9, P(X) = 10/20P(O/ X) = 8/10, P(O) = 10/20
Correlation
Two variables A, B that are not independent are said to be correlated.
A and B are positively correlated when P(A/ B) > P(A). If B happens, A is more likely to happen.
A and B are negatively correlated when P(A/ B) < P(A). If B happens, A is less likely to happen.
Correlation
Other relationships between variables are often called correlation as well.
A and B are positively correlated when increases in A correspond to increases in B.
A and B are negatively correlated when increases in A correspond to decreases in B.
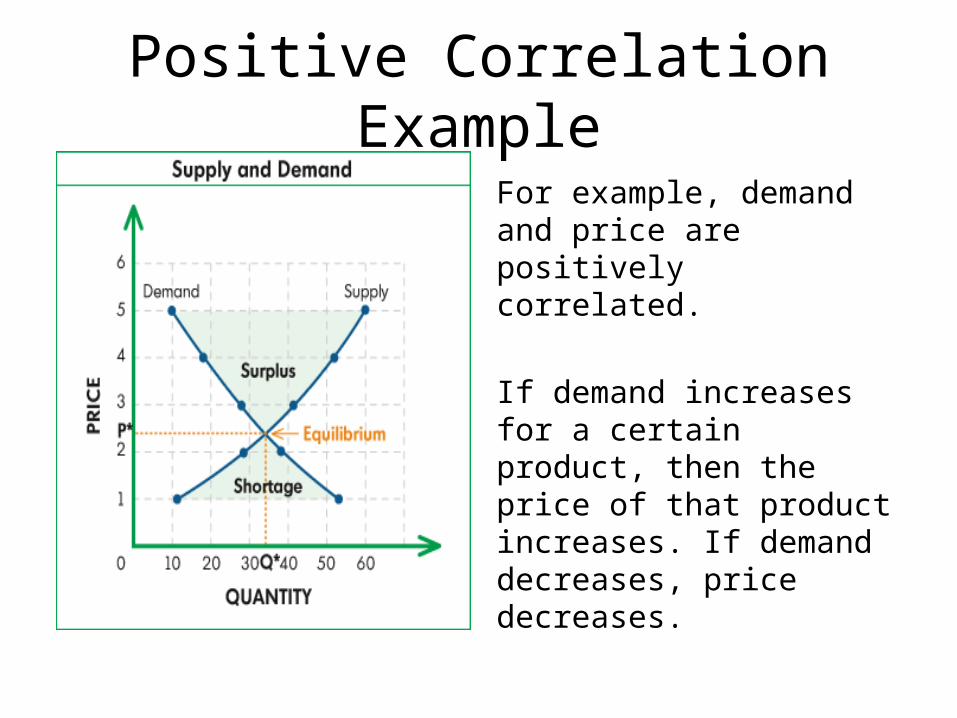
Positive Correlation Example
For example, demand and price are positively correlated.
If demand increases for a certain product, then the price of that product increases. If demand decreases, price decreases.
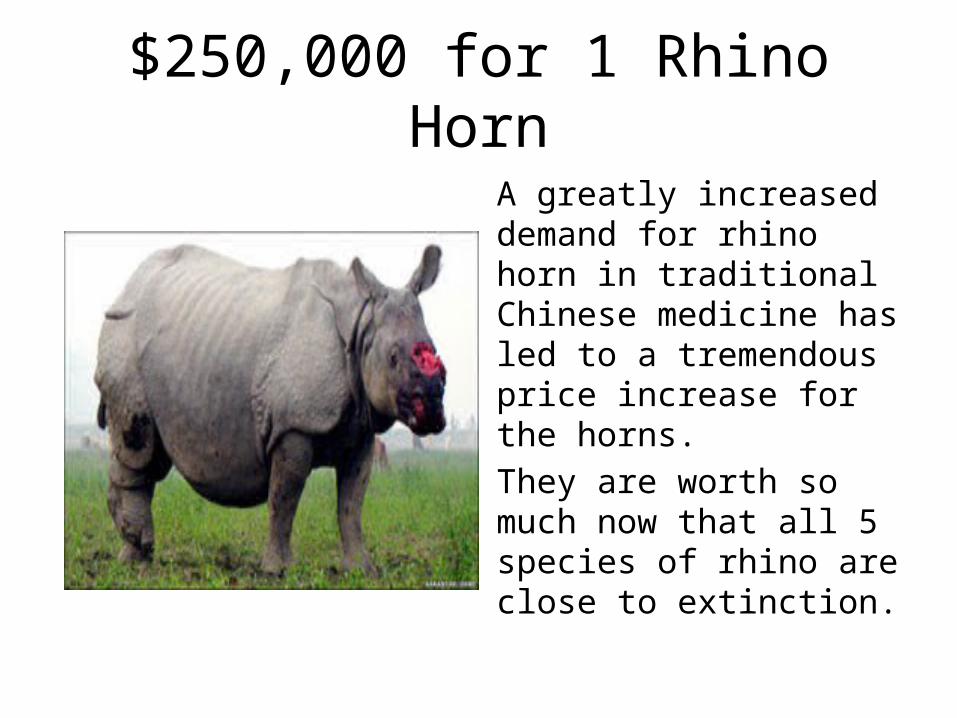
$250,000 for 1 Rhino Horn
A greatly increased demand for rhino horn in traditional Chinese medicine has led to a tremendous price increase for the horns.They are worth so much now that all 5 species of rhino are close to extinction.
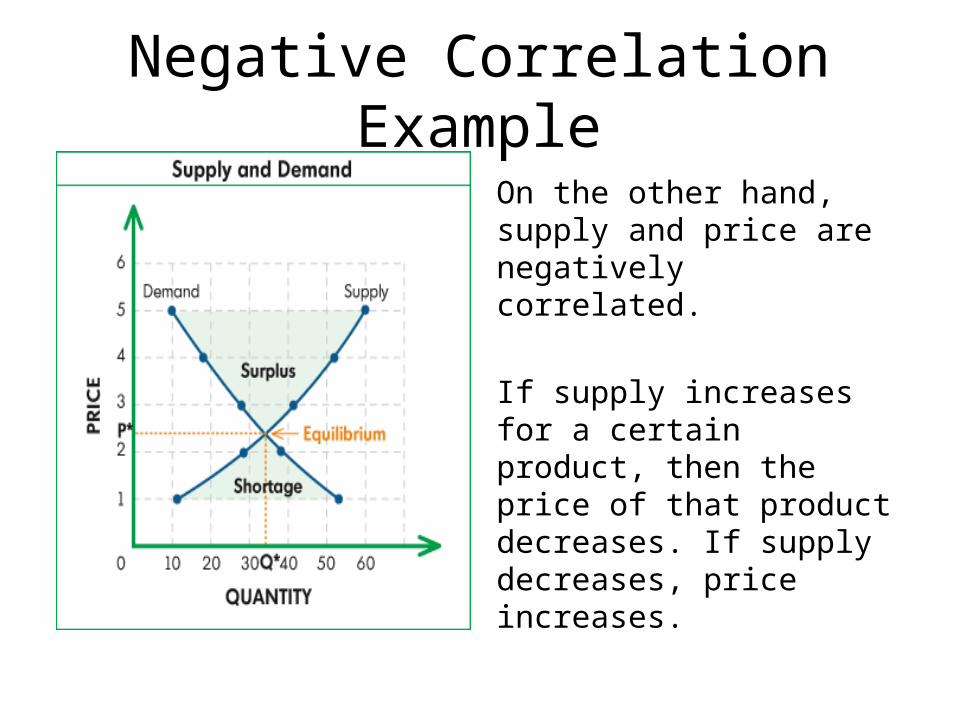
Negative Correlation Example
On the other hand, supply and price are negatively correlated.
If supply increases for a certain product, then the price of that product decreases. If supply decreases, price increases.

Pork Prices Predicted to Soar
So recently, higher corn prices have made pig-farming less profitable, leading to a decreased supply of pigs.
Experts are predicting that there will be an increase in pork prices next year.
Causation and Correlation
One thing that can lead two variables A and B to be correlated is when A causes B.
For example, if having a cold causes a runny nose, then having a cold is correlated with having a runny nose:
P(cold/ runny nose) > P(cold)
Causation and Correlation
Similarly, the number of cars on the road is correlated with the number of accidents: if there is an increase in the number of people driving, there will be an increase in the number of car accidents.
This is because a larger number of cars causes a larger number of accidents.
Causation ≠ Correlation
But causation does not imply correlation. If A and B are correlated there are several possibilities:
• A causes B• B causes A• C causes A and C causes B• A and B are only accidentally correlated
B causes A
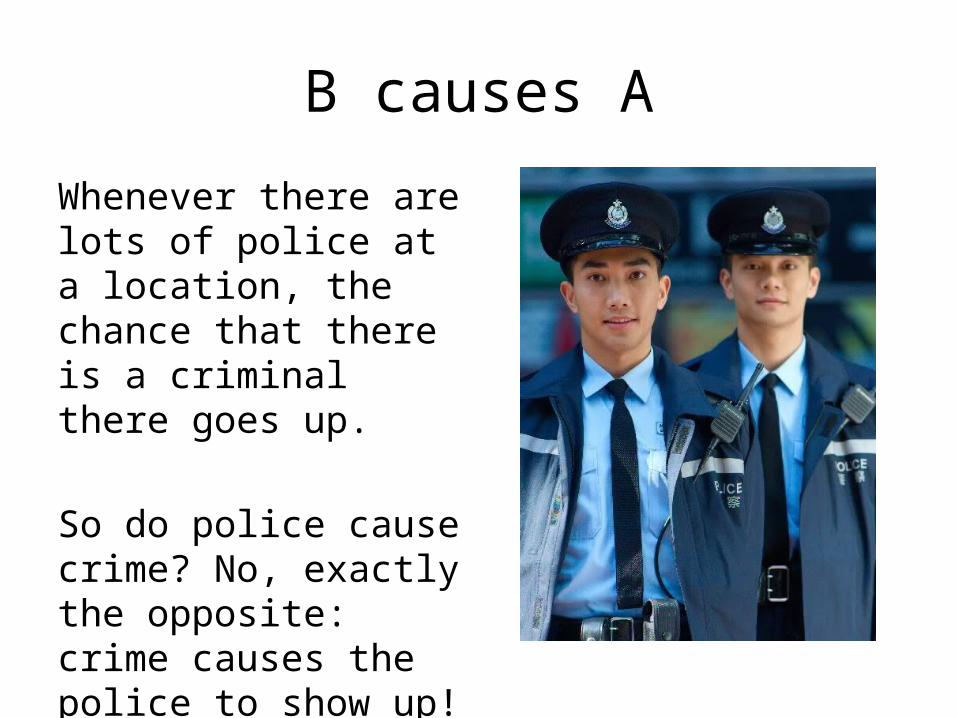
Whenever there are lots of police at a location, the chance that there is a criminal there goes up.
So do police cause crime? No, exactly the opposite: crime causes the police to show up!
B causes A
Here’s a somewhat more realistic example. It has been observed that democracies tend to get in fewer wars than non-democratic countries.
A plausible inference would be that the negative correlation between democracy and war is due to the fact that democracy causes peace.
B causes A
But there’s another explanation, and some studies have suggested that it’s the right one.
Frequent wars cause a country to not be democratic. Countries that get in a lot of wars don’t have the stability that’s necessary for democracy to flourish.
Common Cause
Sometimes A and B are correlated, not because A causes B and B causes A, but instead because a third variable C, the common cause, causes both A and B.
Porn and Rape
A study of U.S. prison inmates found that prisoners who had been exposed to pornography earlier in life were less likely to be in prison for rape, compared with those exposed to porn later in life.
Porn and Rape
Does this mean that exposure to porn early in life prevents men from becoming rapists? Should you give your children porn?
No. Inmates who had been exposed to porn later were more likely to have had a religious fundamentalist upbringing.
Porn and Rape
And a religious fundamentalist upbringing was correlated with higher rates of sexual deviancy (and rape).
Fundamentalist upbringing caused both late exposure to porn and higher chances of sexual crimes.
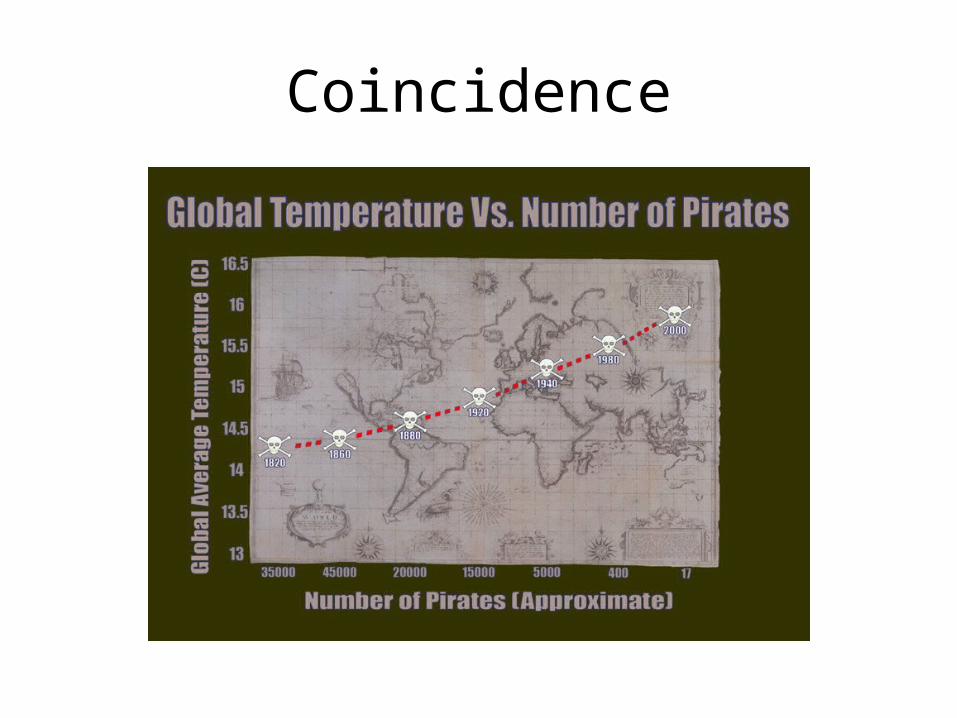
Coincidence

The “Texas Sharp Shooter”
Suppose I stand in front of a barn. I have a machine gun with me, and I am blindfolded. I shoot wildly at the barn for several minutes.
Afterward, I walk up to the barn. I find a spot where three bullets are very close together, and I paint a target around them. “Look!” I say, “at what an excellent marksman I am!”
Rare Things are Frequent
Rare coincidences are bound to happen sometimes. How likely is it that someone will both win the lottery and get struck by lightning?
Well, there is 1 lottery every week, 50 every year. In a span of 30 years, 1500 people will win the lottery.
Getting Struck by Lightning
There is a 1 in 1 million chance of getting struck by lightning in any given year. Let’s suppose each lottery winner on average lives 30 years after winning. That’s 30 distinct 1 in 1 million chances of getting struck, or a 30 in 1 million chance of getting struck in 30 years.
P(struck) = 1 – P(not struck) = 1 – .999999^30
Winners Getting Struck by Lightning
So what’s the probability that any of the 1,500 winners will get struck?
P(some winner is struck) = 1 – P(no winner is struck) = 1 – .99997^1500 = 1 – .955997 = .044 = 4.4%.
That’s higher than the probability that a coin will land heads 5 times in a row.
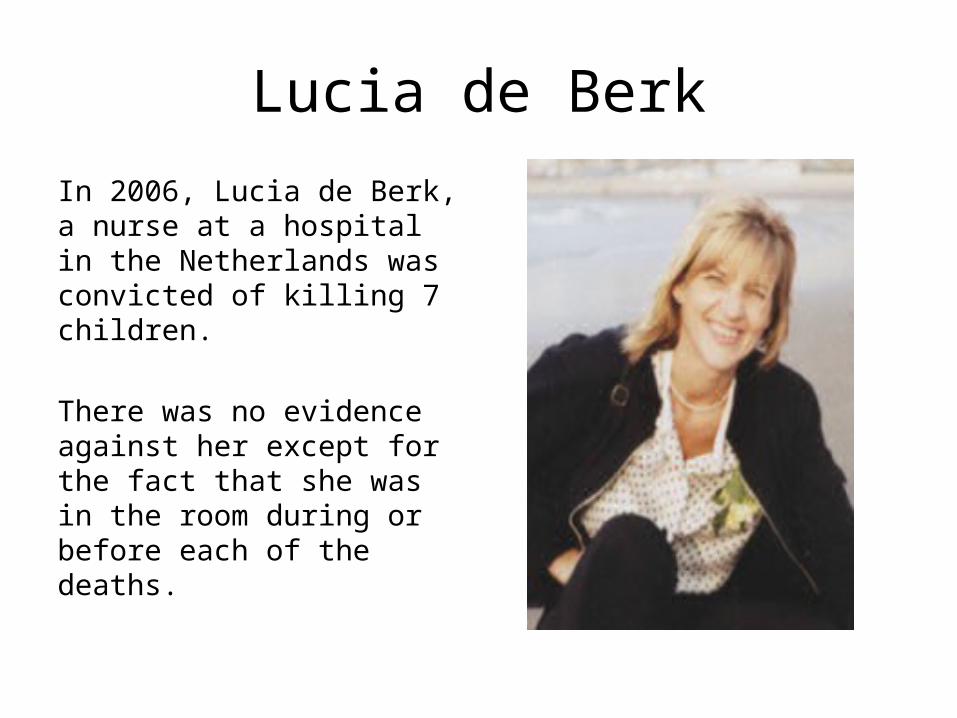
Lucia de Berk
In 2006, Lucia de Berk, a nurse at a hospital in the Netherlands was convicted of killing 7 children.
There was no evidence against her except for the fact that she was in the room during or before each of the deaths.
Correlation
Prosecutors reasoned that there was a correlation: Lucia de Berk in the room & death.
It couldn’t be that the deaths caused her to be in the room.It couldn’t be that some common cause C both caused her to be in the room and the deaths.So the only other option was that she caused the deaths.
Coincidence
But there was a third option: coincidence.
How many hospitals are there in all the world? How many nurses work at each of those hospitals? What are the chances that, just by accident, in one of those hospitals one of those nurses just happened to be present for 7 deaths?
Rare Things are Frequent
Richard Gill, Professor of Mathematical Statistics at the University of Leiden, worked hard to overturn the case. He estimated that the chance that this was an accident was 1 in 9.
This doesn’t prove that she’s innocent (or guilty). But things that have a 1 in 9 chance of happening happen all the time!

EXPERIMENTAL DESIGN
Types of Scientific Studies
There are two basic types of scientific studies (the stuff that gets published in scientific journals and reported in the “science” section of the newspaper):
• Observational studies• Controlled experiments
Observational Studies
An observational study looks at data in order to determine whether two variables are correlated.
Observational Studies
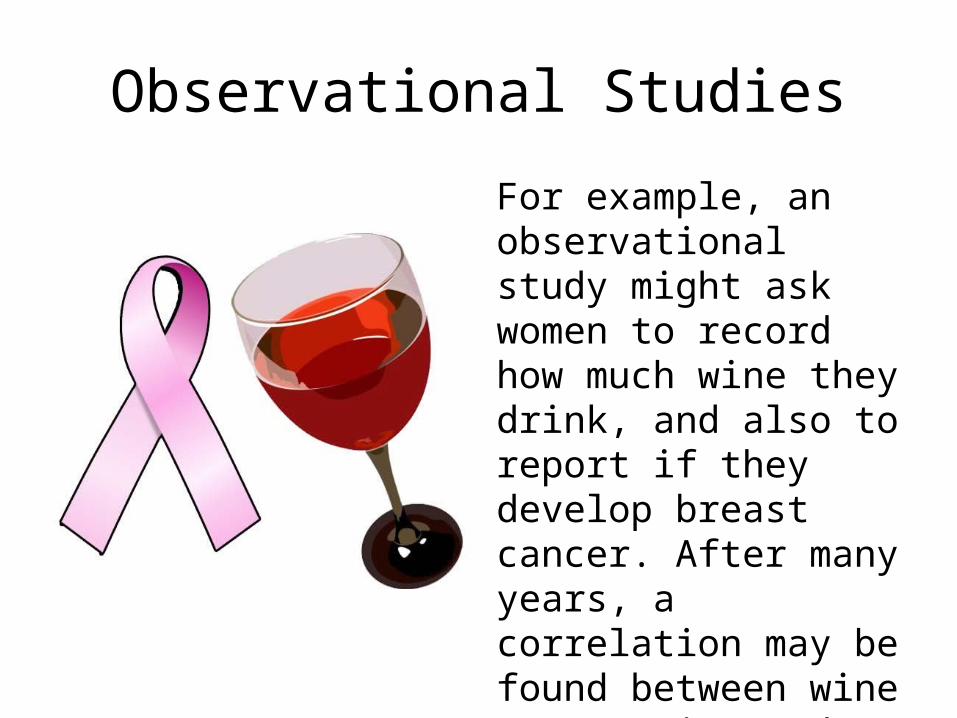
For example, an observational study might ask women to record how much wine they drink, and also to report if they develop breast cancer. After many years, a correlation may be found between wine consumption and cancer.
Importantly, observational studies can only show whether two variables A and B are correlated. They cannot show whether A causes B, or B causes A, or some third cause causes both, or if the correlation is accidental.
Controlled Experiments
The first recorded controlled experiment occurs in the Book of Daniel, part of the Jewish Torah and the Christian Bible.

Daniel’s Experiment
Daniel wanted to discover which of two diets was better: a diet of meat and wine, or vegetables.So he proposed that some servants eat one diet and the rest eat the other. Then at the end of 10 days, they’d see who looked healthier.
Controlled Experiments
In a controlled experiment there are two groups who get separate treatments.
One group, the “control group” gets the standard treatment. For example, all of the king’s servants ate meat and wine before Daniel suggested a different diet might be better.
Controlled Experiments
The other group, the “experimental group”, gets the treatment we plan to test.
If the test group has better results than the control group, we have good evidence that our new treatment should be adopted.
Why are They Better?
Observational studies only reveal correlations, they can’t reveal causation.
Controlled experiments are also only studies of correlation: correlation between the control group and outcomes, and correlation between the experimental group and outcomes.
Why are They Better?
But controlled experiments are better than observational studies. Why?
In observational studies, people are not randomly assigned to conditions. For example, an observational study might find a correlation between using a cane and dying within a year.
Canes
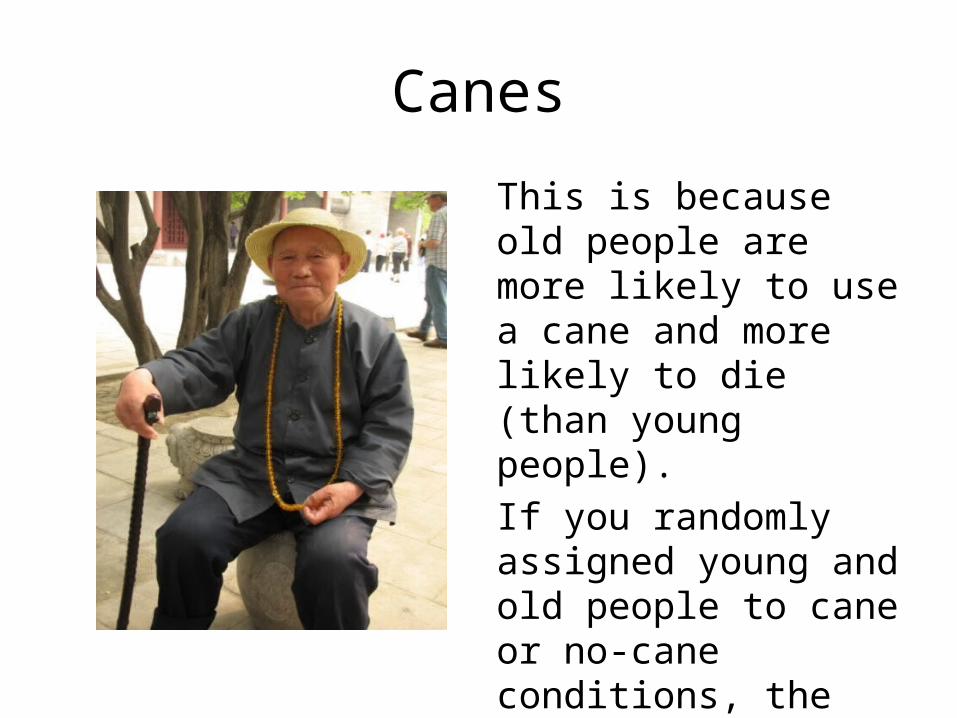
This is because old people are more likely to use a cane and more likely to die (than young people).If you randomly assigned young and old people to cane or no-cane conditions, the correlation would go away. Canes don’t cause death.
Confounding Variables
A confounding variable is a variable that affects the variables you want to study.
For instance, if you want to study whether canes cause death, age is a confounding variable, because age influences your chances of death.
Confounding Variables
A controlled experiment lets you “control for” confounding variables. You can make the control group and the experimental group have equal numbers of people from each age group.
Then you know that if more people in your experimental group die, it wasn’t due to their age (the other group had similar ages).
Controlling
In an observational study, there is no way to rule out a common cause for two correlated variables A and B.
In an experimental study, the common cause is ruled out, because the experimenter is the one who causes (“controls”) whether people have A or not.
Controlling
In an observational study, there is no way to rule out B causing A rather than A causing B. Does wine reduce the risk of cancer, or does a lowered risk of cancer increase wine consumption?
If experimenters control who gets wine, then we can rule out the hypothesis that in our study, lowered cancer risk causes wine drinking.
Next Time
We’ll talk more next time about other things that can bias an experiment and how to “control for” them.
What about Observational Studies?
Why do scientists still conduct observational studies, if controlled experiments are considered better evidence?
1. Moral reasons2. Practical reasons
Moral Reasons
Sometimes performing a controlled experiment would be unethical.
For example, suppose we want to know whether vaccines cause autism (NOTE: they do not).
We cannot simply stop vaccinating people.
Moral Reasons
If you stopped vaccinating children, you’d effectively be killing lots of children (and adults).
Vaccines prevent lots and lots of otherwise deadly infectious diseases.
Moral Reasons
Thus you must conduct an observational study. Find people who (for whatever reason) chose not to vaccinate their children, and compare their rates of autism to those of the vaccinated children.
When you do this you find that vaccines do not cause autism. (No correlation, hence no causation.)
Practical Reasons
Some controlled experiments are also simply impractical.
Does being smart make you rich? Well, we can’t make a random group of people smart. That’s impossible. Does being rich make you smart? Well, we can’t give a random bunch of people a lot of money– we’re just poor scientists!