Embed Size (px)
Citation preview

Probability Distributions
What proportion of a group of kittens lie in any selected
part of a pile of kittens?
Probability Distributions
Sometimes we want to know the chances that something will occur?
For example:1. What are the odds that I will win the lottery?2. What are my chances of getting an A?3. If a person is young, what are the chances that
he or she will be in poverty?4. What chances do poor people have of graduating
from college?
To answer questions such as these, we turn to probability.

Probability Distributions
Probability:
Out of all possible outcomes, the proportionate expectation of a given outcome. Values for statistical probability range from 0 (never) to 1 (always) or from 0% chance to 100% chance.
For example:
12 of 25 students in an engineering class are women. The probability that a randomly selected student in that engineering class will be a woman is 12/25 = .48 or 48%.
13
12
F M

Probability Distributions
What is the probability that a student will get a C in Statistics?
What about a C or Higher?
F D C B A
10
5
03 5 12 7 5
Probability Distributions
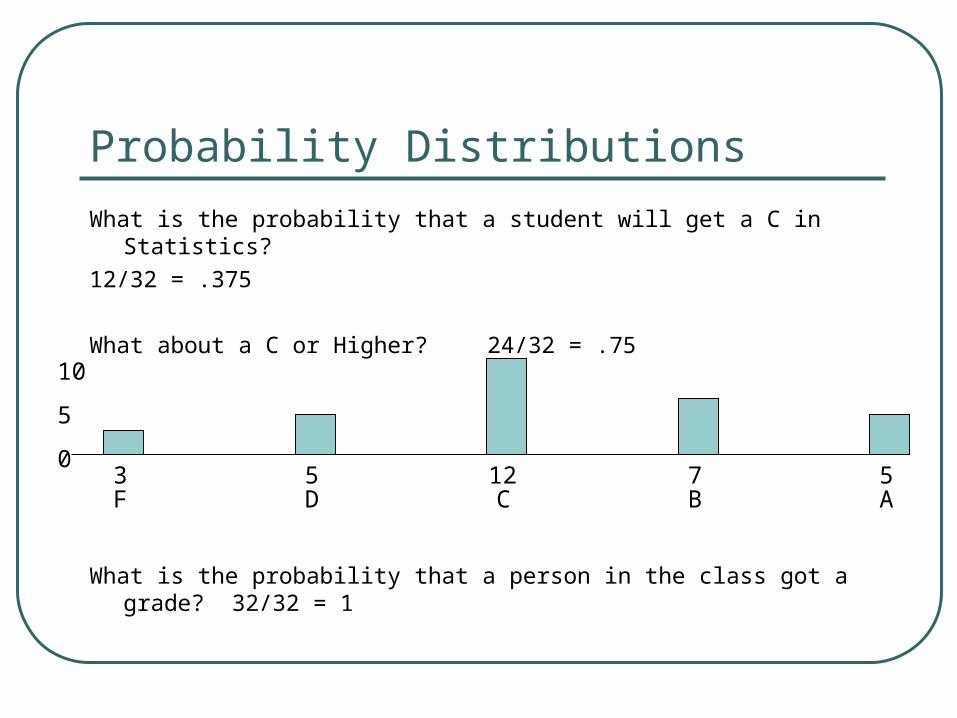
What is the probability that a student will get a C in Statistics?
12/32 = .375
What about a C or Higher? 24/32 = .75
What is the probability that a person in the class got a grade? 32/32 = 1
F D C B A
10
5
03 5 12 7 5

Probability Distributions
Empirical probability distribution:All the outcomes in a distribution of research results and each of their probabilities—what actually happened
The probability distribution of a variable lists the possible outcomes together with their probabilities

Probability Distributions
What is the probability that a student will get a C in Statistics?
12/32 = .375
What about a C or Higher? 24/32 = .75
F D C B A
.375
.219
0
F D C B A
P=1
100% of cases
P=.25 or 25%
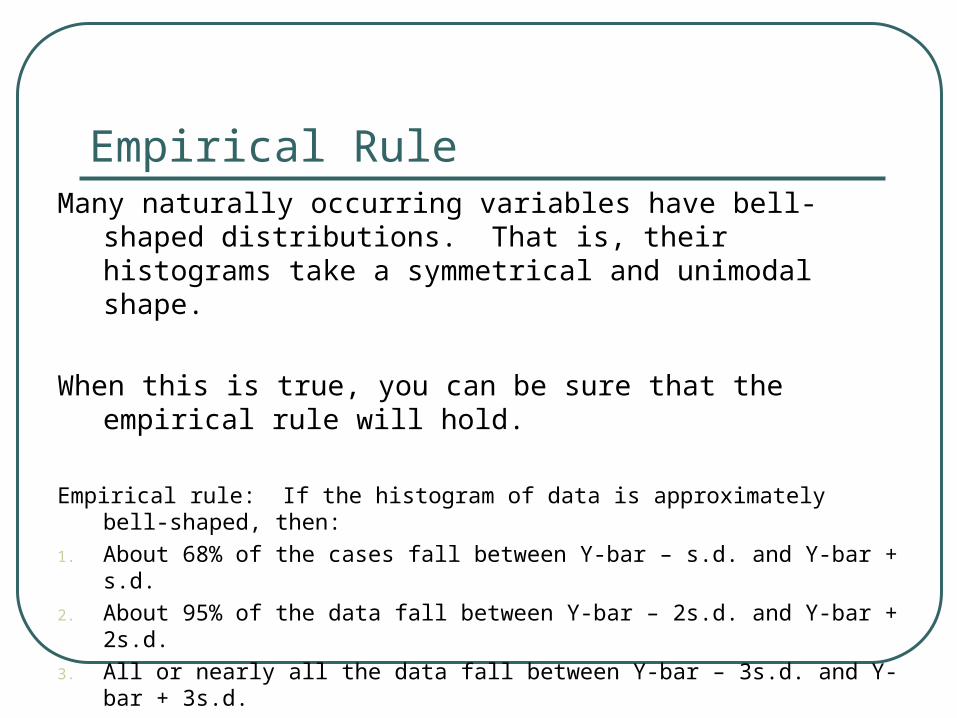
Empirical RuleMany naturally occurring variables have bell-shaped
distributions. That is, their histograms take a symmetrical and unimodal shape.
When this is true, you can be sure that the empirical rule will hold.
Empirical rule: If the histogram of data is approximately bell-shaped, then:
1. About 68% of the cases fall between Y-bar – s.d. and Y-bar + s.d.
2. About 95% of the data fall between Y-bar – 2s.d. and Y-bar + 2s.d.
3. All or nearly all the data fall between Y-bar – 3s.d. and Y-bar + 3s.d.
Empirical Rule
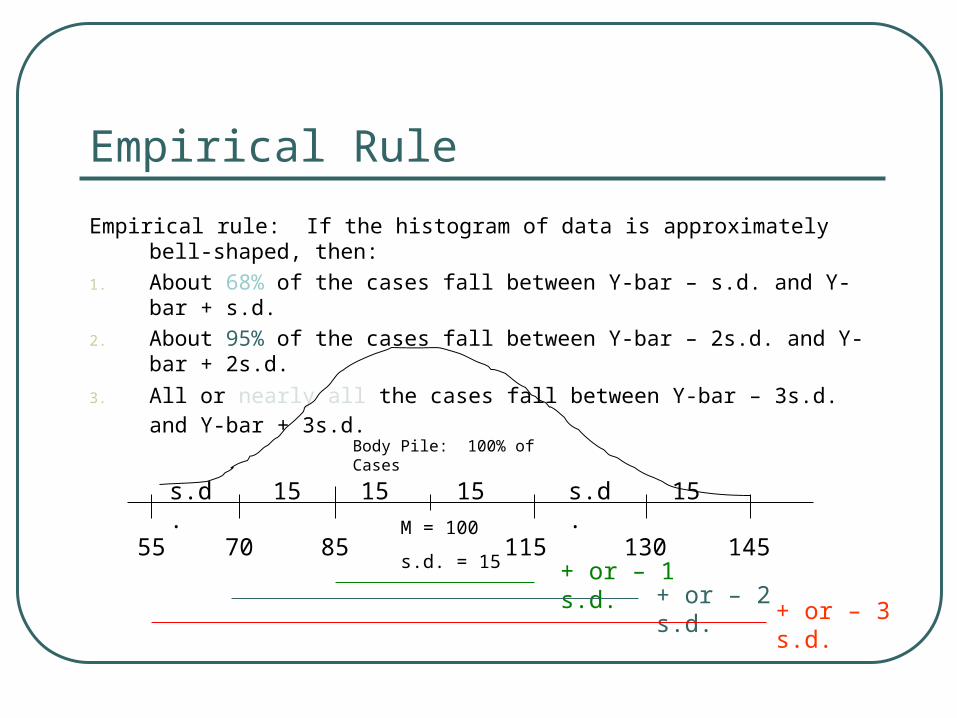
Empirical rule: If the histogram of data is approximately bell-shaped, then:
1. About 68% of the cases fall between Y-bar – s.d. and Y-bar + s.d.
2. About 95% of the cases fall between Y-bar – 2s.d. and Y-bar + 2s.d.
3. All or nearly all the cases fall between Y-bar – 3s.d. and Y-bar + 3s.d.
Body Pile: 100% of Cases
M = 100
s.d. = 15
s.d. 15 15 15 s.d. 15
8555 70 115 130 145+ or – 1 s.d.
+ or – 2 s.d.+ or – 3 s.d.
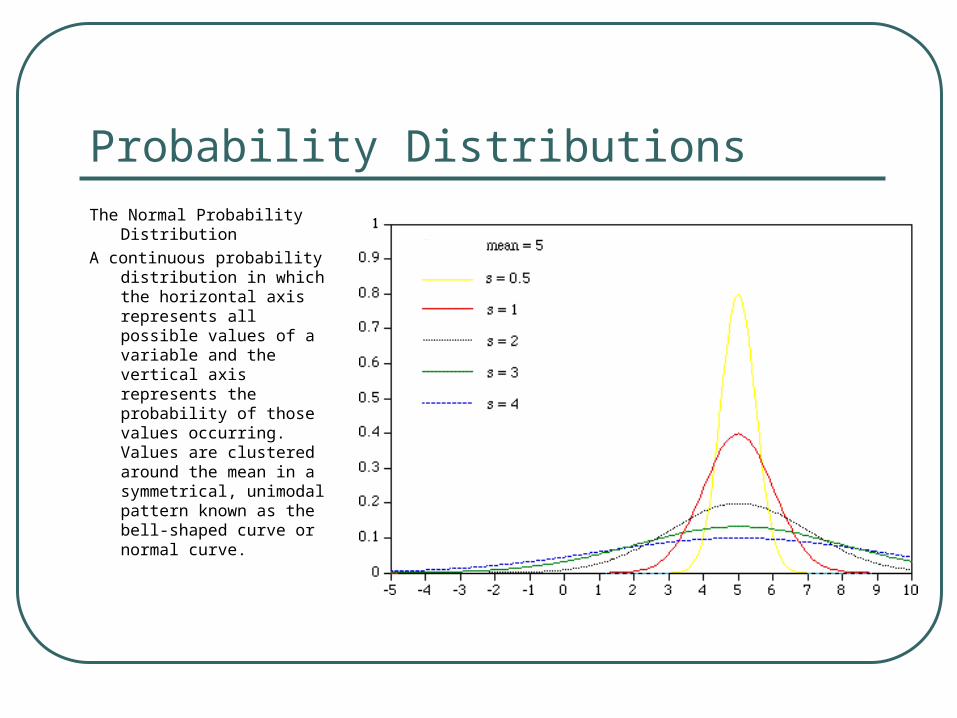
Probability DistributionsThe Normal Probability
Distribution
A continuous probability distribution in which the horizontal axis represents all possible values of a variable and the vertical axis represents the probability of those values occurring. Values are clustered around the mean in a symmetrical, unimodal pattern known as the bell-shaped curve or normal curve.

Probability DistributionsThe Normal Probability Distribution
No matter what the actual s.d. () value is, the
proportion of cases under the curve that corresponds
with the mean ()+/- 1s.d. is the same (68%).
The same is true of mean+/- 2s.d. (95%)
And mean +/- 3s.d. (almost all cases)
Because of the equivalence of all
Normal Distributions, these are often
described in terms of the Standard Normal Curve
where mean = 0 and s.d. = 1 and is called “z”
Z = # of standard deviations away from the meanZ=-3 -2 -1 0 1 2 3
Z = -3 -2 -1 0 1 2 3
68%
68%

Probability DistributionsConverting to z-scores
To compare different normal curves, it is helpful to know how to convert data values into z-scores.
It is like have two rulers beneath each normal curve. One for data values, the second for z-scores.
Values 55 70 85 100 115 130 145
Z-scores -3 -2 -1 0 1 2 3
IQ = 100 = 15

Probability DistributionsConverting to z-scores
Z = Y –
Values 55 70 85 100 115 130 145
Z-scores -3 -2 -1 0 1 2 3
IQ = 100 = 15
Z = 100 – 100 / 15 = 0
Z = 145 – 100 / 15 = 45/15 = 3
Z = 70 – 100 / 15 = -30/15 = -2
Z = 105 – 100 / 15 = 5/15 = .33

Probability DistributionsEngagement Ring Example:Mean cost of an engagement ring
is $500, and the standard deviation is $100.
Z = Y –
Values 200 300 400 500 600 700 800
Z-scores -3 -2 -1 0 1 2 3
Ring = 100 = 15
Z = 500 – 500 / 100 = 0
Z = 600 – 500 / 100 = 100/100 = 1
Z = 200 – 500 / 100 = -300/100 = -3
Z = 550 – 500 / 100 = 50/100 = .5
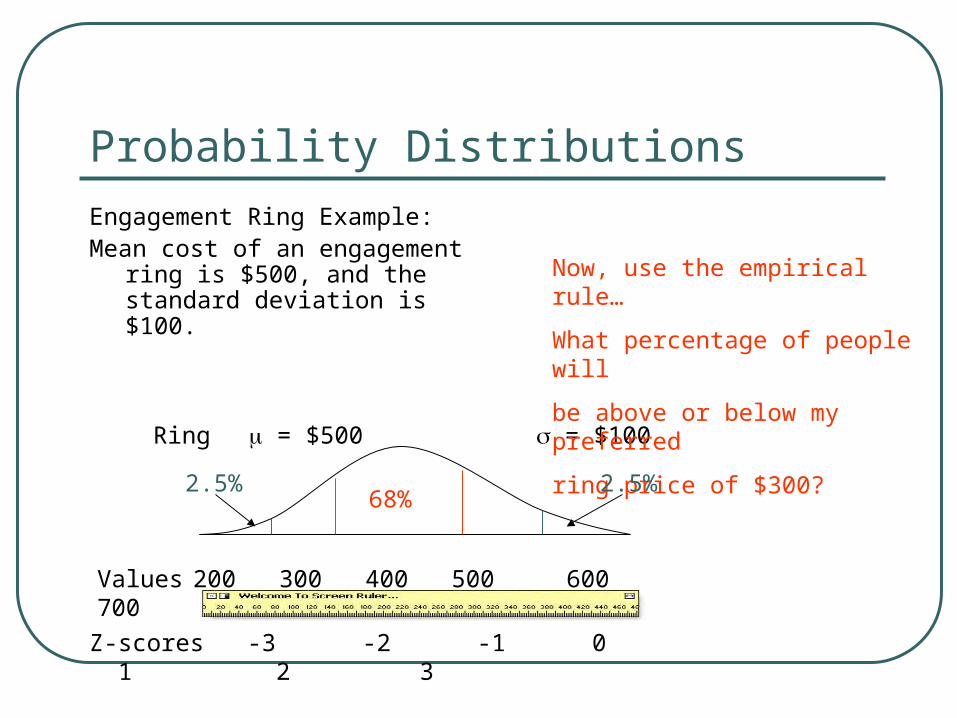
Probability DistributionsEngagement Ring Example:Mean cost of an engagement ring
is $500, and the standard deviation is $100.
Values 200 300 400 500 600 700 800
Z-scores -3 -2 -1 0 1 2 3
Ring = $500 = $100
Now, use the empirical rule…
What percentage of people will
be above or below my preferred
ring price of $300?
68%2.5%2.5%

Probability Distributions
Comparing two distributions by Z-score
Imagine that your partner didn’t get you a ring, but took you on a trip to express their love for you. You could convert the trip’s price into a ring price using z-scores.
Your trip cost $2,000. The average “love trip” costs $1,500 with a s.d. of $250. What is the equivalent ring price?
Rings Trips
200 300 400 500 600 700 800 750 1000 1250 1500 1750 2000 2250
-3 -2 -1 0 1 2 3 -3 -2 -1 0 1 2 3
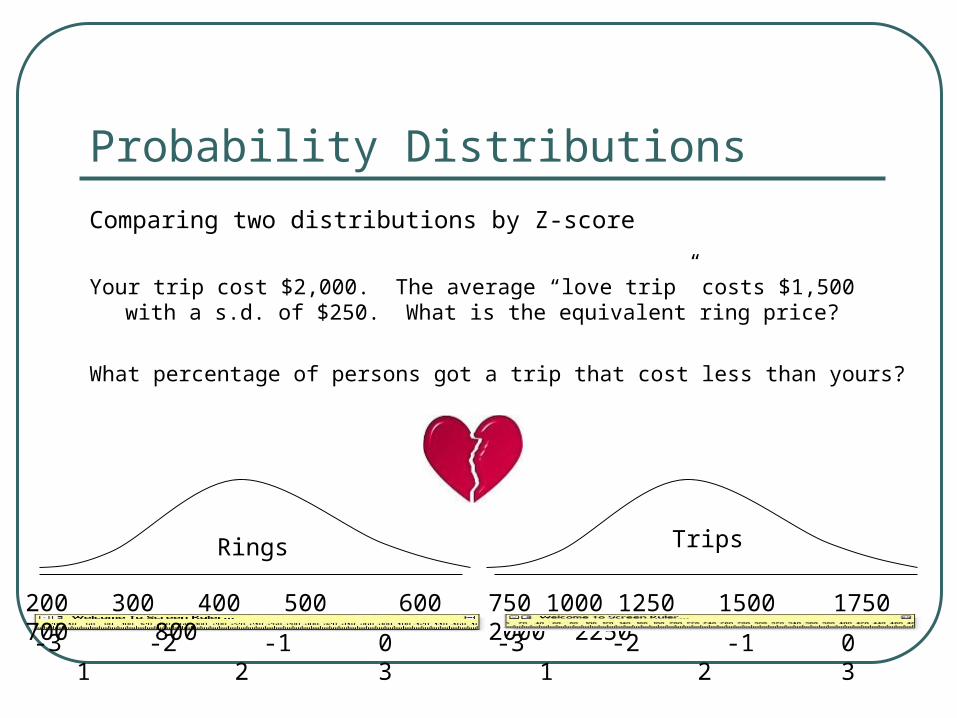
Probability Distributions
Comparing two distributions by Z-score
Your trip cost $2,000. The average “love trip” costs $1,500 with a s.d. of $250. What is the equivalent ring price?
What percentage of persons got a trip that cost less than yours?
Rings Trips
200 300 400 500 600 700 800 750 1000 1250 1500 1750 2000 2250
-3 -2 -1 0 1 2 3 -3 -2 -1 0 1 2 3
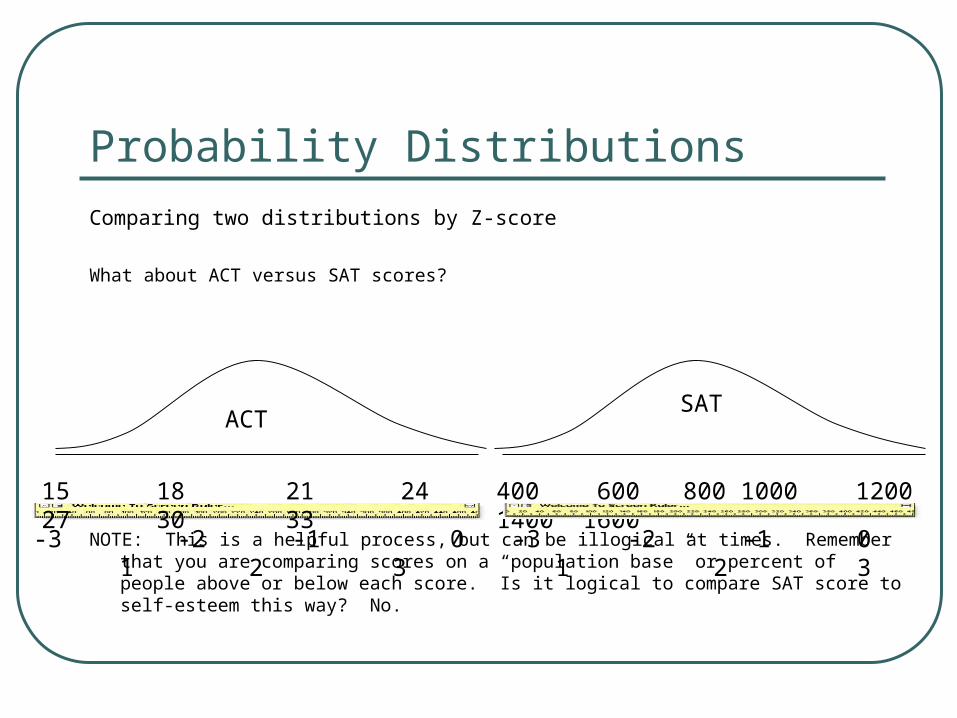
Probability Distributions
Comparing two distributions by Z-score
What about ACT versus SAT scores?
NOTE: This is a helpful process, but can be illogical at times. Remember that you are comparing scores on a “population base” or percent of people above or below each score. Is it logical to compare SAT score to self-esteem this way? No.
ACTSAT
15 18 21 24 27 30 33 400 600 800 1000 1200 1400 1600
-3 -2 -1 0 1 2 3 -3 -2 -1 0 1 2 3

Probability DistributionsHow to use a z-score table. (I could use
some z z z z’s).
F-N&L-G Appendix B has reports from the literal measurements of area under normal curves. The table gives you the percent of values above, below, or between particular z-scores (# of s.d.s away from the mean).
Left column = z (out to two decimals)Second column is area—proportion of
distribution—from mean to zRight column is area—proportion of
distribution—from z to the end of the line.
Can work in reverse to find z-scores too.
Other tables will use different layouts, online you can get automatic answers without using a table.
Probability Distributions
Theoretical probability distribution:The proportion of times we would expect to get a particular outcome in a large number of trials—what would happen if we had the time to observe it.
Q: Why are these important?
A: Sociologists usually get only one chance to draw a sample from a population. Therefore, if we know what kind of variation in measurement we would see if we repeatedly sampled (theoretically), we can judge the chance that numbers produced by our sample are accurate (this will make sense later).

Probability DistributionsTheoretical probability distribution:
The number of times we would expect to get a particular outcome in a large number of trials.
For Example: Let’s say the mean GPA at SJSU is 2.5.
Randomly take 100 SJSU students’ GPAs.Record it.Now, take 100 more SJSU students’ GPAs.Record that.Now, repeat the above.Record again.Now, lather, rinse, repeat.Again.Again. And on and on.
What might you see?
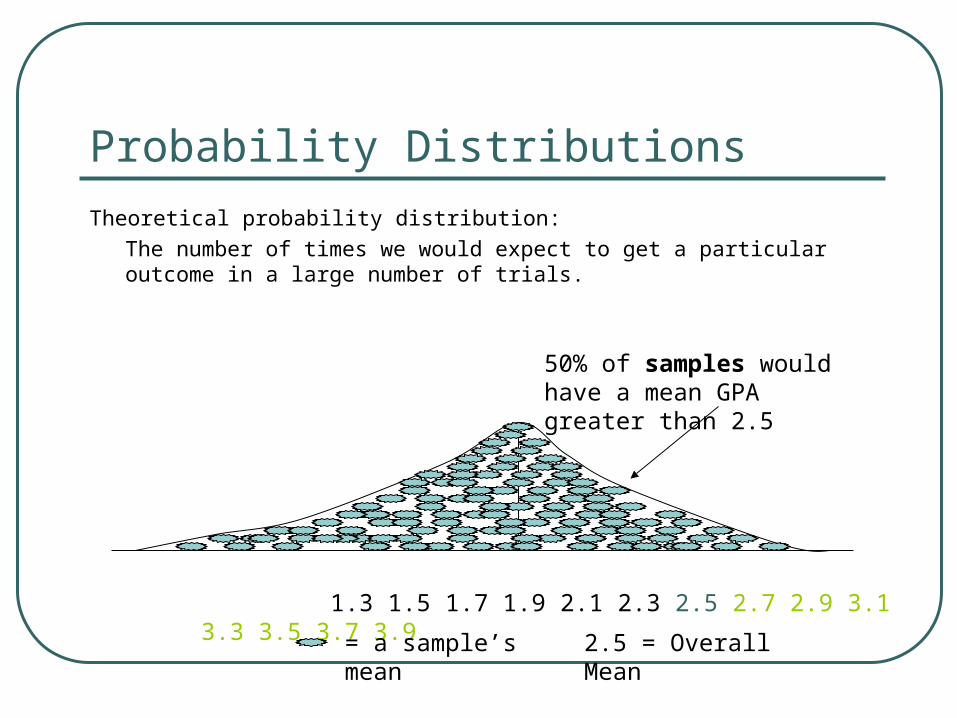
Probability DistributionsTheoretical probability distribution:
The number of times we would expect to get a particular outcome in a large number of trials.
1.3 1.5 1.7 1.9 2.1 2.3 2.5 2.7 2.9 3.1 3.3 3.5 3.7 3.9
= a sample’s mean 2.5 = Overall Mean
50% of samples would have a mean GPA greater than 2.5