Embed Size (px)
DESCRIPTION
Probability. Introduction to Probability, Conditional Probability and Random Variables. Course Overview. Collecting Data. Exploring Data. Probability Intro. Inference. Comparing Variables. Relationships between Variables. Means. Proportions. Regression. Contingency Tables. - PowerPoint PPT Presentation
Citation preview
04/19/23 1
Probability
Introduction to Probability,
Conditional Probability and
Random Variables
04/19/23 2
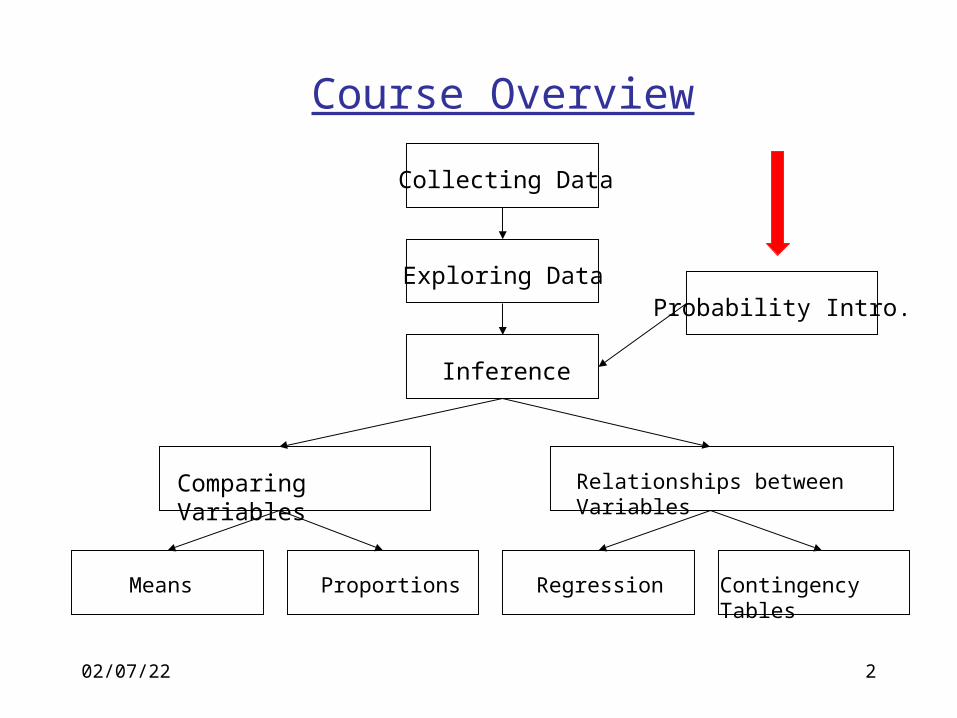
Course Overview
Collecting Data
Exploring DataProbability Intro.
Inference
Comparing Variables Relationships between Variables
Means Proportions Regression Contingency Tables
04/19/23 3
Why do we need Probability?
• We have several graphical and numerical statistics for summarizing our data
• We want to make probability statements about the significance of our statistics
• Eg. In Stat111, mean(height) = 66.7 inches • What is the chance that the true height of Penn
students is between 60 and 70 inches?
• Eg. r = -0.22 for draft order and birthday• What is the chance that the true correlation is
significantly different from zero?
04/19/23 4
Deterministic vs. Random Processes
• In deterministic processes, the outcome can be predicted exactly in advance• Eg. Force = mass x acceleration. If we are given
values for mass and acceleration, we exactly know the value of force
• In random processes, the outcome is not known exactly, but we can still describe the probability distribution of possible outcomes • Eg. 10 coin tosses: we don’t know exactly how
many heads we will get, but we can calculate the probability of getting a certain number of heads
04/19/23 5
Events
• An event is an outcome or a set of outcomes of a random process
Example: Tossing a coin three times
Event A = getting exactly two heads = {HTH, HHT, THH}
Example: Picking real number X between 1 and 20
Event A = chosen number is at most 8.23 = {X ≤ 8.23}
Example: Tossing a fair dice
Event A = result is an even number = {2, 4, 6}
• Notation: P(A) = Probability of event A• Probability Rule 1:
0 ≤ P(A) ≤ 1 for any event A
04/19/23 6
Sample Space
• The sample space S of a random process is the set of all possible outcomes Example: one coin toss
S = {H,T} Example: three coin tosses
S = {HHH, HTH, HHT, TTT, HTT, THT, TTH, THH}Example: roll a six-sided dice
S = {1, 2, 3, 4, 5, 6}Example: Pick a real number X between 1 and 20
S = all real numbers between 1 and 20
• Probability Rule 2: The probability of the whole sample space is 1
P(S) = 1
04/19/23 7
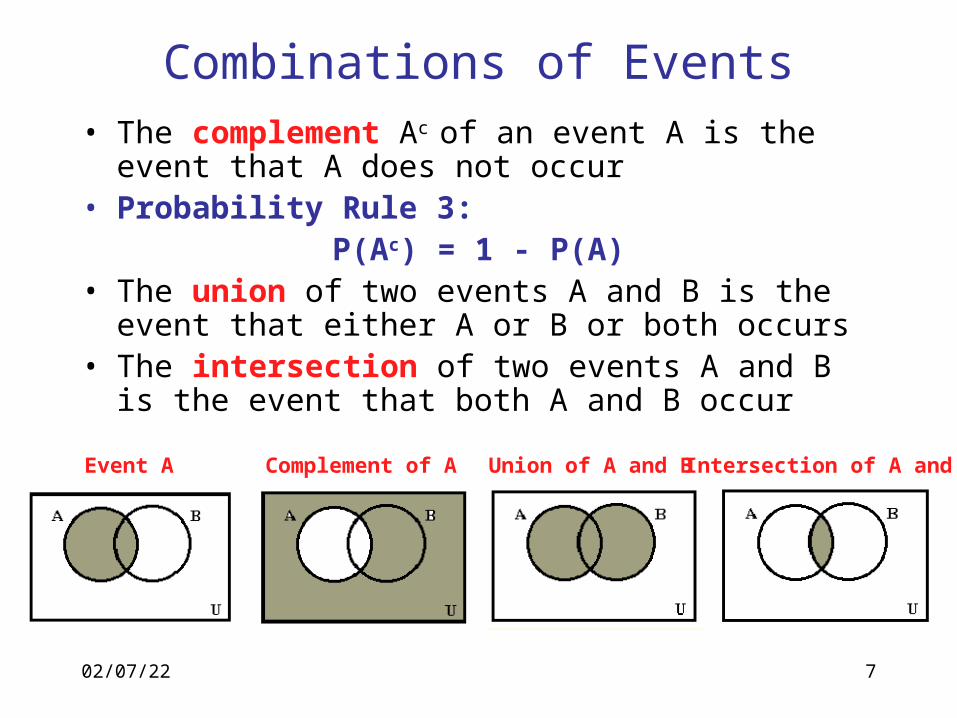
Combinations of Events• The complement Ac of an event A is the event that A
does not occur• Probability Rule 3:
P(Ac) = 1 - P(A)• The union of two events A and B is the event that
either A or B or both occurs• The intersection of two events A and B is the event
that both A and B occur
Event A Complement of A Union of A and B Intersection of A and B
04/19/23 8
Disjoint Events• Two events are called disjoint if they can not
happen at the same time • Events A and B are disjoint means that the
intersection of A and B is zero
• Example: coin is tossed twice • S = {HH,TH,HT,TT}• Events A={HH} and B={TT} are disjoint • Events A={HH,HT} and B = {HH} are not disjoint
• Probability Rule 4: If A and B are disjoint events then
P(A or B) = P(A) + P(B)
04/19/23 9
Independent events• Events A and B are independent if knowing that A
occurs does not affect the probability that B occurs
• Example: tossing two coinsEvent A = first coin is a head
Event B = second coin is a head
• Disjoint events cannot be independent!• If A and B can not occur together (disjoint), then knowing that
A occurs does change probability that B occurs
• Probability Rule 5: If A and B are independent
P(A and B) = P(A) x P(B)
Independent
multiplication rule for independent events
04/19/23 10
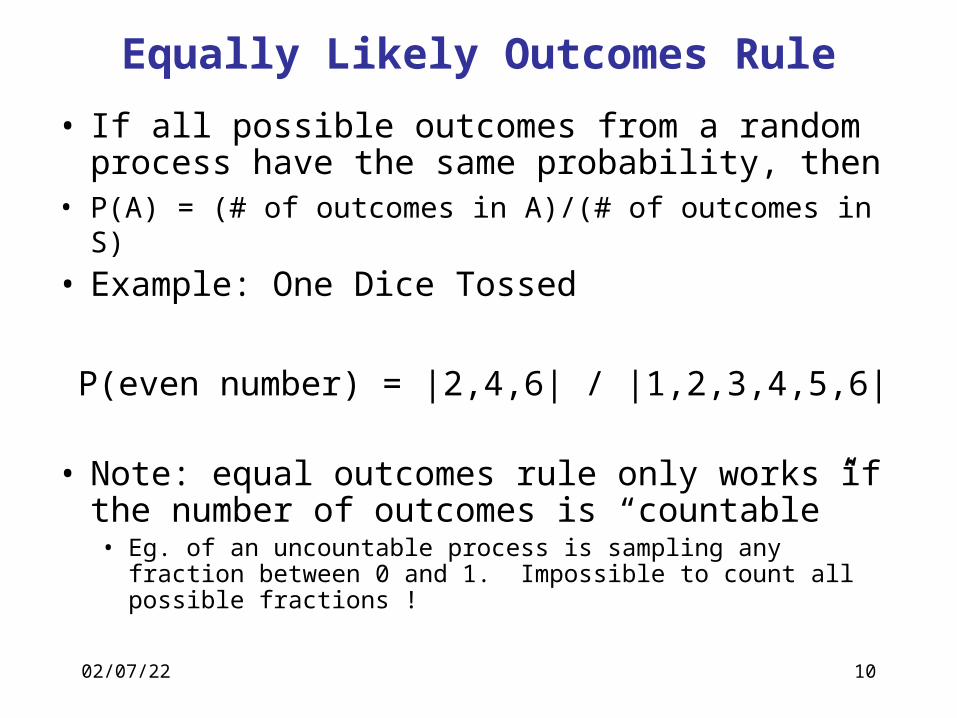
Equally Likely Outcomes Rule
• If all possible outcomes from a random process have the same probability, then
• P(A) = (# of outcomes in A)/(# of outcomes in S)
• Example: One Dice Tossed
P(even number) = |2,4,6| / |1,2,3,4,5,6|
• Note: equal outcomes rule only works if the number of outcomes is “countable”• Eg. of an uncountable process is sampling any fraction between
0 and 1. Impossible to count all possible fractions !
04/19/23 11
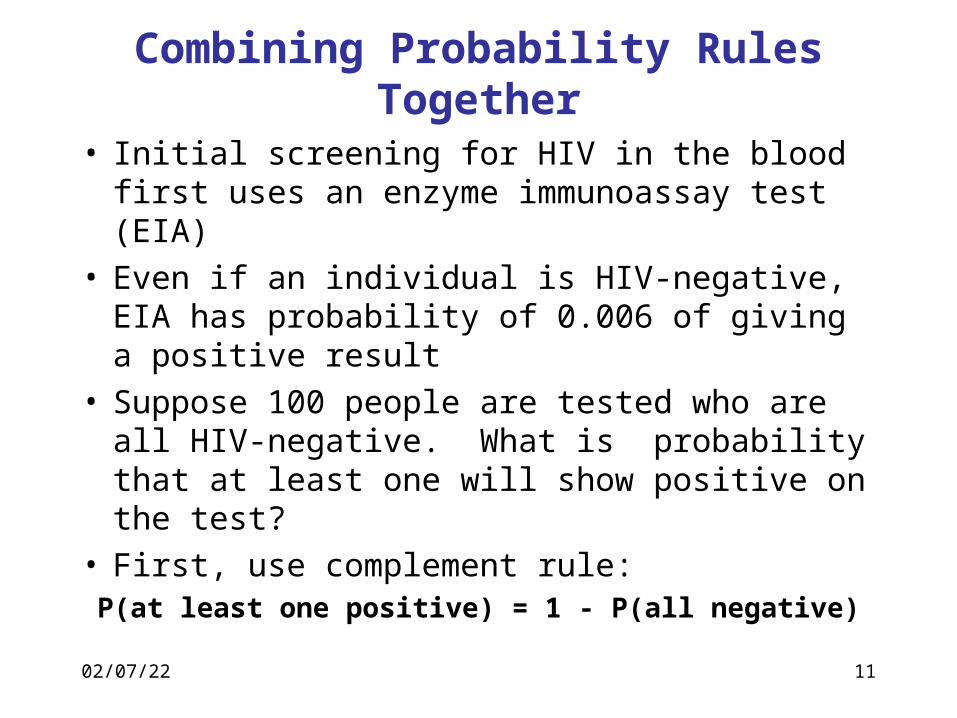
Combining Probability Rules Together
• Initial screening for HIV in the blood first uses an enzyme immunoassay test (EIA)
• Even if an individual is HIV-negative, EIA has probability of 0.006 of giving a positive result
• Suppose 100 people are tested who are all HIV-negative. What is probability that at least one will show positive on the test?
• First, use complement rule:P(at least one positive) = 1 - P(all negative)
04/19/23 12
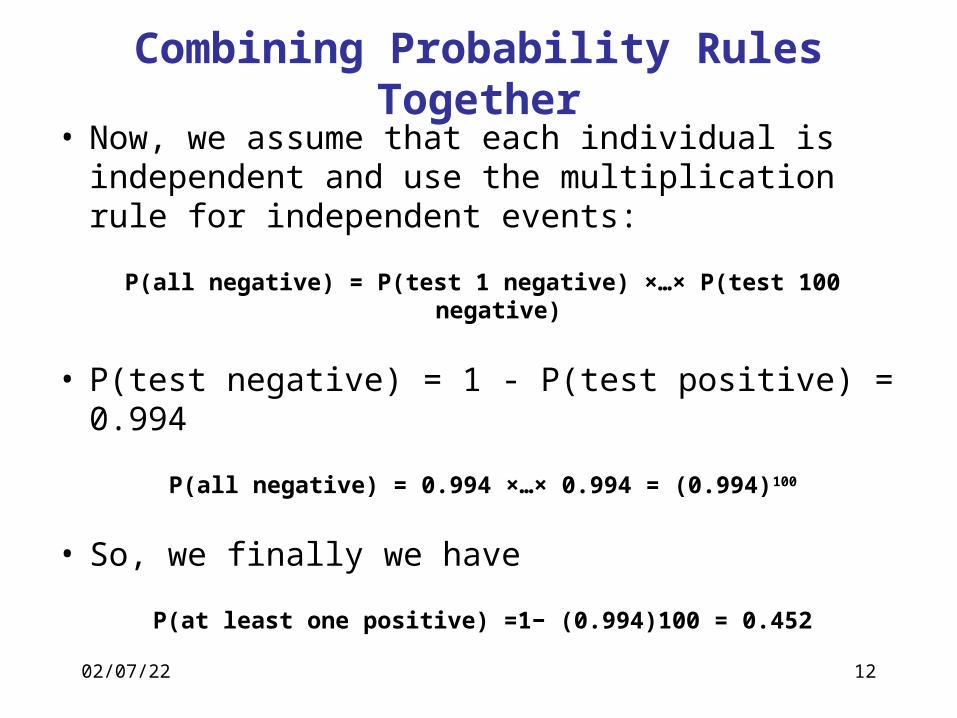
• Now, we assume that each individual is independent and use the multiplication rule for independent events:
P(all negative) = P(test 1 negative) ×…× P(test 100 negative)
• P(test negative) = 1 - P(test positive) = 0.994
P(all negative) = 0.994 ×…× 0.994 = (0.994)100
• So, we finally we have
P(at least one positive) =1− (0.994)100 = 0.452
Combining Probability Rules Together
04/19/23 13
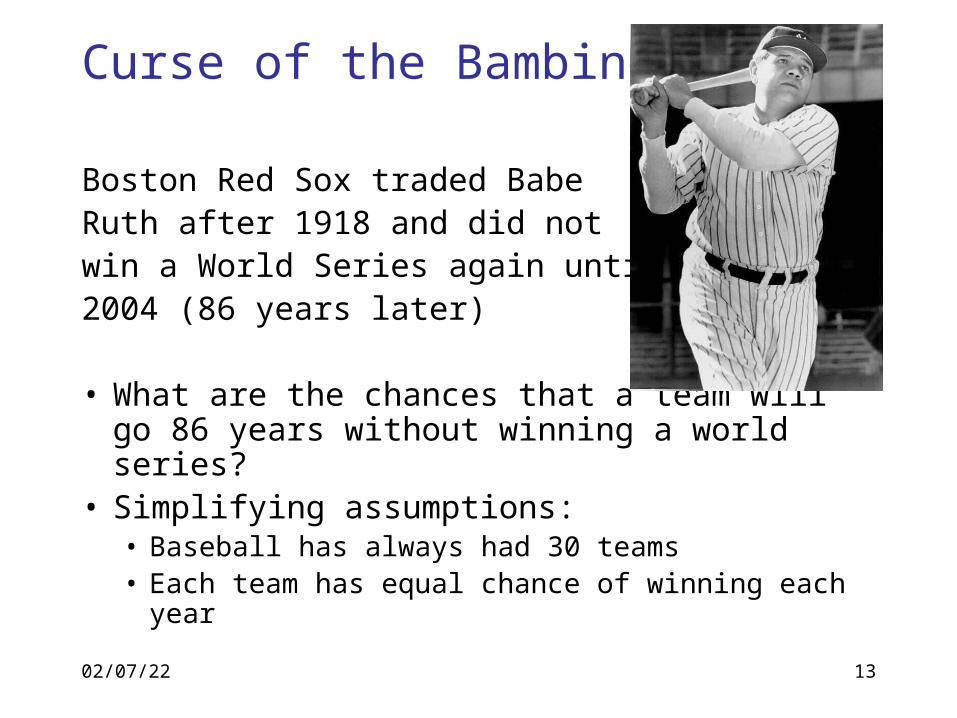
Curse of the Bambino:
Boston Red Sox traded Babe Ruth after 1918 and did not win a World Series again until 2004 (86 years later)
• What are the chances that a team will go 86 years without winning a world series?
• Simplifying assumptions: • Baseball has always had 30 teams • Each team has equal chance of winning each year
04/19/23 14
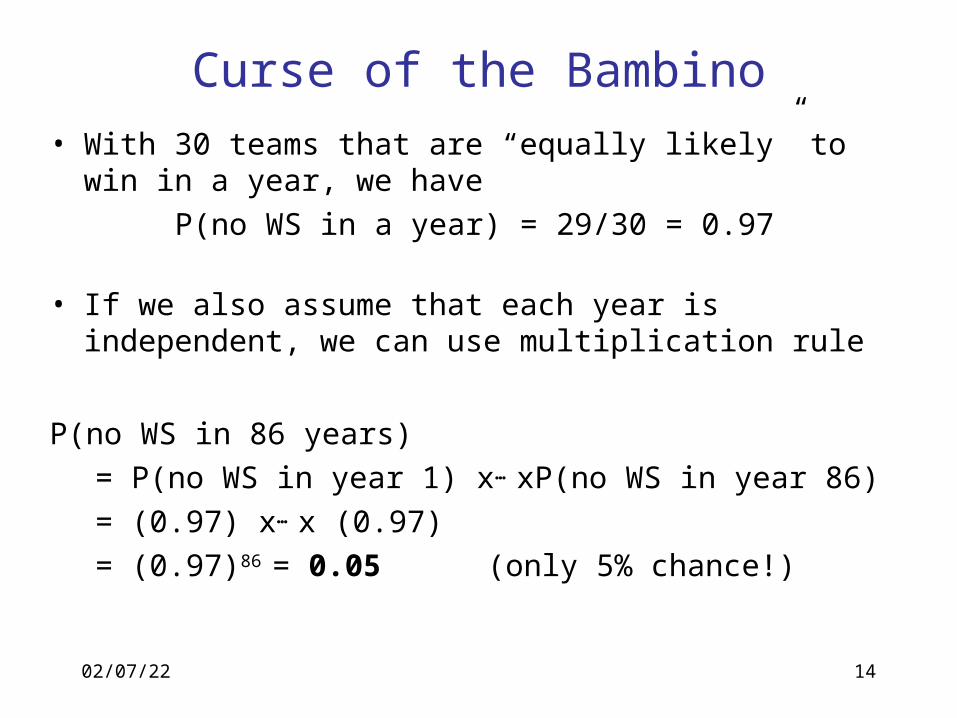
Curse of the Bambino
• With 30 teams that are “equally likely” to win in a year, we have
P(no WS in a year) = 29/30 = 0.97
• If we also assume that each year is independent, we can use multiplication rule
P(no WS in 86 years)
= P(no WS in year 1) x… xP(no WS in year 86)
= (0.97) x… x (0.97)
= (0.97)86 = 0.05 (only 5% chance!)
04/19/23 15
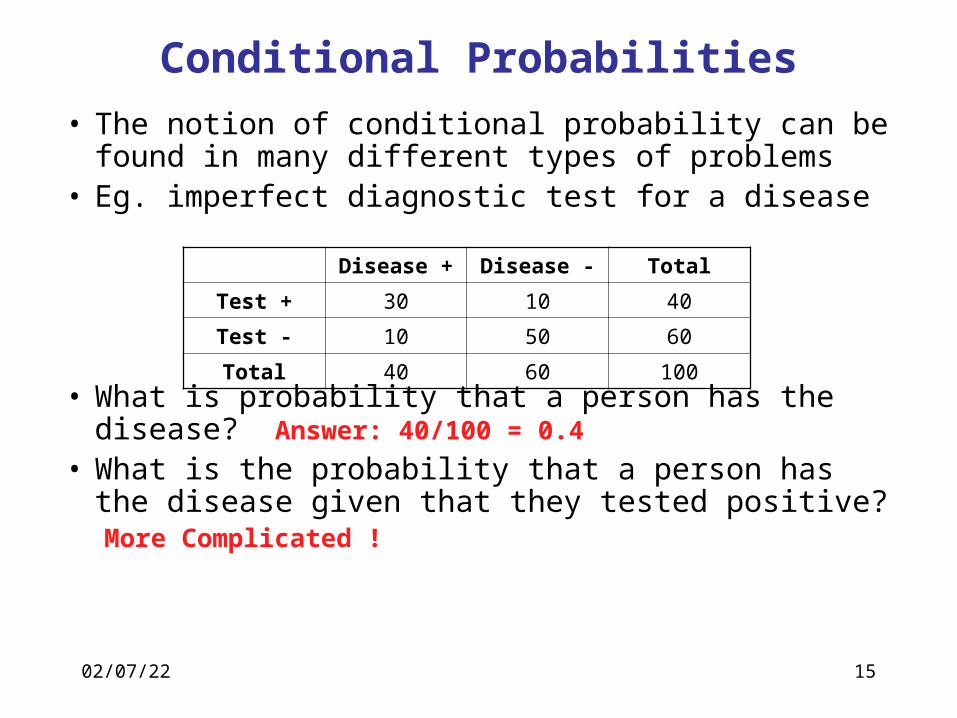
Conditional Probabilities
• The notion of conditional probability can be found in many different types of problems
• Eg. imperfect diagnostic test for a disease
• What is probability that a person has the disease? Answer: 40/100 = 0.4
• What is the probability that a person has the disease given that they tested positive?More Complicated !
Disease + Disease - Total
Test + 30 10 40
Test - 10 50 60
Total 40 60 100
04/19/23 16
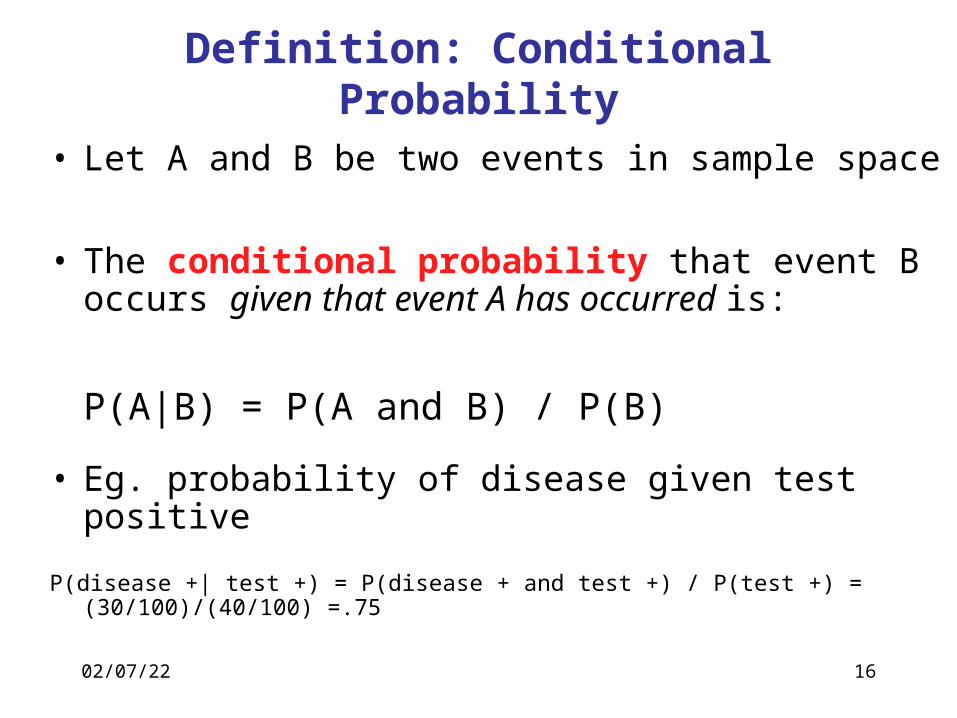
Definition: Conditional Probability
• Let A and B be two events in sample space
• The conditional probability that event B occurs given that event A has occurred is:
P(A|B) = P(A and B) / P(B)
• Eg. probability of disease given test positive
P(disease +| test +) = P(disease + and test +) / P(test +) = (30/100)/(40/100) =.75
04/19/23 17
Independent vs. Non-independent Events
• If A and B are independent, then
P(A and B) = P(A) x P(B)
which means that conditional probability is:
P(B | A) = P(A and B) / P(A) = P(A)P(B)/P(A) = P(B)
• We have a more general multiplication rule for events that are not independent:
P(A and B) = P(B | A) × P(A)
04/19/23 18
Random variables
• A random variable is a numerical outcome of a random process or random event
• Example: three tosses of a coin • S = {HHH,THH,HTH,HHT,HTT,THT,TTH,TTT}• Random variable X = number of observed tails• Possible values for X = {0,1, 2, 3}
• Why do we need random variables?• We use them as a model for our observed data
04/19/23 19
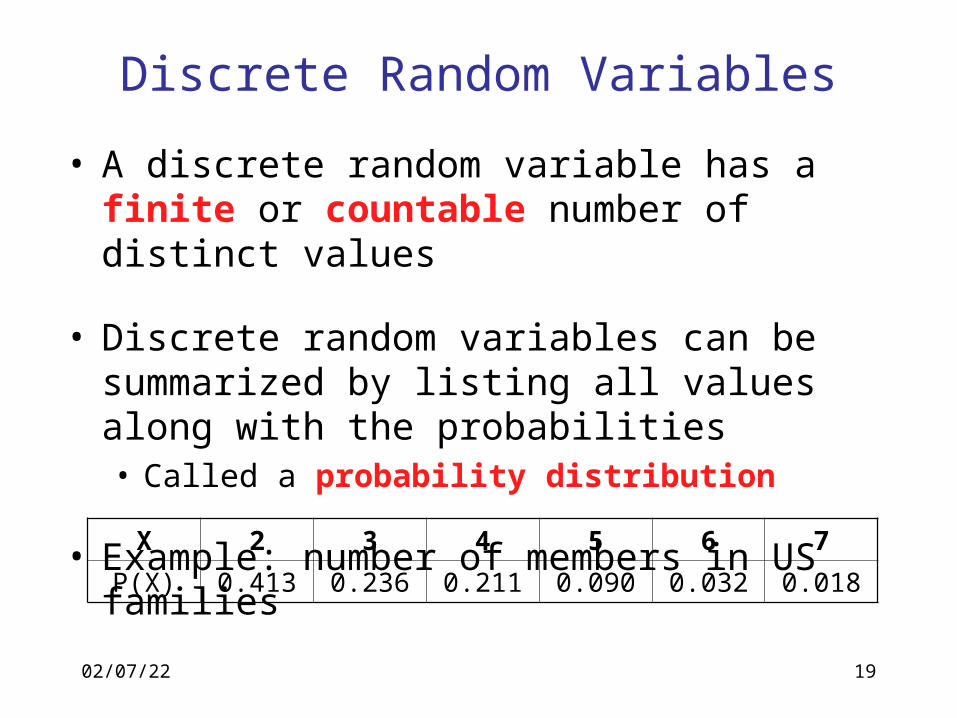
Discrete Random Variables
• A discrete random variable has a finite or countable number of distinct values
• Discrete random variables can be summarized by listing all values along with the probabilities• Called a probability distribution
• Example: number of members in US families
X 2 3 4 5 6 7
P(X) 0.413 0.236 0.211 0.090 0.032 0.018
04/19/23 20
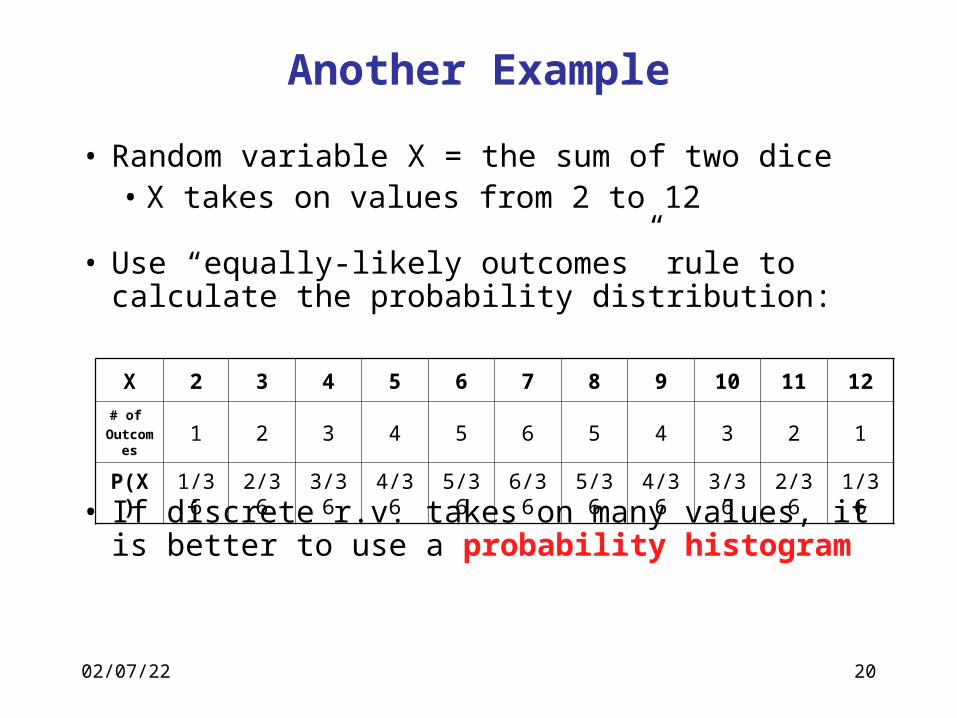
Another Example
• Random variable X = the sum of two dice• X takes on values from 2 to 12
• Use “equally-likely outcomes” rule to calculate the probability distribution:
• If discrete r.v. takes on many values, it is better to use a probability histogram
X 2 3 4 5 6 7 8 9 10 11 12
# of
Outcomes
1 2 3 4 5 6 5 4 3 2 1
P(X) 1/36 2/36 3/36 4/36 5/36 6/36 5/36 4/36 3/36 2/36 1/36
04/19/23 21
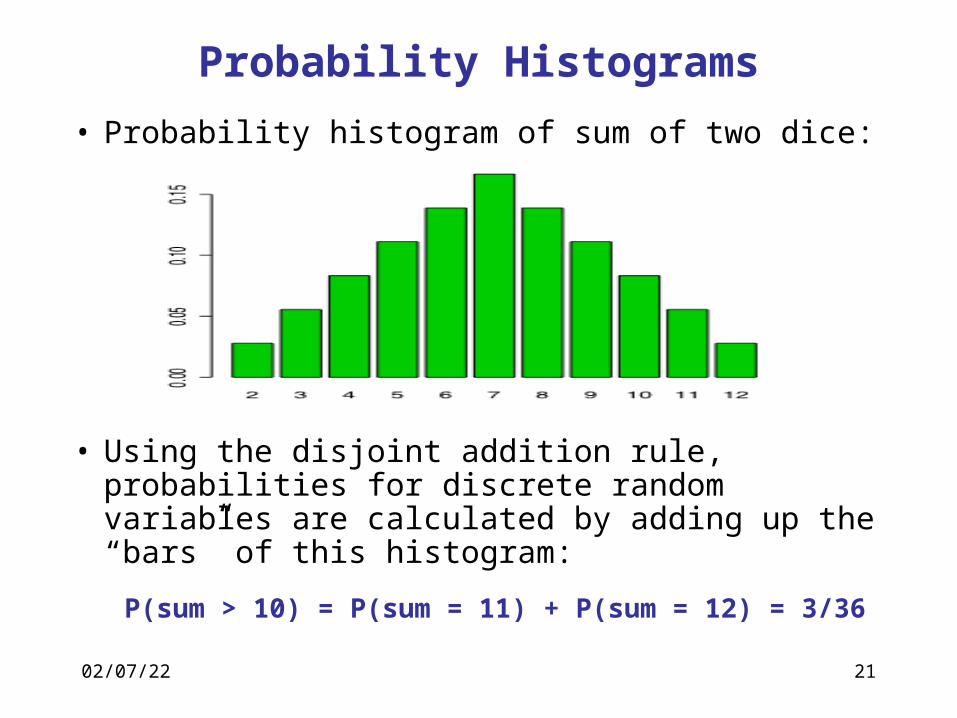
Probability Histograms
• Probability histogram of sum of two dice:
• Using the disjoint addition rule, probabilities for discrete random variables are calculated by adding up the “bars” of this histogram:
P(sum > 10) = P(sum = 11) + P(sum = 12) = 3/36
04/19/23 22
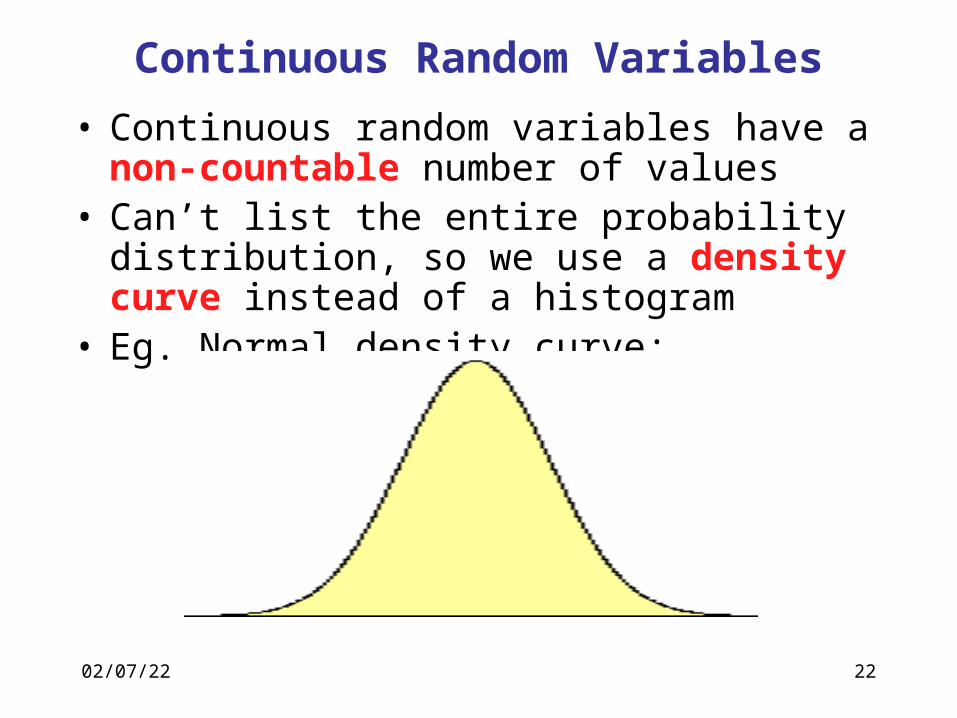
Continuous Random Variables
• Continuous random variables have a non-countable number of values
• Can’t list the entire probability distribution, so we use a density curve instead of a histogram
• Eg. Normal density curve:
04/19/23 23
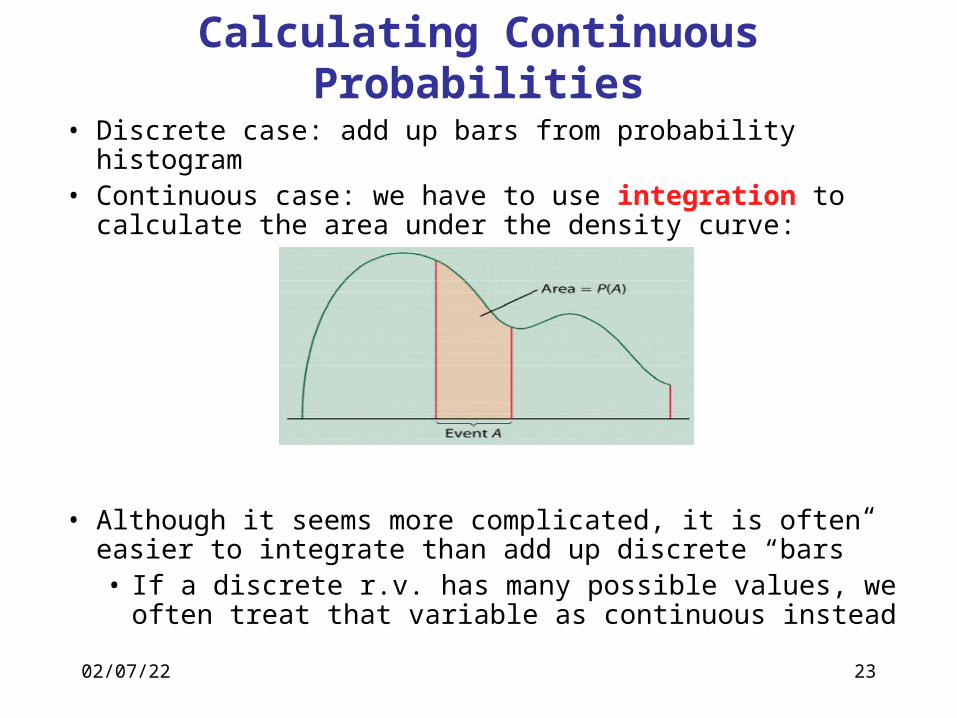
Calculating Continuous Probabilities
• Discrete case: add up bars from probability histogram• Continuous case: we have to use integration to
calculate the area under the density curve:
• Although it seems more complicated, it is often easier to integrate than add up discrete “bars”• If a discrete r.v. has many possible values, we often
treat that variable as continuous instead
04/19/23 24
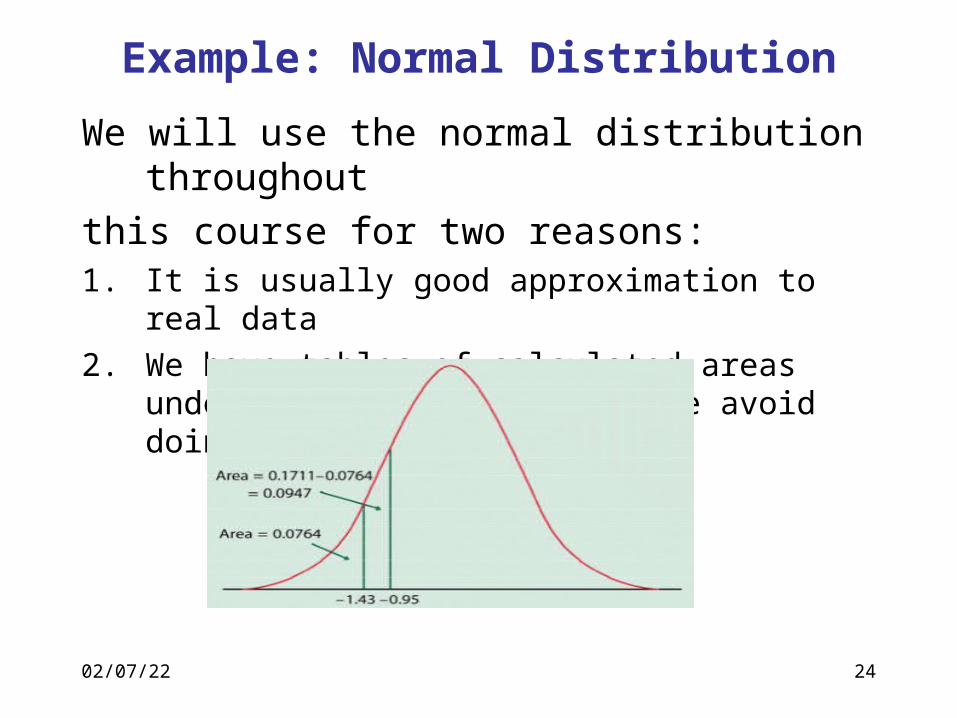
Example: Normal Distribution
We will use the normal distribution throughout
this course for two reasons:1. It is usually good approximation to real data
2. We have tables of calculated areas under the normal curve, so we avoid doing integration!
04/19/23 25
Mean of a Random Variable• Average of all possible values of a random
variable (often called expected value)• Notation: don’t want to confuse random
variables with our collected data variables
= mean of random variable x = mean of a data variable
• For continuous r.v, we again need integration to calculate the mean
• For discrete r.v., we can calculate the mean by hand since we can list all probabilities
04/19/23 26
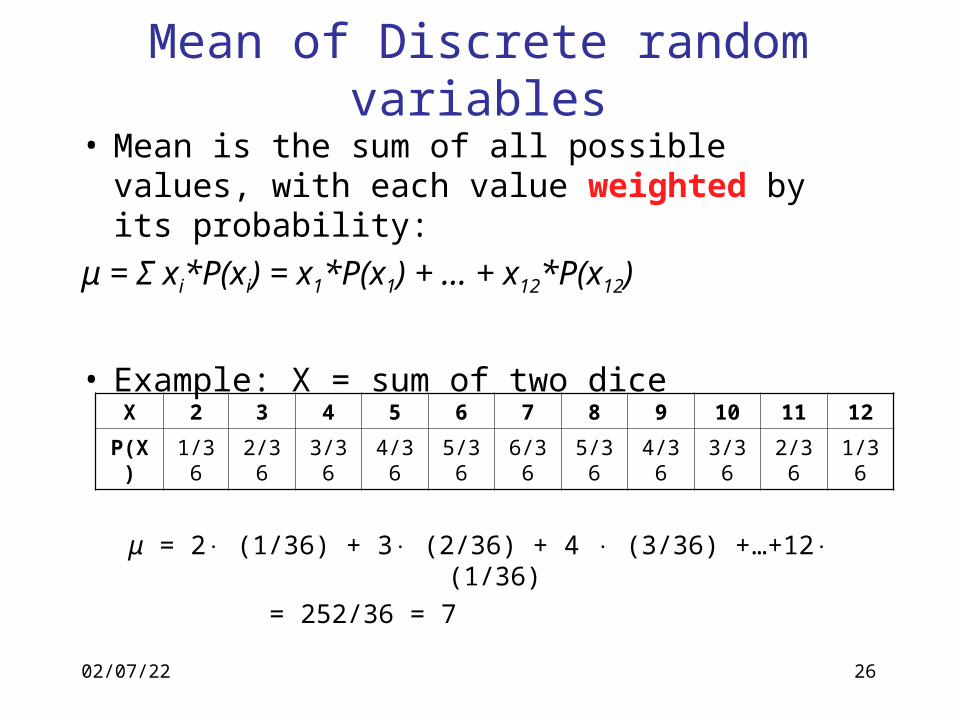
Mean of Discrete random variables
• Mean is the sum of all possible values, with each value weighted by its probability:
μ = Σ xi*P(xi) = x1*P(x1) + … + x12*P(x12)
• Example: X = sum of two dice
μ = 2 (1/36) + 3 (2/36) + 4 (3/36) +⋅ ⋅ ⋅ …+12 (1/36)⋅ = 252/36 = 7
X 2 3 4 5 6 7 8 9 10 11 12
P(X) 1/36 2/36 3/36 4/36 5/36 6/36 5/36 4/36 3/36 2/36 1/36
04/19/23 27
Variance of a Random Variable• Spread of all possible values of a random
variable around its mean• Again, we don’t want to confuse random
variables with our collected data variables:
2 = variance of random variables2 = variance of a data variable
• For continuous r.v, again need integration to calculate the variance
• For discrete r.v., can calculate the variance by hand since we can list all probabilities
04/19/23 28
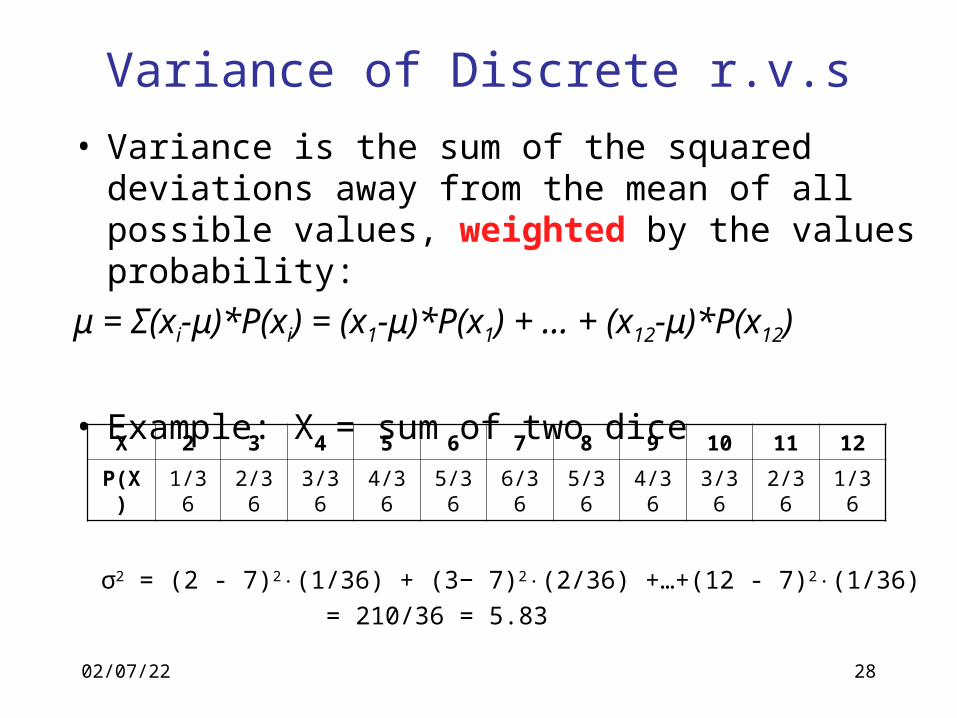
Variance of Discrete r.v.s
• Variance is the sum of the squared deviations away from the mean of all possible values, weighted by the values probability:
μ = Σ(xi-μ)*P(xi) = (x1-μ)*P(x1) + … + (x12-μ)*P(x12)
• Example: X = sum of two dice
σ2 = (2 - 7)2 (1/36) +⋅ (3− 7)2 (2/36) +⋅ …+(12 - 7)2 (1/36)⋅ = 210/36 = 5.83
X 2 3 4 5 6 7 8 9 10 11 12
P(X) 1/36 2/36 3/36 4/36 5/36 6/36 5/36 4/36 3/36 2/36 1/36