Embed Size (px)
Citation preview

COMPDYN 20176th ECCOMAS Thematic Conference on
Computational Methods in Structural Dynamics and Earthquake EngineeringM. Papadrakakis, M. Fragiadakis (eds.)
Rhodes Island, Greece, 15–17 June, 2017
PROBABILISTIC VALIDATION OF THE HOUSNERROCKING MODEL
Jonas A. Bachmann1∗, Mathias Strand2, Michalis F. Vassiliou1, MarcoBroccardo1, and Bozidar Stojadinovic1
1ETH ZurichStefano-Franscini-Platz 5, 8093 Zurich, Switzerland{bachmann, vassiliou, stojadinovic}@ibk.baug.ethz.ch
2NTNU TrondheimHøgskoleringen 1, 7491 Trondheim, Norway
Keywords: Rocking, uplifting structures, earthquake engineering, chaotic motion, prob-abilistic analysis.
Abstract. The rocking oscillator has drawn the attention of many researchers sincethe publication of Housner’s [1] seminal paper. As the response of the rocking oscillatoris highly non-linear and exhibits negative stiffness [2] many researchers have suggestedtreating the rocking oscillator as a chaotic system, in the sense that small perturbationsof its governing parameters result to widely diverging outcomes. Researchers that havetried to experimentally validate Housner’s model have shown that, given the modellinguncertainty, it is hard to confidently predict the time history response of a rocking blockto a specific ground motion. This makes practicing engineers hesitant to adopt rocking asan earthquake response modification strategy.
However, accurately predicting the response to a single ground motion would be idealbut it is not a necessary condition to trust a model: there is so much uncertainty inthe expected ground motion that could overshadow the modelling uncertainty. To takethe former uncertainty into account, in common practice, engineers use an ensemble ofground motions when they perform a time history analysis. Therefore, it is reasonable totry to compare numerical experimental testing results in terms of their statistics. If thenumerical model is capable of capturing the statistics of the experimental testing, then,in terms of civil engineering design, the model is trustworthy. The first ones to adopt aprobabilistic approach were Yim, Chopra and Penzien [3] who as early as in 1980 observedsome order in rocking motion when they studied it from a probabilistic point of view. Theyobserved specific trends in their numerical results when, instead of using only one, theyused 10 synthetic ground motions. This paper compares the numerical and experimentalresponse of a rigid rocking block when excited by an ensemble of 100 ground motions thatshare the statistical properties of original ground motion.

M. Strand, J. A. Bachmann, M. F. Vassiliou, M. Broccardo, and B. Stojadinovic
1 INTRODUCTION
The rocking oscillator has drawn the attention of many researchers since the publicationof Housner’s [1] seminal paper. Rocking behavior has been studied to address three classesof structures:
a) large structures with underdesigned foundations that use uplift and rocking as aseismic response modification technique [4–15];
b) precious unanchored equipment and museum artifacts that are excited by earth-quakes and whose overturning stability is important [16,17]; and
c) ancient Greek and Roman temples [18,19].
As the response of the rocking oscillator is highly non-linear, due to its negative stiff-ness [2], many have suggested treating the rocking oscillator as a chaotic system, in thesense that small perturbations of its governing parameters, be it the oscillator propertiesor the excitation, result to widely diverging outcomes. Researchers that have tried toexperimentally validate Housner’s model [20–26] have shown that, given the modellinguncertainty (especially of the one related to impact), it is difficult to confidently predictthe time history response of a rocking block to a specific ground motion. Even if thecoefficient of restitution is relatively well predicted, or determined via experiments, theresponse of the system to a ground motion is so sensitive that predicting the whole timehistory is practically impossible [27]. This has generated a lot of discussion about Hous-ner’s approach to determine the energy losses during impact and has resulted in variousdifferent energy dissipation models [28–37]. Moreover, it makes practicing engineers hesi-tant to adopt rocking as an earthquake response modification strategy, e.g. for bridges [8].In contrast, Time History Analysis of yielding structures, where one has to model behav-iors such as concrete cracking and spalling, rebar debonding or steel column buckling andconnection failure, is accepted in engineering practice – even though research and ”blindcontests” show that predicting the response even of simple yielding structures is verysensitive to modelling assumptions [38] and that matching the experimental results is anextremely difficult task.
However, accurately predicting the response to a single ground motion would be idealbut it is not a necessary condition to trust a model (and the design solution it attemptsto model): there is so much uncertainty in the expected ground motion that could over-shadow the modelling uncertainty. In the cases where time history analyses are performedengineers commonly use an ensemble of ground motions to take the former uncertaintyinto account. Therefore, it is reasonable to try to compare numerical and experimentaltesting results in terms of their statistics. If the numerical model is capable of capturingthe statistics of the experimental testing, then, regarding civil engineering design, themodel is trustworthy. The first ones to adopt a probabilistic approach were Yim, Chopraand Penzien [3] who as early as in 1980 observed some order in rocking motion when theystudied it from a probabilistic point of view. When, instead of using only one, they used10 synthetic ground motions they observed specific trends in their numerical results. Thisshows that an order does exist in rocking motion.
This paper compares the statistics of the numerical and experimental response of arigid rocking block when excited by an ensemble of 100 ground motions that have thesimilar spectral properties.

M. Strand, J. A. Bachmann, M. F. Vassiliou, M. Broccardo, and B. Stojadinovic
2 EMPLOYED NUMERICAL MODEL
The numerical model used in this study was kept as simple as possible, being the rigidrocking block on a rigid surface (Figure 1). It is assumed that the coefficient of friction islarge enough to prevent sliding throughout the entire motion. The size and shape of theblock are given by its semi-diagonal R, and its slenderness α, defined as α = atan(B/H).When the block is subjected to a horizontal ground acceleration ug(t), and is rockingaround O, or O’ respectively, the non-linear equation of motion is ([3, 39–41] amongothers):
I0 θ(t) +mcgR[α sgn θ(t)− θ(t)] = −mcug(t)R cos[α sgn θ(t)− θ(t)] (1)
Equation 1 can be expressed in a more compact form:
θ(t) = −p2(
sin[α sgn θ(t)− θ(t)] +ugg
cos[α sgn θ(t)− θ(t)])
(2)
where p is the frequency parameter defined as:
p =
√mcgR
I0(3)
To initiate rocking motion the ground acceleration ug must meet or exceed the valueg tanα. For rectangular blocks the rotational inertia is I0 = 4/3mcR
2, and p simplifies top =
√(3g)/(4R). The oscillation frequency T of a rigid block under free vibration is not
constant because it strongly depends on the vibration amplitude θ0 [1]. Nevertheless, thequantity p is a measure of the dynamic characteristics of the block and is equal to thein-plane pendulum frequency of the block as if it were hanging from its rocking rotationpoint [42]. For a free-standing solid rectangular block with dimensions 10m · 1.5m thefrequency parameter yields p = 1.2 rad/s.
Housner assumed that the impact is instantaneous and that the impact forces areconcentrated at the new pivot point (O and O’). Under these assumptions, Conservation
θ > 0
2H
2B
mc
R
α
x
z
C
H
OO'
B B
θ
Figure 1: Rigid block rocking freely on a rigid surface.

M. Strand, J. A. Bachmann, M. F. Vassiliou, M. Broccardo, and B. Stojadinovic
of Angular Momentum (CoAM) an instant before the impact and immediately after theimpact gives the coefficient of restitution:
r =
(1− 2 sin2 α
mcR2
I0
)2
(4)
Many researchers have revisited the above assumption [23, 25, 35, 43–45] and formulatedmore detailed expressions. In this study the Housner coefficient of restitution will be useddue to the following:
i. the specimens used were engineered such that impact forces act as close as possibleto the rocking corners.
ii. the Housner model is simple, and successful in identifying the most important energydissipation factor: the slenderness α of the block.
The construction of the so called rocking spectra and the application of dimensionalanalysis to reduce the dimensionality of the problem are extensively described in [46–49],but are briefly described here for reasons of completeness:When excited by an analytical pulse ground motion [50] of a specific shape, a givenacceleration amplitude ap, and dominant frequency ωp, the response θ of a rigid block isa function of five variables:
θ = f (α,R, g, ap, ωp) (5)
Since this function involves two reference dimensions ([Length] and [Time]) it canbe described by three dimensionless terms using Dimensional and Orientational Analysis[46–49] arguments:
θ
α= φ
(α,ωp
p,
apg tanα
)(6)
Symmetric Ricker
2pT S= p
S
ap
2 4 6 8 10
0
2
4
6
8
10
12
-5 0 5
-1.0
-0.5
0
0.5
1.0
Larger StructuresShorter Pulses
Time [ ]s
Smaller StructuresLonger Pulses
-1.00
-0.75
-0.50
-0.25
0
0.25
0.50
0.75
1.00
/q aRocking Spectrum for tan( ) = 0.1α
Acc
. [
]g
PG
A
ωp
gta
n(
)α
p
Figure 2: Rocking Spectrum (left) of a symmetric Ricker (right) analytical pulse ground motion.

M. Strand, J. A. Bachmann, M. F. Vassiliou, M. Broccardo, and B. Stojadinovic
Accordingly, rocking spectra (i.e. contour plots of θ/α in the ωp/p and ap/g tanαplane for a given slenderness α can be constructed. Figure 2 plots such a spectrum fortanα = 0.1. One can observe that for small structures or long period pulses (small ωp/p)the difference between the acceleration required to cause uplift (ug ≥ g tanα) and theacceleration required to overturn the block, is small. On the contrary, a larger structure(large ωp/p) has a larger range of pulse accelerations for which there is rocking but nooverturning. It is for these structures that the study of rocking motion is meaningful,whereas for small structures a simple static analysis is enough.
An acceleration equal to g tanα is enough to cause both uplift and overturn. Therefore,this paper is limited to the study of relatively large (in the prototype scale) rockingstructures.
3 SPECIMENS AND TEST SETUP
3.1 Rocking Specimen
With reference to Figure 3, a specimen consists of an assembly of four wedges (Nr. 1), twolinking plates (Nr. 2), and two hollow columns (Nr. 3). It presents symmetry with respectto three planes. All parts are made of aluminum and connected by aluminum bolts. Thespecimen’s height (≡ 2H) is 500mm and its depth is 400mm. This specific depth ofthe specimen was chosen in order to avoid undesired out-of-plane motion. Previous testsusing a specimen with equal width and depth revealed that, even for a weak 1D excitation,out-of-plane motion cannot be avoided.
The wedges used for the results presented in this manuscript had a total width of82mm, but the effective rocking width (distance between the center of rotations O andO’ while rocking occurs) was 75mm resulting in an effective slenderness of tanα =75mm/500mm = 0.15. To represent as closely as possible the Housner impact model
(a) Specimen in ETH laboratory
2
1
3
(b) 3D model
Figure 3: Top: Specimen and 3D model
M. Strand, J. A. Bachmann, M. F. Vassiliou, M. Broccardo, and B. Stojadinovic
5.5 71 5.5
2 2
1
3
2
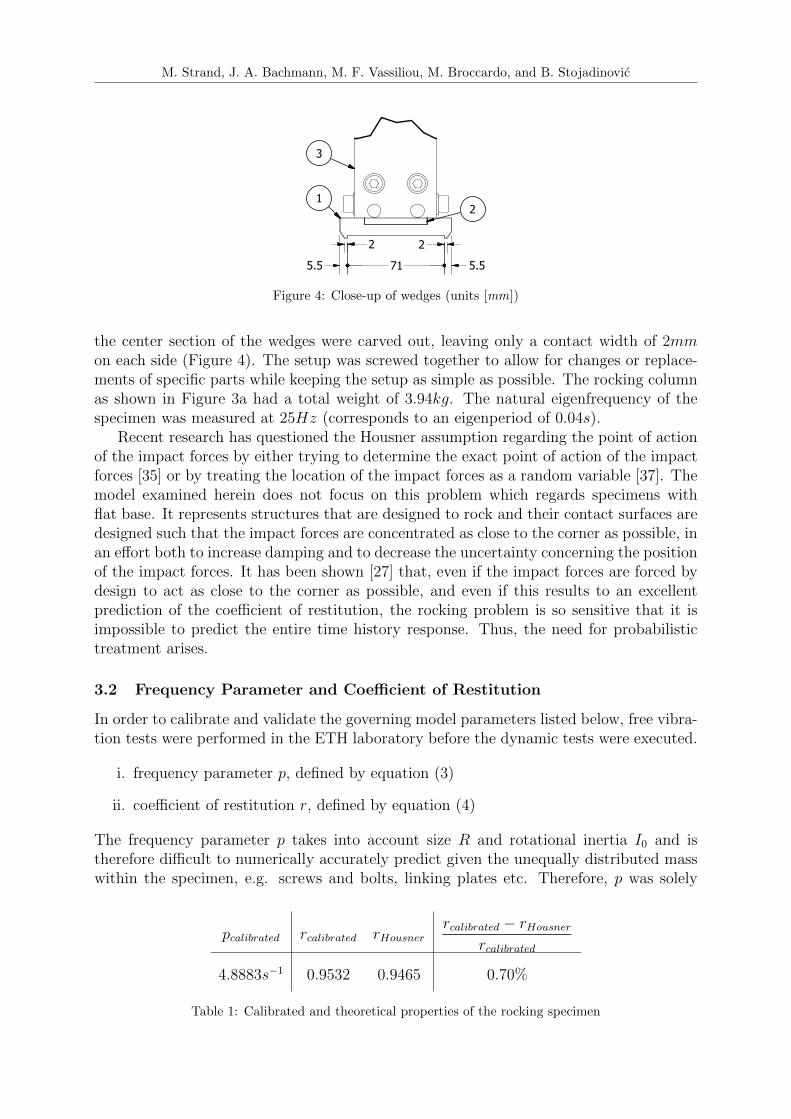
Figure 4: Close-up of wedges (units [mm])
the center section of the wedges were carved out, leaving only a contact width of 2mmon each side (Figure 4). The setup was screwed together to allow for changes or replace-ments of specific parts while keeping the setup as simple as possible. The rocking columnas shown in Figure 3a had a total weight of 3.94kg. The natural eigenfrequency of thespecimen was measured at 25Hz (corresponds to an eigenperiod of 0.04s).
Recent research has questioned the Housner assumption regarding the point of actionof the impact forces by either trying to determine the exact point of action of the impactforces [35] or by treating the location of the impact forces as a random variable [37]. Themodel examined herein does not focus on this problem which regards specimens withflat base. It represents structures that are designed to rock and their contact surfaces aredesigned such that the impact forces are concentrated as close to the corner as possible, inan effort both to increase damping and to decrease the uncertainty concerning the positionof the impact forces. It has been shown [27] that, even if the impact forces are forced bydesign to act as close to the corner as possible, and even if this results to an excellentprediction of the coefficient of restitution, the rocking problem is so sensitive that it isimpossible to predict the entire time history response. Thus, the need for probabilistictreatment arises.
3.2 Frequency Parameter and Coefficient of Restitution
In order to calibrate and validate the governing model parameters listed below, free vibra-tion tests were performed in the ETH laboratory before the dynamic tests were executed.
i. frequency parameter p, defined by equation (3)
ii. coefficient of restitution r, defined by equation (4)
The frequency parameter p takes into account size R and rotational inertia I0 and istherefore difficult to numerically accurately predict given the unequally distributed masswithin the specimen, e.g. screws and bolts, linking plates etc. Therefore, p was solely
pcalibrated rcalibrated rHousnerrcalibrated − rHousner
rcalibrated
4.8883s−1 0.9532 0.9465 0.70%
Table 1: Calibrated and theoretical properties of the rocking specimen

M. Strand, J. A. Bachmann, M. F. Vassiliou, M. Broccardo, and B. Stojadinovic
0 2 4 6 8 10 12 14
-0.8
-0.4
0
0.4
0.8experimentalnumerical
Figure 5: Free vibration: comparison between numerical (pcalibrated and rcalibrated) and experimentaldata.
obtained from the laboratory and not compared to a computed numerical value. p wascalibrated as 4.8883s−1 using the non-linear relationship between the rocking period Tand the frequency parameter p was used [1]:
coshpT
4=
1
1− θ0/α(7)
where θ0 is the maximum rocking angle for the half-cycle of duration T/2 (≡ time betweentwo impacts). For every half-cycle i a corresponding value pi can be determined. Theresulting values for p of the first 15 half-cycles were averaged to get pcalibrated. The influ-ence of decreasing values for θ0 over time was accounted for empirically by a regressionperformed on numerical experiments.
The experimental coefficient of restitution was derived by relating total energies pre-and post-impact to compute the energy loss at every impact, given the assumptions thatenergy dissipation only takes place during impact, and that at rest (θ = 0) the potentialenergy is zero. The maximum angle θ0,i of each half-cycle i was used to compute thecorresponding increase of potential energy ∆Vi, at which point the angular velocity θ iszero and, thus, the potential energy is equal to the total energy.
Eventually, equation (8) describes the energy loss at impact i and, therefore, thecoefficient of restitution ci for the ith impact during a free vibration test.
ci =cos(α− |θ0,i+1|)− cosα
cos(α− |θ0,i|)− cosα(8)
Figure 5 plots the numerical and experimental outcome of the free vibration test aftercalibration (pcalibrated was used), and Table 1 compares the calibrated parameter valuefor c to the one predicted by applying Housner’s assumptions. Noticeably, the two timehistories compare well for more than 20 rocking cycles. Housner’s assumption predicts thecoefficient of restitution with an error < 1% and the free vibration response is capturedexcellently. However, as it will be shown in a next section, this does not suffice to predictthe complete time history response to a ground motion.
3.3 Specimen Excitation and Shaking Table
The rocking response of the specimen was induced by dynamic excitation of its support.This was achieved by placing the specimen on the top of the ETH shaking table [51]. The

M. Strand, J. A. Bachmann, M. F. Vassiliou, M. Broccardo, and B. Stojadinovic
Figure 6: Experimental setup on the shaking table
shaking table platform is a stiff steel box that is placed on roller bearings and actuatedusing a servo-hydraulic actuator to move only in a uniaxial, horizontal direction. Thestroke of the table is 250mm and the maximum velocity is 225mm/s.
3.4 Data Acquisition System
Figure 6 shows the experimental and Figure 7 the schematic setup on the shaking table.The movement of the rocking column during the experimental tests was tracked withthe Optotrak Certus System, manufactured by Northern Digital Inc. (NDI). In totalfour infrared-emitting diodes were placed as markers numbered from 1 to 4; two of themon the rocking specimen (Nr. 2 and 4), and two on the shaking table (Nr. 1 and 3).The markers recorded 3D position data with an accuracy of 0.1mm. Additional output,recorded with the same sampling rate of 500Hz, is the 2D-angle (in the plane x − y ofthe NDI coordinate system) between the two lines 1–3 (going through the markers Nr. 1and 3) and 2–4, respectively, and is computed by the software of the NDI system.
In the given configuration, respecting the feasible measurement window while allowingthe shaking table to move to its maximum positions, the NDI camera allowed for recordingangles with an error of 0.8mrad (= 0.0053α). The initial and constant offset between the
Figure 7: Schematic setup on the shaking table

M. Strand, J. A. Bachmann, M. F. Vassiliou, M. Broccardo, and B. Stojadinovic
Lines 1–3 and 2–4 was measured at rest (no rocking) and was subtracted during postprocessing. The NDI camera was positioned such that the y-axis of the NDI camera andthe moving 1D-axis of the shaking table were parallel. Post processing of the 3D positiondata showed that this alignment was flawless.
4 DESCRIPTION OF THE SYNTHETIC GROUND MOTION GENERA-TION MODEL
In their pioneering work in 1980 Yim, Chopra and Penzien [3] used the 1968 model ofJennings et al. [52] to generate synthetic ground motions. Since then, more sophisticatedmodels have been developed that produce simulated ground motions with similar elasticspectra characteristics to a given recorded ground motion. The Rezaeian and Der Ki-ureghian [53–55] stochastic ground motion model was used to create 100 synthetic groundmotions for the longitudinal component of the 1940 El Centro Array #9 earthquake.
The set of 100 synthetic ground motion records was created such that it statisticallymatches the original motion. Figure 8a),b) shows the acceleration trace of the originalground motion as well as the elastic pseudo-acceleration response spectra of the generated
0 5 10 15 20 25 30 35 40 45 50-0.4
-0.2
0
0.2
0.4
10-2 10-1 1000
1
2
3
10-2 10-1 1000
1
2
3
0
0.2
0.4
0.6
10-2 10-1 1000
1
2
3
10-2 10-1 1000
1
2
3
0
0.05
0.1
10-2 10-1 1000
1
2
3
Figure 8: a) El Centro ground motion; b) Acceleration spectra of the recorded and the simulated groundmotion (without time scaling); c) Mean acceleration and displacement spectra of the original and simu-lated ground motions d-f) Acceleration and displacement spectra of the simulated ground motions andtheir shake table realizations (with time scaling).

M. Strand, J. A. Bachmann, M. F. Vassiliou, M. Broccardo, and B. Stojadinovic
synthetic ground motion records.Note that the simulated ground motions merely match the original ground motion in
terms of selected response quantities of a linear elastic single-degree-of-freedom oscillator.This does not guarantee that structures with non-linear behavior, such as rocking struc-tures, will have similar responses to individual ground motions in the generated ensemble.In fact, Vassiliou et al. [56] have shown that ground motions with identical elastic spectracan have very different rocking spectra. However, as there is no stochastic model to gen-erate ground motions with same overturning potential, using ground motions with similarelastic spectra was adopted as a minimum precondition for the statistical comparison ofthe numerical and experimental results.
It is expected that the predictability of rocking motion will depend on the size of therocking structure. From equation (6) it follows directly that to study this dependency,instead of using different specimens, one can change the time scale of the ground motion.Therefore, the dominant frequency of the input ground motions in the model scale willbe:
ωmodel = ωprototype
√S (9)
where S is the size scaling factor (S = Rprototype/Rmodel).The prototype column that was tested had a total height 2H equal to 5m. Given that
in the model domain the size of the specimen is 0.5m, the ground motions were scaledin time by a factor of
√10 (i.e. their dominant frequency was increased). Note that the
100 simulated ground motions were produced in the prototype scale and afterwards theywere scaled in time; not the vice versa.
Figure 8 compares the elastic spectra of the 100 simulated ground motions both in theprototype scale and when the ground motions are scaled in time. The spectra of both thesimulated time histories (i.e. the input to the shaking table) and of the measured shakingtable motion are shown. The mean of the displacement spectra of the 100 motions isalso plot, as several researchers report that the maximum of the Elastic DisplacementSpectrum is a good measure of the overturning potential of a ground motion [57–59].
One can observe that Rezeian’s and Der Kiureghian’s model succeeds in producingsynthetic ground motions with similar elastic spectra to the recorded ones. A comparisonbetween the spectra of the simulated ground motions and of the spectra of the motionsmeasured on the shaking table shows that the shaking table generally failed to reproducewell the high frequency content of the input ground motions. However, this does notjeopardize the validity of the comparison between the response predicted by the numericalrocking model and the experimentally observed rocking response: The spectra of themeasured ground motion still do not have a large dispersion. In any case, the numericalmodel uses the measured acceleration as excitation; and not the input to the shakingtable controller.
5 DETERMINISTIC COMPARISON
Figure 9 shows the responses observed experimentally and determined numerically for theprototype model size of 5m to four randomly selected synthetic ground motions (out ofthe set of 100) of the original ground motion Lefkada. It demonstrates that, even thoughthe experimentally measured frequency parameter, p, was used, Housner’s model fails to

M. Strand, J. A. Bachmann, M. F. Vassiliou, M. Broccardo, and B. Stojadinovic
0 5 10 15
-1
0
1
-1
0
1
0 5 10 15
Figure 9: Deterministic comparison of time history responses to four randomly selected simulated groundmotion: experimental vs. numerical (Housner) vs. numerical (empirical).
predict the response well. The results improve when the experimentally obtained coeffi-cient of restitution is used. Nevertheless, the prediction in most cases is poor and thereis not a consistent overestimation or underestimation of the maximum rocking response.Similarly, this can be observed in the other produced synthetic ground motions.
It can be concluded that the Housner rocking model, even when the coefficient ofrestitution is experimentally obtained with free vibration tests, is unable to confidentlypredict the response to a recorded earthquake ground motion. In an effort to estimatewhether the model can predict the statistics of the response to an ensemble of groundmotions (which is the actual design question) the next section adopts a probabilistictreatment.
6 STATISTICAL COMAPRISON
The experimental and the numerical response are compared in terms of their maximumrotation because this is the engineering parameter that is of interest to the designer.
Next, following [3] the maxima of θ/α were arranged in ascending order and plottedin Figure 10 in the form of a cumulative probability distribution function (CDF). Thisplot shows the probability that the block will exhibit a response less than a specific value
θnum θexp θnum − θexpθnum − θexp
θexppercentile [α] [α] [α] [-]
25th 0.37 0.36 0.01 0.03
50th 0.77 0.65 0.12 0.18
75th overturn overturn - -
Table 2: 25th, 50th and 75th percentile of the responses to the El Centro ground motion for the 5m tallprototype.

M. Strand, J. A. Bachmann, M. F. Vassiliou, M. Broccardo, and B. Stojadinovic
0 0.2 0.4 0.6 0.8 1 1.20
0.2
0.4
0.6
0.8
1
Figure 10: Cumulative distribution functions (CDF) of maximum tilt angle θmax normalized by slender-ness α.
of θ/α. Table 2 shows that the numerical and the experimental models compare excellentin terms of the 25th, 50th and 75th percentile of θ/α with a maximum relative error of0.18. This is considered a good prediction, especially given the uncertainty in predictingthe level of the ground motion intensity (however it is defined).
A comparison between the probabilities of overturning when the Housner coefficient ofrestitution and when the empirical coefficient of restitution are used reconfirms the 1980finding of Yim et al. [3]:
”From a probabilistic point of view, the coefficient of restitution influences the response[...] to a much lesser degree than the other system parameters.”
Therefore, for blocks with bases engineered to attract all the impact forces at thecorners, it seems pointless (at least in terms of overturning probability) to try to revisit thecoefficient of restitution proposed by Housner via sophisticated models. On the contrary,it is more useful to evaluate the stability of a rocking block probabilistically via the useof an ensemble of ground motions.
CONCLUSIONS
The rocking response to a single ground motion is indeed very sensitive to all parametersand the prediction of the response of a rocking block to a single ground motion is a verydifficult task. In that sense, it could be characterized as ”chaotic”. However, since theseismic problem is inherently stochastic (the ground motion is not known a priori andthis induces uncertainty in the system), the modelling uncertainty should not be a reasonto deter engineers from using rocking solutions. This paper compared experimental andnumerical results of planar SDOF rocking. It showed that existing rigid rocking modelsare able to predict the statistics of the behavior of rigid rocking systems with an accuracyon the order of 18%, at least when their rocking surfaces are engineered in a way so thatthe impact forces are concentrated at the edges.

M. Strand, J. A. Bachmann, M. F. Vassiliou, M. Broccardo, and B. Stojadinovic
REFERENCES
[1] G.W. Housner. The Behavior of inverted Pendulum Structures during Earthquakes. Bulletinof the Seismological Society of America, 53(2):403–417, 1963.
[2] Nicos Makris and Dimitrios Konstantinidis. The rocking spectrum and the limitations ofpractical design methodologies. Earthquake Engineering & Structural Dynamics, 32(2):265–289, feb 2003.
[3] Chik-Sing Yim, Anil K. Chopra, and Joseph Penzien. Rocking response of rigid blocks toearthquakes. Earthquake Engineering & Structural Dynamics, 8(6):565–587, 1980.
[4] John B Mander and Chin-Tung Cheng. Seismic resistance of bridge piers based on damageavoidance design. Technical report, 1997.
[5] Junichi Sakai and Stephen A Mahin. Analytical investigations of new methods for reducingresidual displacements of reinforced concrete bridge columns. Pacific Earthquake Engineer-ing Research Center, 2004.
[6] Chin-Tung Cheng. Shaking table tests of a self-centering designed bridge substructure.Engineering Structures, 30(12):3426–3433, 2008.
[7] Michalis F. Vassiliou. Analytical investigation of the dynamic response of a pair of columnscapped with a rigid beam and of the effect of seismic isolation on rocking structures. PhDthesis, Doctoral dissertation, Dept. of Civil Engineering, Univ. of Patras, Greece (in Greek),2010.
[8] Lijun Deng, Bruce L Kutter, and Sashi K Kunnath. Probabilistic seismic performanceof rocking-foundation and hinging-column bridges. Earthquake Spectra, 28(4):1423–1446,2012.
[9] Nicos Makris and Michalis F. Vassiliou. Planar rocking response and stability analysis ofan array of free-standing columns capped with a freely supported rigid beam. EarthquakeEngineering & Structural Dynamics, 42(3):431–449, mar 2013.
[10] Nicos Makris and Michalis F. Vassiliou. Are Some Top-Heavy Structures More Stable?Journal of Structural Engineering, 140(5):06014001, may 2014.
[11] Nicos Makris and Michalis F. Vassiliou. Dynamics of the Rocking Frame with VerticalRestrainers. Journal of Structural Engineering, 141(10):04014245, oct 2015.
[12] Elias G. Dimitrakopoulos and Anastasios I Giouvanidis. Seismic Response Analysis of thePlanar Rocking Frame. Journal of Engineering Mechanics, 141(7):04015003, jul 2015.
[13] Anastasios I. Giouvanidis and Elias G. Dimitrakopoulos. Seismic Performance of RockingFrames with Flag-Shaped Hysteretic Behavior. Journal of Engineering Mechanics, (ac-cepted 5 OCT), 2016.
[14] Marianna Loli, Jonathan A Knappett, Michael J Brown, Ioannis Anastasopoulos, andGeorge Gazetas. Centrifuge modeling of rocking-isolated inelastic RC bridge piers. Earth-quake engineering & structural dynamics, 43(15):2341–2359, 2014.
[15] P. Kokkali, T. Abdoun, and I. Anastasopoulos. Centrifuge Modeling of Rocking Foun-dations on Improved Soil. Journal of Geotechnical and Geoenvironmental Engineering,141(10):4015041, 2015.
[16] Amitabh Dar, Dimitrios Konstantinidis, and Wael W. El-Dakhakhni. Evaluation of ASCE43-05 Seismic Design Criteria for Rocking Objects in Nuclear Facilities. Journal of Struc-tural Engineering, page 04016110, jun 2016.
[17] Alessandro Contento and Angelo Di Egidio. Investigations into the benefits of base isolationfor non-symmetric rigid blocks. Earthquake Engineering & Structural Dynamics, 38(7):849–866, jun 2009.

M. Strand, J. A. Bachmann, M. F. Vassiliou, M. Broccardo, and B. Stojadinovic
[18] Ioannis N. Psycharis, J. V. Lemos, D. Y. Papastamatiou, C. Zambas, and C. Papantonopou-los. Numerical study of the seismic behaviour of a part of the Parthenon Pronaos. Earth-quake Engineering & Structural Dynamics, 32(13):2063–2084, nov 2003.
[19] Dimitrios Konstantinidis and Nicos Makris. Seismic response analysis of multidrum classicalcolumns. Earthquake Engineering & Structural Dynamics, 34(10):1243–1270, aug 2005.
[20] MJN Priestley, RJ Evison, and AJ Carr. Seismic response of structures free to rock ontheir foundations. Bulletin of the New Zealand National, 1978.
[21] Mohammad Aslam, D Theodore Scalise, and William G Godden. Earthquake rockingresponse of rigid bodies. Journal of the Structural Division, 106(2):377–392, 1980.
[22] P. R. Lipscombe and S. Pellegrino. Free Rocking of Prismatic Blocks. Journal of EngineeringMechanics, 119(7):1387–1410, jul 1993.
[23] Fernando Pena, Francisco Prieto, Paulo B. Lourenco, A. Campos Costa, and J. V. Lemos.On the dynamics of rocking motion of single rigid-block structures. Earthquake Engineering& Structural Dynamics, 36(15):2383–2399, dec 2007.
[24] Quincy Tsun Ming Ma. The mechanics of rocking structures subjected to ground motion.PhD thesis, 2010.
[25] Rico E. Truniger, Michalis F. Vassiliou, and Bozidar Stojadinovic. An analytical modelof a deformable cantilever structure rocking on a rigid surface: experimental validation.Earthquake Engineering & Structural Dynamics, 44(13), 2015.
[26] Rico E. Truniger, Michalis F. Vassiliou, and Bozidar Stojadinovic. Experimental Studyon the Interaction between Elasticity and Rocking. In 10th U.S. National Conference onEarthquake Engineering, 2014.
[27] Jonas A. Bachmann, Christoph Jost, Quentin Studemann, Michalis F. Vassiliou, and Bozi-dar Stojadinovic. An analytical model for the dynamic response of an elastic SDOF systemfixed on top of a rocking single-story frame structure: experimental validation. In EC-COMAS Congress 2016: 7th European Congress on Computational Methods in AppliedSciences and Engineering, Heraklion, 2016.
[28] Giuseppe Oliveto, Ivo Calio, and Annalisa Greco. Large displacement behaviour of a struc-tural model with foundation uplift under impulsive and earthquake excitations. EarthquakeEngineering & Structural Dynamics, 32(3):369–393, mar 2003.
[29] F. Prieto, P. B. Lourenco, and C. S. Oliveira. Impulsive Dirac-delta forces in the rockingmotion. Earthquake Engineering & Structural Dynamics, 33(7):839–857, jun 2004.
[30] Sinan Acikgoz and Matthew J. DeJong. The interaction of elasticity and rocking in flexiblestructures allowed to uplift. Earthquake Engineering & Structural Dynamics, 41(11):1–18,mar 2012.
[31] Alessandro Baratta, Ileana Corbi, and Ottavia Corbi. Towards a seismic worst scenarioapproach for rocking systems: analytical and experimental set-up for dynamic response.Acta Mechanica, 224(4):691, 2013.
[32] Michalis F. Vassiliou, Rico E. Truniger, and Bozidar Stojadinovic. An analytical model ofa deformable cantilever structure rocking on a rigid surface: development and verification.Earthquake Engineering & Structural Dynamics, 44(13), 2015.
[33] Sinan Acikgoz and Matthew J. DeJong. Analytical modelling of multi-mass flexible rockingstructures. Earthquake Engineering & Structural Dynamics, 41(11):1549–1568, 2016.
[34] Anastasios I. Giouvanidis and Elias G. Dimitrakopoulos. Nonsmooth Dynamic Analysis ofSticking Impacts in Rocking Structures. Bulletin of Earthquake Engineeringa, (accepted 4DEC), 2016.

M. Strand, J. A. Bachmann, M. F. Vassiliou, M. Broccardo, and B. Stojadinovic
[35] Dimitrios Kalliontzis, Sri Sritharan, and Arturo Schultz. Improved Coefficient of RestitutionEstimation for Free Rocking Members. Journal of Structural Engineering, page 06016002,jul 2016.
[36] Michalis F. Vassiliou, Kevin R. Mackie, and Bozidar Stojadinovic. A finite element modelfor seismic response analysis of deformable rocking frames. Earthquake Engineering &Structural Dynamics, 2016.
[37] M N Chatzis, M Garcia Espinosa, and A W Smyth. Examining the Energy Loss in theInverted Pendulum Model for Rocking Bodies. Journal of Engineering Mechanics, page4017013, 2017.
[38] V Terzic, M J Schoettler, J I Restrepo, and S A Mahin. Concrete column blind predictioncontest 2010: outcomes and observations. PEER Rep. No, 1, 2015.
[39] Jian Zhang and Nicos Makris. Rocking Response of Free-Standing Blocks under CycloidalPulses. Journal of Engineering Mechanics, 127(5):473–483, may 2001.
[40] Nicos Makris. The Role of the Rotational Inertia on the Seismic Resistance of Free-StandingRocking Columns and Articulated Frames. Bulletin of the Seismological Society of America,104(5):2226–2239, oct 2014.
[41] Nicos Makris and Georgios Kampas. Size Versus Slenderness: Two Competing Parametersin the Seismic Stability of Free-Standing Rocking Columns. Bulletin of the SeismologicalSociety of America, 106(1):104–122, feb 2016.
[42] Elias G. Dimitrakopoulos and Matthew J. DeJong. Overturning of Retrofitted RockingStructures under Pulse-Type Excitations. Journal of Engineering Mechanics, 138(8):963–972, aug 2012.
[43] Mohamed A. ElGawady, Quincy Tsun Ming Ma, John W. Butterworth, and Jason Ing-ham. Effects of interface material on the performance of free rocking blocks. EarthquakeEngineering & Structural Dynamics, 40(4):375–392, apr 2011.
[44] Christine E. Wittich and Tara C. Hutchinson. Shake table tests of stiff, unattached, asym-metric structures. Earthquake Engineering & Structural Dynamics, 41(11):n/a–n/a, jun2015.
[45] Tamas Ther and Laszlo P Kollar. Refinement of Housner’s model on rocking blocks. Bulletinof Earthquake Engineering, pages 1–15.
[46] Elias G. Dimitrakopoulos and Matthew J. DeJong. Revisiting the rocking block: closed-form solutions and similarity laws. Proceedings of the Royal Society A: Mathematical,Physical and Engineering Sciences, 468(2144):2294–2318, aug 2012.
[47] Nicos Makris and Michalis F. Vassiliou. Sizing the slenderness of free-standing rockingcolumns to withstand earthquake shaking. Archive of Applied Mechanics, 82(10-11):1497–1511, oct 2012.
[48] Michalis F. Vassiliou and Nicos Makris. Analysis of the rocking response of rigid blocksstanding free on a seismically isolated base. Earthquake Engineering & Structural Dynamics,41(2):177–196, feb 2012.
[49] Michalis F. Vassiliou and Nicos Makris. Dynamics of the Vertically Restrained RockingColumn. Journal of Engineering Mechanics, 141(12):04015049, dec 2015.
[50] Michalis F. Vassiliou and Nicos Makris. Estimating time scales and length scales in pulselikeearthquake acceleration records with wavelet analysis. Bulletin of the Seismological Societyof America, 101(2):596–618, 2011.
[51] Hugo Bachmann, Thomas Wenk, Markus Baumann, and Pierino Lestuzzi. Der neue ETH-Erdbebensimulator. Schweizer Ingenieur und Architekt, 4, 1999.

M. Strand, J. A. Bachmann, M. F. Vassiliou, M. Broccardo, and B. Stojadinovic
[52] Paul C Jennings, George W Housner, and N Chien Tsai. Simulated earthquake motions.1968.
[53] Sanaz Rezaeian and Armen Der Kiureghian. Simulation of synthetic ground motions forspecified earthquake and site characteristics. Earthquake Engineering & Structural Dynam-ics, 39(10):1155–1180, 2010.
[54] Sanaz Rezaeian and Armen Der Kiureghian. A stochastic ground motion model with sep-arable temporal and spectral nonstationarities. Earthquake Engineering & Structural Dy-namics, 37(13):1565–1584, 2008.
[55] M Broccardo and A Der Kiureghian. Simulation of near-fault ground motions usingfrequency-domain discretization. In Proceedings of the 10th National Conference on Earth-quake Engineering. Anchorage, Alaska, 2014.
[56] Michalis F. Vassiliou, Stefan Burger, Marius Egger, Jonas A. Bachmann, Marco Broccardo,and Bozidar Stojadinovic. The three-dimensional behavior of inverted pendulum cylindri-cal structures during earthquakes (under review). Earthquake Engineering & StructuralDynamics.
[57] Bidur Kafle, Nelson T. K. Lam, Emad F. Gad, and John Wilson. Displacement con-trolled rocking behaviour of rigid objects. Earthquake Engineering & Structural Dynamics,40(15):1653–1669, dec 2011.
[58] F. Gelagoti, R. Kourkoulis, I. Anastasopoulos, and G. Gazetas. Rocking-isolated framestructures: Margins of safety against toppling collapse and simplified design approach. SoilDynamics and Earthquake Engineering, 32(1):87–102, jan 2012.
[59] Vasileios Drosos and Ioannis Anastasopoulos. Shaking table testing of multidrum columnsand portals. Earthquake Engineering & Structural Dynamics, 43(11):1703–1723, sep 2014.