Embed Size (px)
Citation preview
Nat. Hazards Earth Syst. Sci., 10, 1–9, 2010www.nat-hazards-earth-syst-sci.net/10/1/2010/© Author(s) 2010. This work is distributed underthe Creative Commons Attribution 3.0 License.
Natural Hazardsand Earth
System Sciences
Probabilistic seismic hazard assessment in Greece – Part 2:Acceleration response spectra and elastic input energy spectra
G-A. Tselentis, L. Danciu, and E. Sokos
University of Patras, Seismological Lab, Rio 265 00, Patras, Greece
Received: 5 November 2009 – Revised: 8 December 2009 – Accepted: 9 December 2009 – Published:
Abstract. This second part of the study, deals with the eval-uation of the earthquake hazard in Greece in terms of theresponse spectral acceleration and the elastic input energyequivalent velocity. Four sets of predictive equations wereselected, two for each type of spectra. Probabilistic hazardmaps were created by determining the seismic hazard at gridpoints covering the region of interest. The maps are pre-sented for the dominant periods of 0.2 s and 1.0 s for eachspectrum. Uniform hazard response spectra (UHRS) for sixcities located in the regions of highest estimated hazard arealso presented. The comparison with elastic design spectraproposed by the latest national building code, has shown thatthe UHRS values exceed the design values at almost all peri-ods.
1 Introduction
Seismic hazard evaluation, either deterministic or probabilis-tic, represents the most important tool to provide designengineers and planners with critical information about theearthquake prone areas. Such information may form a basisfor effective mitigation strategies, including designing andconstructing facilities to withstand earthquake shaking withlimited damage, adequate land use and urban development,emergency response planning, etc. The current trend in theearthquake hazard evaluation calls for a proper prediction ofeffects from earthquakes whose damageability is defined byground motion parameters. Therefore, seismic hazard evalu-ation requires selecting one or more ground motion parame-ters representative of the damage potential of the earthquakeground motion.
Correspondence to:G-A. Tselentis([email protected])
Traditionally, peak ground acceleration (PGA) and re-sponse spectra acceleration (SA) are the most commonlyused parameters. However, both have significant shortcom-ings: PGA is purely related to the ground motion, and repre-sents only the information of a maximum observed amplitudevalue; whereas SA is directly related to the characteristics ofthe structure (frequency and damping) interacting with theground motion and does not account for the duration or thecyclic loadings of the ground motion. In this respect, elas-tic input energy spectra (Ei) might represent an alternative,because by combining the amplitude and duration of groundmotion provides additional information to address the elasticresponse spectra drawbacks (Uang and Bertero, 1988).
In the framework of earthquake-resistant design, the im-portance ofEi have been long time recognized and many at-tempts have been done to develop the so-called energy-basedseismic design methods (Benavent-Climent et al., 2002; Chaiand Fajfar, 2000; Decanini and Mollaioli, 1998; Housner,1956; Uang and Bertero, 1988). These studies emphasizedthat there is not a general established energy-based seismicdesign method yet; but they all pinpointed the use of dura-tion and energy parameters to describe the reliable designearthquake, as they adequately capture the destructive poten-tial of the different type of time histories (impulsive, non-impulsive, periodic with long-duration pulses, etc.) corre-sponding to an earthquake. Although, the current trend inearthquake-resistant design relies upon Probabilistic SeismicHazard (PSHA), the incorporation of energy-based spectramight provide an improved means for selecting earthquakescenarios and establishing design earthquakes for many typesof engineering analyses (Chapman, 1999).
In this respect we have selected both acceleration- andenergy-based spectra to characterize the seismic hazard inGreece. The seismic hazard is evaluated in a probabilisticmanner and the spatial variations in the hazard will be illus-trated through seismic hazard maps in terms of selected spec-tra, at periods of 0.2 and 1.0 s. The obtained hazard maps in-
Published by Copernicus Publications on behalf of the European Geosciences Union.
2 G-A. Tselentis et al.: Probabilistic seismic hazard assessment in Greece
dicate different aspects of seismic hazards which arise fromthe seismotectonic characteristics of Greece. Because PSHAis site specific rather than regional, uniform hazard responsespectra (UHRS) were computed and examined in detail forsix municipalities located in the high seismic prone regions.All the reported results in the present study are for rock soiland 5% of damping and estimated for a 10% probability ofexceedance in 50 years (0.002105 per annum).
From the point of seismic hazard assessment in Greece interms of spectral values, the study of Theodulidis and Pa-pazachos (1994b) represents the only attempt. They used theresponse spectra acceleration as a hazard parameter and pro-posed a 5% damped uniform hazard acceleration responsespectra for 11 Greek cities computed for 475 years return pe-riod. In addition they have investigated the spectral accel-eration amplification factors based on rock and alluvium soilconditions, and they observed a dependence of the spectra ondistance, for a given type of soil. However, their study wasbased on a limited data set.
2 Elastic input energy spectra
According to Uang and Bertero (1990), the total absolute en-ergy at any instant of time is given by:
Ei = EK +ES+Eζ +EH (1)
whereEK is the absolute kinetic energy,ES is the strain en-ergy, Eζ is the absorbed viscous damping energy, andEHis the hysteretic energy absorbed by the structure, whichcan be found by numerically integrating the nonlinear force-displacement history over the duration of the event.Ei isrelated to the total force applied at the base of a structurewhich physically, represents the inertial force equals the sumof the damping and restoring force. The elastic input energycan be converted to an equivalent velocity, by
VEi(T ) =√
(2Ei(T )/m), (2)
which in turn can be converted into an equivalent accelera-tion by
AEi(T ) = ωVEi(T ) = (2φ/T )√
(2Ei(T )/m), (3)
whereω is the circular frequency of motion andT is the pe-riod. For the present investigation, we have selected to rep-resent the hazard in terms of the acceleration-related param-eter SA(T ) and the elastic input energy equivalent velocityVEi(T ).
3 PSHA model
In this study a probabilistic approach, originally developedby Cornell (1968) and extended later to incorporate the un-certainty of ground motion by Esteva (1970) was used to
calculate seismic hazard values in Greece. The PSHA pro-cess involves an integration of the potential earthquake shak-ing from all possible source locations and magnitudes forsome area around a site to calculate the probabilities of var-ious levels of ground shaking at the site. The main ele-ments in seismic hazard analysis comprises a set of seis-motectonic source zones developed from a seismotectonicmodel of the study region; magnitude-recurrence relationsfor each of these zones; functional relations for the magni-tude and distance dependence of the selected strong-motionparameters; and an analytical technique for computation ofthe ground motion parameters at the selected points through-out the region at desired probabilities of exceedance (Tselen-tis and Danciu, 2010a).
In order to estimate the probability of ground motion on aregional scale, earthquakes within a seismic source are typ-ically assumed to occur randomly over time unless the his-torical or geological record indicates nonrandom occurrence(Thenhaus and Campbell, 2003). Therefore, assuming thatthe temporal occurrence of the earthquake follows a Pois-son process, for any given level of ground shaking over aspecified exposure period, the probabilistic method gives thechances of experiencing or exceeding that level of groundshaking over a specified exposure period. This assumption ofPoisson process cannot be adopted in other type of studies,e.g., when calculating the probability of a prediction basedfor example on seismic electric signals to become successfulby chance (Varotsos et al., 1996). The standard PSHA outputis the seismic hazard curve, which is defined as:
P(Y >y∗
;t)= 1−
∏k
{1−Pk (Y >y∗;t)k
}(4)
whereP (Y >y∗;t) is the exceedance probability due to all
sources within timet ; Pk is the exceedance probability dueto the k-th source, and
∏is the series product.
When spectral values are employed as hazard parameters,Eq. (4) is solved over the range of all spectral periods. How-ever, if a unique probability is assigned to the estimated spec-tra at each discrete period, equal probability spectra can bederived and referred to as a uniform hazard response spec-trum (UHRS).
The seismogenic model used in the present study was welldefined in the first part of this study (Tselentis and Danciu,2010a). In summary, the model relies on the 67 seismo-genic source zones proposed by Papaioannou and Papaza-chos (2000) and their seismicity parameters derived from theGreek catalogue thought to be complete for moment magni-tudesM≥8.0 since 550 BC, forM≥7.3 since 1501,M≥6.0since 1845,M≥5.0 since 1911,M≥4.5 since 1950,M≥4.3since 1964, andM≥4.0 since 1981.
For each seismic source zone, the estimated mean occur-rence rate per year, slope of the magnitude-frequency rela-tionship and of the maximum observed magnitude were re-tained from the same study. The magnitude was restrictedto the range 5≤M≤Mmax, where the upper bound magnitude
Nat. Hazards Earth Syst. Sci., 10, 1–9, 2010 www.nat-hazards-earth-syst-sci.net/10/1/2010/
G-A. Tselentis et al.: Probabilistic seismic hazard assessment in Greece 3
Mmax was defined as the maximum magnitude observed ineach seismic source zone plus a 0.5 magnitude unit. The un-certainty associated with the maximum observed magnitudewas estimated as 0.1 due to lack of information about theexpected faults.
The dominant fault mechanism for each individual seis-mic source zone was identified and assigned to all the gridpoints within the zone. The spatial distribution of the Greekcatalogue within the selected seismic source zones, togetherwith the associated fault mechanism is presented in Fig. 1 ofPart 1 of this investigation (Tselentis and Danciu, 2010a). Afocal depth of 10 km was adopted for all seismogenic sourcezones.
The selection of the ground motion predictive models isimportant, because these must have a similar functional form,be homogeneous in terms of magnitude and use the same def-initions for distance, soil category and fault mechanism. Forthe region of Greece, predictive equations for spectral valueswere first proposed by Theodulidis and Papazachos (1994a)and recently by Danciu and Tselentis (2007). The latest studyproposed a set of predictive equations for response accel-eration spectra and elastic input energy spectra and there-fore represents the suitable candidate to estimate the SA andVEi . The predictive model proposed by Danciu and Tse-lentis (2007), hereinafter called DT07, was derived froma dataset consisting of time-histories recorded on the lastdecades in Greece and therefore can be considered reliablefor the purpose of the present investigation.
Theodulidis and Papazachos (1994), obtained a set ofpredictive equations for pseudo-velocity spectra based on105 horizontal components of pseudo-velocity spectra from36 earthquakes in Greece with surface wave magnitude4.5<Ms<7.0 and 16 components from four earthquakes inJapan and Alaska with moment magnitude 7.0<M<7.5 val-ues in terms of earthquake magnitude, epicentral distanceand geologic site conditions. Although, the study is veryimportant, we did not consider this regression model in thepresent study, due to the abnormal large values observed par-ticularly in the short period of the elastic velocity spectra onfirm soil. This behavior was observed also by other authors(Burton et al., 2003).
Recently, Ambraseys et al. (2005), in the following AM05,have derived a set of ground motion predictive equationsbased on a set of 595 strong motion records recorded in Eu-rope and Middle East. The contribution of the strong mo-tion data recorded in Greece to the final database consistedof 112 records, approximately 22% from the total number ofrecords. The functional form of the AM05 model takes intoaccount the effect of the local soil effects and style-of-faultmechanism on the observed ground motions. The predictivemodel is valid forM>5 and distance to the surface projec-tion of the fault less than 100 km. It has to be pointed out thatthe AM05 predictive model considers the two definitions ofthe source-to-site distance: the distance to the surface pro-jection of the fault,RJB, (also, known as the Joyner-Boore
distance) forM>6 and the epicentral distance,RE, for smallearthquakes for which the location of the causative fault hasnot been reported, mainlyM<6.
Considering the predictive model for VEi , additionallyto the DT07 equations we have selected the predictiveequations proposed by Chapman (1999), in the followingCH99. The CH99 regression model for estimating the VEiwas established using a dataset consisting of 303 recordsfrom 23 earthquakes in western North America. The CH99regression model is homogenous in term of magnitude,5.2≤M≤7.7, and uses the nearest surface projection of thefault rupture as a source-to-site distance definition. As wehave mentioned before, the candidate predictive models haveto be uniform in terms of magnitude, distance definition andlocal soil conditions. In this respect, the models of AM05and CH99 have to be uniform in terms of epicentral distance.Because for small earthquakes,RJB andRE are similar dueto the small rupture planes of such earthquakes, the distancerequired in the AM05 model is corrected only for large earth-quakes, withM>6. We have selected the conversion rela-tionships proposed by Montaldo et al. (2005) based on theEuropean data:
RJB= 0.8845RE−3.5525 (5)
Unfortunately, it was not possible to empirically relate thenearest surface projection to the fault rupture with the epi-central distance. We have made a very rough approxima-tion that for small events these two source-to-site distancedefinitions are equal and we expect that for events ofM>6the ground motion is underestimated. Because of these em-pirical conversions we expect that additional bias was intro-duced in the PSHA, and therefore we have decided to focuson the DT07 regression models and to give smaller weights tothe other ground motion predictive models, including AM05,and CH99. Thus, the model DT07 for SA and VEi was as-signed with a probability of 55%, while AM05 and CH99models were assigned with an equally probability of 45%each.
The uncertainty in the regression models (due to the scat-ter in the data from which was derived) is assumed to fol-low a log normal distribution. This assumption provides ameans of quantifying the probability that given the occur-rence of an earthquake of magnitudeM at a source-to-sitedistanceR, the ground motion is above (or bellow) a groundmotion level of interest. The exclusion of this uncertainty inthe analysis would produce lower values on the PSHA results(Bender, 1984; Bommer and Abrahamson, 2006). Generally,the uncertainty of ground motion can be modelled using alognormal distribution. Following the current PSHA prac-tice we have directly incorporated the standard deviation intothe PSHA calculation, and we have imposed cut-off limitsof median plus and minus three standard deviations, to the“right-tail” of the lognormal distribution which tend to reachinfinity.
www.nat-hazards-earth-syst-sci.net/10/1/2010/ Nat. Hazards Earth Syst. Sci., 10, 1–9, 2010
4 G-A. Tselentis et al.: Probabilistic seismic hazard assessment in Greece
523
Figure 1a 524
525
526
Figure 1b 527
20
523
Figure 1a 524
525
526
Figure 1b 527
20
(a) (b)
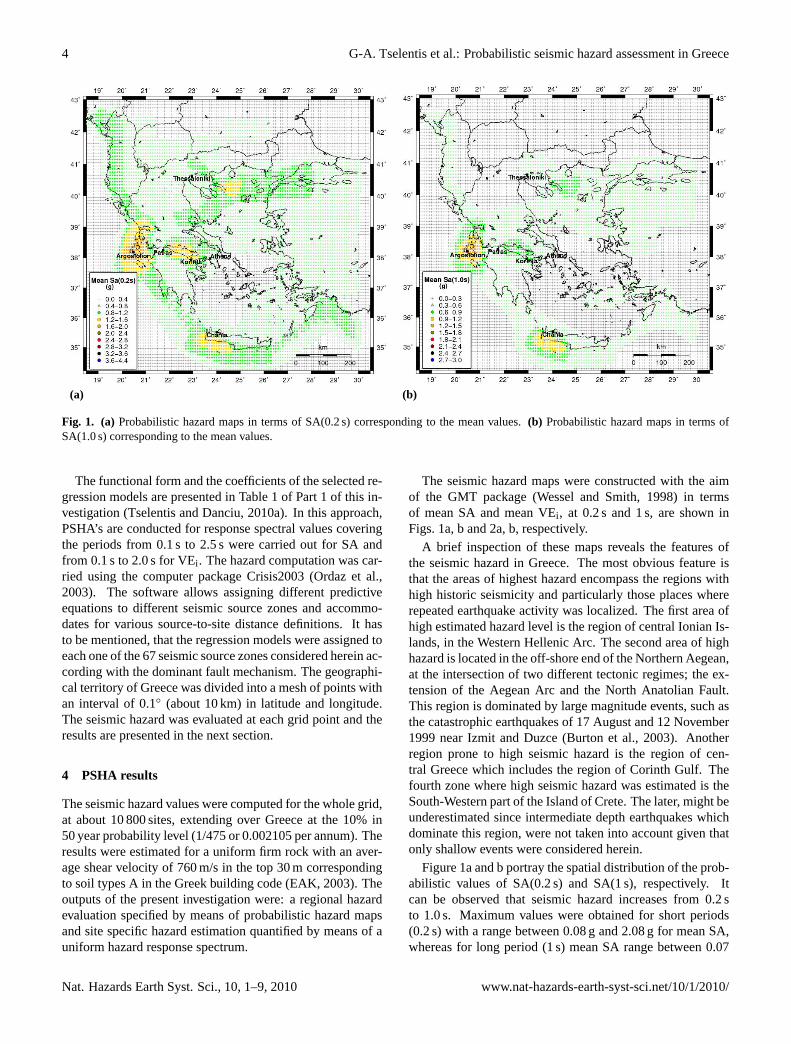
Fig. 1. (a) Probabilistic hazard maps in terms of SA(0.2 s) corresponding to the mean values.(b) Probabilistic hazard maps in terms ofSA(1.0 s) corresponding to the mean values.
The functional form and the coefficients of the selected re-gression models are presented in Table 1 of Part 1 of this in-vestigation (Tselentis and Danciu, 2010a). In this approach,PSHA’s are conducted for response spectral values coveringthe periods from 0.1 s to 2.5 s were carried out for SA andfrom 0.1 s to 2.0 s for VEi . The hazard computation was car-ried using the computer package Crisis2003 (Ordaz et al.,2003). The software allows assigning different predictiveequations to different seismic source zones and accommo-dates for various source-to-site distance definitions. It hasto be mentioned, that the regression models were assigned toeach one of the 67 seismic source zones considered herein ac-cording with the dominant fault mechanism. The geographi-cal territory of Greece was divided into a mesh of points withan interval of 0.1◦ (about 10 km) in latitude and longitude.The seismic hazard was evaluated at each grid point and theresults are presented in the next section.
4 PSHA results
The seismic hazard values were computed for the whole grid,at about 10 800 sites, extending over Greece at the 10% in50 year probability level (1/475 or 0.002105 per annum). Theresults were estimated for a uniform firm rock with an aver-age shear velocity of 760 m/s in the top 30 m correspondingto soil types A in the Greek building code (EAK, 2003). Theoutputs of the present investigation were: a regional hazardevaluation specified by means of probabilistic hazard mapsand site specific hazard estimation quantified by means of auniform hazard response spectrum.
The seismic hazard maps were constructed with the aimof the GMT package (Wessel and Smith, 1998) in termsof mean SA and mean VEi , at 0.2 s and 1 s, are shown inFigs. 1a, b and 2a, b, respectively.
A brief inspection of these maps reveals the features ofthe seismic hazard in Greece. The most obvious feature isthat the areas of highest hazard encompass the regions withhigh historic seismicity and particularly those places whererepeated earthquake activity was localized. The first area ofhigh estimated hazard level is the region of central Ionian Is-lands, in the Western Hellenic Arc. The second area of highhazard is located in the off-shore end of the Northern Aegean,at the intersection of two different tectonic regimes; the ex-tension of the Aegean Arc and the North Anatolian Fault.This region is dominated by large magnitude events, such asthe catastrophic earthquakes of 17 August and 12 November1999 near Izmit and Duzce (Burton et al., 2003). Anotherregion prone to high seismic hazard is the region of cen-tral Greece which includes the region of Corinth Gulf. Thefourth zone where high seismic hazard was estimated is theSouth-Western part of the Island of Crete. The later, might beunderestimated since intermediate depth earthquakes whichdominate this region, were not taken into account given thatonly shallow events were considered herein.
Figure 1a and b portray the spatial distribution of the prob-abilistic values of SA(0.2 s) and SA(1 s), respectively. Itcan be observed that seismic hazard increases from 0.2 sto 1.0 s. Maximum values were obtained for short periods(0.2 s) with a range between 0.08 g and 2.08 g for mean SA,whereas for long period (1 s) mean SA range between 0.07
Nat. Hazards Earth Syst. Sci., 10, 1–9, 2010 www.nat-hazards-earth-syst-sci.net/10/1/2010/
G-A. Tselentis et al.: Probabilistic seismic hazard assessment in Greece 5528
529
530
Figure 2a 531
532
533
Figure 2b 534
535
21
528
529
530
Figure 2a 531
532
533
Figure 2b 534
535
21
(a) (b)
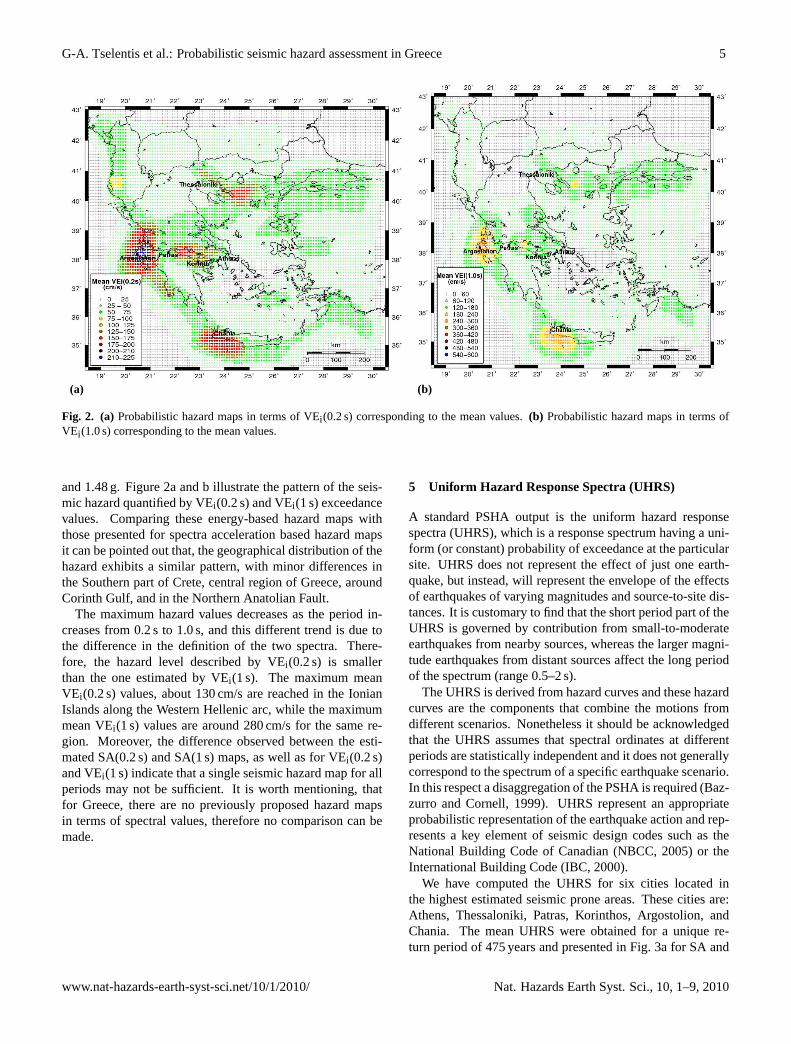
Fig. 2. (a) Probabilistic hazard maps in terms of VEi (0.2 s) corresponding to the mean values.(b) Probabilistic hazard maps in terms ofVEi (1.0 s) corresponding to the mean values.
and 1.48 g. Figure 2a and b illustrate the pattern of the seis-mic hazard quantified by VEi(0.2 s) and VEi(1 s) exceedancevalues. Comparing these energy-based hazard maps withthose presented for spectra acceleration based hazard mapsit can be pointed out that, the geographical distribution of thehazard exhibits a similar pattern, with minor differences inthe Southern part of Crete, central region of Greece, aroundCorinth Gulf, and in the Northern Anatolian Fault.
The maximum hazard values decreases as the period in-creases from 0.2 s to 1.0 s, and this different trend is due tothe difference in the definition of the two spectra. There-fore, the hazard level described by VEi(0.2 s) is smallerthan the one estimated by VEi(1 s). The maximum meanVEi(0.2 s) values, about 130 cm/s are reached in the IonianIslands along the Western Hellenic arc, while the maximummean VEi(1 s) values are around 280 cm/s for the same re-gion. Moreover, the difference observed between the esti-mated SA(0.2 s) and SA(1 s) maps, as well as for VEi(0.2 s)and VEi(1 s) indicate that a single seismic hazard map for allperiods may not be sufficient. It is worth mentioning, thatfor Greece, there are no previously proposed hazard mapsin terms of spectral values, therefore no comparison can bemade.
5 Uniform Hazard Response Spectra (UHRS)
A standard PSHA output is the uniform hazard responsespectra (UHRS), which is a response spectrum having a uni-form (or constant) probability of exceedance at the particularsite. UHRS does not represent the effect of just one earth-quake, but instead, will represent the envelope of the effectsof earthquakes of varying magnitudes and source-to-site dis-tances. It is customary to find that the short period part of theUHRS is governed by contribution from small-to-moderateearthquakes from nearby sources, whereas the larger magni-tude earthquakes from distant sources affect the long periodof the spectrum (range 0.5–2 s).
The UHRS is derived from hazard curves and these hazardcurves are the components that combine the motions fromdifferent scenarios. Nonetheless it should be acknowledgedthat the UHRS assumes that spectral ordinates at differentperiods are statistically independent and it does not generallycorrespond to the spectrum of a specific earthquake scenario.In this respect a disaggregation of the PSHA is required (Baz-zurro and Cornell, 1999). UHRS represent an appropriateprobabilistic representation of the earthquake action and rep-resents a key element of seismic design codes such as theNational Building Code of Canadian (NBCC, 2005) or theInternational Building Code (IBC, 2000).
We have computed the UHRS for six cities located inthe highest estimated seismic prone areas. These cities are:Athens, Thessaloniki, Patras, Korinthos, Argostolion, andChania. The mean UHRS were obtained for a unique re-turn period of 475 years and presented in Fig. 3a for SA and
www.nat-hazards-earth-syst-sci.net/10/1/2010/ Nat. Hazards Earth Syst. Sci., 10, 1–9, 2010
6 G-A. Tselentis et al.: Probabilistic seismic hazard assessment in Greece
(a)
2.502.252.001.751.501.251.000.750.500.250.00
1.5
1.2
0.9
0.6
0.3
0.0
T(sec)
Sa(%
g)
mean
2.502.252.001.751.501.251.000.750.500.250.00
1.5
1.2
0.9
0.6
0.3
0.0
T(sec)
Sa(%
g)
mean
2.502.252.001.751.501.251.000.750.500.250.00
2.0
1.6
1.2
0.8
0.4
0.0
T(sec)
Sa(g
)
mean
2.502.252.001.751.501.251.000.750.500.250.00
2.5
2.0
1.5
1.0
0.5
0.0
T(sec)
Sa(g
)
mean
2.502.252.001.751.501.251.000.750.500.250.00
6.0
4.8
3.6
2.4
1.2
0.0
T(sec)
Sa(g
)
mean
2.502.252.001.751.501.251.000.750.500.250.00
3.0
2.4
1.8
1.2
0.6
0.0
T(sec)
Sa(g
)mean
Athens Thessaloniki
Patras
ChaniaArgostolion
Korinthos
536
537
538
22
(b)
2.001.751.501.251.000.750.500.250.00
200
100
0
T(s)
VEi
(cm
/sec
)
mean
2.001.751.501.251.000.750.500.250.00
200
100
0
T(s)
VEi
(cm
/sec
)
mean
2.001.751.501.251.000.750.500.250.00
200
100
0
T(s)
VEi
(cm
/sec
)
mean
2.001.751.501.251.000.750.500.250.00
500
250
0
T(s)
VEi
(cm
/sec
)
mean
2.001.751.501.251.000.750.500.250.00
300
150
0
T(s)
VEi
(cm
/sec
)
mean
2.001.751.501.251.000.750.500.250.00
300
150
0
T(s)
VEi
(cm
/sec
)
mean
ThessalonikiAthens
Patras Argostolion
Korinthos Chania
539
540
Figure 3 541
542
543
23
(a) (b)
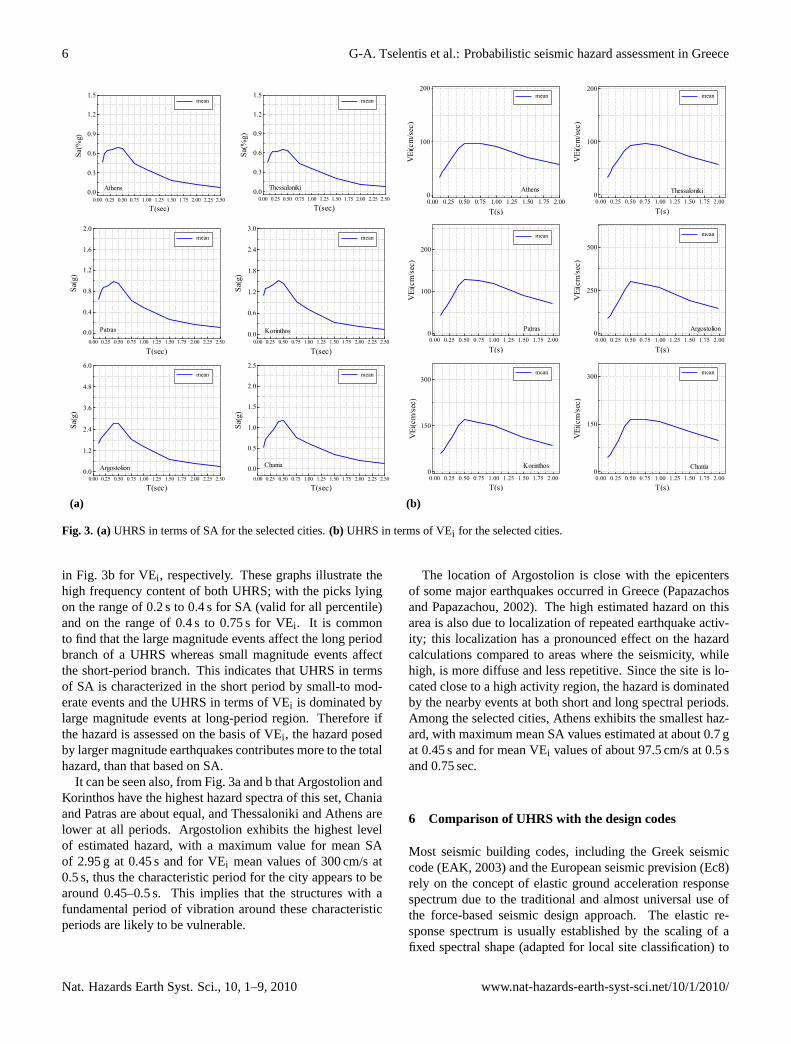
Fig. 3. (a)UHRS in terms of SA for the selected cities.(b) UHRS in terms of VEi for the selected cities.
in Fig. 3b for VEi , respectively. These graphs illustrate thehigh frequency content of both UHRS; with the picks lyingon the range of 0.2 s to 0.4 s for SA (valid for all percentile)and on the range of 0.4 s to 0.75 s for VEi . It is commonto find that the large magnitude events affect the long periodbranch of a UHRS whereas small magnitude events affectthe short-period branch. This indicates that UHRS in termsof SA is characterized in the short period by small-to mod-erate events and the UHRS in terms of VEi is dominated bylarge magnitude events at long-period region. Therefore ifthe hazard is assessed on the basis of VEi , the hazard posedby larger magnitude earthquakes contributes more to the totalhazard, than that based on SA.
It can be seen also, from Fig. 3a and b that Argostolion andKorinthos have the highest hazard spectra of this set, Chaniaand Patras are about equal, and Thessaloniki and Athens arelower at all periods. Argostolion exhibits the highest levelof estimated hazard, with a maximum value for mean SAof 2.95 g at 0.45 s and for VEi mean values of 300 cm/s at0.5 s, thus the characteristic period for the city appears to bearound 0.45–0.5 s. This implies that the structures with afundamental period of vibration around these characteristicperiods are likely to be vulnerable.
The location of Argostolion is close with the epicentersof some major earthquakes occurred in Greece (Papazachosand Papazachou, 2002). The high estimated hazard on thisarea is also due to localization of repeated earthquake activ-ity; this localization has a pronounced effect on the hazardcalculations compared to areas where the seismicity, whilehigh, is more diffuse and less repetitive. Since the site is lo-cated close to a high activity region, the hazard is dominatedby the nearby events at both short and long spectral periods.Among the selected cities, Athens exhibits the smallest haz-ard, with maximum mean SA values estimated at about 0.7 gat 0.45 s and for mean VEi values of about 97.5 cm/s at 0.5 sand 0.75 sec.
6 Comparison of UHRS with the design codes
Most seismic building codes, including the Greek seismiccode (EAK, 2003) and the European seismic prevision (Ec8)rely on the concept of elastic ground acceleration responsespectrum due to the traditional and almost universal use ofthe force-based seismic design approach. The elastic re-sponse spectrum is usually established by the scaling of afixed spectral shape (adapted for local site classification) to
Nat. Hazards Earth Syst. Sci., 10, 1–9, 2010 www.nat-hazards-earth-syst-sci.net/10/1/2010/
G-A. Tselentis et al.: Probabilistic seismic hazard assessment in Greece 7
a single ground motion parameter – PGA – deterministicallyor probabilistically estimated from the seismicity of the re-gion. In general the shape of a spectrum is statistically de-rived from a collection of numerous spectra representativeof the ground motions recorded in different earthquakes un-der similar conditions (especially characterized by local soilconditions).
Despite its widespread and acceptance as a convenient de-sign tool, the use of normalized shape spectra has advantagesin its simplicity; but not without criticism. In both seis-mic codes the spectral shape is considered completely inde-pendent from seismic hazard, only site conditions affect thespectral shape. It has been recognized, that spectral shapeis also dependent upon earthquake magnitude and source-to-site distance, local site conditions and direction of fault rup-ture propagation, but conventional elastic design spectra doesnot take into account these effects. Moreover, the probabil-ities of exceedance of a normalized-shape design spectrummay be different over the entire frequency (or period) rangeof interest and cannot be considered as an uniform hazardspectrum (Kramer, 1996).
An attempt to consider the earthquake magnitude effecton the spectral shape dependence on the fixed spectral shapewas proposed in Eurocode 8. The European seismic regula-tion introduced two types of design spectra for low (type II)and high (type I) seismic regions that depend on the max-imum magnitude of earthquakes that are expected to affectthe site. Both spectra rely in the value of the reference PGA,which is chosen by the National Authorities for each seis-mic zone, corresponding to the reference return period (475-years) of the seismic action for the no-collapse requirement.In EAK (2003), the seismic hazard is defined by a PGA mapestimated for 475-year return period, which depicts the re-gion of Greece in three zones of homogenous hazard withthe following seismic zone factors (PGA): 0.16 g for zone I;0.24 g for zone II and 0.36 g for zone III.
It is interesting to note that, the first difference arise fromthe slightly different values of the corner periods introducedfor the same type of soil categories. For rock soil condition(category A) the region of constant acceleration defined byTB in EAK starts at 0.10 s while in Ec8 starts at 0.15 s. How-ever, another difference of the EAK (2003) from the Ec8 isin the exponential coefficient of the descending slope of theelastic response spectrum (2/3 instead of 1). Thus, the EAKelastic design spectra is more conservative in the moderate tolong region of the spectra (velocity and displacement regionof elastic spectra), exhibiting a descending slope larger thanthe one proposed by EC8.
Plots of the two elastic design spectra proposed byEAK (2003) and Ec8 (type I) together with UHRS estimatedfor the selected cities are plotted in Fig. 4. The elastic de-sign spectra plotted in Fig. 4 corresponds to a region of highseismic zone, (reference PGA = 0.36 g), estimated in bedrock(soil category A) and 5 % damping. The UHRS in terms ofSA computed for the selected cities were normalized with the
24
544
545
546
547
Figure 4 548
549
Figure 5 550
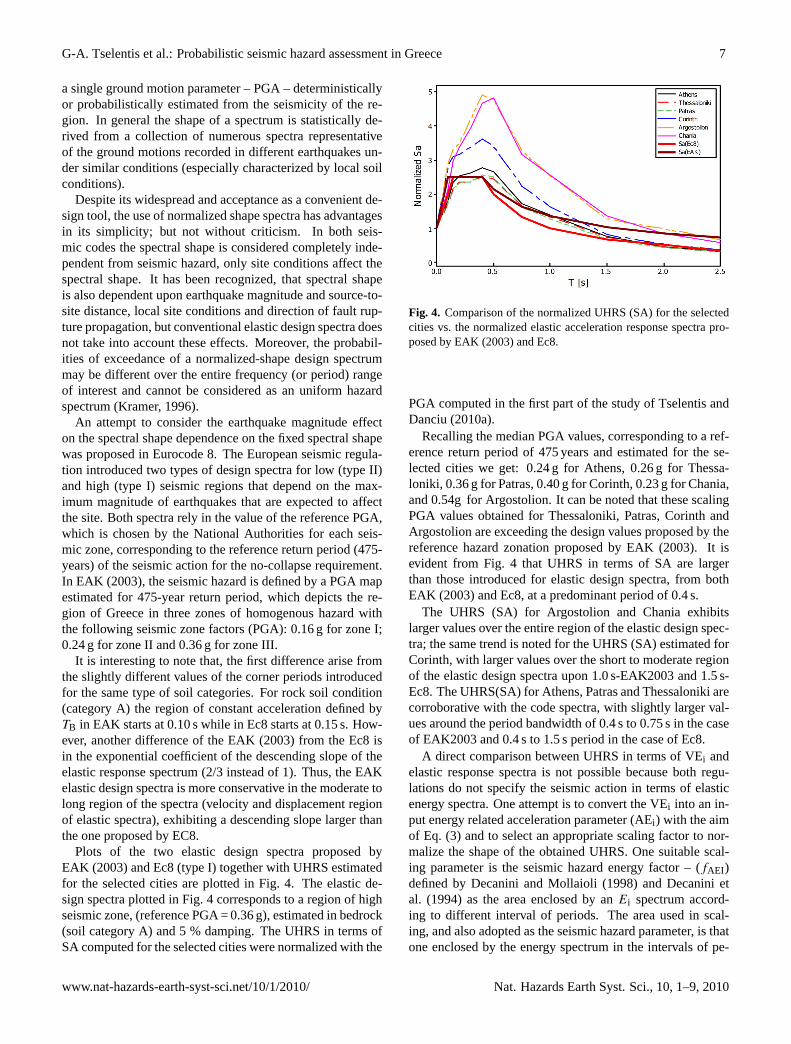
Fig. 4. Comparison of the normalized UHRS (SA) for the selectedcities vs. the normalized elastic acceleration response spectra pro-posed by EAK (2003) and Ec8.
PGA computed in the first part of the study of Tselentis andDanciu (2010a).
Recalling the median PGA values, corresponding to a ref-erence return period of 475 years and estimated for the se-lected cities we get: 0.24 g for Athens, 0.26 g for Thessa-loniki, 0.36 g for Patras, 0.40 g for Corinth, 0.23 g for Chania,and 0.54g for Argostolion. It can be noted that these scalingPGA values obtained for Thessaloniki, Patras, Corinth andArgostolion are exceeding the design values proposed by thereference hazard zonation proposed by EAK (2003). It isevident from Fig. 4 that UHRS in terms of SA are largerthan those introduced for elastic design spectra, from bothEAK (2003) and Ec8, at a predominant period of 0.4 s.
The UHRS (SA) for Argostolion and Chania exhibitslarger values over the entire region of the elastic design spec-tra; the same trend is noted for the UHRS (SA) estimated forCorinth, with larger values over the short to moderate regionof the elastic design spectra upon 1.0 s-EAK2003 and 1.5 s-Ec8. The UHRS(SA) for Athens, Patras and Thessaloniki arecorroborative with the code spectra, with slightly larger val-ues around the period bandwidth of 0.4 s to 0.75 s in the caseof EAK2003 and 0.4 s to 1.5 s period in the case of Ec8.
A direct comparison between UHRS in terms of VEi andelastic response spectra is not possible because both regu-lations do not specify the seismic action in terms of elasticenergy spectra. One attempt is to convert the VEi into an in-put energy related acceleration parameter (AEi) with the aimof Eq. (3) and to select an appropriate scaling factor to nor-malize the shape of the obtained UHRS. One suitable scal-ing parameter is the seismic hazard energy factor – (fAEI)defined by Decanini and Mollaioli (1998) and Decanini etal. (1994) as the area enclosed by anEi spectrum accord-ing to different interval of periods. The area used in scal-ing, and also adopted as the seismic hazard parameter, is thatone enclosed by the energy spectrum in the intervals of pe-
www.nat-hazards-earth-syst-sci.net/10/1/2010/ Nat. Hazards Earth Syst. Sci., 10, 1–9, 2010
8 G-A. Tselentis et al.: Probabilistic seismic hazard assessment in Greece
24
544
545
546
547
Figure 4 548
549
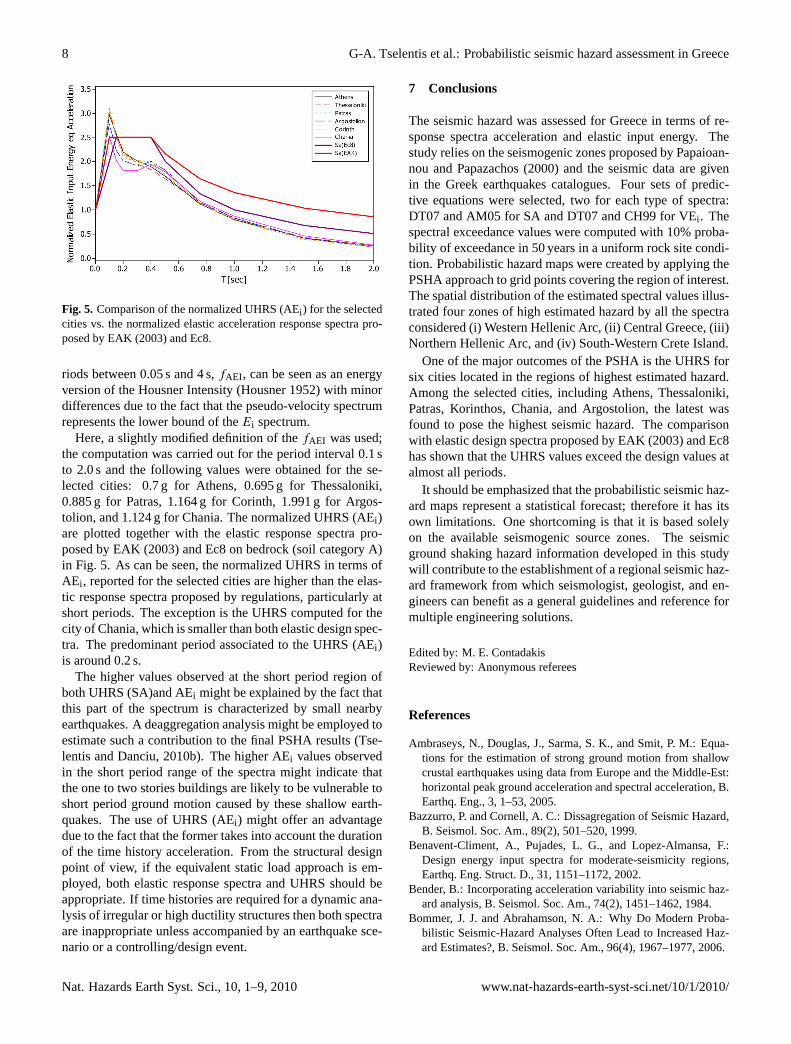
Figure 5 550 Fig. 5. Comparison of the normalized UHRS (AEi ) for the selectedcities vs. the normalized elastic acceleration response spectra pro-posed by EAK (2003) and Ec8.
riods between 0.05 s and 4 s,fAEI , can be seen as an energyversion of the Housner Intensity (Housner 1952) with minordifferences due to the fact that the pseudo-velocity spectrumrepresents the lower bound of theEi spectrum.
Here, a slightly modified definition of thefAEI was used;the computation was carried out for the period interval 0.1 sto 2.0 s and the following values were obtained for the se-lected cities: 0.7 g for Athens, 0.695 g for Thessaloniki,0.885 g for Patras, 1.164 g for Corinth, 1.991 g for Argos-tolion, and 1.124 g for Chania. The normalized UHRS (AEi)are plotted together with the elastic response spectra pro-posed by EAK (2003) and Ec8 on bedrock (soil category A)in Fig. 5. As can be seen, the normalized UHRS in terms ofAEi , reported for the selected cities are higher than the elas-tic response spectra proposed by regulations, particularly atshort periods. The exception is the UHRS computed for thecity of Chania, which is smaller than both elastic design spec-tra. The predominant period associated to the UHRS (AEi)is around 0.2 s.
The higher values observed at the short period region ofboth UHRS (SA)and AEi might be explained by the fact thatthis part of the spectrum is characterized by small nearbyearthquakes. A deaggregation analysis might be employed toestimate such a contribution to the final PSHA results (Tse-lentis and Danciu, 2010b). The higher AEi values observedin the short period range of the spectra might indicate thatthe one to two stories buildings are likely to be vulnerable toshort period ground motion caused by these shallow earth-quakes. The use of UHRS (AEi) might offer an advantagedue to the fact that the former takes into account the durationof the time history acceleration. From the structural designpoint of view, if the equivalent static load approach is em-ployed, both elastic response spectra and UHRS should beappropriate. If time histories are required for a dynamic ana-lysis of irregular or high ductility structures then both spectraare inappropriate unless accompanied by an earthquake sce-nario or a controlling/design event.
7 Conclusions
The seismic hazard was assessed for Greece in terms of re-sponse spectra acceleration and elastic input energy. Thestudy relies on the seismogenic zones proposed by Papaioan-nou and Papazachos (2000) and the seismic data are givenin the Greek earthquakes catalogues. Four sets of predic-tive equations were selected, two for each type of spectra:DT07 and AM05 for SA and DT07 and CH99 for VEi . Thespectral exceedance values were computed with 10% proba-bility of exceedance in 50 years in a uniform rock site condi-tion. Probabilistic hazard maps were created by applying thePSHA approach to grid points covering the region of interest.The spatial distribution of the estimated spectral values illus-trated four zones of high estimated hazard by all the spectraconsidered (i) Western Hellenic Arc, (ii) Central Greece, (iii)Northern Hellenic Arc, and (iv) South-Western Crete Island.
One of the major outcomes of the PSHA is the UHRS forsix cities located in the regions of highest estimated hazard.Among the selected cities, including Athens, Thessaloniki,Patras, Korinthos, Chania, and Argostolion, the latest wasfound to pose the highest seismic hazard. The comparisonwith elastic design spectra proposed by EAK (2003) and Ec8has shown that the UHRS values exceed the design values atalmost all periods.
It should be emphasized that the probabilistic seismic haz-ard maps represent a statistical forecast; therefore it has itsown limitations. One shortcoming is that it is based solelyon the available seismogenic source zones. The seismicground shaking hazard information developed in this studywill contribute to the establishment of a regional seismic haz-ard framework from which seismologist, geologist, and en-gineers can benefit as a general guidelines and reference formultiple engineering solutions.
Edited by: M. E. ContadakisReviewed by:Anonymous referees
References
Ambraseys, N., Douglas, J., Sarma, S. K., and Smit, P. M.: Equa-tions for the estimation of strong ground motion from shallowcrustal earthquakes using data from Europe and the Middle-Est:horizontal peak ground acceleration and spectral acceleration, B.Earthq. Eng., 3, 1–53, 2005.
Bazzurro,P. and Cornell, A. C.: Dissagregation of Seismic Hazard,B. Seismol. Soc. Am., 89(2), 501–520, 1999.
Benavent-Climent, A., Pujades, L. G., and Lopez-Almansa, F.:Design energy input spectra for moderate-seismicity regions,Earthq. Eng. Struct. D., 31, 1151–1172, 2002.
Bender, B.: Incorporating acceleration variability into seismic haz-ard analysis, B. Seismol. Soc. Am., 74(2), 1451–1462, 1984.
Bommer, J. J. and Abrahamson, N. A.: Why Do Modern Proba-bilistic Seismic-Hazard Analyses Often Lead to Increased Haz-ard Estimates?, B. Seismol. Soc. Am., 96(4), 1967–1977, 2006.
Nat. Hazards Earth Syst. Sci., 10, 1–9, 2010 www.nat-hazards-earth-syst-sci.net/10/1/2010/
G-A. Tselentis et al.: Probabilistic seismic hazard assessment in Greece 9
Bommer, J. J. and Abrahamson, N. A.: Why Do Modern Proba-bilistic Seismic-Hazard Analysis Often Lead to Increase HazardEstimates?, B. Seismol. Soc. Am., 96(4), 1967–1977, 2006.
Burton, P. W., Yebang, X., Tselentis, G.-A., Sokos, E., and Aspinall,W.: Strong ground accelaration seismic hazard in Greece andneighboring regions, Soil Dyn. Earthq. Eng., 23, 159–181, 2003.
CEN. Eurocode 8: Design of structures for earthquake resistance ofstructures – Part 1: General rules, seismic actions and rules forbuildings, prEN 1998-1, Brussels, 2002b.
Chai, Y. H. and Fajfar, P.: A Procedure for Estimating Input EnergySpectra for Seismic Design, J. Earthq. Eng., 4(2), 539–561, 2000.
Chapman, M. C.: On the use of elastic input energy for seismichazard analysis, Earthq. Spectra, 15(2), 607–635, 1999.
Cornell, C. A.: Engineering Seismic Risk Analysis, B. Seismol.Soc. Am., 58, 1583–1606, 1968.
Danciu, L. and Tselentis, G. A.: Engineering Ground-Motion Pa-rameters Attenuation Relationships for Greece, B. Seismol. Soc.Am., 97(1B), 162–183, 2007.
Decanini, L. and Mollaioli, F.: Formulation of Elastic EarthquakeInput Energy Spectra, Earthq. Eng. Struct. D., 27, 1503–1522,1998.
Decanini, L., Mollaioli, F., and Oliveto, G.: Observations andlessons learned from the earthquake of 13th December 1990 inSouth-East Sicily, Proc. of the 10th European Conference onEarthquake Engineering, Balkema, Wien, 1935–1943, 1994.
EAK: Greek Seismic Code, edited by: Earthquake Planning & Pro-tection Organizatin. Athens – Greece, 72 pp., 7 appendixes, 2003(in Greek).
Esteva, L.: Seismic Risk and Seismic Design Decisions, in: SeismicDesign for Nuclear Power Plants, edited by: Hansen, R. J., Mas-sachusetts Inst. of Tech. Press, Cambridge, MA, USA, 142–82,1970.
Housner, G. W.: Intensity of ground motion during strong earth-quake, California Institute of Technology, Pasadena, California,1952.
Housner, G. W.: Limit design of structures to resist earthquakes,Proc. 1st. World Conference Earthquake Engineering, Berkeley,California, EERI, 1956.
Kramer, S. L.: Geotechnical Earthquake Engineering, Prentice Hall,1996.
Montaldo, V., Faccioli, E., Zonno, G., Akinci, A., and Malagnini,L.: Treatment of ground-motion predictive relationships for thereference seismic hazard map of Italy, J. Seismol., 9, 295–316,2005.
Ordaz, M., Aguilar, A., and Arboleda, J.: CRISIS2003, Ver. 3.1,Program for computing seismic hazard, Instituto de Ingenierı́a,UNAM, Mexico, 2003.
Papaioannou, C. A. and Papazachos, B. C.: Time-Independent andTime-Depended Seismic Hazard in Greece Based on Seismo-genic Sources, B. Seismol. Soc. Am., 90, 22–33, 2000.
Papazachos, C. B. and Papazachou, K.: Earthquakes in Greece, ZitiPublications, Thessaloniki, 2002.
Thenhaus, P. C. and Campbell, K. W.: Seismic Hazard Analysis, in:Earthquake Engineering Handbook, edited by: Chen, W.-F. andSchawthorn, C., CRC Press, VIII1-50, 2003.
Theodulidis, N. P. and Papazachos, B. C.: Dependence of strongground motion on magnitude-distance, site geology and macro-seismic intensity for shallow earthquakes in Greece: II, Horizon-tal Pseudo-velocity, Soil Dyn. Earthq. Eng., 13, 317–343, 1994a.
Theodulidis, N. P. and Papazachos, B. C.: Seismic Hazard As-sessment in Greece in terms of spectral values, Bull. Geol. Soc.Greece, XXX(3), 205–213, 1994b.
Tselentis, G.-A. and Danciu, L.: Probabilistic seismic hazard as-sessment in Greece – Part 1: Engineering ground motion param-eters, Nat. Hazards Earth Syst. Sci., 10, 25–39, 2010a.
Tselentis, G.-A. and Danciu, L.: Probabilistic seismic hazard as-sessment in Greece – Part 3: Deaggregation, Nat. Hazards EarthSyst. Sci., 10, 51–59, 2010b.
Uang, C. M. and Bertero, V. V.: Implications of recorded earth-quake ground motions on seismic design of building structures,Earthquake Engineering Research Center, Berkeley, CA, ReportNo. UCB/EERC-88/13, 1988.
Uang, C. M. and Bertero, V. V.: Evaluation of seismic energy instructures, Earthq. Eng. Struct. D., 19, 77–90, 1990.
Varotsos, P., Eftaxias, K., Lazaridou, M., Antonopoulos, G.,Makris, J., and Poliyannakis, J.: Summary of the five principlessuggested by P. Varotsos et al. (1996) and the additional ques-tions raised in this debate, Geophys. Res. Lett., 23, 1449–1452,1996.
Wessel, P. and Smith, W. H. F.: Free software helps map and displaydata, EOS T. Am. Geophys. Un., 72, 444–446, 1998.
www.nat-hazards-earth-syst-sci.net/10/1/2010/ Nat. Hazards Earth Syst. Sci., 10, 1–9, 2010