Embed Size (px)
Citation preview

Probabilistic Assessment of the Crosswind Stability ofRailway Vehicles
Christian Wetzel∗, Carsten Proppe
Institut fur Technische Mechanik, Universitat Karlsruhe (TH)
Abstract
The crosswind stability against overturning is a major design criterion for high speedrailway vehicles. Due to the increasing interoperability in Europe it has also become animportant international task. In recent years efforts have been made to derive an uniformrule in certifying railway vehicles. In this case especially probabilistic methods have beenproposed which are common design criteria for wind turbines. A sophisticated method tocompute the reliability of railway vehicles under strong crosswind is presented. In consid-eration of the given stochastic wind excitation the response of a simplified train model andthe corresponding probability of failure have been computed. The major failure criterion todetermine the reliability is the lowest wheel-rail contact force of the railway vehicle.In the product development process it is a common goal to calculate the virtual prototypeas realistic as possible but it is also essential to minimize the computational efforts. For aprobabilistic analysis this means to take only the most significant stochastic variables intoaccount and to neglect the unimportant ones. To isolate the major variables a sensitivityanalysis with respect to the stochastic excitation variables has been done.But not only the knowledge about the influence of the excitation variables is crucial, alsothe impact of the design parameters of the railway vehicle on the crosswind stability isimportant to know. To get a deeper insight into the system also a sensitivity analysis withrespect to the deterministic design parameters has been done.
Keywords: Crosswind Stability, Railway Vehicles, Stochastic System, Sensitivity Analysis
∗Kontakt: Christian Wetzel, Institut fur Technische Mechanik Universitat Karlsruhe (TH) 76128 Karlsruhe,E-Mail: [email protected]
Weimar Optimization and Stochastics Days4.0– November 29–30, 2007 1

1 Introduction
The modern developments in railway engineering have been showing a trend to faster and moreenergy efficient trains with a higher capacity of passenger transportation. These efforts are di-rectly leading to light-weight cars with distributed actuation. Unfortunately these developmentsare in contrast to a save use in strong crosswind conditions.Especially the first car of the trainis highly endangered as it is exposed by the strongest wind forces and moments.
Figure 1: Switzerland January 2007, courtesy of Schweizer Fernsehen - Schweiz Aktuell.
During the last 140 years about thirty wind-induced accidents have been reported. Most ofthese accidents happened in Japan on narrow gauges at highlyendangered points (e.g. bridgesor embankments) in nearly hurricane conditions, Fujii et al.; Gawthorpe (1994). But also in Eu-rope there have been incidents reported that trains turned over while operating in strong winds,Rolen et al. (2004). The last accident which has happened inEurope occurred in Switzerland(figure 1) during the winter storm Kyrill in January 2007.Consequently the crosswind stability is a major topic whichhas to be considered during theproduct development process and which cannot be solved easily as all counter-measures arevery expensive. If a railway vehicle fails to be certified, ballasting in the underbelly is often theonly adequate way to save the design. It is obvious that ballasting a light-weight constructionis not a desired goal. Putting wind-fences along the track atplaces with a high risk of strongwinds also increases the costs dramatically.Due to the desired interoperability in Europe the European Commission is working on Techni-cal Specifications for Interoperability (TSI) to get a common rule for the certification of rail-way vehicles. Most of the leading operating companies of trains in Europe are using approvalprocesses which are based on worst case scenarios in which the stochastic nature of the uncer-tainties are not explicitly modeled but are considered by using safety factors, Matschke et al.(2002); Diedrichs et al. (2004). This approach is an antagonism to the intention to optimize therailway vehicle behavior under strong crosswind. Taking the uncertainties during the computa-tion of the characteristic wind curve into account, Carrarini (2004) for the first time, proposeda probabilistic characteristic wind curve (PCWC) whereas Cooper (1979) was the first to in-troduce uncertainties by the use of a risk assessment process. The major uncertainties in therailway vehicle-/environmental system (e.g. wind scenario, aerodynamic coefficients) are con-sidered as stochastic variables for which the corresponding probability distributions are takenfrom available literature.The first intention of this paper is to introduce a method for computing the failure probability
Weimar Optimization and Stochastics Days4.0– November 29–30, 2007 2

Pf of a railway vehicle under strong crosswind. In this case failure means the exceedance of acritical value of the so-called wheel unloading
δQ
Q= 1 −
Qdyn
Qstatic
, (1)
whereQdyn is the wheel-rail contact force in every time step andQstatic is the static contact forcewhich is set in the absence of all external forces, Diedrichset al. (2004). The critical limit ofthe wheel unloading is usually defined as
δQ
Q≥ 0.9, (2)
which means, that the windward wheels are not yet lifting offthe track.
Figure 2: Front and side view with normal wheel forceQdyn and resultant wind velocityvs.
In a second step sensitivity analyses with respect to the stochastic excitation variables and withrespect to deterministic design parameters are performed and the most crucial variables areaccentuated.The paper is structured as follows: In the first section the vehicle and the wind model areintroduced. Then the simulation procedures are described and the used software is shown.After that a representative railway car is investigated andthe results are briefly stated whilesection6 contains the major conclusions.
2 Modeling of the system
The system can be divided into two separate parts: the environmental model and the vehiclemodel. The environmental model itself consists of two distinct components: the track and theaerodynamic forces and moments.
2.1 Railway vehicle
The railway vehicle is simulated in the commercial MBS-Software ADAMS/Rail. In this codethe nonlinear spring and damper forces can be utilized without major problems and also thebump-stops, which have a great influence on the overturning behavior can be included veryprecisely. The wheel-rail contact forces are simulated using the implemented FASTSIM routine,Kalker (1982). This routine is a good compromise between speed and accuracy to calculate theresultant wheel-rail forces.
Weimar Optimization and Stochastics Days4.0– November 29–30, 2007 3

Figure 3: Schematic sketch of the vehicle with coordinate system and wind velocity vector.
2.2 Environmental model
2.2.1 Track model
Straight tracks fitted with UIC 60 rails at standard gauge of1435 mm have been used. So farno track irregularities have been investigated. The sleepers have been modeled as rigid bodieswith an elastic foundation.
2.2.2 Aerodynamic model
The crosswind modelu(t) consists of a superposition of the mean windu0 and the gust winduB(t). As the train speedv0 is much higher than the velocity of the crosswind the spatialcorre-lation of the wind can be neglected. That means that the wind excitation is modeled in such away, as if the train would be running through a frozen wind field. Hence, the wind is designed asa function of the track variables and must be transformed into the time domain by the constanttrain velocityv0 as a time integration of the differential equations has to beperformed.
Figure 4: Crosswind characteristic with gust amplitudeA and gust durationT .
The exponentially shaped gust characteristic (figure 4) which is utilized in this investigationsis often used in wind turbine design and has a strong theoretical foundation, Bierbooms andCheng (2002); prEN 14067-6 (2007).
Weimar Optimization and Stochastics Days4.0– November 29–30, 2007 4

The wind loads on the vehicle are modeled as concentrated forces and moments and so they arecomputed from the acting wind velocityvs(t) by means of experimentally determined aerody-namic coefficients:
Fy/z(v0, u(t)) = Cside/lift(βw)ρ
LAt
2v2
s , (3)
Mx/y/z(v0, u(t)) = Croll/pitch/yaw(βw)ρ
LAtl
2v2
s , (4)
as the determination of reliable aerodynamic coefficients by means of computational fluid dy-namics (CFD) is still an unsolved topic, Diedrichs et al. (2004); Diedrichs (2003). The param-etersAt and l are the area and the length dimension of the railway car andρL is the constantdensity of air. The wind forces and moments are therefore functions of the angle
βw = arctan
(
u0 + uB(t)
v0
)
(5)
and of the squared resultant wind velocity
v2
s(t) = v2
0+ (u0 + uB(t))2
. (6)
As the railway vehicle has a certain dimension in the horizontal and vertical direction the re-sultant wind forces have to be calculated by an averaging process over the whole area of thecarbody. In the time domain this integration transforms to asliding mean procedure with thetime interval[t − Lt
2v0
, t + Lt
2v0
], whereLt describes the length of the carbody.
0 1 2 3 4 50
0.1
0.2
0.3
0.4
0.5
0.6
0.7
0.8
pdf(
A)
A0 5 10 15 20
0
0.05
0.1
0.15
0.2
0.25
p T|A
(t)
t
Figure 5: Probability distribution functions of amplitudeA and durationT .
The aerodynamic coefficientsCside/lift/roll/pitch/yaw, the gust amplitudeA and the gust dura-tion T are assumed to be random variables. As not much information about the distributionsof the aerodynamic coefficients exists they are fitted by a gaussian distribution with a standarddeviation of10%. The gust amplitudeA follows a half gaussian and the gust durationT followsa lognormal distribution as described in Delaunay and Locatelly (1990).
Weimar Optimization and Stochastics Days4.0– November 29–30, 2007 5
3 Probabilistic analysis of the system
3.1 Reliability analysis
To determine the probability of failurePf it is necessary to evaluate the high dimensional inte-gral
Pf =
∫
Ωf
pZ∗
(z∗)dz∗ (7)
over the failure domainΩf wherez∗ contains all stochastic variables of the system andpZ∗
(z∗)are the corresponding probability density functions. The failure domainΩf is separated fromthe safe domainΩs by the so called limit-state functiong(z∗) = 0 which is defined as:
g(z∗) = 0.9 −δQ
Q. (8)
From this definition the failure domain is characterized byg(z∗) ≤ 0 and the safe domain byg(z∗) ≥ 0. For the complex railway vehicle system where a numerical calculation of the func-tiong(z∗) lasts about half a minute and where the limit-state functionis not known explicitly butcan only be evaluated pointwise the computation of the integral 7 is a demanding task. To sim-plify the calculations the law of conditional probability can be used and equation 7 is reducedto
Pf =
∫ u0,t
u0,d
P (z|u0)p(u0)du0, (9)
whereasz = [A, T, Cside/lift/roll/pitch/yaw] is the vector of the remaining stochastic variables.But still the conditional probabilityP (z|u0) has to be calculated which can be done by semi-analytical procedures such as FORM or SORM or by numerical methods like Monte CarloSimulation, Proppe et al. (2003); Roos et al. (2006), and eventually also response surface meth-ods can be used, Bucher and Burgound (1990).The first step in the numerical procedure is always to map all distributions to the standard gaus-sian space, in which the shortest distance from the origin tothe limit-state function, the socalled design point, is computed. The FORM results are then verified and improved by impor-tance sampling around the design point, Engelund and Rackwitz (1993); Bucher (1988), to getreliable estimates of the conditional probabilities.
3.2 Sensitivity analysis
The sensitivity analysis is a method to investigate the influence of input parameters on the out-put of a system. Sensitivity methods are commonly classifiedin local and global methods andin qualitative and quantitative methods. It is up to the userof these methods which one to take,as they all have their advantages and respectively drawbacks. In general the local and qualita-tive methods are less computationally expensive but the results gained from these methods areeither only valid for a small local region or give only an indication how the dependency betweeninput and output parameters is. On the other side the global and quantitative methods give eitherresults which are valid over the whole parameter space or which show exactly how the inputparameters affect the output, but these sensitivity methods require a much higher amount of
Weimar Optimization and Stochastics Days4.0– November 29–30, 2007 6

computational effort.In this work the sensitivity analysis is performed to deal with two different kinds of problems.The first one is the impact of the seven stochastic excitationvariables on the crosswind stabilityof the railway vehicle and the second one is to investigate the influence of the deterministicdesign parameters.To separate the unimportant excitation variables from the important ones a robustness analysiswith latin hypercube sampling (LHS) has been undertaken. From the LHS linear and quadraticcorrelation coefficients and principal component values from a principal component analysishave been calculated. A comparison of these values show clearly how high the impact of astochastic variable is. Another good method to decide whichvariable is important or not is tolook at the response surface approximations and to search for high gradients.The influence of the deterministic design parameters has been extracted by a design of ex-periment (DoE). In this case the anthill plots of the function g(z) with respect to the designparameters are good criterions, as these functions directly show the deterministic dependencybetween these values, optiSLang2007.
4 Workflow
The reliability and sensitivity calculations have been performed under assistance of the com-mercial code optiSLang. The software optiSlang is specially designed to perfom sensitivity,reliability and optimization tasks. It is platform and solver independent and its advantage liesin its coupling with other software codes as for example Multi-Body- or FE-programs. The im-plemented powerful algorithms can then be used to investigate the Multi-Body- or FE-models.
Figure 6: Flowchart between optiSLang, Matlab and ADAMS/Rail.
In this work optiSLang is coupled with the MBS-code ADAMS/Rail and with Matlab. OptiS-Lang is used for pre-and postprocessing and as master program to control the reliability andsensitivity computations. It alters the ADAMS input-file and the Matlab m-file which is neededto map the distributions to standard gaussian variables andto start ADAMS/Rail in solver mode.The Matlab m-file also writes an output file to pass the resultant values to optiSLang, Fritz(2004).
Weimar Optimization and Stochastics Days4.0– November 29–30, 2007 7

The postprocessing and the graphical preparation at the endof the computations is again per-formed with the powerful optiSLang postprocessing routines.
5 Results
5.1 Reliability analysis
As a first result, in figure 7, the normal forceQdyn(t) of a windward wheel is shown with respectto the simulation timet. In the presented case the critical limit is already exceeded and so thesystems parameters are located in the failure domain.
Qdyn(t)
t
Figure 7: Normal forceQdyn(t) for v0 = 160[kmh
] andu0 = 14[ms] at the design point.
Figure 8 shows the conditional probability of failureP (z|u0) with respect to the mean windspeedu0 on a straight track for two different vehicle velocities. The failure probability variesabout exponentially with increasing mean wind speed.
16 18 20 2210
−6
10−4
10−2
100
P(z
|u0)
u0 [m/s]
FORM 160 [km/h]IS 160 [km/h]FORM 240 [km/h]IS 240 [km/h]
Figure 8: PCWC calculated by a FORM and IS analysis.
To verify and to improve the results of the FORM analysis importance sampling simulationshave been carried out. For higher mean wind speeds both results match quite well, as can be
Weimar Optimization and Stochastics Days4.0– November 29–30, 2007 8
Evolution of failure probability
800700600500400Designs
0.0
60
.04
0.0
20
Fa
ilure
pro
ba
bili
ty | S
tan
da
rd d
evia
tio
n
Failure probabilityStandard deviation
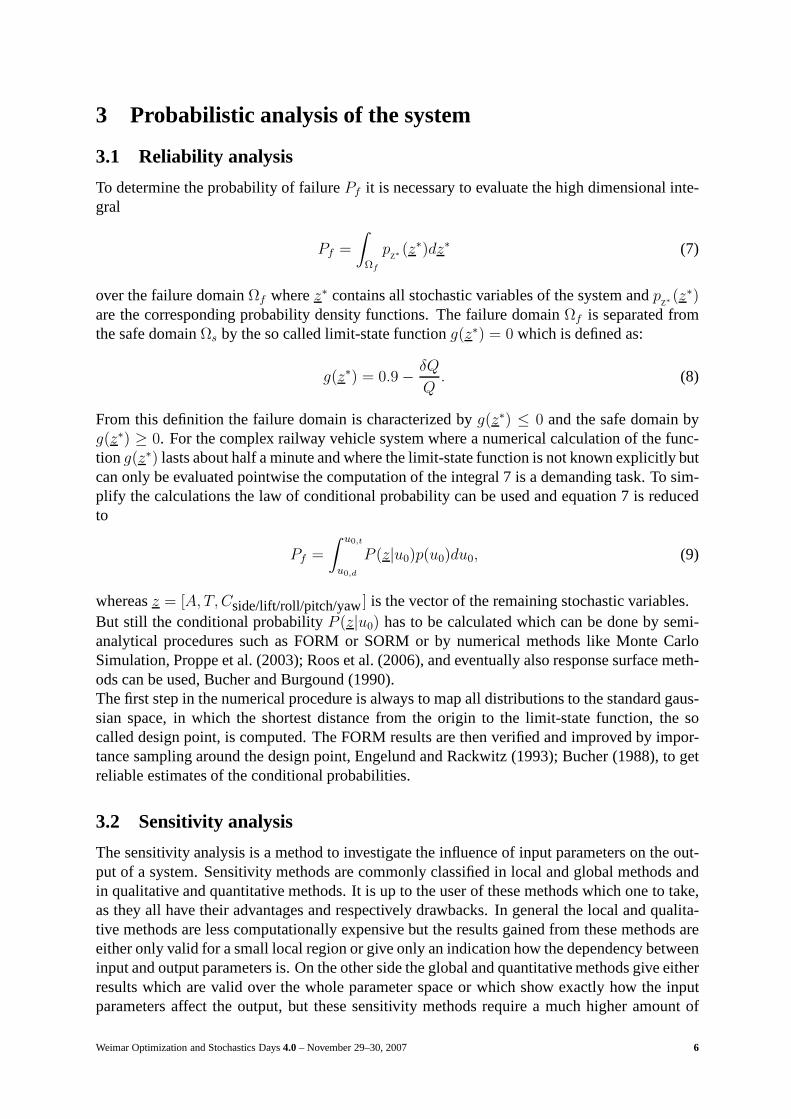
Figure 9: IS result evolution and anthill plot of the failure and safe domain forv0 = 240[kmh
]andu0 = 20[m
s].
seen in figure 9, but for lower mean wind speeds drastic deviations occur. At a mean wind speedof 16[m
s] and a driving velocity of160[km
h] the relative error is about
P (z|16)FORM
P (z|16)IS= 114 (10)
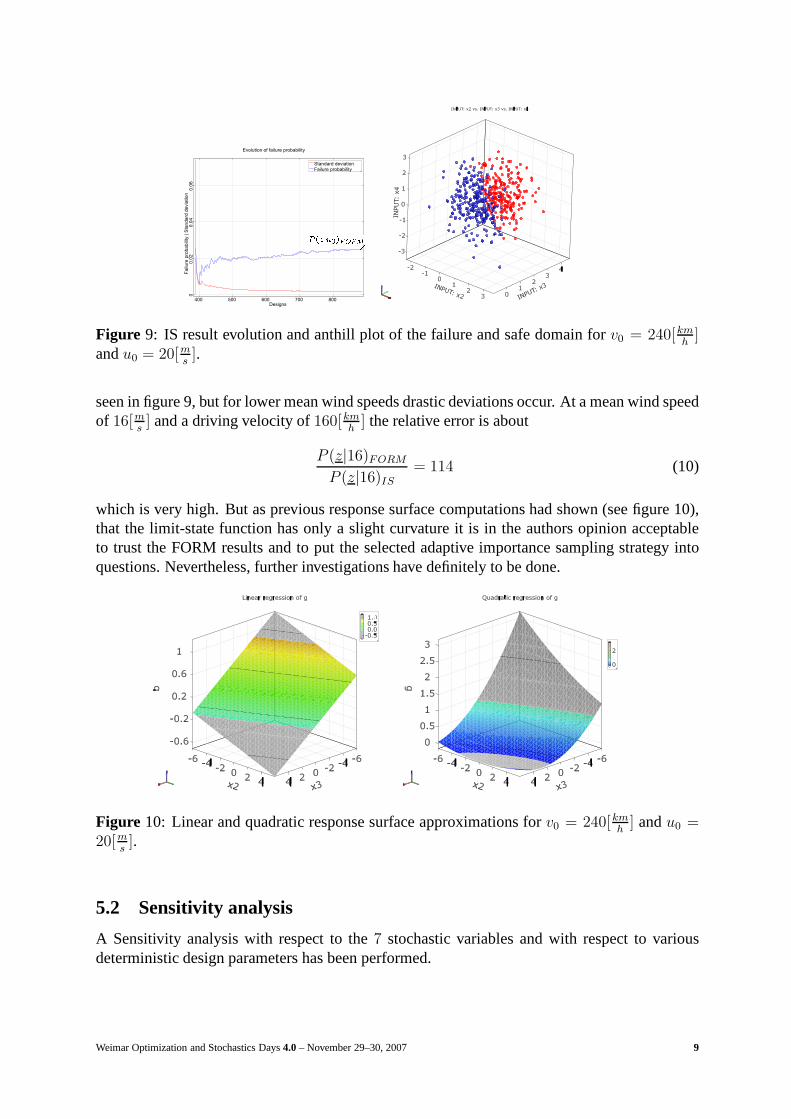
which is very high. But as previous response surface computations had shown (see figure 10),that the limit-state function has only a slight curvature itis in the authors opinion acceptableto trust the FORM results and to put the selected adaptive importance sampling strategy intoquestions. Nevertheless, further investigations have definitely to be done.
Figure 10: Linear and quadratic response surface approximations for v0 = 240[kmh
] andu0 =20[m
s].
5.2 Sensitivity analysis
A Sensitivity analysis with respect to the7 stochastic variables and with respect to variousdeterministic design parameters has been performed.
Weimar Optimization and Stochastics Days4.0– November 29–30, 2007 9

5.2.1 Excitation variables
In all figures the order and assignment of the variables is as follows:
x1 → Clift , x2 → Croll , x3 → A, x4 → T,
x5 → Cside, x6 → Cpitch, x7 → Cyaw, x8 → g(z).
From the linear and quadratic correlations matrices shown in figure 11 (the axes refer toxi, i =1 . . . 8) the most crucial variables can be identified. These are the gust amplitudeA, the aerody-
INPUT: x1 vs. INPUT: x1, r = 1.000
8642From: RELI-ISPUD ; Samples 887/887 (0 failed)
86
42
Par
amet
er |
Res
pons
e
-1.0-0.50.00.51.0
INPUT: x1 vs. INPUT: x1, r = 1.000
8642Quadratic - Linear r = 0.000
86
42
Par
amet
er |
Res
pons
e
0.0
0.5
1.0
Figure 11: Linear and quadratic correlation coefficients forv0 = 240[kmh
] andu0 = 20[ms].
namic roll moment coefficientCroll and the gust durationT , listed in the order of importance.The same result arises form the computation of the principalcomponent vector. From figure12 it can clearly be seen, that the amplitude and the roll moment coefficient have the highest
INPUT: x1
INPUT: x2
INPUT: x3
INPUT: x4
INPUT: x5
INPUT: x6
INPUT: x7
OUTPUT: g
Principal Component Vector 1
0.60.40.20-0.2-0.4-0.6PC vector coefficient
86
42
-1.0-0.50.00.51.0
Figure 12: Principal component vector forv0 = 240[kmh
] andu0 = 20[ms].
impact. Based on these facts a model reduction could be applied and the unimportant variablescould be neglected.
Weimar Optimization and Stochastics Days4.0– November 29–30, 2007 10
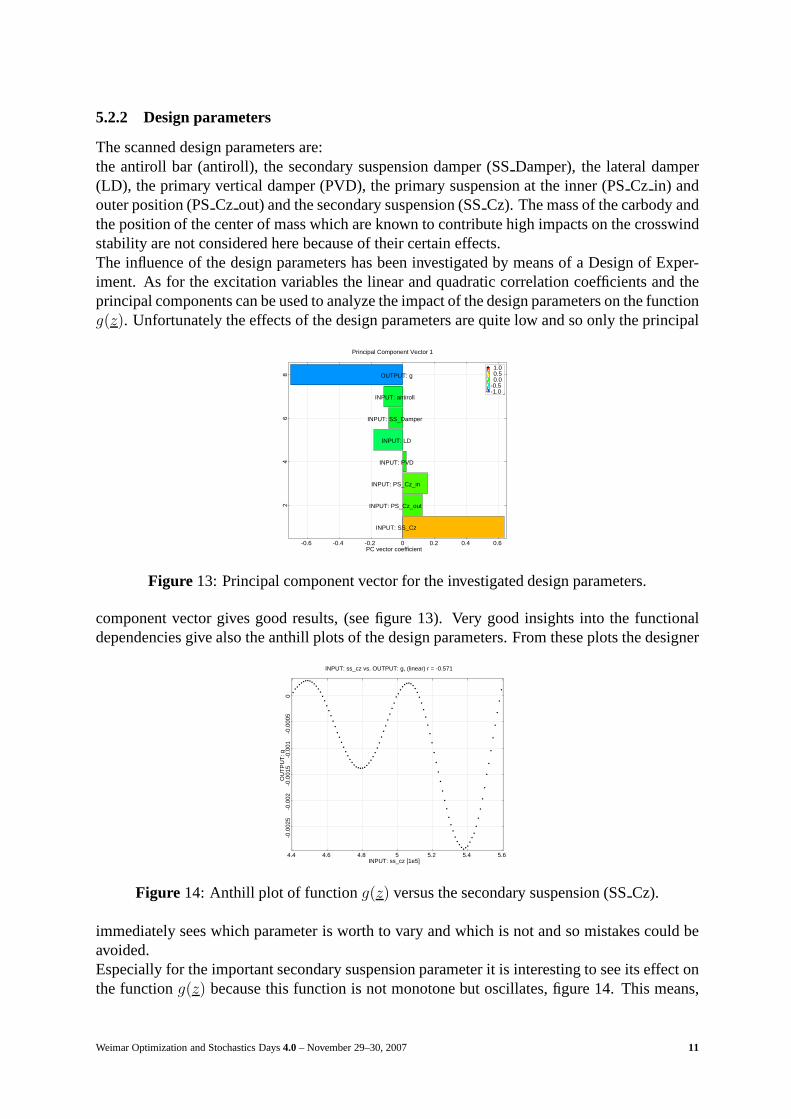
5.2.2 Design parameters
The scanned design parameters are:the antiroll bar (antiroll), the secondary suspension damper (SSDamper), the lateral damper(LD), the primary vertical damper (PVD), the primary suspension at the inner (PSCz in) andouter position (PSCz out) and the secondary suspension (SSCz). The mass of the carbody andthe position of the center of mass which are known to contribute high impacts on the crosswindstability are not considered here because of their certain effects.The influence of the design parameters has been investigatedby means of a Design of Exper-iment. As for the excitation variables the linear and quadratic correlation coefficients and theprincipal components can be used to analyze the impact of thedesign parameters on the functiong(z). Unfortunately the effects of the design parameters are quite low and so only the principal
INPUT: SS_Cz
INPUT: PS_Cz_out
INPUT: PS_Cz_in
INPUT: PVD
INPUT: LD
INPUT: SS_Damper
INPUT: antiroll
OUTPUT: g
Principal Component Vector 1
0.60.40.20-0.2-0.4-0.6PC vector coefficient
86
42
-1.0-0.50.00.51.0
Figure 13: Principal component vector for the investigated designparameters.
component vector gives good results, (see figure 13). Very good insights into the functionaldependencies give also the anthill plots of the design parameters. From these plots the designer
INPUT: ss_cz vs. OUTPUT: g, (linear) r = -0.571
5.65.45.254.84.64.4INPUT: ss_cz [1e5]
0-0
.000
5-0
.001
-0.0
015
-0.0
02-0
.002
5O
UT
PU
T: g
Figure 14: Anthill plot of functiong(z) versus the secondary suspension (SSCz).
immediately sees which parameter is worth to vary and which is not and so mistakes could beavoided.Especially for the important secondary suspension parameter it is interesting to see its effect onthe functiong(z) because this function is not monotone but oscillates, figure14. This means,
Weimar Optimization and Stochastics Days4.0– November 29–30, 2007 11

that a simple increase or decrease of the secondary suspension parameter could lead to the op-posite effect as wanted and so maybe the designer would misleadingly decrease the crosswindstability and not increase it. Here, using a local sensitivity method would have also lead towrong results and only a global sensitivity analysis can give the complete overview over thesystem behavior.
6 Conclusion
In this paper a consistent stochastic approach to calculatethe crosswind stability of railwayvehicles, in which Probabilistic Characteristic Wind Curves (PCWC) have to be computed, isproposed. The stochastic variables in the system result from uncertainties in the wind excita-tion and from uncertainties in the aerodynamic coefficientsof the vehicle. In this approach thecrosswind stability is quantified by the probability of failure that a railway vehicle turns over. Ina second step the influence of the stochastic variables and the influence of deterministic designparameters have been investigated by means of global sensitivity analyses.The PCWC have been calculated by FORM approximations and by Monte Carlo simulationswith variance reduction. The derived results have been showing a good agreement for highermean wind velocities but have also been showing relative large errors for lower mean wind ve-locities.The sensitivity analyses have been performed by means of latin hypercube sampling (LHS) andby subsequent calculations of linear and quadratic correlation coefficients and principal compo-nent values.From the seven stochastic variables the most crucial variables have been extracted. The gustamplitudeA, the aerodynamic roll moment coefficientCroll and the gust durationT have beenidentified to be most important.For the design parameters of the railway vehicle such clear results cannot be given. The influ-ences of the considered parameters are, except for one exclusion, almost negligible. And thementioned exception unfortunately has an oscillating functional dependency on the crosswindstability and can therefore not be used to optimize the railway vehicle.Optimizing the railway vehicle with the goal to reduce the risk of overturning while operatingin strong winds is a crucial issue as it directly leads to multi-criterion optimization. Not onlythe crosswind stability but other objective functions as for example comfort, costs and limiteddesign space have to be considered. This is an issue which should definitely be investigated infuture.
Acknowledgement
The authors would like to thank Dynardo-Dynamic Software and Engineering GmbH for pro-viding the software optiSLang.
References
[optiSLang2007]optiSLang, the optimizing Structural Language, Version 2.1, 2007
Weimar Optimization and Stochastics Days4.0– November 29–30, 2007 12

[prEN 14067-6 2007] 14067-6 prEN: Railway applications-Aerodynamics-Part 6:Require-ments and test procedures for cross wind assessment. 2007. –European Standard
[Bierbooms and Cheng 2002] BIERBOOMS, W. ; CHENG, P.-W.: Stochastic gust model fordesign calculations of wind turbines. In:Wind Engineering and Industrial Aerodynamics90(2002), S. 1237–1251
[Bucher 1988] BUCHER, C.: Adaptive Sampling - An Iterative Fast Monte Carlo Procedure.In: Structural Safety5 (1988), S. 119–126
[Bucher and Burgound 1990] BUCHER, C. ; BURGOUND, U.: A fast and efficient responsesurface approach for structural reliability problems. In:Structural Safety7 (1990), S. 57–66
[Carrarini 2004] CARRARINI, A.: A probabilistic approach to the effects of cross-windsonrolling stock. In:Proc. European Congress on Computational Methods in Applied Sciencesand Engineering. Jyv 2004
[Cooper 1979] COOPER, R.K.: The probability of trains overturning in high winds.In: Proc.5th Int. Conf. on Wind Engineering, Fort Collins, Colorado,USA, pp. 1185-1194, 1979
[Delaunay and Locatelly 1990] DELAUNAY , D. ; LOCATELLY, J.P.: A gust model for thedesign of large horizontal axis wind turbines: completion and validation. In:Proc. EuropeanCommunity Wind Energy Conference, Madrid, Spain, pp. 176-180, 1990
[Diedrichs 2003] DIEDRICHS, B.: On computational fluid dynamics modelling of crosswindeffects for high-speed rolling stock. In:Journal Rail and Rapid Transit217 (2003), S. 203–226
[Diedrichs et al. 2004] DIEDRICHS, B. ; EKEQUIST, M. ; STICHEL, S. ; TENGSTRAND, H.:Quasi-static modelling of wheel-rail reactions due to crosswind effects for varous types ofhigh-speed rolling stock. In:Journal Rail and Rapid Transit218 (2004), S. 133–148
[Engelund and Rackwitz 1993] ENGELUND, S. ; RACKWITZ , R.: A benchmark study onimportance sampling techniques in structural reliability. In: Structural Safety12 (1993),S. 255–276
[Fritz 2004] FRITZ, F. Grundlagen der gekoppelten Simulation in Matlab/Simulinkund ADAMSmittels ADAMS-Controls, Studienarbeit Universitat Karlsruhe. 2004
[Fujii et al.] FUJII, T. ; MAEDA, T. ; ISHIDA, H. ; IMAI , T. ; TANEMOTO, K. ; SUZUKI ,M.: Wind-Induced Accidents of Train/Vehicles and Their Measures in Japan. In:QuarterlyReport of Railway Technical Research Institut40, March
[Gawthorpe 1994] GAWTHORPE, R.G.: Wind effects on ground transportation. In:Journal ofWind Engineering and Industrial Aerodynamics52 (1994), S. 73–92
[Kalker 1982] KALKER, J.J.: A Fast Algorithm for the Simplified Theory of Rolling Conatct.In: Vehicle System Dynamics11 (1982), S. 1–13
[Matschke et al. 2002] MATSCHKE, G. ; GRAB, M. ; BERGANDER, B.: Nachweis der Sicherheitim Schienenverkehr bei extremem Seitenwind. In:Betrieb und Verkehr51 (2002), April,S. 200–206
Weimar Optimization and Stochastics Days4.0– November 29–30, 2007 13

[Proppe et al. 2003] PROPPE, C. ; PRADLWARTER, H.J. ; SCHUELLER, G.I.: Equivalent lin-earization and Monte Carlo simulation in stochastic dynamics. In:Probabilistic EngineeringMechanics18 (2003), S. 1–15
[Rolen et al. 2004] ROLEN, C. ; RUNG, T. ; WU, D.: Computational modelling of cross-windstability of high-speed trains. In:Proc. European Congress on Computational Methods inApplied Sciences and Engineering. Jyv 2004
[Roos et al. 2006] ROOS, D. ; ADAM , U. ; BAYER, V.: Design Reliability Analysis. In:24thCAD-FEM User‘s Meeting, International Congress on FEM Technology, 2006
Weimar Optimization and Stochastics Days4.0– November 29–30, 2007 14


![Crosswind Guidelines[1]](https://img.pdfslide.us/doc/110x75/542d898f219acd4d4b8b573b/crosswind-guidelines1.jpg)