Embed Size (px)
Citation preview

www.crnm.org
Private Sector
A product of the Private Sector Outreach of the Office of Trade Negotiations (OTN) of the CARICOM Secretariat
Trade Note
+
CARICOM’s Export Overview
CARICOM TRADE PERFORMANCE The Caribbean Common Market (CARICOM) is an almost 40 year old free trade and economic bloc comprised of most of the English speaking islands of the Caribbean along with Haiti, Suriname and Belize. The establishment of CARICOM facilitates various international business possibilities including trade in goods and services as well as cross-border investment. This trade note
focuses on the region’s performance in the area of trade in goods as the information is most readily available. In 2008, exporters in CARICOM generated US$34.3bn in both intra-regional and extra-regional sales. There were about 1,260 tariff lines recording over US$100,000 in 2008 showing the breadth of export activity. Simultaneously, the region’s importers spent almost US$40bn on both intra-regional and extra regional imports (see figure 1).
Between 2001 and 2008, merchandise exports have been more dynamic than merchandise imports. Between 2001 and 2008, merchandise export sales have grown by 19.8% per annum, whilst merchandise import spending expanded by 16.4% per annum. However, the trade deficit still expanded by on average 4.5% per annum between 2001 and 2008 to record US$5.6bn in 2008 (see figure 1). International merchandise trade opportunities are not being exploited homogenously across CARICOM. In 2008, the dominant regional exporter and importer was Trinidad & Tobago. Trinidad & Tobago accounted for circa 70% of total export sales and over a quarter of import spending in 2008. Trinidad & Tobago, along with Jamaica, Suriname and Guyana accounted for almost 90% of total merchandise exports in 2008. Similarly, these four member states accounted for almost 60% of total merchandise imports in 2008 (see figure 2).
www.crnm.org
This shows that CARICOM trade is concentrated in these territories with the smaller Organisation of Eastern Caribbean States (OECS) understandably playing a smaller role. However, it is interesting to note that the OECS territories play a more significant role in merchandise import spending than merchandise export earning, with smaller member states such as St. Lucia and Antigua and Barbuda jointly accounting for over 14% of import spending in 2008. This fact crudely indicates that there are opportunities for import displacement even in some of the smaller member states which are largely being exploited by import activity, and more interesting, mainly extra-regional imports.
Between 2004 and 2008, the most dynamic importing member states were St. Lucia (average import growth rate of 87% per annum); Antigua & Barbuda (36%); Suriname (22%); Guyana (21%) and Jamaica (20%). The most dynamic exporters between 2004 and 2008 were Trinidad & Tobago (28% growth per annum between 2004 and 2008); the Bahamas (22%); Barbados (17%) and Jamaica (16%).
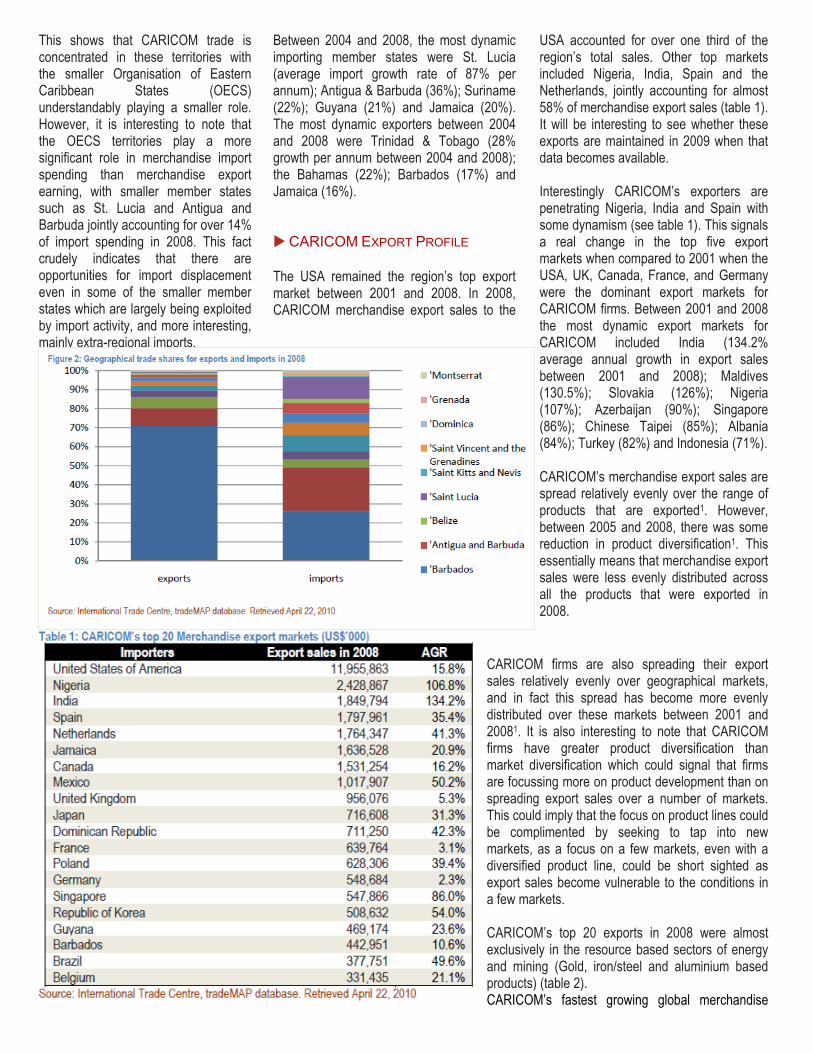
CARICOM EXPORT PROFILE The USA remained the region’s top export market between 2001 and 2008. In 2008, CARICOM merchandise export sales to the
USA accounted for over one third of the region’s total sales. Other top markets included Nigeria, India, Spain and the Netherlands, jointly accounting for almost 58% of merchandise export sales (table 1). It will be interesting to see whether these exports are maintained in 2009 when that data becomes available. Interestingly CARICOM’s exporters are penetrating Nigeria, India and Spain with some dynamism (see table 1). This signals a real change in the top five export markets when compared to 2001 when the USA, UK, Canada, France, and Germany were the dominant export markets for CARICOM firms. Between 2001 and 2008 the most dynamic export markets for CARICOM included India (134.2% average annual growth in export sales between 2001 and 2008); Maldives (130.5%); Slovakia (126%); Nigeria (107%); Azerbaijan (90%); Singapore (86%); Chinese Taipei (85%); Albania (84%); Turkey (82%) and Indonesia (71%). CARICOM’s merchandise export sales are spread relatively evenly over the range of products that are exported1. However, between 2005 and 2008, there was some reduction in product diversification1. This essentially means that merchandise export sales were less evenly distributed across all the products that were exported in 2008.
CARICOM firms are also spreading their export sales relatively evenly over geographical markets, and in fact this spread has become more evenly distributed over these markets between 2001 and 20081. It is also interesting to note that CARICOM firms have greater product diversification than market diversification which could signal that firms are focussing more on product development than on spreading export sales over a number of markets. This could imply that the focus on product lines could be complimented by seeking to tap into new markets, as a focus on a few markets, even with a diversified product line, could be short sighted as export sales become vulnerable to the conditions in a few markets. CARICOM’s top 20 exports in 2008 were almost exclusively in the resource based sectors of energy and mining (Gold, iron/steel and aluminium based products) (table 2). CARICOM’s fastest growing global merchandise

www.crnm.org
exports between 2005 and 2008 included frozen rock lobster (2,292% growth per annum); saturated acyclic monocarboxylic acids (1,849%); bars/rods of alloy steel (1,803%); womens/girls suits of cotton, not knitted (1,741%); paper, household/sanitary rolls of a width >36cm (1,741%); unwrought silver (1,309%); crude soya bean oil (849%); hulled, pearled, sliced or kibbled maize (783%); soya bean flour and meals (740%); hop extract (709%); hydraulic cements (630%) and cardamoms (619%). CARICOM firms are facing challenges in penetrating the intra-regional market capturing only 10% of total import spending in 2008 (table 3). Intra-regional merchandise exports are however dynamic, expanding by over 20% annually between 2005 and 2008.
Need More Information on Private Sector Trade? |www.crnm.org
RReeaaddeerrss aarree iinnvviitteedd ttoo ssuuggggeesstt ttooppiiccss ooff iinntteerreesstt ffoorr ffuuttuurree ttrraaddee
nnootteess..
CCAARRIICCOOMM’’ss ttoopp 2200 eexxppoorrttss iinn 22000088 wweerree aallmmoosstt eexxcclluussiivveellyy iinn tthhee rreessoouurrccee bbaasseedd sseeccttoorrss ooff eenneerrggyy aanndd mmiinniinngg ((GGoolldd,, iirroonn//sstteeeell aanndd
aalluummiinniiuumm bbaasseedd pprroodduuccttss))

www.crnm.org
_____________________ 1 As measured by the normalised Herfindahl‐H index. The H index measures the spread of the product groups and a H Index close to 0 implies that each product group contributes a statistically similar share of the total merchandise export sales (and vice versa). Only products with minimum total CARICOM merchandise export sales of US$100,000 were included in this analysis 1 As the H Index increased marginally from 0.078 to 0.09 1 In 2001, the H index for export markets was 0.21, and this declined to 0.14 in 2008 (see figure 3).
As was the case for global trade, energy products were the dominant export within CARICOM in 2008, and there is no evidence to project any change in this phenomenon as between 2005 and 2008 sales of light petroleum distillates, aviation spirits and liquefied butanes grew faster than the average growth rate for total intra-regional exports, which could indicate even greater intra-regional dominance of these products. Notwithstanding this dynamic, there were other products which exhibited intra-regional dynamism between 2005 and 2008. The most dynamic intra-regional exports included maize seed (1104% growth per annum); lubricating oil additives (1014%); electric conductors for a voltage > 1000 volts (253%); tin articles; cane molasses (71%); husked brown rice (37%); cigarettes containing tobacco (30%); fowls (gallus domesticus) cuts and offal, frozen (28%); mixtures of juices (49%); animal feed (28%); sweet biscuits (40%); hydraulic cement; gypsum anhydrite (92%); shelled cashew nuts (364%); aluminium sulphate (77%); waffles and wafers (50%) and cement clinkers (324%). Firms exporting these products may now need to examine extra-regional markets to compliment their intra-regional sales as the
PPrroodduucceedd bbyy tthhee OOTTNN IInnffoorrmmaattiioonn UUnniitt,, 22000099
DDIIRREECCTT AALLLL CCOOMMMMEENNTTSS OORR QQUUEERRIIEESS TTOO::
MMrr.. LLiinnccoollnn PPrriiccee
PPrriivvaattee SSeeccttoorr LLiiaaiissoonn lliinnccoollnn..pprriiccee@@ccrrnnmm..oorrgg
global economic crises seem to abate. At the other extreme, products “retreating” from intra-regional exports include refined petroleum oils (-33% growth per annum); refined soya bean oil (-12%); raw sugar cane (-36%); surface active preps for washing and cleaning (-29%); insecticides (48%); upholstered seats with wooden frames (-28%); and frozen fish fillets (-45%). Not all of these products may qualify for duty free treatment within CARICOM as duty relief depends on qualifying under the rules of origin. These products require some investigation as to the reasons for their market regression.
*********************
The CARICOM Standard


![CARICOM-Canada Trade Development Forum - Unlocking Business Potential between CARICOM and Canada [HC Buxo, High Commissioner of Trinidad & Tobago, Canada]](https://img.pdfslide.us/doc/110x75/5452e7ebaf7959ce428b4980/caricom-canada-trade-development-forum-unlocking-business-potential-between-caricom-and-canada-hc-buxo-high-commissioner-of-trinidad-tobago-canada.jpg)