Embed Size (px)
Citation preview

Policy Research Working Paper 5185
Private Education Provision and Public Finance
The Netherlands
Harry Anthony Patrinos
The World BankHuman Development NetworkEducation TeamJanuary 2010
WPS5185P
ublic
Dis
clos
ure
Aut
horiz
edP
ublic
Dis
clos
ure
Aut
horiz
edP
ublic
Dis
clos
ure
Aut
horiz
edP
ublic
Dis
clos
ure
Aut
horiz
edP
ublic
Dis
clos
ure
Aut
horiz
edP
ublic
Dis
clos
ure
Aut
horiz
edP
ublic
Dis
clos
ure
Aut
horiz
edP
ublic
Dis
clos
ure
Aut
horiz
ed

Produced by the Research Support Team
Abstract
The Policy Research Working Paper Series disseminates the findings of work in progress to encourage the exchange of ideas about development issues. An objective of the series is to get the findings out quickly, even if the presentations are less than fully polished. The papers carry the names of the authors and should be cited accordingly. The findings, interpretations, and conclusions expressed in this paper are entirely those of the authors. They do not necessarily represent the views of the International Bank for Reconstruction and Development/World Bank and its affiliated organizations, or those of the Executive Directors of the World Bank or the governments they represent.
Policy Research Working Paper 5185
One of the key features of the Dutch education system is freedom of education—freedom to establish schools and organize teaching. Almost 70 percent of schools in the Netherlands are administered by private school boards, and all schools are government funded equally. This allows school choice. Using an instrument to
This paper—a product of the Education Team, Human Development Network—is part of a larger effort in the department to study the impacts of public-private partnerships. Policy Research Working Papers are also posted on the Web at http://econ.worldbank.org. The author may be contacted at [email protected].
identify school choice, it is shown that the Dutch system promotes academic performance. The instrumental variables results show that private school attendance is associated with higher test scores. Private school size effects in math, reading, and science achievement are 0.17, 0.28, and 0.18.

PRIVATE EDUCATION PROVISION AND PUBLIC FINANCE:
THE NETHERLANDS
HARRY ANTHONY PATRINOS∗
WORLD BANK
JEL Classification Codes: I72, I22, L33 Keywords: School choice, vouchers, education, human capital
∗ I have benefited greatly from discussions with and comments from Husein Abdul-Hamid, Eric Bettinger, Wim Bos, Cypriaan Brom, Eamonn Butler, Erik Canton, A. Clement, H. Davids, Frans de Vijlder, AnneBert Dijkstra, Henri Geerling, Martyn Haeser, Sjoerd Karsten, Gwang-Jo Kim, Michael Latham, Henry Levin, Jesse Levin, Daniel Levy, Neil McIntosh, Hessel Oosterbeek, Tjeerd Plomp, George Psacharopoulos, Jo Ritzen, Ton Rolvink, R. Schouten, J.W. Schraven, Christine Teelken, Roelien Timmerman, R. van der Horst, J. van Dommelen, Nico van Zuylen, Ayesha Vawda, Richard Venniker, Adrie Visscher, Dinand Webbink, and participants at seminars at the American Economic Association, the World Bank, and the National Center on School Choice, Vanderbilt University. I thank Vicente Garcia-Moreno for able research assistance. Support from the World Bank’s Human Development Network Professional Development Grant is gratefully acknowledged. I thank the editors and anonymous referees for comments. The views expressed here are those of the author and should not be attributed to the World Bank Group. [email protected].

INTRODUCTION
One of the key features of the Dutch education system is freedom of education – freedom
to establish schools, determine the principles on which the school is based, and organize
classroom teaching. In fact, the Netherlands has one of the oldest national systems based on
school choice in the world. Although all schools in the Netherlands are government funded,
most are administered by private school boards. As a result, most children in the Netherlands
attend private schools, a trend that has been increasing over the past 150 years. Parents can
choose among several schools, and school choice is often promoted by the government as a way
to increase competition in the school system. Efficiency increases as public and private schools
try to improve their outcomes to develop a good reputation and thus attract more students.
School choice is often promoted as a means of increasing competition in the school
system (Friedman 1955). It is believed that competition will lead to efficiency gains as schools –
public and private – compete for students and try to improve quality while reducing expenses
(Hoxby 2003; Neal 2002). By encouraging more private schools, vouchers will allow school
managers to become innovative and thereby bring improvements to the learning process. Public
schools, in order to attract the resources that come with students, will need to improve. Thus,
school choice will lead to improved learning outcomes and increased efficiency. Opponents
claim that under a voucher system private providers will be unaccountable to tax payers and the
public. Claims of efficiency gains are also questioned. Further, opponents sometimes claim that
choice will lead to privatization, less public (government) control of education, and increased
segregation (Ladd 2002). The United States literature on school choice is extensive (see
Peterson 2009 for a recent review). The international literature is small, but growing (see
Barrera-Osorio and Patrinos 2009 for a recent review).

2
However, most of the literature has focused on small-scale choice systems (such as in a
number of cities in the United States). Denmark’s large and mature voucher system has been
researched. Andersen (2005), Andersen and Serritzlew (2006), Nannestad (2004) and Rangvid
(2008) reach the conclusion that, despite increments in competition, private schools do not
perform academically better than public ones. These analyses suffer from weak instruments and
non-robust methodologies. For the case of Sweden, Ahlin (2003) estimates the effect of a
general school choice reform on student performance. Using a rich set of individual level data,
increased school competition is shown to have statistically significant positive effects on student
performance in mathematics, but no significant effects in English and Swedish. Interacting
school competition with student characteristics, the results indicate that immigrant students and
those in need of special education tend to gain more from increased school competition than
others, while adverse effects on students from low education families are found in terms of
English and Swedish performance. Also for Sweden, Sandström and Bergström (2004) analyze
the effects of competition on public schools using data on 28,000 ninth graders. They account
for potential endogeneity of the share of students attending independent schools by using
instrumental variable estimation. Their findings support the hypothesis that school results in
public schools improve due to competition. Research on Chile’s universal school choice model
has been subject to a high level of scrutiny. The research is controversial, with several early
articles presenting data to show that subsidized, private schools obtain higher standardized test
scores than do public schools (Rodriguez 1988; Aedo and Larranaga 1994; Aedo 1997). A
second batch of studies uses individual level information with large samples (Bravo et al 1999;
Carnoy and McEwan 2000; Mizala and Romaguera 2000; Gallegos 2002; Vegas 2002). Several
studies advance the previous estimations, with strategies to overcome the problem of self-

3
selection. Sapelli and Vial (2002, 2004) have taken into account some of the deficiencies of
previous studies, especially in terms of lack of control for selection bias, homogenous treatment
effects, and assumptions of equal funding for voucher schools. These studies present small
average treatment effects but large treatment on the treated effects. They also reject the
hypothesis that peer effects explain the positive results. However, Hsieh and Urquiola (2006),
using several instruments and over-time data, find no evidence that choice improved average
educational outcomes as measured by test scores, repetition rates and years of schooling. They
find that the voucher program led to increased sorting, as the best public school students left for
the private sector. Gallegos (2006) explains that the differences in results can be attributed to
changes in the voucher and education systems in the mid-1990s. He uses information on the
number of Catholic priests in 1950 and the institution of the voucher system in 1981 as an
exogenous determinant of the supply of voucher schools and shows that vouchers increase tests
scores. For Colombia’s targeted secondary school voucher program, researchers take advantage
of a randomized design (Angrist et al 2002, 2006). The Colombian program found that voucher
beneficiaries had higher educational attainment: they were 10 percent more likely to finish the
8th grade three years after they won the vouchers, 5 to 6 percent less likely to repeat a grade,
they scored 0.2 standard deviations higher on achievement tests than non-voucher students, and
they were 20 percent more likely to take the college entrance exam than students who had not
won a voucher in the lottery.
The Netherlands provides an ideal situation to examine the effects of school choice in a
long-standing system. Interestingly, the issue of choice in the Netherlands has been under-
studied (but see Ritzen et al 1997; Himmler 2007). In the Dutch national school choice system,
policy is determined centrally but the administration and management of schools is decentralized

4
to the school level. The central government exercises ultimate control over both public and
private schools. Students from the Netherlands do exceptionally well on international academic
achievement tests such as TIMSS and PISA. The country achieves high scores even after
controlling for national income and expenditure per student. Thus, the system is not only
successful academically but is also cost effective, yielding good results at relatively low cost.
The substantial degree of competition in the system is one determinant of its high academic
achievement rates. Thus, a large school choice system can promote efficiency and equity
without necessarily leading to privatization or to reduced public scrutiny. All this lends credence
to the arguments of the proponents of school choice.
To what extent is student academic achievement in the Netherlands due to school choice?
If school choice leads to competition, this can manifest itself in, among other things, schools
becoming more effective in managing personnel, teaching students, promoting school efficiency,
managing budgets, and involving parents as appropriate. That is, attendance at a private school
can lead to superior performance. Given the predominance and growing significance of private
schools in the Netherlands, and the ease of entry of new providers, this might be a useful
measure of the effect of school choice on outcomes. In fact, Dutch private schools outperform
public schools despite 100 years of competition and equal funding to both sectors.
We show that a significant part of the high achievement of Dutch students in international
achievement tests is due to the institutional features associated with school choice. We address
the selection problem with information on the act of school choice in the Netherlands. We show
that when we instrument for school choice, then private school attendance is associated with
higher test scores. Private school size effects in math, reading and science are high and

5
significant, close to 0.2 of a standard deviation in math and science, and almost 0.3 of a standard
deviation in reading.
THE NETHERLANDS’ SCHOOL CHOICE SYSTEM: AN OVERVIEW
The current Dutch education system, established in 1917, provides an ideal environment
through which the impact of school choice can be examined. The “schools to the parents”
movement created a system unparalleled elsewhere in which parents have true freedom over
education in that they can choose whatever school they wish for their children while the state
pays most of the cost. Freedom of education is guaranteed under Article 23 of the Constitution,
which ended the state monopoly in education early on in the Netherlands. Along with school
choice, all parts of social life were segmented – often referred to as “pillarisation” (verzuiling), in
the literature – for a period as long as 1870 to 1960 as part of a political compromise (James
1984). Not only were schools organized along political and religious lines, but so too were other
aspects, such as political parties, trade unions, business associations, professional groups, sports
clubs, and so on, into different blocs based on religious and ideological basis (Roman Catholic,
Protestant, liberal and social-democratic). While the segmentation has ended, interestingly
enough, schools continue to be oriented in a particular way, despite the fact that Dutch society
has changed considerably. Nevertheless, freedom of education in the Netherlands was not
originally based so much on principals of equality and liberalism, but rather on freedom of
religion, in a more conservative perspective (Patrinos 2002).
Most schools are private, usually managed by a foundation or church. Municipal
authorities are the competent local authority for schools in the area. All schools are governed by
a legally recognized authority (school board). The school board is responsible for implementing

6
legislation and regulations in schools. There is, despite school choice and diversity of supply, no
significant elite school sector (Karsten et al 1995). It is required that primary and secondary
schools receiving public funds must be not-for-profit. Nevertheless, school boards are able to
retain surplus earnings. There are a few for-profit schools, representing less than 1 percent of
total enrollments (Hirsch 2002), but they are too small to receive government funds.
There is relative ease of entry of new providers. A small number of parents can and do
propose to start a school. Government is required to provide initial capital costs and ongoing
expenses, while the municipality provides buildings. A small fund for operating expenses that
the school may allocate at its discretion among activities such as maintenance, cleaning, heating,
libraries and teaching aids also exists. The sum is determined separately by each municipality,
which must then give all public and private schools the same per capita amount. The requisite
number of parents required to set up a school varies according to population density, from 200
for small municipalities to 337 for The Hague.
Each family is entitled to choose the school – public or private – they want and the state
pays. The main impediment to choice is distance, although parents are free to choose a school
anywhere in their city of residence or indeed anywhere in the country since there are no
catchment areas. Public schools must admit all pupils and most pursue non-restrictive
admissions policies. A school cannot refuse to admit a child if parents are unable or unwilling to
pay. Once it is certain that a child is to be admitted to the school, a written contract must be
drawn up between the school and the parents, stating what the parental contribution is to be used
for and what will happen if it is not paid in full.
Money follows students and each school receives for each student enrolled a sum
equivalent to the per capita cost of public schooling (Patrinos 2002). The school that receives
7
the funds is then entitled to funding that will cover specified amounts of teacher salaries and
other expenses. The number of teachers to which a school is entitled depends on its number of
students. Private schools can and do supplement this funding by charging ancillary fees;
however, this right is severely limited. There is no evidence of refusing at-risk students (Karsten
and Meijer 1999). Municipal schools charge small fees during the 12 year compulsory stage of
schooling. Schools are fully accountable towards the parents for the use of fees collected. Other
private contributions and sponsorship are allowed, but no advertising materials are permitted,
and schools may not become dependent on sponsors (Droog 2001; de Vijlder 2001). The central
government pays most of the running costs. Limited local government discretion is allowed.
Staff costs are funded according to the number of students enrolled, as well as running costs and
supplementary staffing. Municipalities organize and pay for minority language teaching.
Salaries are based on fixed scales that take into account education and experience. While the
freedom to organize teaching means that schools are free to determine how to teach, still the
Ministry of Education, Culture and Science does, however, impose a number of statutory
standards in relation to the quality of education. These prescribe the subjects to be studied, the
attainment targets and the content of national examinations. There are also rules about the
number of teaching periods per year, teacher training and teaching qualifications, the rights of
parents and pupils to have a say in school matters, and the planning and reporting obligations of
schools. As a rule, schools enjoy considerable freedom in the choice of textbooks and materials
and in the way they manage their affairs. The Education Inspectorate is charged by the Minister
of Education with supervising the manner in which schools fulfill their responsibilities. The
financing procedure is somewhat different at the secondary level. All teacher salaries and
building costs are covered directly by the municipality. In addition, municipal and private

8
secondary general schools that are included in the Minister of Education’s three-year plan get the
same discretionary fund per capita. Since 80-90 percent of all current school expenditures are
for teacher salaries, this immediately places the bulk of budgetary decisions in the hands of the
central government.
Central standards remain. School discretion is limited only by employment laws; teacher
qualifications, pay and conditions; and building standards. Funding mechanisms are designed to
control national expenditures. Poor schools try to cut costs by improving efficiency, such as
more extensive methods of teaching. The Dutch education system combines centralized
education policy with decentralized administration and management of schools. Central control
is exercised over both public and private schools. The system is characterized by a large central
staff; many school advisory services and coordination bodies; a strong Inspectorate; and stringent
regulations.
TRENDS AND EFFECTS OF SCHOOL CHOICE
Most children in the Netherlands attend private schools (Figures 1 and 2) and the trend
over the past 150 years is increasing. Most school boards are Catholic or Protestant, but there
are also Jewish, Islamic, Hindu and humanist schools in the Netherlands. While 35 percent are
public, 29 and 27 percent are Catholic and Protestant (Hupe and Meijs 2000). There are also
private non-denominational schools that are run by an association or foundation but are not based
on any specific religious or ideological beliefs. Like some public schools, many privately run
schools base their teaching on specific educational principles.
The Dutch system is relatively efficient. Education in the Netherlands is free for the
compulsory, first ten years of schooling. At all levels of education, the Dutch government

9
spends at the OECD average (OECD 2009). Education spending as a proportion of GDP is 4.8
percent. Thus, achievement levels are high, while relative costs are low. To deal with
disadvantage, a weighted funding formula is used. For every ethnic minority student, a school
receives 1.9 times the amount paid for other children. This is extra funding for personnel.
Native children from disadvantaged backgrounds receive 1.25 times the amount (Ritzen and
others 1997; see Leuven et al. 2007 for an evaluation).
In 1997, the daily newspaper Trouw (www.trouw.nl) went to court for the right to publish
education Inspectorate results. When Trouw published the results of all schools later that year,
the newspaper was sold out in a matter of hours. This demonstrates the significant demand for
information on school quality. From then on this newspaper published articles on the quality of
schools every year and it also opened a website so that citizens could view this information all
year round (http://www.trouw.nl). A survey in 1998 reported that 91 percent of respondents
believed that Inspectorate reports should be made public. The increased transparency led to
drastic changes in the Inspectorate service. The agency decided that it would also publish the
results of school inspections itself. The Inspectorate even redefined its task and stated that one
of its tasks was to provide citizens with independent and reliable information about the quality of
schools (Meijer 2007). The Inspectorate opened a website and first published quantitative
information concerning the quality of schools – the so-called Quality Cards – in 1998
(http://www.kwaliteitskaart.nl). Approximately 200 inspectors make more than 10,000 visits to
schools every year. While observing lessons, the inspectors also assess teaching methods. Every
year, the Inspectorate submits around 25 reports, including the annual Education Report, to the
Minister, the State Secretaries and the Parliament. The results of the Inspectorate reports can be
used to put schools on notice if quality is poor, and action is taken by the Ministry of Education

10
if schools do not improve. Curiously, it was once believed that parents did not want test data
published (Louis and van Velzen 1991).
The Netherlands scores high in international academic achievement tests. For example,
in Trends in International Mathematics and Science Study (TIMSS), Netherlands scored near the
top in both subjects in 2007, repeating its performance in earlier years, such as 2003, 1999 and
1995. The Netherlands consistently scores in the top ten in math and science. Also, in
mathematics and science achievement in the final years of secondary school, carried out by
TIMSS in 1995 in 21 countries, the Netherlands was the top performing country. The
Netherlands achieves high scores in TIMSS, in comparison to other countries, even when
controlling for level of national income (as well as expenditure per student).
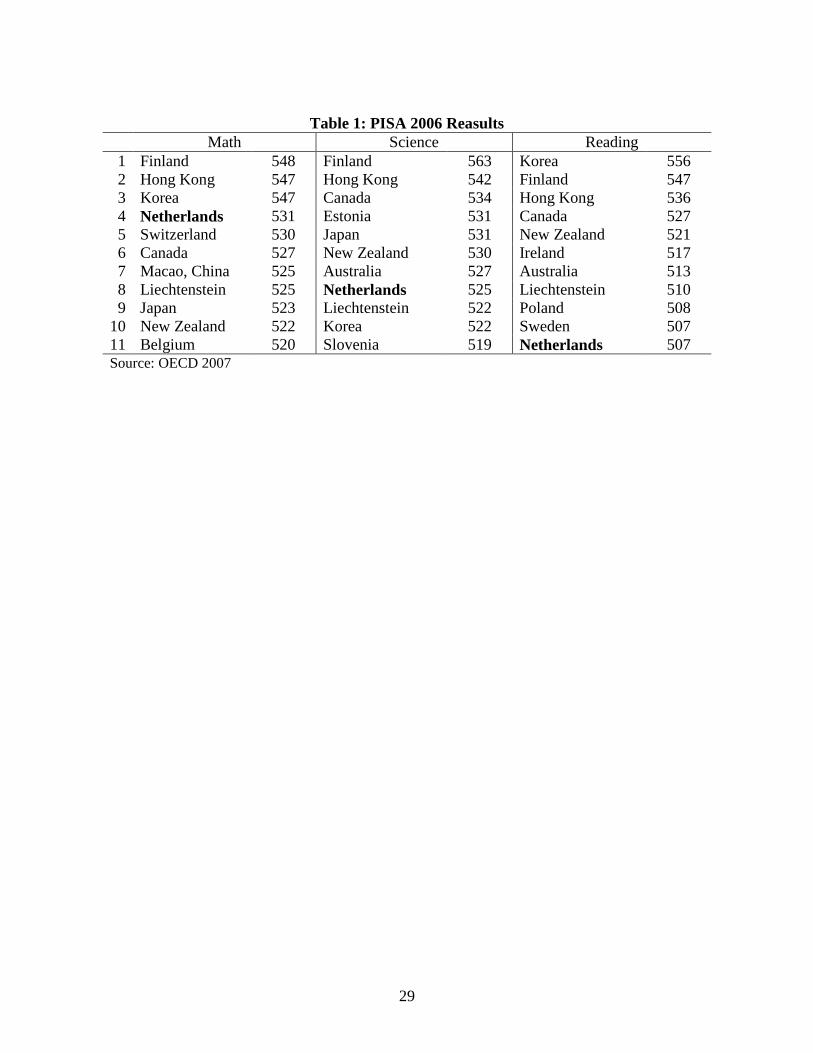
In the OECD’s Programme for International Student Assessment (PISA), the Netherlands
does very well. In all three subjects, math, science and reading, the Netherlands consistently
scores above the OECD average. In math, the Netherlands ranks fourth of all participating
countries, scoring 0.3 of a standard deviation above the OECD average. In science, the
Netherlands ranks 8th and in reading 11th (see Table 1).
ASSESSING THE IMPACT OF SCHOOL CHOICE IN THE NETHERLANDS
Previous research has found that confessional schools perform better than public schools
(see, for example, Dijkstra et al 2001). Despite the fact that there is no elite school sector, there
is some evidence of higher quality in private schools, especially Catholic and Protestant
secondary schools (Dronkers 1995). A careful analysis of school performance in the Netherlands
shows that Catholic schools do out-perform other schools, especially public schools (Levin
2002). The superior performance holds even after controlling for educational practices and

11
selection. The results show that Catholic schools do perform better, while schooling choice is
available and affordable for the majority of families.
To what extent is this high achievement due to the institutional features associated with
school choice? School choice leads to competition which can manifest itself in schools firing
ineffective teachers for instance; or through schools using achievement data to evaluate teachers.
School autonomy can also lead to schools taking a more direct role in establishing teachers’
salary increases among other school functions. In addition, parents may be more involved in
discussions on budget formulation at the school level. Another variable that might help explain
superior performance is attendance at a private school. Given the predominance and growing
significance of private schools in the Netherlands, and the ease of entry of new providers, this
might be a useful measure of the effect of school choice on outcomes. In the Netherlands, on
average, private schools perform slightly better than public schools – despite 100 years of
competition and equal funding to both sectors – and all perform significantly above the OECD
mean. Figure 3 shows the slight advantage of private schools in PISA 2006.
Data and Coverage
In the analysis that follows, we use data from the OECD’s Program for International
Student Assessment (PISA), a student assessment jointly developed by participating countries to
assess and compare student achievement based on a standardized and highly reliable framework.
The detailed description of assessment framework, cautious procedures of translation and
supervision of country specific implementations, and finally careful calibration of student scores
based on response items and collected background variables, supports the view that PISA is a
valid framework for assessing student achievement. The survey is realized as representative to

12
the population of interest in a two-stage stratified sample with random sampling of schools and
within each school. Survey weights reflect the different probabilities of schools and students to
be sampled. The domains of reading, mathematical and scientific literacy are covered not merely
in terms of mastery of the school curriculum, but in terms of important knowledge and skills
needed in adult life, particularly in the labor market (OECD 2007).
Table 2 presents descriptive statistics. Most schools in the Netherlands PISA 2006
sample are private. Most schools can fire a teacher, which is not unexpected since most schools
are private, but in the Netherlands almost all schools can fire teachers. Achievement data is used
to evaluate teachers in most schools, with almost three-quarters saying that it is so. Also evident
is the high degree of school-based management in the Netherlands, as more than 80 percent of
schools report that they can set teacher salary increases. Few schools directly involve parents in
school budget decisions, at only 9 percent overall. Teachers in the Netherlands are certified, and
few schools are located in rural areas. In terms of differences between public and private
schools, there is a slightly higher probability that public schools can fire teachers in the
Netherlands, and parental involvement in school budget decisions is higher in public schools.
Religion is more important for choosing private schools. The student-teacher ratio is slightly
lower in private schools. Private school students have mothers who are relatively less educated.
Only 26 percent of the mothers of private school students have a university education, while
more than 33 percent of the mothers of public school students have a university education
mother.

13
Measuring the Effects of Choice on Achievement
Controlling for a series of institutional, school, student and family characteristics, and
running a series of OLS regressions, it turns out that private school attendance is a positive and
significant explanatory variable, though the effect is very small, except in the case of science,
where it has no effect (Table 3). Private school attendance increases test scores in math by no
more than 5 points and 4 points in reading. Given the PISA scale – mean OECD score of 500
and standard deviation of 100 points – these are very small size effects. In the case of science,
the effect is not significant.
However, other institutional variables have a strong effect, such as firing teachers,
especially in science. The effect varies from 20 points in reading, or 0.20 of a standard
deviation, to 43 in math and 73 in science. However, most schools report that they can fire
teachers in the Netherlands. Assessment is important in the Netherlands and many schools use
achievement information to assess progress. This has a small but positive and significant effect
on outcomes, about twice the size effect of private school attendance. The same goes for schools
setting teacher salary increases. Overall, 8 to 10 points increase is associated with schools
setting teacher increases. Parental involvement in school budget decisions is associated with
higher scores, raising achievement by 11 points in math, to 14 points in science, and by 16 points
in reading. Therefore, the OLS analysis suggests that institutional factors are more important
than private school attendance in determining achievement in the Netherlands. It is important to
bear in mind however that the OLS results are correlations, and not causal relationships. We turn
now to the identification problem.

14
Identification
Private school attendance is associated with self-selection in the Netherlands given
universal school choice, so one cannot attribute from the regression results that private schools
contribute to the increase in test scores. There are two main channels through which a school
choice program can increase learning outcomes: the mechanism it uses to sort students and the
across-school competition it creates. For the first channel, choice programs may allow a better
fit between parental preferences and schools. Presumably, families will enroll their children in
high-performing schools, either leaving or not applying to low-performing schools. This
allocation mechanism will induce students to improve educational outcomes because they will be
in better schools. For the second channel, choice may induce competition for students across
schools. Low-performing schools will be forced to increase their quality in order to retain and
attract students who will otherwise enroll in better schools (Hoxby 2003; Neal 2002).
The average learning outcome then will depend on the average outcomes of students who
stay in the low-performing schools (expellers) and those who move to the high-performing
schools (receivers) (Nechyba 1999, 2000; Epple and Romano 1998). On top of this sorting
mechanism of students, competition across schools will tend to increase the quality of education.
Again, schools will compete for students which may lead to improved learning outcomes. Final
outcomes will depend on the net effect of these margins.
The typical estimation of the effect of a choice program on learning outcomes will have
the form:
tjitjitjtitji DZXY ,,,,3,2,10,, *** εββββ ++++= (1) where tiY , is any variable capturing learning outcomes such as standardized test score for
individual i in school j at time t; tiX , are a set of socioeconomic characteristics of the individual;

15
tjZ , are characteristics of the school such as teachers; tjiD ,, is a dummy variable indicating
whether the individual is a beneficiary of choice or not; tji ,,ε comprises all unobservable
characteristics of the school and individual that can affect learning outcomes.
The fundamental problem in estimating the impact of choice programs with equation (1)
is selection bias—students and schools self-select into the program. Under these conditions, a
comparison between students who participate and those who do not confounds the effects of the
program, with the initial differences in characteristics between participants and non-participants.
For example, it is possible to expect that better informed households are more likely to actively
choose schools. Students from these households may perform differently than less active
choosers. Therefore, any observed final educational outcomes not only comprise the results
from the choice program but also the inherent differences in characteristics of the families or
students. Besides students self-selecting into the program, schools may also self-select into the
program or select students, reinforcing the problem of identifying impacts. An evaluation of the
choice program with this behavior may thus confound the impact of the program with the
differences in the characteristics of the schools. Therefore, a simple comparison between
students in schools with the program and without the program may pick up not only the
differences in the educational outcomes due to the voucher program, but also the differences in
the characteristics of the two groups of schools. In the Netherlands, fortunately for the purposes
of evaluation, schools do not select nor reject students and all schools are part of the choice
program, so we do not have this sort of problem in the Netherlands.
In short, the main objective of this type of estimation is to identify 3β . If the program
does not assign the students randomly, then it is very likely that the unobservable characteristics
are correlated with the dummy that indicates whether or not the individual receives the program.

16
In this case, 0)/( ,,,, ≠tjitji DE ε , and ordinary least squares (OLS) estimators are biased. This
can be described as a problem of causality. If D is determined with self-selected individuals, and
the most able ones are participating in the program, then D can be causing Y. On the other hand,
Y as indicative of ability can be causing D, in the sense that more able individuals are choosing
to be in the program. Therefore, the causality direction is unclear. Another perspective of the
problem is to see bias as the consequence of omitted variables. In this case tji ,,ε captures all the
unobservable variables at the school and individual level that affect Y. If it were possible to
control for all the variables such as 0)/( ,,,, =tjitji DE ε , then OLS would be unbiased. In other
words, if we can control for all the key variables that determine participation in the program,
estimates by OLS will be unbiased. The direction of the bias in simple comparisons between
students with vouchers and other students is not clear.
The problem of bias in the estimation of equation (1) has multiple solutions. If
randomization and regression discontinuity techniques are not an option, then one must opt for
other methods, such as instrumental variables, Heckman correction models, difference-in-
difference estimators and matching estimators. However, they are all based on strong
assumptions (Angrist and Imbens 1995; Athey and Imbens 2006; Heckman 1976; Heckman,
Ichimura and Todd 1998; Rosenbaum and Rubin 1983). In the Netherlands, there is no pre-
program data, given the long standing nature of the program. There are also no exclusion
criteria, since all families and students have access to all schools, schools do not reject
applicants, and there are no top up fees.
Our empirical strategy is to locate a variable that matters for the treatment status or more
generally for participation – relevance of the instrument – but that is not correlated with the
outcomes of interest given treatment – exclusion restriction. The instrument will control for the

17
endogeneity in the choice variable (enter a private school) that arises from selection on
unobservables. In student achievement regressions, school choice is usually instrumented with
variables related to the cost of schooling: price of schooling and distance to the school.
However, these variables might violate the exclusion restriction if distance is correlated with
absences or tardiness – likely to affect learning – or if the price of schooling also depends on the
demand for schooling. Another possibility when past (pre-program) data are available is to use
lagged (pre-program) values of participation determinants as instruments. However, because
past determinants are strongly correlated with current determinants, they are arguably weak
instruments (Blundell and Costa Dias 2000; Davidson and MacKinnon 2003). Researchers
investigating universal choice programs have used various techniques to create treatment groups.
Instrumental variables have been used in the cases of Denmark and Sweden, such as the degree
of competition. Others have used school location and find mixed effects across country
(Vandenberghe and Robin 2004). Religion has also been used as an instrument. In Chile,
Gallegos (2006) used religion and showed that an increase of one in the ratio of voucher-to-
public schools increases tests scores by about 0.14 standard deviations. West and Woessmann
(2008) argue that nineteenth-century Catholic doctrine strongly opposed state schooling and
show that countries with larger shares of Catholics in 1900 (but without a Catholic state religion)
tend to have larger shares of privately operated schools today. They show that larger shares of
privately operated schools lead to better student achievement in mathematics, science and
reading, and to lower total education spending, even after controlling for current Catholic shares
(West and Woessmann 2008; see also Card, Dooley and Payne 2007; Evans and Schwab 1995;
Neal 1997; Jepsen 2003; Sander 1996 on the use of Catholic shares as instruments; and see
Cohen-Zada 2009 for an alternative instrument that uses historical Catholic share of population

18
as an instrument; but see Altonji, Elder, and Taber (2005) on cautions about using such
instruments. Thus, an instrumental variables approach is undertaken to address the causality
issue. However a good instrument should be good at predicting choice, but not achievement.
Here we exploit information on the act of school choice in the Netherlands. There is a
diversity of providers in the Dutch market. In addition to public schools, managed at the
municipal level, the private school sector is composed of religious and secular schools. The
religious school sector is dominated by Catholic and Protestant managed schools, but includes
other providers as well. In fact, two-thirds of all schools in the Netherlands are private.
Moreover, most private schools are religious in nature, at 91 percent; and religious schools make
up 59 percent of all schools in the Netherlands. There is evidence that parents are active
choosers, basing their decision at times on religion. According to research, more than 50 percent
of parents choose schools based on religion (Teelken 1998). This suggests that religion would be
a good instrument for private school choice. In the Netherlands, we know that religion is
important in the selection of schools. Himmler (2007) used an Instrumental Variables approach
for analyzing school achievement in the Netherlands. He controlled for the possible endogeneity
of Catholic school competition to public school quality. He found a positive link between
competition intensity and academic achievement in secondary school.
Fortunately, PISA 2006 asks the school principal if parents’ endorsement of the
instructional or religious philosophy of the school is taken into consideration at the time of
admission, meaning that parents express an interest in the religious orientation of the school (see
PISA School questionnaire). We shall use this as an instrument for parental preference or choice
based on religion. In the Netherlands, according to PISA 2006, 38 percent of parents choose
19
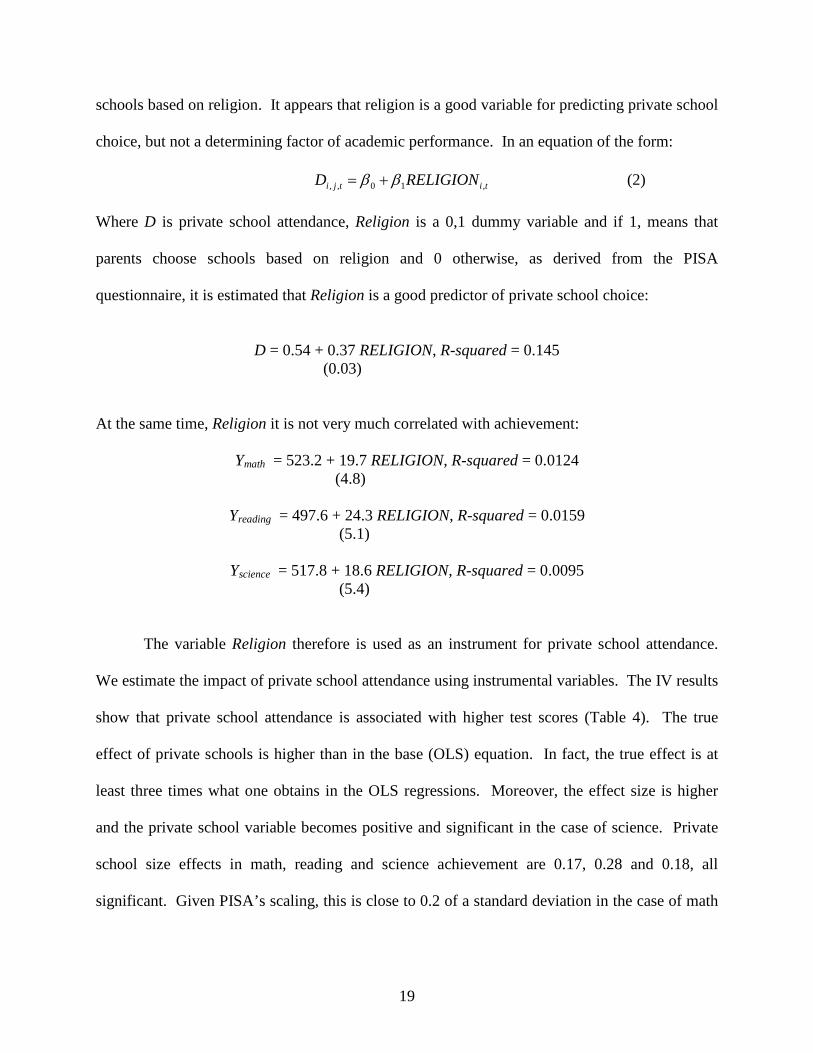
schools based on religion. It appears that religion is a good variable for predicting private school
choice, but not a determining factor of academic performance. In an equation of the form:
titji RELIGIOND ,10,, ββ += (2)
Where D is private school attendance, Religion is a 0,1 dummy variable and if 1, means that
parents choose schools based on religion and 0 otherwise, as derived from the PISA
questionnaire, it is estimated that Religion is a good predictor of private school choice:
D = 0.54 + 0.37 RELIGION, R-squared = 0.145
(0.03)
At the same time, Religion it is not very much correlated with achievement:
Ymath = 523.2 + 19.7 RELIGION, R-squared = 0.0124 (4.8)
Yreading = 497.6 + 24.3 RELIGION, R-squared = 0.0159
(5.1)
Yscience = 517.8 + 18.6 RELIGION, R-squared = 0.0095 (5.4)
The variable Religion therefore is used as an instrument for private school attendance.
We estimate the impact of private school attendance using instrumental variables. The IV results
show that private school attendance is associated with higher test scores (Table 4). The true
effect of private schools is higher than in the base (OLS) equation. In fact, the true effect is at
least three times what one obtains in the OLS regressions. Moreover, the effect size is higher
and the private school variable becomes positive and significant in the case of science. Private
school size effects in math, reading and science achievement are 0.17, 0.28 and 0.18, all
significant. Given PISA’s scaling, this is close to 0.2 of a standard deviation in the case of math

20
and science, and almost 0.3 of a standard deviation in reading. In other words, these are large
effect size effects, indicating that school choice contributes to achievement in Netherlands.
In the case of math outcomes, the private school attendance is associated with a
significant effect size of 0.17 of a standard deviation. This is much higher than what one obtains
with OLS. It is also interesting that there is a substantial change in at least one of the
institutional variables. That is, the coefficient on firing teachers is reduced by 20 percent, or 9
points, while at the same time private schooling increases three-fold, by 12 points. In reading,
the impact of private schooling is much higher in the IV results. In fact, when instrumented
private school attendance has a six times higher effect size than in OLS. Also, for reading, the
impact of firing teachers is substantially reduced in the IV results, by more than 87 percent or
points; at the same time, the impact of private schooling increased by 24 points. In science,
when estimated using OLS, private schooling had no effect, and the coefficient was insignificant.
Moreover, the impact of firing teachers was huge, at over 70 points. However, in the IV results,
the firing teachers variable is substantially reduced, falling by more than 24 points. At the same
time, private schooling increases from a small, even negative, but insignificant effect in OLS, to
a large, positive and significant effect in the IV results. The private school effects are large and
significant, suggesting that private schools have a positive effect on learning outcomes, even
controlling for institutional factors and a host of other controls.
Therefore, one may reject the null hypothesis that private schools have no impact on
cognitive ability. The private school effect implies that school choice is beneficial for improving
cognitive ability. The difference between the OLS and IV results further suggests that private
schooling’s true impact works through the competition that the Dutch system promotes. Parents
are able to choose among a variety of providers, thus ensuring that tastes and preferences are

21
catered to. The competitive funding system promotes innovation, efficiency and excellence.
The competition that is created in the Dutch market leads to efficiency gains as schools are able
to cater to different markets and parents exercise their choice to find the provider for their
children that best fits their needs. The system is also highly equitable. Although there are
competition effects whereby private school students achieve slightly higher than public school
students, nevertheless the system overall boasts high average attainment levels. That is,
achievement is high for all groups, with the average score of Dutch students significantly above
the OECD average in all three subjects.
The question that remains is why we obtain such a large impact of private schools when
the raw differential is so small? In other words, the test score outcomes of public and private
schools are almost equal. Moreover, choice and competition has existed for almost 100 years.
Yet when we control for selection we obtain a positive impact of attending private schools. The
answer may lie in the fact that the competition that is created in the market leads to efficiency
gains as schools are able to cater to different markets and parents exercise their choice to find the
provider for their children that best fits their needs. In fact, the students of private schools come
from slightly less well-off families. This is evident in Table 2 which shows that the mothers of
private school students are slightly less well educated than the mothers of students in public
schools (see also Figure 4). Therefore, one possibility is that the true private school effect
operates via the value it adds for students from relatively less well-off backgrounds.
The institutional features associated with school choice are important as well. School
choice leads to competition which can manifest itself in schools firing ineffective teachers for
instance; or through schools using achievement data to evaluate teachers. School autonomy can
also lead to schools taking a more direct role in establishing teachers’ salary increases among

22
other school functions. In addition, parents may be more involved in discussions on budget
formulation at the school level. We are able to show that attendance at a private school has a
positive and significant effect on cognitive ability, controlling for these factors and even after
controlling for selection. In other words, the private school advantage is causal. One reason for
the positive effect of private schools in the Netherlands may be due to the value-added to
students from less well-off families.
CONCLUSIONS
School choice is often promoted as a means of increasing competition in the school
system. It is believed that competition will lead to efficiency gains as schools – public and
private – compete for students and try to improve quality while reducing expenses. By
encouraging more private schools, vouchers will allow school managers to become innovative
and thereby bring improvements to the learning process. Public schools, in order to attract the
resources that come with students, will need to improve. Thus, school choice will lead to
improved learning outcomes and increased efficiency. Opponents claim that under a voucher
system private providers will be unaccountable to tax payers and the public. Claims of
efficiency gains are also questioned. Further, opponents sometimes claim that choice will lead to
privatization, less public (government) control of education, and increased segregation.
One of the key features of the Dutch education system is freedom of education – freedom
to establish schools, determine the principles on which the school is based, and organize
classroom teaching. School choice is made possible through public finance, making it the oldest
publicly financed school choice system in the world. The Dutch version of freedom of education
allows parents the opportunity to choose schools, to establish schools, and to organize teaching

23
and to determine the principles of the school. This has resulted in a large number of non-public
schools financed by the state. Moreover, parents can typically choose among several schools.
Parents have access to a variety of schools, access is not selective, all schools are equally
publicly financed, there is ease of entry of providers into the market, and information flows.
Most children in the Netherlands attend privately-managed schools and the. Private schools are
not for profit and usually managed by a foundation or church.
Studies of the effectiveness of school choice programs suffer from an inability to control
for selection and are usually not able to attribute outcomes to the type of school attended. Since
most schools in the Netherlands are private and we know that religion is a key factor associated
with parental choice of school, we use this fact to create an instrument by which to measure the
effectiveness of private schools in the Netherlands.
We are able to show that private schools have a positive and significant impact on school
outcomes using the OECD’s Program for International Student Assessment (PISA) 2006 data for
the Netherlands. Only when we property account for selection do we show a positive and
significant impact. In fact, OLS estimates show a negligible or insignificant effect of private
schools. The IV results show that private school attendance is associated with higher test scores.
The true effect of private schools is higher than in the base (OLS) equation. The effect size is
higher and the private school variable becomes positive and significant in the case of science as
well. Private school size effects in math, reading and science achievement are 0.17, 0.28 and
0.18, all significant. Given PISA’s scaling, this is close to 0.2 of a standard deviation in the case
of math and science, and almost 0.3 of a standard deviation in reading. In other words, these are
large effect size effects, indicating that school choice contributes to achievement in Netherlands.
The reasons for an impact, despite the almost equal raw scores in achievement between public

24
and private schools and almost 100 years existence of a system of public finance of private
school choice, might have to do with the fact that it is the relatively less well-off that attend
private schools in the Netherlands. That is, the mothers of private school students are slightly
less well educated than the mothers of students in public schools. Therefore, one possibility is
that the true private school effect operates via the value it adds for students from relatively less
well-off backgrounds.
This study has contributed to the small but growing international literature on the
effectiveness of school choice. It was shown that private school choice can have an impact,
while at the same time contributing to overall high levels of achievement and equity. Also, the
Dutch education system exhibits a strong central education policy role but decentralized school
management. While private schools have a positive impact, public schools also perform very
well and all schools are associated with high levels of autonomy – for example, ability to fire
teachers, setting of teacher salary increases, using achievement data, allowing parental
participation – at the school level. Thus, central government control and school choice in a
predominantly private schooling environment is possible, and evidently beneficial in terms of
academic achievement. Dutch students perform exceptionally well on international academic
achievement tests, whether they are enrolled in public or private schools. Thus, a large school
choice system can promote efficiency and equity without necessarily leading to privatization or
to reduced public scrutiny – school choice led to heightened demands for information, prompting
the education Inspectorate to promote the use of school report cards and wide dissemination of
school results.
The Netherlands shows that a large private sector with equal public funding does not
necessarily mean decentralization and a weak central role. Choice can coexist with a strong

25
center. Interestingly, as the center has moved away from any direct provision of education
services its role in policy making, evaluation, and information dissemination increased.
Therefore, the fear of the retreat of the state from matters of importance in education policy with
the introduction of market forces is not founded.

26
REFERENCES Aedo, C. 1997. “Organización Industrial de la Prestación de Servicios Sociales” Working Paper
Series R-302. Inter-American Development Bank, Washington, DC. Aedo, C. and O. Larrañaga. 1994. “Educación Privada vs. Pública en Chile: Calidad y Sesgo de
Selección.” Graduate Economics Program, Santiago ILADES, Santiago, Chile, and Georgetown University, Washington, DC. Processed.
Ahlin, A. 2003. “Does School Competition Matter? Effects of a Large-scale School Choice Reform on Student Performance.” Uppsala University Working Paper Series 2.
Altonji, J.G., T.E. Elder and C.R. Taber. 2005. “An Evaluation of Instrumental Variable Strategies for Estimating the Effects of Catholic Schooling. Journal of Human Resources 40(4): 791-821.
Andersen, S.C. 2005. Selection and competition effects in a large-scale school voucher system. For presentation at the conference EPCS 1005, 31 March to 3 April at University of Durham, Durham, England.
Andersen, S.C. and S. Serritzlew. 2006. “The Unintended Effects of Private School Competition.” Journal of Public Administration Research and Theory 17: 335-356.
Barrera-Osorio, F. and H.A. Patrinos. 2009. “An International Perspective on School Vouchers.” In M. Berends, M.G. Springer, D. Ballou and H.J. Walberg, eds., Handbook of Research on School Choice. New York: Routledge, pp. 339-358.
Blundell, R. and M. Costa Dias. 2000. “Evaluation Methods for Non-Experimental Data.” Fiscal Studies 21(4): 427-468.
Bravo, D., D. Contreras, and C. Sanhueza. 1999. “Rendimiento Educacional, Desigualdad, y Brecha de Desempeño Privado Público: Chile 1982-1997.” Department of Economy, University of Chile. Processed.
Card, D., M. Dooley and A.A. Payne. 2007. “School Competition and Efficiency with Publicly Funded Catholic Schools.” Manuscript.
Carnoy, M. and P. McEwan. 2000. “The Effectiveness and Efficiency of Private Schools in Chile’s Voucher System.” Educational Evaluation and Policy Analysis 22(3): 213-239.
Cohen-Zada, D. 2009. “An Alternative Instrument for Private School Competition. Economics of Education Review 28(1): 29-37.
Davidson R. and J. MacKinnon. 2003. Econometric Theory and Methods. Oxford: Oxford University Press.
de Vijlder, F.J. 2001. “Choice and Financing of Schools in the Netherlands: The Art of Maintaining an Open System Responsive to Its Changing Environment.” Max Groote Expert Center, University of Amsterdam (mimeo).
Dijkstra, A., J. Dronkers and S. Karsten. 2001. “Private Schools as Public Provision for Education School Choice and Marketization in the Netherlands and Elsewhere in Europe.” Columbia University, Teachers College, National Center for the Study of Privatization in Education Occasional Paper No. 20.
Dronkers, J. 1995. “The Existence of Parental Choice in the Netherlands.” Educational Policy 9(3): 227-243.
Droog, M.G.A. 2001. Information Dossier on the Structure of the Education System in the Netherlands 2000. Netherlands Ministry of Education, Science and Culture, EURYDICE Unit.

27
Epple, D. and R.E. Romano. 1998 “Competition between Private and Public Schools, Vouchers, and Peer-Group Effects.” American Economic Review 88(1): 33-62.
Evans, W.N. and R.M. Schwab. 1995. “Finishing High School and Starting College: Do Catholic Schools Make a Difference?” Quarterly Journal of Economics 110(4): 941-974.
Friedman, M. 1955. “Role of Government in Education,” in Economics and the Public Interest ed., Robert Solo. New Brunswick, NJ: Rutgers University Press.
Gallegos, F. 2006. “Voucher-School Competition, Incentives and Outcomes: Evidence from Chile.” Massachusetts Institute of Technology, Department of Economics, Cambridge, MA. Processed.
Gallegos, F. 2002. “Competencia y Resultados Educativos: Teoría y Evidencia para Chile.” Cuadernos de Economía 39(118): 309-352.
Himmler, O. 2007. The Effects of School Choice on Academic Achievement in the Netherlands. Georg-August-Universität Göttingen, March
Hirsch, D. 2002. “School: A Choice of Directions.” OECD CERI Working Paper: What Works in Innovation in Education.
Hoxby, C.M. (ed). 2003. The Economics of School Choice. Chicago: University of Chicago Press.
Hsieh, C.-T. and M. Urquiola. 2006. “The effects of generalized school choice on achievement and stratification: Evidence from Chile's voucher program.” Journal of Public Economics 90 (8-9): 1477-1503.
Hupe P.L. and L.C.P.M. Meijs. 2000. Hybrid Governance: The impact of the nonprofit sector in the Netherlands. The Hague: Social and Cultural Planning Office.
James, E. 1984. “Benefits and Costs of Privatized Public Services: Lessons from the Dutch Educational System.” Comparative Education Review 28(4):605-64.
Jepsen, C. 2003. “The Effectiveness of Catholic Primary Schooling.” Journal of Human Resources 38(4): 928-941.
Karsten, S., I. Groot and M.A. Ruiz. 1995. “Value Orientations of the Dutch Educational Elite.” Comparative Education Review 39(4): 508-521.
Karsten, S. and J. Meijer. 1999. “School-Based Management in the Netherlands: The Education Consequences of Lump-Sum Funding.” Educational Policy 13(3): 421-439.
Ladd, H.F. 2002. “School Vouchers: A Critical View.” Journal of Economic Perspectives 16(4): 3-24.
Leuven, E., M. Lindahl, H. Oosterbeek and D. Webbink, 2007. “The Effect of Extra Funding for Disadvantaged Pupils on Achievement.” Review of Economics and Statistics 89(4): 721-736.
Levin, J.D. 2002. Essays in the Economics of Education. PhD Dissertation, University of Amsterdam.
Louis, K.S. and B.A.M. van Velzen. 1990/1991. “A Look at Choice in the Netherlands.” Education Leadership (December/January): 66-72.
Meijer, A.J. 2007. “Publishing public performance results on the Internet: Do stakeholders use the Internet to hold Dutch public service organizations to account?” Government Information Quarterly 24(1): 165-185.
Mizala, A. and P. Romaguera. 2000. “School Performance and Choice: The Chilean Experience.” Journal of Human Resources 35(2): 392-417.
Nannestad, P. 2004. Do private schools improve the Quality of Municipal Schooling? The case of Denmark. For presentation at the EPCS Annual Meeting, Berlin, April 15-18, 2004.

28
Neal, D. 2002. “How Vouchers Could Change the Market for Education.” Journal of Economic Perspectives 16(4): 25-44.
Neal, D. 1997. “The Effects of Catholic Secondary Schooling on Secondary Achievement.” Journal of Labor Economics 15(1): 98-123.
Nechyba, T.J. 1999. "School Finance Induced Migration and Stratification Patterns: The Impact of Private School Vouchers." Journal of Public Economic Theory 1(1): 5-50.
Nechyba, T.J. 2000. "Mobility, Targeting, and Private-School Vouchers." American Economic Review 90(1): 130-146.
OECD. 2009. Education at a Glance. Paris. OECD. 2007. PISA 2006: Science Competencies for Tomorrow’s World. Paris: OECD. Patrinos, H.A. 2002. “Private Education Provision and Public Finance: The Netherlands as a
Possible Model,” Occasional Paper No. 59, National Center for the Study of Privatization in Education, Teachers College, Columbia University.
Peterson, P.E. 2009. “Voucher Impacts: Differences between Public and Private Schools.” In M. Berends, M.G. Springer, D. Ballou and H.J. Walberg, eds., Handbook of Research on School Choice. New York: Routledge, pp. 249-266.
Rangvid, B.S. 2008. “Private School Diversity in Denmark’s National Voucher System.”
Scandinavian Journal of Educational Research 52(4): 331-354. Ritzen, J.M.M., J. Van Dommelen and F.J. De Vijlder. 1997. “School Finance and School
Choice in the Netherlands.” Economics of Education Review 16(3):329-335. Rodriguez, J. 1988. “School Achievement and Decentralization Policy: The Chilean Case.”
Revista de Análisis Económico 3(1): 75–88. Sander, W. 1996. “Catholic Grade Schools and Academic Achievement. Journal of Human
Resources 31(3): 540-548. Sapelli, C. and B. Vial. 2004. “Peer Effects and Relative Performance of Voucher Schools in
Chile.” Paper presented at the American Economic Association meetings, 3 January 2004, San Diego, CA.
Sapelli, C. and B. Vial. 2002. “The Performance of Private and Public Schools in the Chilean Voucher System.” Cuadernos de Economía 39(118): 423-454.
Teelken, C. 1998. “Market Mechanisms in Education: A Comparative Study of School Choice in the Netherlands, England and Scotland.” PhD Dissertation, University of Amsterdam.
Vandenberghe, V. and S. Robin. 2004. “Evaluating the Effectiveness of Private Education across Countries: A Comparison of Methods. Labour Economics 11(4): 487-506.
Vegas, E. 2002. “School Choice, Student Performance, and Teacher and Student Characteristics: The Chilean Case.” Policy Research Working Paper 2833, Washington, DC: The World Bank.
West, M.R. and L. Woessmann. 2008. “‘Every Catholic Child in a Catholic School:’ Historical Resistance to State Schooling, Contemporary Private Competition, and Student Achievement across Countries.” IZA Discussion Papers 3818, Institute for the Study of Labor (IZA), Bonn, Germany.
29
Table 1: PISA 2006 Reasults
Math Science Reading 1 Finland 548 Finland 563 Korea 556 2 Hong Kong 547 Hong Kong 542 Finland 547 3 Korea 547 Canada 534 Hong Kong 536 4 Netherlands 531 Estonia 531 Canada 527 5 Switzerland 530 Japan 531 New Zealand 521 6 Canada 527 New Zealand 530 Ireland 517 7 Macao, China 525 Australia 527 Australia 513 8 Liechtenstein 525 Netherlands 525 Liechtenstein 510 9 Japan 523 Liechtenstein 522 Poland 508
10 New Zealand 522 Korea 522 Sweden 507 11 Belgium 520 Slovenia 519 Netherlands 507 Source: OECD 2007

30
Table 2: Descriptive Statistics
Total Private Public Mean SD Mean SD Mean SD School can fire teachers 0.994 (0.080) 1.000 (0.000) 0.979 (0.143) Achievement data used 0.752 (0.432) 0.750 (0.433) 0.756 (0.430) Set teacher salary increase 0.809 (0.393) 0.771 (0.420) 0.894 (0.308) Parents involved in budget 0.088 (0.284) 0.071 (0.257) 0.128 (0.334) Religion used to select school 0.401 (0.490) 0.536 (0.499) 0.092 (0.290) Student-teacher ratio 16.325 (4.204) 16.227 (4.584) 16.546 (3.162) Math class hours 2.888 (1.433) 2.886 (1.444) 2.894 (1.408) Teachers certified 0.884 (0.191) 0.877 (0.176) 0.900 (0.221) School location rural 0.026 (0.158) 0.028 (0.164) 0.021 (0.145) Student Grade 9th 0.430 (0.495) 0.433 (0.496) 0.423 (0.494)
10th 0.529 (0.499) 0.534 (0.499) 0.517 (0.500) 11th 0.006 (0.075) 0.004 (0.065) 0.009 (0.094)
Age 15.718 (0.285) 15.718 (0.284) 15.717 (0.288) Female 0.498 (0.500) 0.499 (0.500) 0.494 (0.500) Mother's education Primary 0.051 (0.220) 0.050 (0.218) 0.053 (0.223)
Lower secondary 0.128 (0.334) 0.127 (0.333) 0.131 (0.337) Upper secondary 0.518 (0.500) 0.547 (0.498) 0.454 (0.498)
University 0.284 (0.451) 0.261 (0.439) 0.334 (0.472) Books at home 11-100 0.423 (0.494) 0.425 (0.494) 0.419 (0.494)
101-500 0.456 (0.498) 0.453 (0.497) 0.464 (0.499) One or more computer at home 0.994 (0.074) 0.996 (0.064) 0.991 (0.092) N 3,840 2,665 1,175 Source: PISA 2006

31
Table 3: Determinants of Learning: GLS
Math Reading Science Private school attendance 4.7 (2.2)* 4.0 (2.41)*** -1.0 (2.32) Institutional variables: School can fire teachers 43.3 (12.4)* 19.9 (13.87) 72.5 (13.47)* Achievement data used 8.3 (2.3)* 10.6 (2.55)* 6.8 (2.44)* School sets teacher increase 8.1 (2.5)* 9.9 (2.83)* 7.6 (2.70)* Parents involved in budget 11.4 (3.5)* 16.0 (3.84)* 13.9 (3.83)* School variables: Student-teacher ratio 4.5 (0.2)* 4.3 (0.27)* 4.5 (0.26)* Class hours 9.3 (0.7)* 1.2 (0.89) 13.7 (0.58)* Certified teachers -8.5 (5.2) 7.7 (5.75) 4.7 (5.57) Rural -13.6 (6.3)* -7.6 (6.92) -19.2 (6.85)* Student’s grade:
9 43.4 (5.4)* 59.9 (6.03)* 41.8 (5.77)* 10 102.2 (5.6)* 111.9 (6.23)* 97.4 (5.96)* 11 180.1 (14.3)* 185.1 (16.23)* 163.7 (15.35)*
Student’s age -31.4 (3.9)* -27.3 (4.38)* -23.1 (4.21)* Female -20.8 (2.0)* 13.1 (2.19)* -16.9 (2.11)* Mother’s education:
Primary 27.3 (8.3)* 19.1 (9.30)** 23.8 (9.01)* Lower secondary 27.7 (7.6)* 19.2 (8.50)* 31.1 (8.28)* Upper secondary 24.8 (7.3)* 25.1 (8.13)* 34.3 (7.94)*
University 42.3 (7.5)* 39.7 (8.34)* 47.5 (8.13)* Books at home:
11–100 26.0 (3.2)* 25.2 (3.60)* 27.5 (3.47)* 101-500 58.7 (3.4)* 54.3 (3.72)* 59.4 (3.61)*
Computer(s) at home 36.8 (13.3)* 29.4 (14.81)** 45.0 (13.71)* Constant 723.5 (66.7)* 652.3 (73.12)* 528.9 (70.41)* N (students) 3,866 3,891 3,737 R-square 0.446 0.349 0.476 Source: Estimation with GLS from PISA 2006 Notes: Standard errors in parentheses; indicates significances at * 1%, ** 5%, *** 10%

32
Table 4: IV Estimation of Determinants of Learning, Netherlands
Math Reading Science Private 17.4 (5.4)* 28.3 (5.8)* 17.9 (6.0)* School can fire teachers 34.7 (12.9)* 2.5 (14.3) 48.0 (14.3)* Achievement data used 8.3 (2.3)* 10.0 (2.6)* 7.1 (2.6) Schools set teacher increase 9.1 (2.7)* 12.1 (3.0)* 10.3 (3.0)* Parents involved in budget 13.1 (3.6)* 21.0 (4.0)* 18.4 (4.0)* Student-teacher ratio 4.5 (0.2)* 4.2 (0.3)* 5.2 (0.3)* Class hours 9.3 (0.7)* 8.4 (0.8)* 9.2 (0.8)* Certified teachers -6.6 (5.2) 11.4 (5.8) 10.6 (5.8) Rural -14.1 (6.4)* -10.2 (7.0) -24.0 (7.0)* Student’s grade:
9 42.2 (5.5)* 56.9 (6.1)* 41.9 (6.1)* 10 101.1 (5.7)* 107.6 (6.3)* 94.6 (6.3)* 11 180.5 (14.4)* 176.7 (15.9)* 166.1 (15.9)*
Age -31.2 (4.0)* -24.6 (4.4)* -22.2 (4.4)* Female -20.8 (2.0)* 15.2 (2.2)* -15.8 (2.2)* Mother’s education: Primary 26.3 (8.4)* 15.8 (9.3)* 24.3 (9.3)* Lower secondary 26.4 (7.7)* 16.1 (8.5)* 31.7 (8.5)* Upper secondary 23.0 (7.4)* 19.6 (8.2)* 31.3 (8.2)* University 41.8 (7.6)* 36.6 (8.4)* 51.2 (8.4)* Books at home: 11–100 25.9 (3.3)* 22.5 (3.6)* 31.5 (3.6)* 101-500 58.7 (3.4)* 50.7 (3.8)* 67.3 (3.7)* Computer(s) at home 34.3 (13.4)* 26.9 (14.8)* 48.1 (14.8)* Constant 718.2 (66.3)* 593.8 (73.4)* 504.1 (73.3)* N 3,840 3,840 3,840 R2 0.442 0.352 0.415 Over-identification test Exactly identified Exactly identified Exactly identified Source: Computed from PISA 2006 Notes: Standard errors in parentheses

33
Figure 1: Private and Public Enrollment Shares (%), Primary
0102030405060708090
100
1850 1900 1950 2000
Source: MOE; James 1984; Justesen 2002
Public
Private

34
Figure 2: Private and Public Enrollment Shares (%), Secondary
0102030405060708090
100
1850 1900 1950 2000
Source: MOE; James 1984; Justesen 2002
PublicPrivate

35

36