Embed Size (px)
Citation preview
Public Policy Program Stanford University
Private Placement of Municipal
Debt: Lessons from California’s
Mandatory Disclosure Rule
A Report For: The Volcker Alliance
Prepared By:
Benji Nguyen, Sylesh Volla, and Annabel Wong
June 2017

Page | ii
This page intentionally left blank
Page | iii
Preface
This report was produced for the Stanford Public Policy Program practicum project on the topic
of bank loans in California’s municipal financing market. This research should be of interest to
policy groups, legislators, debt issuers, investors, and California taxpayers.
The Public Policy Program at Stanford is an interdisciplinary program connecting the theoretical
and analytical tools of economics, political science, philosophy, psychology, and law with their
real-world policy applications. The Program works with the Stanford Institute for Economic Policy
Research (SIEPR), which supports research that informs economic policymaking while engaging
future leaders and scholars. SIEPR shares knowledge and builds relationships among academics,
government officials, the business community and the public.
The client for this project is the Volcker Alliance. Based in New York, The Volcker Alliance was
launched in 2013 to address the challenge of effective execution of public policies and to help
rebuild public trust in government. The nonpartisan Alliance works toward that broad objective by
partnering with other organizations—academic, business, governmental, and public interest—to
strengthen professional education for public service, conduct needed research on government
performance, and improve the efficiency and accountability of governmental organization at the
federal, state, and local levels.
If you would like to contact the authors, please email: Benji Nguyen ([email protected]),
Sylesh Volla ([email protected]), and Annabel Wong ([email protected]). You may also
email instructors Christine Pal Chee ([email protected]) and Joe Nation

Page | iv
This page intentionally left blank
Page | v
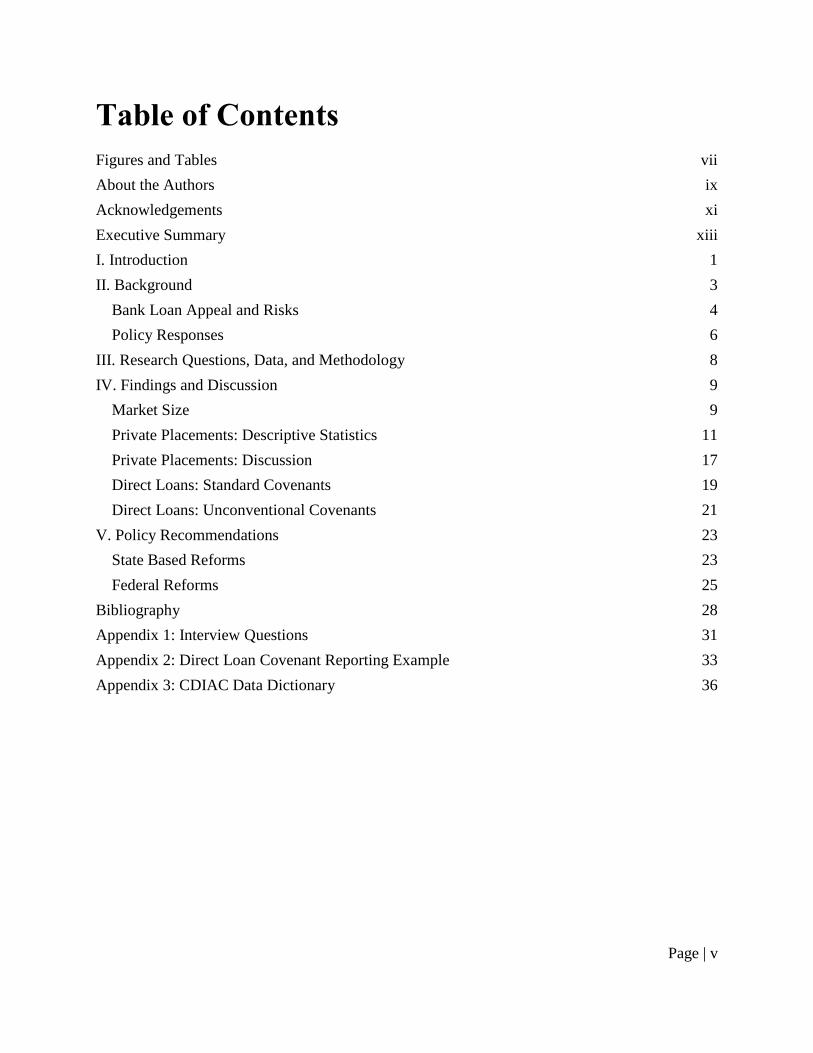
Table of Contents
Figures and Tables vii
About the Authors ix
Acknowledgements xi
Executive Summary xiii
I. Introduction 1
II. Background 3
Bank Loan Appeal and Risks 4
Policy Responses 6
III. Research Questions, Data, and Methodology 8
IV. Findings and Discussion 9
Market Size 9
Private Placements: Descriptive Statistics 11
Private Placements: Discussion 17
Direct Loans: Standard Covenants 19
Direct Loans: Unconventional Covenants 21
V. Policy Recommendations 23
State Based Reforms 23
Federal Reforms 25
Bibliography 28
Appendix 1: Interview Questions 31
Appendix 2: Direct Loan Covenant Reporting Example 33
Appendix 3: CDIAC Data Dictionary 36

Page | vi
This page intentionally left blank
Page | vii
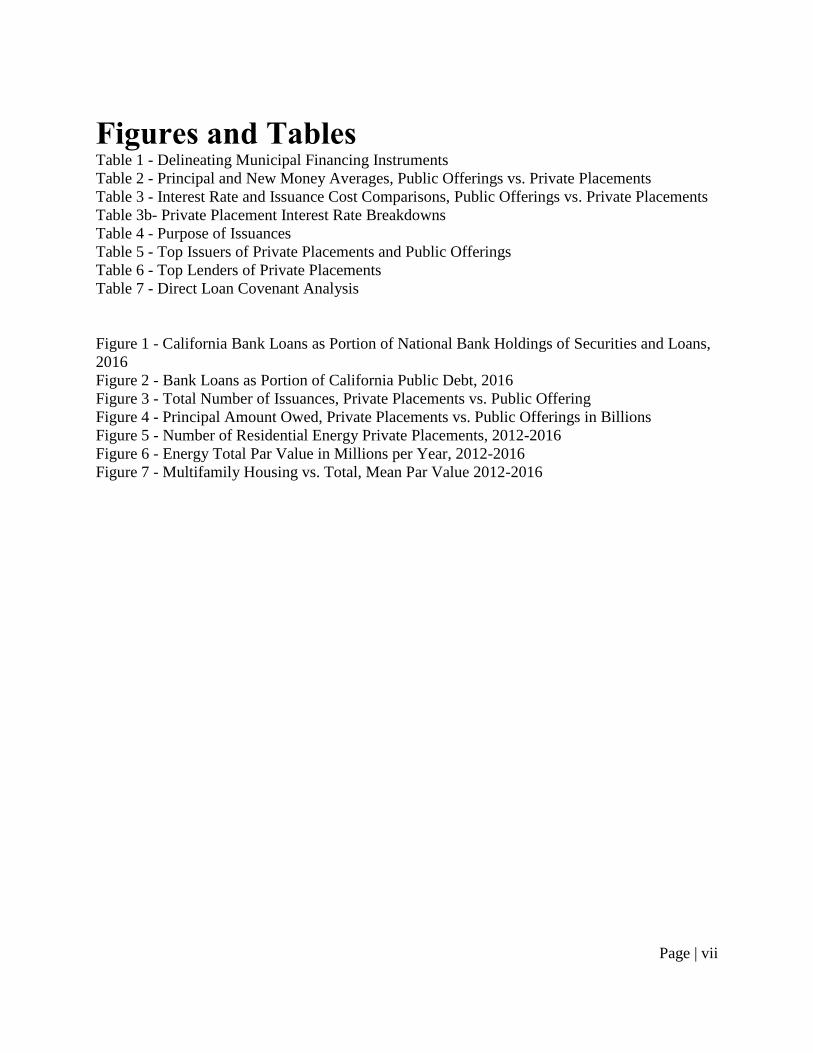
Figures and Tables Table 1 - Delineating Municipal Financing Instruments
Table 2 - Principal and New Money Averages, Public Offerings vs. Private Placements
Table 3 - Interest Rate and Issuance Cost Comparisons, Public Offerings vs. Private Placements
Table 3b- Private Placement Interest Rate Breakdowns
Table 4 - Purpose of Issuances
Table 5 - Top Issuers of Private Placements and Public Offerings
Table 6 - Top Lenders of Private Placements
Table 7 - Direct Loan Covenant Analysis
Figure 1 - California Bank Loans as Portion of National Bank Holdings of Securities and Loans,
2016
Figure 2 - Bank Loans as Portion of California Public Debt, 2016
Figure 3 - Total Number of Issuances, Private Placements vs. Public Offering
Figure 4 - Principal Amount Owed, Private Placements vs. Public Offerings in Billions
Figure 5 - Number of Residential Energy Private Placements, 2012-2016
Figure 6 - Energy Total Par Value in Millions per Year, 2012-2016
Figure 7 - Multifamily Housing vs. Total, Mean Par Value 2012-2016

Page | viii
This page intentionally left blank

Page | ix
About the Authors
Benji Nguyen Benji Nguyen is a graduate student pursuing a Master in Public Policy at Stanford. Benji also
completed his undergraduate degree in Symbolic Systems at Stanford. Benji has worked as a data
science intern at Indeed and a financial analyst for the San Jose City Government. At Stanford, he
has worked as an operations research analyst for the Stanford Children’s Hospital. After
graduation, Benji plans to work as a Technical Consultant for Epic Systems in Madison,
Wisconsin.
Sylesh Volla Sylesh Volla is a graduate student pursuing a Master of Arts in Public Policy with a concentration
in Legal and Regulatory Interventions. Sylesh received his BA in Economics from Stanford
University. He currently works as a volunteer tax counselor for AARP Tax-Aide in Palo Alto. He
has interned at U.S. Bank, Capricorn Investment Group, and most recently the Federal Reserve
Board in Washington, D.C. After graduation, Sylesh plans to work as an Economic Consultant at
Analysis Group in San Francisco.
Annabel Wong Annabel Wong is a Stanford graduate student pursuing a joint Master in Public Policy and Master
in Education degree. Before coming to Stanford, Annabel worked for educational non-profits and
received her BA in Political Science from the University of British Columbia, in Vancouver,
Canada. Annabel has been a Student Affairs fellow at the Haas Center for Public Service since
January 2016. After graduating, Annabel intends to work in higher education.

Page | x
This page intentionally left blank

Page | xi
Acknowledgements
We are grateful for the guidance and assistance of those who made this project possible.
We would first like to thank our client, The Volcker Alliance, for providing direction and
instruction. William Glasgall, the Alliance’s state and local program director, was tireless in
focusing our work and connecting us with a variety of stakeholders throughout California. Melissa
Austin, project manager for the Alliance’s state and local program, was instrumental in
coordinating the Alliance’s participation and communication with the Stanford University team.
We would like to thank the teaching staff of this practicum project. Professor Joe Nation and
Christine Pal Chee provided commentary and feedback on our work at every juncture. We extend
our thanks to the Stanford Public Policy Program staff: Greg Rosston, Katie DuPlessis, Kelly
Walsh, and Brenna Boerman. They have provided us with the opportunity to conduct real-world
policy research and the administrative support to succeed.
Our gratitude also goes to the representatives of municipal borrowers, bond counsels, financial
agencies, regulatory bodies, and professional organizations who contributed to our research
through interviews and phone calls. Tim Schaefer, Mark Campbell, and Joyce Ward in the
California State Treasurer’s Office supported our project and clarified the CDIAC data with
immense patience. Lisa Washburn, Matt Fabian, Tom Doe, and Brian Potter from Municipal
Market Analytics gave us helpful comments and assistance with data. We appreciate the time that
Jenna Magan from Orrick, Herrington, & Sutcliffe spent with us both discussing and explaining
legal concepts to our team. We hope that our study can inform policy efforts to improve the
municipal market.

Page | xii
This page intentionally left blank
Page | xiii
Executive Summary
Municipalities rely on the collection of taxes or transfer of state and federal taxes to meet revenue
requirements. But they also make use of other instruments to raise revenue, such as publicly issued
bonds, private placements of municipal securities, and direct loans from banks. The phenomenon
of bank loans has raised important questions about transparency, the agreements themselves, and
their impacts on municipalities, investors, and the market in general.
California is currently the only state to require the disclosure of bank loans to municipal
government. This information is collected by the California Debt and Investment Advisory
Commission (CDIAC). California is the largest municipal market in the country at $78.5 billion
in 2016, with $11.0 billion in private placements and direct loans.1 This suggests that California’s
municipal market is 2.1% of the national municipal market and California’s municipal bank loan
market is 6.4% of the equivalent national market. This study examines CDIAC data to characterize
bank loans, identify areas of concern, and discuss roles for public policy.
The research analyzes state and local debt issuances between 2012 and 2016, as well as direct loan
documents from 2016. It is also informed by interviews with representatives from municipal
borrowers, financial institutions, bond counsels, regulatory agencies, and professional
organizations. The findings can be summarized as follows:
● Private placements are increasing in California, rising from 688 to 1761 between 2012 and
2016. They are chiefly being used to fund residential energy improvement programs and
build multifamily housing units and K-12 school facilities. The biggest issuers are joint
power authorities that act as conduit issuers, such as the Western Riverside Council of
Governments, California Statewide Communities Development Authority, and San
Bernardino Associated Governments.
● Items in the Events of Default section and other covenants in direct loan agreements may
be harmful to investors of public debt, municipalities, and taxpayers unaware of their
existence.
● Some provisions in direct loan agreements, in conjunction with a lack of timely information
for investors of public bonds, could enable banks to make deals with municipalities on
claims on assets before other investors know the borrower is struggling and have a chance
to come to the table.
These findings suggest that the absence of timely and clear disclosure of bank loans and their
provisions could negatively impact municipal investors and citizens who are unable to properly
assess the riskiness of municipal issuers. The availability of this information allows regulators to
identify trends and bubbles at the macro-level, and reduce information asymmetry between issuers
and their investors, creditors, and citizens at the micro-level.2
1 California Debt and Investment Advisory Commission. (2017). CDIAC All Data. (February, 2017) [data file]
https://data.debtwatch.treasurer.ca.gov/Government/CDA-All-Data/yng6-vaxy 2 Matt Fabian & Lisa Washburn. (20 March, 2017). Municipal Market Analytics. MMA Weekly Outlook, p. 3.
Page | xiv
Our recommendations can be summarized as follows:
● Increase enforcement of California’s 2014 law that requires municipalities to report
private placements and direct loans to CDIAC.
● Improve public access to CDIAC data by developing an interactive website that uses a
reporting format similar to the one shown in Appendix 2, in which a viewer could easily
see the obligations of a particular municipality.
● Require Committee on Uniform Security Identification Procedures (CUSIP) identification
for private placements of securities to ensure that securities transactions are correctly
settled and matched.
● Clarify the definition of “material” in the Security and Exchange Commission's (SEC) Rule
15c-12 to encourage complete disclosure of events that substantially impact a
municipality’s financial situation.
● Expand the definition of “financial obligations” of the SEC Rule 15c-12 so that pension
obligations must be disclosed by municipalities.
Page | 1
I. Introduction
In addition to tax revenues, municipalities use publicly issued bonds, private placements of
municipal securities, and direct loans to finance their projects. Private placements, also known as
direct purchases, are bonds purchased by banks directly from the municipality,3 and direct loans
refer to explicit loan agreements between a bank or other financial entity and municipality. For the
purposes of this report, “bank loans” is used as a generic term for direct loans and private
placements.4
The phenomenon of increased bank loans has raised questions about the importance of
transparency, the agreements themselves, and their impacts on municipalities, investors, and the
market in general. As an example, in September 2015, Standard & Poor downgraded Lawrence,
Wisconsin’s credit rating from the third-highest grade, AA, to junk, BB+.5 The 4,600-person town
had borrowed $4.6 million in direct loans from local banks and agreed to a clause that allows the
banks to demand immediate repayment by deeming themselves “insecure” if they decide that the
town’s finances have deteriorated. S&P’s discovery of the terms during a routine review prompted
the credit downgrade, likely resulting in fewer willing investors and higher costs to the city.
Such scenarios demonstrate the need for increased transparency in municipal financing; investors,
creditors, taxpayers, and citizens should have full disclosure of municipal financial transactions
and contingent agreements, without which these stakeholders cannot properly assess their
exposure to potential losses. Without this disclosure, municipalities can borrow funds without
timely notification to relevant stakeholders, who may be able to access the information months
later only in the municipality’s Comprehensive Annual Financial Report (CAFR). As the largest
municipal market in the country, with median debt per issuance of $5.2 million during 2012-2016,
California’s municipalities are not invulnerable to Lawrence’s experience, and state legislators
have attempted to address the issue. In 2014, California became the first state to require formal
disclosure filing of bank loans, which must be done with the California Debt and Investment
Advisory Commission (CDIAC) within 21 days. The availability of such data allows regulators to
identify trends and bubbles at the macro-level, and reduce information asymmetry between issuers
and their investors, creditors, and citizens at the micro-level.6
3 Municipal Securities Rulemaking Board (MSRB). (2011). “MSRB Notice 2011-52 (September 2011) Potential
Applicability of MSRB Rules to Certain ‘Direct Purchases’ and ‘Bank Loans’”, http://msrb.org/Rules-and-
Interpretations/Regulatory-Notices/2011/2011-52.aspx, retrieved Dec. 1, 2016. 4 Following the National Federation of Municipal Analysts 2015 report, we use bank loans to apply to loans and
private placements throughout this document. 5 Martin Braun. (15 October, 2015). “Swift Descent to Junk Shows Buried Risk as Municipal Loans Surge,”
https://www.bloomberg.com/news/articles/2015-10-05/swift-descent-to-junk-shows-buried-risk-as-municipal-loans-
surge, retrieved April 20, 2017. 6 Fabian & Washburn, p. 3.
Page | 2
Using data partly available due to disclosure regulation, this report aims to:
1) Characterize the municipal bank loan market in California;
2) Examine the extent to which bank loans raise concerns for the issuers, investors, and
market in general; and
3) Offer policy recommendations to address any concerns.
This report addresses these aims by examining state and local debt issuances in California between
2012 and 2016, as well as direct loan documents from 2016. It is also informed by interviews with
representatives from municipal borrowers, financial institutions, bond counsels, regulatory
agencies, and professional organizations.
This report aims to provide insight into the place of bank loans in California’s economy and bolster
the case for timely and clear disclosure nationally. Section II provides background information on
the topic, Section III describes the research questions, data, and methodology, and Section IV
contains the findings and discussion. Section V concludes the report with recommendations.
Page | 3
II. Background
Municipalities rely on the collection of taxes or transfer of state and federal taxes to meet revenue
requirements. But they also make use of other instruments to raise revenue, such as publicly issued
bonds, private placements of municipal securities, and direct loans from banks. Table 1 describes
these financing instruments.
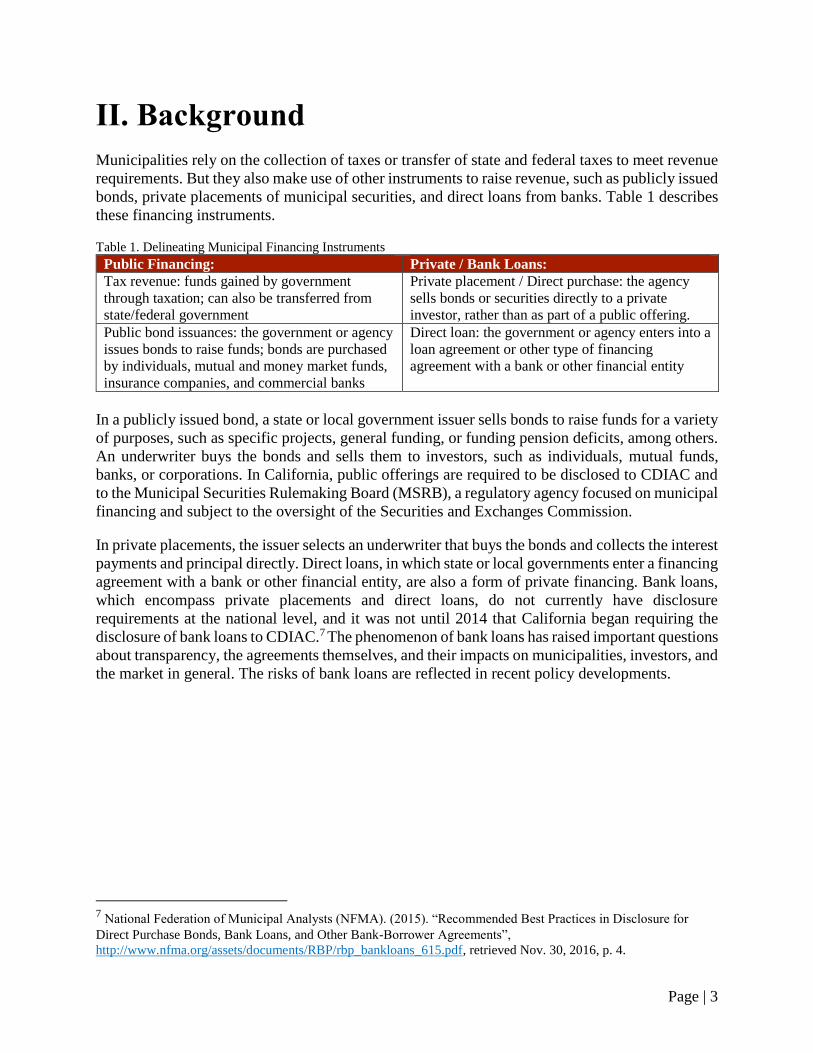
Table 1. Delineating Municipal Financing Instruments
Public Financing: Private / Bank Loans:
Tax revenue: funds gained by government
through taxation; can also be transferred from
state/federal government
Private placement / Direct purchase: the agency
sells bonds or securities directly to a private
investor, rather than as part of a public offering.
Public bond issuances: the government or agency
issues bonds to raise funds; bonds are purchased
by individuals, mutual and money market funds,
insurance companies, and commercial banks
Direct loan: the government or agency enters into a
loan agreement or other type of financing
agreement with a bank or other financial entity
In a publicly issued bond, a state or local government issuer sells bonds to raise funds for a variety
of purposes, such as specific projects, general funding, or funding pension deficits, among others.
An underwriter buys the bonds and sells them to investors, such as individuals, mutual funds,
banks, or corporations. In California, public offerings are required to be disclosed to CDIAC and
to the Municipal Securities Rulemaking Board (MSRB), a regulatory agency focused on municipal
financing and subject to the oversight of the Securities and Exchanges Commission.
In private placements, the issuer selects an underwriter that buys the bonds and collects the interest
payments and principal directly. Direct loans, in which state or local governments enter a financing
agreement with a bank or other financial entity, are also a form of private financing. Bank loans,
which encompass private placements and direct loans, do not currently have disclosure
requirements at the national level, and it was not until 2014 that California began requiring the
disclosure of bank loans to CDIAC.7 The phenomenon of bank loans has raised important questions
about transparency, the agreements themselves, and their impacts on municipalities, investors, and
the market in general. The risks of bank loans are reflected in recent policy developments.
7 National Federation of Municipal Analysts (NFMA). (2015). “Recommended Best Practices in Disclosure for
Direct Purchase Bonds, Bank Loans, and Other Bank-Borrower Agreements”,
http://www.nfma.org/assets/documents/RBP/rbp_bankloans_615.pdf, retrieved Nov. 30, 2016, p. 4.

Page | 4
Bank Loan Appeal and Risks
Banks have participated in municipal lending since at least the mid-20th century and were major
purchasers of municipal bonds through public offerings.8 Since the end of the Great Recession in
2009, some municipalities have eschewed the use of public capital market financing in favor of
bank loans.9 For municipal issuers, fewer disclosure requirements and issuance costs, namely
associated with credit ratings, bond insurance, the absence of an Official Statement, and printing
costs, make private placements attractive. The execution process also requires less time, interest
rates are competitive with public offerings, and private placements can often be structured to better
suit specific projects or repayment considerations than public bond issues.10
In spite of these advantages, bank loans can introduce risks that affect credit analysis. Reduced
disclosure requirements are of particular concern, because information about a municipality’s debt
affects its creditworthiness as determined by ratings agencies and potential and current investors.
Risks that concern bondholders include:
● Additional debt in general;
● Liquidity risks;
● Refinancing risks; and
● Jeopardized security positions.
Additional debt: Incurring bank loans for new money financing increases the aggregate debt for
which the municipality becomes responsible. This can affect the municipality’s debt position,
whether level of net direct debt, or debt as percent of expenditures, which are important credit
quality and pricing indicators for public bonds and the investors who may choose to hold them.
Liquidity risks: The terms of bank loans can differ from the terms of publicly issued debt,
especially provisions that trigger changes in payment under certain events, such as “acceleration”
features by a ratings downgrade, or ones that favor the bank loan provider in the event of
insolvency.11 Some provisions can inhibit the ability of a municipality to manage financial
demands and pay claims that are contingent on certain events, thus affecting its creditworthiness.
Refinancing risks: Generally, bank loans have shorter terms than publicly issued bonds. Bank
loans have maturities of 3-7 years, to avoid the long-term commitments that are found among
public bonds. If the municipality requires financing with longer maturities, there is a risk of
uncertain access to refinancing when the loan matures.12 Bondholders need to be aware of
refinancing risk that could compromise an issuer’s ability to repay outstanding bonds, particularly
8 Securities Industry and Financial Markets Association (SIFMA). (2013). “White Paper: Considerations Regarding
Voluntary Secondary Market Disclosure About Bank Loans”,
http://www.sifma.org/issues/item.aspx?id=8589943360, retrieved April 14, 2017, Appendix B. 9 NFMA, p. 2
10 Government Finance Officers Association (GFOA). (September 2013). “Understanding Bank Loans”,
http://gfoa.org/understanding-bank-loans, retrieved April 20, 2017. 11
Bergstresser, D., & Orr, P. (2014). “Direct Bank Investment in Municipal Debt”. Municipal Finance Journal., 35,
1, p. 3. 12
NFMA, p. 8.
Page | 5
if loans are structured with a bank loan may be structured with a large, “balloon” payment of
principal or purchase price due at the end of the term of the loan.13
Jeopardized security positions: In general, additional debt, and additional debt restrictions, can
affect municipal security and their credit quality. More debt obligations increase the risk of delayed
or defaulted payments for existing bondholders. Bondholders are wary of situations in which assets
or revenues that were once available to pay outstanding bonds are pledged to the bank as security
for a bank loan.14 Covenants in loan agreements, such as acceleration clauses and cross default
provisions, can jeopardize bondholders’ security positions. Such covenants, and definitions of
events of default, can be different from those applicable to outstanding bonds, enabling the bank
to assert remedies prior to other bondholders and give seniority to private placements relative to
publicly marketed bonds.15
13
SIFMA, p. 8. 14
NFMA, p. 8. 15
Ibid, p. 7.
Page | 6
Policy Responses
In a move suggesting that disclosure of alternatives to public bond offerings are becoming an area
of interest nationally, the SEC has now joined the Government Finance Officers Association and
the National Federation of Municipal Analysts in calling for more disclosure regulation, especially
in the $549 billion municipal securities and loans16 market held by banks as of 2016.17 Policy
responses have arisen at the state and national levels.
Transparency in California: The Municipal Securities Rulemaking Board (MSRB) strictly
regulates the disclosure of public bond issues across the country via underwriters, but California
became the first state to pass a law regarding the disclosure of municipal bank loans.18 In view of
the risks associated with bank loans, California took steps to improve transparency. In 2014,
Assembly Bill no. 2274 amended Sections 8855 and 8856 of the Government Code to require all
that the issuer of any debt issue of state or local government submit a report of final sale to CDIAC
not later than 21 days after the sale of the debt.19 CDIAC has served as a statistical clearinghouse
for all state and local debt issuance in California since 1982, and the data it has collected allows
for analysis and description of debt incurred across the state.20 The report to CDIAC provides a
snapshot in time for that issue, allowing investors and the market greater access to a municipality’s
financial position.
National Policy Developments: On March 1, 2017, the Securities and Exchange Commission
proposed two draft amendments to the SEC’s municipal disclosure Rule 15c2-12. Underwriters
are responsible for confirming that the issuer has entered into a continuing disclosure agreement
in which the issuer agrees to provide timely notice to the MSRB about a list of material events.
These amendments add two material events to the existing list of 14 that must be disclosed:
● Amendment 15: “Incurring a financial obligation by the obligated person, if material, or
agreement to covenants, events of default, remedies, priority rights, or other similar terms
of a financial obligation of the obligated person, any of which affect security holders, if
material;” and
● Amendment 16: “Default, event of acceleration, termination event, modification of terms,
or other similar events under the terms of a financial obligation of the obligated person,
any of which reflect financial difficulties.”
16
This report does not focus on differentiating between private placements and direct loans that may be considered
“securities” or “loans”, which has been an area of contention in the field. Securities are subject to regulation by the
Municipal Securities Rulemaking Board, while loans are not. Please see the MSRB website for further information,
particularly: http://msrb.org/Rules-and-Interpretations/Regulatory-Notices/2011/2011-52.aspx, retrieved April 20,
2017. 17
Federal Reserve Flow of Funds, March 2017. 18
NFMA, p. 4 19
California Debt and Investment Advisory Commission, Assem. Bill 2274, 2013-2014 Reg. Sess. 2014 Cal. Stat. http://leginfo.legislature.ca.gov/faces/billNavClient.xhtml?bill_id=201320140AB2274 20
California Debt and Investment Advisory Commission. (2016).
http://www.treasurer.ca.gov/cdiac/introduction.asp, retrieved April 15, 2017.
Page | 7
The proposed amendments require that information be provided about (1) the incurrence and terms
of direct loans and direct purchases and (2) the occurrence of accelerations and defaults by the
issuer.21 These amendments improve the ability of municipal investors in assessing the fiscal
position of issuers. This paper will discuss these amendments in greater depth in the Policy
Recommendations section.
21
Stephens, R. B., Wiener, M. L., & Stevens, D. (2017, April 12). Material-Event Disclosures Under New SEC
Proposal - Law360. Retrieved April 26, 2017, from https://www.law360.com/articles/912785/material-event-
disclosures-under-new-sec-proposal
Page | 8
III. Research Questions, Data, and
Methodology
The availability of data, as well as California’s position as the largest municipal market in the
country at $78.5 billion22, makes the state a logical candidate for analysis on the phenomenon of
bank loans. This research aims to address three questions as related to California’s municipal
financing:
1) What are the characteristics of private placements and direct loans in California?
2) Are there private placement and direct loan provisions that are concerning to
municipalities and bondholders?
3) Is there a role for public policy to improve the market for municipalities?
To address the research questions, we employ qualitative interview data, quantitative data from
extant data sources, and direct loan documents from CDIAC. The report is informed by interviews
with 15 individuals who represent municipal borrowers, financial institutions, bond counsels,
regulatory agencies, and professional organizations (see Appendix 1 for the interview questions).
Interviews ranged from 30 minutes to one hour. After contacting financial officers of the top five
municipal borrowers of both private placements and public issuances, responsive individuals
became the interviewees. Other contacts were referred to the researchers by the Volcker Alliance
and municipal borrowers.
The primary data analyses were conducted on a database of all debt issuances as recorded by
CDIAC. The CDIAC reporting form has distinguished private placements from other issuances
since 2012, two years before the 2014 law made it a requirement, which allowed analysis on
issuances from the years 2012 through 2016. The 2012-2016 dataset contains 12,527 total
issuances. However, many aspects of the CDIAC database are currently missing. Mainly, it is
difficult to fully delineate the various aspects of a bond’s issuance cost because key information,
such as underwriter fees, bond counsel fees, and other costs are sporadically available in the
database. Direct loans were sporadically identified, with 27 made in 2016 and only 15 from 2010
to 2015, which suggests that direct loan reporting is low.
Forty-two individual direct loan documents were reported in the CDIAC database from 2010 to
2016, which were each analyzed to understand the structure of the bank loan agreements. Though
a handful of banks, like First Republic Bank, based in San Francisco, California, played a more
prominent role in the market, several banks were engaged in direct lending.
22
CDIAC, 2017.
Page | 9
IV. Findings and Discussion
Market Size
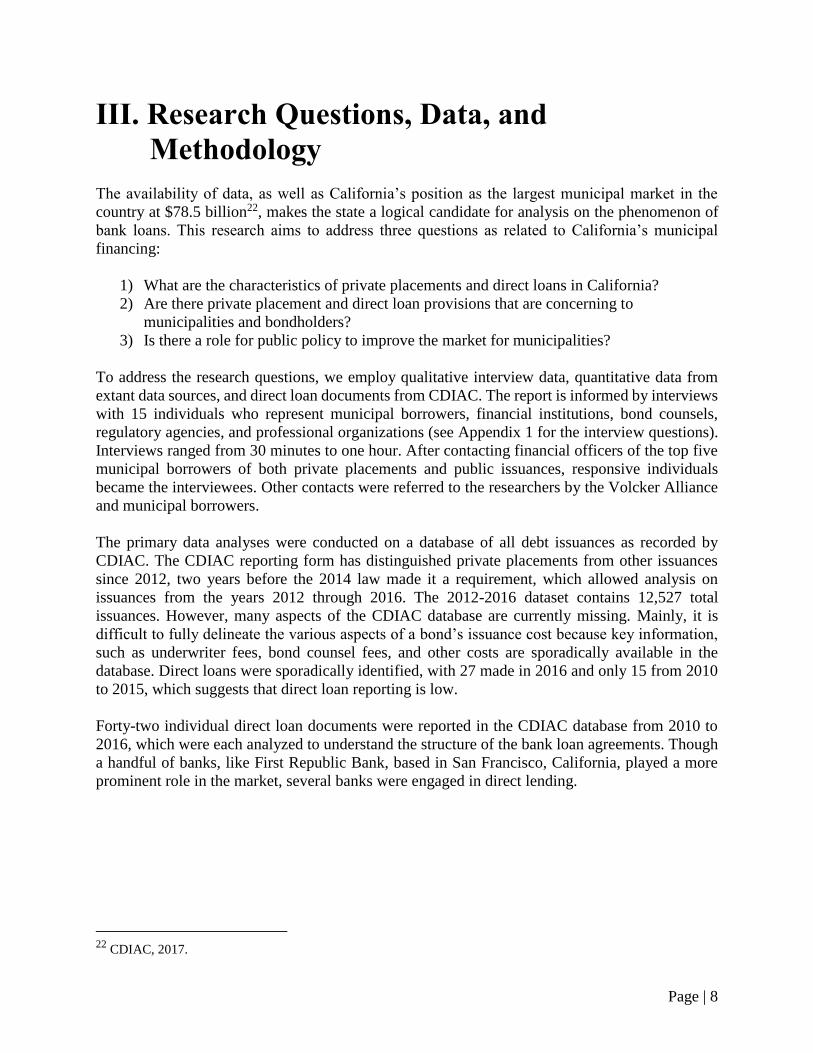
This report draws from numerous sources to characterize the size of the bank loan market at both
federal and state levels. According to the Federal Reserve, the U.S. municipal market was $3.8
trillion by the end of 2016, of which $535.6 billion were national bank holdings of securities and
loans.23 The Federal Deposit Insurance Corporation (FDIC) offers further granularity; of national
bank holdings, $173.5 billion was categorized as direct loans or private placements. Of the $536.6
billion in national bank holdings, California’s total bank holdings of securities and loans was $90.6
billion (16.9% of national), with $21.0 billion classified as direct loans or private placements
(12.1% of national).
Figure 1. California Bank Loans as Portion of National Bank Holdings of Securities and Loans, 2016
(Source: FDIC BankRegData)
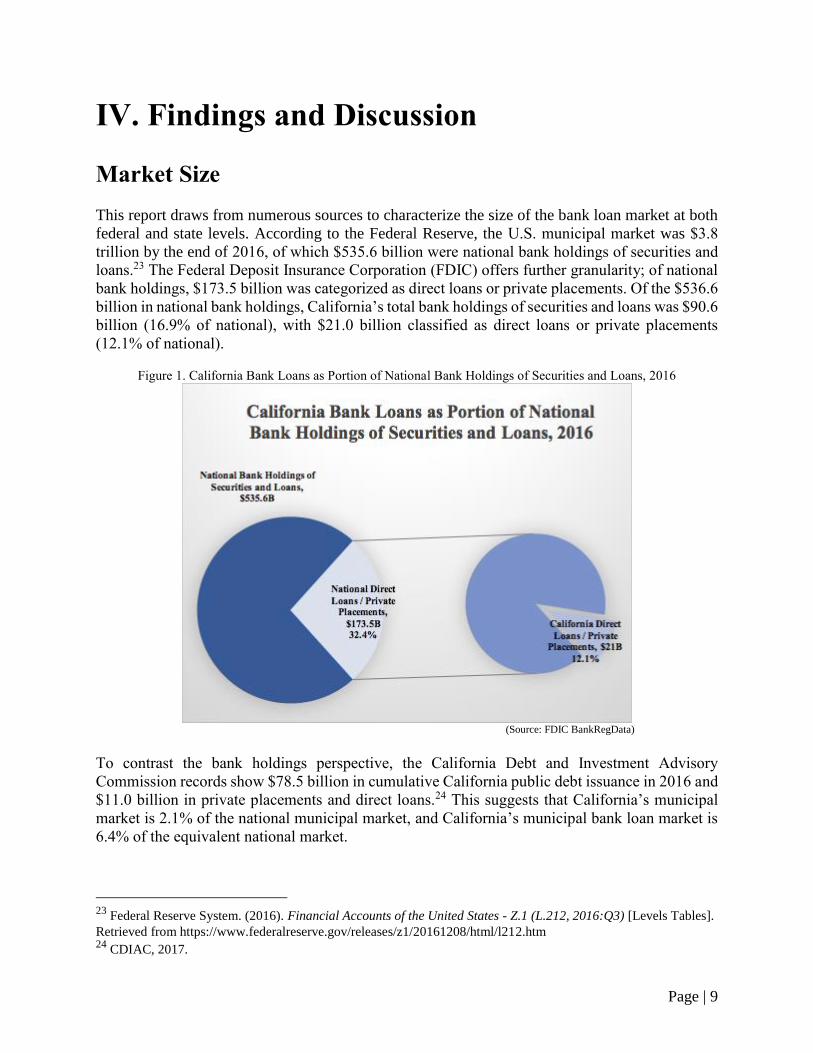
To contrast the bank holdings perspective, the California Debt and Investment Advisory
Commission records show $78.5 billion in cumulative California public debt issuance in 2016 and
$11.0 billion in private placements and direct loans.24 This suggests that California’s municipal
market is 2.1% of the national municipal market, and California’s municipal bank loan market is
6.4% of the equivalent national market.
23
Federal Reserve System. (2016). Financial Accounts of the United States - Z.1 (L.212, 2016:Q3) [Levels Tables].
Retrieved from https://www.federalreserve.gov/releases/z1/20161208/html/l212.htm 24
CDIAC, 2017.
Page | 10
Figure 2. Bank Loans as Portion of California Public Debt, 2016
(Source: CDIAC, http://www.treasurer.ca.gov/cdiac/debt.asp)
Though these numbers may seem incongruent, note that the FDIC and CDIAC are reporting from
different reference points. The FDIC’s $21.0 billion number for 2016 refers to the direct loans or
private placement holdings of banks located with the State of California. CDIAC’s $11.0 billion
number refers to direct loans and private placements California municipalities have borrowed. The
discrepancy could be caused by factors such as the ability of banks located with the state to have
out-of-state municipal holdings.
CDIAC’s estimate that California is only 2.1% of the national market is harder to explain. It is
possible that CDIAC is not capturing all of California’s public issuances. CDIAC might also have
a narrower definition of public issuance, which would underestimate the proportion of California’s
municipal market as part of the national market. Unfortunately, a state-by-state breakdown of the
national $3.8 trillion was not available, which would have provided more information on the
discrepancy between the FDIC and CDIAC’s estimates for California’s public and private debt.
Page | 11
Private Placements: Descriptive Statistics
This section will highlight some key descriptive findings from statistical analyses performed on
CDIAC’s database of California issuances from the years 2012-2016. The findings capture the
trend in the growth of private placements versus public offerings, both in terms of the total number
of private placements issued year-by-year and the total amount of debt issued. These findings also
include comparisons between private placements and public offerings in terms of their average
issuance costs, interest rates, and purpose of funding. This section concludes with a look into which
funding purposes or sectors issue the most private placements and some trends within those
sectors.
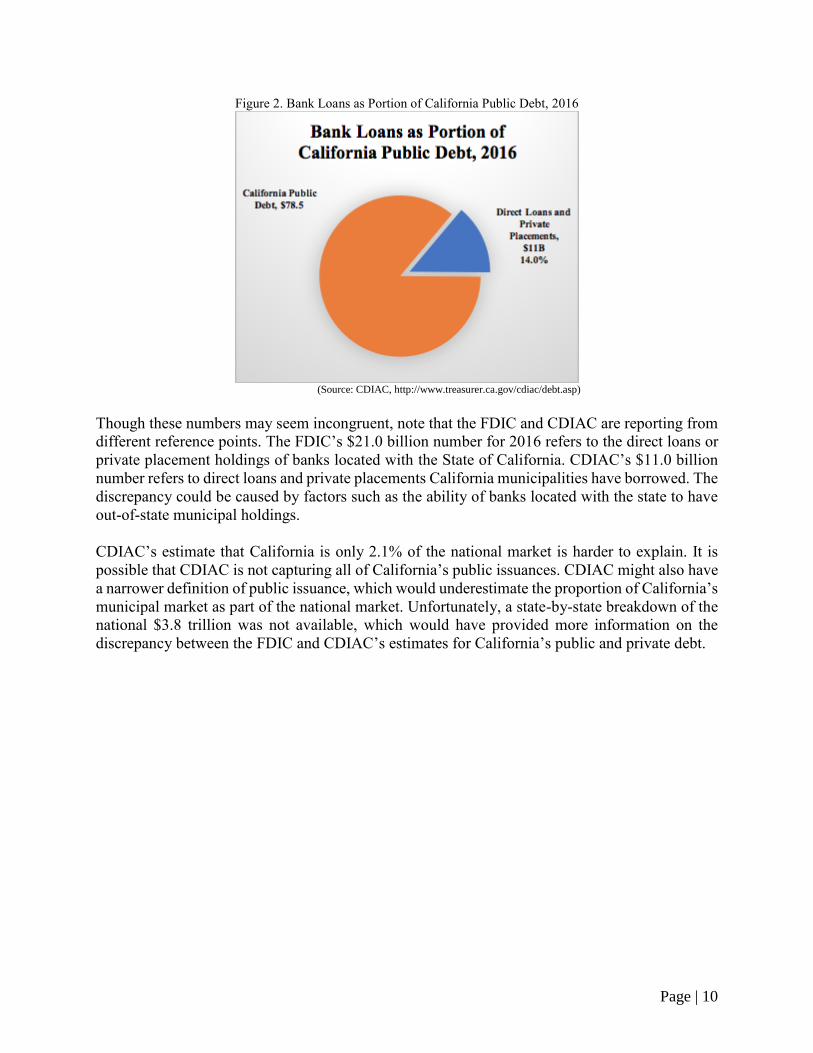
Figure 3 gives the total number of public offering issuances and private placement issuances each
year from 2012-2016. These include all issuances, including long-term fixed-rate issuances and
short-term variable-rate issuances. There is a steady increase in private placements from 2012-
2016, with 2016 having almost triple the amount triple the number of private placements as in
2012. The number of public offerings remains roughly the same.
Figure 3. Total Number of Issuances, Private Placements vs. Public Offerings
(Source: CDIAC, http://www.treasurer.ca.gov/cdiac/debt.asp)
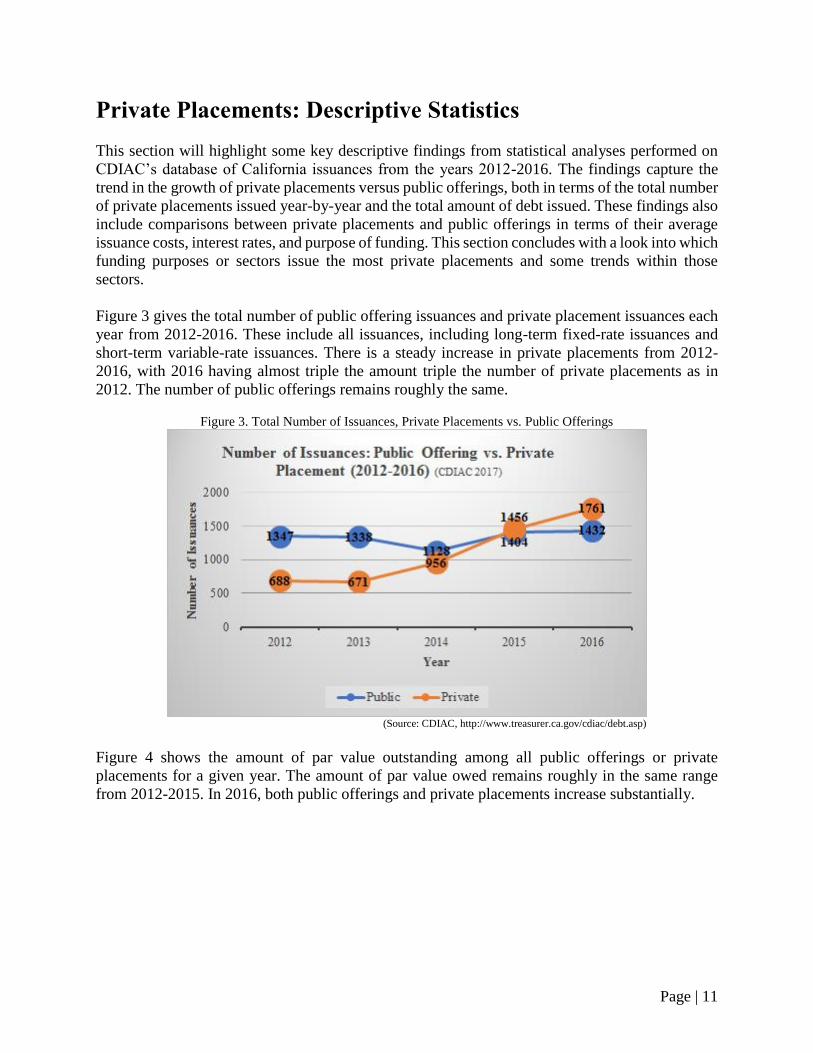
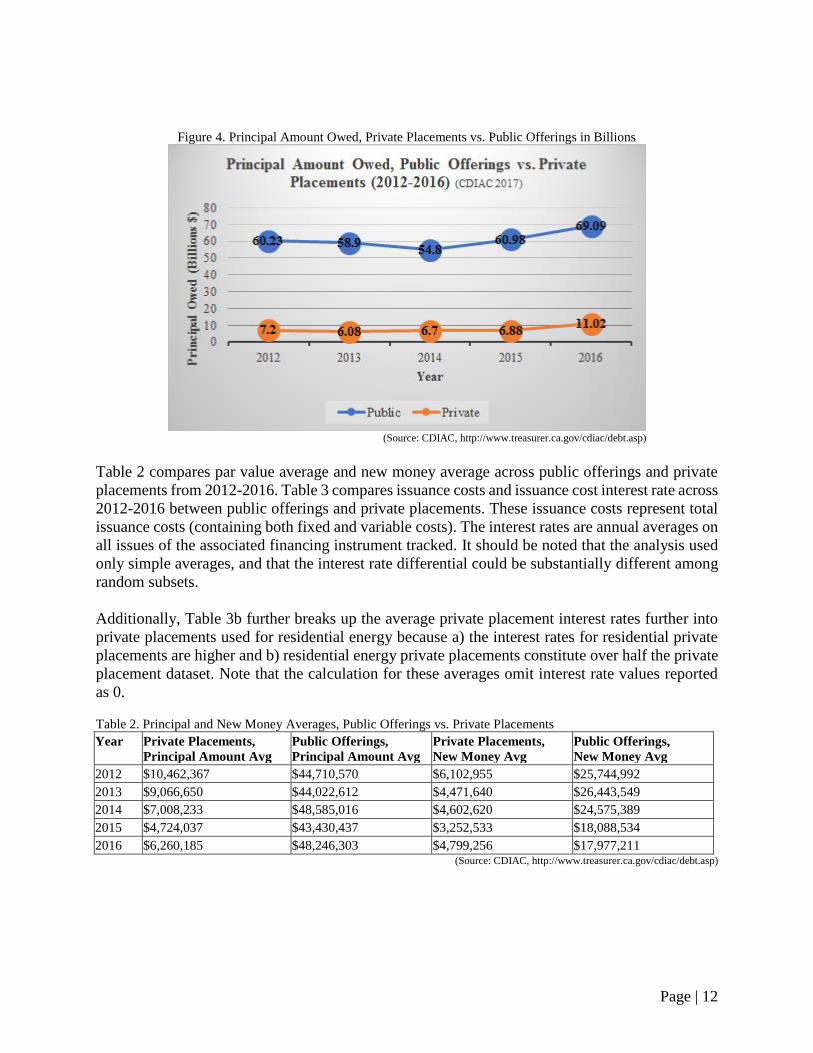
Figure 4 shows the amount of par value outstanding among all public offerings or private
placements for a given year. The amount of par value owed remains roughly in the same range
from 2012-2015. In 2016, both public offerings and private placements increase substantially.
Page | 12
Figure 4. Principal Amount Owed, Private Placements vs. Public Offerings in Billions
(Source: CDIAC, http://www.treasurer.ca.gov/cdiac/debt.asp)
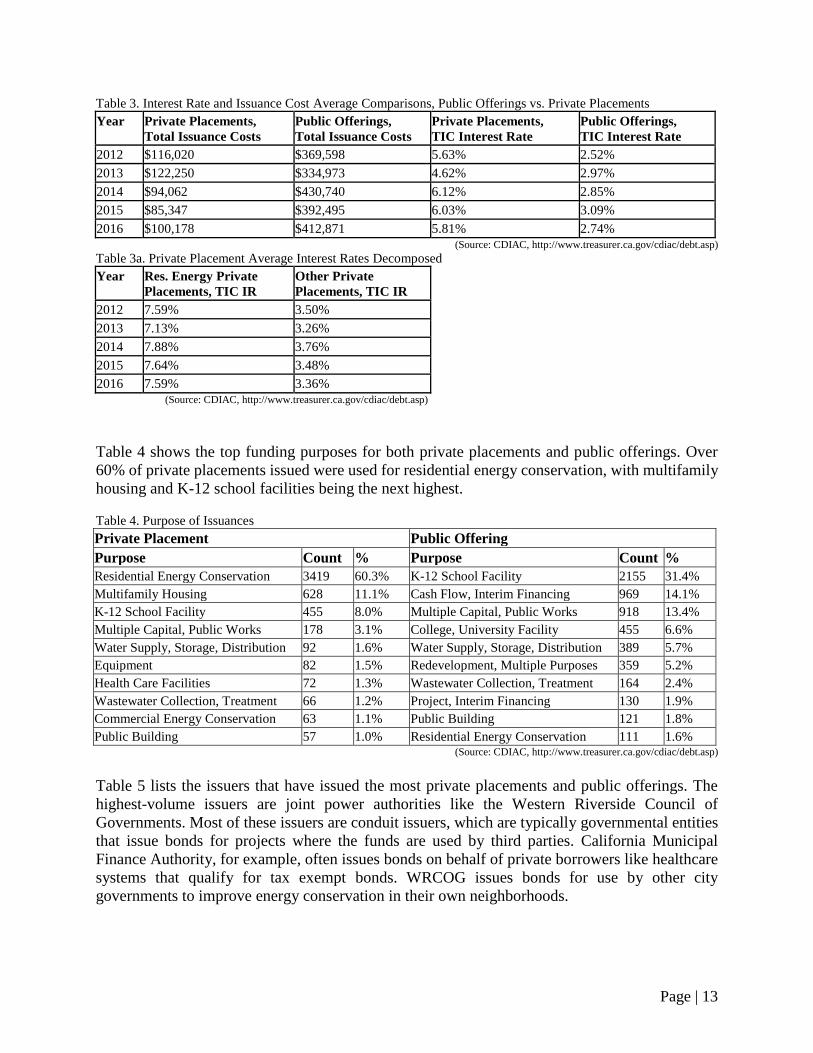
Table 2 compares par value average and new money average across public offerings and private
placements from 2012-2016. Table 3 compares issuance costs and issuance cost interest rate across
2012-2016 between public offerings and private placements. These issuance costs represent total
issuance costs (containing both fixed and variable costs). The interest rates are annual averages on
all issues of the associated financing instrument tracked. It should be noted that the analysis used
only simple averages, and that the interest rate differential could be substantially different among
random subsets.
Additionally, Table 3b further breaks up the average private placement interest rates further into
private placements used for residential energy because a) the interest rates for residential private
placements are higher and b) residential energy private placements constitute over half the private
placement dataset. Note that the calculation for these averages omit interest rate values reported
as 0.
Table 2. Principal and New Money Averages, Public Offerings vs. Private Placements
Year Private Placements,
Principal Amount Avg
Public Offerings,
Principal Amount Avg
Private Placements,
New Money Avg
Public Offerings,
New Money Avg
2012 $10,462,367 $44,710,570 $6,102,955 $25,744,992
2013 $9,066,650 $44,022,612 $4,471,640 $26,443,549
2014 $7,008,233 $48,585,016 $4,602,620 $24,575,389
2015 $4,724,037 $43,430,437 $3,252,533 $18,088,534
2016 $6,260,185 $48,246,303 $4,799,256 $17,977,211 (Source: CDIAC, http://www.treasurer.ca.gov/cdiac/debt.asp)
Page | 13
Table 3. Interest Rate and Issuance Cost Average Comparisons, Public Offerings vs. Private Placements Year Private Placements,
Total Issuance Costs
Public Offerings,
Total Issuance Costs
Private Placements,
TIC Interest Rate
Public Offerings,
TIC Interest Rate
2012 $116,020 $369,598 5.63% 2.52%
2013 $122,250 $334,973 4.62% 2.97%
2014 $94,062 $430,740 6.12% 2.85%
2015 $85,347 $392,495 6.03% 3.09%
2016 $100,178 $412,871 5.81% 2.74%
(Source: CDIAC, http://www.treasurer.ca.gov/cdiac/debt.asp) Table 3a. Private Placement Average Interest Rates Decomposed Year Res. Energy Private
Placements, TIC IR
Other Private
Placements, TIC IR
2012 7.59% 3.50%
2013 7.13% 3.26%
2014 7.88% 3.76%
2015 7.64% 3.48%
2016 7.59% 3.36%
(Source: CDIAC, http://www.treasurer.ca.gov/cdiac/debt.asp)
Table 4 shows the top funding purposes for both private placements and public offerings. Over
60% of private placements issued were used for residential energy conservation, with multifamily
housing and K-12 school facilities being the next highest.
Table 4. Purpose of Issuances
Private Placement Public Offering
Purpose Count % Purpose Count %
Residential Energy Conservation 3419 60.3% K-12 School Facility 2155 31.4%
Multifamily Housing 628 11.1% Cash Flow, Interim Financing 969 14.1%
K-12 School Facility 455 8.0% Multiple Capital, Public Works 918 13.4%
Multiple Capital, Public Works 178 3.1% College, University Facility 455 6.6%
Water Supply, Storage, Distribution 92 1.6% Water Supply, Storage, Distribution 389 5.7%
Equipment 82 1.5% Redevelopment, Multiple Purposes 359 5.2%
Health Care Facilities 72 1.3% Wastewater Collection, Treatment 164 2.4%
Wastewater Collection, Treatment 66 1.2% Project, Interim Financing 130 1.9%
Commercial Energy Conservation 63 1.1% Public Building 121 1.8%
Public Building 57 1.0% Residential Energy Conservation 111 1.6% (Source: CDIAC, http://www.treasurer.ca.gov/cdiac/debt.asp)
Table 5 lists the issuers that have issued the most private placements and public offerings. The
highest-volume issuers are joint power authorities like the Western Riverside Council of
Governments. Most of these issuers are conduit issuers, which are typically governmental entities
that issue bonds for projects where the funds are used by third parties. California Municipal
Finance Authority, for example, often issues bonds on behalf of private borrowers like healthcare
systems that qualify for tax exempt bonds. WRCOG issues bonds for use by other city
governments to improve energy conservation in their own neighborhoods.

Page | 14
Table 5. Top Issuers of Private Placements and Public Offerings Private Placement Public Offering
Issuer Count % Issuer Count %
Western Riverside Council of
Governments
1249 22.0% State of California 850 12.4%
California Statewide Communities
Development Authority
868 15.3% California Statewide Communities
Development Authority
133 1.9%
San Bernardino Associated
Governments
746 13.2% Sonoma County 115 1.7%
Los Angeles County 698 12.3% California Municipal Finance Authority 92 1.3%
California Municipal Finance Authority 270 4.8% California School Finance Authority 58 0.9%
Sonoma County Public Financing
Authority
117 2.1% California Health Facilities Financing
Authority
47 0.7%
California Enterprise Development
Authority
79 1.4% California State Public Works Board 40 0.6%
Los Angeles 66 1.2% San Francisco City & County 37 0.5%
San Francisco City & County 62 1.1% California Infrastructure & Economic
Development Bank
34 0.5%
(Source: CDIAC, http://www.treasurer.ca.gov/cdiac/debt.asp)
Table 6 lists the top 10 funding purposes for private placements in the year 2016 based on the total
par value across all issuances used for a given funding purpose (e.g. all multifamily housing in
2016 summed up to a total par value of $3.9 billion). Multifamily housing accounts for the largest
share of total par value across all private placements in 2016, followed by residential energy
conservation and K-12 school facilities.
Table 6. Private Placements’ Purpose of Funding by Total Principal, 2016
Purpose of Funding Total Par Value ($)
Multifamily Housing $3,907,421,177
Residential Energy Conservation, Improvement $1,379,362,038
K-12 School Facility $841,561,684
Health Care Facilities $750,712,245
Public Transit $457,000,000
Power Generation/Transmission $428,119,192
Multiple Capital Improvements, Public Works $338,941,586
Hospital $280,662,000
Pollution Control $242,900,000
College, University Facility $228,241,977 (Source: CDIAC, http://www.treasurer.ca.gov/cdiac/debt.asp)
Page | 15
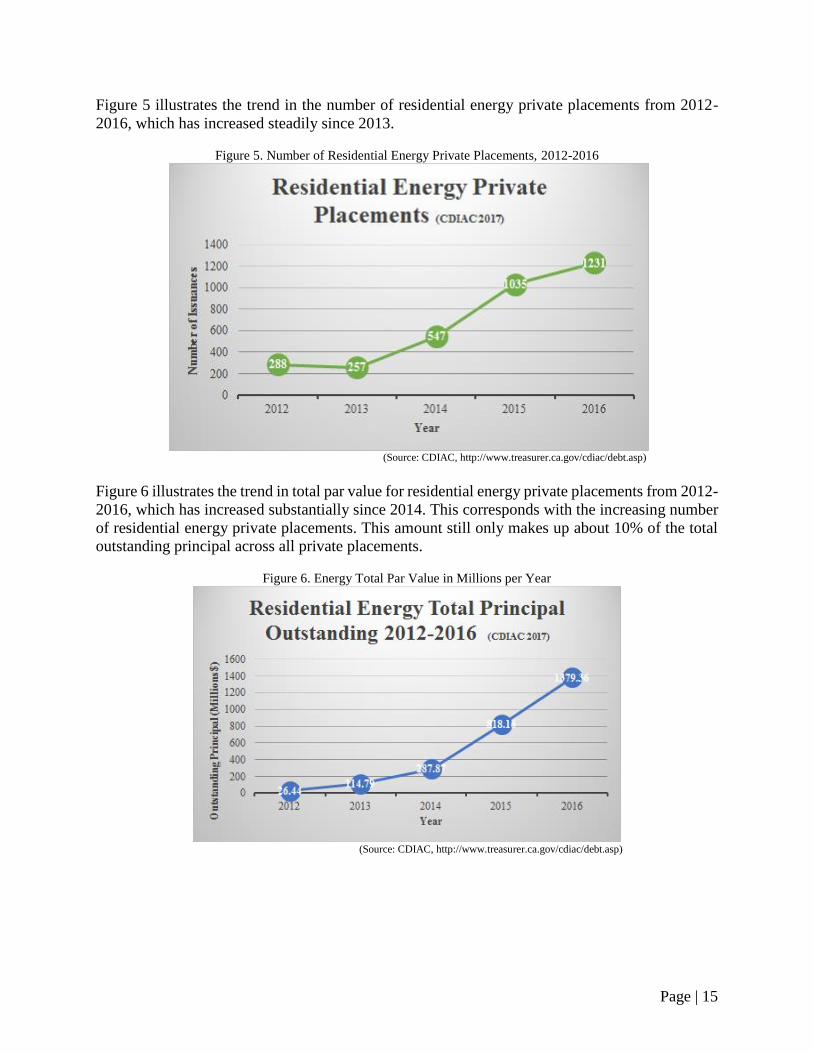
Figure 5 illustrates the trend in the number of residential energy private placements from 2012-
2016, which has increased steadily since 2013.
Figure 5. Number of Residential Energy Private Placements, 2012-2016
(Source: CDIAC, http://www.treasurer.ca.gov/cdiac/debt.asp)
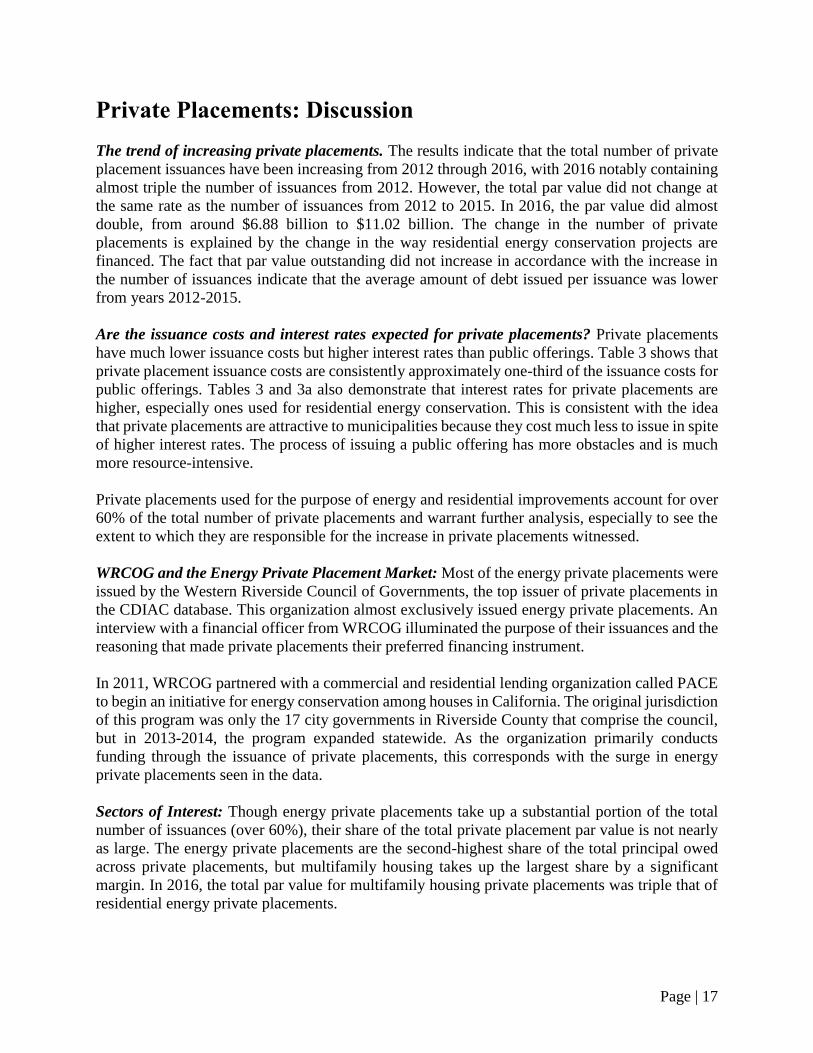
Figure 6 illustrates the trend in total par value for residential energy private placements from 2012-
2016, which has increased substantially since 2014. This corresponds with the increasing number
of residential energy private placements. This amount still only makes up about 10% of the total
outstanding principal across all private placements.
Figure 6. Energy Total Par Value in Millions per Year
(Source: CDIAC, http://www.treasurer.ca.gov/cdiac/debt.asp)

Page | 16
Figure 7 shows the trend in mean par value issued for multifamily housing private placements
from 2012-2016, which has increased since 2014. The mean par value for housing issuances has
been significantly higher than the mean for all private placements.
Figure 7. Multifamily Housing vs. Total, Mean Par Value 2012-2016
(Source: CDIAC, http://www.treasurer.ca.gov/cdiac/debt.asp)
Page | 17
Private Placements: Discussion
The trend of increasing private placements. The results indicate that the total number of private
placement issuances have been increasing from 2012 through 2016, with 2016 notably containing
almost triple the number of issuances from 2012. However, the total par value did not change at
the same rate as the number of issuances from 2012 to 2015. In 2016, the par value did almost
double, from around $6.88 billion to $11.02 billion. The change in the number of private
placements is explained by the change in the way residential energy conservation projects are
financed. The fact that par value outstanding did not increase in accordance with the increase in
the number of issuances indicate that the average amount of debt issued per issuance was lower
from years 2012-2015.
Are the issuance costs and interest rates expected for private placements? Private placements
have much lower issuance costs but higher interest rates than public offerings. Table 3 shows that
private placement issuance costs are consistently approximately one-third of the issuance costs for
public offerings. Tables 3 and 3a also demonstrate that interest rates for private placements are
higher, especially ones used for residential energy conservation. This is consistent with the idea
that private placements are attractive to municipalities because they cost much less to issue in spite
of higher interest rates. The process of issuing a public offering has more obstacles and is much
more resource-intensive.
Private placements used for the purpose of energy and residential improvements account for over
60% of the total number of private placements and warrant further analysis, especially to see the
extent to which they are responsible for the increase in private placements witnessed.
WRCOG and the Energy Private Placement Market: Most of the energy private placements were
issued by the Western Riverside Council of Governments, the top issuer of private placements in
the CDIAC database. This organization almost exclusively issued energy private placements. An
interview with a financial officer from WRCOG illuminated the purpose of their issuances and the
reasoning that made private placements their preferred financing instrument.
In 2011, WRCOG partnered with a commercial and residential lending organization called PACE
to begin an initiative for energy conservation among houses in California. The original jurisdiction
of this program was only the 17 city governments in Riverside County that comprise the council,
but in 2013-2014, the program expanded statewide. As the organization primarily conducts
funding through the issuance of private placements, this corresponds with the surge in energy
private placements seen in the data.
Sectors of Interest: Though energy private placements take up a substantial portion of the total
number of issuances (over 60%), their share of the total private placement par value is not nearly
as large. The energy private placements are the second-highest share of the total principal owed
across private placements, but multifamily housing takes up the largest share by a significant
margin. In 2016, the total par value for multifamily housing private placements was triple that of
residential energy private placements.

Page | 18
Private placements for the purpose of multifamily housing have consistently been issued for
increasing par values over the past five years. The total par value of issuances for multifamily
housing has tripled between 2012 and 2016. The average par value per private placement has also
increased over the last five years. Multifamily housing is the purpose with the most notable
increase in amount of debt issued and is a sector to monitor in the future. Residential energy and
building of new K-12 facilities are other areas to monitor.
This is consistent with data collected from interviews with various municipalities. With an
increased emphasis on building more affordable housing in the state in the past few years, many
municipalities have increased funding for multifamily housing units.
Are private placements a systemic risk? Currently, the data does not necessarily indicate major
systemic risks with private placements. The principals of private placements are generally
relatively small (median deal size of $5.2 million on par value outstanding) and the amount of debt
issued via private placements is dispersed among a wide variety of lenders. However, some of the
sectors identified above have shifted their primary financing instrument. And given the increase
in deal size in certain sectors, it is possible that the increase in private placements will become
more worrisome in the future.
Page | 19
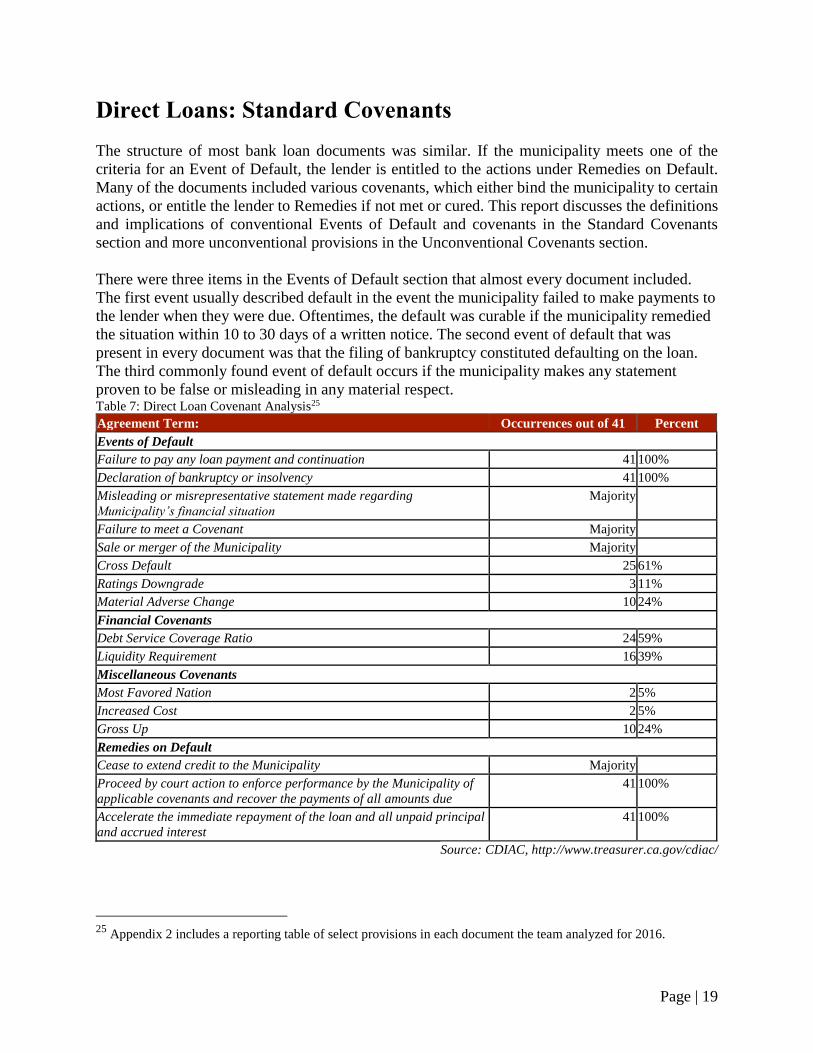
Direct Loans: Standard Covenants
The structure of most bank loan documents was similar. If the municipality meets one of the
criteria for an Event of Default, the lender is entitled to the actions under Remedies on Default.
Many of the documents included various covenants, which either bind the municipality to certain
actions, or entitle the lender to Remedies if not met or cured. This report discusses the definitions
and implications of conventional Events of Default and covenants in the Standard Covenants
section and more unconventional provisions in the Unconventional Covenants section.
There were three items in the Events of Default section that almost every document included.
The first event usually described default in the event the municipality failed to make payments to
the lender when they were due. Oftentimes, the default was curable if the municipality remedied
the situation within 10 to 30 days of a written notice. The second event of default that was
present in every document was that the filing of bankruptcy constituted defaulting on the loan.
The third commonly found event of default occurs if the municipality makes any statement
proven to be false or misleading in any material respect. Table 7: Direct Loan Covenant Analysis25
Agreement Term: Occurrences out of 41 Percent
Events of Default
Failure to pay any loan payment and continuation 41 100%
Declaration of bankruptcy or insolvency 41 100%
Misleading or misrepresentative statement made regarding
Municipality’s financial situation
Majority
Failure to meet a Covenant Majority
Sale or merger of the Municipality Majority
Cross Default 25 61%
Ratings Downgrade 3 11%
Material Adverse Change 10 24%
Financial Covenants
Debt Service Coverage Ratio 24 59%
Liquidity Requirement 16 39%
Miscellaneous Covenants
Most Favored Nation 2 5%
Increased Cost 2 5%
Gross Up 10 24%
Remedies on Default
Cease to extend credit to the Municipality Majority
Proceed by court action to enforce performance by the Municipality of
applicable covenants and recover the payments of all amounts due
41 100%
Accelerate the immediate repayment of the loan and all unpaid principal
and accrued interest
41 100%
Source: CDIAC, http://www.treasurer.ca.gov/cdiac/
25
Appendix 2 includes a reporting table of select provisions in each document the team analyzed for 2016.

Page | 20
However, less frequent and potentially more harmful provisions were found in the Events of
Default, evaluated in Table 7, which shows an inventory of important agreement terms from the
41 loan documents.
One section that was often present in the loan documents was a Financial Covenants Section. When
present, this section contained either a Debt Service Coverage Ratio provision, a Liquidity
Requirement provision, or both. The Municipal Securities Rulemaking Board defines debt service
coverage ratio as the ratio between annual revenues available to pay debt service to the annual debt
service requirement. More simply, the formula is:
Coverage = Available Revenues 26
Debt Service Requirement
From our analysis, 24 of the 41, or 59% of the agreements require the borrower to maintain an
average debt service coverage ratio of 1.21:1, relatively ordinary and comparable to the historical
benchmark of 1.25:1 found with most real estate and commercial loans.27
The liquidity requirement provisions require the borrower to maintain a specific amount of liquid
assets that consisted of a borrower’s immediately available cash, bank deposits, savings accounts,
certificates of deposit, and money market accounts maintained with the municipality. The amount
is often be subject to proportional reduction in the event of optional prepayment. Sixteen of the
41, or 39% of the agreements require the borrower to maintain an average of $3,341,250 of liquid
assets. Generally, neither the debt service coverage ratios nor liquidity requirements appeared
remarkable given the borrower’s agreement to make payments.
Lastly, the Remedies on Default sections were extremely uniform in structure and content. All 41
agreements stated that the lender was entitled to acceleration, which declares the principal
balance of loans immediately due and payable. All Remedies on Default sections also included
Enforcement provisions, which give the lender the right to proceed by court action to enforce
performance and recovery all payments due from the municipality. The vast majority of
documents also gave the lender the right to cease to extend credit to the municipality. This report
finds no issues with these three provisions, not only due to their ubiquity, but because it’s
reasonable to expect that a lender would have enforceable actions like the right to some sort of
legal recourse in the event of a default and the ability to cease extending credit.
26
Glossary of Municipal Securities Terms. (n.d.). Retrieved May 21, 2017, from
http://www.msrb.org/glossary/COVERAGE.aspx 27
Lesonsky, R. (2017, January 03). What is Debt-Service Coverage Ratio? We Explain DSCR Here. Retrieved May
21, 2017, from https://www.fundera.com/blog/debt-service-coverage-ratio
Page | 21
Direct Loans: Unconventional Covenants
Many of the provisions in the Events of Default section could be considered boilerplate. However,
numerous items in the Events of Default section and covenants in other sections are potentially
harmful to investors of public debt, municipalities, and taxpayers are likely unaware of their
existence.
One such clause was cross default, which puts a borrower in default with the lender if it defaults
on another liability or obligation unrelated to the bank loan agreement. Oftentimes, the agreement
only puts the borrower in a state of default if the liability exceeded a certain amount. Cross default
provisions were relatively common, with 61%, 25 of the 41 agreements, containing cross-default
provisions; the most common liability minimum was $100,000 and the average default liability
minimum was $153,750.
The ratings downgrade provision was another clause that could put a municipality at risk. The
provision stipulates that an event of default occurs if S&P, Fitch, or Moody’s assigns to any debt
secured by the borrower’s pledged revenues that is rated below A- (by S&P or Fitch) or A3
(Moody’s Investors Service). Only 7%, or three of the 41 loan documents, included such
provisions, but these provisions can be more complicated than their face value suggests. The fact
that an Event of Default condition can be met through a ratings downgrade is problematic for
borrowers, because they are not directly in control of the factors that lead to their ratings.
For example, a credit rating agency could change its criteria and increase scrutiny on certain types
of issuers or specific types of debt in its review. In 2014, S&P changed the credit ratings and
potentially increased the cost of borrowing of 13 nationwide after evaluating 404 direct loans
totaling $16 billion.28 Hypothetically, a cycle could form in which a rating downgrade by a credit
agency due to the discovery of direct loans could lead the municipality to default on those same
loans.
Another frequent provision was the material adverse effect or material adverse change, found
either as an event of default or as part of the borrower’s reporting requirements in 10 of the 41
documents. A material adverse effect refers to a change in the operations, business, properties,
liabilities, or financial prospects of the municipality that would result in its material impairment to
perform its obligations under any loan document. The problem with such a clause, especially as
an event of default, is that it is broad, unclear, and heavily subject to interpretation as to what
constitutes material change.
In general, the requirements in the Financial Covenants sections, including debt service coverage
ratio and liquidity, as unusual given the municipality’s obligation to make frequent payments.
However, the financial covenants sections were either redacted or explicitly omitted in four of the
agreements, which is concerning if the borrower, bond counsel, or lender did not want the
covenants to be made public.
28
Braun, Martin. (15 October, 2015). “Swift Descent to Junk Shows Buried Risk as Municipal Loans Surge.”
Bloomberg. Retrieved April 20, 2017 from https://www.bloomberg.com/news/articles/2015-10-05/swift-descent-to-
junk-shows-buried-risk-as-municipal-loans-surge
Page | 22
Out of the three main Remedies on Default, including the exercise of legal means to enforce
performance of contract and ceasing to extend credit, acceleration seemed to be the most important
provision. Given that a relatively minor event like a ratings downgrade could trigger a default and
that cross-default provisions are relatively common, the occurrence of a chain reaction for a
municipality is possible. In a worst-case scenario, a ratings downgrade in just one loan agreement
could lead the municipality to default on that agreement, and cross default provisions in other
contracts could cause multiple accelerations, causing severe liquidity strains on a municipality. In
a case like this, the banks could make deals with the municipality with regards to claims on assets
before public bond investors know the borrower is struggling and have a chance to come to the
table.
The language of one miscellaneous covenant, the most favored nation clause (MFN), states that
whenever a municipality signs a new loan agreement with stronger covenants, it must agree to
amend the current bank document and give the current lender the same rights. Only 2 of the 41
loan agreements, or 5%, had this clause and it was associated with larger borrowing amounts.
However, the MFN can pose the same connectivity problem to municipalities the cross default
clause does. If a municipality signed four prior loan agreements that are relatively standard, and a
new lender demands stronger covenants such as a material adverse change counting as an Event
of Default, all the previous agreements get amended with that same language if they contained
MFN clauses.
Another provision that was not included in the three major sections was increased cost. Increased
cost is a type of gross up provision, in which the interest rate the municipality pays is “grossed up”
if a regulatory change lowers the total payment the lender receives. Such a clause protects the
lender from any future regulatory changes that increase funding costs. These risks can consist of
stricter Basel Capital Requirements for banks, higher insurance premiums, or new taxes.29 For
example, the language in one document states that if the federal corporate income tax increases,
the interest rate the municipality pays is subject to adjustment by a margin rate factor. The margin
rate factor is the greater of 1.0 and (1 - Maximum Federal Corporate Income Tax Rate) * 1.58346.
Only two of the 41 loan agreements contained increased cost provisions. However, five times as
many contained some form of language connected to the idea of “grossing up” interest rates in the
event of a tax code change unfavorable to the lender. However, the language was often unclear,
often with no explicit gross up rates and gross up being referenced only in the Definitions sections.
29
Second Amended and Restated Indenture between San Francisco County Transportation Authority and US Bank
National Association as Trustee. (2015). Retrieved May 25, 2017, from http://cdiacdocs.sto.ca.gov/2015-1308.pdf
P. 7, 37
Page | 23
V. Policy Recommendations
The recommendations of this paper are broadly designed to improve the transparency of
California’s municipal market, and by extension, make a case for greater transparency across the
entire nation. Any market can suffer when participants on one side have less information than those
on another. In this case, the market suffers when either municipal bond holders do not have the
information they need to make knowledgeable investments, or bank loans hurt issuers enough that
the market unravels. More transparency and better disclosure practices can greatly improve both
sides of the market.
State Based Reforms
Though requiring direct loan disclosure through the MSRB’s Electronic Municipal Market Access
(EMMA) database, would be ideal, the Tower Amendment prohibits “direct or indirect federal
regulation of municipal issuers.”30 Hence, the federal government is barred from requiring issuers
to file offering documents for bank loans. Due to the low likelihood of a repeal of the Tower
Amendment, it is more realistic to pursue state-based reform.
Increasing Enforcement and Access: The first recommendation for improving disclosure is
increasing enforcement of California’s 2014 law that requires municipalities to report private
placements and direct loans to CDIAC. Though CDIAC suspects that reporting for public offerings
and direct purchases to be over 97% of such transactions; the estimate for direct loans is unknown
and as put in an emailed response, “would simply be a wild guess.” Increasing the number of direct
loans in the database would offer more information to issuers and help evaluate their other
agreements. More information can also help issuers argue for more favorable terms on future loans.
For example, an ideal scenario would enable a less sophisticated issuer to view loan documents
for their purpose of debt or type of financing and obtain an understanding of the type of covenants
that are normal for a new issuance.
CDIAC’s data that is accessible to the public is currently housed in an exportable Excel
spreadsheet. However, the spreadsheet is meant for research purposes and difficult to navigate for
public use. This paper recommends two possible alternatives for simple access to relevant direct
loan covenants. The first is an interactive website that uses a reporting format similar to the one
shown in Appendix 2, in which a viewer could easily see the obligations of a particular
municipality. Even if a municipality had a perfectly good reason to agree to a ratings downgrade
provision, a taxpayer could see and inquire about it. The second method is standardizing the bank
loan documents in such a way that they would be machine readable. Even though the documents
are uploaded as electronic pdfs, the differing structures and terms for the same sections make
machine reading and analysis difficult.
30
NAST Supports Preservation of the Tower Amendment. (2016, October). Retrieved May 29, 2017, from
http://nast.org/wp-content/uploads/2016/10/Tower-Amendment-6915-ONE-PAGER.pdf
National Association of State Treasurers Memorandum
Page | 24
Complying with both proposed initiatives might be time-intensive, but could worth the cost
provided enough interest. Municipalities could benefit from being able to evaluate current and
future loan agreements, investors would gain a better sense of municipal credit quality, and
taxpayers could use the site as a tool to keep their municipalities accountable.
The practical enforcement of the 2014 law may be accomplished through increased activity from
the State of California. The only penalty for not filing debt issuance information with CDIAC is
contained in California Water Code section 20560.2. Under this section, a sale of debt can be
rendered invalid if the issuer does not comply with California Government Code Section 8855(i).
However, the report’s authors know of no instances where the penalty has ever been enforced for
failing to report either public offerings or bank loans. Hence, fines could be one potential way to
raise compliance. However, market-based reforms might prove to be more effective and less
intrusive in increasing reporting. For example, the State of California could build a dynamic online
platform that asks issuers for a one-page summary of all alternative financings.31 If that became a
regular practice, issuers who did not disclose might be penalized through higher pricing. Interviews
with issuers revealed that many respondents had incomplete or unclear understandings of the 2014
law. CDIAC actively reaches out to its constituents to inform of their filing requirements, but it
could increase its marketing efforts and outreach to raise awareness of both the 2014 law’s
reporting requirements and the potential harms of bank loans.
31
Lauren Herrera. (July 2015). “Alternative Financing in the Municipal Market: Financial and Policy
Considerations for Municipal Borrowers.” Retrieved April 17, 2017 from
http://www.treasurer.ca.gov/cdiac/issuebriefs/201507.pdf, p. 4.
Page | 25
Federal Reforms
Requiring Identification Numbers (CUSIP): The second recommendation for improving
municipal market transparency is requiring CUSIPs for private placements. The Committee on
Uniform Security Identification Procedure (CUSIP) is a nine-digit number assigned to all security
issues approved for trading in the US. The bond rating and analyst community like CUSIPs
because they improve the standardization of tagging the securities. All private placements would
have a unique identifier and be in the CUSIP Services Bureau’s centralized database. They help
avoid confusion and ensure that securities transactions are correctly matched and settled.
Requiring CUSIP increases the difficulty for lenders to identify instruments that are truly securities
as “loans.” If a loan turns out to be a security, the dealer needs to be a broker dealer to sell it to
investors. If it is a security, MSRB rules are applicable. Disclosure obligations arise under EMMA
if the loan is a security. The delineating factors are that loan documents should not have typical
securities language. In addition, loan documents generally have covenants, information disclosure
requirements, and transferability restrictions. A CUSIP requirement for private placements might
force lenders to take a harder look when determining debt as a loan or security and act as a piece
in the puzzle in raising the accountability of lenders.
The MSRB has proposed draft amendments to Rule G-34, on “CUSIP Numbers, New Issue and
Market Information Requirements,” that clarify the need that dealers must obtain CUSIP numbers.
The amendments respond to the claim that industry participants like banks do not appear to believe
that CUSIP numbers are required with respect to municipal securities.32 This push at the federal
level moves exactly in the right direction with respect to bank loan identification.
That being said, the MSRB needs to be aware that additional CUSIP assignment could create
reporting and system complexities that result in unintentional disclosure gaps. The National
Federation of Municipal Analysts sent a letter to the MSRB arguing that new CUSIP assignment
for each private debt transaction could realistically cause fewer notices being posted or linked to
the CUSIPs for public debt, increasing the difficulty investors face in obtaining a full risk
assessment.33 With this issue, even though CUSIPs improve transparency, regulators need to be
cautious and make sure bank loans are linked to an issuer’s public debt.
SEC Amendments, Materiality and Financial Obligations: The SEC proposed two draft
amendments to municipal disclosure Rule 15c-12, covered in this report’s background section that
this report supports. These amendments are vital in improving the ability of municipal investors to
assess the fiscal position of issuers. In the current state, lenders obtain the best view of the full
financial situation of issuers, through strict reporting covenants within the agreements. Credit
32
Hume, L. (2017, March 01). MSRB Draft Rules Would Clarify CUSIPs Needed for Private Placements.
Retrieved April 26, 2017, from http://www.bondbuyer.com/news/washington-securities-law/msrb-draft-rules-would-
clarify-cusips-needed-for-private-placements-1126571-1.html 33 Washburn, L., & Egan, J. (31 March, 2017). MSRB Regulatory Notice 2017-05 [Letter to Ronald W. Smith].
National Federation of Municipal Analysts, Pittsburgh, Pennsylvania.
Page | 26
analysts have the second-best view, often learning about direct loans and other private placements
from year-end audits, but not at the time of the loan.34
However, investors of public securities are at a massive disadvantage, because they cannot readily
access information relating to private placements, especially events like defaults and accelerations.
As a result, in a few cases, the contracts have raised credit concerns and ratings have been
downgraded, effectively subjecting only bondholders to the consequences of private events.35
These amendments would reduce this information asymmetry, but the SEC needs to clarify these
rules in order to aid market stability in places like California.
The MSRB needs to create a better definition of events that are “material.” The MSRB may
understandably find it useful to keep the definition of “material” intentionally broad; depending
on the circumstances, a small bank loan may represent a development that is technically “material”
but is much less significant than many other developments relating to the issuer. However, many
market participants complain of the ambiguity of “material” events. If the MSRB does not want to
define the term, state governments can play a larger role in encouraging issuers to post their
disclosure policies, on which investors and other market participants could comment.
There is a growing need for disclosure due to the growing risks that unfunded pension liability
poses to all local governments, both within California and across the country. Municipal Market
Analytics, an independent municipal research firm, states that municipal investors accept that state
and local pension contracts are likely to be considered senior to general obligation and other
unsecured bondholders, and that a government signing a new pension contract should be a
disclosable event to investors because they could cause risk-averse investors to sell their bonds to
more speculative investors. In addition to bank loans, pension obligations need to be explicitly
included in the definition of “financial obligations.” Due to the influx of retirees, lower retirement
age requirements, and low funding rates, pension obligations have been taking up an increasing
amount of space in municipal budgets. The bankruptcies of Stockton and San Bernardino are prime
examples of what can happen when pension obligations become unmanageable. The signing of
new pension contracts as a disclosable event will improve the robustness of municipal markets in
California and nationally.
When you consider a yield on bank’s commercial portfolio. Municipal loans running out 20 and
25 years. Capital havoc on banks. If banks startmoving capital from muni to commercial lending.
It used to be the municipality would approach the bank . $600 million private placements with
banks = maturity range is plus 12 years so it’s big Regulators are stressed out because loans are
starting to get big. Regulators are not able to see the debt covenant.
34
Jacobs, T. (2015, June 07). Moody's: Growth in bank loans and private financing creating information gaps in US
municipal market. Retrieved April 26, 2017, from https://www.moodys.com/research/Moodys-Growth-in-bank
-loans-and-private-financing-creating-information--PR_310660 35
Matt Fabian & Lisa Washburn. (24 April, 2017). Municipal Market Analytics. MMA Weekly Outlook.

Page | 27
Page | 28
Bibliography
Bergstresser, D., & Orr, P. (2014). “Direct Bank Investment in Municipal Debt.” Municipal
Finance Journal., 35, 1.
Braun, Martin. (15 October, 2015). “Swift Descent to Junk Shows Buried Risk as Municipal
Loans Surge.” Bloomberg. Retrieved April 20, 2017 from
https://www.bloomberg.com/news/articles/2015-10-05/swift-descent-to-junk-shows-
buried-risk-as-municipal-loans-surge
California Debt and Investment Advisory Commission. (2017). CDIAC All Data. (February,
2017) [data file] ttps://data.debtwatch.treasurer.ca.gov/Government/CDA-All-Data/yng6-
vaxy
Casey, J. (13 March, 2017). “Lawyers Ask About Carve-Out from CUSIPs for some Private
Placements.” The Bond Buyer. Retrieved April 26, 2017, from
https://www.bondbuyer.com/news/lawyers-ask-about-carve-out-from-cusips-for-some-
private-placements
Columbo, E. M., Deaton, D. M., & Seymour, J. K. (2017, March 13). “Evaluating SEC Plan For
New Municipal Issuer Disclosures.” Law360. Retrieved April 26, 2017, from
https://www.law360.com/articles/899219?scroll=1
Fabian, M. & Washburn, L. (20 March, 2017). “MMA Weekly Outlook.” Municipal Market
Analytics.
Fabian, M. & Washburn, L. (24 April, 2017). “MMA Weekly Outlook.” Municipal Market
Analytics.
Federal Reserve System. (8 December, 2016). Financial Accounts of the United States - Z.1
(L.212, 2016:Q3) [Levels Tables]. Retrieved from
https://www.federalreserve.gov/releases/z1/20161208/html/l212.htm
Government Finance Officers Association (GFOA). (September 2013). “Understanding Bank
Loans.” Retrieved April 20, 2017 from http://gfoa.org/understanding-bank-loans
Hume, L. (01 March, 2017). “SEC to Propose Issuer Disclosures on Bank Loans, Private
Placements.” The Bond Buyer. Retrieved April 26, 2017, from
http://www.bondbuyer.com/news/washington-securities-law/sec-to-propose-issuer-
disclosures-on-bank-loans-private-placements-1126531-1.html
Hume, L. (01 March, 2017). “MSRB Draft Rules Would Clarify CUSIPs Needed for Private
Placements.” The Bond Buyer. Retrieved April 26, 2017, from
http://www.bondbuyer.com/news/washington-securities-law/msrb-draft-rules-would-
clarify-cusips-needed-for-private-placements-1126571-1.html

Page | 29
Hume, L. (03 March, 2017). “SEC Proposal on Bank Loans May Be Far Reaching.” The Bond
Buyer. Retrieved April 26, 2017, from https://www.bondbuyer.com/news/sec-proposal-
on-bank-loans-may-be-far-reaching
Jacobs, T. (07 June, 2015). “Moody's: Growth in bank loans and private financing creating
information gaps in US municipal market.” Retrieved April 26, 2017, from
https://www.moodys.com/research/Moodys-Growth-in-bank-loans-and-private-
financing-creating-information--PR_310660
Lauren Herrera. (July 2015). “Alternative Financing in the Municipal Market: Financial and
Policy Considerations for Municipal Borrowers.” Retrieved April 17, 2017 from
http://www.treasurer.ca.gov/cdiac/issuebriefs/201507.pdf, p. 4.
LeBuhn, James. (25 October, 2011). “Direct Bank Placements.” FitchRatings. Retrieved April
17, 2017 from
https://www.cdfa.net/cdfa/cdfaweb.nsf/0/5329A991CE6FBB1B8825796C00627257/$file
/Fitch.DirectBankPlacements.pdf
Municipal Securities Rulemaking Board (MSRB). (2011). “MSRB Notice 2011-52 (September
2011) Potential Applicability of MSRB Rules to Certain ‘Direct Purchases’ and ‘Bank
Loans’.” Retrieved December 1, 2016 from http://msrb.org/Rules-and-
Interpretations/Regulatory-Notices/2011/2011-52.aspx
Mike Quinn and Todd Smart. (10 March, 2016). “Assessing the Less Contemplated Risks of
Bank Placement Agreements”, The Bond Buyer.
NAST Supports Preservation of the Tower Amendment. (2016, October). Retrieved May 29,
2017, from
http://nast.org/wp-content/uploads/2016/10/Tower-Amendment-6915-ONE-PAGER.pdf
National Association of State Treasurers Memorandum
National Federation of Municipal Analysts (NFMA). (2015). “Recommended Best Practices in
Disclosure for Direct Purchase Bonds, Bank Loans, and Other Bank-Borrower
Agreements.” Retrieved November 30, 2016
from http://www.nfma.org/assets/documents/RBP/rbp_bankloans_615.pdf
Securities Industry and Financial Markets Association (SIFMA). (2013). “White Paper:
Considerations Regarding Voluntary Secondary Market Disclosure About Bank Loans.”
Retrieved April 14, 2017 from http://www.sifma.org/issues/item.aspx?id=8589943360
Second Amended and Restated Indenture between San Francisco County Transportation
Authority and US Bank National Association as Trustee. (2015). Retrieved May 25,
2017, from http://cdiacdocs.sto.ca.gov/2015-1308.pdf, P. 7, 37
Stephens, R. B., Wiener, M. L., & Stevens, D. (12 April, 2017). “Material-Event Disclosures
Under New SEC Proposal.” Law360. Retrieved April 26, 2017, from
Page | 30
https://www.law360.com/articles/912785/material-event-disclosures-under-new-sec-
proposal
Tim Schaefer, Deputy Treasurer for Public Finance, California State Treasurer’s Office, personal
communication, Nov. 21, 2016
Thomas Jacobs. (16 October, 2014). “Growth of Bank Loans and Private Placements Increases
Risk and Reduces Transparency in the Municipal Market.” Retrieved April 20, 2017 from
http://www.vehbfa.org/wp-content/uploads/3d.-Tab-2-Guadagno-Moodys-Growth-of-
Bank-Loans-and-Private-Placements-10-16-14.pdf
Thomas Jacobs, Rachel Cortez, and Deepa Patel. (15 September, 2011). “Direct Bank Loans
Carry Credit Risks Similar to Variable Rate Demand Bonds for Public Finance Issuers.”
Retrieved April 20, 2017 from
http://www.treasurer.ca.gov/cdiac/seminars/2014/20141008/loans.pdf
Washburn, L., & Egan, J. (31 March, 2017). MSRB Regulatory Notice 2017-05 [Letter to
Ronald W. Smith]. National Federation of Municipal Analysts, Pittsburgh, Pennsylvania.
Weber, F., Artin, K., & Deaton, D. (11 April, 2017). Proposed Amendments to Exchange Act
Rule 15c2-12, Comments on the Collection of Information Requirements [Letter to
Shagufta Ahmed & Brent J. Fields]. National Association of Bond Lawyers, Washington,
D.C.

Page | 31
Appendix 1: Interview Questions
Version 1: Municipalities
1) Can you tell us about your job / role?
2) What is the background of the organization?
3) What types of projects has your organization funded with private placement?
4) What is appealing to your organization about private placements?
5) What is the process your organization uses for reporting loans to CDIAC?
6) What types of projects has your organization funded [/considered funding] with
commercial lending?
7) What are obstacles that municipalities encounter in using private placements?
8) What are trends you’ve noticed about private placements?
9) As you know, we are three graduate students and this is the topic area of our practicum
project - what meaningful contribution do you think we could make?
10) Are there other people we should talk to about this?
Version 2: Bond Counsels
1) What are the main priorities/goals of a bond counsel?
2) Do you do the reporting to CDIAC? Do you have any issues with the reporting process?
3) How do you get involved in a transaction? Who are your main clients?
4) How do you go about negotiating terms in a contract?
5) What do you think about acceleration, cross default, and gross up covenants? Do you see
them often? Do bond counsels point out such covenants to issuers?
6) How do municipalities generally view their bank loan agreements? What do they think of
potentially harmful covenants, such as acceleration clauses? Are there municipalities that
are more susceptible to such clauses?
7) What’s the process for the bond counsel for private vs. public placements?
8) What are the legal issues with treating a transaction as a loan vs. security?
9) What trends, if any, do you see among private placements and public offerings regarding
purpose or type of debt?
10) What are your thoughts on issuing CUSIPS for private placements?
Version 3: CDIAC
1) When it comes to non-reporting penalties in California, who enforces the penalty?
2) Can you tell us a little about the background/history for CDIAC's data collection changes
around 2012?
3) Has reporting to CDIAC increased over time, especially after 2012, or has it remained
relatively constant?
4) Even if all California municipal debt is not reported, is it close to a random sample?
What, if any factors, influence the bias?
Version 4: Bank
1) How do the processes for private placements and public offerings work?
2) What are considerations for selecting between private placements and public bonds?
3) What are your thoughts on the criticism of covenants in private placements?

Page | 32
4) What is the underwriter’s role?
5) What prices are the bonds sold at?
6) Is there a concern/risk for diversification of risk from holding leftover bonds?
7) Have you noticed underlying trends with private placements or public offerings in the last
ten years?
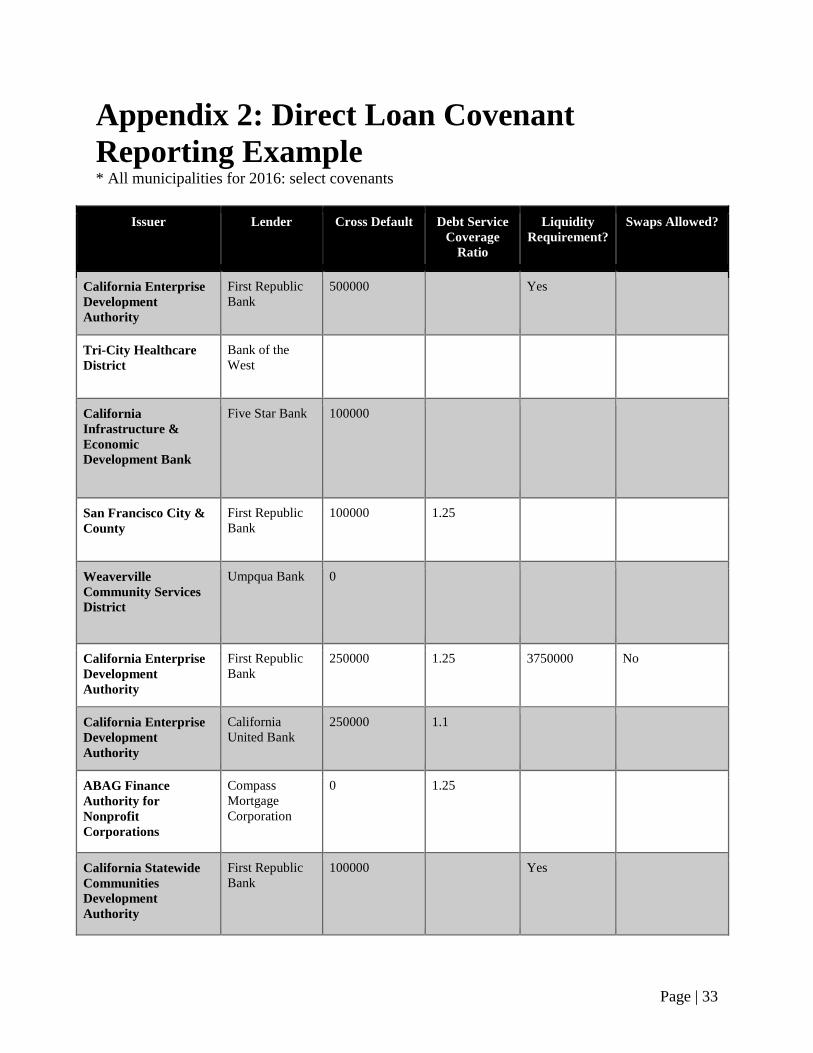
Page | 33
Appendix 2: Direct Loan Covenant
Reporting Example * All municipalities for 2016: select covenants
Issuer Lender Cross Default Debt Service
Coverage
Ratio
Liquidity
Requirement?
Swaps Allowed?
California Enterprise
Development
Authority
First Republic
Bank
500000 Yes
Tri-City Healthcare
District
Bank of the
West
California
Infrastructure &
Economic
Development Bank
Five Star Bank 100000
San Francisco City &
County
First Republic
Bank
100000 1.25
Weaverville
Community Services
District
Umpqua Bank 0
California Enterprise
Development
Authority
First Republic
Bank
250000 1.25 3750000 No
California Enterprise
Development
Authority
California
United Bank
250000 1.1
ABAG Finance
Authority for
Nonprofit
Corporations
Compass
Mortgage
Corporation
0 1.25
California Statewide
Communities
Development
Authority
First Republic
Bank
100000 Yes
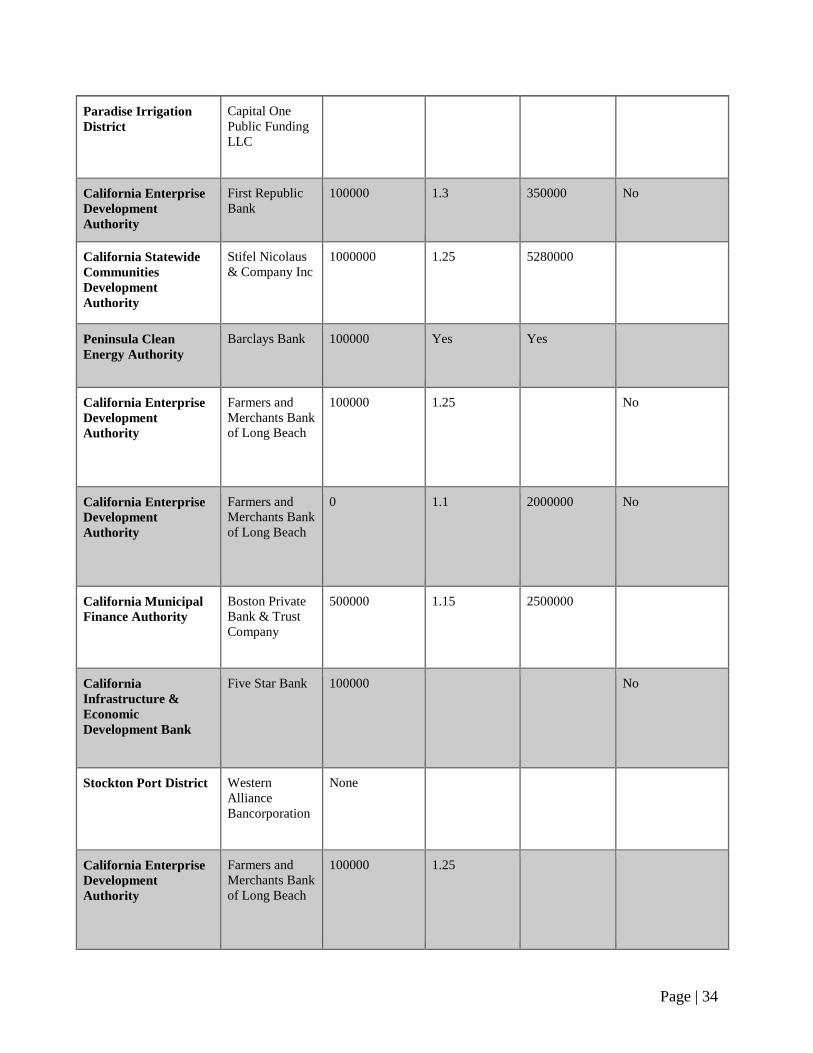
Page | 34
Paradise Irrigation
District
Capital One
Public Funding
LLC
California Enterprise
Development
Authority
First Republic
Bank
100000 1.3 350000 No
California Statewide
Communities
Development
Authority
Stifel Nicolaus
& Company Inc
1000000 1.25 5280000
Peninsula Clean
Energy Authority
Barclays Bank 100000 Yes Yes
California Enterprise
Development
Authority
Farmers and
Merchants Bank
of Long Beach
100000 1.25 No
California Enterprise
Development
Authority
Farmers and
Merchants Bank
of Long Beach
0 1.1 2000000 No
California Municipal
Finance Authority
Boston Private
Bank & Trust
Company
500000 1.15 2500000
California
Infrastructure &
Economic
Development Bank
Five Star Bank 100000 No
Stockton Port District Western
Alliance
Bancorporation
None
California Enterprise
Development
Authority
Farmers and
Merchants Bank
of Long Beach
100000 1.25

Page | 35
California Municipal
Finance Authority
California Bank
& Trust
25000 1.3 Yes
California Municipal
Finance Authority
First Republic
Bank
50000 1.1 10000000
California Enterprise
Development
Authority
First Republic
Bank
100000 1.35 1850000
California Enterprise
Development
Authority
Umpqua Bank 100000
ABAG Finance
Authority for
Nonprofit
Corporations
Compass
Mortgage
Corporation
100000
Anaheim Wells Fargo
Bank National
Association
0 No
California
Infrastructure &
Economic
Development Bank
Farmers and
Merchants Bank
of Long Beach
100000 1.2 1000000
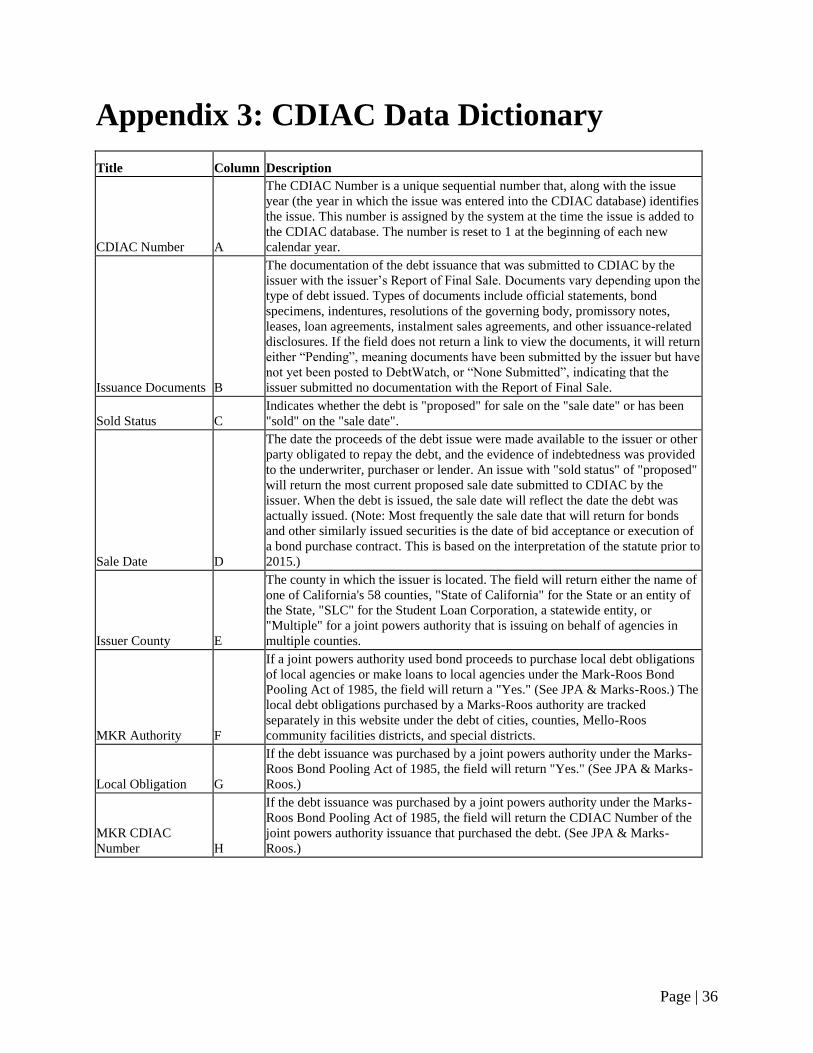
Page | 36
Appendix 3: CDIAC Data Dictionary
Title Column Description
CDIAC Number A
The CDIAC Number is a unique sequential number that, along with the issue
year (the year in which the issue was entered into the CDIAC database) identifies
the issue. This number is assigned by the system at the time the issue is added to
the CDIAC database. The number is reset to 1 at the beginning of each new
calendar year.
Issuance Documents B
The documentation of the debt issuance that was submitted to CDIAC by the
issuer with the issuer’s Report of Final Sale. Documents vary depending upon the
type of debt issued. Types of documents include official statements, bond
specimens, indentures, resolutions of the governing body, promissory notes,
leases, loan agreements, instalment sales agreements, and other issuance-related
disclosures. If the field does not return a link to view the documents, it will return
either “Pending”, meaning documents have been submitted by the issuer but have
not yet been posted to DebtWatch, or “None Submitted”, indicating that the
issuer submitted no documentation with the Report of Final Sale.
Sold Status C
Indicates whether the debt is "proposed" for sale on the "sale date" or has been
"sold" on the "sale date".
Sale Date D
The date the proceeds of the debt issue were made available to the issuer or other
party obligated to repay the debt, and the evidence of indebtedness was provided
to the underwriter, purchaser or lender. An issue with "sold status" of "proposed"
will return the most current proposed sale date submitted to CDIAC by the
issuer. When the debt is issued, the sale date will reflect the date the debt was
actually issued. (Note: Most frequently the sale date that will return for bonds
and other similarly issued securities is the date of bid acceptance or execution of
a bond purchase contract. This is based on the interpretation of the statute prior to
2015.)
Issuer County E
The county in which the issuer is located. The field will return either the name of
one of California's 58 counties, "State of California" for the State or an entity of
the State, "SLC" for the Student Loan Corporation, a statewide entity, or
"Multiple" for a joint powers authority that is issuing on behalf of agencies in
multiple counties.
MKR Authority F
If a joint powers authority used bond proceeds to purchase local debt obligations
of local agencies or make loans to local agencies under the Mark-Roos Bond
Pooling Act of 1985, the field will return a "Yes." (See JPA & Marks-Roos.) The
local debt obligations purchased by a Marks-Roos authority are tracked
separately in this website under the debt of cities, counties, Mello-Roos
community facilities districts, and special districts.
Local Obligation G
If the debt issuance was purchased by a joint powers authority under the Marks-
Roos Bond Pooling Act of 1985, the field will return "Yes." (See JPA & Marks-
Roos.)
MKR CDIAC
Number H
If the debt issuance was purchased by a joint powers authority under the Marks-
Roos Bond Pooling Act of 1985, the field will return the CDIAC Number of the
joint powers authority issuance that purchased the debt. (See JPA & Marks-
Roos.)
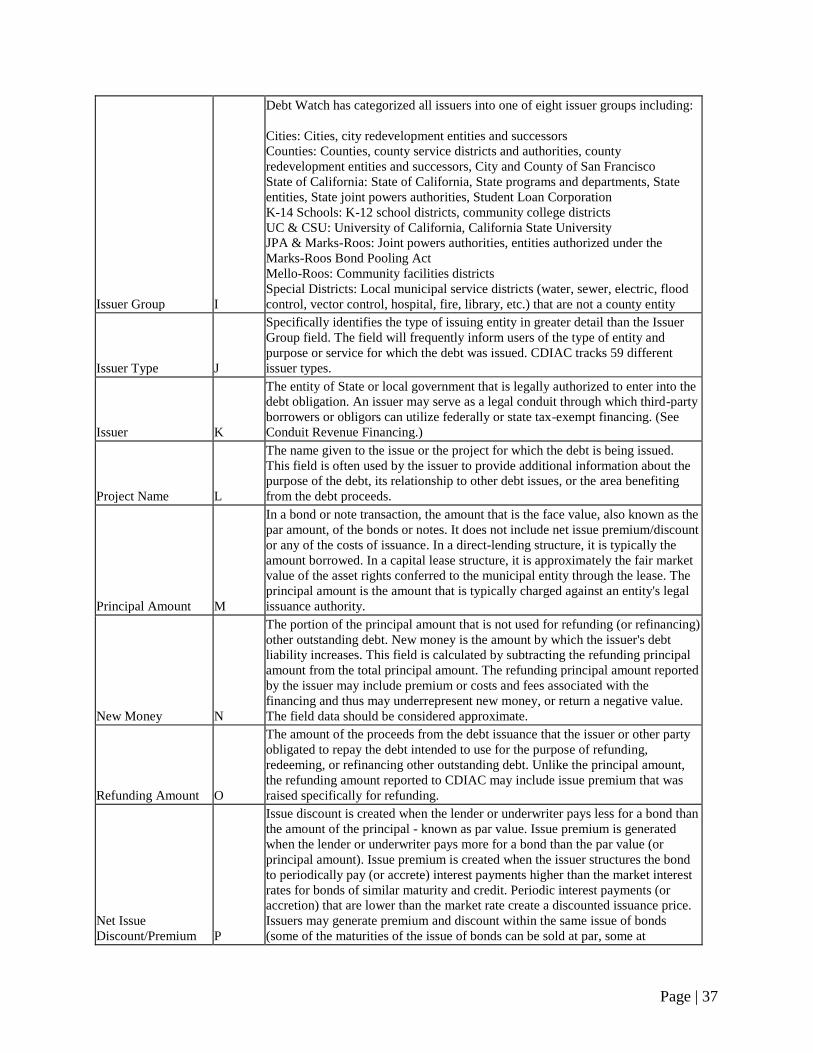
Page | 37
Issuer Group I
Debt Watch has categorized all issuers into one of eight issuer groups including:
Cities: Cities, city redevelopment entities and successors
Counties: Counties, county service districts and authorities, county
redevelopment entities and successors, City and County of San Francisco
State of California: State of California, State programs and departments, State
entities, State joint powers authorities, Student Loan Corporation
K-14 Schools: K-12 school districts, community college districts
UC & CSU: University of California, California State University
JPA & Marks-Roos: Joint powers authorities, entities authorized under the
Marks-Roos Bond Pooling Act
Mello-Roos: Community facilities districts
Special Districts: Local municipal service districts (water, sewer, electric, flood
control, vector control, hospital, fire, library, etc.) that are not a county entity
Issuer Type J
Specifically identifies the type of issuing entity in greater detail than the Issuer
Group field. The field will frequently inform users of the type of entity and
purpose or service for which the debt was issued. CDIAC tracks 59 different
issuer types.
Issuer K
The entity of State or local government that is legally authorized to enter into the
debt obligation. An issuer may serve as a legal conduit through which third-party
borrowers or obligors can utilize federally or state tax-exempt financing. (See
Conduit Revenue Financing.)
Project Name L
The name given to the issue or the project for which the debt is being issued.
This field is often used by the issuer to provide additional information about the
purpose of the debt, its relationship to other debt issues, or the area benefiting
from the debt proceeds.
Principal Amount M
In a bond or note transaction, the amount that is the face value, also known as the
par amount, of the bonds or notes. It does not include net issue premium/discount
or any of the costs of issuance. In a direct-lending structure, it is typically the
amount borrowed. In a capital lease structure, it is approximately the fair market
value of the asset rights conferred to the municipal entity through the lease. The
principal amount is the amount that is typically charged against an entity's legal
issuance authority.
New Money N
The portion of the principal amount that is not used for refunding (or refinancing)
other outstanding debt. New money is the amount by which the issuer's debt
liability increases. This field is calculated by subtracting the refunding principal
amount from the total principal amount. The refunding principal amount reported
by the issuer may include premium or costs and fees associated with the
financing and thus may underrepresent new money, or return a negative value.
The field data should be considered approximate.
Refunding Amount O
The amount of the proceeds from the debt issuance that the issuer or other party
obligated to repay the debt intended to use for the purpose of refunding,
redeeming, or refinancing other outstanding debt. Unlike the principal amount,
the refunding amount reported to CDIAC may include issue premium that was
raised specifically for refunding.
Net Issue
Discount/Premium P
Issue discount is created when the lender or underwriter pays less for a bond than
the amount of the principal - known as par value. Issue premium is generated
when the lender or underwriter pays more for a bond than the par value (or
principal amount). Issue premium is created when the issuer structures the bond
to periodically pay (or accrete) interest payments higher than the market interest
rates for bonds of similar maturity and credit. Periodic interest payments (or
accretion) that are lower than the market rate create a discounted issuance price.
Issuers may generate premium and discount within the same issue of bonds
(some of the maturities of the issue of bonds can be sold at par, some at
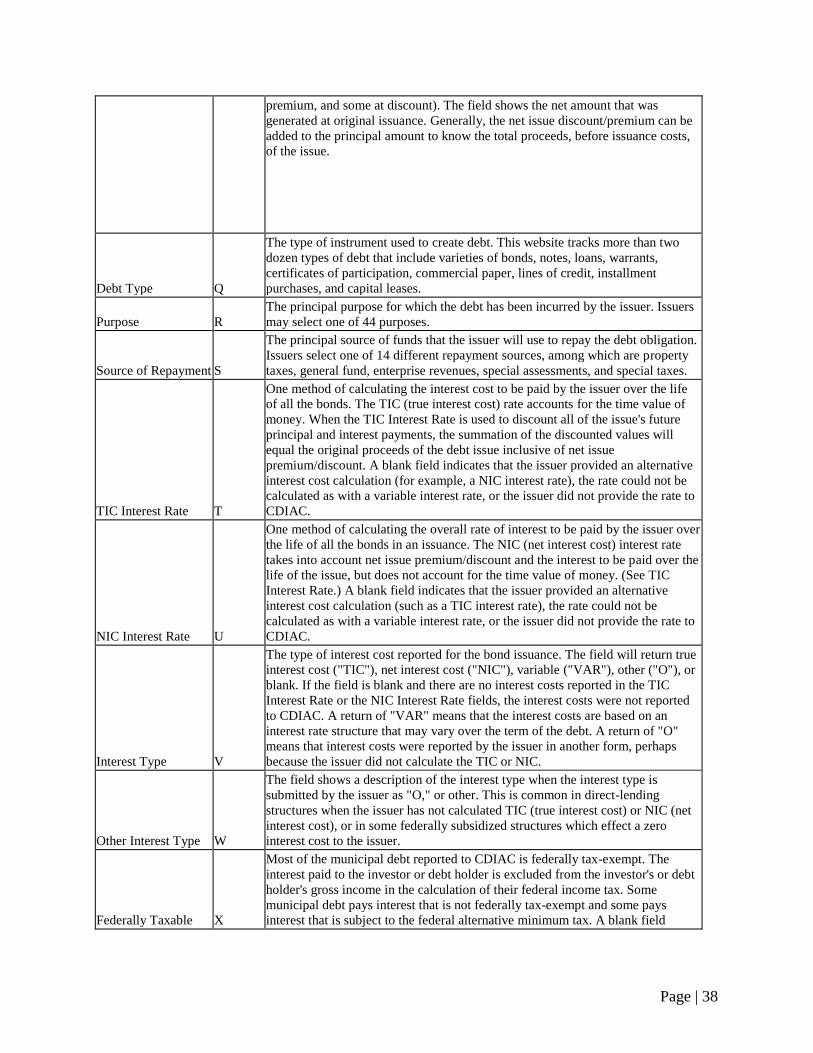
Page | 38
premium, and some at discount). The field shows the net amount that was
generated at original issuance. Generally, the net issue discount/premium can be
added to the principal amount to know the total proceeds, before issuance costs,
of the issue.
Debt Type Q
The type of instrument used to create debt. This website tracks more than two
dozen types of debt that include varieties of bonds, notes, loans, warrants,
certificates of participation, commercial paper, lines of credit, installment
purchases, and capital leases.
Purpose R
The principal purpose for which the debt has been incurred by the issuer. Issuers
may select one of 44 purposes.
Source of Repayment S
The principal source of funds that the issuer will use to repay the debt obligation.
Issuers select one of 14 different repayment sources, among which are property
taxes, general fund, enterprise revenues, special assessments, and special taxes.
TIC Interest Rate T
One method of calculating the interest cost to be paid by the issuer over the life
of all the bonds. The TIC (true interest cost) rate accounts for the time value of
money. When the TIC Interest Rate is used to discount all of the issue's future
principal and interest payments, the summation of the discounted values will
equal the original proceeds of the debt issue inclusive of net issue
premium/discount. A blank field indicates that the issuer provided an alternative
interest cost calculation (for example, a NIC interest rate), the rate could not be
calculated as with a variable interest rate, or the issuer did not provide the rate to
CDIAC.
NIC Interest Rate U
One method of calculating the overall rate of interest to be paid by the issuer over
the life of all the bonds in an issuance. The NIC (net interest cost) interest rate
takes into account net issue premium/discount and the interest to be paid over the
life of the issue, but does not account for the time value of money. (See TIC
Interest Rate.) A blank field indicates that the issuer provided an alternative
interest cost calculation (such as a TIC interest rate), the rate could not be
calculated as with a variable interest rate, or the issuer did not provide the rate to
CDIAC.
Interest Type V
The type of interest cost reported for the bond issuance. The field will return true
interest cost ("TIC"), net interest cost ("NIC"), variable ("VAR"), other ("O"), or
blank. If the field is blank and there are no interest costs reported in the TIC
Interest Rate or the NIC Interest Rate fields, the interest costs were not reported
to CDIAC. A return of "VAR" means that the interest costs are based on an
interest rate structure that may vary over the term of the debt. A return of "O"
means that interest costs were reported by the issuer in another form, perhaps
because the issuer did not calculate the TIC or NIC.
Other Interest Type W
The field shows a description of the interest type when the interest type is
submitted by the issuer as "O," or other. This is common in direct-lending
structures when the issuer has not calculated TIC (true interest cost) or NIC (net
interest cost), or in some federally subsidized structures which effect a zero
interest cost to the issuer.
Federally Taxable X
Most of the municipal debt reported to CDIAC is federally tax-exempt. The
interest paid to the investor or debt holder is excluded from the investor's or debt
holder's gross income in the calculation of their federal income tax. Some
municipal debt pays interest that is not federally tax-exempt and some pays
interest that is subject to the federal alternative minimum tax. A blank field
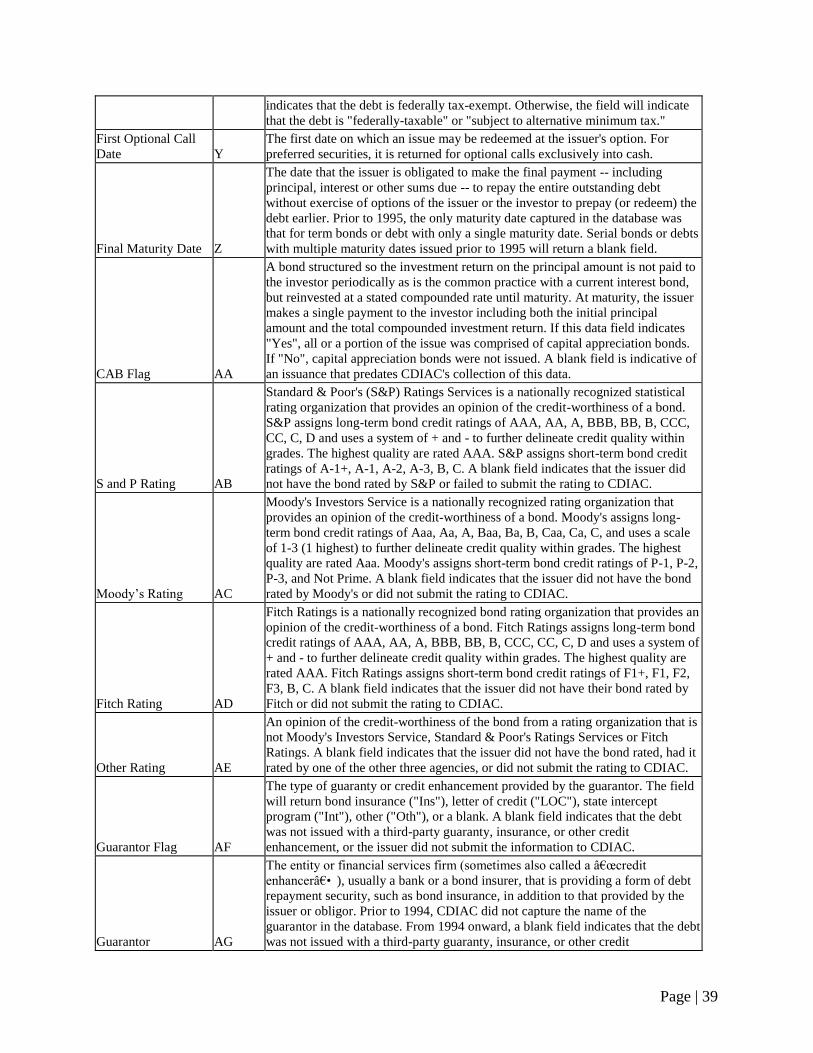
Page | 39
indicates that the debt is federally tax-exempt. Otherwise, the field will indicate
that the debt is "federally-taxable" or "subject to alternative minimum tax."
First Optional Call
Date Y
The first date on which an issue may be redeemed at the issuer's option. For
preferred securities, it is returned for optional calls exclusively into cash.
Final Maturity Date Z
The date that the issuer is obligated to make the final payment -- including
principal, interest or other sums due -- to repay the entire outstanding debt
without exercise of options of the issuer or the investor to prepay (or redeem) the
debt earlier. Prior to 1995, the only maturity date captured in the database was
that for term bonds or debt with only a single maturity date. Serial bonds or debts
with multiple maturity dates issued prior to 1995 will return a blank field.
CAB Flag AA
A bond structured so the investment return on the principal amount is not paid to
the investor periodically as is the common practice with a current interest bond,
but reinvested at a stated compounded rate until maturity. At maturity, the issuer
makes a single payment to the investor including both the initial principal
amount and the total compounded investment return. If this data field indicates
"Yes", all or a portion of the issue was comprised of capital appreciation bonds.
If "No", capital appreciation bonds were not issued. A blank field is indicative of
an issuance that predates CDIAC's collection of this data.
S and P Rating AB
Standard & Poor's (S&P) Ratings Services is a nationally recognized statistical
rating organization that provides an opinion of the credit-worthiness of a bond.
S&P assigns long-term bond credit ratings of AAA, AA, A, BBB, BB, B, CCC,
CC, C, D and uses a system of + and - to further delineate credit quality within
grades. The highest quality are rated AAA. S&P assigns short-term bond credit
ratings of A-1+, A-1, A-2, A-3, B, C. A blank field indicates that the issuer did
not have the bond rated by S&P or failed to submit the rating to CDIAC.
Moody’s Rating AC
Moody's Investors Service is a nationally recognized rating organization that
provides an opinion of the credit-worthiness of a bond. Moody's assigns long-
term bond credit ratings of Aaa, Aa, A, Baa, Ba, B, Caa, Ca, C, and uses a scale
of 1-3 (1 highest) to further delineate credit quality within grades. The highest
quality are rated Aaa. Moody's assigns short-term bond credit ratings of P-1, P-2,
P-3, and Not Prime. A blank field indicates that the issuer did not have the bond
rated by Moody's or did not submit the rating to CDIAC.
Fitch Rating AD
Fitch Ratings is a nationally recognized bond rating organization that provides an
opinion of the credit-worthiness of a bond. Fitch Ratings assigns long-term bond
credit ratings of AAA, AA, A, BBB, BB, B, CCC, CC, C, D and uses a system of
+ and - to further delineate credit quality within grades. The highest quality are
rated AAA. Fitch Ratings assigns short-term bond credit ratings of F1+, F1, F2,
F3, B, C. A blank field indicates that the issuer did not have their bond rated by
Fitch or did not submit the rating to CDIAC.
Other Rating AE
An opinion of the credit-worthiness of the bond from a rating organization that is
not Moody's Investors Service, Standard & Poor's Ratings Services or Fitch
Ratings. A blank field indicates that the issuer did not have the bond rated, had it
rated by one of the other three agencies, or did not submit the rating to CDIAC.
Guarantor Flag AF
The type of guaranty or credit enhancement provided by the guarantor. The field
will return bond insurance ("Ins"), letter of credit ("LOC"), state intercept
program ("Int"), other ("Oth"), or a blank. A blank field indicates that the debt
was not issued with a third-party guaranty, insurance, or other credit
enhancement, or the issuer did not submit the information to CDIAC.
Guarantor AG
The entity or financial services firm (sometimes also called a “credit
enhancer―), usually a bank or a bond insurer, that is providing a form of debt
repayment security, such as bond insurance, in addition to that provided by the
issuer or obligor. Prior to 1994, CDIAC did not capture the name of the
guarantor in the database. From 1994 onward, a blank field indicates that the debt
was not issued with a third-party guaranty, insurance, or other credit
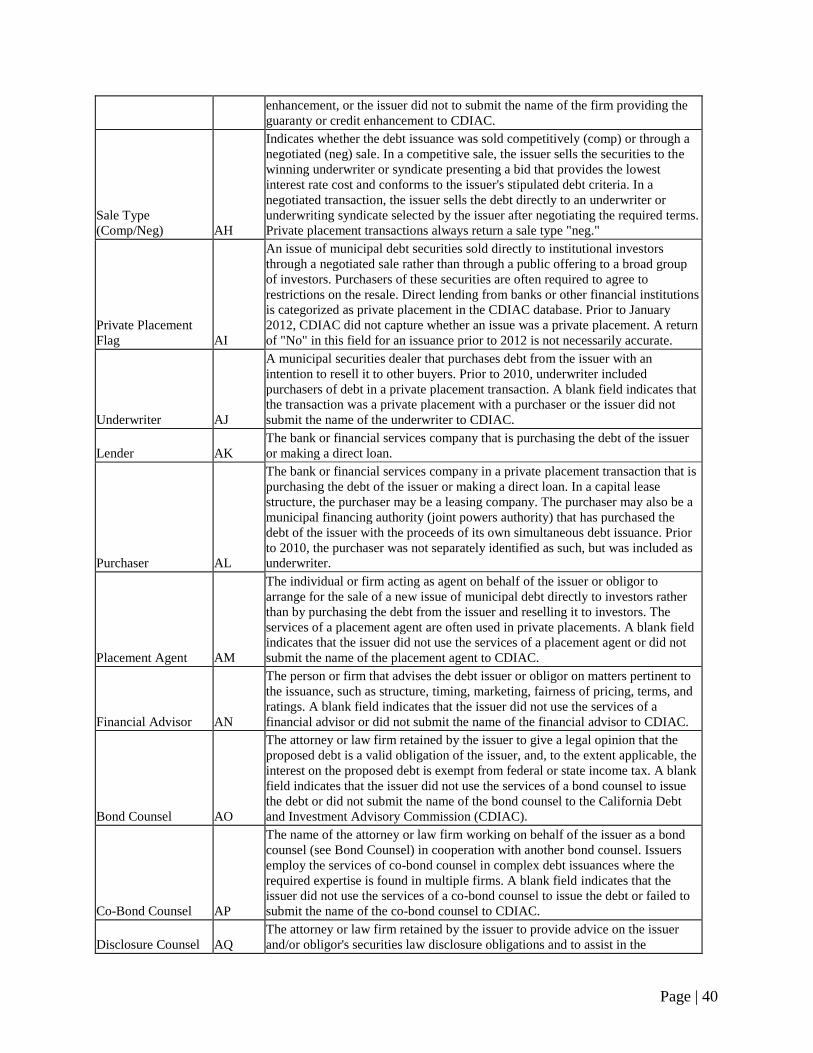
Page | 40
enhancement, or the issuer did not to submit the name of the firm providing the
guaranty or credit enhancement to CDIAC.
Sale Type
(Comp/Neg) AH
Indicates whether the debt issuance was sold competitively (comp) or through a
negotiated (neg) sale. In a competitive sale, the issuer sells the securities to the
winning underwriter or syndicate presenting a bid that provides the lowest
interest rate cost and conforms to the issuer's stipulated debt criteria. In a
negotiated transaction, the issuer sells the debt directly to an underwriter or
underwriting syndicate selected by the issuer after negotiating the required terms.
Private placement transactions always return a sale type "neg."
Private Placement
Flag AI
An issue of municipal debt securities sold directly to institutional investors
through a negotiated sale rather than through a public offering to a broad group
of investors. Purchasers of these securities are often required to agree to
restrictions on the resale. Direct lending from banks or other financial institutions
is categorized as private placement in the CDIAC database. Prior to January
2012, CDIAC did not capture whether an issue was a private placement. A return
of "No" in this field for an issuance prior to 2012 is not necessarily accurate.
Underwriter AJ
A municipal securities dealer that purchases debt from the issuer with an
intention to resell it to other buyers. Prior to 2010, underwriter included
purchasers of debt in a private placement transaction. A blank field indicates that
the transaction was a private placement with a purchaser or the issuer did not
submit the name of the underwriter to CDIAC.
Lender AK
The bank or financial services company that is purchasing the debt of the issuer
or making a direct loan.
Purchaser AL
The bank or financial services company in a private placement transaction that is
purchasing the debt of the issuer or making a direct loan. In a capital lease
structure, the purchaser may be a leasing company. The purchaser may also be a
municipal financing authority (joint powers authority) that has purchased the
debt of the issuer with the proceeds of its own simultaneous debt issuance. Prior
to 2010, the purchaser was not separately identified as such, but was included as
underwriter.
Placement Agent AM
The individual or firm acting as agent on behalf of the issuer or obligor to
arrange for the sale of a new issue of municipal debt directly to investors rather
than by purchasing the debt from the issuer and reselling it to investors. The
services of a placement agent are often used in private placements. A blank field
indicates that the issuer did not use the services of a placement agent or did not
submit the name of the placement agent to CDIAC.
Financial Advisor AN
The person or firm that advises the debt issuer or obligor on matters pertinent to
the issuance, such as structure, timing, marketing, fairness of pricing, terms, and
ratings. A blank field indicates that the issuer did not use the services of a
financial advisor or did not submit the name of the financial advisor to CDIAC.
Bond Counsel AO
The attorney or law firm retained by the issuer to give a legal opinion that the
proposed debt is a valid obligation of the issuer, and, to the extent applicable, the
interest on the proposed debt is exempt from federal or state income tax. A blank
field indicates that the issuer did not use the services of a bond counsel to issue
the debt or did not submit the name of the bond counsel to the California Debt
and Investment Advisory Commission (CDIAC).
Co-Bond Counsel AP
The name of the attorney or law firm working on behalf of the issuer as a bond
counsel (see Bond Counsel) in cooperation with another bond counsel. Issuers
employ the services of co-bond counsel in complex debt issuances where the
required expertise is found in multiple firms. A blank field indicates that the
issuer did not use the services of a co-bond counsel to issue the debt or failed to
submit the name of the co-bond counsel to CDIAC.
Disclosure Counsel AQ
The attorney or law firm retained by the issuer to provide advice on the issuer
and/or obligor's securities law disclosure obligations and to assist in the
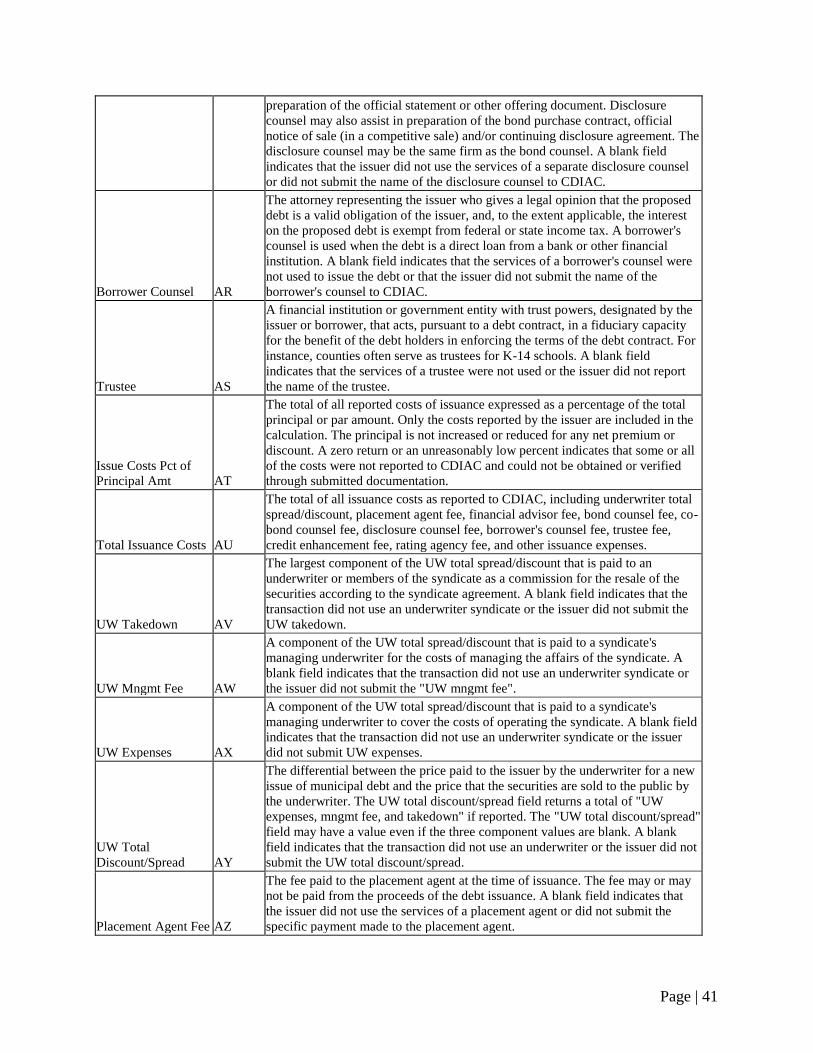
Page | 41
preparation of the official statement or other offering document. Disclosure
counsel may also assist in preparation of the bond purchase contract, official
notice of sale (in a competitive sale) and/or continuing disclosure agreement. The
disclosure counsel may be the same firm as the bond counsel. A blank field
indicates that the issuer did not use the services of a separate disclosure counsel
or did not submit the name of the disclosure counsel to CDIAC.
Borrower Counsel AR
The attorney representing the issuer who gives a legal opinion that the proposed
debt is a valid obligation of the issuer, and, to the extent applicable, the interest
on the proposed debt is exempt from federal or state income tax. A borrower's
counsel is used when the debt is a direct loan from a bank or other financial
institution. A blank field indicates that the services of a borrower's counsel were
not used to issue the debt or that the issuer did not submit the name of the
borrower's counsel to CDIAC.
Trustee AS
A financial institution or government entity with trust powers, designated by the
issuer or borrower, that acts, pursuant to a debt contract, in a fiduciary capacity
for the benefit of the debt holders in enforcing the terms of the debt contract. For
instance, counties often serve as trustees for K-14 schools. A blank field
indicates that the services of a trustee were not used or the issuer did not report
the name of the trustee.
Issue Costs Pct of
Principal Amt AT
The total of all reported costs of issuance expressed as a percentage of the total
principal or par amount. Only the costs reported by the issuer are included in the
calculation. The principal is not increased or reduced for any net premium or
discount. A zero return or an unreasonably low percent indicates that some or all
of the costs were not reported to CDIAC and could not be obtained or verified
through submitted documentation.
Total Issuance Costs AU
The total of all issuance costs as reported to CDIAC, including underwriter total
spread/discount, placement agent fee, financial advisor fee, bond counsel fee, co-
bond counsel fee, disclosure counsel fee, borrower's counsel fee, trustee fee,
credit enhancement fee, rating agency fee, and other issuance expenses.
UW Takedown AV
The largest component of the UW total spread/discount that is paid to an
underwriter or members of the syndicate as a commission for the resale of the
securities according to the syndicate agreement. A blank field indicates that the
transaction did not use an underwriter syndicate or the issuer did not submit the
UW takedown.
UW Mngmt Fee AW
A component of the UW total spread/discount that is paid to a syndicate's
managing underwriter for the costs of managing the affairs of the syndicate. A
blank field indicates that the transaction did not use an underwriter syndicate or
the issuer did not submit the "UW mngmt fee".
UW Expenses AX
A component of the UW total spread/discount that is paid to a syndicate's
managing underwriter to cover the costs of operating the syndicate. A blank field
indicates that the transaction did not use an underwriter syndicate or the issuer
did not submit UW expenses.
UW Total
Discount/Spread AY
The differential between the price paid to the issuer by the underwriter for a new
issue of municipal debt and the price that the securities are sold to the public by
the underwriter. The UW total discount/spread field returns a total of "UW
expenses, mngmt fee, and takedown" if reported. The "UW total discount/spread"
field may have a value even if the three component values are blank. A blank
field indicates that the transaction did not use an underwriter or the issuer did not
submit the UW total discount/spread.
Placement Agent Fee AZ
The fee paid to the placement agent at the time of issuance. The fee may or may
not be paid from the proceeds of the debt issuance. A blank field indicates that
the issuer did not use the services of a placement agent or did not submit the
specific payment made to the placement agent.

Page | 42
Financial Advisor
Fee BA
The fee paid to the financial advisor at the time of issuance. The fee may or may
not be paid from the proceeds of the debt issuance. A blank field indicates that
the issuer did not use the services of a financial advisor or did not submit the
specific payment made to the financial advisor.
Bond Counsel Fee BB
The fee paid to the bond counsel firm at the time of issuance. The fee may or
may not be paid from the proceeds of the debt issuance. A blank field indicates
that the issuer did not use the services of a bond counsel or did not submit the
specific payment made to the bond counsel.
Co-Bond Counsel
Fee BC
The fee paid by the issuer to the bond counsel firm at the time of issuance. The
fee may or may not be paid from the proceeds of the debt issuance. A blank field
indicates that the issuer did not use the services of a co-bond counsel or failed to
submit the specific payment made to the co-bond counsel.
Disclosure Counsel
Fee BD
The fee paid to the disclosure counsel firm at the time of issuance. The fee may
or may not be paid from the proceeds of the debt issuance. A blank field
indicates that the issuer did not use the services of a disclosure counsel or did not
submit the specific payment made to the disclosure counsel.
Borrower Counsel
Fee BE
The fee paid by the issuer to its counsel at the time of issuance. The fee may or
may not be paid from the proceeds of the debt issuance. A blank field indicates
that the services of a borrower's counsel were not used to issue the debt or that
the issuer did not submit the specific payment made to the borrower's counsel.
Trustee Fee BF
The fee paid to the trustee at the time of issuance. The fee may or may not be
paid from the proceeds of the debt issuance. A blank field indicates that the
issuer did not use the services of a trustee or failed to submit the specific
payment made to the trustee.
Credit Enhancement
Fee BG
The fee paid by the issuer (or conduit borrower or obligor) to a financial services
firm, usually a bank or a bond insurer, to provide debt repayment security in
addition to that provided by the issuer or obligor. The fee may or may not be paid
from the proceeds of the debt issuance. A blank field indicates that the debt was
not issued with a third-party guaranty, insurance, or other credit enhancement or
the issuer failed to submit the specific amount paid for the credit enhancement.
Rating Agency Fee BH
The fees paid by the issuer at the time of issuance to the rating agencies that have
rendered their opinion of the credit-worthiness of the bond. The fee may or may
not be paid from the proceeds of the debt issuance. A blank field indicates an
unrated bond issuance or that the issuer did not submit the specific payment
made to the rating agencies.
Other Issuance
Expenses BI
Expenses paid at the time of issuance for services directly associated with the
issuance of the debt that are not paid to the underwriter, bond counsel, borrower's
counsel, disclosure counsel, rating agency, guarantor, financial advisor,
placement agent, or trustee. The expenses may or may not be paid from the
proceeds of the debt issuance.