Embed Size (px)
Citation preview
Private Information Trading
and Corporate Governance In Emerging Markets
Olesya V. Grishchenko, Lubomir P. Litov and Jianping Mei1
January 2003
Abstract
This paper develops a new approach to extract information on corporate
governance in emerging markets based on trading data. We apply the theoretical
framework of Llorente, Michaely, Saar, and Wang (2002) to analyze the relation
between daily volume and first-order return autocorrelation for individual stocks in
emerging markets. We find strong evidence of return continuation following high
volume days, suggesting the presence of private information trading for many
emerging market stocks. We discover that private information trading is especially
strong around major corporate event dates. In addition, we find stocks that provide
better investor protection and information disclosure exhibit less private information
trading. These results suggest return autocorrelation and trading volume carry useful
information about corporate governance in emerging market.
1 Doctoral students and associate professor of finance at New York University. Please send inquiries to
Jianping Mei, Department of International Business, Stern School, 44 West 4th Street, New York, NY
10012-1126. Tel: 212-998-0354, Fax: 212-998-4221. Email: [email protected]. We like to thank John
Campbell, Hyuk Choe, Robert Engle, Kent Hargis, Joel Hasbrouck, Stas Kolenikov, Gideon Saar, Gil
Schorr, Jiang Wang, Robert Whitelaw, Daniel Wolfenzon, participants at NYU Monday Finance
Workshop, Hong Kong UST seminar as well as the China Center for Financial Research 2002 conference,
European Financial Management Association Meetings 2002 at London and European Finance Association
Meetings 2002 at Berlin for helpful discussions and comments. We are grateful to Rebecca Pei for her
excellent research support. We also like to acknowledge that Emerging Market Finance Institute has
provided some financial support to this research.
1
Private Information Trading and
Corporate Governance In Emerging Markets
Abstract
This paper develops a new approach to extract information on corporate
governance in emerging markets based on trading data. We apply the theoretical
framework of Llorente, Michaely, Saar, and Wang (2002) to analyze the relation
between daily volume and first-order return autocorrelation for individual stocks in
emerging markets. We find strong evidence of return continuation following high
volume days, suggesting the presence of private information trading for many
emerging market stocks. We discover that private information trading is especially
strong around major corporate event dates. In addition, we find stocks that provide
better investor protection and information disclosure exhibit less private information
trading. These results suggest return autocorrelation and trading volume carry useful
information about corporate governance in emerging market.
2
1. Introduction
It is not enough for the playing field to be level. Perhaps even more important, it must
also be visible. The late 1990s stock market boom and its aftermath have shown that even
in the United States - with extensive insider-trading laws, outside auditors, and a host of
other regulatory features to protect investors - large parts of the playing field are simply
hidden from view2. Thus, for example, many brokerage firms maintained public buy
recommendations on companies their analysts were quietly disparaging to a favored
subset of clients3. Relatedly, there has been widespread manipulation of earnings by
corporations. These factors have dealt a serious blow to investor trust in securities
markets in the United States and contributed to a bear market. In Southeast Asia, the
durability of crony capitalism continues to plague the region's markets. All this suggests
that the rule of law and investor rights - which we term "corporate governance" - is of
primary importance to investment returns.
A major difficulty in studying corporate governance is the lack of quality
information. This is especially true in emerging markets, where there are fewer disclosure
rules, much less enforcement of insider trading laws, poor protection of minority
shareholder rights, unequal treatment of foreign and domestic shareholders, and a
generally underdeveloped legal and regulatory environment. Moreover, disclosed
information, including analyst reports, often is subject to manipulation. Corporate
governance problems are even more pervasive in emerging markets due to poor
protection of the minority shareholder rights, unequal treatment of foreign and domestic
stockholders, and underdeveloped legal and regulatory environment. To protect
themselves against corporate predators, investors in emerging markets need to find
alternative source of information on corporate governance. 2 Recently the New York State attorney general has made numerous investigations into leading Wall Street firms for issuing inflated investment ratings and offering “hot” IPOs in turn for investment banking business from telecom companies. Several CEOs from once high-flying companies have been indicted or have pleaded guilty to outright stealing from shareholders. 3Hayes (1998), Lim (2001), and Michaely and Womack (1999) have shown that information is manipulated in order to drum up investment banking business, to maintain access to information, or to stimulate trading by investors. (For example, numerous telecom analysts were alleged or found to have inflated earnings forecasts for companies such as Global Crossing, Quest, WorldCom and Winstar. Despite mounting loss and falling revenues, many continued their buy recommendation for investors until their bankruptcy.)
3
This paper contributes to the literature by establishing a relationship between
return autocorrelation and private information trading. Our paper is based on a dynamic
volume-return model of Llorente, Michaely, Saar, and Wang (2002, LMSW hereafter).
The essence of the model is that intensive trading volume together with stock return
autocorrelation can help us identify firms with a high degree of trading based on private
information - that is, information that has not been disseminated to the public. Private
information here includes both "insider" information and information not available to the
general public. Using US data, LMSW show that the differences in the dynamics of
returns and volume across stocks are closely associated with different degrees of
information asymmetry. This paper extends their work to measure the degree of
information asymmetry in emerging market stocks. We will implicitly control for market
microstructure effects such as bid-ask spread, poor liquidity, and nonsynchronous trading.
Another goal of this study is to establish a link between a measure of private
information trading and various indicators of corporate governance quality. Intuitively,
informational asymmetry is related to the quality of corporate governance and information
disclosure. Therefore, the intensity of private information trading is a useful indicator for
identifying corporate governance problems at both macro- and micro-levels. We examine
how the regulatory environment in the emerging markets’ countries affects informational
trading. We also study the relation between intensity of private information trading and
company-specific indicators of investor rights protection. We find that stocks in countries
that enforce insider-trading law, have higher standards of information disclosure, and
provide better investor protection exhibit less private information trading. By using trading
data, our study provides more rigorous results than if it had relied on accounting data,
which can vary greatly in quality across different markets.
The paper is related to several studies that have investigated the effects of various
types of information asymmetry on foreign equity holdings. These asymmetries tend to
scare away foreign investment and thus drive up the cost of capital. Bhattacharya, Daouk,
and Welker (2003) show that earnings management in a country is linked to a decrease in
trading in the stock market of that country, and is weakly linked to an increase in US
home bias toward that country. They also point out that the practice of earnings
management makes it harder for foreign investors to obtain relevant information about
4
emerging market firms. Brennan and Cao (1997) also demonstrate that a disadvantage in
information might help explain investors’ home bias. Bhattacharya, Daouk, Jorgenson,
and Kehr (2000) show that the presence of unrestricted insider trading has caused prices
to fully incorporate firm information before its public release in Mexico. Bhattacharya
and Daouk (2002) discuss how the lack of prosecution of inside trading creates a
hazardous investment environment for foreign investors in emerging markets.
Albuquerque, Bauer, and Schneider (2001) also develop a framework for characterizing
asymmetric information in international equity markets.
Our work also builds on a growing literature on return autocorrelation and
turnover. Harvey (1995a) was first to examine the determinants of return autocorrelation
in emerging market indices. He documented that a lack of diversification and trading
depth induces spurious serial correlation in some countries but noted that more needs to
done to explain the return autocorrelation. Rouwenhorst (1999) finds that return factors
and turnover are related in emerging markets. However, the focus of his study is on
liquidity issues. We extend a large body of literature on emerging-market asset pricing by
studying daily (high-frequency) trading data at the firm level. Most previous studies -
including Bailey and Lim (1992), Bekaert and Harvey (1995, 1997, 2000), Bekaert,
Harvey, and Ng (2002), Harvey (1995a, 1995b), and Henry (1999, 2000) - use monthly
(low-frequency) data. Moreover, by relying on turnover rather than accounting data, our
data enjoy a high degree of transparency and uniformity across different markets, which
makes it easier for cross-country comparison. We measure turnover by the number of
shares traded rather than by their value.
The paper is organized as follows. Section 2 describes the methodology for
measuring private-information trading after controlling for microstructure effects and the
data. Empirical results on the extent of informational trading are then presented in
Section 3. Section 4 relates such trading to aspects of corporate governance, with private-
information trading around corporate events and corporate governance issues in Russia
receiving special attention. We conclude with some caveats and topics for further
research in Section 5.
5
2. Methodology
This section briefly introduces the LMSW model, in which investors trade for both
hedging and information reasons. We use the model to demonstrate how the dynamic
relation between return and volume depends on the information asymmetry between
investors. Because the goal here is just to establish the intuition behind our study, we will
simply describe the economy and provide the theoretical results. Interested readers are
referred to the original paper of LMSW.
The economy is defined on a discrete time sequence and there are two traded
securities, a riskless bond and a stock. The bond is in unlimited supply at a constant non-
negative interest rate. The stock’s dividend at the end of the time period is the sum of
two components and G :
1+tD
ttF t tt GFD +=+1
.2,1, =iZ it
. There are two classes of investors. Investors
are identical within each class, but are different in their endowments and information.
Both groups observe , but group 1 has an information advantage of also observing G .
The degree of informational asymmetry is measured using a standard deviation of second
signal . In addition, investors are also endowed with a non-traded asset with payoff ,
and the random endowment Investors maximize their expected utility over the
next period wealth using a common exponential utility function conditional on their
respective information set. All shocks to the economy are normally distributed with zero
mean and constant variances. In addition, they are assumed to be mutually independent,
except for the payoff to non-traded asset and dividend on the stock, which are correlated.
tF t
tN2Gσ
LMSW point out that the model provides two important motives for trading:
hedging risk and speculation on future returns by informed investors. All investors hold
both stock and non-traded asset in their portfolios. Because the returns on the two assets
are correlated, as holdings of the non-traded asset change, each investor wants to adjust his
stock positions to maintain an optimal risk exposure. This generates hedging trade in the
model. On the other hand, some investors might have private information about future
stock returns. As new private information arrives, they take speculative positions in the
stock, which generates informational trade in the model.
LMSW solve for the equilibrium stock price and trading volume by providing the
following dynamic volume-return relationship:
6
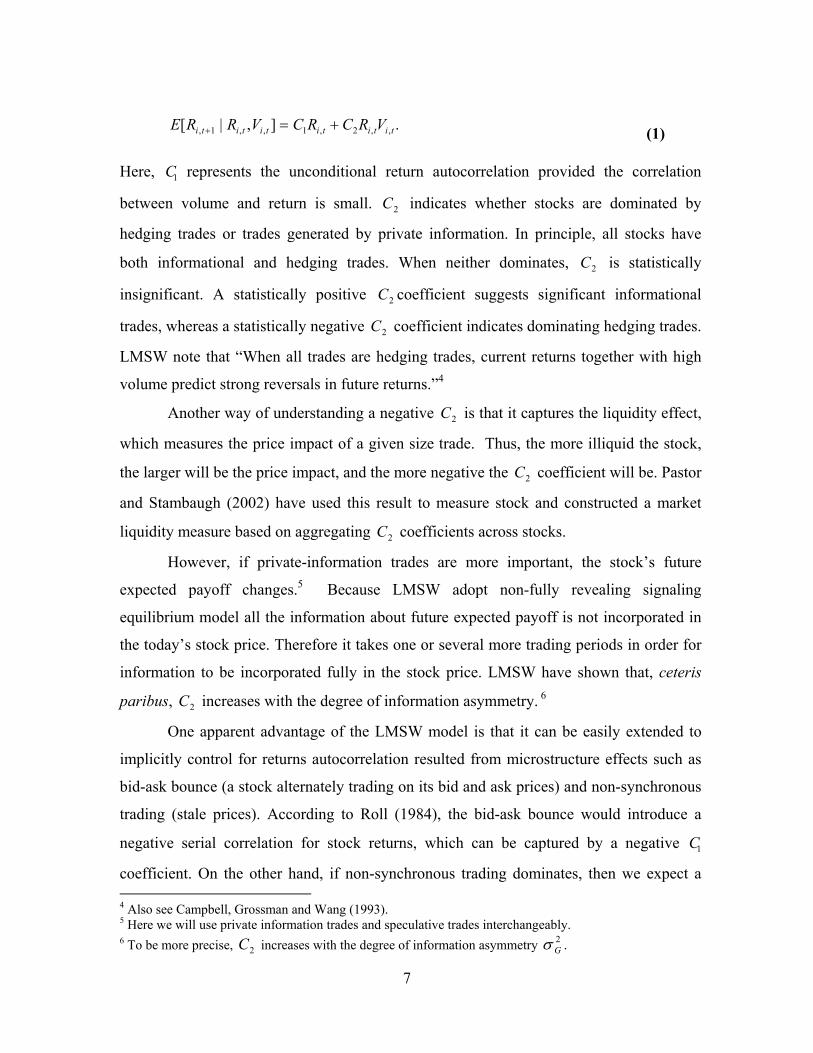
.],|[ ,,2,1,,1, titititititi VRCRCVRRE +=+ (1) Here, 1 represents the unconditional return autocorrelation provided the correlation
between volume and return is small. indicates whether stocks are dominated by
hedging trades or trades generated by private information. In principle, all stocks have
both informational and hedging trades. When neither dominates, is statistically
insignificant. A statistically positive C coefficient suggests significant informational
trades, whereas a statistically negative C coefficient indicates dominating hedging trades.
LMSW note that “When all trades are hedging trades, current returns together with high
volume predict strong reversals in future returns.”
C
2C
2
2
2C
4
Another way of understanding a negative C is that it captures the liquidity effect,
which measures the price impact of a given size trade. Thus, the more illiquid the stock,
the larger will be the price impact, and the more negative the C coefficient will be. Pastor
and Stambaugh (2002) have used this result to measure stock and constructed a market
liquidity measure based on aggregating coefficients across stocks.
2
2
2C
However, if private-information trades are more important, the stock’s future
expected payoff changes.5 Because LMSW adopt non-fully revealing signaling
equilibrium model all the information about future expected payoff is not incorporated in
the today’s stock price. Therefore it takes one or several more trading periods in order for
information to be incorporated fully in the stock price. LMSW have shown that, ceteris
paribus, increases with the degree of information asymmetry.2C 6
One apparent advantage of the LMSW model is that it can be easily extended to
implicitly control for returns autocorrelation resulted from microstructure effects such as
bid-ask bounce (a stock alternately trading on its bid and ask prices) and non-synchronous
trading (stale prices). According to Roll (1984), the bid-ask bounce would introduce a
negative serial correlation for stock returns, which can be captured by a negative C
coefficient. On the other hand, if non-synchronous trading dominates, then we expect a
1
4 Also see Campbell, Grossman and Wang (1993). 5 Here we will use private information trades and speculative trades interchangeably. 6 To be more precise, increases with the degree of information asymmetry . 2C 2
Gσ
7

positive serial correlation for stock returns, which can be captured by a positive C
coefficient. could also be positive if there is short-term price momentum or negative if
there is a reversal.
1
1C
1 =
VOL
In this paper, we estimate equation (1) and measure the intensity of asymmetric
information in emerging market stocks. Following LMSW, we make several modifications
of the theoretical model for empirical analysis. The theoretical model uses dollar returns
per share and normalized volume, while we use log returns (because stock prices in
emerging markets are not stationary) and detrended log turnover as in LMSW. We begin
by estimating the following regression derived from equation (1):
.1,,,2,10, ++ +++ tititititi VRCRCCR ε (2)
We use daily continuously compounded return and trading volume for the estimation of
(2). Following earlier studies, such as LMSW and Stickel and Verrecchia (1994), we
define continuously compounded return as ))log(( 1,,, −+= tiittiti PDPR , and volume as
∑=
−−−=20
1,,,,, ),log(20
1)log(j
jtijtitititi NVOLNV
tiVOL ,
where is the daily close price,
is the daily number of shares traded, and the total number of outstanding
shares in day t for company i.
tiP ,
tiN ,
Detrended daily turnover is used as a measure of trading volume for individual
stocks. Lo and Wang (2000) provide theoretical justification for using daily turnover as a
proxy for the trading volume of individual stocks. We found that daily time series of
turnover are nonstationary, so we measure turnover in logs and detrend the series.
Following LMSW, we change zero trading volume to a small constant 0.00000255 before
taking logs and detrend resulting series by subtracting 20-day moving average7.
We assume the error term in equation (2) is uncorrelated over time, but its variance
may vary.8 We also examine the dynamic volume-return relationship by using excess
returns and excess turnover. Our objective is to remove the market effect and concentrate
7 We also detrend series by 60-day and 120-day moving average. The number of stocks robust to MA specification in each country is reported in the last column of Table 2. 8 See Harvey (1995b), and Bekaert and Harvey (1995, 2000) for time-varying volatility in emerging markets.
8
on the idiosyncratic component of individual stock return and volume. It is conceivable
that the market component in returns and turnover is associated with “allocational trades”
while company-specific (idiosyncratic) component is associated with private informational
trade. This may make it easier to discover the presence of informational trades. Therefore,
we run the following regression:
,1,,,2,101, ++ +++= ti
eti
eti
eti
eti VRCRCCR ε (3)
where is return, and V is turnover, in excess of the market. tmti
eti RRR ,,, −= tmti
eti VV ,,, −=
3. Data
There are 1001 companies from 19 emerging markets in the study. The sample
period is January 1, 1995 to November 1, 2001 (except for Russia). Returns are converted
to US dollars using data from S&P DRI Pro. When the project started on January 11,
2002, the smallest market was Sri Lanka, with a market cap of $0.49 billion, and the
largest was South Korea with $124 billion. Basic statistics are reported in Table 1.
To the extent available from Datastream, the sample includes the stocks of each
country's market index. We cross-checked the sample so obtained with the IFC/S&P
investible index for each market. We deleted from the sample any companies that are not
considered investment grade ones by the IFC. Stock data are from Datastream, except for
Russia, where data are from the Russian Trading System (RTS) website (but Gazprom,
from AKM Russian consulting agency).
For the selected stocks, our almost seven-year study period has as many as 1785
daily observations on three variables: closing price, number of shares traded, and the total
number of shares outstanding. Because some stocks are subject to missing observations,
and different countries observe different closing days, the number of observations
actually used is less for many stocks. The Russian sample starts with September 1, 1995,
and ends November 1, 2001. Appendix Table 1b reports the average number of trading
days for each country.
The arithmetic mean, geometric mean, and standard deviation of daily stock
returns and daily turnover for each country in Table 1 were computed first for each
company and then averaged across stocks within a country. Mean and median first order
9
autocorrelation in daily returns were similarly computed. The standard deviation,
however, was computed as the cross-sectional variation of autocorrelations.
Average daily returns are mostly negative during the 1995-2001 sample period.
This is not surprising, as most countries studied suffered through a series of financial
crises. Daily-return volatility ranged from 2.2% in Portugal to 6.2% in Russia. Average
turnover varies dramatically across countries, with a sluggish 0.06% for Colombia and an
extremely heavy 3.2% in South Korea. There is also a large variation of turnover
volatility across markets, ranging from 0.12% in Russia to 6.2% in South Korea.
The ninth to eleventh column presents the mean, median, and standard deviation of
first order autocorrelation in daily returns. For the mean and median, we compute them for
each company first and then average them across stocks within a country. For the standard
deviation, however, it is computed as the cross-sectional variation of autocorrelations. We
can see from the ninth column that the mean autocorrelation of stocks tend to be positive
in most countries but it could be negative such as in Pakistan. From the variation of
autocorrelations, we can see that even for counties like Russia, where the mean
autocorrelation is negative (-0.074), the large standard deviation (0.154) suggests that
there are still a large number of stocks with positive autocorrelation. These results are
similar in spirit to those found in Harvey (1995a), who discovers positive first order
autocorrelations for almost all emerging market indices but they vary greatly across
markets. He further finds that the variation is partly explained by difference in market cap,
trading volume, and asset concentration. However, he found there is much variation left to
be explained.
Our next objective is to further explore return autocorrelation and turnover and to
extract some useful information on speculative trading and corporate governance.
4. Empirical Results on Private Information Trading
This section presents the results of regressions on equations (2) and (3). Our
results suggest noticeable information asymmetry in emerging market stocks, with
particularly pervasive levels in some countries.
10
4.1 Estimating Equation (2): Panel A
We start by estimating equation (2) for all emerging market stocks in our sample.
For simplicity, we aggregate the parameter estimates by countries and the results are
presented in Table 2, Panel A. The mean coefficient for most countries is positive
(column 2), suggesting the presence of price momentum or the effects of non-synchronous
trading. These results are consistent with those of Harvey (1995a), who finds that
emerging market indices generally exhibit short-term positive serial correlation.
1C
Column 3 reports the cross-sectional averages of coefficients for each country
in the sample and column 4 reports the percentage of positive coefficients. The mean
coefficient is positive for 10 of the 19 countries (column 3). The strongest evidence of
informational trading is in Brazil (C
2C
2
2C
2C
2 > 0 for 72% of the stocks). Argentina, Indonesia,
Pakistan, and Russia also have particular strong evidence for such trading. South Korea
generally is perceived to have the most developed financial market among the countries in
our study, and it shows the least private-information trading in the tests: C2 > 0 for 15.5%
of the stocks. Chile, Colombia, Greece, India, Malaysia, Philippines, and Thailand, also
have less than half of positive . The total number of positive coefficients could be
misleading because some might be not statistically significant. Thus, we also report the
percentage of companies with significantly positive C coefficients (at 5% level) in
column 5. The t-statistic is computed based on the White heteroscedasticity robust
standard errors. The C coefficient is statistically significant and positive for about 14%
of the sample (140 stocks). Indonesia, perceived to have some of the worst crony
capitalism in the world, has the highest percentage, 42%, of significantly positive
coefficients.
2C
2
coefficient is determined by a balance between liquidity and information
trading, so it is remarkable that many Russian stocks still show a presence of information
trading despite their low turnover. To dominate the effects of liquidity, private-
information trading must be quite extreme.
2C
The sign of coefficient from regression (2) is robust to different specification
of turnover measures. We consider log turnover detrended with a 20-, 60-, or 120-day
moving average. Table 2, Panel A, Column 7 reports the number of stocks whose C
2C
2
11
coefficient does not change sign under the three different specifications. The percentage of
robust stocks varies between 71% (for Peru) and 93% (for India).
It is worth noting that although our study shows a significant presence of private-
information trading in emerging markets, it does not necessarily mean the strong
presence of insider trading. However, the data do indicate a great deal of information
asymmetry stacked up against less informed local and foreign investors9.
4.2 Estimating Equation (2): Panel B
It is conceivable that the market component in return and turnover reflects overall
market information while the idiosyncratic part corresponds to trades based on private
information related to the company. Thus, we would expect more to be positive in a
modified regression (3). Table 2 Panel B reports regression results. The total number of
positive coefficients has increased from 414 in Panel A to 497 in Panel B. The
increase in positive coefficients is found at the country level for 16 out of 19 countries.
2C
2C
Unfortunately, due to the increase in measurement errors, we have a drop in the
percentage of companies with significantly positive coefficients. However, the
robustness check of C coefficients with respect to the three different turnover measures
indicates that results are quite robust to the alternative specifications of trading volume.
Percentage of robust stocks varies between 66% (for Greece) and 90% (for Venezuela).
2C
2
The presence of private-information trades in emerging markets is further
supported when we decompose return and turnover into market and idiosyncratic
components. An equality of means test between C2 coefficients from regressions (2) and
(3) has a t-statistic of 3.34, significant at the 5% level.
5. Relating Private-Information Trading to Corporate Governance
This section examines the relationship between private information trading and our
9Conceptually, private information may come from two main sources, inside information and information derived from research by security analysts. As Bainbridge (2000) notes, insider trading is hard to measure because it is usually illegal. The only reliable, but not necessarily timely, source of data concerning legal trades is the reports filed by corporate insiders in the United States and United Kingdom, but such stringent reporting seldom exists in emerging markets.
12
broadly defined corporate governance measures. Our intuition is that informational
asymmetry should be related to the quality of corporate governance and information
disclosure. Therefore, intensity of private information trading could be a useful indicator
for identifying corporate governance problems in emerging markets.
For simplicity, we classify indicators of corporate governance into two broad
categories: the rule of law and investor rights. We first relate the intensity of private
information trading to the rule of law and information disclosure, which together define
the macro-environment for corporate governance.
5.1 The Data
Here we introduce our data source and the definition of the indicators. The variable
used for the enforcement of insider trading laws is from Bhattacharya and Daouk (2002).
It takes value of 1 for the corresponding country if the first prosecution under these laws
was prior to or during the sample period of our study.10 All countries in our sample had
established insider trading law prior to the beginning of the sample period, but
enforcement varies across countries.
Other indicators (as used by LaPorta et al (1998)) are the quality of accounting
standards, the risk of expropriation, and the efficiency of judicial system.11
5.2 Rule of Law
All companies in our sample are pooled to run the following cross-sectional
regression using the above indicators:
,43210,2 iiiiii errorQASaRExpaEJSaITLEaaC +++++= (4)
10 See Bhattacharya and Daouk (2002) for the construction of the dummy variable. 11The index of accounting standards is created by examining and rating the 1990 annual reports on inclusion or omission of 90 items in seven categories (general information, income statements, funds flow statement, balance sheets, accounting standards, stock data, and special items). Expropriation risk is for “outright confiscation” as estimated in the International Country Risk guide. The scale is from 0 to 10, with higher scores representing lower risks. The value is an average of April and October monthly data during 1982-95, representing 28 data points. Judicial efficiency is a 0 to 10 rating of how the legal system affects business, particularly foreign companies, produced by the country-risk rating agency Business International Corp. A higher score indicates higher efficiency. The value is an average index from 1980 to 1983, which are the only data available. We feel justified in using them because judicial systems have not changed much, at least in practice.
13
where is the insider trading law enforcement index, is the efficiency of the
judicial system, is the risk of expropriation, and is the quality of accounting
standards for country i
iITLE iEJS
iRE iQAS
.
Results of cross-sectional regression (4) are in Table 3 panel A. The dependent
variable for each company is obtained from regression (2). C is inversely related to
insider-trading laws enforcement, the efficiency of the judicial system, and the quality of
the accounting standards; it is positively related to the risk of expropriation. Thus,
countries with no or little enforcement of their insider trading laws, inefficient judicial
system, high risk of expropriation, and low quality of the accounting standards are
expected to have more private-information trading. Results are unchanged if we regress
coefficients on each individual indictor.
2C 2
2C 12
As a robustness check, we conducted a cross-sectional regression analysis for C
estimates obtained from the modified regression (3). Our results remain largely
unchanged, especially for the single-indicator regression. The only difference is that
and become insignificant in the joint estimation. Note that the risk of expropriation
index has the highest adjusted R-square value and t-statistics in the individual regressions.
2
iEJS
iQAS
5.3 Shareholders rights
To explore the relationship across countries between private-information trading
and the protection of the shareholder rights, we regressC coefficients on another set of
indicators, listed in Appendix Table 1.
2
Two indicators, shares not blocked before meeting and proportional
representation of cumulative voting, are procedural variables whose impact on investor
protection is somewhat ambiguous. The others are clearly related to minority investor
protection.
We now proceed with the regression:
12 Corruption, rule of law, and risk of contract repudiation variables are not included in the regression specification due to their high correlation with the insider-trading law enforcement and the risk-of-expropriation variables.
14
.765
43210,2
iiii
iiiii
errorCumVotaSNBaCOaESMaPRIaOMNaOSOVaaC
++++
++++= (5)
Table 4 reports results for cross-sectional regression (5). Panel A uses C
estimates obtained from regression (2) for 978 stocks.
2
13 Panel B uses estimates from
regression (3).
In Panel A all of the coefficients in the individual regressions are significant at the
5% level. The “one share-one vote” variable is inversely related to . This implies that
the presence of the one share-one vote rule is associated with a lower degree of private
information trading. As expected, the “oppressed minority mechanism” variable is
inversely related to C . The intuition is that the mechanism for protection of oppressed
minority interest allows the latter to dispute the decisions of the management or the
assembly. A higher percentage of share capital needed to call extraordinary shareholders’
meeting is positively related to C . Moreover, higher degree of ownership concentration
seems to give rise to more informational trading. However, our results on the “preemptive
rights to issue” are ambiguous, since the results are not different in the single and joint
estimation.
2C
2
2
“Shares not blocked before meeting” variable is positively related to C . One
possible explanation here is that, if shares are not blocked before the shareholders’
meeting then they can be sold just before the meeting to take advantage of insider
information. As a result, private-information trading could be high. The “cumulative
voting/ proportional representation” dummy variable is positively related to C .
2
2
Most estimates from (5) do not change their sign irrespective of whether the
regression is run individually or jointly. All indicators, except for “preemptive rights to
issue”, are statistically significant and preserve their signs in the individual regressions in
Panel B.
13 Russia is excluded from this part of the study because we are not aware of macro-indicators to allow including it.
15
5.4 Market Capitalization and Private Information Trading
Here we analyze the relationship between the average market capitalization of the
companies in the sample and the intensity of private-information trading. We estimate the
following regression:
,)log(20
19
1,2 ii
jjji errorMktCapDC ++=∑
=
αα (6)
where is the country dummy and log( is the log of company’s average
market capitalization in US dollars during the sample period. We use the country dummy
variables to control for differences in the quality of corporate governance and information
disclosure. Table 5 reports results of the regression.
jD )iMktCap
In regression (6) I, the dependent variable is the C coefficient from regression
(2), while in regression (6) II it is from regression (3). We obtain a statistically significant
inverse relationship between log-average market capitalization and in both cases.
Thus, the intensity of private-information trading is higher for small companies in
emerging markets. This is in line with the original results of LMSW, who find that small-
cap stocks exhibit more informational trading than large-cap stocks.
2
2C
6. Special Case of the Russian Market
In this section, we explicitly link the extent of private information trading to
corporate governance rankings. The Russian market is of particular interest, because it is
often considered one of the most opaque and hazardous markets in the world. Until a few
years ago its legal environment was so murky that Russia was not even rated by many
international rating agencies. It is a market where undisclosed insider trading is a real
possibility and where superior information of insiders and local investors could be
incorporated in stock prices through their trades. In addition, we were able to obtain
corporate governance rankings only for Russian companies.
16
6.1 Corporate events
The LMSW theoretical model suggests that price changes generated by
informational trade tend to continue if trading volume remains high. Therefore, we
examine the relationship between volume and return around major corporate events. Our
conjecture is that corporate-event periods are associated with days of high trading volume.
We focus on the announcement and holding of corporate meetings. These are important in
Russia, because corporate ownership structure, board structure, control rights, and asset
disposition are determined in those meetings. Press conferences also are included because
they often involve news of corporate scandals and thus can have a large impact on share
prices. We conjecture that private information trading tends to be most heavy when some
important news is expected. Insiders already know what the news are and may start trading
on it in advance of public release of the information.
The event window, during which we expect trading volume to be high, is defined
as the period from 10 days prior to the announcement of the corporate event, to 10 days
after the actual (effective) date of the event. The minimum window is thus 20 days, but
can be longer if an event is held more than 10 days after it is announced.
For each stock we create a corporate dummy variable , which is one for days in
an event window for stock i, and zero otherwise. To capture additional information
asymmetry during the event trading periods we estimate the following regression:
ctiD ,
.1,,,,3,,2,101, ++ ++++= ti
ctititititititi DVRCVRCRCCR ε (7)
Here,C shows what is the usual informational trading for stock i , and C shows the
additional information asymmetry around corporate events days. We have data about
corporate announcements and their dates from Bloomberg (see Appendix Table 3). The
database includes corporate meetings, and capital changes, as well as all press
conferences on company-related news.
2 3
Table 6 reports results for regression (7). Although many coefficients are
insignificant, almost all are positive. This supports our story of more informational trading
around corporate meetings, even for blue chips. For example, coefficient for Gazprom,
Russia’s largest company and its natural gas monopoly is 0.443 around event periods.
3C
3C
17
Our results are consistent with several papers investigating the relation between the
dynamics of return and trading volume using US data. For example, Stickel and
Verrecchia (1994) find that when earnings announcements are accompanied by higher
volume, returns tend to be positively correlated. Their results indicate that earnings
announcements may generate a large amount of private information that lead to active
private-information trading and return continuation.14
6.2 Corporate Governance Issues
The relation between the intensity of private-information trading and Russian
corporate governance is our next topic. We use the corporate governance risk ranking for
Russian companies computed by the investment bank Brunswick UBS Warburg (see
Appendix Table 2). Although we limit our cross-sectional analysis to only 15 companies,
their stocks account for some 90% of Russian market capitalization. Consider the
following regression specification:
,10,2 iii errorRiskGovernanceaaC ++= (8)
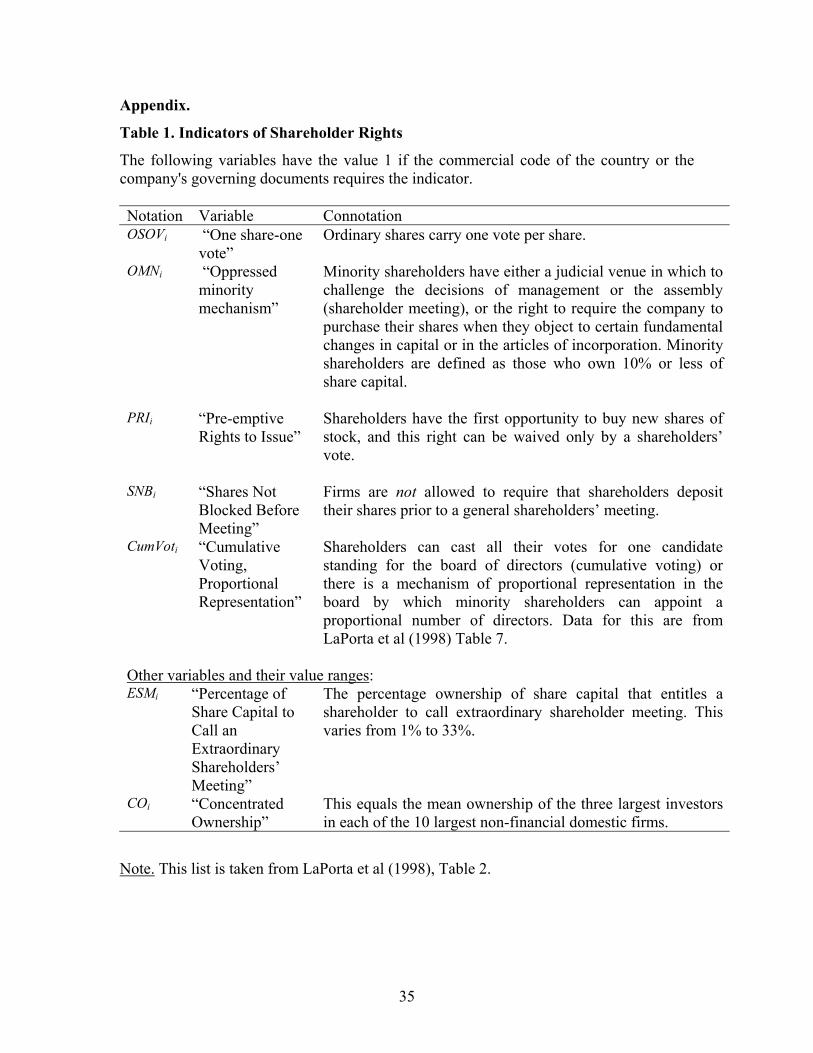
We ran OLS regression (8) and corrected errors for heteroskedasticity. The results are in
Figure 1 and 2. The governance-risk ranking is clearly positively related to the intensity of
private-information trading. The relationship is statistically significant. The results are
similar using C obtained from regression (3). While we are aware that the sample is
relatively small, our results suggest a possible relationship between corporate governance
and private-information trading.
2
7. Conclusion
This paper develops a new approach to extract information on corporate
governance in emerging markets based on trading data. It measures the intensity of private
14 We also looked how the nature of trades changes with the introduction of American Depositary Receipts (ADRs) on a Russian stock. The hypothesis was this facilitates hiding informational trades. This means that the informational-allocational trading pattern should change as a result of international cross-listing. However, we did not find any change. This is not surprising, as the ADR market for Russian stocks is very thin and one generally is trading against large institutional market makers. (see Domowitz, Glen, and Madhavan (1998) for a discussion on international cross-listing and segmentation of stock markets).
18
information trading by examining the dynamic relation between return and volume of
individual stocks in Russia and other emerging markets. It then relates the measure of
private-information trading to legal environment and corporate governance. Our analysis
is based on a simple theoretical model of Llorente, Michaely, Saar, and Wang (2001),
which shows that returns generated by risk-sharing trades tend to reverse themselves while
returns generated by private information trades tend to continue themselves.
Our empirical study finds strong evidence of private-information trading in
emerging markets. Using corporate announcement data from Russia, we find private-
information trading is especially strong around major corporate event dates. We also find
such trading in Russian stocks is related to poor corporate governance. Stocks in countries
that enforce insider-trading laws and provide better investor protection exhibit less return
continuation following high volume days. Moreover, intense private-information trading
reflects a high degree of expropriation risk and poor minority shareholder protection.
Thus, the intensity of private-information trading can be used as a possible measure of
“corporate governance” (broadly defined) for ranking emerging market stocks.
The robustness of our results is examined along several dimensions. First, we
decompose both the volume and return series into systematic and idiosyncratic
components. Information asymmetry remains when we remove the market-wide variations
from the analysis. Second, our findings are not sensitive to alternative definitions of
trading volume.
We have made a methodological contribution to the private information literature
by combining the traditional event study approach with LMSW regressions. Previously,
studies of private-information (insider) trading used cumulative abnormal returns around
event windows to measure the impact of private information on stock returns (see, for
example, Bhattacharya, Daouk, Jorgenson, and Kehr (2000) and Banerjee and Eckard
(2001)). The intuition behind our approach is that insiders and others with material
information related to corporate event exploit their information advantage by trading
against uninformed outsiders. Thus, conditional on corporate event and high trading
volume, we are more likely to observe return continuation when there is information
asymmetry.
19
However, there are several caveats for our measure of information asymmetry.
First, the measure is based on historical data. There is no guarantee that this asymmetry
will persist in the future. This is especially the case if investors use it to avoid stocks that
have a high degree of bad “corporate governance”. This may cause corporate insiders to
change their behavior in order to attract liquidity traders or uninformed investors.
Second, private information trading may happen infrequently and vary in its
intensity and trading frequency. For example, if insider trading is conducted within a few
hours or over a few weeks rather than over several days, it would be hard for an
econometrician to detect it using only daily return and turnover data.
Moreover, although we provide some measure for the intensity of “information
asymmetry” and its relationship to poor corporate governance, it is not a direct measure
of financial loss likely to be incurred by uninformed investors.
Although the measures developed in the paper are certainly quite crude
instruments, they do provide some independent information on the status of corporate
governance of emerging market companies. A byproduct of our information measure is
that it may sometimes serve as a liquidity proxy when C is negative. Pastor and
Stambaugh (2002) demonstrated that aggregated C could be used as a proxy for the
liquidity factor in the US market. It would be interesting to see whether similar results can
be obtained in emerging markets as well.
2
2
There are several issues that remain to be examined.
It is interesting to know whether the C measure is persistent. Given that insiders
face little risk of prosecution in many markets, we conjecture that they may continue to
exploit their information advantage by trading against uninformed investors. Thus, return
continuation on high trading volume could persist and be reflected in our measure. As a
result, we conjecture that could provide an ex ante as well as ex post measure of
information asymmetry against minority shareholders. However, we need to confirm this
intuition with more empirical work.
2
2C
It is interesting to know how our measure of information asymmetry (and corporate
governance) is related to the cost of capital. Presumably, uninformed investors may stay
away from stocks in which others have a distinct information advantage. This may
increase cost of capital as found for insider trading (Bhattacharya and Daouk (2002)).
20

How information asymmetry and poor corporate governance in emerging market
stocks affects the investment strategies of uninformed (or poorly informed) global
investors also is an important issue in need of further research.
21
References
Albuquerque, R., G. Bauer, and M. Schneider, 2002, Characterizing Asymmetric Information in International Equity Markets, Working paper. Antoniewicz, R.L., 1993, Relative Volume and Subsequent Stock Price Movements, Working paper, Board of Governors of the Federal Reserve System. Bailey, W., and C. X. Mao, 2001, Investment Restrictions and the Cross-Border Flow of Information: Some Empirical Evidence, Working paper, Cornell University. Bailey, W. and J. Lim, 1992, Evaluating the Diversification Benefits of the New Country Funds, Journal of Portfolio Management, 17, 74-80. Bainbridge, Stephen, 2000, Insider trading, in Encyclopedia of Law and Economics III (Edward Elgar Publishing, Cheltenham, U.K.). Banerjee, A. and W. Eckard, 2001, Why Regulate Insider Trading? Evidence from the Great Merger Wave (1897-1903), American Economic Review, 1329-1349. Bekaert, G., and C. Harvey, 1995, Time-Varying World Market Integration, Journal of Finance, Vol. 50, 403-444. Bekaert, G., and C. Harvey, 1997, Emerging Equity Market Volatility, Journal of Financial Economics, 43:1, 29-78. Bekaert, G. and C. Harvey, 2000, Foreign Speculators and Emerging Equity Markets, Journal of Finance, 565-613. Bekaert, G., C. Harvey, and A. Ng, Market Integration and Contagion, Journal of Business, forthcoming. Bhattacharya, U., and H. Daouk, 2002, The world price of insider trading, Journal of Finance, 57, 75-108. Bhattacharya, U., and H. Daouk, Brian Jorgenson, and Carl-Heinrich Kehr, 2000, When an event is not an event: The curious case of an emerging market, Journal of Financial Economics 55, 69-101. Bhattacharya, U., H. Daouk, and M. Welker, 2003, The World Price of Earnings Opacity, Accounting Review, forthcoming. Black, Bernard, 2001a, Does Corporate Governance Matter? A Crude test Using Russian Data, University of Pennsylvania Law Review, Vol. 149, 2131-2150. Black, Bernard, 2001b, The Corporate Governance and Market Value of Russian Firms,
22
Emerging Markets Review, 2. Brennan, M, and H. Cao, International Portfolio Investment Flows, Journal of Finance, Vol. 52, No. 5. (Dec., 1997), 1851-1880. Brennan, M. and A. Subrahmanyam, 1995, Investment Analysis and Price Formation in Securities Markets, Journal of Financial Economics 38, 361-381. Campbell, J.Y., S.J. Grossman, and J. Wang, 1993, Trading Volume and Serial Correlation in Stock Returns, Quarterly Journal of Economics 108, 905-939. Conrad, J., A. Hameed, and C.M. Niden, 1992, Volume and Autocovariances in Short-Horizon Individual Security Returns, Journal of Finance 49, 1305-1329. Domowitz I., J. Glen, and A. Madhavan, 1998, International Cross-Listing and Order Flow Migration: Evidence From An Emerging Market, Journal of Finance 53, 2001-2027. Easley, D., and M. O'Hara, 1987, Price, Trade Size, and Information In Securities Markets, Journal of Financial Economics 18, 69-90. Gallant, R., P. Rossi, and Tauchen, G., 1992, Stock Prices and Volume, Review of Financial Studies 5, 199-242. Glosten, L. and P. Milgrom, 1985, Bid, Ask and Transaction Prices in a Market-Maker Market with Heterogeneously Informed Traders, Journal of Financial Economics 14, 71-100. Harvey, C., 1991, The world price of covariance risk, Journal of Finance 46, 111-157. Harvey, C., 1995a, Predictable risk and returns in emerging markets, Review of Financial Studies 8, 773-816. Harvey, C., 1995b, The Cross-Section of Volatility and Autocorrelation in Emerging Markets, Finanzmarkt und Portfolio Management 1, 12-30. Hayes, R.M., 1998, The impact of trading commission incentives on analysts’ stock coverage decisions and earnings forecasts, Journal of Accounting Research, 36, 299–320. Henry, Peter, 2000, Stock Market Liberalization, Economic Reform, and Emerging Market Equity Prices, Journal of Finance, Vol. LV, No. 2, 529-564. Henry, Peter, 2000, Do Stock Market Liberalizations Cause Investment Booms? Journal of Financial Economics, Vol. 58, No.1-2, 301-334. La Porta, R., F. Lopez-de-Silanes, A. Shleifer, and R. Vishny, 1997, Legal determinants of external finance, Journal of Finance 52, 1131-1150.
23
La Porta, R., F. Lopez-de-Silanes, A. Shleifer, and R. Vishny, 1998, Law and finance, Journal of Political Economy 106, 1113-1155. Lim, T., 2001, Rationality and analysts’ forecast bias, Journal of Finance, 56, 369–385. Llorente G., R. Michaely, G. Saar, and J. Wang, 2002, Dynamic Volume-return Relation of Individual Stocks, Review of Financial Studies, Vol. 15, 1005-1047. Lo, A.W., and A.C. MacKinlay, 1990, An Econometric Analysis of Nonsynchronous Trading, Journal of Econometrics 45, 181-211. Lo, A. and J. Wang, 2000, Trading Volume: Definitions, Data Analysis, and Implications of Portfolio Theory, Review of Financial Studies 13, 257-300. Madhavan, A., M. Richardson, and M. Roomans, 1997, Why Do Security Prices Change? A Transaction-Level Analysis of NYSE Stocks, Review of Financial Studies 10, 1035-1064. Michaely and Womack, 1999, Conflict of Interest and The Credibility of Underwriter Analyst Recommendations, The Review of Financial Studies, 1999, 12, 653-686. Pastor and Stambaugh, Liquidity Risk and Expected Stock Returns, Journal of Political Economy, forthcoming. Roll, R, 1984, A Simple Implicit Measure of the Effective Bid-Ask Spread in an Efficient Market, Journal of Finance, 39, 1127-1140. Stickel, S.E. and R.E. Verrecchia, 1994, Evidence that Volume Sustains Price Changes, Financial Analyst Journal (November-December), 57-67.
24
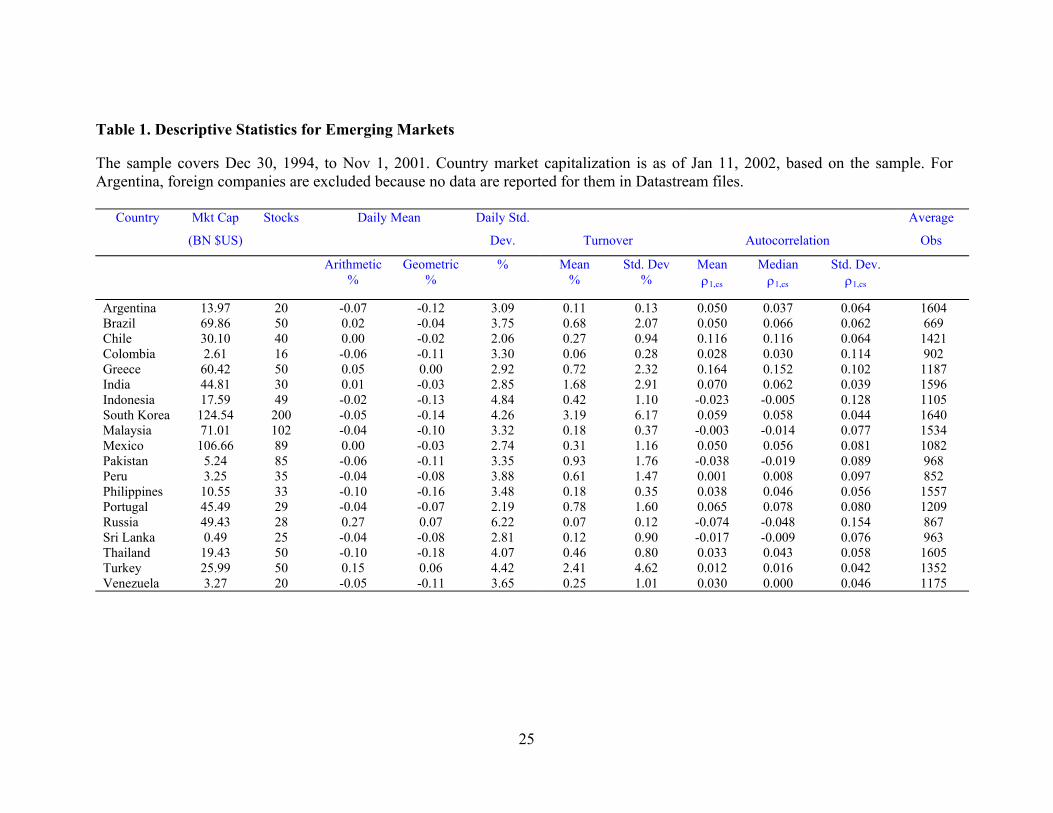
Table 1. Descriptive Statistics for Emerging Markets
The sample covers Dec 30, 1994, to Nov 1, 2001. Country market capitalization is as of Jan 11, 2002, based on the sample. For Argentina, foreign companies are excluded because no data are reported for them in Datastream files.
Country Mkt Cap
(BN $US)
Stocks Daily Mean Daily Std.
Dev.
Turnover
Autocorrelation
Average
Obs
Arithmetic %
Geometric %
% Mean%
Std. Dev %
Mean ρ1,cs
Median ρ1,cs
Std. Dev. ρ1,cs
Argentina 13.97 20 -0.07 -0.12 3.09 0.11 0.13 0.050 0.037 0.064 1604Brazil
69.86 50 0.02 -0.04 3.75 0.68 2.07 0.050 0.066 0.062 669Chile 30.10 40 0.00 -0.02 2.06 0.27 0.94 0.116 0.116 0.064 1421Colombia 2.61 16 -0.06 -0.11 3.30 0.06 0.28 0.028 0.030 0.114 902Greece 60.42 50 0.05 0.00 2.92 0.72 2.32 0.164 0.152 0.102 1187India 44.81 30 0.01 -0.03 2.85 1.68 2.91 0.070 0.062 0.039 1596Indonesia 17.59 49 -0.02 -0.13 4.84 0.42 1.10 -0.023 -0.005 0.128 1105South Korea 124.54 200 -0.05 -0.14 4.26 3.19 6.17 0.059 0.058 0.044 1640Malaysia 71.01 102 -0.04 -0.10 3.32 0.18 0.37 -0.003 -0.014 0.077 1534Mexico 106.66 89 0.00 -0.03 2.74 0.31 1.16 0.050 0.056 0.081 1082Pakistan 5.24 85 -0.06 -0.11 3.35 0.93 1.76 -0.038 -0.019 0.089 968Peru 3.25 35 -0.04 -0.08 3.88 0.61 1.47 0.001 0.008 0.097 852Philippines 10.55 33 -0.10 -0.16 3.48 0.18 0.35 0.038 0.046 0.056 1557Portugal 45.49 29 -0.04 -0.07 2.19 0.78 1.60 0.065 0.078 0.080 1209Russia 49.43 28 0.27 0.07 6.22 0.07 0.12 -0.074 -0.048 0.154 867Sri Lanka 0.49 25 -0.04 -0.08 2.81 0.12 0.90 -0.017 -0.009 0.076 963Thailand 19.43 50 -0.10 -0.18 4.07 0.46 0.80 0.033 0.043 0.058 1605Turkey 25.99 50 0.15 0.06 4.42 2.41 4.62 0.012 0.016 0.042 1352Venezuela 3.27 20 -0.05 -0.11 3.65 0.25 1.01 0.030 0.000 0.046 1175
25
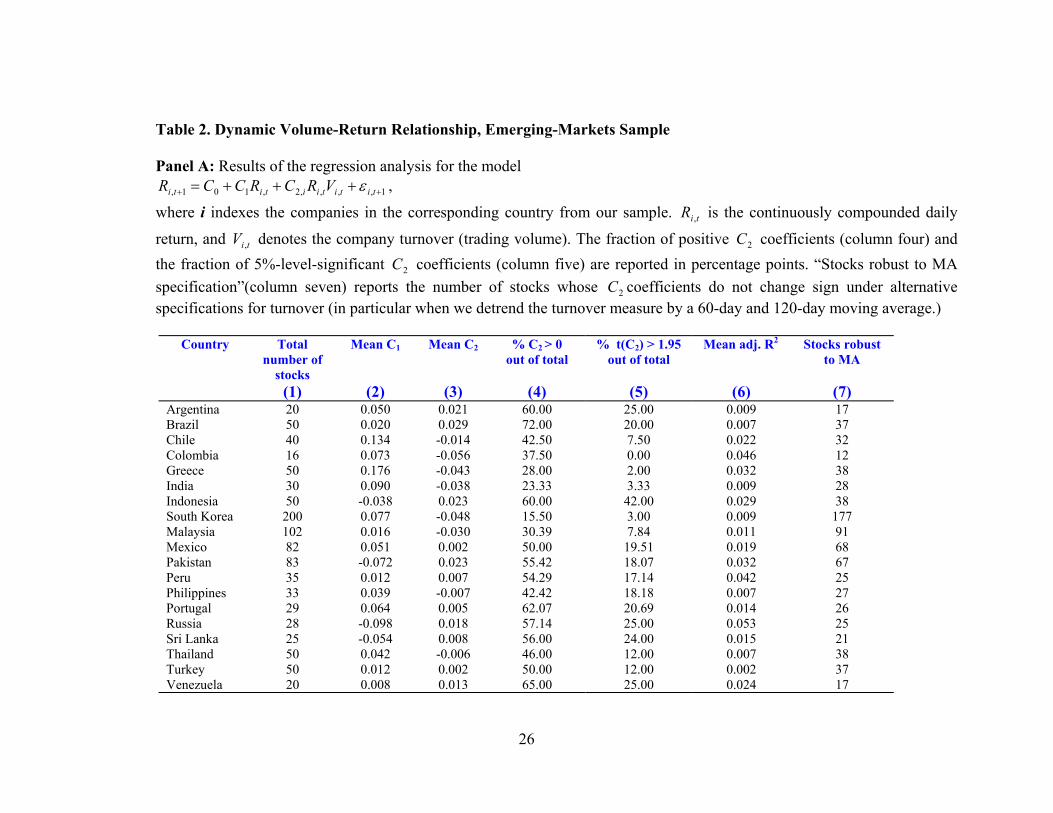
Table 2. Dynamic Volume-Return Relationship, Emerging-Markets Sample Panel A: Results of the regression analysis for the model
+++= VRCRCCR ε 1,,,,2,101, ++ tititiititi ,
where i indexes the companies in the corresponding country from our sample. is the continuously compounded daily
return, and denotes the company turnover (trading volume). The fraction of positive coefficients (column four) and the fraction of 5%-level-significant coefficients (column five) are reported in percentage points. “Stocks robust to MA specification”(column seven) reports the number of stocks whose C coefficients do not change sign under alternative specifications for turnover (in particular when we detrend the turnover measure by a 60-day and 120-day moving average.)
tiR ,
tiV , 2C
2C
2
Country Total
number of stocks
Mean C1 Mean C2 % C2 > 0 out of total
% t(C2) > 1.95 out of total
Mean adj. R2 Stocks robustto MA
(1) (2) (3) (4) (5) (6) (7)Argentina 20 0.050 0.021 60.00 25.00 0.009 17Brazil
50 0.020 0.029 72.00 20.00 0.007 37Chile 40 0.134 -0.014 42.50 7.50 0.022 32Colombia 16 0.073 -0.056 37.50 0.00 0.046 12Greece 50 0.176 -0.043 28.00 2.00 0.032 38India 30 0.090 -0.038 23.33 3.33 0.009 28Indonesia 50 -0.038 0.023 60.00 42.00 0.029 38South Korea 200 0.077 -0.048 15.50 3.00 0.009 177 Malaysia 102 0.016 -0.030 30.39 7.84 0.011 91Mexico 82 0.051 0.002 50.00 19.51 0.019 68Pakistan 83 -0.072 0.023 55.42 18.07 0.032 67Peru 35 0.012 0.007 54.29 17.14 0.042 25Philippines 33 0.039 -0.007 42.42 18.18 0.007 27Portugal 29 0.064 0.005 62.07 20.69 0.014 26Russia 28 -0.098 0.018 57.14 25.00 0.053 25Sri Lanka 25 -0.054 0.008 56.00 24.00 0.015 21 Thailand 50 0.042 -0.006 46.00 12.00 0.007 38Turkey 50 0.012 0.002 50.00 12.00 0.002 37Venezuela 20 0.008 0.013 65.00 25.00 0.024 17
26
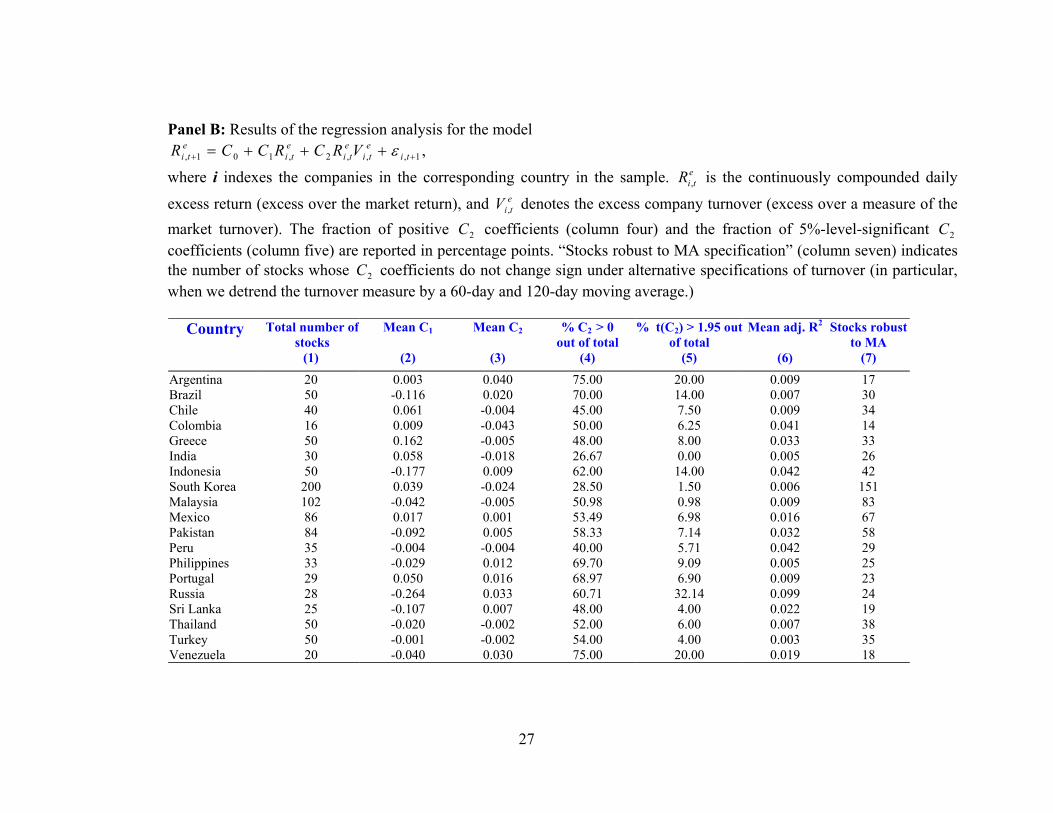
Panel B: Results of the regression analysis for the model ,+++= eeee VRCRCCR ε 1,,,2,101, ++ tititititi
where i indexes the companies in the corresponding country in the sample. is the continuously compounded daily
excess return (excess over the market return), and denotes the excess company turnover (excess over a measure of the market turnover). The fraction of positive coefficients (column four) and the fraction of 5%-level-significant coefficients (column five) are reported in percentage points. “Stocks robust to MA specification” (column seven) indicates the number of stocks whose C coefficients do not change sign under alternative specifications of turnover (in particular, when we detrend the turnover measure by a 60-day and 120-day moving average.)
etiR ,
etiV ,
2C 2C
2
Country Total number of
stocks Mean C1 Mean C2 % C2 > 0
out of total % t(C2) > 1.95 out
of total Mean adj. R2 Stocks robust
to MA (1)
(2) (3) (4) (5) (6) (7)
Argentina 20 0.003 0.040 75.00 20.00 0.009 17Brazil
50 -0.116 0.020 70.00 14.00 0.007 30Chile 40 0.061 -0.004 45.00 7.50 0.009 34Colombia 16 0.009 -0.043 50.00 6.25 0.041 14Greece 50 0.162 -0.005 48.00 8.00 0.033 33India 30 0.058 -0.018 26.67 0.00 0.005 26Indonesia 50 -0.177 0.009 62.00 14.00 0.042 42South Korea 200 0.039 -0.024 28.50 1.50 0.006 151 Malaysia 102 -0.042 -0.005 50.98 0.98 0.009 83Mexico 86 0.017 0.001 53.49 6.98 0.016 67Pakistan 84 -0.092 0.005 58.33 7.14 0.032 58Peru 35 -0.004 -0.004 40.00 5.71 0.042 29Philippines 33 -0.029 0.012 69.70 9.09 0.005 25Portugal 29 0.050 0.016 68.97 6.90 0.009 23Russia 28 -0.264 0.033 60.71 32.14 0.099 24Sri Lanka 25 -0.107 0.007 48.00 4.00 0.022 19 Thailand 50 -0.020 -0.002 52.00 6.00 0.007 38Turkey 50 -0.001 -0.002 54.00 4.00 0.003 35Venezuela 20 -0.040 0.030 75.00 20.00 0.019 18
27
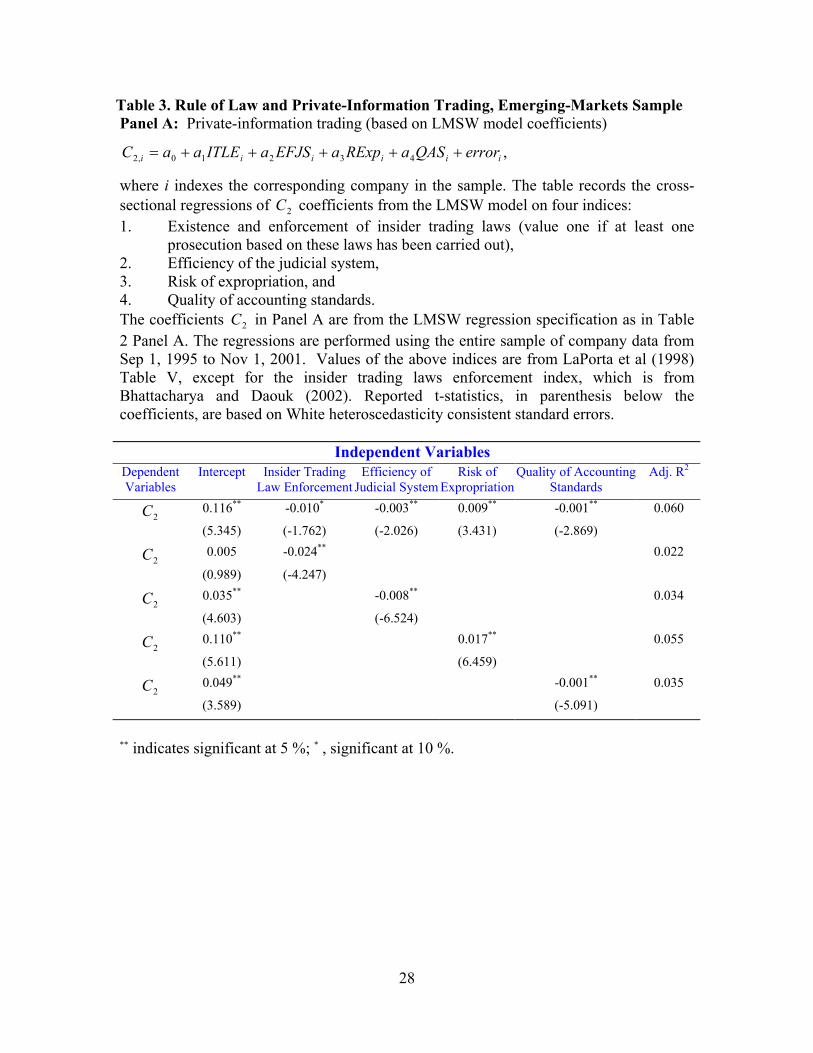
Table 3. Rule of Law and Private-Information Trading, Emerging-Markets Sample Panel A: Private-information trading (based on LMSW model coefficients)
,43210,2 iiiiii errorQASaRExpaEFJSaITLEaaC +++++=
where i indexes the corresponding company in the sample. The table records the cross-sectional regressions of coefficients from the LMSW model on four indices: 2C1. Existence and enforcement of insider trading laws (value one if at least one
prosecution based on these laws has been carried out), 2. Efficiency of the judicial system, 3. Risk of expropriation, and 4. Quality of accounting standards. The coefficients in Panel A are from the LMSW regression specification as in Table 2 Panel A. The regressions are performed using the entire sample of company data from Sep 1, 1995 to Nov 1, 2001. Values of the above indices are from LaPorta et al (1998) Table V, except for the insider trading laws enforcement index, which is from Bhattacharya and Daouk (2002). Reported t-statistics, in parenthesis below the coefficients, are based on White heteroscedasticity consistent standard errors.
2C
Independent Variables
Dependent Variables
Intercept Insider Trading Law Enforcement
Efficiency of Judicial System
Risk of Expropriation
Quality of Accounting Standards
Adj. R2
2C 0.116** -0.010* -0.003** 0.009** -0.001** 0.060
(5.345) (-1.762) (-2.026) (3.431) (-2.869) 2C 0.005 -0.024** 0.022
(0.989) (-4.247) 2C 0.035** -0.008** 0.034
(4.603) (-6.524) 2C 0.110** 0.017** 0.055
(5.611) (6.459) 2C 0.049** -0.001** 0.035
(3.589) (-5.091) ** indicates significant at 5 %; * , significant at 10 %.
28
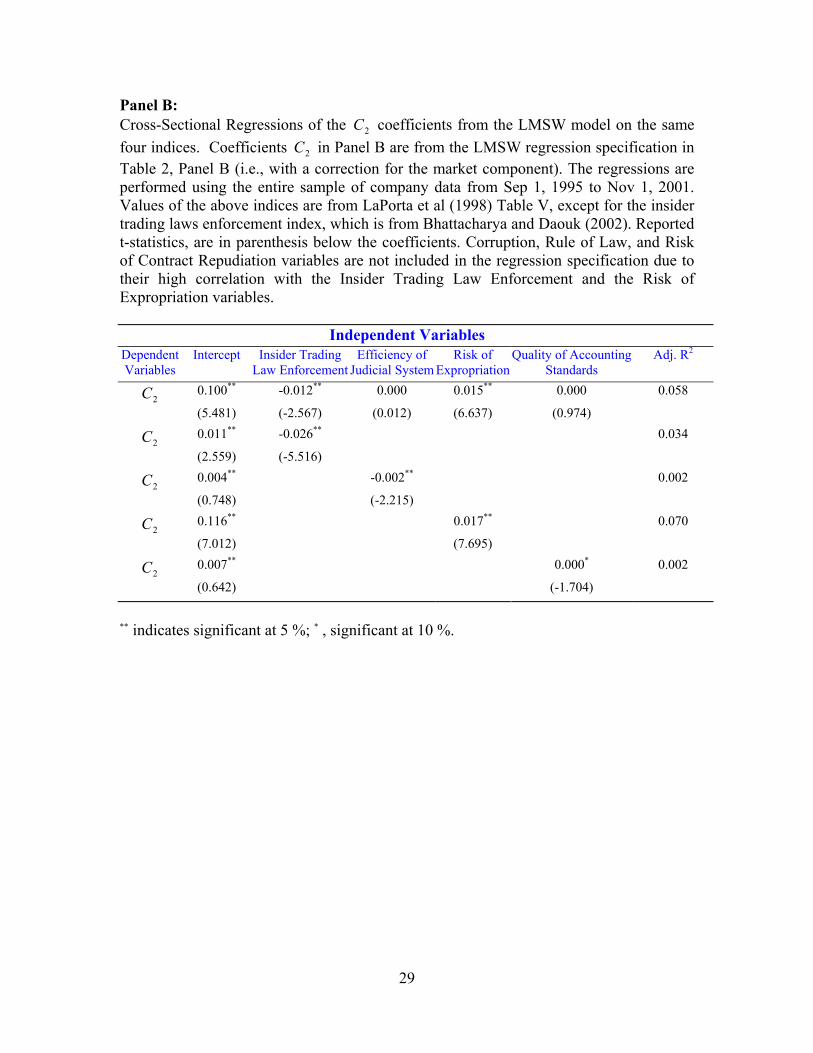
Panel B: Cross-Sectional Regressions of the C coefficients from the LMSW model on the same four indices. Coefficients C in Panel B are from the LMSW regression specification in Table 2, Panel B (i.e., with a correction for the market component). The regressions are performed using the entire sample of company data from Sep 1, 1995 to Nov 1, 2001. Values of the above indices are from LaPorta et al (1998) Table V, except for the insider trading laws enforcement index, which is from Bhattacharya and Daouk (2002). Reported t-statistics, are in parenthesis below the coefficients. Corruption, Rule of Law, and Risk of Contract Repudiation variables are not included in the regression specification due to their high correlation with the Insider Trading Law Enforcement and the Risk of Expropriation variables.
2
2
Independent Variables
Dependent Variables
Intercept Insider Trading Law Enforcement
Efficiency of Judicial System
Risk of Expropriation
Quality of Accounting Standards
Adj. R2
2C 0.100** -0.012** 0.000 0.015** 0.000 0.058
(5.481) (-2.567) (0.012) (6.637) (0.974) 2C 0.011** -0.026** 0.034
(2.559) (-5.516) 2C 0.004** -0.002** 0.002
(0.748) (-2.215) 2C 0.116** 0.017** 0.070
(7.012) (7.695)
2C 0.007** 0.000* 0.002
(0.642) (-1.704) ** indicates significant at 5 %; * , significant at 10 %.
29
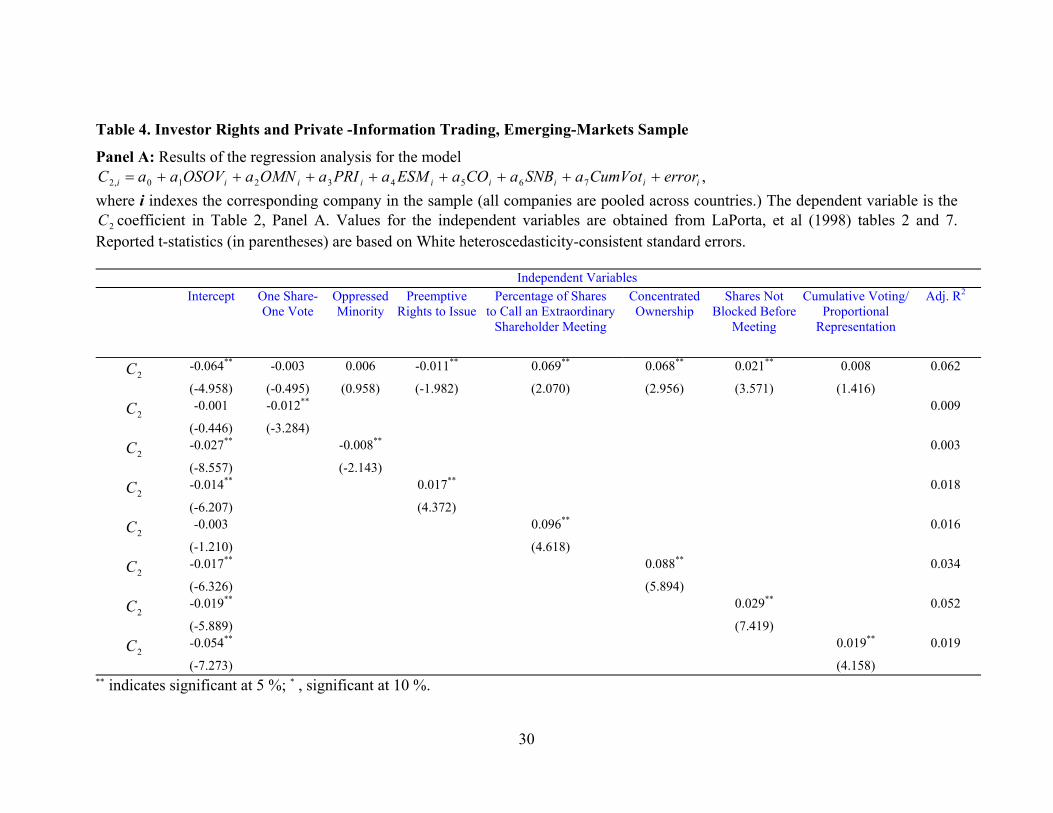
Table 4. Investor Rights and Private -Information Trading, Emerging-Markets Sample
Panel A: Results of the regression analysis for the model aESMaPRIaOMNaOSOVaaC +++++= ,76543210,2 iiiiiiiii errorCumVotaSNBaCO +++
where i indexes the corresponding company in the sample (all companies are pooled across countries.) The dependent variable is the C coefficient in Table 2, Panel A. Values for the independent variables are obtained from LaPorta, et al (1998) tables 2 and 7. Reported t-statistics (in parentheses) are based on White heteroscedasticity-consistent standard errors.
2
Independent Variables
Intercept One Share-One Vote
OppressedMinority
Preemptive Rights to Issue
Percentage of Shares to Call an Extraordinary
Shareholder Meeting
Concentrated Ownership
Shares Not Blocked Before
Meeting
Cumulative Voting/Proportional
Representation
Adj. R2
2C -0.064** -0.003 0.006 -0.011** 0.069** 0.068** 0.021** 0.008 0.062
(-4.958) (-0.495) (0.958) (-1.982) (2.070) (2.956) (3.571) (1.416)
2C -0.001 -0.012** 0.009
(-0.446) (-3.284)
2C -0.027** -0.008** 0.003
(-8.557) (-2.143)
2C -0.014** 0.017** 0.018
(-6.207) (4.372)
2C -0.003 0.096** 0.016
(-1.210) (4.618)
2C -0.017** 0.088** 0.034
(-6.326) (5.894)
2C -0.019** 0.029** 0.052
(-5.889) (7.419)
2C -0.054** 0.019** 0.019
(-7.273) (4.158)
** indicates significant at 5 %; * , significant at 10 %.
30
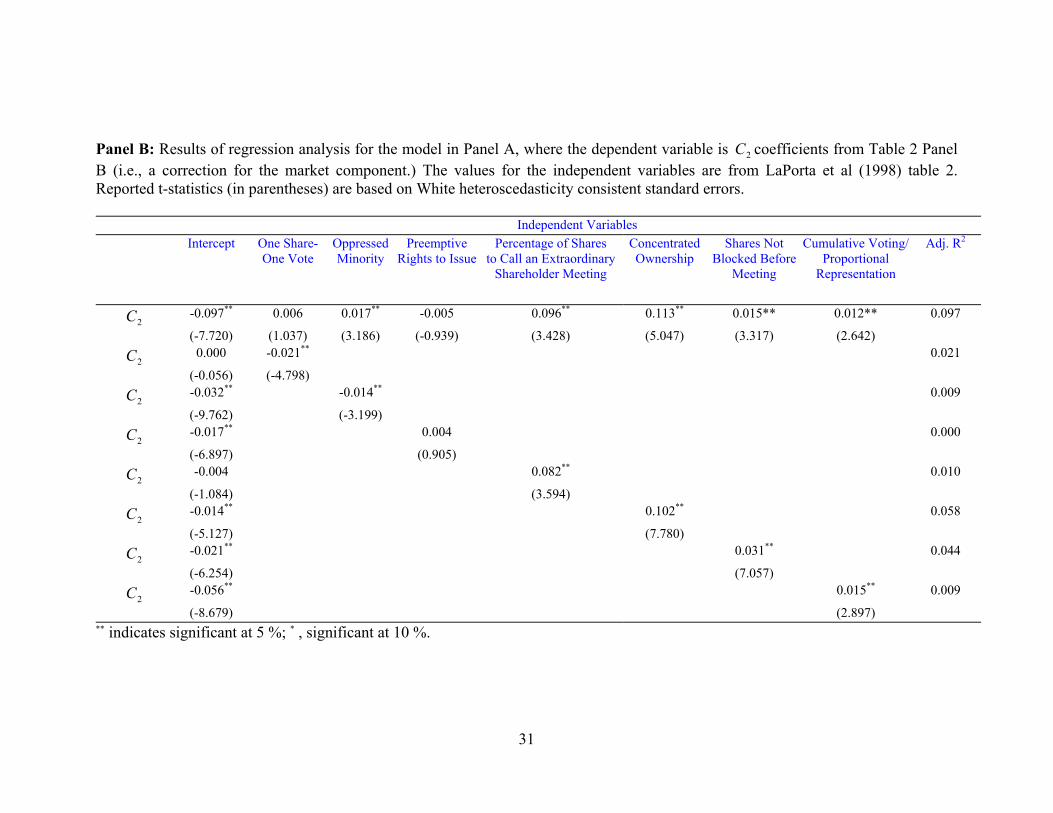
Panel B: Results of regression analysis for the model in Panel A, where the dependent variable is coefficients from Table 2 Panel B (i.e., a correction for the market component.) The values for the independent variables are from LaPorta et al (1998) table 2. Reported t-statistics (in parentheses) are based on White heteroscedasticity consistent standard errors.
2C
Independent Variables
Intercept One Share-One Vote
OppressedMinority
Preemptive Rights to Issue
Percentage of Shares to Call an Extraordinary
Shareholder Meeting
Concentrated Ownership
Shares Not Blocked Before
Meeting
Cumulative Voting/Proportional
Representation
Adj. R2
2C -0.097** 0.006 0.017** -0.005 0.096** 0.113** 0.015** 0.012** 0.097
(-7.720) (1.037) (3.186) (-0.939) (3.428) (5.047) (3.317) (2.642)
2C 0.000 -0.021** 0.021
(-0.056) (-4.798)
2C -0.032** -0.014** 0.009
(-9.762) (-3.199)
2C -0.017** 0.004 0.000
(-6.897) (0.905)
2C -0.004 0.082** 0.010
(-1.084) (3.594)
2C -0.014** 0.102** 0.058
(-5.127) (7.780)
2C
-0.021** 0.031** 0.044
(-6.254) (7.057)
2C -0.056** 0.015** 0.009
(-8.679) (2.897)
** indicates significant at 5 %; * , significant at 10 %.
31
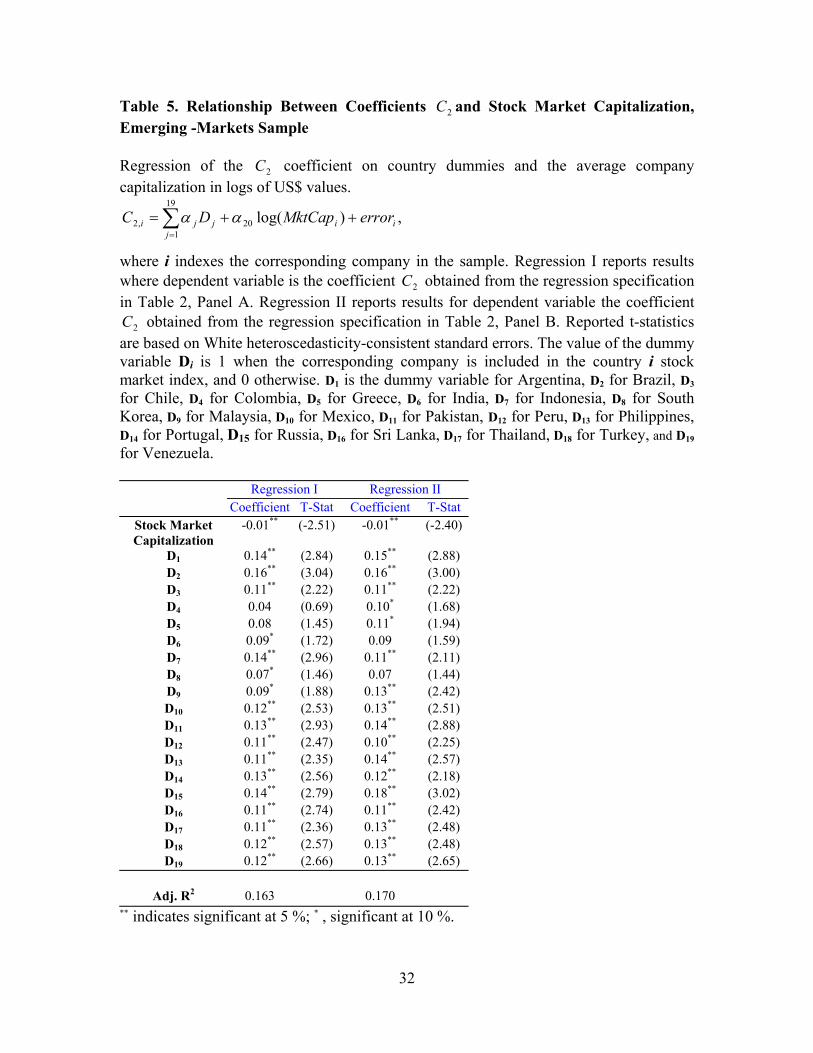
Table 5. Relationship Between Coefficients C and Stock Market Capitalization, Emerging -Markets Sample
2
Regression of the coefficient on country dummies and the average company capitalization in logs of US$ values.
2C
,)log(20
19
1,2 ii
jjji errorMktCapDC ++= ∑
=
αα
where i indexes the corresponding company in the sample. Regression I reports results where dependent variable is the coefficient C obtained from the regression specification in Table 2, Panel A. Regression II reports results for dependent variable the coefficient
obtained from the regression specification in Table 2, Panel B. Reported t-statistics are based on White heteroscedasticity-consistent standard errors. The value of the dummy variable D
2
2C
i is 1 when the corresponding company is included in the country i stock market index, and 0 otherwise. D1 is the dummy variable for Argentina, D2 for Brazil, D3 for Chile, D4 for Colombia, D5 for Greece, D6 for India, D7 for Indonesia, D8 for South Korea, D9 for Malaysia, D10 for Mexico, D11 for Pakistan, D12 for Peru, D13 for Philippines, D14 for Portugal, D15 for Russia, D16 for Sri Lanka, D17 for Thailand, D18 for Turkey, and D19 for Venezuela.
Regression I Regression II Coefficient T-Stat Coefficient T-Stat
Stock Market Capitalization
-0.01** (-2.51) -0.01** (-2.40)
D1 0.14** (2.84) 0.15** (2.88) D2 0.16** (3.04) 0.16** (3.00) D3 0.11** (2.22) 0.11** (2.22) D4 0.04 (0.69) 0.10* (1.68) D5 0.08 (1.45) 0.11* (1.94) D6 0.09* (1.72) 0.09 (1.59) D7 0.14** (2.96) 0.11** (2.11) D8 0.07* (1.46) 0.07 (1.44) D9 0.09* (1.88) 0.13** (2.42) D10 0.12** (2.53) 0.13** (2.51) D11 0.13** (2.93) 0.14** (2.88) D12 0.11** (2.47) 0.10** (2.25) D13 0.11** (2.35) 0.14** (2.57) D14 0.13** (2.56) 0.12** (2.18) D15 0.14** (2.79) 0.18** (3.02) D16 0.11** (2.74) 0.11** (2.42) D17 0.11** (2.36) 0.13** (2.48) D18 0.12** (2.57) 0.13** (2.48) D19 0.12** (2.66) 0.13** (2.65)
Adj. R2 0.163 0.170
** indicates significant at 5 %; * , significant at 10 %.
32
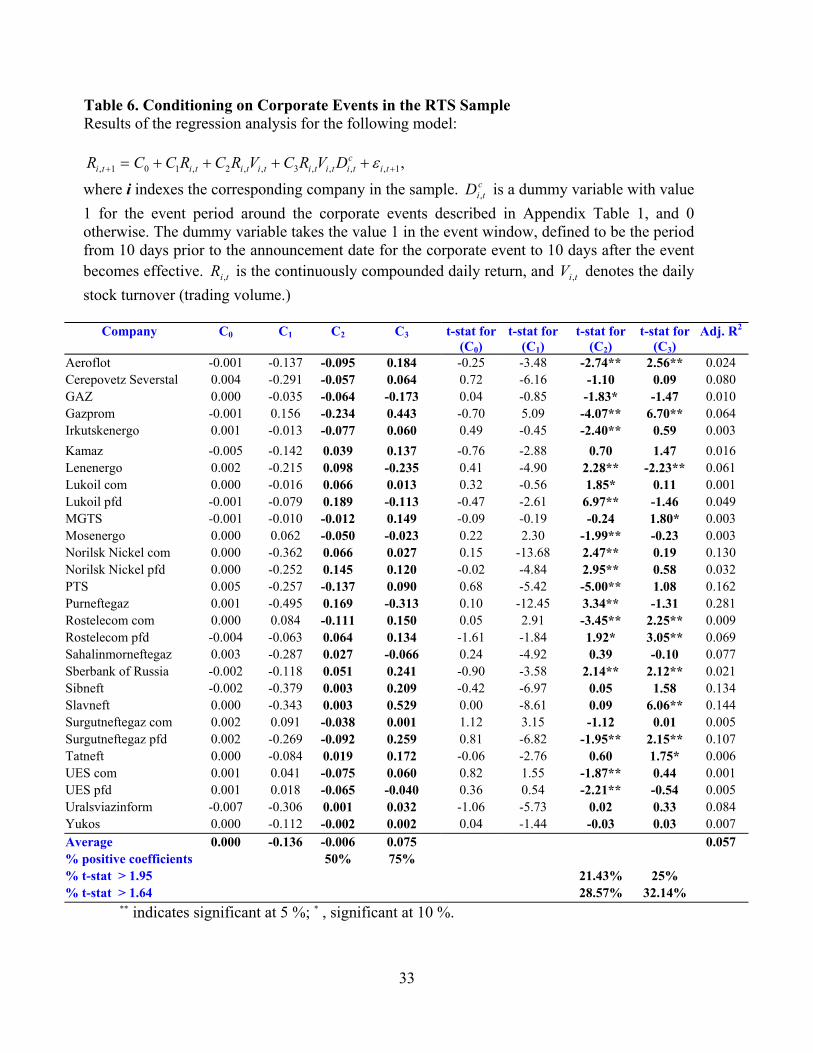
Table 6. Conditioning on Corporate Events in the RTS Sample Results of the regression analysis for the following model:
,1,,,,3,,2,101, ++ ++++= tictititititititi DVRCVRCRCCR ε
where i indexes the corresponding company in the sample. is a dummy variable with value 1 for the event period around the corporate events described in Appendix Table 1, and 0 otherwise. The dummy variable takes the value 1 in the event window, defined to be the period from 10 days prior to the announcement date for the corporate event to 10 days after the event becomes effective. is the continuously compounded daily return, and V denotes the daily stock turnover (trading volume.)
ctiD ,
tiR , ti,
Company C0 C1 C2 C3 t-stat for
(C0) t-stat for
(C1) t-stat for
(C2) t-stat for
(C3) Adj. R2
Aeroflot -0.001 -0.137 -0.095 0.184 -0.25 -3.48 -2.74** 2.56** 0.024 Cerepovetz Severstal 0.004 -0.291 -0.057 0.064 0.72 -6.16 -1.10 0.09 0.080 GAZ 0.000 -0.035 -0.064 -0.173 0.04 -0.85 -1.83* -1.47 0.010 Gazprom -0.001 0.156 -0.234 0.443 -0.70 5.09 -4.07** 6.70** 0.064 Irkutskenergo 0.001 -0.013 -0.077 0.060 0.49 -0.45 -2.40** 0.59 0.003 Kamaz -0.005 -0.142 0.039 0.137 -0.76 -2.88 0.70 1.47 0.016 Lenenergo 0.002 -0.215 0.098 -0.235 0.41 -4.90 2.28** -2.23** 0.061 Lukoil com 0.000 -0.016 0.066 0.013 0.32 -0.56 1.85* 0.11 0.001 Lukoil pfd -0.001 -0.079 0.189 -0.113 -0.47 -2.61 6.97** -1.46 0.049 MGTS -0.001 -0.010 -0.012 0.149 -0.09 -0.19 -0.24 1.80* 0.003 Mosenergo 0.000 0.062 -0.050 -0.023 0.22 2.30 -1.99** -0.23 0.003 Norilsk Nickel com 0.000 -0.362 0.066 0.027 0.15 -13.68 2.47** 0.19 0.130 Norilsk Nickel pfd 0.000 -0.252 0.145 0.120 -0.02 -4.84 2.95** 0.58 0.032 PTS 0.005 -0.257 -0.137 0.090 0.68 -5.42 -5.00** 1.08 0.162 Purneftegaz 0.001 -0.495 0.169 -0.313 0.10 -12.45 3.34** -1.31 0.281 Rostelecom com 0.000 0.084 -0.111 0.150 0.05 2.91 -3.45** 2.25** 0.009 Rostelecom pfd -0.004 -0.063 0.064 0.134 -1.61 -1.84 1.92* 3.05** 0.069 Sahalinmorneftegaz 0.003 -0.287 0.027 -0.066 0.24 -4.92 0.39 -0.10 0.077 Sberbank of Russia -0.002 -0.118 0.051 0.241 -0.90 -3.58 2.14** 2.12** 0.021 Sibneft -0.002 -0.379 0.003 0.209 -0.42 -6.97 0.05 1.58 0.134 Slavneft 0.000 -0.343 0.003 0.529 0.00 -8.61 0.09 6.06** 0.144 Surgutneftegaz com 0.002 0.091 -0.038 0.001 1.12 3.15 -1.12 0.01 0.005 Surgutneftegaz pfd 0.002 -0.269 -0.092 0.259 0.81 -6.82 -1.95** 2.15** 0.107 Tatneft 0.000 -0.084 0.019 0.172 -0.06 -2.76 0.60 1.75* 0.006 UES com 0.001 0.041 -0.075 0.060 0.82 1.55 -1.87** 0.44 0.001 UES pfd 0.001 0.018 -0.065 -0.040 0.36 0.54 -2.21** -0.54 0.005 Uralsviazinform -0.007 -0.306 0.001 0.032 -1.06 -5.73 0.02 0.33 0.084 Yukos 0.000 -0.112 -0.002 0.002 0.04 -1.44 -0.03 0.03 0.007 Average 0.000 -0.136 -0.006 0.075 0.057 % positive coefficients 50% 75% % t-stat > 1.95 21.43% 25% % t-stat > 1.64 28.57% 32.14%
** indicates significant at 5 %; * , significant at 10 %.
33
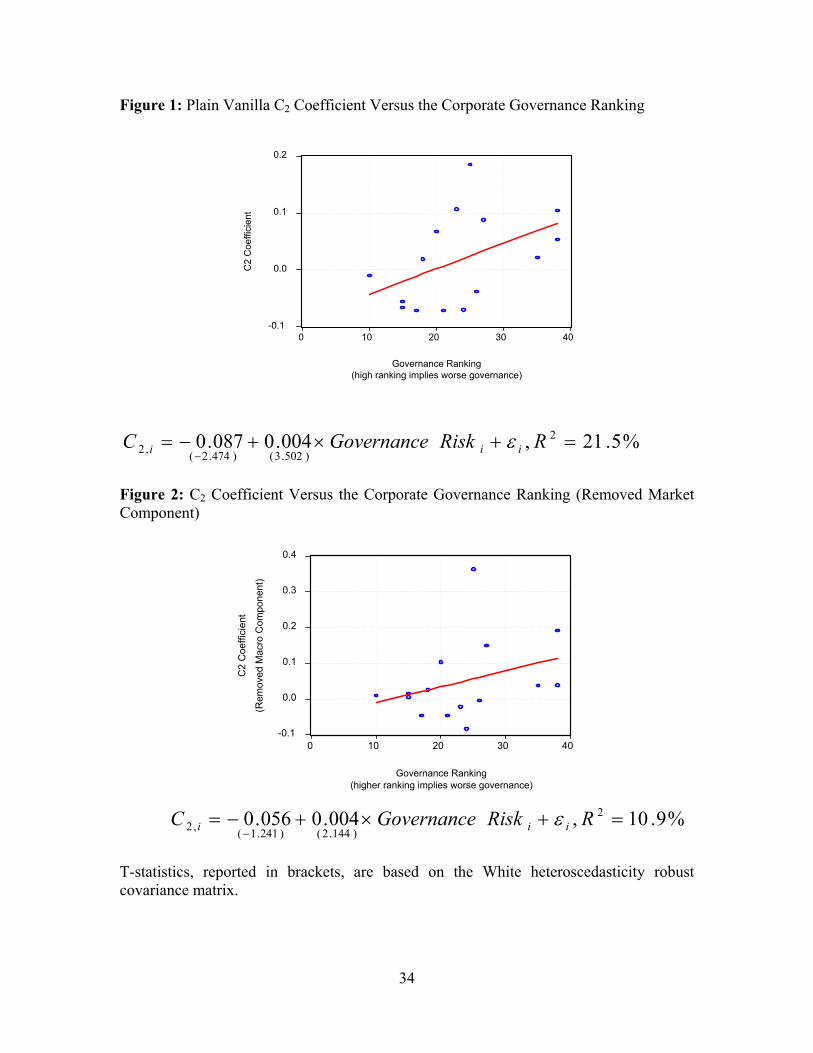
Figure 1: Plain Vanilla C2 Coefficient Versus the Corporate Governance Ranking
-0.1
0.0
0.1
0.2
0 10 20 30 40
Governance Ranking(high ranking implies worse governance)
C2
Coe
ffici
ent
%5.21,004.0087.0 2
)502.3()474.2(,2 =+×+−=−
RRiskGovernanceC iii ε
Figure 2: C2 Coefficient Versus the Corporate Governance Ranking (Removed Market Component)
-0.1
0.0
0.1
0.2
0.3
0.4
0 10 20 30 40
Governance Ranking(higher ranking implies worse governance)
C2
Coe
ffici
ent
(Rem
oved
Mac
ro C
ompo
nent
)
%9.10,004.0056.0 2
)144.2()241.1(,2 =+×+−=−
RRiskGovernanceC iii ε
T-statistics, reported in brackets, are based on the White heteroscedasticity robust covariance matrix.
34
Appendix.
Table 1. Indicators of Shareholder Rights
The following variables have the value 1 if the commercial code of the country or the company's governing documents requires the indicator. Notation Variable Connotation OSOVi “One share-one
vote” Ordinary shares carry one vote per share.
OMNi “Oppressed minority mechanism”
Minority shareholders have either a judicial venue in which to challenge the decisions of management or the assembly (shareholder meeting), or the right to require the company to purchase their shares when they object to certain fundamental changes in capital or in the articles of incorporation. Minority shareholders are defined as those who own 10% or less of share capital.
PRIi “Pre-emptive Rights to Issue”
Shareholders have the first opportunity to buy new shares of stock, and this right can be waived only by a shareholders’ vote.
SNBi “Shares Not Blocked Before Meeting”
Firms are not allowed to require that shareholders deposit their shares prior to a general shareholders’ meeting.
CumVoti “Cumulative Voting, Proportional Representation”
Shareholders can cast all their votes for one candidate standing for the board of directors (cumulative voting) or there is a mechanism of proportional representation in the board by which minority shareholders can appoint a proportional number of directors. Data for this are from LaPorta et al (1998) Table 7.
Other variables and their value ranges: ESMi “Percentage of
Share Capital to Call an Extraordinary Shareholders’ Meeting”
The percentage ownership of share capital that entitles a shareholder to call extraordinary shareholder meeting. This varies from 1% to 33%.
COi “Concentrated Ownership”
This equals the mean ownership of the three largest investors in each of the 10 largest non-financial domestic firms.
Note. This list is taken from LaPorta et al (1998), Table 2.
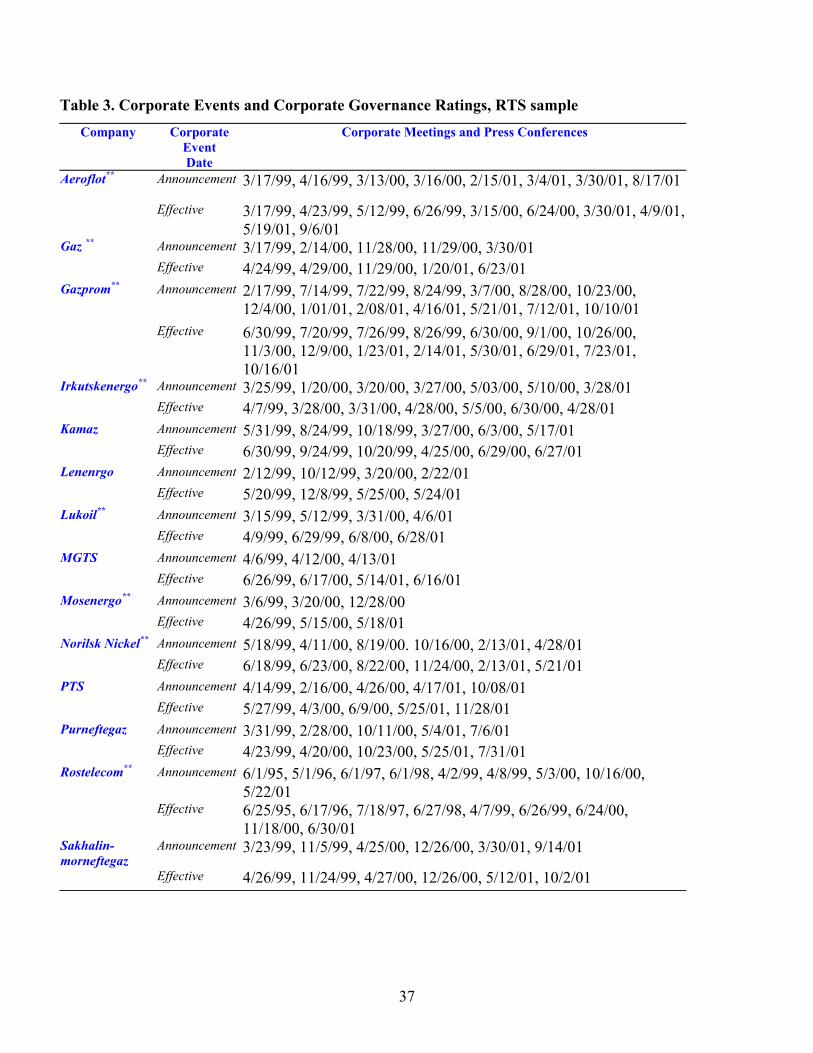
35
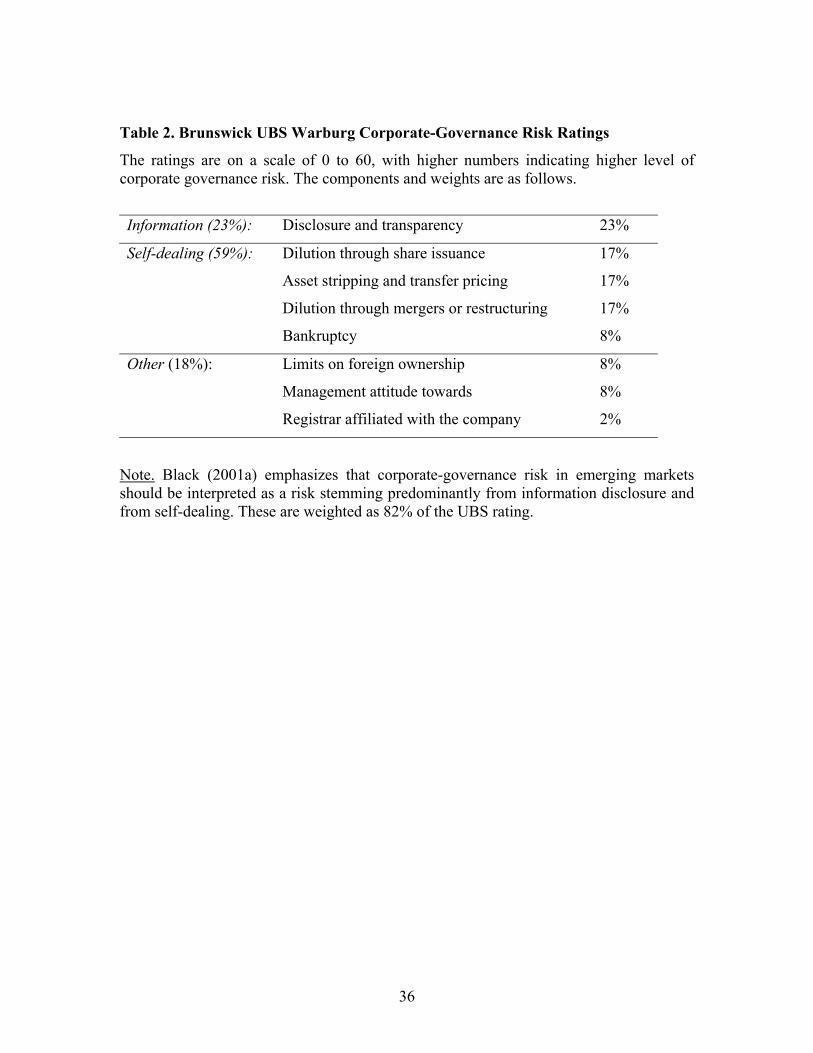
Table 2. Brunswick UBS Warburg Corporate-Governance Risk Ratings
The ratings are on a scale of 0 to 60, with higher numbers indicating higher level of corporate governance risk. The components and weights are as follows.
Information (23%): Disclosure and transparency 23%
Self-dealing (59%): Dilution through share issuance 17%
Asset stripping and transfer pricing 17%
Dilution through mergers or restructuring 17%
Bankruptcy 8%
Other (18%): Limits on foreign ownership 8%
Management attitude towards 8%
Registrar affiliated with the company 2%
Note. Black (2001a) emphasizes that corporate-governance risk in emerging markets should be interpreted as a risk stemming predominantly from information disclosure and from self-dealing. These are weighted as 82% of the UBS rating.
36
37
Table 3. Corporate Events and Corporate Governance Ratings, RTS sample Company Corporate
Event Date
Corporate Meetings and Press Conferences
Aeroflot**
Announcement 3/17/99, 4/16/99, 3/13/00, 3/16/00, 2/15/01, 3/4/01, 3/30/01, 8/17/01
Effective 3/17/99, 4/23/99, 5/12/99, 6/26/99, 3/15/00, 6/24/00, 3/30/01, 4/9/01, 5/19/01, 9/6/01
Gaz ** Announcement 3/17/99, 2/14/00, 11/28/00, 11/29/00, 3/30/01 Effective 4/24/99, 4/29/00, 11/29/00, 1/20/01, 6/23/01 Gazprom** Announcement 2/17/99, 7/14/99, 7/22/99, 8/24/99, 3/7/00, 8/28/00, 10/23/00,
12/4/00, 1/01/01, 2/08/01, 4/16/01, 5/21/01, 7/12/01, 10/10/01 Effective 6/30/99, 7/20/99, 7/26/99, 8/26/99, 6/30/00, 9/1/00, 10/26/00,
11/3/00, 12/9/00, 1/23/01, 2/14/01, 5/30/01, 6/29/01, 7/23/01, 10/16/01
Irkutskenergo** Announcement 3/25/99, 1/20/00, 3/20/00, 3/27/00, 5/03/00, 5/10/00, 3/28/01 Effective 4/7/99, 3/28/00, 3/31/00, 4/28/00, 5/5/00, 6/30/00, 4/28/01 Kamaz Announcement 5/31/99, 8/24/99, 10/18/99, 3/27/00, 6/3/00, 5/17/01 Effective 6/30/99, 9/24/99, 10/20/99, 4/25/00, 6/29/00, 6/27/01 Lenenrgo Announcement 2/12/99, 10/12/99, 3/20/00, 2/22/01 Effective 5/20/99, 12/8/99, 5/25/00, 5/24/01 Lukoil** Announcement 3/15/99, 5/12/99, 3/31/00, 4/6/01 Effective 4/9/99, 6/29/99, 6/8/00, 6/28/01 MGTS Announcement 4/6/99, 4/12/00, 4/13/01 Effective 6/26/99, 6/17/00, 5/14/01, 6/16/01 Mosenergo** Announcement 3/6/99, 3/20/00, 12/28/00 Effective 4/26/99, 5/15/00, 5/18/01 Norilsk Nickel** Announcement 5/18/99, 4/11/00, 8/19/00. 10/16/00, 2/13/01, 4/28/01 Effective 6/18/99, 6/23/00, 8/22/00, 11/24/00, 2/13/01, 5/21/01 PTS Announcement 4/14/99, 2/16/00, 4/26/00, 4/17/01, 10/08/01 Effective 5/27/99, 4/3/00, 6/9/00, 5/25/01, 11/28/01 Purneftegaz Announcement 3/31/99, 2/28/00, 10/11/00, 5/4/01, 7/6/01 Effective 4/23/99, 4/20/00, 10/23/00, 5/25/01, 7/31/01 Rostelecom** Announcement 6/1/95, 5/1/96, 6/1/97, 6/1/98, 4/2/99, 4/8/99, 5/3/00, 10/16/00,
5/22/01 Effective 6/25/95, 6/17/96, 7/18/97, 6/27/98, 4/7/99, 6/26/99, 6/24/00,
11/18/00, 6/30/01 Sakhalin-morneftegaz
Announcement 3/23/99, 11/5/99, 4/25/00, 12/26/00, 3/30/01, 9/14/01
Effective 4/26/99, 11/24/99, 4/27/00, 12/26/00, 5/12/01, 10/2/01
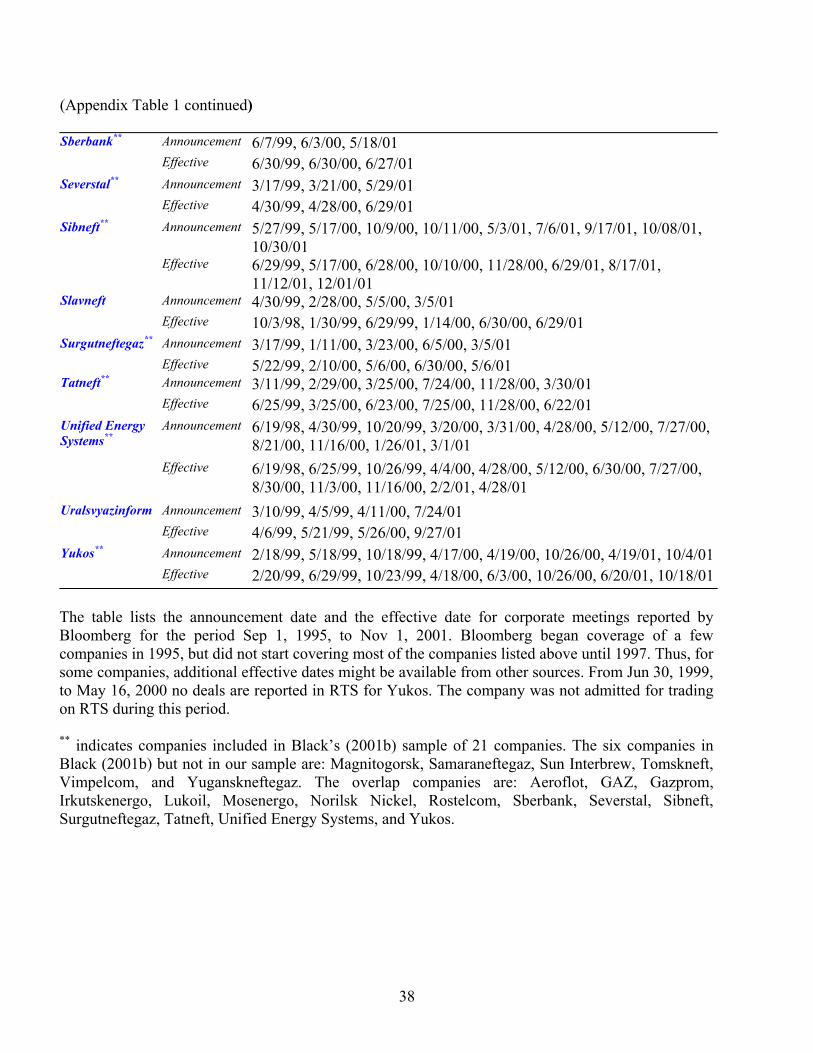
38
(Appendix Table 1 continued) Sberbank** Announcement 6/7/99, 6/3/00, 5/18/01 Effective 6/30/99, 6/30/00, 6/27/01 Severstal** Announcement 3/17/99, 3/21/00, 5/29/01 Effective 4/30/99, 4/28/00, 6/29/01 Sibneft** Announcement 5/27/99, 5/17/00, 10/9/00, 10/11/00, 5/3/01, 7/6/01, 9/17/01, 10/08/01,
10/30/01 Effective 6/29/99, 5/17/00, 6/28/00, 10/10/00, 11/28/00, 6/29/01, 8/17/01,
11/12/01, 12/01/01 Slavneft Announcement 4/30/99, 2/28/00, 5/5/00, 3/5/01 Effective 10/3/98, 1/30/99, 6/29/99, 1/14/00, 6/30/00, 6/29/01 Surgutneftegaz** Announcement 3/17/99, 1/11/00, 3/23/00, 6/5/00, 3/5/01 Effective 5/22/99, 2/10/00, 5/6/00, 6/30/00, 5/6/01 Tatneft** Announcement 3/11/99, 2/29/00, 3/25/00, 7/24/00, 11/28/00, 3/30/01 Effective 6/25/99, 3/25/00, 6/23/00, 7/25/00, 11/28/00, 6/22/01 Unified Energy Systems**
Announcement 6/19/98, 4/30/99, 10/20/99, 3/20/00, 3/31/00, 4/28/00, 5/12/00, 7/27/00, 8/21/00, 11/16/00, 1/26/01, 3/1/01
Effective 6/19/98, 6/25/99, 10/26/99, 4/4/00, 4/28/00, 5/12/00, 6/30/00, 7/27/00, 8/30/00, 11/3/00, 11/16/00, 2/2/01, 4/28/01
Uralsvyazinform Announcement 3/10/99, 4/5/99, 4/11/00, 7/24/01 Effective 4/6/99, 5/21/99, 5/26/00, 9/27/01 Yukos** Announcement 2/18/99, 5/18/99, 10/18/99, 4/17/00, 4/19/00, 10/26/00, 4/19/01, 10/4/01 Effective 2/20/99, 6/29/99, 10/23/99, 4/18/00, 6/3/00, 10/26/00, 6/20/01, 10/18/01 The table lists the announcement date and the effective date for corporate meetings reported by Bloomberg for the period Sep 1, 1995, to Nov 1, 2001. Bloomberg began coverage of a few companies in 1995, but did not start covering most of the companies listed above until 1997. Thus, for some companies, additional effective dates might be available from other sources. From Jun 30, 1999, to May 16, 2000 no deals are reported in RTS for Yukos. The company was not admitted for trading on RTS during this period. ** indicates companies included in Black’s (2001b) sample of 21 companies. The six companies in Black (2001b) but not in our sample are: Magnitogorsk, Samaraneftegaz, Sun Interbrew, Tomskneft, Vimpelcom, and Yuganskneftegaz. The overlap companies are: Aeroflot, GAZ, Gazprom, Irkutskenergo, Lukoil, Mosenergo, Norilsk Nickel, Rostelcom, Sberbank, Severstal, Sibneft, Surgutneftegaz, Tatneft, Unified Energy Systems, and Yukos.