Embed Size (px)
Citation preview
Division of Investment Management
Analytics Office
Private Funds Statistics
Fourth Calendar Quarter 2020
August 4, 2021
This is a report of the Staff of the Division of Investment Management’s Analytics Office of the U.S.
Securities and Exchange Commission. The Commission has expressed no view regarding the analysis,
findings, or conclusions contained herein.
August 4, 2021 Analytics Office
Introduction
This report provides a summary of recent private fund industry statistics and trends, reflectingdata collected through Form PF and Form ADV filings.1 Form PF information provided in thisreport is aggregated, rounded, and/or masked to avoid potential disclosure of proprietaryinformation of individual Form PF filers.
This report reflects data from First Calendar Quarter 2019 through Fourth Calendar Quarter2020 as reported by Form PF filers.2 Please see the Appendix for information on the categories ofForm PF filers, the definitions of capitalized terms, a description of the boxplots used in severalfigures, as well as other technical descriptions.
The Staff continues to work with data reported on Form PF and with filers to identifyand correct filing errors. Staff updates reported statistics based on amended filings andalso may make certain adjustments to the statistics presented to correct what appear tobe clear filing errors. Further, the Staff has employed certain assumptions in aggregatingthe data. Future adjustments to these methodologies and amended filings that changethe underlying data could lead to changes in previously reported statistics.
If you have any questions or comments about Fourth Calendar Quarter2020 Private Funds Statistics, please contact:
Tim Dulaney, PhD, FRM, Tim Husson, PhD, FRM, or Trevor Tatum at [email protected] with subjectline “Fourth Calendar Quarter 2020-Private Funds Statistics”.
1Only SEC-registered advisers with at least $150 million in private fund assets under management must report to theCommission on Form PF. SEC-registered investment advisers with less than $150 million in private fund assets undermanagement, SEC exempt reporting advisers, and state-registered investment advisers are not required to file Form PF,but report general information about the private funds they manage on Form ADV.2The Commission began receiving Form PF filings from Large Hedge Fund Advisers in July 2012. A full data set was
not received until March 2013. This report relies upon the Form PF database constructed and maintained by the Officeof Research and Data Services in the Division of Economic and Risk Analysis.
1
Contents
I Number of Funds and Advisers 4
II Gross and Net Assets 5A Aggregate Assets by Fund Type over Time . . . . . . . . . . . . . . . . . . . . . . . . 5B Borrowings . . . . . . . . . . . . . . . . . . . . . . . . . . . . . . . . . . . . . . . . . . 8C Fair Value Hierarchy . . . . . . . . . . . . . . . . . . . . . . . . . . . . . . . . . . . . . 10D Parallel Managed Accounts . . . . . . . . . . . . . . . . . . . . . . . . . . . . . . . . . 11
III Fund Domiciles and Adviser Main Offices 13
IV Beneficial Ownership 15A All Private Funds . . . . . . . . . . . . . . . . . . . . . . . . . . . . . . . . . . . . . . . 15B Qualifying Hedge Funds . . . . . . . . . . . . . . . . . . . . . . . . . . . . . . . . . . . 16C Section 3 Liquidity Funds . . . . . . . . . . . . . . . . . . . . . . . . . . . . . . . . . . 17D Section 4 Private Equity Funds . . . . . . . . . . . . . . . . . . . . . . . . . . . . . . . 18E Concentration . . . . . . . . . . . . . . . . . . . . . . . . . . . . . . . . . . . . . . . . . 19
V Derivatives 20
VI Additional Hedge Fund Industry Information 21A High Frequency Trading . . . . . . . . . . . . . . . . . . . . . . . . . . . . . . . . . . . 21B Industry Concentration . . . . . . . . . . . . . . . . . . . . . . . . . . . . . . . . . . . 22C Single-Strategy US-Domiciled Hedge Funds . . . . . . . . . . . . . . . . . . . . . . . . 24D Single-Strategy Non-US-Domiciled Hedge Funds . . . . . . . . . . . . . . . . . . . . . 26
VII Information Reported by Large Hedge Fund Advisers 28A Economic Leverage . . . . . . . . . . . . . . . . . . . . . . . . . . . . . . . . . . . . . . 28B Industry Concentration . . . . . . . . . . . . . . . . . . . . . . . . . . . . . . . . . . . 30C Portfolio Turnover . . . . . . . . . . . . . . . . . . . . . . . . . . . . . . . . . . . . . . 31D Region and Country Exposure . . . . . . . . . . . . . . . . . . . . . . . . . . . . . . . 32
VIII Qualifying Hedge Fund Specific Information 34A Economic Leverage . . . . . . . . . . . . . . . . . . . . . . . . . . . . . . . . . . . . . . 34B Gross Exposure by Strategy . . . . . . . . . . . . . . . . . . . . . . . . . . . . . . . . . 36C Leverage by Strategy . . . . . . . . . . . . . . . . . . . . . . . . . . . . . . . . . . . . . 38D Investment Exposures . . . . . . . . . . . . . . . . . . . . . . . . . . . . . . . . . . . . 39E Number of Positions . . . . . . . . . . . . . . . . . . . . . . . . . . . . . . . . . . . . . 41F Liquidity . . . . . . . . . . . . . . . . . . . . . . . . . . . . . . . . . . . . . . . . . . . 42G Borrowings . . . . . . . . . . . . . . . . . . . . . . . . . . . . . . . . . . . . . . . . . . 44H Central Clearing . . . . . . . . . . . . . . . . . . . . . . . . . . . . . . . . . . . . . . . 47I Value-at-Risk (“VaR”) Reporting . . . . . . . . . . . . . . . . . . . . . . . . . . . . . . 48
2
August 4, 2021 Analytics Office
J Stress Testing and VaR . . . . . . . . . . . . . . . . . . . . . . . . . . . . . . . . . . . 49K Stress Testing . . . . . . . . . . . . . . . . . . . . . . . . . . . . . . . . . . . . . . . . . 50
IX Section 3 Liquidity Fund Specific Information 52A Liquidity . . . . . . . . . . . . . . . . . . . . . . . . . . . . . . . . . . . . . . . . . . . 52B Portfolio Characteristics . . . . . . . . . . . . . . . . . . . . . . . . . . . . . . . . . . . 52C Rule 2a-7 Compliance . . . . . . . . . . . . . . . . . . . . . . . . . . . . . . . . . . . . 55D Methods of Calculating NAV . . . . . . . . . . . . . . . . . . . . . . . . . . . . . . . . 55E Aggregate Portfolio Holdings . . . . . . . . . . . . . . . . . . . . . . . . . . . . . . . . 56
X Section 4 Private Equity Fund Specific Information 57A CPC Industry Concentration . . . . . . . . . . . . . . . . . . . . . . . . . . . . . . . . 57B CPC Financial Leverage . . . . . . . . . . . . . . . . . . . . . . . . . . . . . . . . . . . 58C CPC Investments by Region and Country . . . . . . . . . . . . . . . . . . . . . . . . . 59
XI Appendices 61A Form PF Filer Categories . . . . . . . . . . . . . . . . . . . . . . . . . . . . . . . . . . 61
1 All Private Fund Advisers . . . . . . . . . . . . . . . . . . . . . . . . . . . . . . 612 Large Hedge Fund Advisers . . . . . . . . . . . . . . . . . . . . . . . . . . . . . 613 Large Liquidity Fund Advisers . . . . . . . . . . . . . . . . . . . . . . . . . . . 624 Large Private Equity Fund Advisers . . . . . . . . . . . . . . . . . . . . . . . . 625 Other Private Fund Advisers . . . . . . . . . . . . . . . . . . . . . . . . . . . . 62
B Handling Annual and Quarterly Data . . . . . . . . . . . . . . . . . . . . . . . . . . . 63C How to Read a Boxplot . . . . . . . . . . . . . . . . . . . . . . . . . . . . . . . . . . . 63D Mitigating the Effects of Outliers . . . . . . . . . . . . . . . . . . . . . . . . . . . . . . 64E Definitions . . . . . . . . . . . . . . . . . . . . . . . . . . . . . . . . . . . . . . . . . . . 65
3
August 4, 2021 Analytics Office
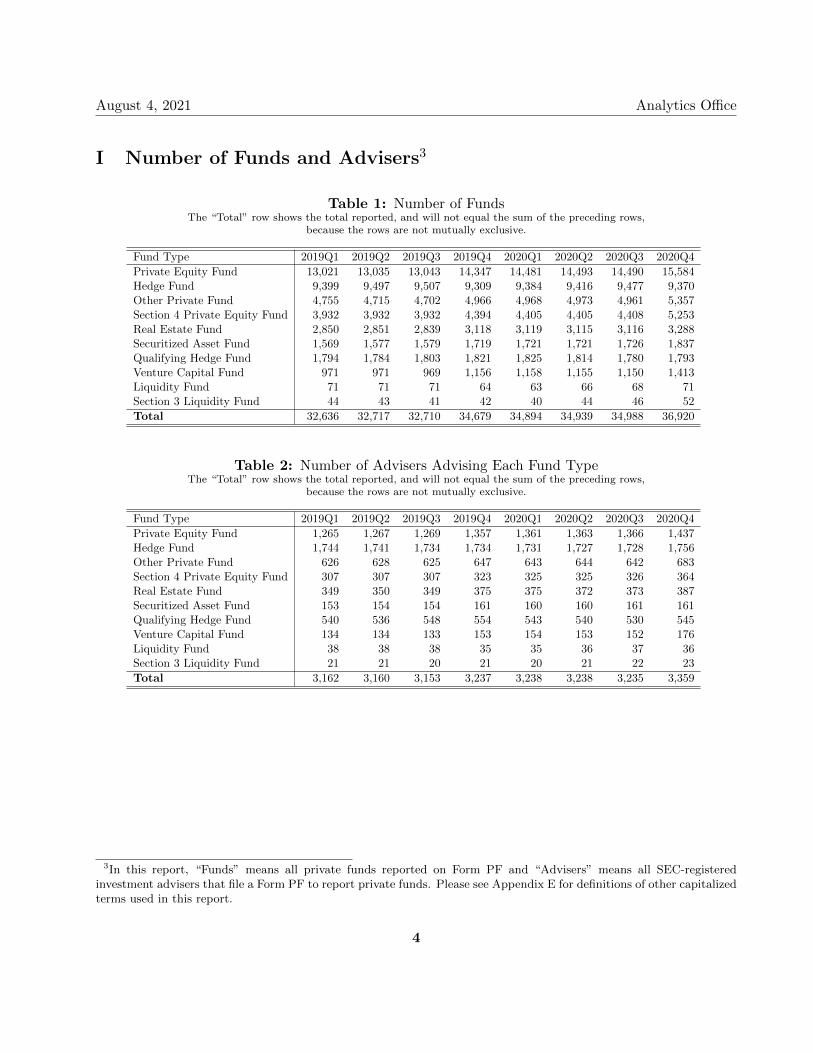
I Number of Funds and Advisers3
Table 1: Number of FundsThe “Total” row shows the total reported, and will not equal the sum of the preceding rows,
because the rows are not mutually exclusive.
Fund Type 2019Q1 2019Q2 2019Q3 2019Q4 2020Q1 2020Q2 2020Q3 2020Q4
Private Equity Fund 13,021 13,035 13,043 14,347 14,481 14,493 14,490 15,584Hedge Fund 9,399 9,497 9,507 9,309 9,384 9,416 9,477 9,370Other Private Fund 4,755 4,715 4,702 4,966 4,968 4,973 4,961 5,357Section 4 Private Equity Fund 3,932 3,932 3,932 4,394 4,405 4,405 4,408 5,253Real Estate Fund 2,850 2,851 2,839 3,118 3,119 3,115 3,116 3,288Securitized Asset Fund 1,569 1,577 1,579 1,719 1,721 1,721 1,726 1,837Qualifying Hedge Fund 1,794 1,784 1,803 1,821 1,825 1,814 1,780 1,793Venture Capital Fund 971 971 969 1,156 1,158 1,155 1,150 1,413Liquidity Fund 71 71 71 64 63 66 68 71Section 3 Liquidity Fund 44 43 41 42 40 44 46 52
Total 32,636 32,717 32,710 34,679 34,894 34,939 34,988 36,920
Table 2: Number of Advisers Advising Each Fund TypeThe “Total” row shows the total reported, and will not equal the sum of the preceding rows,
because the rows are not mutually exclusive.
Fund Type 2019Q1 2019Q2 2019Q3 2019Q4 2020Q1 2020Q2 2020Q3 2020Q4
Private Equity Fund 1,265 1,267 1,269 1,357 1,361 1,363 1,366 1,437Hedge Fund 1,744 1,741 1,734 1,734 1,731 1,727 1,728 1,756Other Private Fund 626 628 625 647 643 644 642 683Section 4 Private Equity Fund 307 307 307 323 325 325 326 364Real Estate Fund 349 350 349 375 375 372 373 387Securitized Asset Fund 153 154 154 161 160 160 161 161Qualifying Hedge Fund 540 536 548 554 543 540 530 545Venture Capital Fund 134 134 133 153 154 153 152 176Liquidity Fund 38 38 38 35 35 36 37 36Section 3 Liquidity Fund 21 21 20 21 20 21 22 23
Total 3,162 3,160 3,153 3,237 3,238 3,238 3,235 3,359
3In this report, “Funds” means all private funds reported on Form PF and “Advisers” means all SEC-registeredinvestment advisers that file a Form PF to report private funds. Please see Appendix E for definitions of other capitalizedterms used in this report.
4
August 4, 2021 Analytics Office
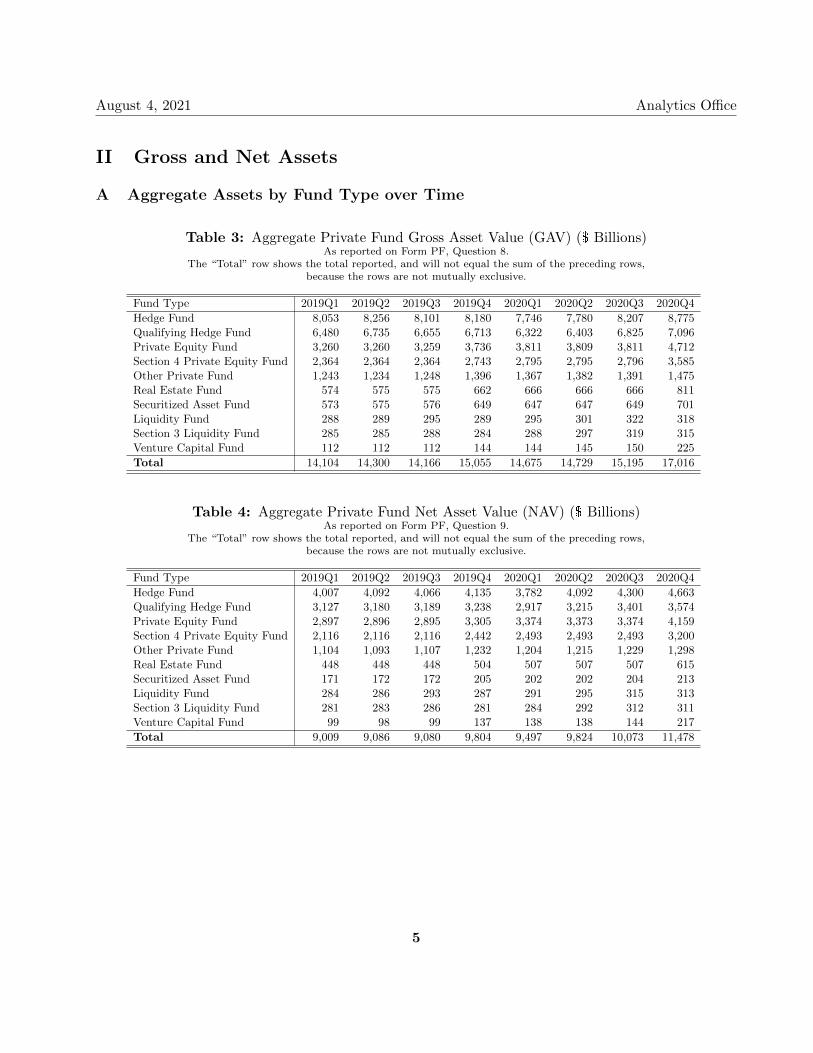
II Gross and Net Assets
A Aggregate Assets by Fund Type over Time
Table 3: Aggregate Private Fund Gross Asset Value (GAV) ($ Billions)As reported on Form PF, Question 8.
The “Total” row shows the total reported, and will not equal the sum of the preceding rows,because the rows are not mutually exclusive.
Fund Type 2019Q1 2019Q2 2019Q3 2019Q4 2020Q1 2020Q2 2020Q3 2020Q4
Hedge Fund 8,053 8,256 8,101 8,180 7,746 7,780 8,207 8,775Qualifying Hedge Fund 6,480 6,735 6,655 6,713 6,322 6,403 6,825 7,096Private Equity Fund 3,260 3,260 3,259 3,736 3,811 3,809 3,811 4,712Section 4 Private Equity Fund 2,364 2,364 2,364 2,743 2,795 2,795 2,796 3,585Other Private Fund 1,243 1,234 1,248 1,396 1,367 1,382 1,391 1,475Real Estate Fund 574 575 575 662 666 666 666 811Securitized Asset Fund 573 575 576 649 647 647 649 701Liquidity Fund 288 289 295 289 295 301 322 318Section 3 Liquidity Fund 285 285 288 284 288 297 319 315Venture Capital Fund 112 112 112 144 144 145 150 225
Total 14,104 14,300 14,166 15,055 14,675 14,729 15,195 17,016
Table 4: Aggregate Private Fund Net Asset Value (NAV) ($ Billions)As reported on Form PF, Question 9.
The “Total” row shows the total reported, and will not equal the sum of the preceding rows,because the rows are not mutually exclusive.
Fund Type 2019Q1 2019Q2 2019Q3 2019Q4 2020Q1 2020Q2 2020Q3 2020Q4
Hedge Fund 4,007 4,092 4,066 4,135 3,782 4,092 4,300 4,663Qualifying Hedge Fund 3,127 3,180 3,189 3,238 2,917 3,215 3,401 3,574Private Equity Fund 2,897 2,896 2,895 3,305 3,374 3,373 3,374 4,159Section 4 Private Equity Fund 2,116 2,116 2,116 2,442 2,493 2,493 2,493 3,200Other Private Fund 1,104 1,093 1,107 1,232 1,204 1,215 1,229 1,298Real Estate Fund 448 448 448 504 507 507 507 615Securitized Asset Fund 171 172 172 205 202 202 204 213Liquidity Fund 284 286 293 287 291 295 315 313Section 3 Liquidity Fund 281 283 286 281 284 292 312 311Venture Capital Fund 99 98 99 137 138 138 144 217
Total 9,009 9,086 9,080 9,804 9,497 9,824 10,073 11,478
5
August 4, 2021 Analytics Office
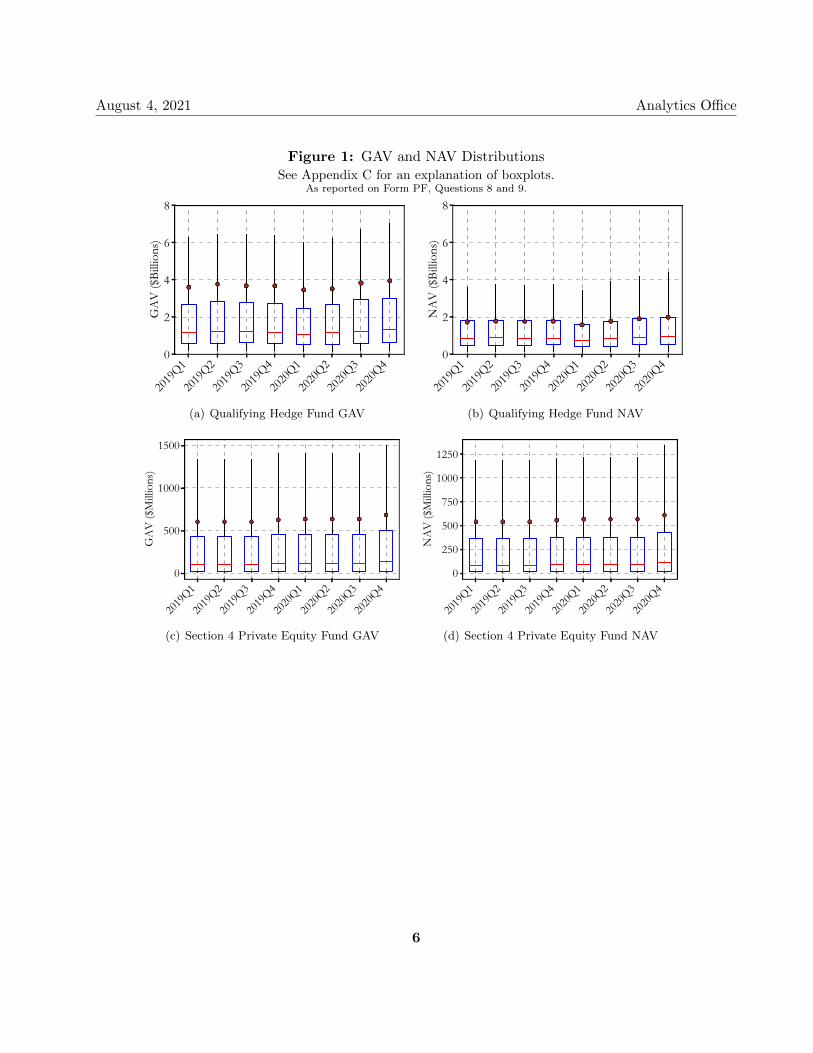
Figure 1: GAV and NAV DistributionsSee Appendix C for an explanation of boxplots.
As reported on Form PF, Questions 8 and 9.
2019
Q1
2019
Q2
2019
Q3
2019
Q4
2020
Q1
2020
Q2
2020
Q3
2020
Q40
2
4
6
8
GA
V ($
Billi
ons)
(a) Qualifying Hedge Fund GAV
2019
Q1
2019
Q2
2019
Q3
2019
Q4
2020
Q1
2020
Q2
2020
Q3
2020
Q40
2
4
6
8
NA
V ($
Billi
ons)
(b) Qualifying Hedge Fund NAV
2019
Q1
2019
Q2
2019
Q3
2019
Q4
2020
Q1
2020
Q2
2020
Q3
2020
Q40
500
1000
1500
GA
V ($
Mill
ions
)
(c) Section 4 Private Equity Fund GAV
2019
Q1
2019
Q2
2019
Q3
2019
Q4
2020
Q1
2020
Q2
2020
Q3
2020
Q40
250
500
750
1000
1250
NA
V ($
Mill
ions
)
(d) Section 4 Private Equity Fund NAV
6
August 4, 2021 Analytics Office
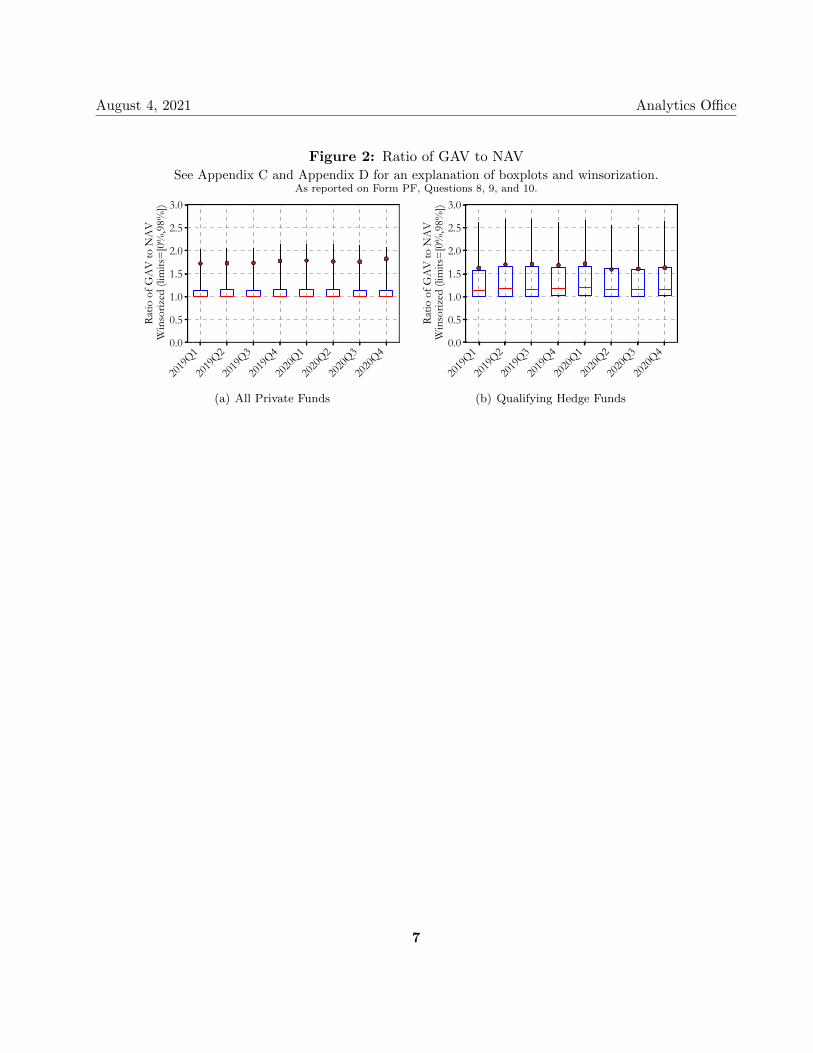
Figure 2: Ratio of GAV to NAVSee Appendix C and Appendix D for an explanation of boxplots and winsorization.
As reported on Form PF, Questions 8, 9, and 10.
2019
Q1
2019
Q2
2019
Q3
2019
Q4
2020
Q1
2020
Q2
2020
Q3
2020
Q40.0
0.5
1.0
1.5
2.0
2.5
3.0
Ratio
of G
AV
to N
AV
Win
soriz
ed (l
imits
=[0
%,9
8%])
(a) All Private Funds
2019
Q1
2019
Q2
2019
Q3
2019
Q4
2020
Q1
2020
Q2
2020
Q3
2020
Q40.0
0.5
1.0
1.5
2.0
2.5
3.0
Ratio
of G
AV
to N
AV
Win
soriz
ed (l
imits
=[0
%,9
8%])
(b) Qualifying Hedge Funds
7
August 4, 2021 Analytics Office
B Borrowings
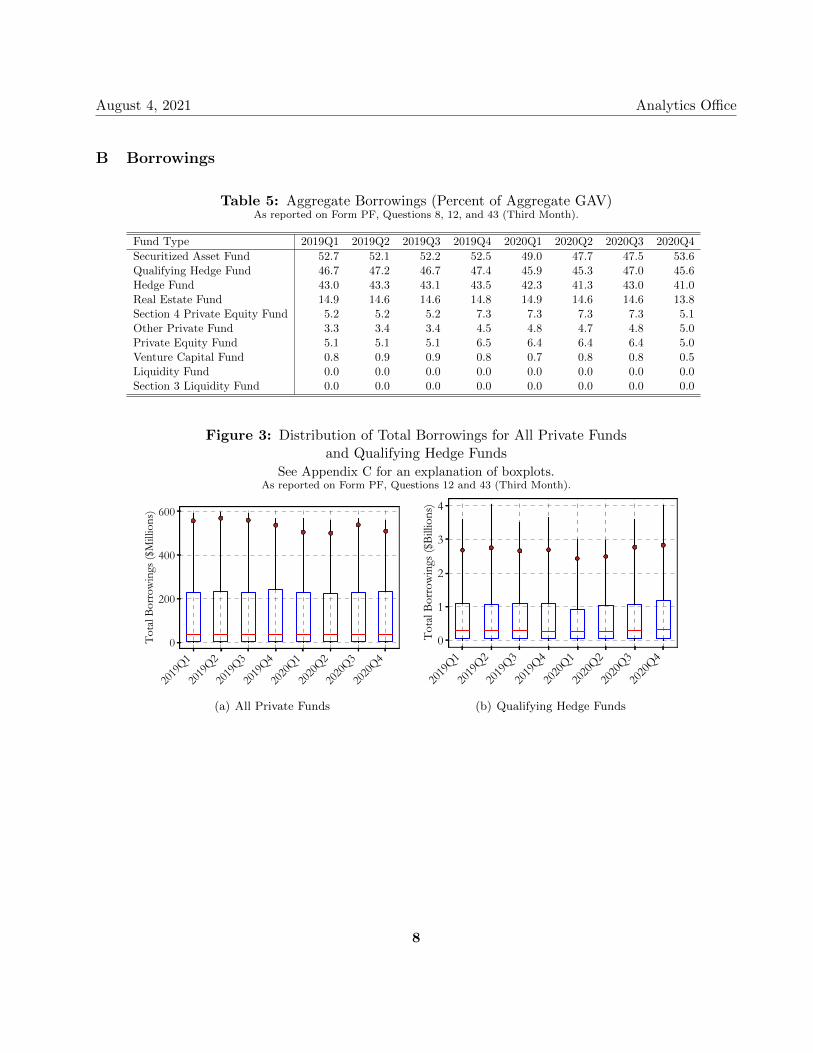
Table 5: Aggregate Borrowings (Percent of Aggregate GAV)As reported on Form PF, Questions 8, 12, and 43 (Third Month).
Fund Type 2019Q1 2019Q2 2019Q3 2019Q4 2020Q1 2020Q2 2020Q3 2020Q4
Securitized Asset Fund 52.7 52.1 52.2 52.5 49.0 47.7 47.5 53.6Qualifying Hedge Fund 46.7 47.2 46.7 47.4 45.9 45.3 47.0 45.6Hedge Fund 43.0 43.3 43.1 43.5 42.3 41.3 43.0 41.0Real Estate Fund 14.9 14.6 14.6 14.8 14.9 14.6 14.6 13.8Section 4 Private Equity Fund 5.2 5.2 5.2 7.3 7.3 7.3 7.3 5.1Other Private Fund 3.3 3.4 3.4 4.5 4.8 4.7 4.8 5.0Private Equity Fund 5.1 5.1 5.1 6.5 6.4 6.4 6.4 5.0Venture Capital Fund 0.8 0.9 0.9 0.8 0.7 0.8 0.8 0.5Liquidity Fund 0.0 0.0 0.0 0.0 0.0 0.0 0.0 0.0Section 3 Liquidity Fund 0.0 0.0 0.0 0.0 0.0 0.0 0.0 0.0
Figure 3: Distribution of Total Borrowings for All Private Fundsand Qualifying Hedge Funds
See Appendix C for an explanation of boxplots.As reported on Form PF, Questions 12 and 43 (Third Month).
2019
Q1
2019
Q2
2019
Q3
2019
Q4
2020
Q1
2020
Q2
2020
Q3
2020
Q40
200
400
600
Tota
l Bor
row
ings
($M
illio
ns)
(a) All Private Funds
2019
Q1
2019
Q2
2019
Q3
2019
Q4
2020
Q1
2020
Q2
2020
Q3
2020
Q40
1
2
3
4
Tota
l Bor
row
ings
($Bi
llion
s)
(b) Qualifying Hedge Funds
8
August 4, 2021 Analytics Office
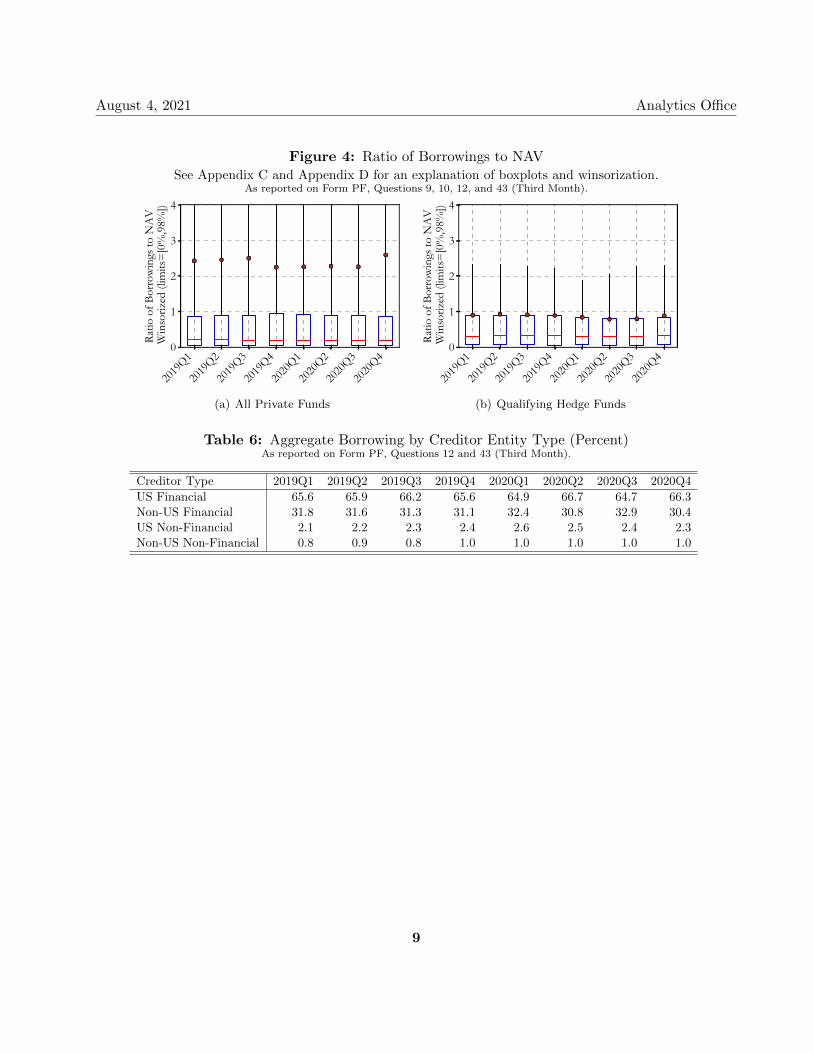
Figure 4: Ratio of Borrowings to NAVSee Appendix C and Appendix D for an explanation of boxplots and winsorization.
As reported on Form PF, Questions 9, 10, 12, and 43 (Third Month).
2019
Q1
2019
Q2
2019
Q3
2019
Q4
2020
Q1
2020
Q2
2020
Q3
2020
Q40
1
2
3
4
Ratio
of B
orro
win
gs to
NA
V W
inso
rized
(lim
its=
[0%
,98%
])
(a) All Private Funds
2019
Q1
2019
Q2
2019
Q3
2019
Q4
2020
Q1
2020
Q2
2020
Q3
2020
Q40
1
2
3
4
Ratio
of B
orro
win
gs to
NA
V W
inso
rized
(lim
its=
[0%
,98%
])
(b) Qualifying Hedge Funds
Table 6: Aggregate Borrowing by Creditor Entity Type (Percent)As reported on Form PF, Questions 12 and 43 (Third Month).
Creditor Type 2019Q1 2019Q2 2019Q3 2019Q4 2020Q1 2020Q2 2020Q3 2020Q4
US Financial 65.6 65.9 66.2 65.6 64.9 66.7 64.7 66.3Non-US Financial 31.8 31.6 31.3 31.1 32.4 30.8 32.9 30.4US Non-Financial 2.1 2.2 2.3 2.4 2.6 2.5 2.4 2.3Non-US Non-Financial 0.8 0.9 0.8 1.0 1.0 1.0 1.0 1.0
9
August 4, 2021 Analytics Office
C Fair Value Hierarchy
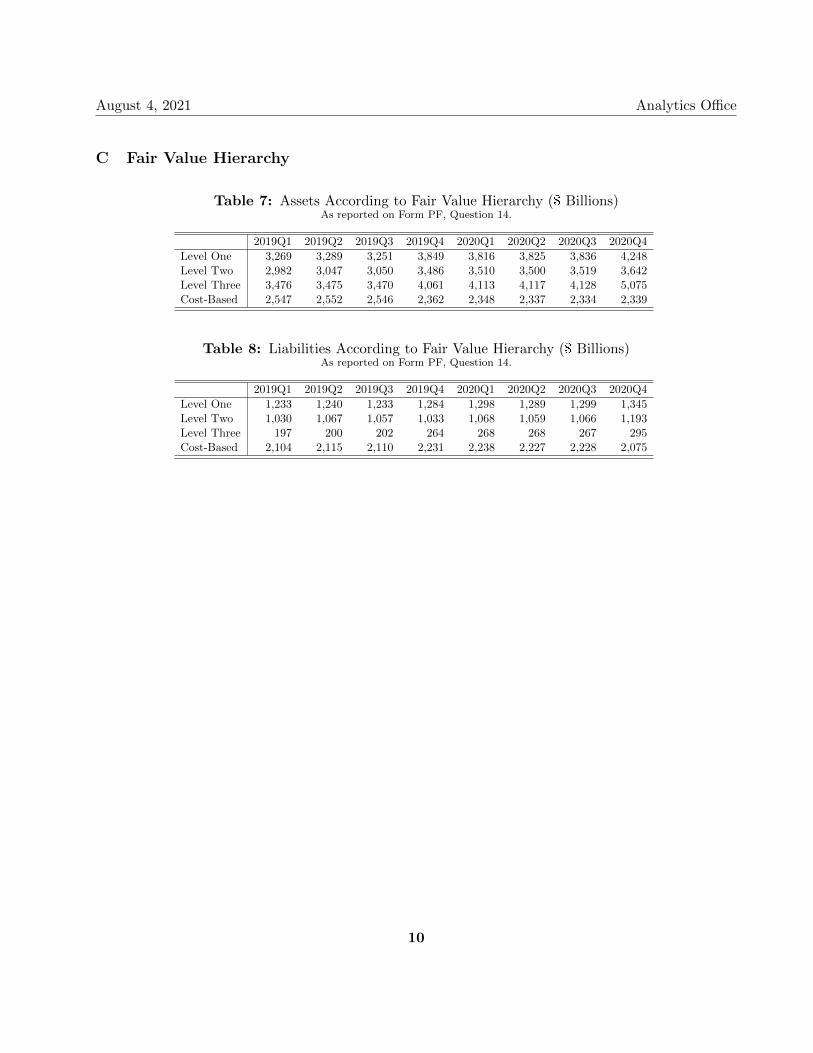
Table 7: Assets According to Fair Value Hierarchy ($ Billions)As reported on Form PF, Question 14.
2019Q1 2019Q2 2019Q3 2019Q4 2020Q1 2020Q2 2020Q3 2020Q4
Level One 3,269 3,289 3,251 3,849 3,816 3,825 3,836 4,248Level Two 2,982 3,047 3,050 3,486 3,510 3,500 3,519 3,642Level Three 3,476 3,475 3,470 4,061 4,113 4,117 4,128 5,075Cost-Based 2,547 2,552 2,546 2,362 2,348 2,337 2,334 2,339
Table 8: Liabilities According to Fair Value Hierarchy ($ Billions)As reported on Form PF, Question 14.
2019Q1 2019Q2 2019Q3 2019Q4 2020Q1 2020Q2 2020Q3 2020Q4
Level One 1,233 1,240 1,233 1,284 1,298 1,289 1,299 1,345Level Two 1,030 1,067 1,057 1,033 1,068 1,059 1,066 1,193Level Three 197 200 202 264 268 268 267 295Cost-Based 2,104 2,115 2,110 2,231 2,238 2,227 2,228 2,075
10
August 4, 2021 Analytics Office
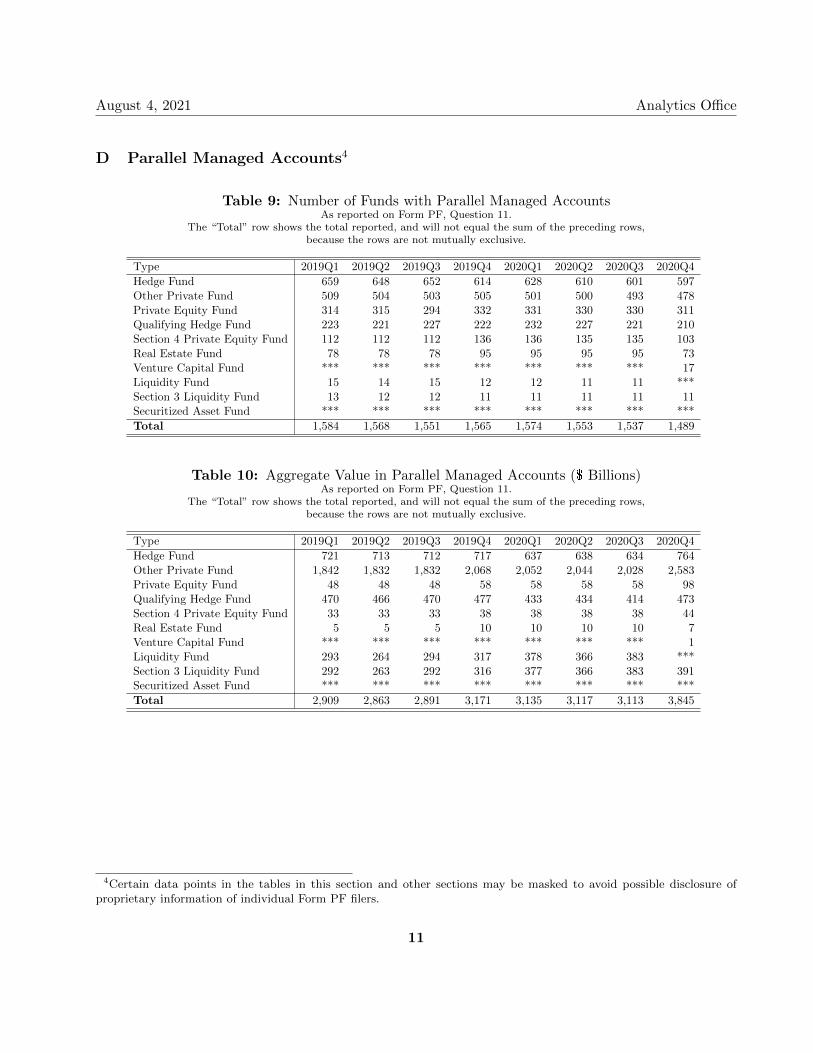
D Parallel Managed Accounts4
Table 9: Number of Funds with Parallel Managed AccountsAs reported on Form PF, Question 11.
The “Total” row shows the total reported, and will not equal the sum of the preceding rows,because the rows are not mutually exclusive.
Type 2019Q1 2019Q2 2019Q3 2019Q4 2020Q1 2020Q2 2020Q3 2020Q4
Hedge Fund 659 648 652 614 628 610 601 597Other Private Fund 509 504 503 505 501 500 493 478Private Equity Fund 314 315 294 332 331 330 330 311Qualifying Hedge Fund 223 221 227 222 232 227 221 210Section 4 Private Equity Fund 112 112 112 136 136 135 135 103Real Estate Fund 78 78 78 95 95 95 95 73Venture Capital Fund *** *** *** *** *** *** *** 17Liquidity Fund 15 14 15 12 12 11 11 ***Section 3 Liquidity Fund 13 12 12 11 11 11 11 11Securitized Asset Fund *** *** *** *** *** *** *** ***
Total 1,584 1,568 1,551 1,565 1,574 1,553 1,537 1,489
Table 10: Aggregate Value in Parallel Managed Accounts ($ Billions)As reported on Form PF, Question 11.
The “Total” row shows the total reported, and will not equal the sum of the preceding rows,because the rows are not mutually exclusive.
Type 2019Q1 2019Q2 2019Q3 2019Q4 2020Q1 2020Q2 2020Q3 2020Q4
Hedge Fund 721 713 712 717 637 638 634 764Other Private Fund 1,842 1,832 1,832 2,068 2,052 2,044 2,028 2,583Private Equity Fund 48 48 48 58 58 58 58 98Qualifying Hedge Fund 470 466 470 477 433 434 414 473Section 4 Private Equity Fund 33 33 33 38 38 38 38 44Real Estate Fund 5 5 5 10 10 10 10 7Venture Capital Fund *** *** *** *** *** *** *** 1Liquidity Fund 293 264 294 317 378 366 383 ***Section 3 Liquidity Fund 292 263 292 316 377 366 383 391Securitized Asset Fund *** *** *** *** *** *** *** ***
Total 2,909 2,863 2,891 3,171 3,135 3,117 3,113 3,845
4Certain data points in the tables in this section and other sections may be masked to avoid possible disclosure ofproprietary information of individual Form PF filers.
11
August 4, 2021 Analytics Office
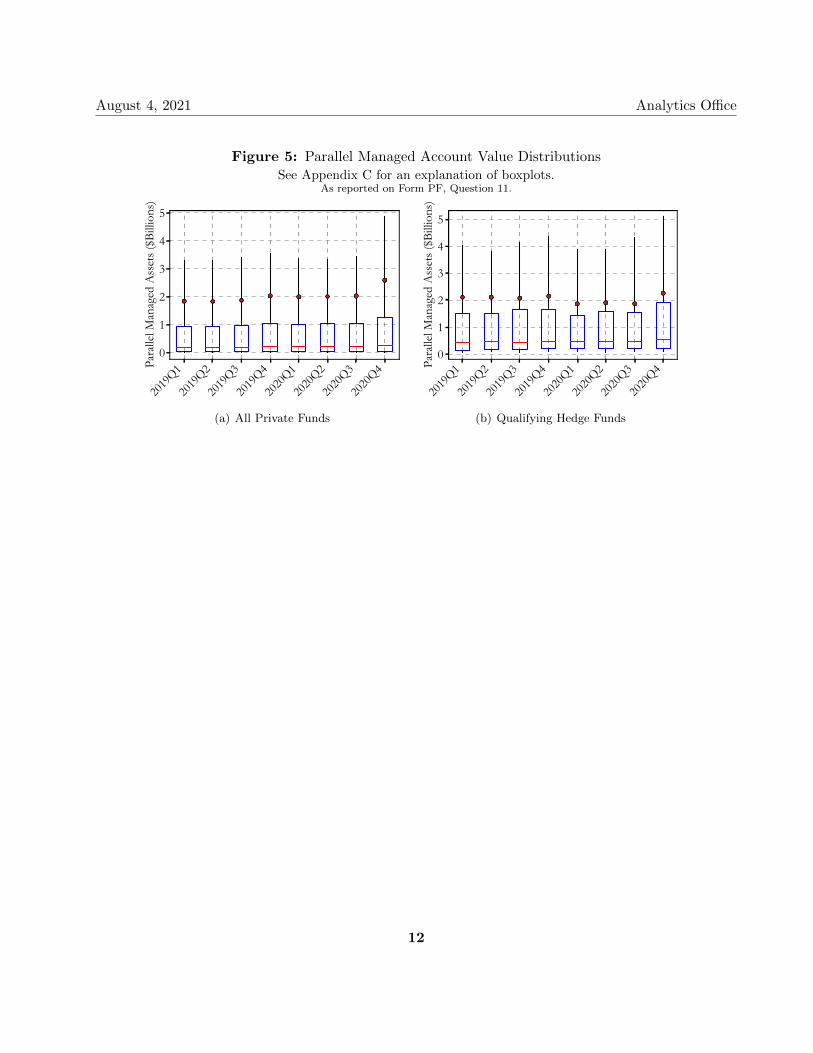
Figure 5: Parallel Managed Account Value DistributionsSee Appendix C for an explanation of boxplots.
As reported on Form PF, Question 11.
2019
Q1
2019
Q2
2019
Q3
2019
Q4
2020
Q1
2020
Q2
2020
Q3
2020
Q40
1
2
3
4
5
Para
llel M
anag
ed A
sset
s ($B
illio
ns)
(a) All Private Funds
2019
Q1
2019
Q2
2019
Q3
2019
Q4
2020
Q1
2020
Q2
2020
Q3
2020
Q40
1
2
3
4
5
Para
llel M
anag
ed A
sset
s ($B
illio
ns)
(b) Qualifying Hedge Funds
12
August 4, 2021 Analytics Office
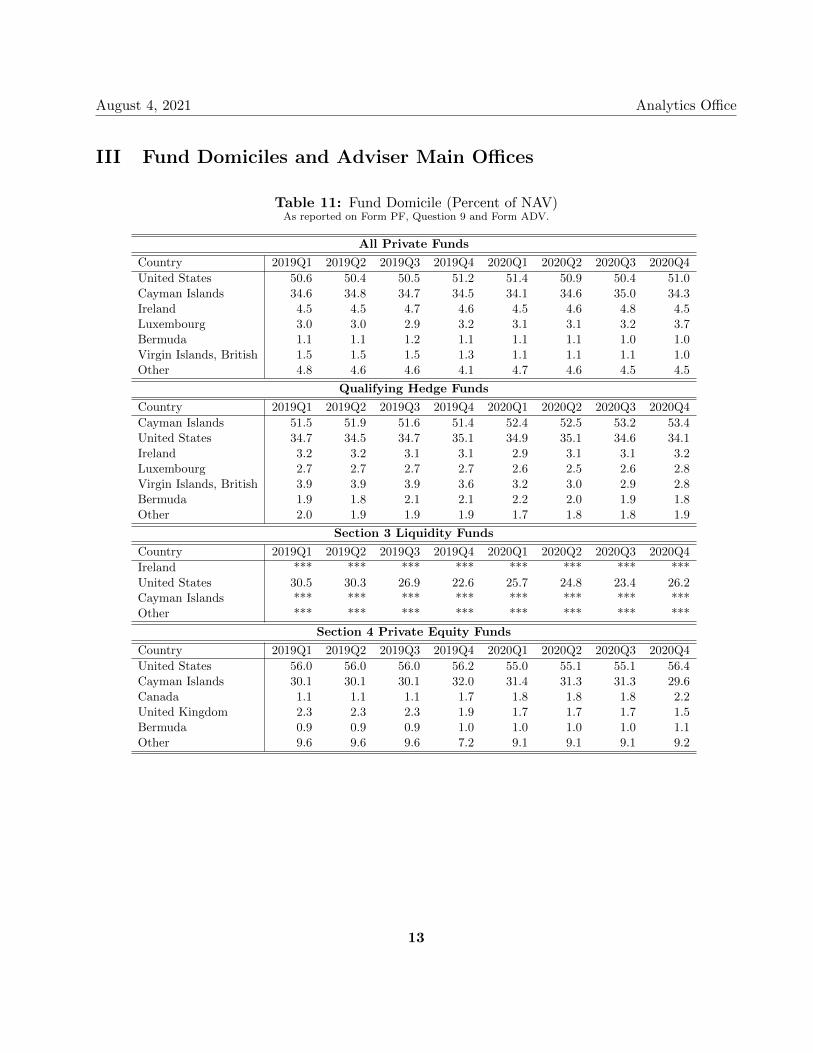
III Fund Domiciles and Adviser Main Offices
Table 11: Fund Domicile (Percent of NAV)As reported on Form PF, Question 9 and Form ADV.
All Private Funds
Country 2019Q1 2019Q2 2019Q3 2019Q4 2020Q1 2020Q2 2020Q3 2020Q4
United States 50.6 50.4 50.5 51.2 51.4 50.9 50.4 51.0Cayman Islands 34.6 34.8 34.7 34.5 34.1 34.6 35.0 34.3Ireland 4.5 4.5 4.7 4.6 4.5 4.6 4.8 4.5Luxembourg 3.0 3.0 2.9 3.2 3.1 3.1 3.2 3.7Bermuda 1.1 1.1 1.2 1.1 1.1 1.1 1.0 1.0Virgin Islands, British 1.5 1.5 1.5 1.3 1.1 1.1 1.1 1.0Other 4.8 4.6 4.6 4.1 4.7 4.6 4.5 4.5
Qualifying Hedge Funds
Country 2019Q1 2019Q2 2019Q3 2019Q4 2020Q1 2020Q2 2020Q3 2020Q4
Cayman Islands 51.5 51.9 51.6 51.4 52.4 52.5 53.2 53.4United States 34.7 34.5 34.7 35.1 34.9 35.1 34.6 34.1Ireland 3.2 3.2 3.1 3.1 2.9 3.1 3.1 3.2Luxembourg 2.7 2.7 2.7 2.7 2.6 2.5 2.6 2.8Virgin Islands, British 3.9 3.9 3.9 3.6 3.2 3.0 2.9 2.8Bermuda 1.9 1.8 2.1 2.1 2.2 2.0 1.9 1.8Other 2.0 1.9 1.9 1.9 1.7 1.8 1.8 1.9
Section 3 Liquidity Funds
Country 2019Q1 2019Q2 2019Q3 2019Q4 2020Q1 2020Q2 2020Q3 2020Q4
Ireland *** *** *** *** *** *** *** ***United States 30.5 30.3 26.9 22.6 25.7 24.8 23.4 26.2Cayman Islands *** *** *** *** *** *** *** ***Other *** *** *** *** *** *** *** ***
Section 4 Private Equity Funds
Country 2019Q1 2019Q2 2019Q3 2019Q4 2020Q1 2020Q2 2020Q3 2020Q4
United States 56.0 56.0 56.0 56.2 55.0 55.1 55.1 56.4Cayman Islands 30.1 30.1 30.1 32.0 31.4 31.3 31.3 29.6Canada 1.1 1.1 1.1 1.7 1.8 1.8 1.8 2.2United Kingdom 2.3 2.3 2.3 1.9 1.7 1.7 1.7 1.5Bermuda 0.9 0.9 0.9 1.0 1.0 1.0 1.0 1.1Other 9.6 9.6 9.6 7.2 9.1 9.1 9.1 9.2
13
August 4, 2021 Analytics Office
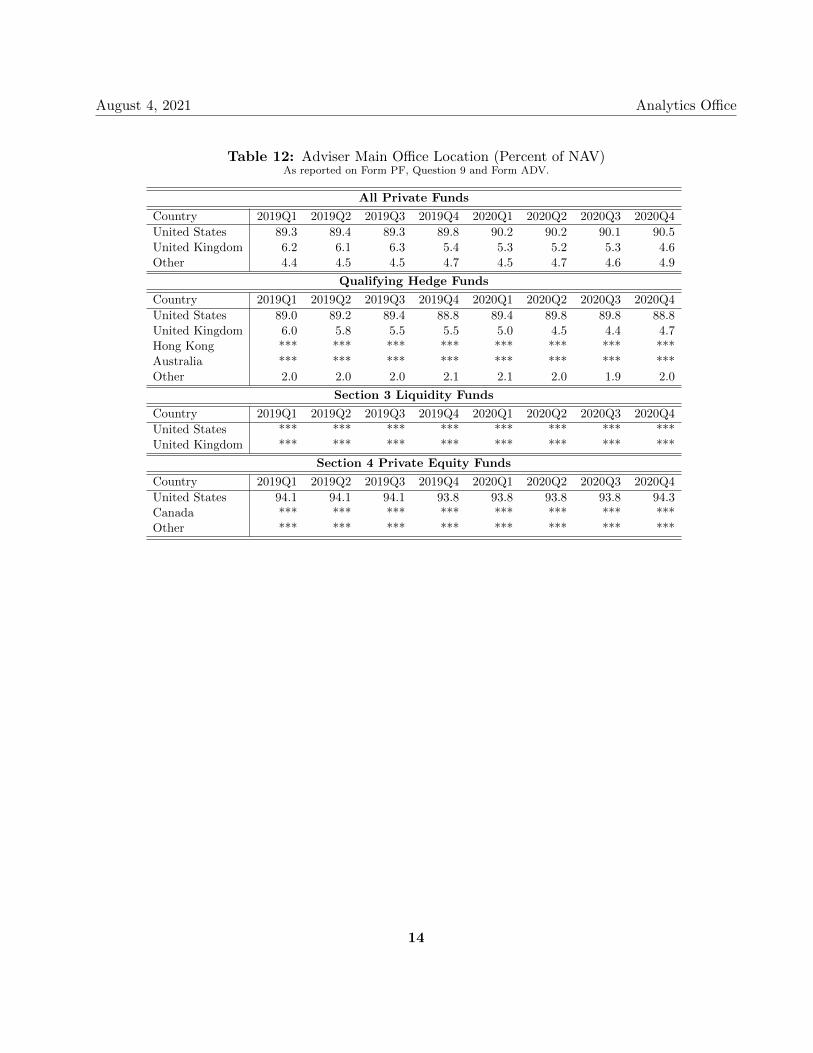
Table 12: Adviser Main Office Location (Percent of NAV)As reported on Form PF, Question 9 and Form ADV.
All Private Funds
Country 2019Q1 2019Q2 2019Q3 2019Q4 2020Q1 2020Q2 2020Q3 2020Q4
United States 89.3 89.4 89.3 89.8 90.2 90.2 90.1 90.5United Kingdom 6.2 6.1 6.3 5.4 5.3 5.2 5.3 4.6Other 4.4 4.5 4.5 4.7 4.5 4.7 4.6 4.9
Qualifying Hedge Funds
Country 2019Q1 2019Q2 2019Q3 2019Q4 2020Q1 2020Q2 2020Q3 2020Q4
United States 89.0 89.2 89.4 88.8 89.4 89.8 89.8 88.8United Kingdom 6.0 5.8 5.5 5.5 5.0 4.5 4.4 4.7Hong Kong *** *** *** *** *** *** *** ***Australia *** *** *** *** *** *** *** ***Other 2.0 2.0 2.0 2.1 2.1 2.0 1.9 2.0
Section 3 Liquidity Funds
Country 2019Q1 2019Q2 2019Q3 2019Q4 2020Q1 2020Q2 2020Q3 2020Q4
United States *** *** *** *** *** *** *** ***United Kingdom *** *** *** *** *** *** *** ***
Section 4 Private Equity Funds
Country 2019Q1 2019Q2 2019Q3 2019Q4 2020Q1 2020Q2 2020Q3 2020Q4
United States 94.1 94.1 94.1 93.8 93.8 93.8 93.8 94.3Canada *** *** *** *** *** *** *** ***Other *** *** *** *** *** *** *** ***
14
August 4, 2021 Analytics Office
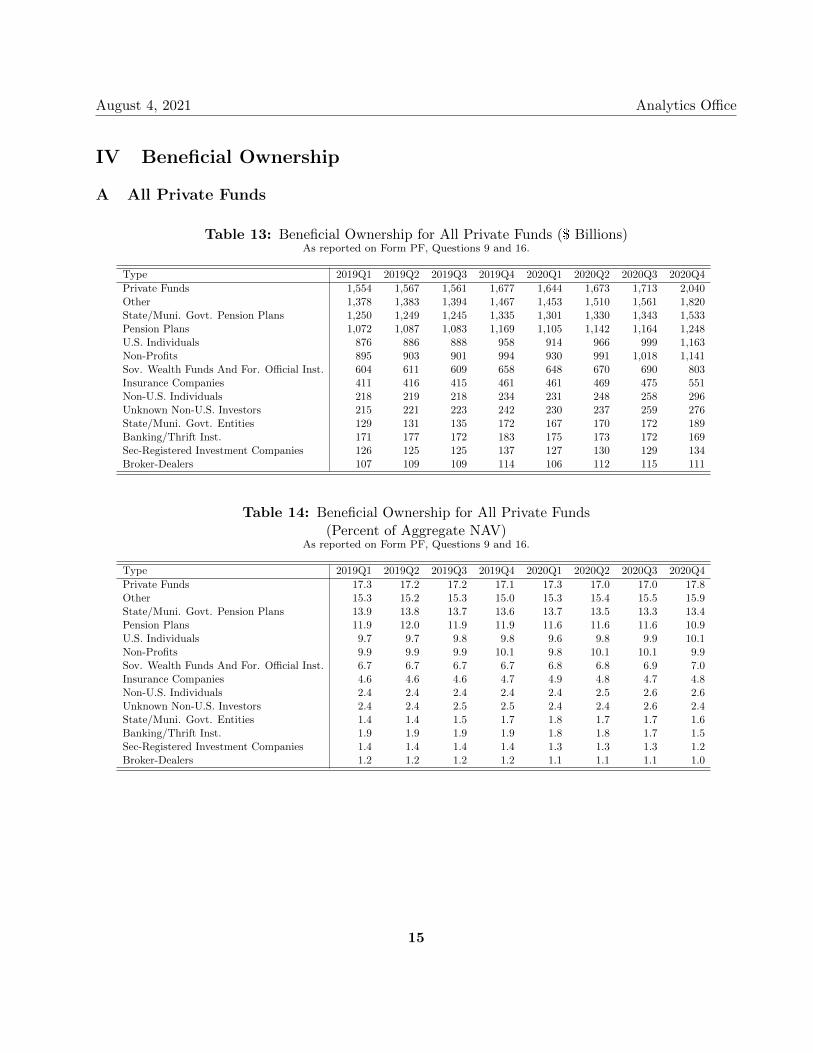
IV Beneficial Ownership
A All Private Funds
Table 13: Beneficial Ownership for All Private Funds ($ Billions)As reported on Form PF, Questions 9 and 16.
Type 2019Q1 2019Q2 2019Q3 2019Q4 2020Q1 2020Q2 2020Q3 2020Q4
Private Funds 1,554 1,567 1,561 1,677 1,644 1,673 1,713 2,040Other 1,378 1,383 1,394 1,467 1,453 1,510 1,561 1,820State/Muni. Govt. Pension Plans 1,250 1,249 1,245 1,335 1,301 1,330 1,343 1,533Pension Plans 1,072 1,087 1,083 1,169 1,105 1,142 1,164 1,248U.S. Individuals 876 886 888 958 914 966 999 1,163Non-Profits 895 903 901 994 930 991 1,018 1,141Sov. Wealth Funds And For. Official Inst. 604 611 609 658 648 670 690 803Insurance Companies 411 416 415 461 461 469 475 551Non-U.S. Individuals 218 219 218 234 231 248 258 296Unknown Non-U.S. Investors 215 221 223 242 230 237 259 276State/Muni. Govt. Entities 129 131 135 172 167 170 172 189Banking/Thrift Inst. 171 177 172 183 175 173 172 169Sec-Registered Investment Companies 126 125 125 137 127 130 129 134Broker-Dealers 107 109 109 114 106 112 115 111
Table 14: Beneficial Ownership for All Private Funds(Percent of Aggregate NAV)
As reported on Form PF, Questions 9 and 16.
Type 2019Q1 2019Q2 2019Q3 2019Q4 2020Q1 2020Q2 2020Q3 2020Q4
Private Funds 17.3 17.2 17.2 17.1 17.3 17.0 17.0 17.8Other 15.3 15.2 15.3 15.0 15.3 15.4 15.5 15.9State/Muni. Govt. Pension Plans 13.9 13.8 13.7 13.6 13.7 13.5 13.3 13.4Pension Plans 11.9 12.0 11.9 11.9 11.6 11.6 11.6 10.9U.S. Individuals 9.7 9.7 9.8 9.8 9.6 9.8 9.9 10.1Non-Profits 9.9 9.9 9.9 10.1 9.8 10.1 10.1 9.9Sov. Wealth Funds And For. Official Inst. 6.7 6.7 6.7 6.7 6.8 6.8 6.9 7.0Insurance Companies 4.6 4.6 4.6 4.7 4.9 4.8 4.7 4.8Non-U.S. Individuals 2.4 2.4 2.4 2.4 2.4 2.5 2.6 2.6Unknown Non-U.S. Investors 2.4 2.4 2.5 2.5 2.4 2.4 2.6 2.4State/Muni. Govt. Entities 1.4 1.4 1.5 1.7 1.8 1.7 1.7 1.6Banking/Thrift Inst. 1.9 1.9 1.9 1.9 1.8 1.8 1.7 1.5Sec-Registered Investment Companies 1.4 1.4 1.4 1.4 1.3 1.3 1.3 1.2Broker-Dealers 1.2 1.2 1.2 1.2 1.1 1.1 1.1 1.0
15
August 4, 2021 Analytics Office
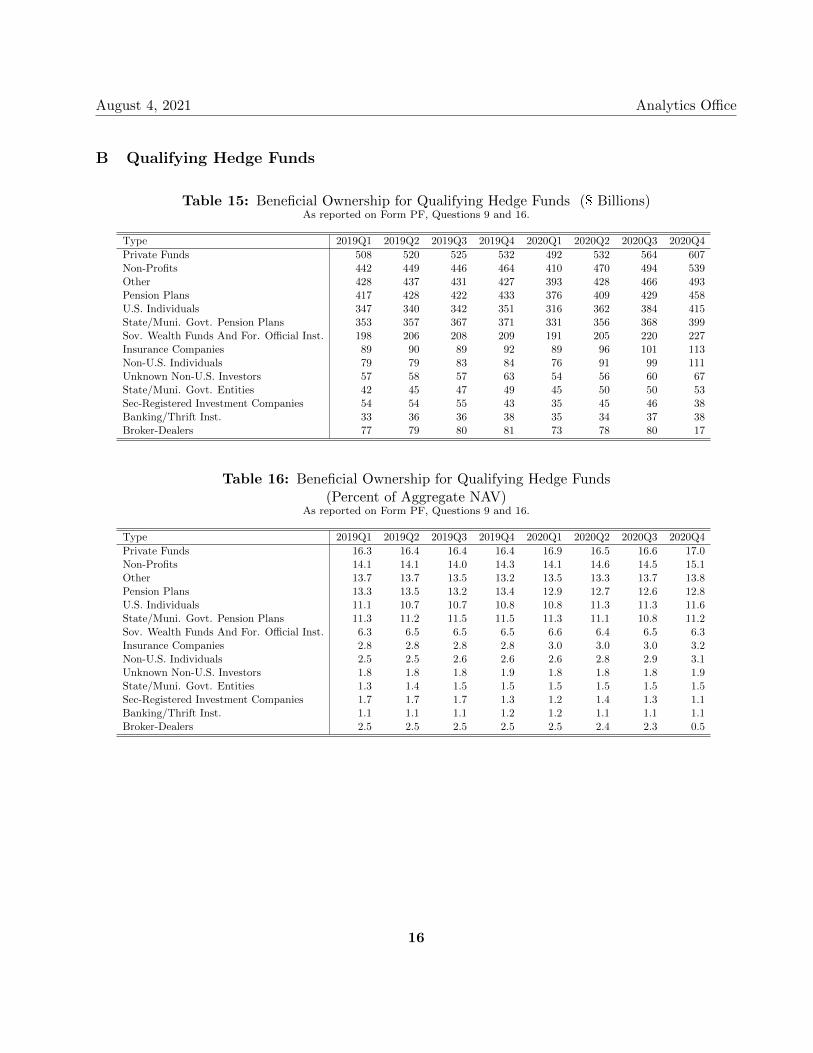
B Qualifying Hedge Funds
Table 15: Beneficial Ownership for Qualifying Hedge Funds ($ Billions)As reported on Form PF, Questions 9 and 16.
Type 2019Q1 2019Q2 2019Q3 2019Q4 2020Q1 2020Q2 2020Q3 2020Q4
Private Funds 508 520 525 532 492 532 564 607Non-Profits 442 449 446 464 410 470 494 539Other 428 437 431 427 393 428 466 493Pension Plans 417 428 422 433 376 409 429 458U.S. Individuals 347 340 342 351 316 362 384 415State/Muni. Govt. Pension Plans 353 357 367 371 331 356 368 399Sov. Wealth Funds And For. Official Inst. 198 206 208 209 191 205 220 227Insurance Companies 89 90 89 92 89 96 101 113Non-U.S. Individuals 79 79 83 84 76 91 99 111Unknown Non-U.S. Investors 57 58 57 63 54 56 60 67State/Muni. Govt. Entities 42 45 47 49 45 50 50 53Sec-Registered Investment Companies 54 54 55 43 35 45 46 38Banking/Thrift Inst. 33 36 36 38 35 34 37 38Broker-Dealers 77 79 80 81 73 78 80 17
Table 16: Beneficial Ownership for Qualifying Hedge Funds(Percent of Aggregate NAV)
As reported on Form PF, Questions 9 and 16.
Type 2019Q1 2019Q2 2019Q3 2019Q4 2020Q1 2020Q2 2020Q3 2020Q4
Private Funds 16.3 16.4 16.4 16.4 16.9 16.5 16.6 17.0Non-Profits 14.1 14.1 14.0 14.3 14.1 14.6 14.5 15.1Other 13.7 13.7 13.5 13.2 13.5 13.3 13.7 13.8Pension Plans 13.3 13.5 13.2 13.4 12.9 12.7 12.6 12.8U.S. Individuals 11.1 10.7 10.7 10.8 10.8 11.3 11.3 11.6State/Muni. Govt. Pension Plans 11.3 11.2 11.5 11.5 11.3 11.1 10.8 11.2Sov. Wealth Funds And For. Official Inst. 6.3 6.5 6.5 6.5 6.6 6.4 6.5 6.3Insurance Companies 2.8 2.8 2.8 2.8 3.0 3.0 3.0 3.2Non-U.S. Individuals 2.5 2.5 2.6 2.6 2.6 2.8 2.9 3.1Unknown Non-U.S. Investors 1.8 1.8 1.8 1.9 1.8 1.8 1.8 1.9State/Muni. Govt. Entities 1.3 1.4 1.5 1.5 1.5 1.5 1.5 1.5Sec-Registered Investment Companies 1.7 1.7 1.7 1.3 1.2 1.4 1.3 1.1Banking/Thrift Inst. 1.1 1.1 1.1 1.2 1.2 1.1 1.1 1.1Broker-Dealers 2.5 2.5 2.5 2.5 2.5 2.4 2.3 0.5
16
August 4, 2021 Analytics Office
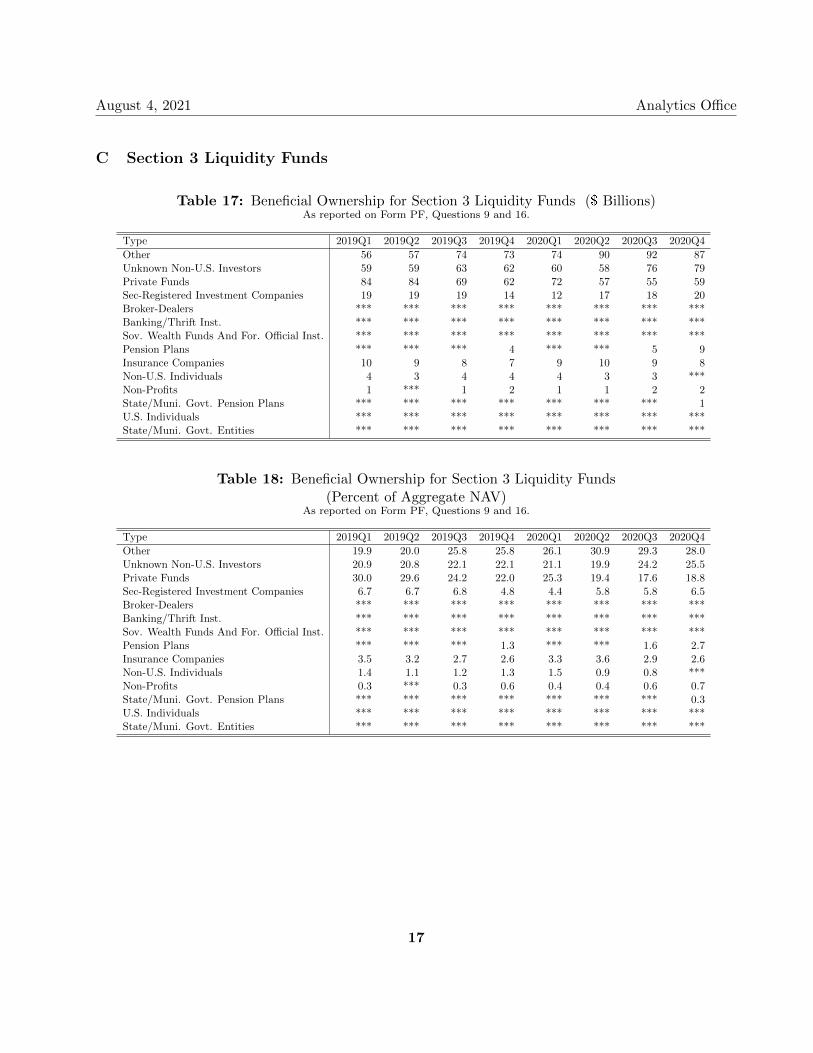
C Section 3 Liquidity Funds
Table 17: Beneficial Ownership for Section 3 Liquidity Funds ($ Billions)As reported on Form PF, Questions 9 and 16.
Type 2019Q1 2019Q2 2019Q3 2019Q4 2020Q1 2020Q2 2020Q3 2020Q4
Other 56 57 74 73 74 90 92 87Unknown Non-U.S. Investors 59 59 63 62 60 58 76 79Private Funds 84 84 69 62 72 57 55 59Sec-Registered Investment Companies 19 19 19 14 12 17 18 20Broker-Dealers *** *** *** *** *** *** *** ***Banking/Thrift Inst. *** *** *** *** *** *** *** ***Sov. Wealth Funds And For. Official Inst. *** *** *** *** *** *** *** ***Pension Plans *** *** *** 4 *** *** 5 9Insurance Companies 10 9 8 7 9 10 9 8Non-U.S. Individuals 4 3 4 4 4 3 3 ***Non-Profits 1 *** 1 2 1 1 2 2State/Muni. Govt. Pension Plans *** *** *** *** *** *** *** 1U.S. Individuals *** *** *** *** *** *** *** ***State/Muni. Govt. Entities *** *** *** *** *** *** *** ***
Table 18: Beneficial Ownership for Section 3 Liquidity Funds(Percent of Aggregate NAV)
As reported on Form PF, Questions 9 and 16.
Type 2019Q1 2019Q2 2019Q3 2019Q4 2020Q1 2020Q2 2020Q3 2020Q4
Other 19.9 20.0 25.8 25.8 26.1 30.9 29.3 28.0Unknown Non-U.S. Investors 20.9 20.8 22.1 22.1 21.1 19.9 24.2 25.5Private Funds 30.0 29.6 24.2 22.0 25.3 19.4 17.6 18.8Sec-Registered Investment Companies 6.7 6.7 6.8 4.8 4.4 5.8 5.8 6.5Broker-Dealers *** *** *** *** *** *** *** ***Banking/Thrift Inst. *** *** *** *** *** *** *** ***Sov. Wealth Funds And For. Official Inst. *** *** *** *** *** *** *** ***Pension Plans *** *** *** 1.3 *** *** 1.6 2.7Insurance Companies 3.5 3.2 2.7 2.6 3.3 3.6 2.9 2.6Non-U.S. Individuals 1.4 1.1 1.2 1.3 1.5 0.9 0.8 ***Non-Profits 0.3 *** 0.3 0.6 0.4 0.4 0.6 0.7State/Muni. Govt. Pension Plans *** *** *** *** *** *** *** 0.3U.S. Individuals *** *** *** *** *** *** *** ***State/Muni. Govt. Entities *** *** *** *** *** *** *** ***
17
August 4, 2021 Analytics Office
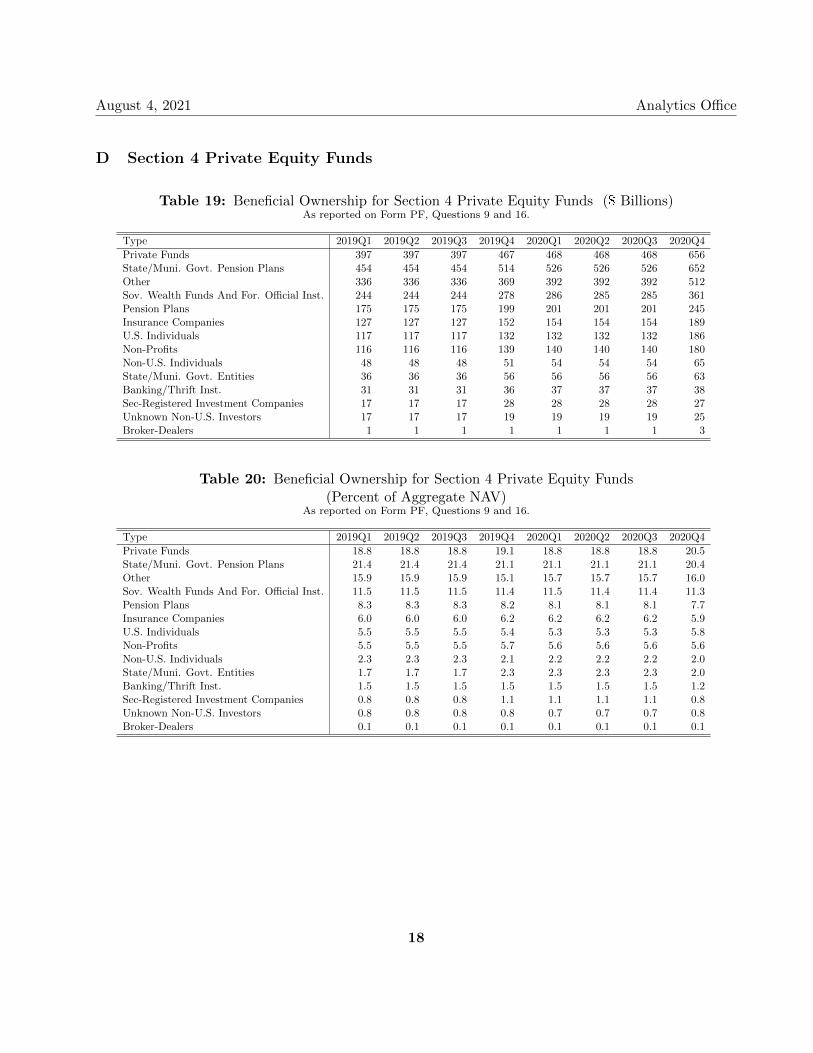
D Section 4 Private Equity Funds
Table 19: Beneficial Ownership for Section 4 Private Equity Funds ($ Billions)As reported on Form PF, Questions 9 and 16.
Type 2019Q1 2019Q2 2019Q3 2019Q4 2020Q1 2020Q2 2020Q3 2020Q4
Private Funds 397 397 397 467 468 468 468 656State/Muni. Govt. Pension Plans 454 454 454 514 526 526 526 652Other 336 336 336 369 392 392 392 512Sov. Wealth Funds And For. Official Inst. 244 244 244 278 286 285 285 361Pension Plans 175 175 175 199 201 201 201 245Insurance Companies 127 127 127 152 154 154 154 189U.S. Individuals 117 117 117 132 132 132 132 186Non-Profits 116 116 116 139 140 140 140 180Non-U.S. Individuals 48 48 48 51 54 54 54 65State/Muni. Govt. Entities 36 36 36 56 56 56 56 63Banking/Thrift Inst. 31 31 31 36 37 37 37 38Sec-Registered Investment Companies 17 17 17 28 28 28 28 27Unknown Non-U.S. Investors 17 17 17 19 19 19 19 25Broker-Dealers 1 1 1 1 1 1 1 3
Table 20: Beneficial Ownership for Section 4 Private Equity Funds(Percent of Aggregate NAV)
As reported on Form PF, Questions 9 and 16.
Type 2019Q1 2019Q2 2019Q3 2019Q4 2020Q1 2020Q2 2020Q3 2020Q4
Private Funds 18.8 18.8 18.8 19.1 18.8 18.8 18.8 20.5State/Muni. Govt. Pension Plans 21.4 21.4 21.4 21.1 21.1 21.1 21.1 20.4Other 15.9 15.9 15.9 15.1 15.7 15.7 15.7 16.0Sov. Wealth Funds And For. Official Inst. 11.5 11.5 11.5 11.4 11.5 11.4 11.4 11.3Pension Plans 8.3 8.3 8.3 8.2 8.1 8.1 8.1 7.7Insurance Companies 6.0 6.0 6.0 6.2 6.2 6.2 6.2 5.9U.S. Individuals 5.5 5.5 5.5 5.4 5.3 5.3 5.3 5.8Non-Profits 5.5 5.5 5.5 5.7 5.6 5.6 5.6 5.6Non-U.S. Individuals 2.3 2.3 2.3 2.1 2.2 2.2 2.2 2.0State/Muni. Govt. Entities 1.7 1.7 1.7 2.3 2.3 2.3 2.3 2.0Banking/Thrift Inst. 1.5 1.5 1.5 1.5 1.5 1.5 1.5 1.2Sec-Registered Investment Companies 0.8 0.8 0.8 1.1 1.1 1.1 1.1 0.8Unknown Non-U.S. Investors 0.8 0.8 0.8 0.8 0.7 0.7 0.7 0.8Broker-Dealers 0.1 0.1 0.1 0.1 0.1 0.1 0.1 0.1
18
August 4, 2021 Analytics Office
E Concentration
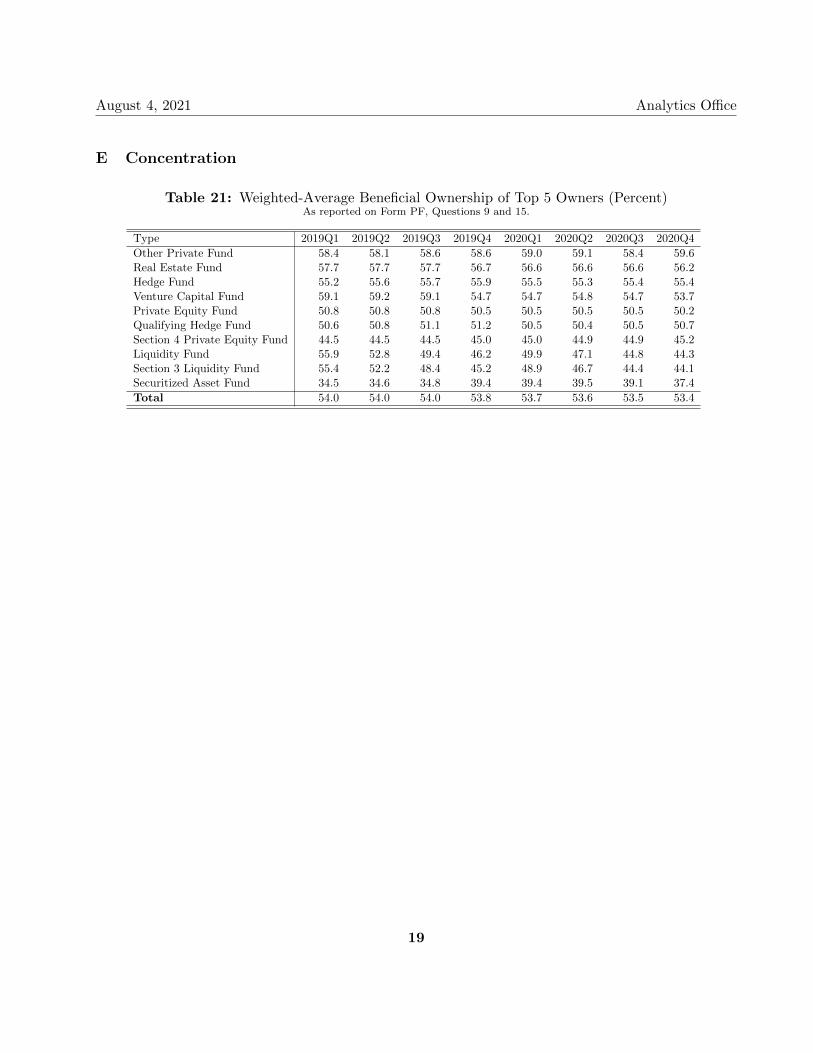
Table 21: Weighted-Average Beneficial Ownership of Top 5 Owners (Percent)As reported on Form PF, Questions 9 and 15.
Type 2019Q1 2019Q2 2019Q3 2019Q4 2020Q1 2020Q2 2020Q3 2020Q4
Other Private Fund 58.4 58.1 58.6 58.6 59.0 59.1 58.4 59.6Real Estate Fund 57.7 57.7 57.7 56.7 56.6 56.6 56.6 56.2Hedge Fund 55.2 55.6 55.7 55.9 55.5 55.3 55.4 55.4Venture Capital Fund 59.1 59.2 59.1 54.7 54.7 54.8 54.7 53.7Private Equity Fund 50.8 50.8 50.8 50.5 50.5 50.5 50.5 50.2Qualifying Hedge Fund 50.6 50.8 51.1 51.2 50.5 50.4 50.5 50.7Section 4 Private Equity Fund 44.5 44.5 44.5 45.0 45.0 44.9 44.9 45.2Liquidity Fund 55.9 52.8 49.4 46.2 49.9 47.1 44.8 44.3Section 3 Liquidity Fund 55.4 52.2 48.4 45.2 48.9 46.7 44.4 44.1Securitized Asset Fund 34.5 34.6 34.8 39.4 39.4 39.5 39.1 37.4
Total 54.0 54.0 54.0 53.8 53.7 53.6 53.5 53.4
19
August 4, 2021 Analytics Office
V Derivatives
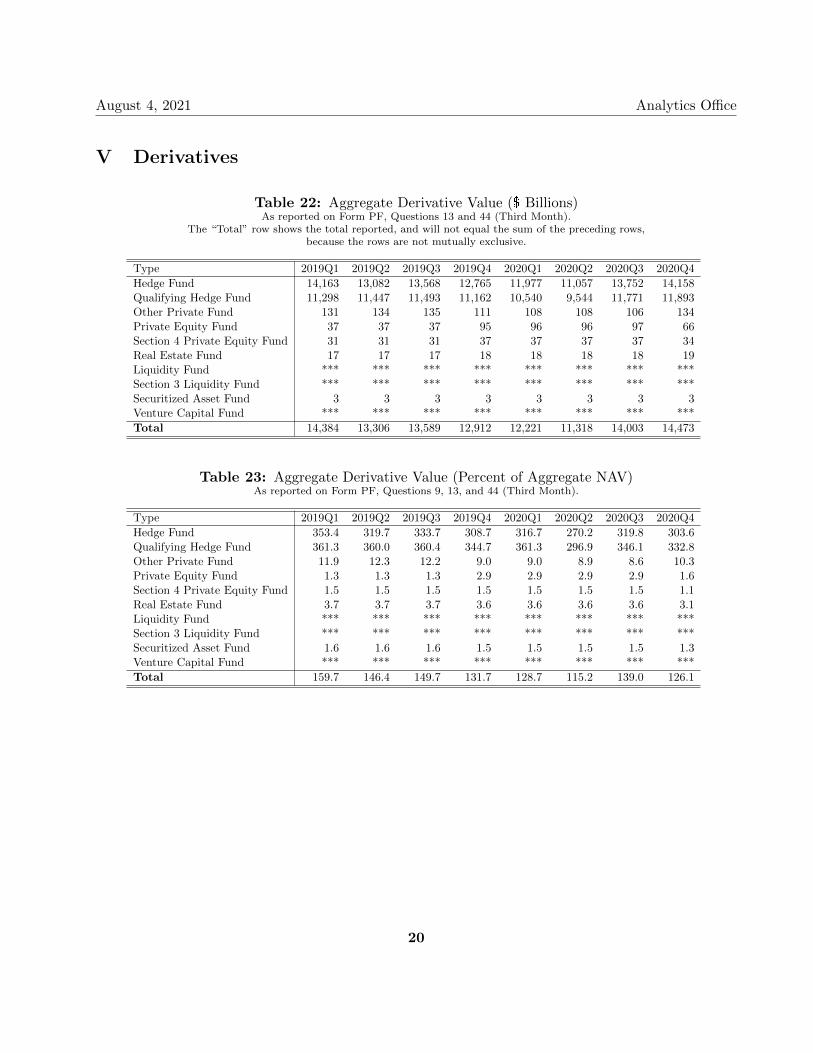
Table 22: Aggregate Derivative Value ($ Billions)As reported on Form PF, Questions 13 and 44 (Third Month).
The “Total” row shows the total reported, and will not equal the sum of the preceding rows,because the rows are not mutually exclusive.
Type 2019Q1 2019Q2 2019Q3 2019Q4 2020Q1 2020Q2 2020Q3 2020Q4
Hedge Fund 14,163 13,082 13,568 12,765 11,977 11,057 13,752 14,158Qualifying Hedge Fund 11,298 11,447 11,493 11,162 10,540 9,544 11,771 11,893Other Private Fund 131 134 135 111 108 108 106 134Private Equity Fund 37 37 37 95 96 96 97 66Section 4 Private Equity Fund 31 31 31 37 37 37 37 34Real Estate Fund 17 17 17 18 18 18 18 19Liquidity Fund *** *** *** *** *** *** *** ***Section 3 Liquidity Fund *** *** *** *** *** *** *** ***Securitized Asset Fund 3 3 3 3 3 3 3 3Venture Capital Fund *** *** *** *** *** *** *** ***
Total 14,384 13,306 13,589 12,912 12,221 11,318 14,003 14,473
Table 23: Aggregate Derivative Value (Percent of Aggregate NAV)As reported on Form PF, Questions 9, 13, and 44 (Third Month).
Type 2019Q1 2019Q2 2019Q3 2019Q4 2020Q1 2020Q2 2020Q3 2020Q4
Hedge Fund 353.4 319.7 333.7 308.7 316.7 270.2 319.8 303.6Qualifying Hedge Fund 361.3 360.0 360.4 344.7 361.3 296.9 346.1 332.8Other Private Fund 11.9 12.3 12.2 9.0 9.0 8.9 8.6 10.3Private Equity Fund 1.3 1.3 1.3 2.9 2.9 2.9 2.9 1.6Section 4 Private Equity Fund 1.5 1.5 1.5 1.5 1.5 1.5 1.5 1.1Real Estate Fund 3.7 3.7 3.7 3.6 3.6 3.6 3.6 3.1Liquidity Fund *** *** *** *** *** *** *** ***Section 3 Liquidity Fund *** *** *** *** *** *** *** ***Securitized Asset Fund 1.6 1.6 1.6 1.5 1.5 1.5 1.5 1.3Venture Capital Fund *** *** *** *** *** *** *** ***
Total 159.7 146.4 149.7 131.7 128.7 115.2 139.0 126.1
20
August 4, 2021 Analytics Office
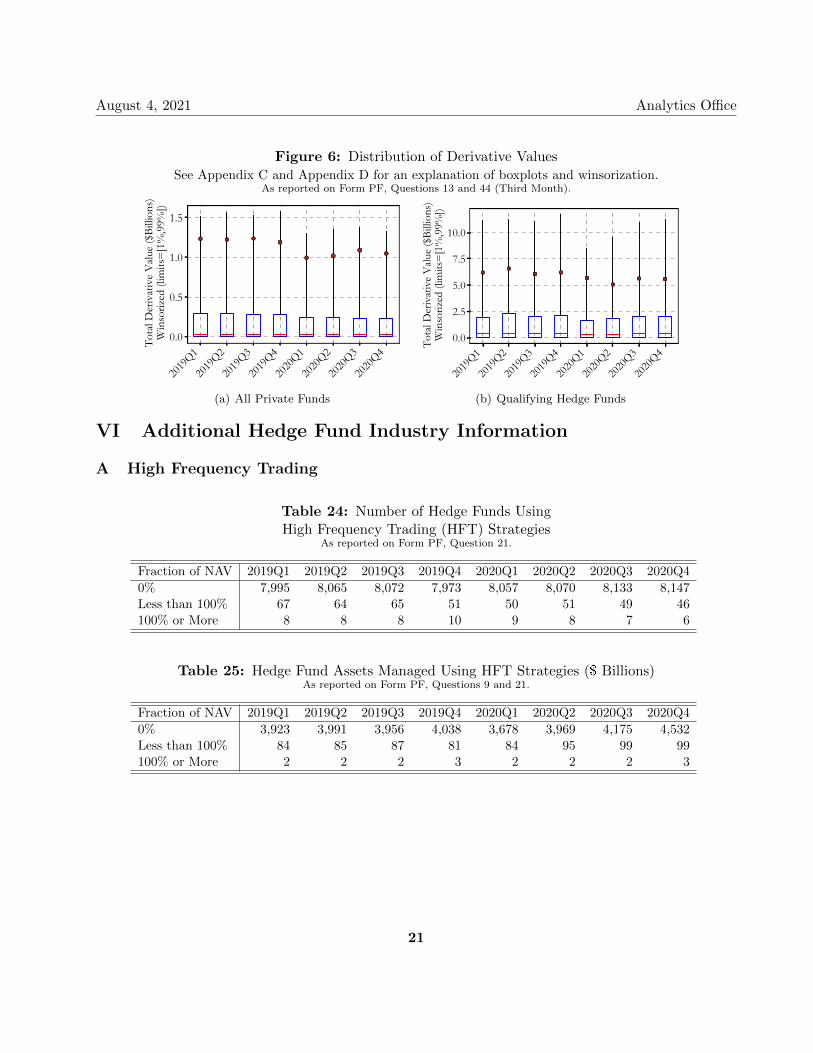
Figure 6: Distribution of Derivative ValuesSee Appendix C and Appendix D for an explanation of boxplots and winsorization.
As reported on Form PF, Questions 13 and 44 (Third Month).
2019
Q1
2019
Q2
2019
Q3
2019
Q4
2020
Q1
2020
Q2
2020
Q3
2020
Q40.0
0.5
1.0
1.5
Tota
l Der
ivat
ive
Valu
e ($
Billi
ons)
Win
soriz
ed (l
imits
=[1
%,9
9%])
(a) All Private Funds
2019
Q1
2019
Q2
2019
Q3
2019
Q4
2020
Q1
2020
Q2
2020
Q3
2020
Q40.0
2.5
5.0
7.5
10.0
Tota
l Der
ivat
ive
Valu
e ($
Billi
ons)
Win
soriz
ed (l
imits
=[1
%,9
9%])
(b) Qualifying Hedge Funds
VI Additional Hedge Fund Industry Information
A High Frequency Trading
Table 24: Number of Hedge Funds UsingHigh Frequency Trading (HFT) Strategies
As reported on Form PF, Question 21.
Fraction of NAV 2019Q1 2019Q2 2019Q3 2019Q4 2020Q1 2020Q2 2020Q3 2020Q4
0% 7,995 8,065 8,072 7,973 8,057 8,070 8,133 8,147Less than 100% 67 64 65 51 50 51 49 46100% or More 8 8 8 10 9 8 7 6
Table 25: Hedge Fund Assets Managed Using HFT Strategies ($ Billions)As reported on Form PF, Questions 9 and 21.
Fraction of NAV 2019Q1 2019Q2 2019Q3 2019Q4 2020Q1 2020Q2 2020Q3 2020Q4
0% 3,923 3,991 3,956 4,038 3,678 3,969 4,175 4,532Less than 100% 84 85 87 81 84 95 99 99100% or More 2 2 2 3 2 2 2 3
21
August 4, 2021 Analytics Office
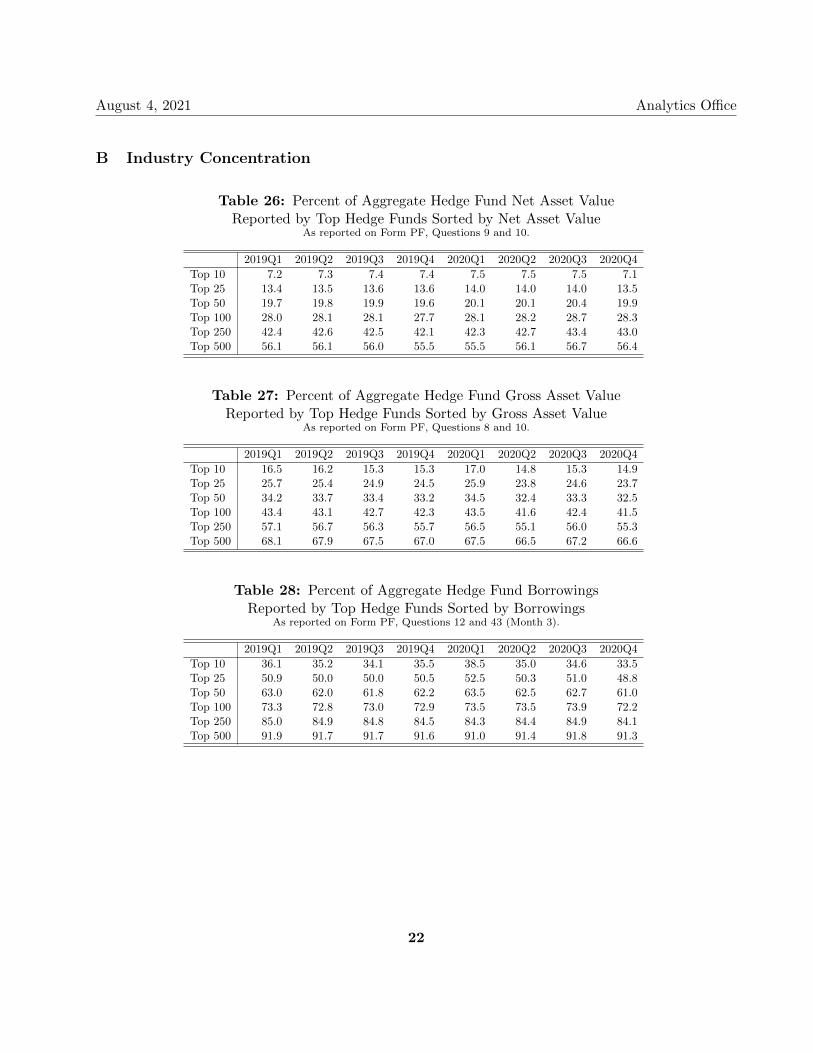
B Industry Concentration
Table 26: Percent of Aggregate Hedge Fund Net Asset ValueReported by Top Hedge Funds Sorted by Net Asset Value
As reported on Form PF, Questions 9 and 10.
2019Q1 2019Q2 2019Q3 2019Q4 2020Q1 2020Q2 2020Q3 2020Q4
Top 10 7.2 7.3 7.4 7.4 7.5 7.5 7.5 7.1Top 25 13.4 13.5 13.6 13.6 14.0 14.0 14.0 13.5Top 50 19.7 19.8 19.9 19.6 20.1 20.1 20.4 19.9Top 100 28.0 28.1 28.1 27.7 28.1 28.2 28.7 28.3Top 250 42.4 42.6 42.5 42.1 42.3 42.7 43.4 43.0Top 500 56.1 56.1 56.0 55.5 55.5 56.1 56.7 56.4
Table 27: Percent of Aggregate Hedge Fund Gross Asset ValueReported by Top Hedge Funds Sorted by Gross Asset Value
As reported on Form PF, Questions 8 and 10.
2019Q1 2019Q2 2019Q3 2019Q4 2020Q1 2020Q2 2020Q3 2020Q4
Top 10 16.5 16.2 15.3 15.3 17.0 14.8 15.3 14.9Top 25 25.7 25.4 24.9 24.5 25.9 23.8 24.6 23.7Top 50 34.2 33.7 33.4 33.2 34.5 32.4 33.3 32.5Top 100 43.4 43.1 42.7 42.3 43.5 41.6 42.4 41.5Top 250 57.1 56.7 56.3 55.7 56.5 55.1 56.0 55.3Top 500 68.1 67.9 67.5 67.0 67.5 66.5 67.2 66.6
Table 28: Percent of Aggregate Hedge Fund BorrowingsReported by Top Hedge Funds Sorted by Borrowings
As reported on Form PF, Questions 12 and 43 (Month 3).
2019Q1 2019Q2 2019Q3 2019Q4 2020Q1 2020Q2 2020Q3 2020Q4
Top 10 36.1 35.2 34.1 35.5 38.5 35.0 34.6 33.5Top 25 50.9 50.0 50.0 50.5 52.5 50.3 51.0 48.8Top 50 63.0 62.0 61.8 62.2 63.5 62.5 62.7 61.0Top 100 73.3 72.8 73.0 72.9 73.5 73.5 73.9 72.2Top 250 85.0 84.9 84.8 84.5 84.3 84.4 84.9 84.1Top 500 91.9 91.7 91.7 91.6 91.0 91.4 91.8 91.3
22
August 4, 2021 Analytics Office
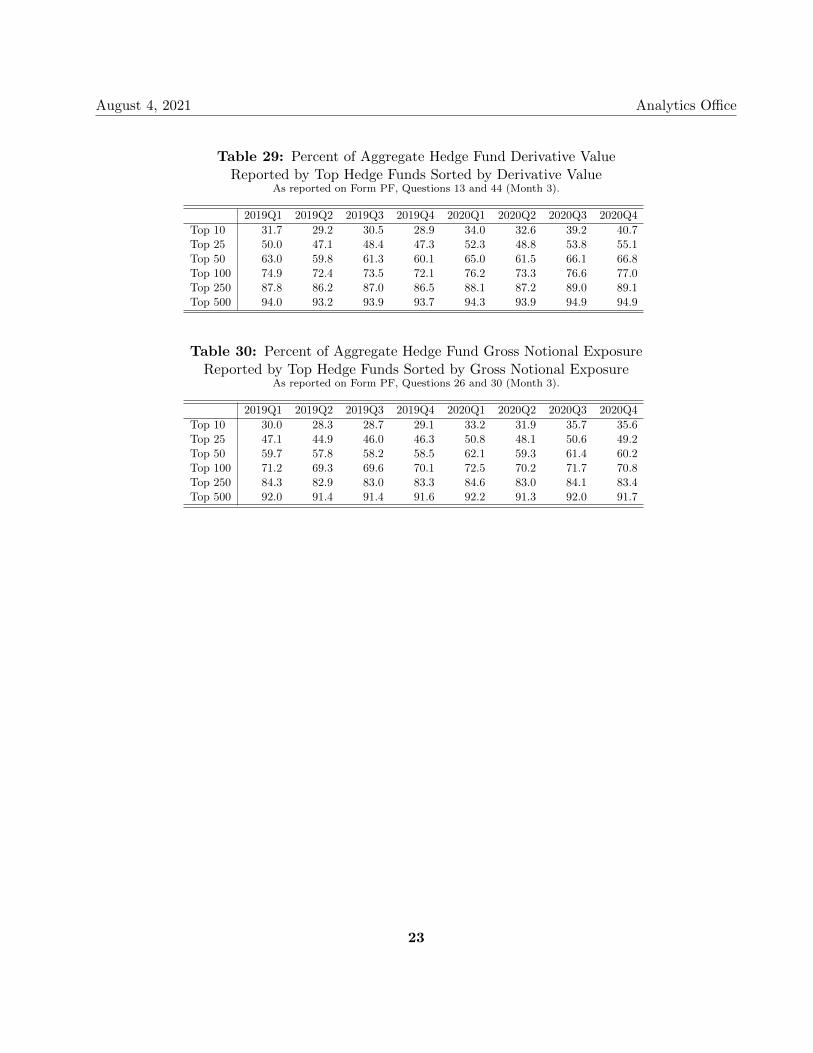
Table 29: Percent of Aggregate Hedge Fund Derivative ValueReported by Top Hedge Funds Sorted by Derivative Value
As reported on Form PF, Questions 13 and 44 (Month 3).
2019Q1 2019Q2 2019Q3 2019Q4 2020Q1 2020Q2 2020Q3 2020Q4
Top 10 31.7 29.2 30.5 28.9 34.0 32.6 39.2 40.7Top 25 50.0 47.1 48.4 47.3 52.3 48.8 53.8 55.1Top 50 63.0 59.8 61.3 60.1 65.0 61.5 66.1 66.8Top 100 74.9 72.4 73.5 72.1 76.2 73.3 76.6 77.0Top 250 87.8 86.2 87.0 86.5 88.1 87.2 89.0 89.1Top 500 94.0 93.2 93.9 93.7 94.3 93.9 94.9 94.9
Table 30: Percent of Aggregate Hedge Fund Gross Notional ExposureReported by Top Hedge Funds Sorted by Gross Notional Exposure
As reported on Form PF, Questions 26 and 30 (Month 3).
2019Q1 2019Q2 2019Q3 2019Q4 2020Q1 2020Q2 2020Q3 2020Q4
Top 10 30.0 28.3 28.7 29.1 33.2 31.9 35.7 35.6Top 25 47.1 44.9 46.0 46.3 50.8 48.1 50.6 49.2Top 50 59.7 57.8 58.2 58.5 62.1 59.3 61.4 60.2Top 100 71.2 69.3 69.6 70.1 72.5 70.2 71.7 70.8Top 250 84.3 82.9 83.0 83.3 84.6 83.0 84.1 83.4Top 500 92.0 91.4 91.4 91.6 92.2 91.3 92.0 91.7
23
August 4, 2021 Analytics Office
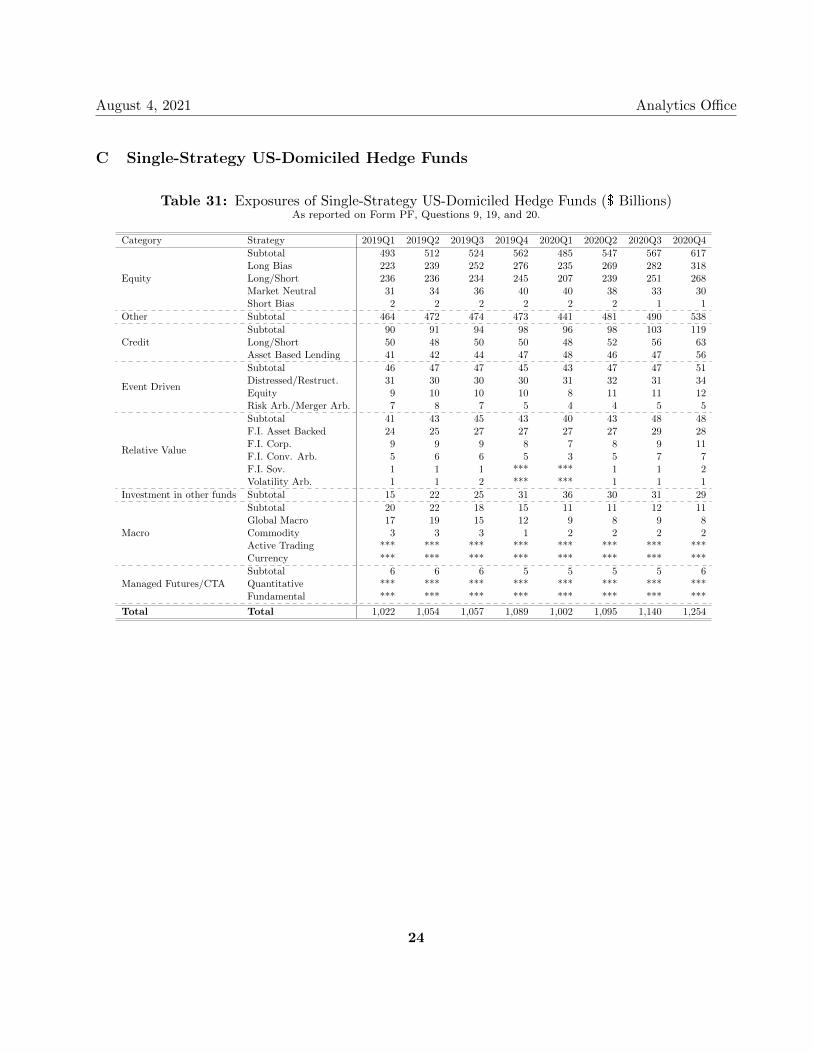
C Single-Strategy US-Domiciled Hedge Funds
Table 31: Exposures of Single-Strategy US-Domiciled Hedge Funds ($ Billions)As reported on Form PF, Questions 9, 19, and 20.
Category Strategy 2019Q1 2019Q2 2019Q3 2019Q4 2020Q1 2020Q2 2020Q3 2020Q4
Equity
Subtotal 493 512 524 562 485 547 567 617Long Bias 223 239 252 276 235 269 282 318Long/Short 236 236 234 245 207 239 251 268Market Neutral 31 34 36 40 40 38 33 30Short Bias 2 2 2 2 2 2 1 1
Other Subtotal 464 472 474 473 441 481 490 538
CreditSubtotal 90 91 94 98 96 98 103 119Long/Short 50 48 50 50 48 52 56 63Asset Based Lending 41 42 44 47 48 46 47 56
Event Driven
Subtotal 46 47 47 45 43 47 47 51Distressed/Restruct. 31 30 30 30 31 32 31 34Equity 9 10 10 10 8 11 11 12Risk Arb./Merger Arb. 7 8 7 5 4 4 5 5
Relative Value
Subtotal 41 43 45 43 40 43 48 48F.I. Asset Backed 24 25 27 27 27 27 29 28F.I. Corp. 9 9 9 8 7 8 9 11F.I. Conv. Arb. 5 6 6 5 3 5 7 7F.I. Sov. 1 1 1 *** *** 1 1 2Volatility Arb. 1 1 2 *** *** 1 1 1
Investment in other funds Subtotal 15 22 25 31 36 30 31 29
Macro
Subtotal 20 22 18 15 11 11 12 11Global Macro 17 19 15 12 9 8 9 8Commodity 3 3 3 1 2 2 2 2Active Trading *** *** *** *** *** *** *** ***Currency *** *** *** *** *** *** *** ***
Managed Futures/CTASubtotal 6 6 6 5 5 5 5 6Quantitative *** *** *** *** *** *** *** ***Fundamental *** *** *** *** *** *** *** ***
Total Total 1,022 1,054 1,057 1,089 1,002 1,095 1,140 1,254
24
August 4, 2021 Analytics Office
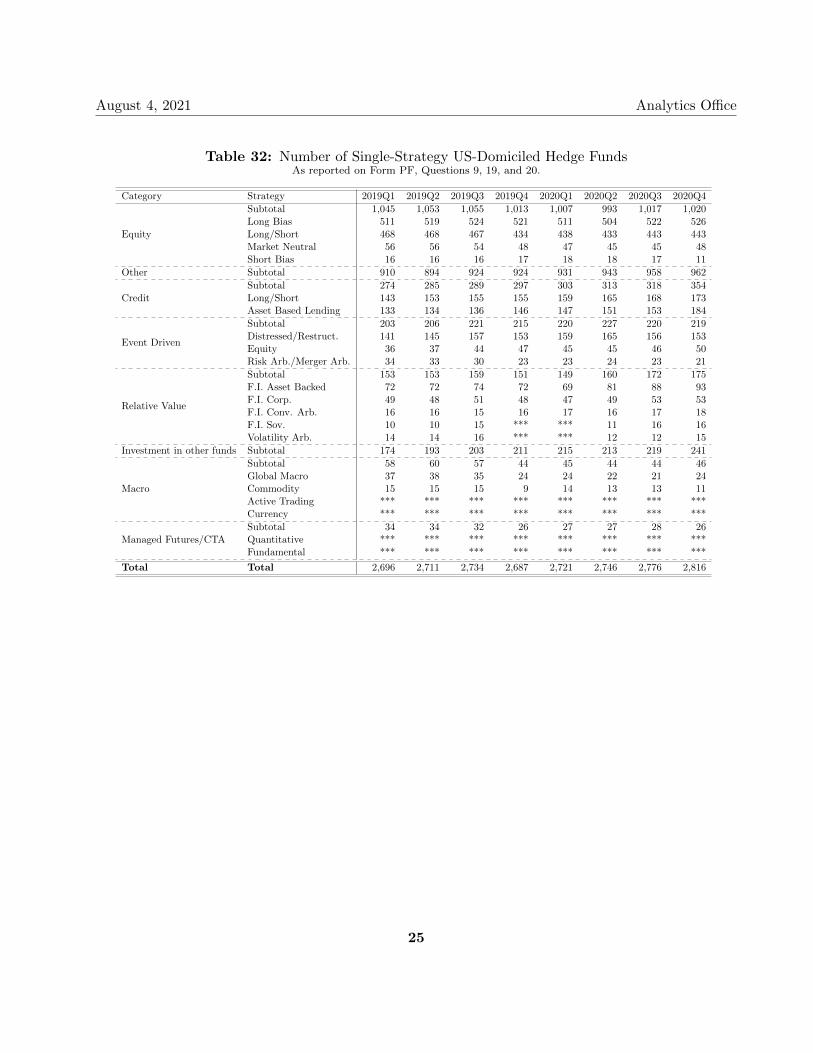
Table 32: Number of Single-Strategy US-Domiciled Hedge FundsAs reported on Form PF, Questions 9, 19, and 20.
Category Strategy 2019Q1 2019Q2 2019Q3 2019Q4 2020Q1 2020Q2 2020Q3 2020Q4
Equity
Subtotal 1,045 1,053 1,055 1,013 1,007 993 1,017 1,020Long Bias 511 519 524 521 511 504 522 526Long/Short 468 468 467 434 438 433 443 443Market Neutral 56 56 54 48 47 45 45 48Short Bias 16 16 16 17 18 18 17 11
Other Subtotal 910 894 924 924 931 943 958 962
CreditSubtotal 274 285 289 297 303 313 318 354Long/Short 143 153 155 155 159 165 168 173Asset Based Lending 133 134 136 146 147 151 153 184
Event Driven
Subtotal 203 206 221 215 220 227 220 219Distressed/Restruct. 141 145 157 153 159 165 156 153Equity 36 37 44 47 45 45 46 50Risk Arb./Merger Arb. 34 33 30 23 23 24 23 21
Relative Value
Subtotal 153 153 159 151 149 160 172 175F.I. Asset Backed 72 72 74 72 69 81 88 93F.I. Corp. 49 48 51 48 47 49 53 53F.I. Conv. Arb. 16 16 15 16 17 16 17 18F.I. Sov. 10 10 15 *** *** 11 16 16Volatility Arb. 14 14 16 *** *** 12 12 15
Investment in other funds Subtotal 174 193 203 211 215 213 219 241
Macro
Subtotal 58 60 57 44 45 44 44 46Global Macro 37 38 35 24 24 22 21 24Commodity 15 15 15 9 14 13 13 11Active Trading *** *** *** *** *** *** *** ***Currency *** *** *** *** *** *** *** ***
Managed Futures/CTASubtotal 34 34 32 26 27 27 28 26Quantitative *** *** *** *** *** *** *** ***Fundamental *** *** *** *** *** *** *** ***
Total Total 2,696 2,711 2,734 2,687 2,721 2,746 2,776 2,816
25
August 4, 2021 Analytics Office
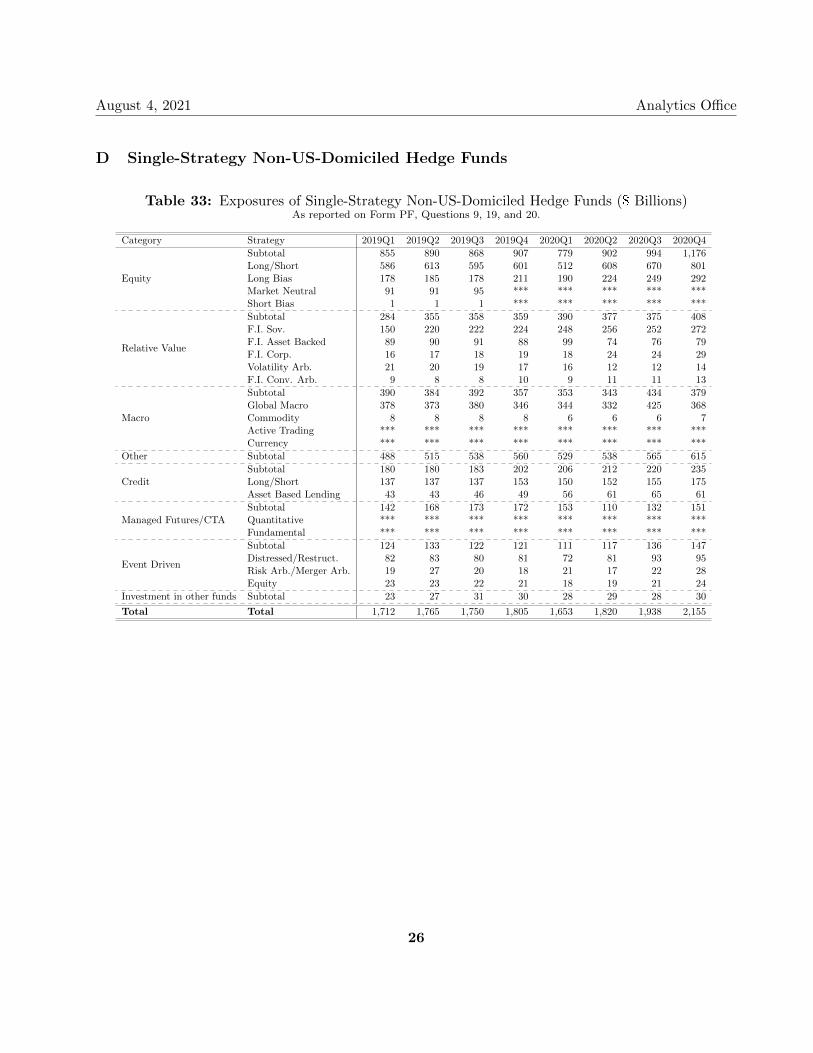
D Single-Strategy Non-US-Domiciled Hedge Funds
Table 33: Exposures of Single-Strategy Non-US-Domiciled Hedge Funds ($ Billions)As reported on Form PF, Questions 9, 19, and 20.
Category Strategy 2019Q1 2019Q2 2019Q3 2019Q4 2020Q1 2020Q2 2020Q3 2020Q4
Equity
Subtotal 855 890 868 907 779 902 994 1,176Long/Short 586 613 595 601 512 608 670 801Long Bias 178 185 178 211 190 224 249 292Market Neutral 91 91 95 *** *** *** *** ***Short Bias 1 1 1 *** *** *** *** ***
Relative Value
Subtotal 284 355 358 359 390 377 375 408F.I. Sov. 150 220 222 224 248 256 252 272F.I. Asset Backed 89 90 91 88 99 74 76 79F.I. Corp. 16 17 18 19 18 24 24 29Volatility Arb. 21 20 19 17 16 12 12 14F.I. Conv. Arb. 9 8 8 10 9 11 11 13
Macro
Subtotal 390 384 392 357 353 343 434 379Global Macro 378 373 380 346 344 332 425 368Commodity 8 8 8 8 6 6 6 7Active Trading *** *** *** *** *** *** *** ***Currency *** *** *** *** *** *** *** ***
Other Subtotal 488 515 538 560 529 538 565 615
CreditSubtotal 180 180 183 202 206 212 220 235Long/Short 137 137 137 153 150 152 155 175Asset Based Lending 43 43 46 49 56 61 65 61
Managed Futures/CTASubtotal 142 168 173 172 153 110 132 151Quantitative *** *** *** *** *** *** *** ***Fundamental *** *** *** *** *** *** *** ***
Event Driven
Subtotal 124 133 122 121 111 117 136 147Distressed/Restruct. 82 83 80 81 72 81 93 95Risk Arb./Merger Arb. 19 27 20 18 21 17 22 28Equity 23 23 22 21 18 19 21 24
Investment in other funds Subtotal 23 27 31 30 28 29 28 30
Total Total 1,712 1,765 1,750 1,805 1,653 1,820 1,938 2,155
26
August 4, 2021 Analytics Office
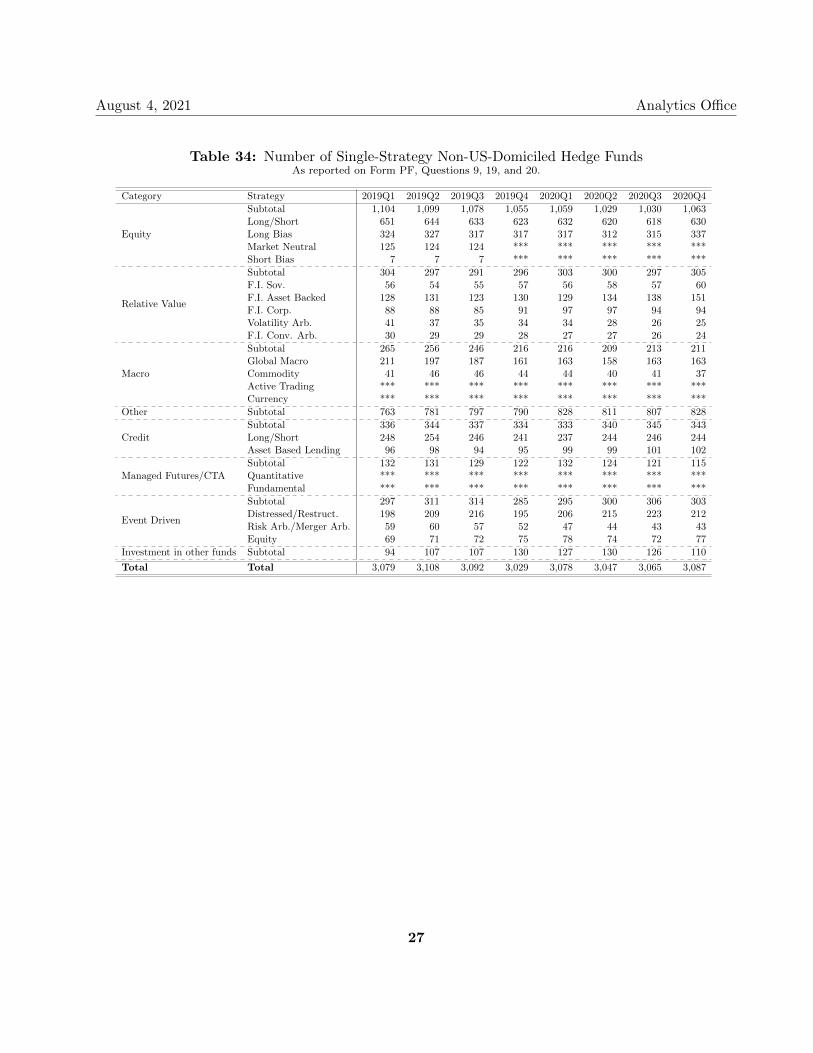
Table 34: Number of Single-Strategy Non-US-Domiciled Hedge FundsAs reported on Form PF, Questions 9, 19, and 20.
Category Strategy 2019Q1 2019Q2 2019Q3 2019Q4 2020Q1 2020Q2 2020Q3 2020Q4
Equity
Subtotal 1,104 1,099 1,078 1,055 1,059 1,029 1,030 1,063Long/Short 651 644 633 623 632 620 618 630Long Bias 324 327 317 317 317 312 315 337Market Neutral 125 124 124 *** *** *** *** ***Short Bias 7 7 7 *** *** *** *** ***
Relative Value
Subtotal 304 297 291 296 303 300 297 305F.I. Sov. 56 54 55 57 56 58 57 60F.I. Asset Backed 128 131 123 130 129 134 138 151F.I. Corp. 88 88 85 91 97 97 94 94Volatility Arb. 41 37 35 34 34 28 26 25F.I. Conv. Arb. 30 29 29 28 27 27 26 24
Macro
Subtotal 265 256 246 216 216 209 213 211Global Macro 211 197 187 161 163 158 163 163Commodity 41 46 46 44 44 40 41 37Active Trading *** *** *** *** *** *** *** ***Currency *** *** *** *** *** *** *** ***
Other Subtotal 763 781 797 790 828 811 807 828
CreditSubtotal 336 344 337 334 333 340 345 343Long/Short 248 254 246 241 237 244 246 244Asset Based Lending 96 98 94 95 99 99 101 102
Managed Futures/CTASubtotal 132 131 129 122 132 124 121 115Quantitative *** *** *** *** *** *** *** ***Fundamental *** *** *** *** *** *** *** ***
Event Driven
Subtotal 297 311 314 285 295 300 306 303Distressed/Restruct. 198 209 216 195 206 215 223 212Risk Arb./Merger Arb. 59 60 57 52 47 44 43 43Equity 69 71 72 75 78 74 72 77
Investment in other funds Subtotal 94 107 107 130 127 130 126 110
Total Total 3,079 3,108 3,092 3,029 3,078 3,047 3,065 3,087
27
August 4, 2021 Analytics Office
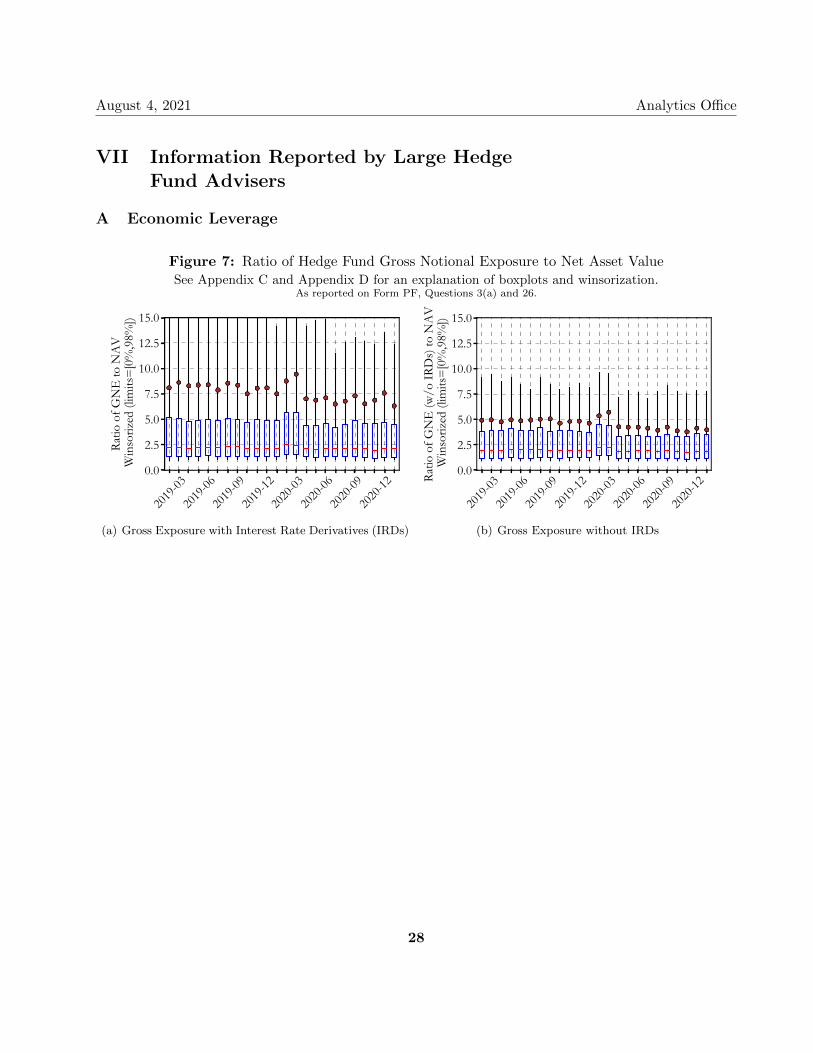
VII Information Reported by Large HedgeFund Advisers
A Economic Leverage
Figure 7: Ratio of Hedge Fund Gross Notional Exposure to Net Asset ValueSee Appendix C and Appendix D for an explanation of boxplots and winsorization.
As reported on Form PF, Questions 3(a) and 26.
2019
-03
2019
-06
2019
-09
2019
-12
2020
-03
2020
-06
2020
-09
2020
-120.0
2.5
5.0
7.5
10.0
12.5
15.0
Ratio
of G
NE
to N
AV
Win
soriz
ed (l
imits
=[0
%,9
8%])
(a) Gross Exposure with Interest Rate Derivatives (IRDs)
2019
-03
2019
-06
2019
-09
2019
-12
2020
-03
2020
-06
2020
-09
2020
-120.0
2.5
5.0
7.5
10.0
12.5
15.0
Ratio
of G
NE
(w/o
IRD
s) to
NA
V W
inso
rized
(lim
its=
[0%
,98%
])
(b) Gross Exposure without IRDs
28
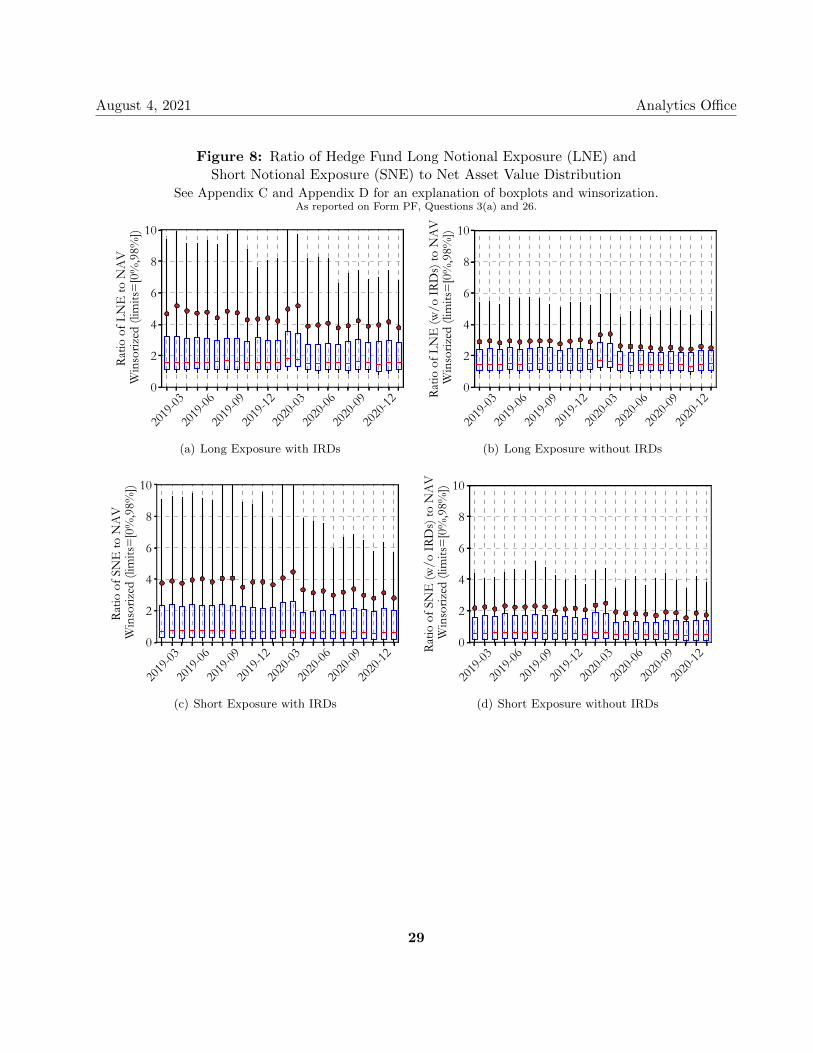
August 4, 2021 Analytics Office
Figure 8: Ratio of Hedge Fund Long Notional Exposure (LNE) andShort Notional Exposure (SNE) to Net Asset Value Distribution
See Appendix C and Appendix D for an explanation of boxplots and winsorization.As reported on Form PF, Questions 3(a) and 26.
2019
-03
2019
-06
2019
-09
2019
-12
2020
-03
2020
-06
2020
-09
2020
-120
2
4
6
8
10
Ratio
of L
NE
to N
AV
Win
soriz
ed (l
imits
=[0
%,9
8%])
(a) Long Exposure with IRDs
2019
-03
2019
-06
2019
-09
2019
-12
2020
-03
2020
-06
2020
-09
2020
-120
2
4
6
8
10
Ratio
of L
NE
(w/o
IRD
s) to
NA
V W
inso
rized
(lim
its=
[0%
,98%
])(b) Long Exposure without IRDs
2019
-03
2019
-06
2019
-09
2019
-12
2020
-03
2020
-06
2020
-09
2020
-120
2
4
6
8
10
Ratio
of S
NE
to N
AV
Win
soriz
ed (l
imits
=[0
%,9
8%])
(c) Short Exposure with IRDs
2019
-03
2019
-06
2019
-09
2019
-12
2020
-03
2020
-06
2020
-09
2020
-120
2
4
6
8
10
Ratio
of S
NE
(w/o
IRD
s) to
NA
V W
inso
rized
(lim
its=
[0%
,98%
])
(d) Short Exposure without IRDs
29
August 4, 2021 Analytics Office
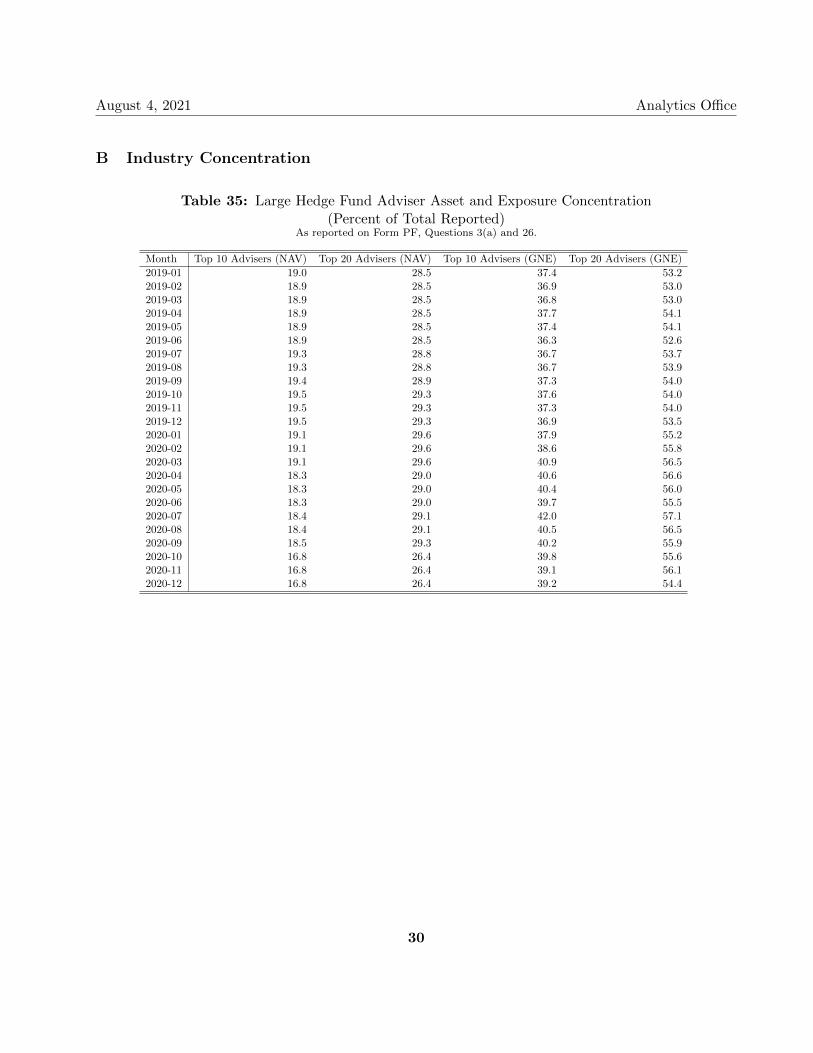
B Industry Concentration
Table 35: Large Hedge Fund Adviser Asset and Exposure Concentration(Percent of Total Reported)
As reported on Form PF, Questions 3(a) and 26.
Month Top 10 Advisers (NAV) Top 20 Advisers (NAV) Top 10 Advisers (GNE) Top 20 Advisers (GNE)
2019-01 19.0 28.5 37.4 53.22019-02 18.9 28.5 36.9 53.02019-03 18.9 28.5 36.8 53.02019-04 18.9 28.5 37.7 54.12019-05 18.9 28.5 37.4 54.12019-06 18.9 28.5 36.3 52.62019-07 19.3 28.8 36.7 53.72019-08 19.3 28.8 36.7 53.92019-09 19.4 28.9 37.3 54.02019-10 19.5 29.3 37.6 54.02019-11 19.5 29.3 37.3 54.02019-12 19.5 29.3 36.9 53.52020-01 19.1 29.6 37.9 55.22020-02 19.1 29.6 38.6 55.82020-03 19.1 29.6 40.9 56.52020-04 18.3 29.0 40.6 56.62020-05 18.3 29.0 40.4 56.02020-06 18.3 29.0 39.7 55.52020-07 18.4 29.1 42.0 57.12020-08 18.4 29.1 40.5 56.52020-09 18.5 29.3 40.2 55.92020-10 16.8 26.4 39.8 55.62020-11 16.8 26.4 39.1 56.12020-12 16.8 26.4 39.2 54.4
30
August 4, 2021 Analytics Office
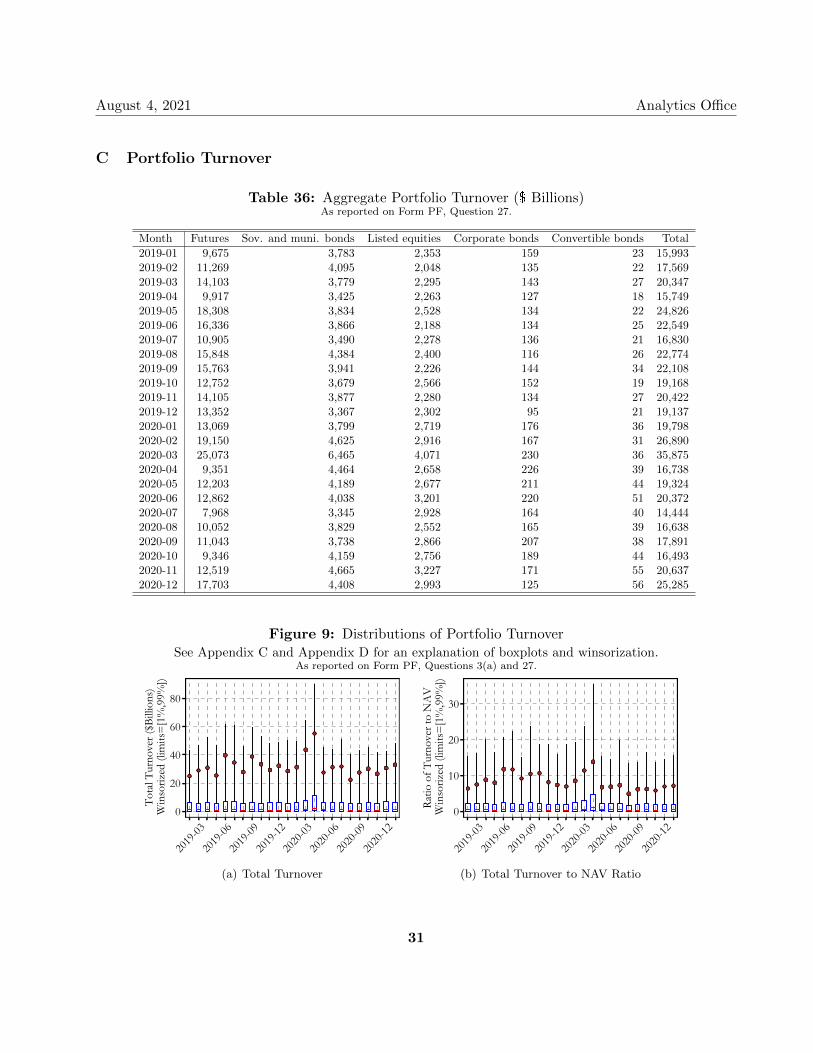
C Portfolio Turnover
Table 36: Aggregate Portfolio Turnover ($ Billions)As reported on Form PF, Question 27.
Month Futures Sov. and muni. bonds Listed equities Corporate bonds Convertible bonds Total
2019-01 9,675 3,783 2,353 159 23 15,9932019-02 11,269 4,095 2,048 135 22 17,5692019-03 14,103 3,779 2,295 143 27 20,3472019-04 9,917 3,425 2,263 127 18 15,7492019-05 18,308 3,834 2,528 134 22 24,8262019-06 16,336 3,866 2,188 134 25 22,5492019-07 10,905 3,490 2,278 136 21 16,8302019-08 15,848 4,384 2,400 116 26 22,7742019-09 15,763 3,941 2,226 144 34 22,1082019-10 12,752 3,679 2,566 152 19 19,1682019-11 14,105 3,877 2,280 134 27 20,4222019-12 13,352 3,367 2,302 95 21 19,1372020-01 13,069 3,799 2,719 176 36 19,7982020-02 19,150 4,625 2,916 167 31 26,8902020-03 25,073 6,465 4,071 230 36 35,8752020-04 9,351 4,464 2,658 226 39 16,7382020-05 12,203 4,189 2,677 211 44 19,3242020-06 12,862 4,038 3,201 220 51 20,3722020-07 7,968 3,345 2,928 164 40 14,4442020-08 10,052 3,829 2,552 165 39 16,6382020-09 11,043 3,738 2,866 207 38 17,8912020-10 9,346 4,159 2,756 189 44 16,4932020-11 12,519 4,665 3,227 171 55 20,6372020-12 17,703 4,408 2,993 125 56 25,285
Figure 9: Distributions of Portfolio TurnoverSee Appendix C and Appendix D for an explanation of boxplots and winsorization.
As reported on Form PF, Questions 3(a) and 27.
2019
-03
2019
-06
2019
-09
2019
-12
2020
-03
2020
-06
2020
-09
2020
-120
20
40
60
80
Tota
l Tur
nove
r ($B
illio
ns)
Win
soriz
ed (l
imits
=[1
%,9
9%])
(a) Total Turnover
2019
-03
2019
-06
2019
-09
2019
-12
2020
-03
2020
-06
2020
-09
2020
-120
10
20
30
Ratio
of T
urno
ver t
o N
AV
Win
soriz
ed (l
imits
=[1
%,9
9%])
(b) Total Turnover to NAV Ratio
31
August 4, 2021 Analytics Office
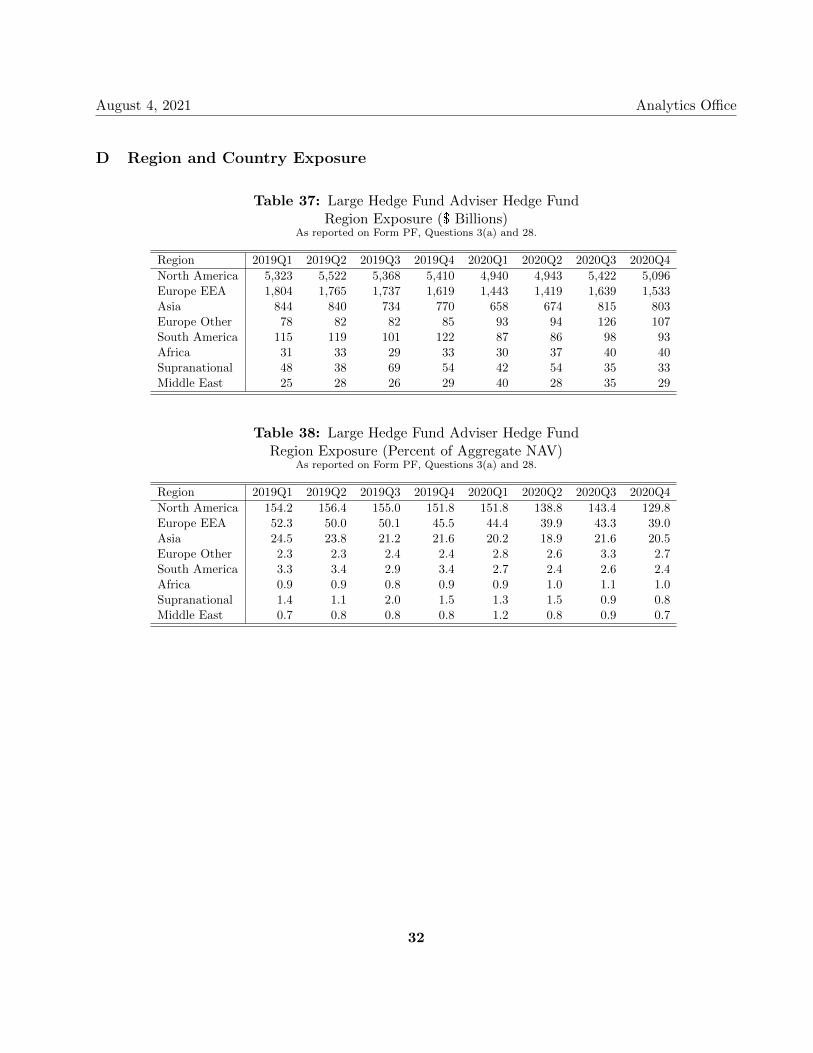
D Region and Country Exposure
Table 37: Large Hedge Fund Adviser Hedge FundRegion Exposure ($ Billions)
As reported on Form PF, Questions 3(a) and 28.
Region 2019Q1 2019Q2 2019Q3 2019Q4 2020Q1 2020Q2 2020Q3 2020Q4
North America 5,323 5,522 5,368 5,410 4,940 4,943 5,422 5,096Europe EEA 1,804 1,765 1,737 1,619 1,443 1,419 1,639 1,533Asia 844 840 734 770 658 674 815 803Europe Other 78 82 82 85 93 94 126 107South America 115 119 101 122 87 86 98 93Africa 31 33 29 33 30 37 40 40Supranational 48 38 69 54 42 54 35 33Middle East 25 28 26 29 40 28 35 29
Table 38: Large Hedge Fund Adviser Hedge FundRegion Exposure (Percent of Aggregate NAV)
As reported on Form PF, Questions 3(a) and 28.
Region 2019Q1 2019Q2 2019Q3 2019Q4 2020Q1 2020Q2 2020Q3 2020Q4
North America 154.2 156.4 155.0 151.8 151.8 138.8 143.4 129.8Europe EEA 52.3 50.0 50.1 45.5 44.4 39.9 43.3 39.0Asia 24.5 23.8 21.2 21.6 20.2 18.9 21.6 20.5Europe Other 2.3 2.3 2.4 2.4 2.8 2.6 3.3 2.7South America 3.3 3.4 2.9 3.4 2.7 2.4 2.6 2.4Africa 0.9 0.9 0.8 0.9 0.9 1.0 1.1 1.0Supranational 1.4 1.1 2.0 1.5 1.3 1.5 0.9 0.8Middle East 0.7 0.8 0.8 0.8 1.2 0.8 0.9 0.7
32
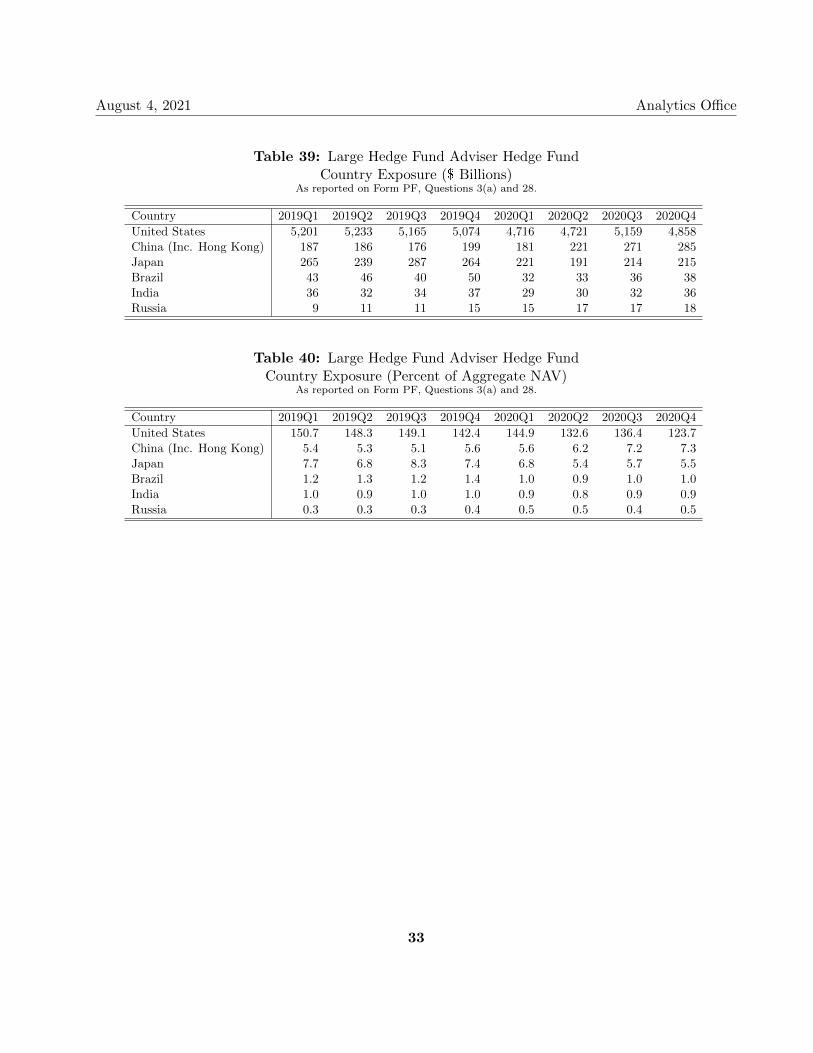
August 4, 2021 Analytics Office
Table 39: Large Hedge Fund Adviser Hedge FundCountry Exposure ($ Billions)
As reported on Form PF, Questions 3(a) and 28.
Country 2019Q1 2019Q2 2019Q3 2019Q4 2020Q1 2020Q2 2020Q3 2020Q4
United States 5,201 5,233 5,165 5,074 4,716 4,721 5,159 4,858China (Inc. Hong Kong) 187 186 176 199 181 221 271 285Japan 265 239 287 264 221 191 214 215Brazil 43 46 40 50 32 33 36 38India 36 32 34 37 29 30 32 36Russia 9 11 11 15 15 17 17 18
Table 40: Large Hedge Fund Adviser Hedge FundCountry Exposure (Percent of Aggregate NAV)
As reported on Form PF, Questions 3(a) and 28.
Country 2019Q1 2019Q2 2019Q3 2019Q4 2020Q1 2020Q2 2020Q3 2020Q4
United States 150.7 148.3 149.1 142.4 144.9 132.6 136.4 123.7China (Inc. Hong Kong) 5.4 5.3 5.1 5.6 5.6 6.2 7.2 7.3Japan 7.7 6.8 8.3 7.4 6.8 5.4 5.7 5.5Brazil 1.2 1.3 1.2 1.4 1.0 0.9 1.0 1.0India 1.0 0.9 1.0 1.0 0.9 0.8 0.9 0.9Russia 0.3 0.3 0.3 0.4 0.5 0.5 0.4 0.5
33
August 4, 2021 Analytics Office
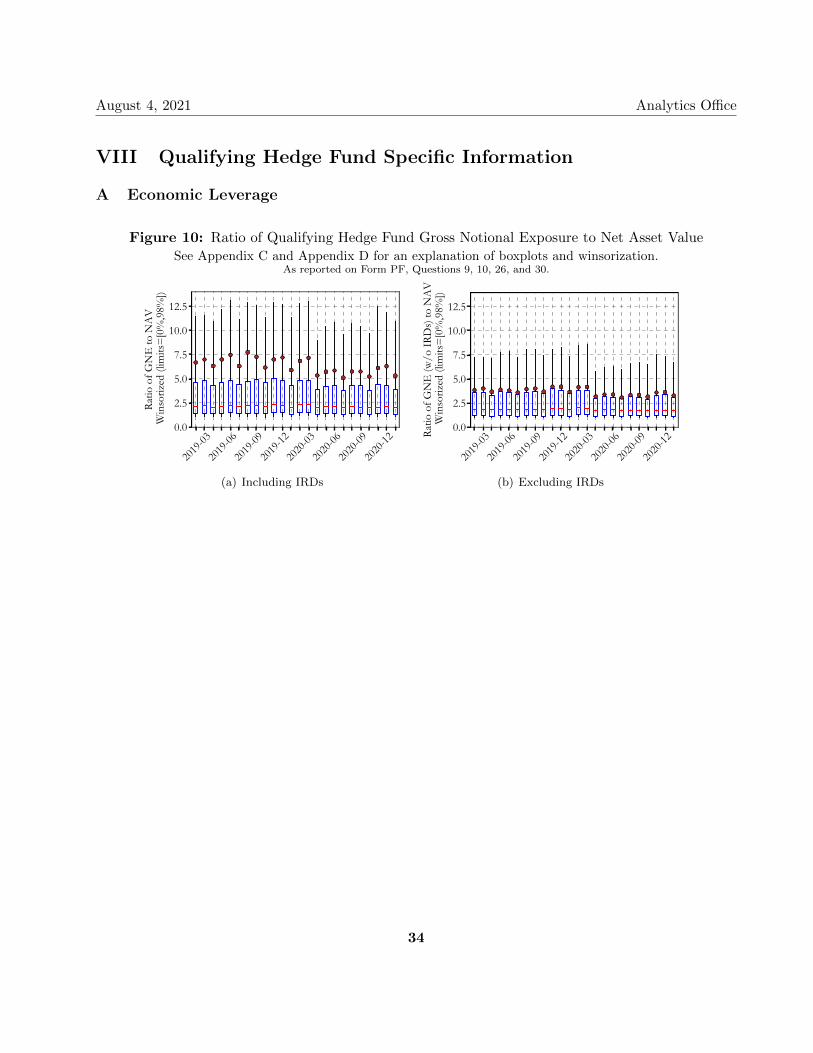
VIII Qualifying Hedge Fund Specific Information
A Economic Leverage
Figure 10: Ratio of Qualifying Hedge Fund Gross Notional Exposure to Net Asset ValueSee Appendix C and Appendix D for an explanation of boxplots and winsorization.
As reported on Form PF, Questions 9, 10, 26, and 30.
2019
-03
2019
-06
2019
-09
2019
-12
2020
-03
2020
-06
2020
-09
2020
-120.0
2.5
5.0
7.5
10.0
12.5
Ratio
of G
NE
to N
AV
Win
soriz
ed (l
imits
=[0
%,9
8%])
(a) Including IRDs
2019
-03
2019
-06
2019
-09
2019
-12
2020
-03
2020
-06
2020
-09
2020
-120.0
2.5
5.0
7.5
10.0
12.5
Ratio
of G
NE
(w/o
IRD
s) to
NA
V W
inso
rized
(lim
its=
[0%
,98%
])
(b) Excluding IRDs
34
August 4, 2021 Analytics Office
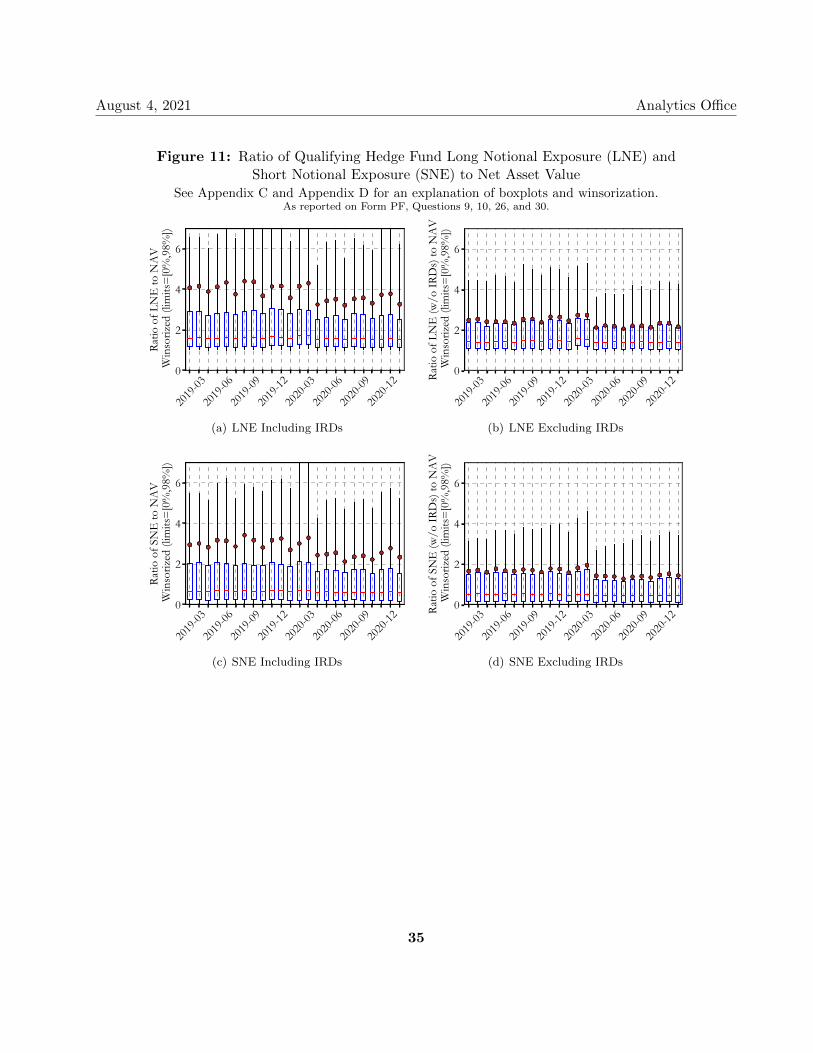
Figure 11: Ratio of Qualifying Hedge Fund Long Notional Exposure (LNE) andShort Notional Exposure (SNE) to Net Asset Value
See Appendix C and Appendix D for an explanation of boxplots and winsorization.As reported on Form PF, Questions 9, 10, 26, and 30.
2019
-03
2019
-06
2019
-09
2019
-12
2020
-03
2020
-06
2020
-09
2020
-120
2
4
6
Ratio
of L
NE
to N
AV
Win
soriz
ed (l
imits
=[0
%,9
8%])
(a) LNE Including IRDs
2019
-03
2019
-06
2019
-09
2019
-12
2020
-03
2020
-06
2020
-09
2020
-120
2
4
6
Ratio
of L
NE
(w/o
IRD
s) to
NA
V W
inso
rized
(lim
its=
[0%
,98%
])(b) LNE Excluding IRDs
2019
-03
2019
-06
2019
-09
2019
-12
2020
-03
2020
-06
2020
-09
2020
-120
2
4
6
Ratio
of S
NE
to N
AV
Win
soriz
ed (l
imits
=[0
%,9
8%])
(c) SNE Including IRDs
2019
-03
2019
-06
2019
-09
2019
-12
2020
-03
2020
-06
2020
-09
2020
-120
2
4
6
Ratio
of S
NE
(w/o
IRD
s) to
NA
V W
inso
rized
(lim
its=
[0%
,98%
])
(d) SNE Excluding IRDs
35

August 4, 2021 Analytics Office
B Gross Exposure by Strategy5
Table 41: Exposures of Hedge Funds ($ Billions)As reported on Form PF, Questions 9 and 20.
Category Strategy 2019Q1 2019Q2 2019Q3 2019Q4 2020Q1 2020Q2 2020Q3 2020Q4
Equity
Subtotal 1,616 1,644 1,622 1,723 1,379 1,641 1,757 1,975Long/Short 841 867 833 880 713 867 957 1,090Long Bias 384 392 404 443 373 443 485 548Market Neutral 386 380 381 397 *** 329 *** ***Short Bias 5 5 4 3 *** 1 *** ***
Other Subtotal 1,038 1,088 1,098 1,134 1,106 1,126 1,128 1,189
Relative Value
Subtotal 963 1,054 1,021 1,030 1,106 983 1,023 997F.I. Sov. 686 774 723 714 836 700 689 676F.I. Conv. Arb. 60 59 57 60 55 80 101 121F.I. Asset Backed 130 134 159 177 129 116 135 112F.I. Corp. 67 69 64 61 53 62 72 56Volatility Arb. 19 18 19 18 32 26 26 32
Macro
Subtotal 782 753 708 666 644 641 797 746Global Macro 695 666 629 579 577 572 725 681Commodity 37 38 34 39 28 25 28 31Currency 46 *** *** 44 36 *** 40 30Active Trading 4 *** *** 5 4 *** 4 4
CreditSubtotal 325 314 305 315 327 358 370 393Long/Short 258 246 234 233 240 265 272 295Asset Based Lending 66 68 71 82 87 93 98 98
Event Driven
Subtotal 313 337 308 311 271 281 307 366Distressed/Restruct. 169 165 160 163 140 159 162 169Risk Arb./Merger Arb. 64 86 71 69 65 59 74 101Equity 80 86 78 79 65 64 71 96
Managed Futures/CTASubtotal 172 191 191 193 159 126 149 165Quantitative *** *** *** *** 158 *** 145 ***Fundamental *** *** *** *** 1 *** 4 ***
Investment in other funds Subtotal 43 41 48 48 50 42 43 43
Total Total 5,251 5,422 5,301 5,420 5,041 5,198 5,574 5,873
5Form PF Question 20 requires advisers to indicate which strategies best describe the reporting fund’s strategiesincluding a good faith estimate of the reporting fund’s allocation among strategies, and provides a list of investmentstrategies for this purpose. Form PF does not define the investment strategies listed by Question 20.
36
August 4, 2021 Analytics Office
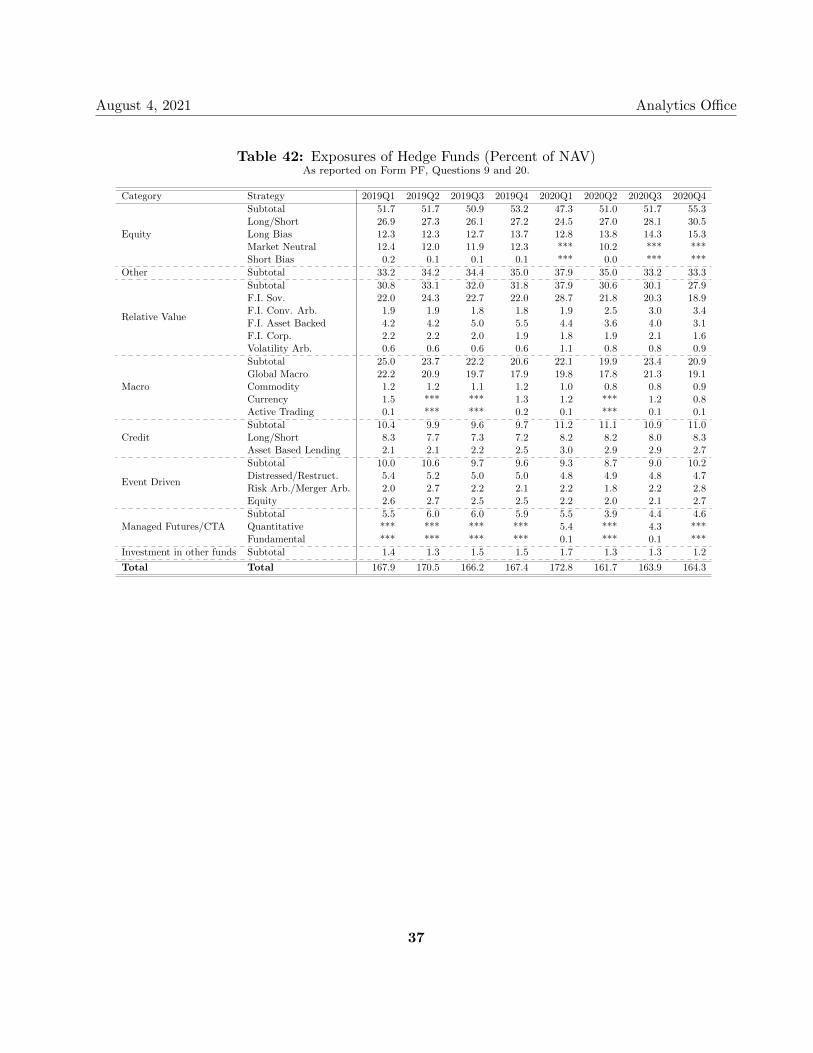
Table 42: Exposures of Hedge Funds (Percent of NAV)As reported on Form PF, Questions 9 and 20.
Category Strategy 2019Q1 2019Q2 2019Q3 2019Q4 2020Q1 2020Q2 2020Q3 2020Q4
Equity
Subtotal 51.7 51.7 50.9 53.2 47.3 51.0 51.7 55.3Long/Short 26.9 27.3 26.1 27.2 24.5 27.0 28.1 30.5Long Bias 12.3 12.3 12.7 13.7 12.8 13.8 14.3 15.3Market Neutral 12.4 12.0 11.9 12.3 *** 10.2 *** ***Short Bias 0.2 0.1 0.1 0.1 *** 0.0 *** ***
Other Subtotal 33.2 34.2 34.4 35.0 37.9 35.0 33.2 33.3
Relative Value
Subtotal 30.8 33.1 32.0 31.8 37.9 30.6 30.1 27.9F.I. Sov. 22.0 24.3 22.7 22.0 28.7 21.8 20.3 18.9F.I. Conv. Arb. 1.9 1.9 1.8 1.8 1.9 2.5 3.0 3.4F.I. Asset Backed 4.2 4.2 5.0 5.5 4.4 3.6 4.0 3.1F.I. Corp. 2.2 2.2 2.0 1.9 1.8 1.9 2.1 1.6Volatility Arb. 0.6 0.6 0.6 0.6 1.1 0.8 0.8 0.9
Macro
Subtotal 25.0 23.7 22.2 20.6 22.1 19.9 23.4 20.9Global Macro 22.2 20.9 19.7 17.9 19.8 17.8 21.3 19.1Commodity 1.2 1.2 1.1 1.2 1.0 0.8 0.8 0.9Currency 1.5 *** *** 1.3 1.2 *** 1.2 0.8Active Trading 0.1 *** *** 0.2 0.1 *** 0.1 0.1
CreditSubtotal 10.4 9.9 9.6 9.7 11.2 11.1 10.9 11.0Long/Short 8.3 7.7 7.3 7.2 8.2 8.2 8.0 8.3Asset Based Lending 2.1 2.1 2.2 2.5 3.0 2.9 2.9 2.7
Event Driven
Subtotal 10.0 10.6 9.7 9.6 9.3 8.7 9.0 10.2Distressed/Restruct. 5.4 5.2 5.0 5.0 4.8 4.9 4.8 4.7Risk Arb./Merger Arb. 2.0 2.7 2.2 2.1 2.2 1.8 2.2 2.8Equity 2.6 2.7 2.5 2.5 2.2 2.0 2.1 2.7
Managed Futures/CTASubtotal 5.5 6.0 6.0 5.9 5.5 3.9 4.4 4.6Quantitative *** *** *** *** 5.4 *** 4.3 ***Fundamental *** *** *** *** 0.1 *** 0.1 ***
Investment in other funds Subtotal 1.4 1.3 1.5 1.5 1.7 1.3 1.3 1.2
Total Total 167.9 170.5 166.2 167.4 172.8 161.7 163.9 164.3
37
August 4, 2021 Analytics Office
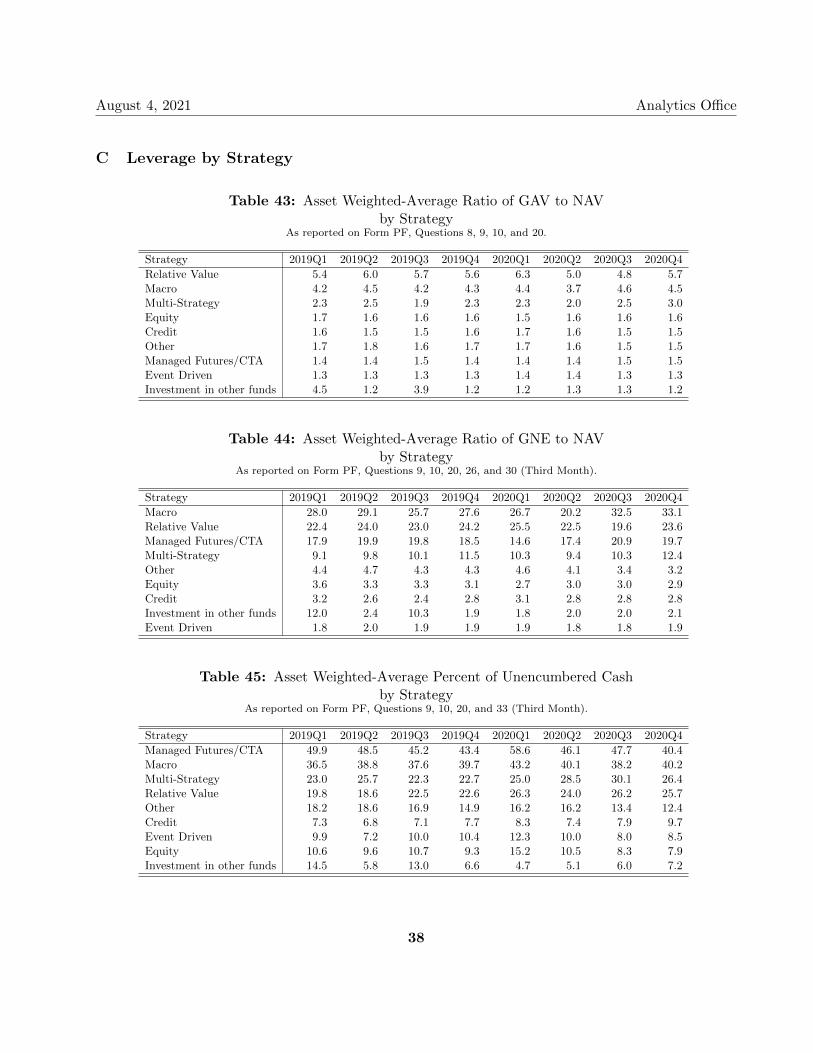
C Leverage by Strategy
Table 43: Asset Weighted-Average Ratio of GAV to NAVby Strategy
As reported on Form PF, Questions 8, 9, 10, and 20.
Strategy 2019Q1 2019Q2 2019Q3 2019Q4 2020Q1 2020Q2 2020Q3 2020Q4
Relative Value 5.4 6.0 5.7 5.6 6.3 5.0 4.8 5.7Macro 4.2 4.5 4.2 4.3 4.4 3.7 4.6 4.5Multi-Strategy 2.3 2.5 1.9 2.3 2.3 2.0 2.5 3.0Equity 1.7 1.6 1.6 1.6 1.5 1.6 1.6 1.6Credit 1.6 1.5 1.5 1.6 1.7 1.6 1.5 1.5Other 1.7 1.8 1.6 1.7 1.7 1.6 1.5 1.5Managed Futures/CTA 1.4 1.4 1.5 1.4 1.4 1.4 1.5 1.5Event Driven 1.3 1.3 1.3 1.3 1.4 1.4 1.3 1.3Investment in other funds 4.5 1.2 3.9 1.2 1.2 1.3 1.3 1.2
Table 44: Asset Weighted-Average Ratio of GNE to NAVby Strategy
As reported on Form PF, Questions 9, 10, 20, 26, and 30 (Third Month).
Strategy 2019Q1 2019Q2 2019Q3 2019Q4 2020Q1 2020Q2 2020Q3 2020Q4
Macro 28.0 29.1 25.7 27.6 26.7 20.2 32.5 33.1Relative Value 22.4 24.0 23.0 24.2 25.5 22.5 19.6 23.6Managed Futures/CTA 17.9 19.9 19.8 18.5 14.6 17.4 20.9 19.7Multi-Strategy 9.1 9.8 10.1 11.5 10.3 9.4 10.3 12.4Other 4.4 4.7 4.3 4.3 4.6 4.1 3.4 3.2Equity 3.6 3.3 3.3 3.1 2.7 3.0 3.0 2.9Credit 3.2 2.6 2.4 2.8 3.1 2.8 2.8 2.8Investment in other funds 12.0 2.4 10.3 1.9 1.8 2.0 2.0 2.1Event Driven 1.8 2.0 1.9 1.9 1.9 1.8 1.8 1.9
Table 45: Asset Weighted-Average Percent of Unencumbered Cashby Strategy
As reported on Form PF, Questions 9, 10, 20, and 33 (Third Month).
Strategy 2019Q1 2019Q2 2019Q3 2019Q4 2020Q1 2020Q2 2020Q3 2020Q4
Managed Futures/CTA 49.9 48.5 45.2 43.4 58.6 46.1 47.7 40.4Macro 36.5 38.8 37.6 39.7 43.2 40.1 38.2 40.2Multi-Strategy 23.0 25.7 22.3 22.7 25.0 28.5 30.1 26.4Relative Value 19.8 18.6 22.5 22.6 26.3 24.0 26.2 25.7Other 18.2 18.6 16.9 14.9 16.2 16.2 13.4 12.4Credit 7.3 6.8 7.1 7.7 8.3 7.4 7.9 9.7Event Driven 9.9 7.2 10.0 10.4 12.3 10.0 8.0 8.5Equity 10.6 9.6 10.7 9.3 15.2 10.5 8.3 7.9Investment in other funds 14.5 5.8 13.0 6.6 4.7 5.1 6.0 7.2
38
August 4, 2021 Analytics Office
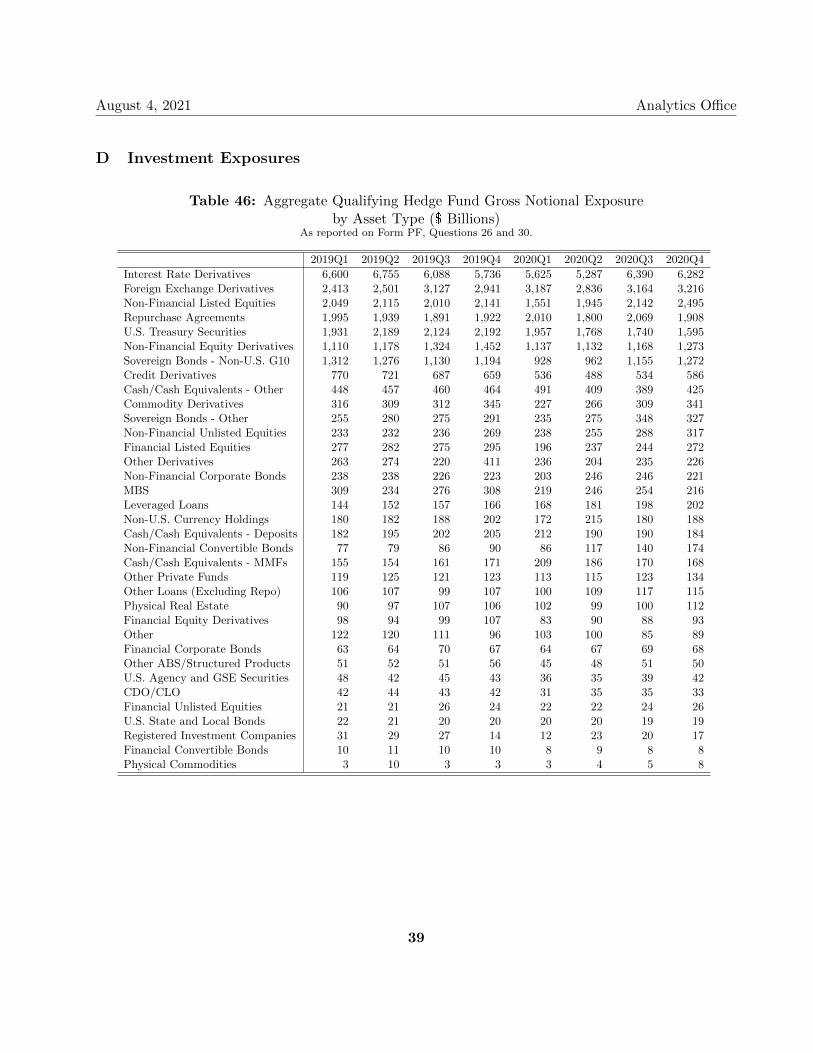
D Investment Exposures
Table 46: Aggregate Qualifying Hedge Fund Gross Notional Exposureby Asset Type ($ Billions)
As reported on Form PF, Questions 26 and 30.
2019Q1 2019Q2 2019Q3 2019Q4 2020Q1 2020Q2 2020Q3 2020Q4
Interest Rate Derivatives 6,600 6,755 6,088 5,736 5,625 5,287 6,390 6,282Foreign Exchange Derivatives 2,413 2,501 3,127 2,941 3,187 2,836 3,164 3,216Non-Financial Listed Equities 2,049 2,115 2,010 2,141 1,551 1,945 2,142 2,495Repurchase Agreements 1,995 1,939 1,891 1,922 2,010 1,800 2,069 1,908U.S. Treasury Securities 1,931 2,189 2,124 2,192 1,957 1,768 1,740 1,595Non-Financial Equity Derivatives 1,110 1,178 1,324 1,452 1,137 1,132 1,168 1,273Sovereign Bonds - Non-U.S. G10 1,312 1,276 1,130 1,194 928 962 1,155 1,272Credit Derivatives 770 721 687 659 536 488 534 586Cash/Cash Equivalents - Other 448 457 460 464 491 409 389 425Commodity Derivatives 316 309 312 345 227 266 309 341Sovereign Bonds - Other 255 280 275 291 235 275 348 327Non-Financial Unlisted Equities 233 232 236 269 238 255 288 317Financial Listed Equities 277 282 275 295 196 237 244 272Other Derivatives 263 274 220 411 236 204 235 226Non-Financial Corporate Bonds 238 238 226 223 203 246 246 221MBS 309 234 276 308 219 246 254 216Leveraged Loans 144 152 157 166 168 181 198 202Non-U.S. Currency Holdings 180 182 188 202 172 215 180 188Cash/Cash Equivalents - Deposits 182 195 202 205 212 190 190 184Non-Financial Convertible Bonds 77 79 86 90 86 117 140 174Cash/Cash Equivalents - MMFs 155 154 161 171 209 186 170 168Other Private Funds 119 125 121 123 113 115 123 134Other Loans (Excluding Repo) 106 107 99 107 100 109 117 115Physical Real Estate 90 97 107 106 102 99 100 112Financial Equity Derivatives 98 94 99 107 83 90 88 93Other 122 120 111 96 103 100 85 89Financial Corporate Bonds 63 64 70 67 64 67 69 68Other ABS/Structured Products 51 52 51 56 45 48 51 50U.S. Agency and GSE Securities 48 42 45 43 36 35 39 42CDO/CLO 42 44 43 42 31 35 35 33Financial Unlisted Equities 21 21 26 24 22 22 24 26U.S. State and Local Bonds 22 21 20 20 20 20 19 19Registered Investment Companies 31 29 27 14 12 23 20 17Financial Convertible Bonds 10 11 10 10 8 9 8 8Physical Commodities 3 10 3 3 3 4 5 8
39
August 4, 2021 Analytics Office
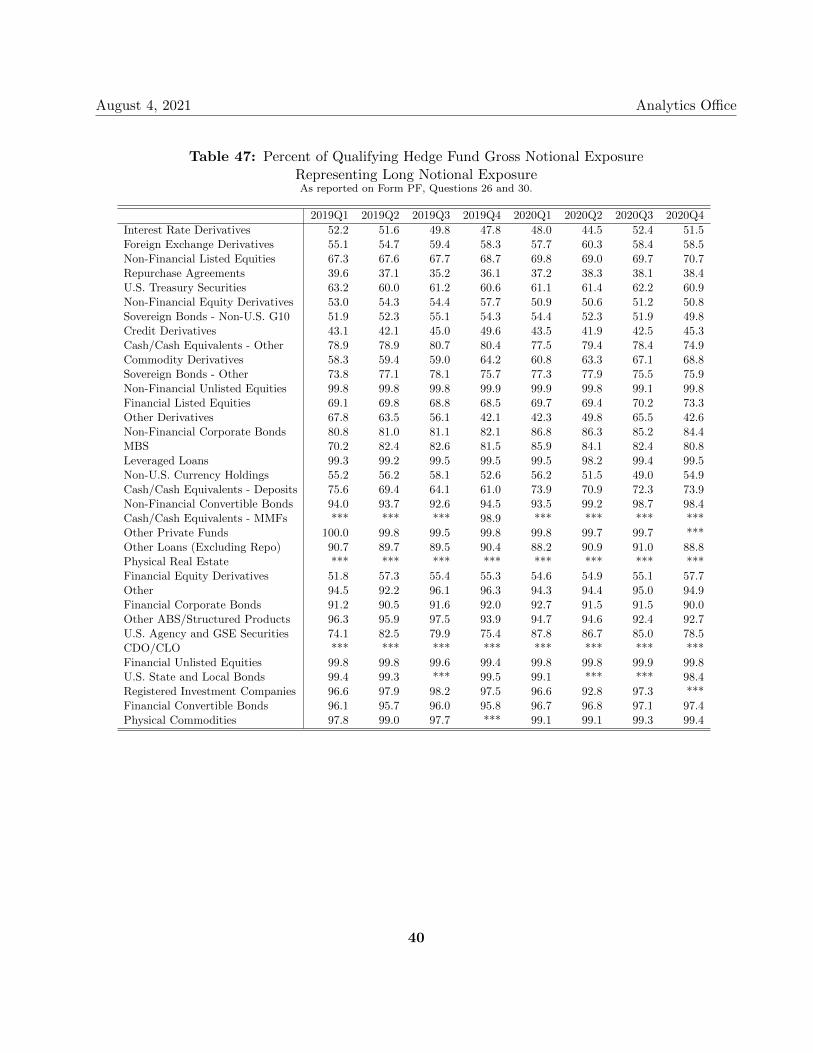
Table 47: Percent of Qualifying Hedge Fund Gross Notional ExposureRepresenting Long Notional ExposureAs reported on Form PF, Questions 26 and 30.
2019Q1 2019Q2 2019Q3 2019Q4 2020Q1 2020Q2 2020Q3 2020Q4
Interest Rate Derivatives 52.2 51.6 49.8 47.8 48.0 44.5 52.4 51.5Foreign Exchange Derivatives 55.1 54.7 59.4 58.3 57.7 60.3 58.4 58.5Non-Financial Listed Equities 67.3 67.6 67.7 68.7 69.8 69.0 69.7 70.7Repurchase Agreements 39.6 37.1 35.2 36.1 37.2 38.3 38.1 38.4U.S. Treasury Securities 63.2 60.0 61.2 60.6 61.1 61.4 62.2 60.9Non-Financial Equity Derivatives 53.0 54.3 54.4 57.7 50.9 50.6 51.2 50.8Sovereign Bonds - Non-U.S. G10 51.9 52.3 55.1 54.3 54.4 52.3 51.9 49.8Credit Derivatives 43.1 42.1 45.0 49.6 43.5 41.9 42.5 45.3Cash/Cash Equivalents - Other 78.9 78.9 80.7 80.4 77.5 79.4 78.4 74.9Commodity Derivatives 58.3 59.4 59.0 64.2 60.8 63.3 67.1 68.8Sovereign Bonds - Other 73.8 77.1 78.1 75.7 77.3 77.9 75.5 75.9Non-Financial Unlisted Equities 99.8 99.8 99.8 99.9 99.9 99.8 99.1 99.8Financial Listed Equities 69.1 69.8 68.8 68.5 69.7 69.4 70.2 73.3Other Derivatives 67.8 63.5 56.1 42.1 42.3 49.8 65.5 42.6Non-Financial Corporate Bonds 80.8 81.0 81.1 82.1 86.8 86.3 85.2 84.4MBS 70.2 82.4 82.6 81.5 85.9 84.1 82.4 80.8Leveraged Loans 99.3 99.2 99.5 99.5 99.5 98.2 99.4 99.5Non-U.S. Currency Holdings 55.2 56.2 58.1 52.6 56.2 51.5 49.0 54.9Cash/Cash Equivalents - Deposits 75.6 69.4 64.1 61.0 73.9 70.9 72.3 73.9Non-Financial Convertible Bonds 94.0 93.7 92.6 94.5 93.5 99.2 98.7 98.4Cash/Cash Equivalents - MMFs *** *** *** 98.9 *** *** *** ***Other Private Funds 100.0 99.8 99.5 99.8 99.8 99.7 99.7 ***Other Loans (Excluding Repo) 90.7 89.7 89.5 90.4 88.2 90.9 91.0 88.8Physical Real Estate *** *** *** *** *** *** *** ***Financial Equity Derivatives 51.8 57.3 55.4 55.3 54.6 54.9 55.1 57.7Other 94.5 92.2 96.1 96.3 94.3 94.4 95.0 94.9Financial Corporate Bonds 91.2 90.5 91.6 92.0 92.7 91.5 91.5 90.0Other ABS/Structured Products 96.3 95.9 97.5 93.9 94.7 94.6 92.4 92.7U.S. Agency and GSE Securities 74.1 82.5 79.9 75.4 87.8 86.7 85.0 78.5CDO/CLO *** *** *** *** *** *** *** ***Financial Unlisted Equities 99.8 99.8 99.6 99.4 99.8 99.8 99.9 99.8U.S. State and Local Bonds 99.4 99.3 *** 99.5 99.1 *** *** 98.4Registered Investment Companies 96.6 97.9 98.2 97.5 96.6 92.8 97.3 ***Financial Convertible Bonds 96.1 95.7 96.0 95.8 96.7 96.8 97.1 97.4Physical Commodities 97.8 99.0 97.7 *** 99.1 99.1 99.3 99.4
40
August 4, 2021 Analytics Office
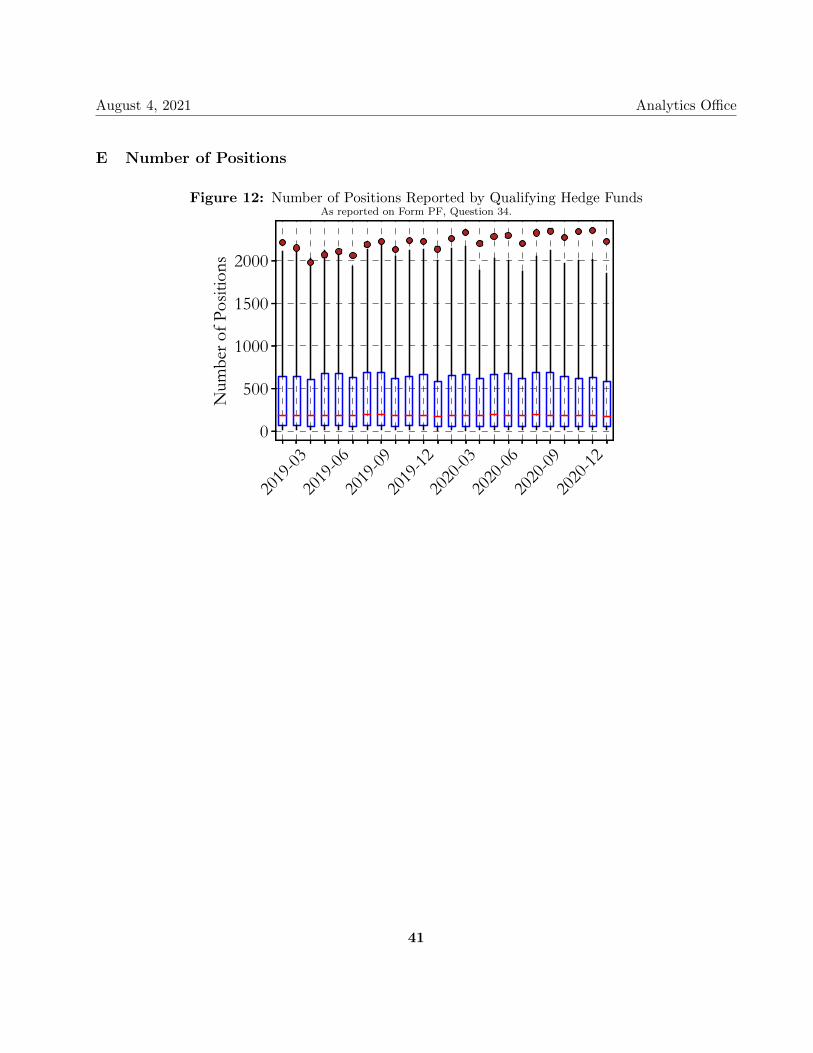
E Number of Positions
Figure 12: Number of Positions Reported by Qualifying Hedge FundsAs reported on Form PF, Question 34.
2019
-03
2019
-06
2019
-09
2019
-12
2020
-03
2020
-06
2020
-09
2020
-120
500
1000
1500
2000
Num
ber o
f Pos
ition
s
41
August 4, 2021 Analytics Office
F Liquidity
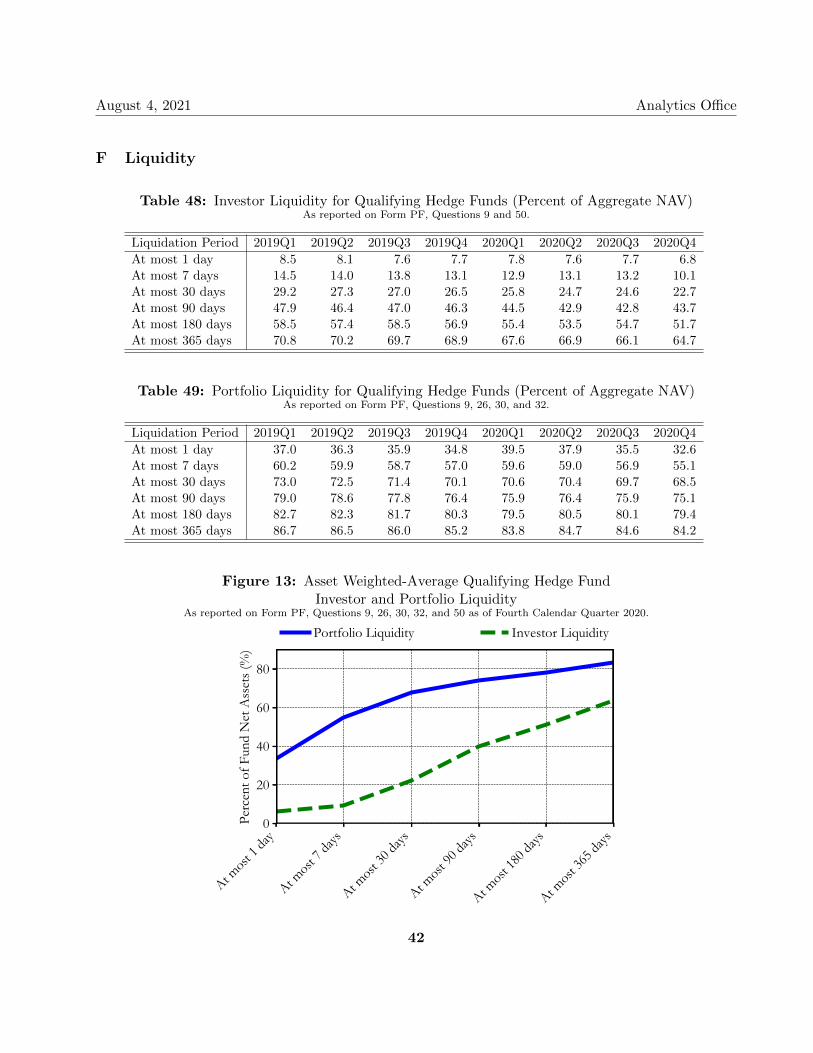
Table 48: Investor Liquidity for Qualifying Hedge Funds (Percent of Aggregate NAV)As reported on Form PF, Questions 9 and 50.
Liquidation Period 2019Q1 2019Q2 2019Q3 2019Q4 2020Q1 2020Q2 2020Q3 2020Q4
At most 1 day 8.5 8.1 7.6 7.7 7.8 7.6 7.7 6.8At most 7 days 14.5 14.0 13.8 13.1 12.9 13.1 13.2 10.1At most 30 days 29.2 27.3 27.0 26.5 25.8 24.7 24.6 22.7At most 90 days 47.9 46.4 47.0 46.3 44.5 42.9 42.8 43.7At most 180 days 58.5 57.4 58.5 56.9 55.4 53.5 54.7 51.7At most 365 days 70.8 70.2 69.7 68.9 67.6 66.9 66.1 64.7
Table 49: Portfolio Liquidity for Qualifying Hedge Funds (Percent of Aggregate NAV)As reported on Form PF, Questions 9, 26, 30, and 32.
Liquidation Period 2019Q1 2019Q2 2019Q3 2019Q4 2020Q1 2020Q2 2020Q3 2020Q4
At most 1 day 37.0 36.3 35.9 34.8 39.5 37.9 35.5 32.6At most 7 days 60.2 59.9 58.7 57.0 59.6 59.0 56.9 55.1At most 30 days 73.0 72.5 71.4 70.1 70.6 70.4 69.7 68.5At most 90 days 79.0 78.6 77.8 76.4 75.9 76.4 75.9 75.1At most 180 days 82.7 82.3 81.7 80.3 79.5 80.5 80.1 79.4At most 365 days 86.7 86.5 86.0 85.2 83.8 84.7 84.6 84.2
Figure 13: Asset Weighted-Average Qualifying Hedge FundInvestor and Portfolio Liquidity
As reported on Form PF, Questions 9, 26, 30, 32, and 50 as of Fourth Calendar Quarter 2020.
At most
1 day
At most
7 day
s
At most
30 da
ys
At most
90 da
ys
At most
180 d
ays
At most
365 d
ays0
20
40
60
80
Perc
ent o
f Fun
d N
et A
sset
s (%
)
Portfolio Liquidity Investor Liquidity
42
August 4, 2021 Analytics Office
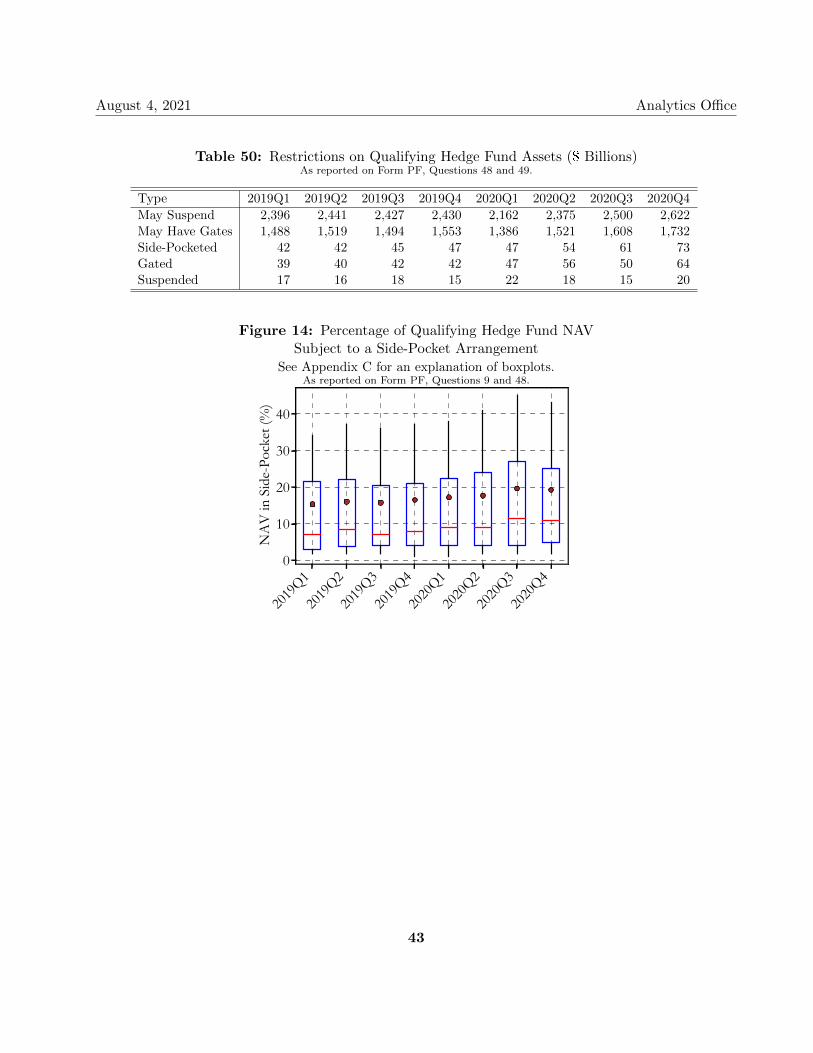
Table 50: Restrictions on Qualifying Hedge Fund Assets ($ Billions)As reported on Form PF, Questions 48 and 49.
Type 2019Q1 2019Q2 2019Q3 2019Q4 2020Q1 2020Q2 2020Q3 2020Q4
May Suspend 2,396 2,441 2,427 2,430 2,162 2,375 2,500 2,622May Have Gates 1,488 1,519 1,494 1,553 1,386 1,521 1,608 1,732Side-Pocketed 42 42 45 47 47 54 61 73Gated 39 40 42 42 47 56 50 64Suspended 17 16 18 15 22 18 15 20
Figure 14: Percentage of Qualifying Hedge Fund NAVSubject to a Side-Pocket Arrangement
See Appendix C for an explanation of boxplots.As reported on Form PF, Questions 9 and 48.
2019
Q1
2019
Q2
2019
Q3
2019
Q4
2020
Q1
2020
Q2
2020
Q3
2020
Q40
10
20
30
40
NA
V in
Sid
e-Po
cket
(%)
43
August 4, 2021 Analytics Office
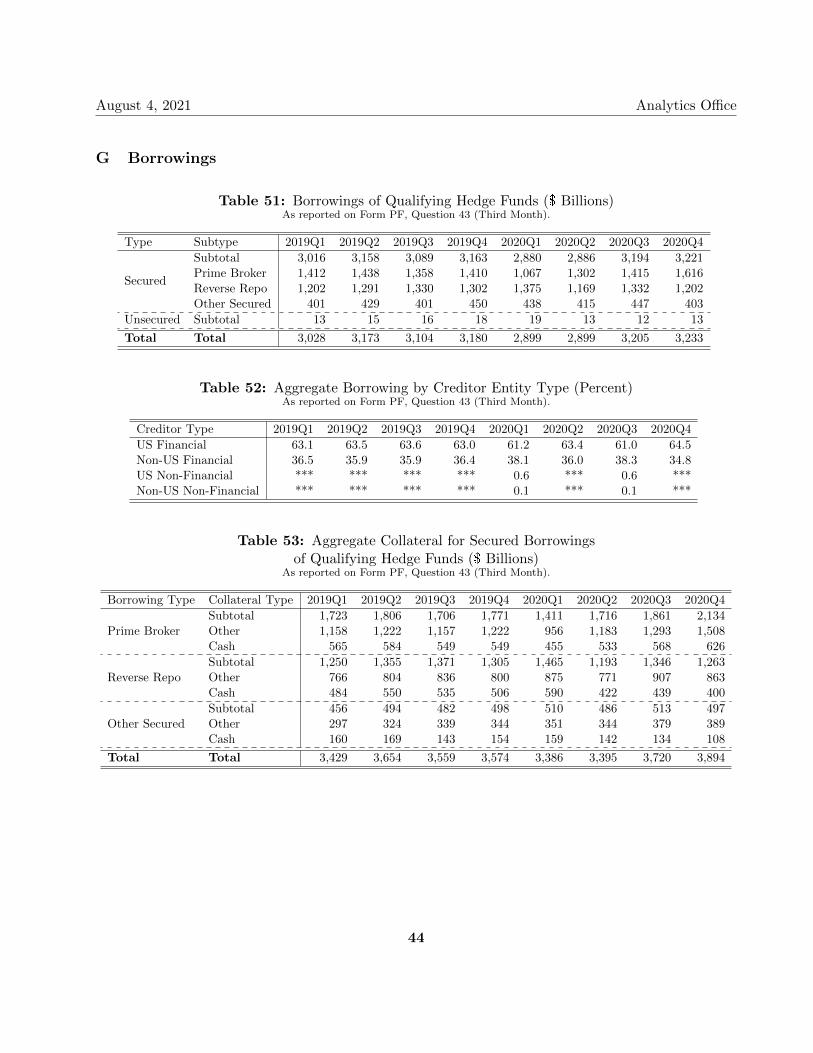
G Borrowings
Table 51: Borrowings of Qualifying Hedge Funds ($ Billions)As reported on Form PF, Question 43 (Third Month).
Type Subtype 2019Q1 2019Q2 2019Q3 2019Q4 2020Q1 2020Q2 2020Q3 2020Q4
Secured
Subtotal 3,016 3,158 3,089 3,163 2,880 2,886 3,194 3,221Prime Broker 1,412 1,438 1,358 1,410 1,067 1,302 1,415 1,616Reverse Repo 1,202 1,291 1,330 1,302 1,375 1,169 1,332 1,202Other Secured 401 429 401 450 438 415 447 403
Unsecured Subtotal 13 15 16 18 19 13 12 13
Total Total 3,028 3,173 3,104 3,180 2,899 2,899 3,205 3,233
Table 52: Aggregate Borrowing by Creditor Entity Type (Percent)As reported on Form PF, Question 43 (Third Month).
Creditor Type 2019Q1 2019Q2 2019Q3 2019Q4 2020Q1 2020Q2 2020Q3 2020Q4
US Financial 63.1 63.5 63.6 63.0 61.2 63.4 61.0 64.5Non-US Financial 36.5 35.9 35.9 36.4 38.1 36.0 38.3 34.8US Non-Financial *** *** *** *** 0.6 *** 0.6 ***Non-US Non-Financial *** *** *** *** 0.1 *** 0.1 ***
Table 53: Aggregate Collateral for Secured Borrowingsof Qualifying Hedge Funds ($ Billions)
As reported on Form PF, Question 43 (Third Month).
Borrowing Type Collateral Type 2019Q1 2019Q2 2019Q3 2019Q4 2020Q1 2020Q2 2020Q3 2020Q4
Prime BrokerSubtotal 1,723 1,806 1,706 1,771 1,411 1,716 1,861 2,134Other 1,158 1,222 1,157 1,222 956 1,183 1,293 1,508Cash 565 584 549 549 455 533 568 626
Reverse RepoSubtotal 1,250 1,355 1,371 1,305 1,465 1,193 1,346 1,263Other 766 804 836 800 875 771 907 863Cash 484 550 535 506 590 422 439 400
Other SecuredSubtotal 456 494 482 498 510 486 513 497Other 297 324 339 344 351 344 379 389Cash 160 169 143 154 159 142 134 108
Total Total 3,429 3,654 3,559 3,574 3,386 3,395 3,720 3,894
44
August 4, 2021 Analytics Office
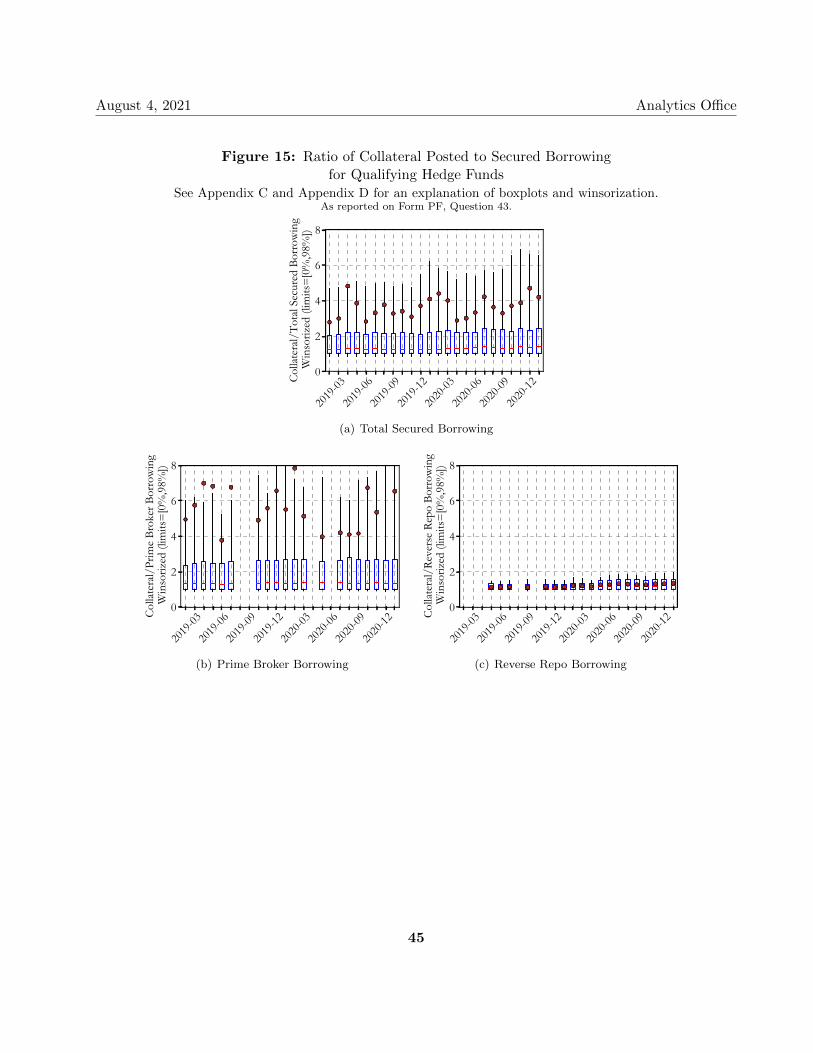
Figure 15: Ratio of Collateral Posted to Secured Borrowingfor Qualifying Hedge Funds
See Appendix C and Appendix D for an explanation of boxplots and winsorization.As reported on Form PF, Question 43.
2019
-03
2019
-06
2019
-09
2019
-12
2020
-03
2020
-06
2020
-09
2020
-120
2
4
6
8
Colla
tera
l/To
tal S
ecur
ed B
orro
win
g W
inso
rized
(lim
its=
[0%
,98%
])
(a) Total Secured Borrowing
2019
-03
2019
-06
2019
-09
2019
-12
2020
-03
2020
-06
2020
-09
2020
-120
2
4
6
8
Colla
tera
l/Pr
ime
Brok
er B
orro
win
g W
inso
rized
(lim
its=
[0%
,98%
])
(b) Prime Broker Borrowing
2019
-03
2019
-06
2019
-09
2019
-12
2020
-03
2020
-06
2020
-09
2020
-120
2
4
6
8
Colla
tera
l/Re
vers
e Re
po B
orro
win
g W
inso
rized
(lim
its=
[0%
,98%
])
(c) Reverse Repo Borrowing
45
August 4, 2021 Analytics Office
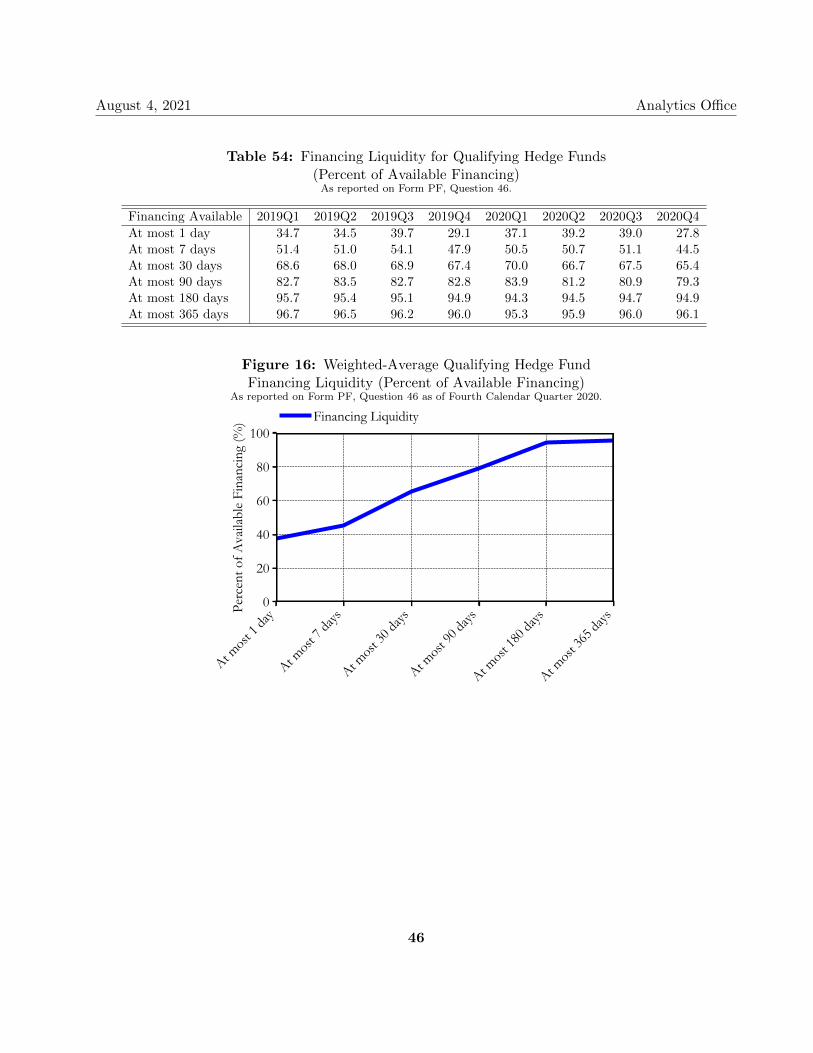
Table 54: Financing Liquidity for Qualifying Hedge Funds(Percent of Available Financing)As reported on Form PF, Question 46.
Financing Available 2019Q1 2019Q2 2019Q3 2019Q4 2020Q1 2020Q2 2020Q3 2020Q4
At most 1 day 34.7 34.5 39.7 29.1 37.1 39.2 39.0 27.8At most 7 days 51.4 51.0 54.1 47.9 50.5 50.7 51.1 44.5At most 30 days 68.6 68.0 68.9 67.4 70.0 66.7 67.5 65.4At most 90 days 82.7 83.5 82.7 82.8 83.9 81.2 80.9 79.3At most 180 days 95.7 95.4 95.1 94.9 94.3 94.5 94.7 94.9At most 365 days 96.7 96.5 96.2 96.0 95.3 95.9 96.0 96.1
Figure 16: Weighted-Average Qualifying Hedge FundFinancing Liquidity (Percent of Available Financing)
As reported on Form PF, Question 46 as of Fourth Calendar Quarter 2020.
At most
1 day
At most
7 day
s
At most
30 da
ys
At most
90 da
ys
At most
180 d
ays
At most
365 d
ays0
20
40
60
80
100
Perc
ent o
f Ava
ilabl
e Fi
nanc
ing
(%) Financing Liquidity
46
August 4, 2021 Analytics Office
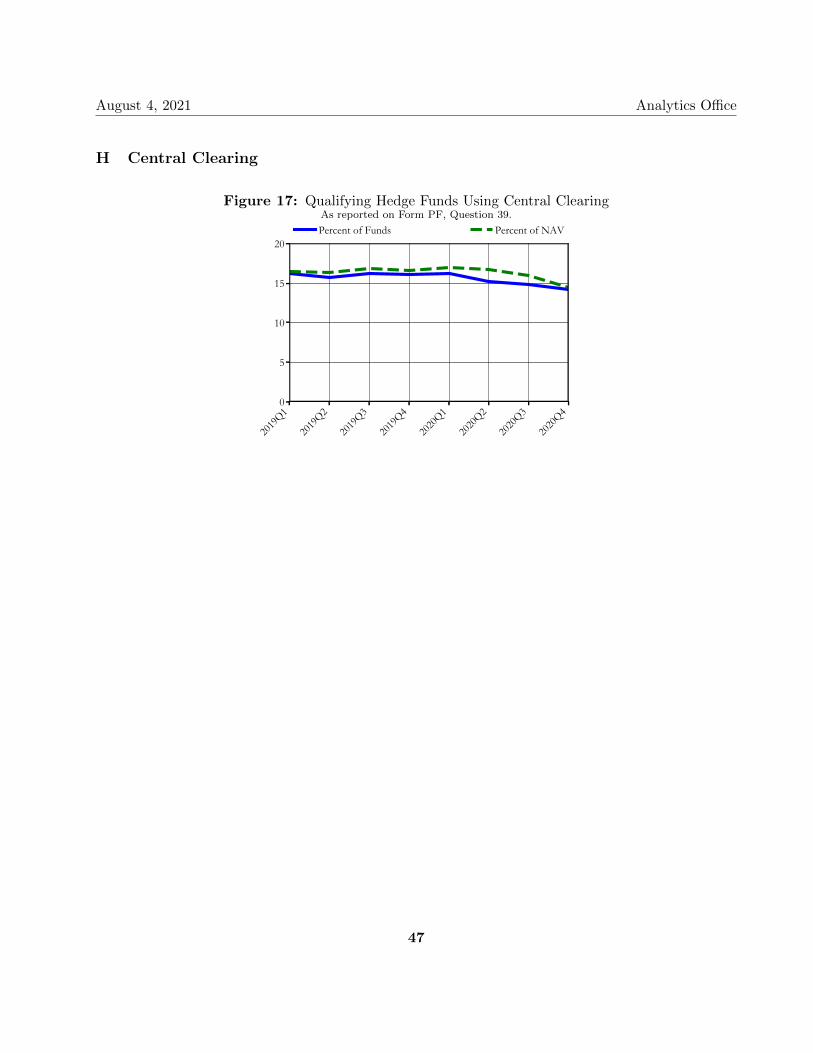
H Central Clearing
Figure 17: Qualifying Hedge Funds Using Central ClearingAs reported on Form PF, Question 39.
2019
Q1
2019
Q2
2019
Q3
2019
Q4
2020
Q1
2020
Q2
2020
Q3
2020
Q40
5
10
15
20Percent of Funds Percent of NAV
47
August 4, 2021 Analytics Office
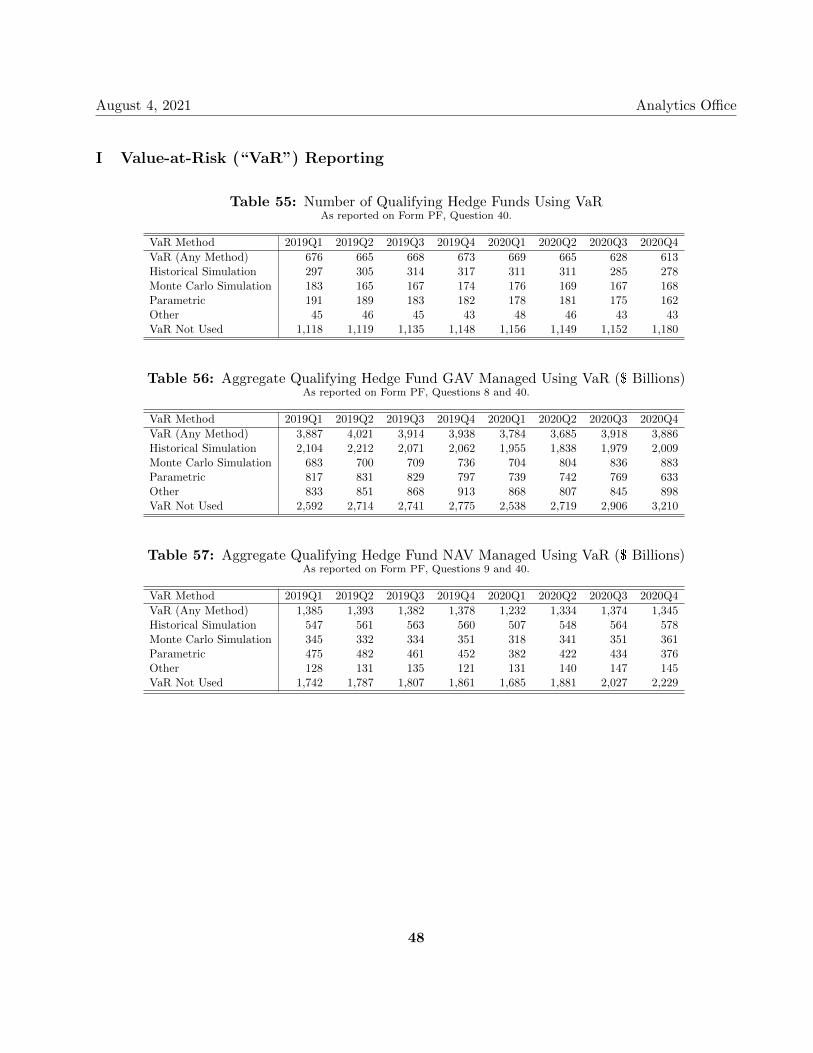
I Value-at-Risk (“VaR”) Reporting
Table 55: Number of Qualifying Hedge Funds Using VaRAs reported on Form PF, Question 40.
VaR Method 2019Q1 2019Q2 2019Q3 2019Q4 2020Q1 2020Q2 2020Q3 2020Q4
VaR (Any Method) 676 665 668 673 669 665 628 613Historical Simulation 297 305 314 317 311 311 285 278Monte Carlo Simulation 183 165 167 174 176 169 167 168Parametric 191 189 183 182 178 181 175 162Other 45 46 45 43 48 46 43 43VaR Not Used 1,118 1,119 1,135 1,148 1,156 1,149 1,152 1,180
Table 56: Aggregate Qualifying Hedge Fund GAV Managed Using VaR ($ Billions)As reported on Form PF, Questions 8 and 40.
VaR Method 2019Q1 2019Q2 2019Q3 2019Q4 2020Q1 2020Q2 2020Q3 2020Q4
VaR (Any Method) 3,887 4,021 3,914 3,938 3,784 3,685 3,918 3,886Historical Simulation 2,104 2,212 2,071 2,062 1,955 1,838 1,979 2,009Monte Carlo Simulation 683 700 709 736 704 804 836 883Parametric 817 831 829 797 739 742 769 633Other 833 851 868 913 868 807 845 898VaR Not Used 2,592 2,714 2,741 2,775 2,538 2,719 2,906 3,210
Table 57: Aggregate Qualifying Hedge Fund NAV Managed Using VaR ($ Billions)As reported on Form PF, Questions 9 and 40.
VaR Method 2019Q1 2019Q2 2019Q3 2019Q4 2020Q1 2020Q2 2020Q3 2020Q4
VaR (Any Method) 1,385 1,393 1,382 1,378 1,232 1,334 1,374 1,345Historical Simulation 547 561 563 560 507 548 564 578Monte Carlo Simulation 345 332 334 351 318 341 351 361Parametric 475 482 461 452 382 422 434 376Other 128 131 135 121 131 140 147 145VaR Not Used 1,742 1,787 1,807 1,861 1,685 1,881 2,027 2,229
48
August 4, 2021 Analytics Office
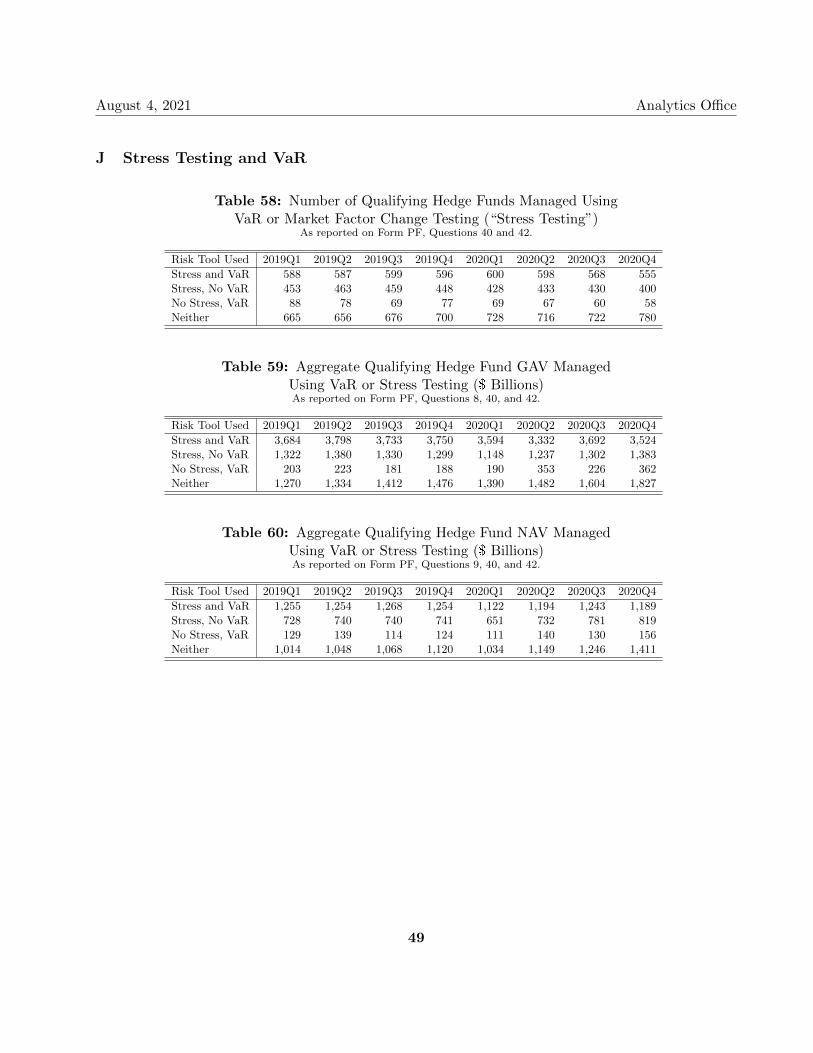
J Stress Testing and VaR
Table 58: Number of Qualifying Hedge Funds Managed UsingVaR or Market Factor Change Testing (“Stress Testing”)
As reported on Form PF, Questions 40 and 42.
Risk Tool Used 2019Q1 2019Q2 2019Q3 2019Q4 2020Q1 2020Q2 2020Q3 2020Q4
Stress and VaR 588 587 599 596 600 598 568 555Stress, No VaR 453 463 459 448 428 433 430 400No Stress, VaR 88 78 69 77 69 67 60 58Neither 665 656 676 700 728 716 722 780
Table 59: Aggregate Qualifying Hedge Fund GAV ManagedUsing VaR or Stress Testing ($ Billions)As reported on Form PF, Questions 8, 40, and 42.
Risk Tool Used 2019Q1 2019Q2 2019Q3 2019Q4 2020Q1 2020Q2 2020Q3 2020Q4
Stress and VaR 3,684 3,798 3,733 3,750 3,594 3,332 3,692 3,524Stress, No VaR 1,322 1,380 1,330 1,299 1,148 1,237 1,302 1,383No Stress, VaR 203 223 181 188 190 353 226 362Neither 1,270 1,334 1,412 1,476 1,390 1,482 1,604 1,827
Table 60: Aggregate Qualifying Hedge Fund NAV ManagedUsing VaR or Stress Testing ($ Billions)As reported on Form PF, Questions 9, 40, and 42.
Risk Tool Used 2019Q1 2019Q2 2019Q3 2019Q4 2020Q1 2020Q2 2020Q3 2020Q4
Stress and VaR 1,255 1,254 1,268 1,254 1,122 1,194 1,243 1,189Stress, No VaR 728 740 740 741 651 732 781 819No Stress, VaR 129 139 114 124 111 140 130 156Neither 1,014 1,048 1,068 1,120 1,034 1,149 1,246 1,411
49
August 4, 2021 Analytics Office
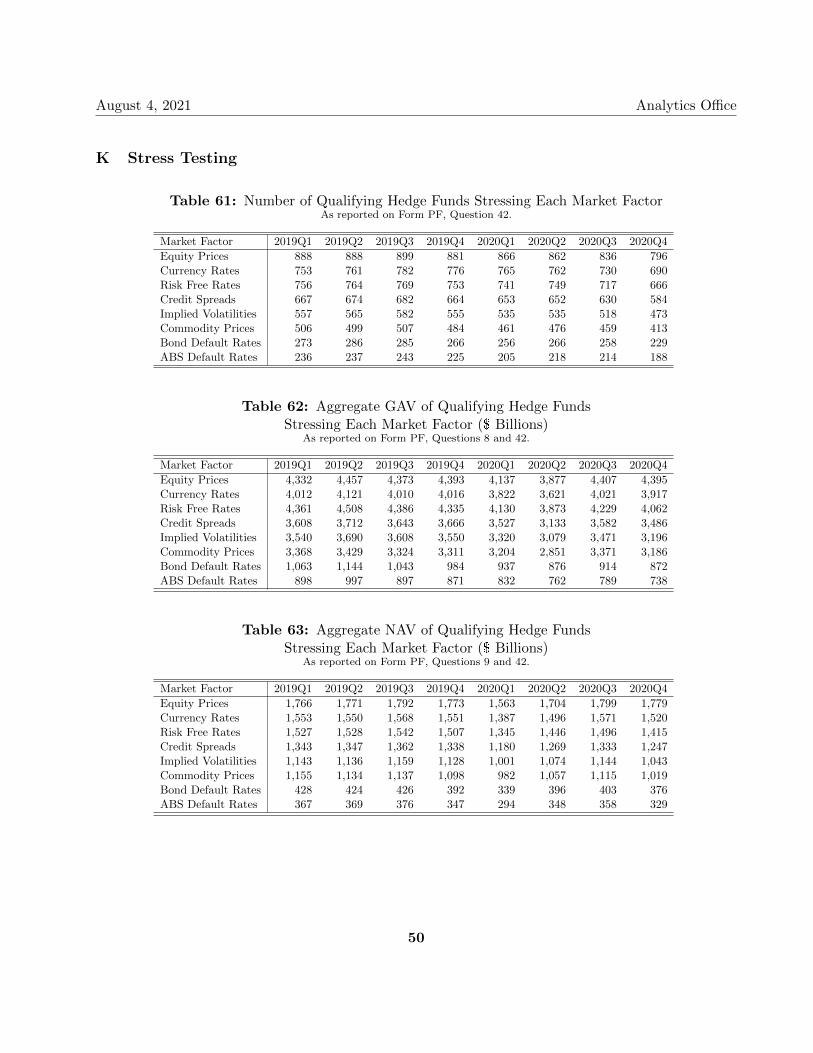
K Stress Testing
Table 61: Number of Qualifying Hedge Funds Stressing Each Market FactorAs reported on Form PF, Question 42.
Market Factor 2019Q1 2019Q2 2019Q3 2019Q4 2020Q1 2020Q2 2020Q3 2020Q4
Equity Prices 888 888 899 881 866 862 836 796Currency Rates 753 761 782 776 765 762 730 690Risk Free Rates 756 764 769 753 741 749 717 666Credit Spreads 667 674 682 664 653 652 630 584Implied Volatilities 557 565 582 555 535 535 518 473Commodity Prices 506 499 507 484 461 476 459 413Bond Default Rates 273 286 285 266 256 266 258 229ABS Default Rates 236 237 243 225 205 218 214 188
Table 62: Aggregate GAV of Qualifying Hedge FundsStressing Each Market Factor ($ Billions)
As reported on Form PF, Questions 8 and 42.
Market Factor 2019Q1 2019Q2 2019Q3 2019Q4 2020Q1 2020Q2 2020Q3 2020Q4
Equity Prices 4,332 4,457 4,373 4,393 4,137 3,877 4,407 4,395Currency Rates 4,012 4,121 4,010 4,016 3,822 3,621 4,021 3,917Risk Free Rates 4,361 4,508 4,386 4,335 4,130 3,873 4,229 4,062Credit Spreads 3,608 3,712 3,643 3,666 3,527 3,133 3,582 3,486Implied Volatilities 3,540 3,690 3,608 3,550 3,320 3,079 3,471 3,196Commodity Prices 3,368 3,429 3,324 3,311 3,204 2,851 3,371 3,186Bond Default Rates 1,063 1,144 1,043 984 937 876 914 872ABS Default Rates 898 997 897 871 832 762 789 738
Table 63: Aggregate NAV of Qualifying Hedge FundsStressing Each Market Factor ($ Billions)
As reported on Form PF, Questions 9 and 42.
Market Factor 2019Q1 2019Q2 2019Q3 2019Q4 2020Q1 2020Q2 2020Q3 2020Q4
Equity Prices 1,766 1,771 1,792 1,773 1,563 1,704 1,799 1,779Currency Rates 1,553 1,550 1,568 1,551 1,387 1,496 1,571 1,520Risk Free Rates 1,527 1,528 1,542 1,507 1,345 1,446 1,496 1,415Credit Spreads 1,343 1,347 1,362 1,338 1,180 1,269 1,333 1,247Implied Volatilities 1,143 1,136 1,159 1,128 1,001 1,074 1,144 1,043Commodity Prices 1,155 1,134 1,137 1,098 982 1,057 1,115 1,019Bond Default Rates 428 424 426 392 339 396 403 376ABS Default Rates 367 369 376 347 294 348 358 329
50
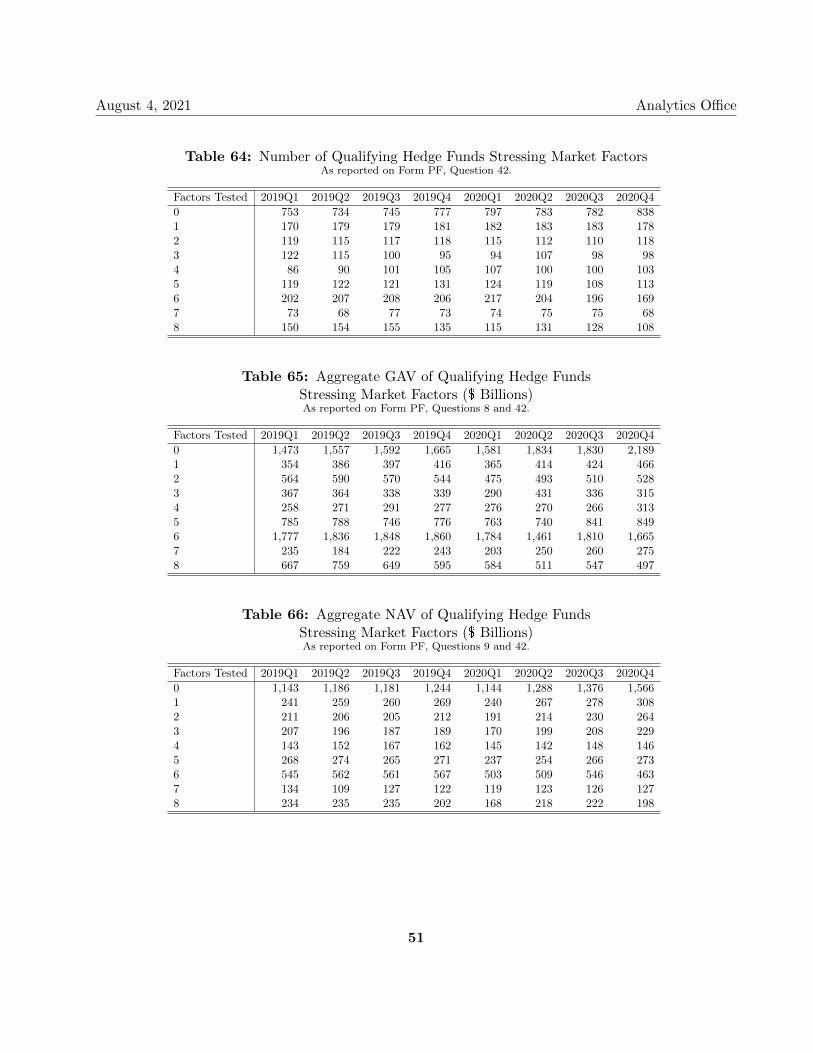
August 4, 2021 Analytics Office
Table 64: Number of Qualifying Hedge Funds Stressing Market FactorsAs reported on Form PF, Question 42.
Factors Tested 2019Q1 2019Q2 2019Q3 2019Q4 2020Q1 2020Q2 2020Q3 2020Q4
0 753 734 745 777 797 783 782 8381 170 179 179 181 182 183 183 1782 119 115 117 118 115 112 110 1183 122 115 100 95 94 107 98 984 86 90 101 105 107 100 100 1035 119 122 121 131 124 119 108 1136 202 207 208 206 217 204 196 1697 73 68 77 73 74 75 75 688 150 154 155 135 115 131 128 108
Table 65: Aggregate GAV of Qualifying Hedge FundsStressing Market Factors ($ Billions)As reported on Form PF, Questions 8 and 42.
Factors Tested 2019Q1 2019Q2 2019Q3 2019Q4 2020Q1 2020Q2 2020Q3 2020Q4
0 1,473 1,557 1,592 1,665 1,581 1,834 1,830 2,1891 354 386 397 416 365 414 424 4662 564 590 570 544 475 493 510 5283 367 364 338 339 290 431 336 3154 258 271 291 277 276 270 266 3135 785 788 746 776 763 740 841 8496 1,777 1,836 1,848 1,860 1,784 1,461 1,810 1,6657 235 184 222 243 203 250 260 2758 667 759 649 595 584 511 547 497
Table 66: Aggregate NAV of Qualifying Hedge FundsStressing Market Factors ($ Billions)As reported on Form PF, Questions 9 and 42.
Factors Tested 2019Q1 2019Q2 2019Q3 2019Q4 2020Q1 2020Q2 2020Q3 2020Q4
0 1,143 1,186 1,181 1,244 1,144 1,288 1,376 1,5661 241 259 260 269 240 267 278 3082 211 206 205 212 191 214 230 2643 207 196 187 189 170 199 208 2294 143 152 167 162 145 142 148 1465 268 274 265 271 237 254 266 2736 545 562 561 567 503 509 546 4637 134 109 127 122 119 123 126 1278 234 235 235 202 168 218 222 198
51
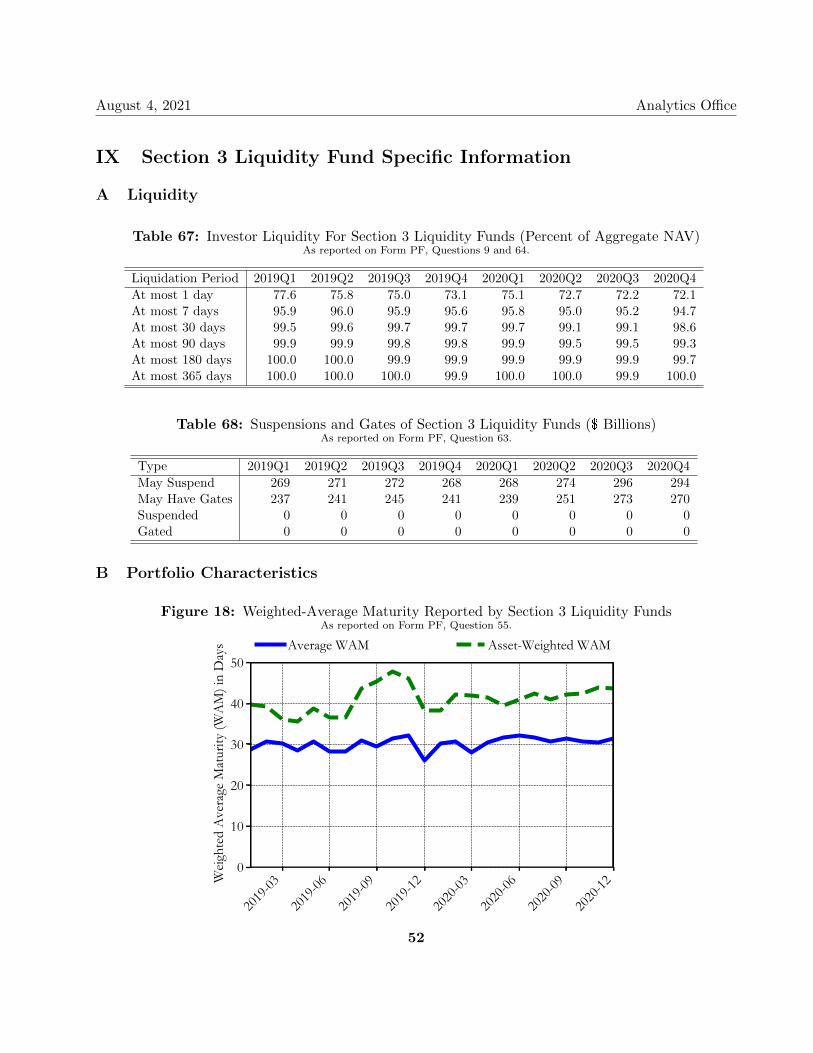
August 4, 2021 Analytics Office
IX Section 3 Liquidity Fund Specific Information
A Liquidity
Table 67: Investor Liquidity For Section 3 Liquidity Funds (Percent of Aggregate NAV)As reported on Form PF, Questions 9 and 64.
Liquidation Period 2019Q1 2019Q2 2019Q3 2019Q4 2020Q1 2020Q2 2020Q3 2020Q4
At most 1 day 77.6 75.8 75.0 73.1 75.1 72.7 72.2 72.1At most 7 days 95.9 96.0 95.9 95.6 95.8 95.0 95.2 94.7At most 30 days 99.5 99.6 99.7 99.7 99.7 99.1 99.1 98.6At most 90 days 99.9 99.9 99.8 99.8 99.9 99.5 99.5 99.3At most 180 days 100.0 100.0 99.9 99.9 99.9 99.9 99.9 99.7At most 365 days 100.0 100.0 100.0 99.9 100.0 100.0 99.9 100.0
Table 68: Suspensions and Gates of Section 3 Liquidity Funds ($ Billions)As reported on Form PF, Question 63.
Type 2019Q1 2019Q2 2019Q3 2019Q4 2020Q1 2020Q2 2020Q3 2020Q4
May Suspend 269 271 272 268 268 274 296 294May Have Gates 237 241 245 241 239 251 273 270Suspended 0 0 0 0 0 0 0 0Gated 0 0 0 0 0 0 0 0
B Portfolio Characteristics
Figure 18: Weighted-Average Maturity Reported by Section 3 Liquidity FundsAs reported on Form PF, Question 55.
2019
-03
2019
-06
2019
-09
2019
-12
2020
-03
2020
-06
2020
-09
2020
-120
10
20
30
40
50
Weig
hted
Ave
rage
Mat
urity
(WA
M) i
n D
ays Average WAM Asset-Weighted WAM
52
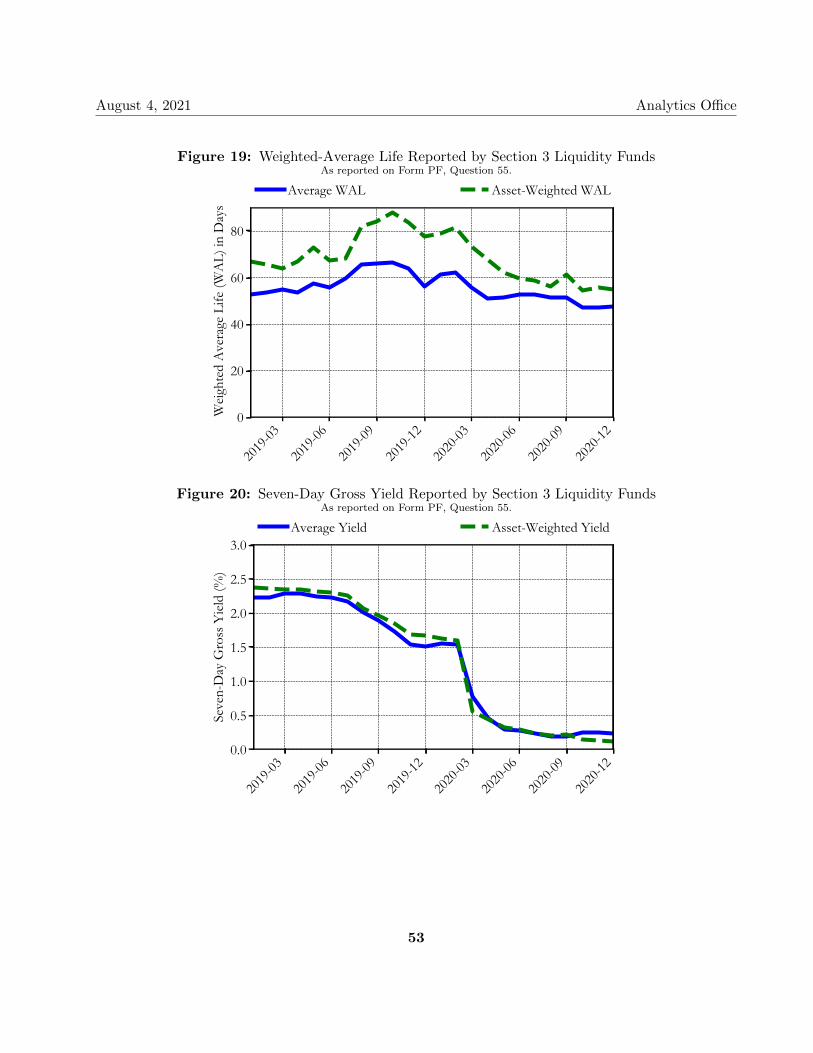
August 4, 2021 Analytics Office
Figure 19: Weighted-Average Life Reported by Section 3 Liquidity FundsAs reported on Form PF, Question 55.
2019
-03
2019
-06
2019
-09
2019
-12
2020
-03
2020
-06
2020
-09
2020
-120
20
40
60
80W
eight
ed A
vera
ge L
ife (W
AL)
in D
ays
Average WAL Asset-Weighted WAL
Figure 20: Seven-Day Gross Yield Reported by Section 3 Liquidity FundsAs reported on Form PF, Question 55.
2019
-03
2019
-06
2019
-09
2019
-12
2020
-03
2020
-06
2020
-09
2020
-120.0
0.5
1.0
1.5
2.0
2.5
3.0
Seve
n-D
ay G
ross
Yiel
d (%
)
Average Yield Asset-Weighted Yield
53
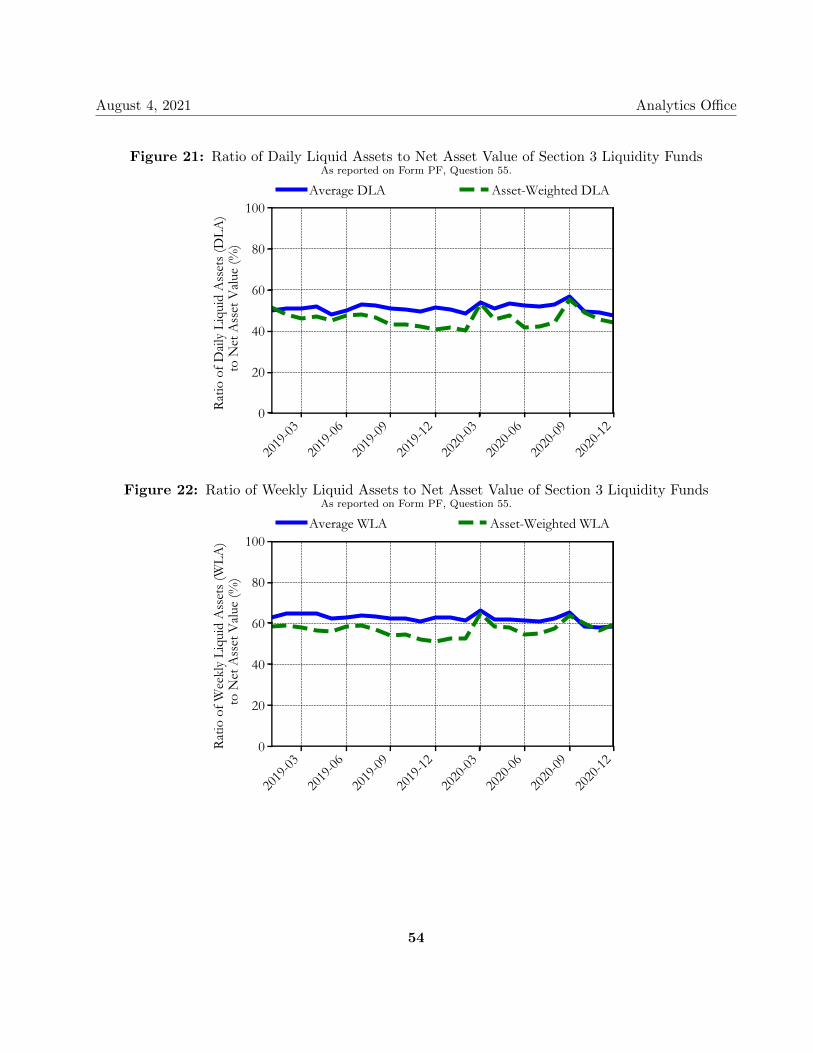
August 4, 2021 Analytics Office
Figure 21: Ratio of Daily Liquid Assets to Net Asset Value of Section 3 Liquidity FundsAs reported on Form PF, Question 55.
2019
-03
2019
-06
2019
-09
2019
-12
2020
-03
2020
-06
2020
-09
2020
-120
20
40
60
80
100Ra
tio o
f Dail
y Li
quid
Ass
ets (
DLA
) to
Net
Ass
et V
alue
(%)
Average DLA Asset-Weighted DLA
Figure 22: Ratio of Weekly Liquid Assets to Net Asset Value of Section 3 Liquidity FundsAs reported on Form PF, Question 55.
2019
-03
2019
-06
2019
-09
2019
-12
2020
-03
2020
-06
2020
-09
2020
-120
20
40
60
80
100
Ratio
of W
eekl
y Li
quid
Ass
ets (
WLA
) to
Net
Ass
et V
alue
(%)
Average WLA Asset-Weighted WLA
54
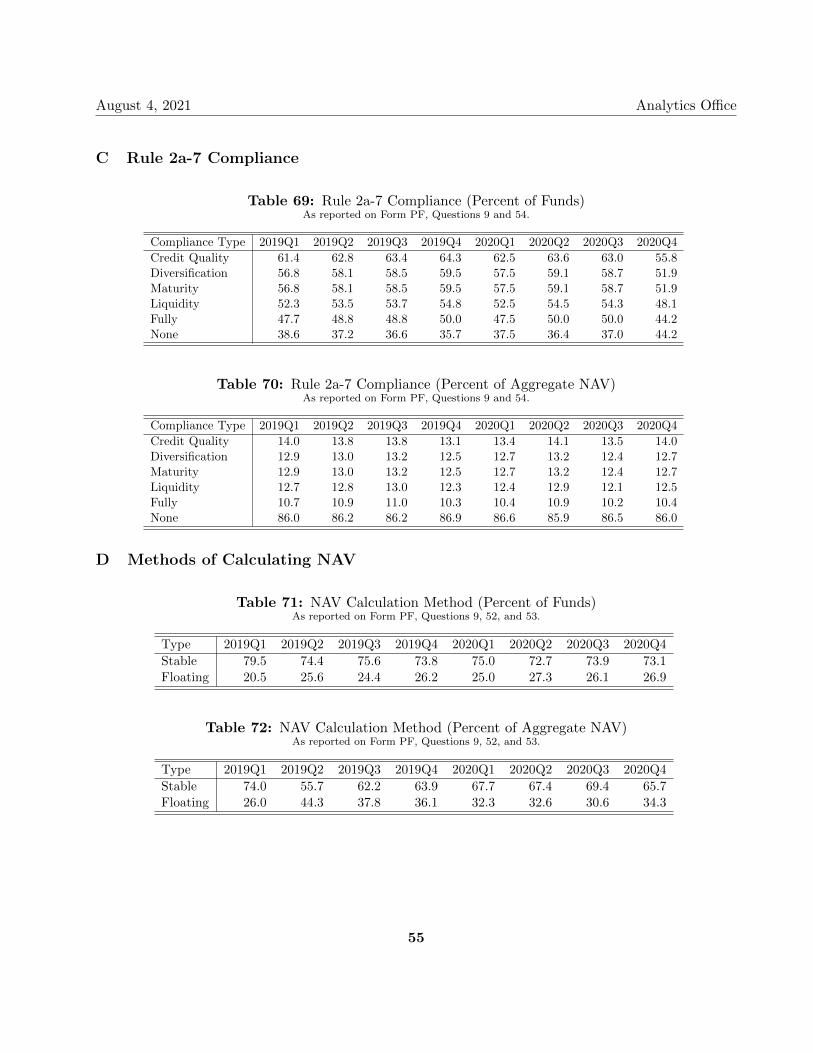
August 4, 2021 Analytics Office
C Rule 2a-7 Compliance
Table 69: Rule 2a-7 Compliance (Percent of Funds)As reported on Form PF, Questions 9 and 54.
Compliance Type 2019Q1 2019Q2 2019Q3 2019Q4 2020Q1 2020Q2 2020Q3 2020Q4
Credit Quality 61.4 62.8 63.4 64.3 62.5 63.6 63.0 55.8Diversification 56.8 58.1 58.5 59.5 57.5 59.1 58.7 51.9Maturity 56.8 58.1 58.5 59.5 57.5 59.1 58.7 51.9Liquidity 52.3 53.5 53.7 54.8 52.5 54.5 54.3 48.1Fully 47.7 48.8 48.8 50.0 47.5 50.0 50.0 44.2None 38.6 37.2 36.6 35.7 37.5 36.4 37.0 44.2
Table 70: Rule 2a-7 Compliance (Percent of Aggregate NAV)As reported on Form PF, Questions 9 and 54.
Compliance Type 2019Q1 2019Q2 2019Q3 2019Q4 2020Q1 2020Q2 2020Q3 2020Q4
Credit Quality 14.0 13.8 13.8 13.1 13.4 14.1 13.5 14.0Diversification 12.9 13.0 13.2 12.5 12.7 13.2 12.4 12.7Maturity 12.9 13.0 13.2 12.5 12.7 13.2 12.4 12.7Liquidity 12.7 12.8 13.0 12.3 12.4 12.9 12.1 12.5Fully 10.7 10.9 11.0 10.3 10.4 10.9 10.2 10.4None 86.0 86.2 86.2 86.9 86.6 85.9 86.5 86.0
D Methods of Calculating NAV
Table 71: NAV Calculation Method (Percent of Funds)As reported on Form PF, Questions 9, 52, and 53.
Type 2019Q1 2019Q2 2019Q3 2019Q4 2020Q1 2020Q2 2020Q3 2020Q4
Stable 79.5 74.4 75.6 73.8 75.0 72.7 73.9 73.1Floating 20.5 25.6 24.4 26.2 25.0 27.3 26.1 26.9
Table 72: NAV Calculation Method (Percent of Aggregate NAV)As reported on Form PF, Questions 9, 52, and 53.
Type 2019Q1 2019Q2 2019Q3 2019Q4 2020Q1 2020Q2 2020Q3 2020Q4
Stable 74.0 55.7 62.2 63.9 67.7 67.4 69.4 65.7Floating 26.0 44.3 37.8 36.1 32.3 32.6 30.6 34.3
55
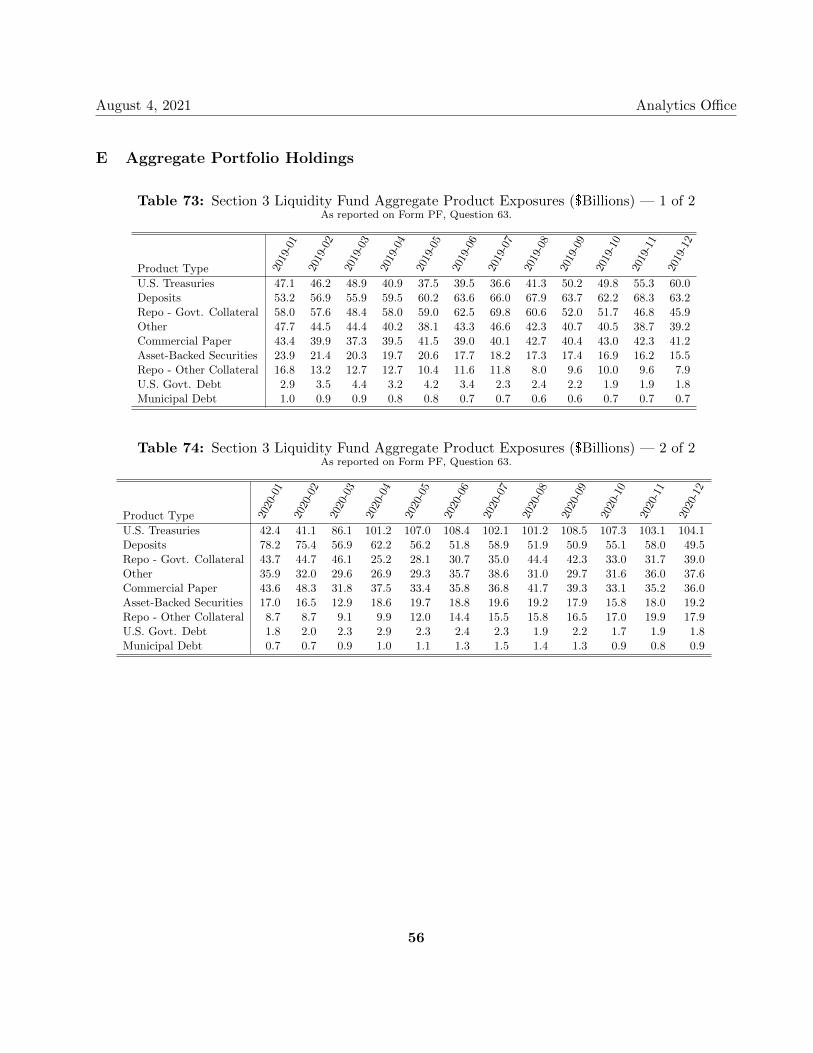
August 4, 2021 Analytics Office
E Aggregate Portfolio Holdings
Table 73: Section 3 Liquidity Fund Aggregate Product Exposures ($Billions) — 1 of 2As reported on Form PF, Question 63.
Product Type 2019
-01
2019
-02
2019
-03
2019
-04
2019
-05
2019
-06
2019
-07
2019
-08
2019
-09
2019
-10
2019
-11
2019
-12
U.S. Treasuries 47.1 46.2 48.9 40.9 37.5 39.5 36.6 41.3 50.2 49.8 55.3 60.0Deposits 53.2 56.9 55.9 59.5 60.2 63.6 66.0 67.9 63.7 62.2 68.3 63.2Repo - Govt. Collateral 58.0 57.6 48.4 58.0 59.0 62.5 69.8 60.6 52.0 51.7 46.8 45.9Other 47.7 44.5 44.4 40.2 38.1 43.3 46.6 42.3 40.7 40.5 38.7 39.2Commercial Paper 43.4 39.9 37.3 39.5 41.5 39.0 40.1 42.7 40.4 43.0 42.3 41.2Asset-Backed Securities 23.9 21.4 20.3 19.7 20.6 17.7 18.2 17.3 17.4 16.9 16.2 15.5Repo - Other Collateral 16.8 13.2 12.7 12.7 10.4 11.6 11.8 8.0 9.6 10.0 9.6 7.9U.S. Govt. Debt 2.9 3.5 4.4 3.2 4.2 3.4 2.3 2.4 2.2 1.9 1.9 1.8Municipal Debt 1.0 0.9 0.9 0.8 0.8 0.7 0.7 0.6 0.6 0.7 0.7 0.7
Table 74: Section 3 Liquidity Fund Aggregate Product Exposures ($Billions) — 2 of 2As reported on Form PF, Question 63.
Product Type 2020
-01
2020
-02
2020
-03
2020
-04
2020
-05
2020
-06
2020
-07
2020
-08
2020
-09
2020
-10
2020
-11
2020
-12
U.S. Treasuries 42.4 41.1 86.1 101.2 107.0 108.4 102.1 101.2 108.5 107.3 103.1 104.1Deposits 78.2 75.4 56.9 62.2 56.2 51.8 58.9 51.9 50.9 55.1 58.0 49.5Repo - Govt. Collateral 43.7 44.7 46.1 25.2 28.1 30.7 35.0 44.4 42.3 33.0 31.7 39.0Other 35.9 32.0 29.6 26.9 29.3 35.7 38.6 31.0 29.7 31.6 36.0 37.6Commercial Paper 43.6 48.3 31.8 37.5 33.4 35.8 36.8 41.7 39.3 33.1 35.2 36.0Asset-Backed Securities 17.0 16.5 12.9 18.6 19.7 18.8 19.6 19.2 17.9 15.8 18.0 19.2Repo - Other Collateral 8.7 8.7 9.1 9.9 12.0 14.4 15.5 15.8 16.5 17.0 19.9 17.9U.S. Govt. Debt 1.8 2.0 2.3 2.9 2.3 2.4 2.3 1.9 2.2 1.7 1.9 1.8Municipal Debt 0.7 0.7 0.9 1.0 1.1 1.3 1.5 1.4 1.3 0.9 0.8 0.9
56
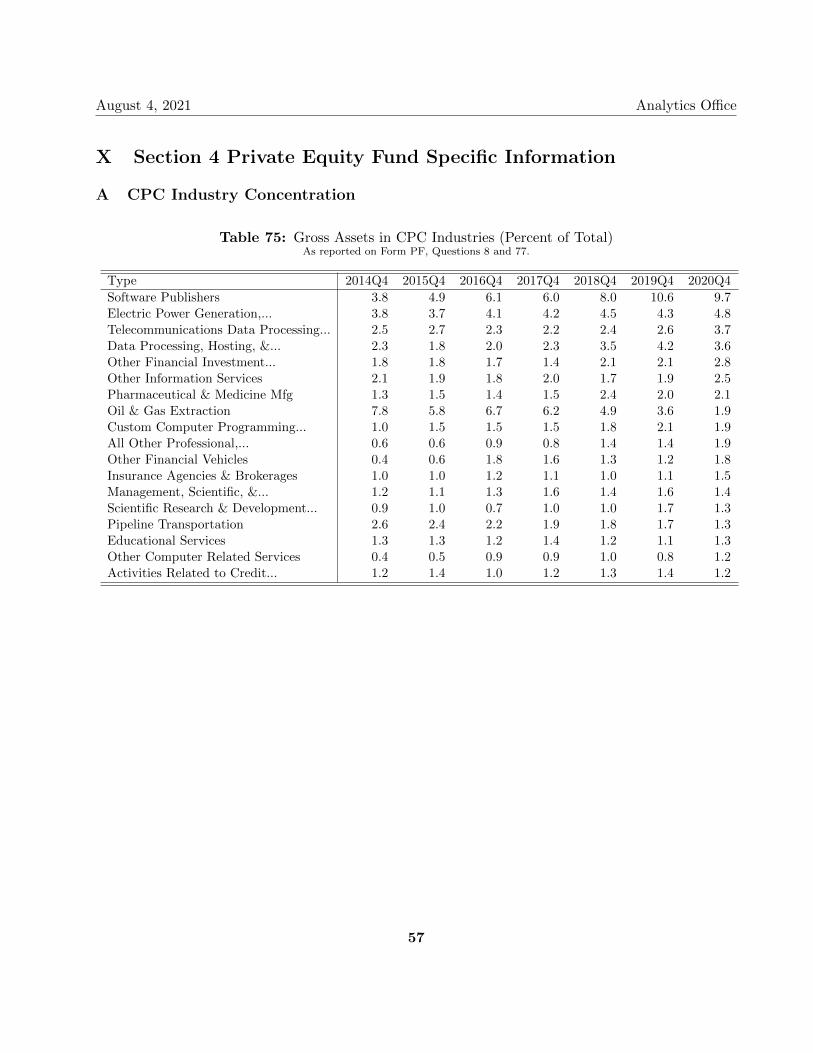
August 4, 2021 Analytics Office
X Section 4 Private Equity Fund Specific Information
A CPC Industry Concentration
Table 75: Gross Assets in CPC Industries (Percent of Total)As reported on Form PF, Questions 8 and 77.
Type 2014Q4 2015Q4 2016Q4 2017Q4 2018Q4 2019Q4 2020Q4
Software Publishers 3.8 4.9 6.1 6.0 8.0 10.6 9.7Electric Power Generation,... 3.8 3.7 4.1 4.2 4.5 4.3 4.8Telecommunications Data Processing... 2.5 2.7 2.3 2.2 2.4 2.6 3.7Data Processing, Hosting, &... 2.3 1.8 2.0 2.3 3.5 4.2 3.6Other Financial Investment... 1.8 1.8 1.7 1.4 2.1 2.1 2.8Other Information Services 2.1 1.9 1.8 2.0 1.7 1.9 2.5Pharmaceutical & Medicine Mfg 1.3 1.5 1.4 1.5 2.4 2.0 2.1Oil & Gas Extraction 7.8 5.8 6.7 6.2 4.9 3.6 1.9Custom Computer Programming... 1.0 1.5 1.5 1.5 1.8 2.1 1.9All Other Professional,... 0.6 0.6 0.9 0.8 1.4 1.4 1.9Other Financial Vehicles 0.4 0.6 1.8 1.6 1.3 1.2 1.8Insurance Agencies & Brokerages 1.0 1.0 1.2 1.1 1.0 1.1 1.5Management, Scientific, &... 1.2 1.1 1.3 1.6 1.4 1.6 1.4Scientific Research & Development... 0.9 1.0 0.7 1.0 1.0 1.7 1.3Pipeline Transportation 2.6 2.4 2.2 1.9 1.8 1.7 1.3Educational Services 1.3 1.3 1.2 1.4 1.2 1.1 1.3Other Computer Related Services 0.4 0.5 0.9 0.9 1.0 0.8 1.2Activities Related to Credit... 1.2 1.4 1.0 1.2 1.3 1.4 1.2
57
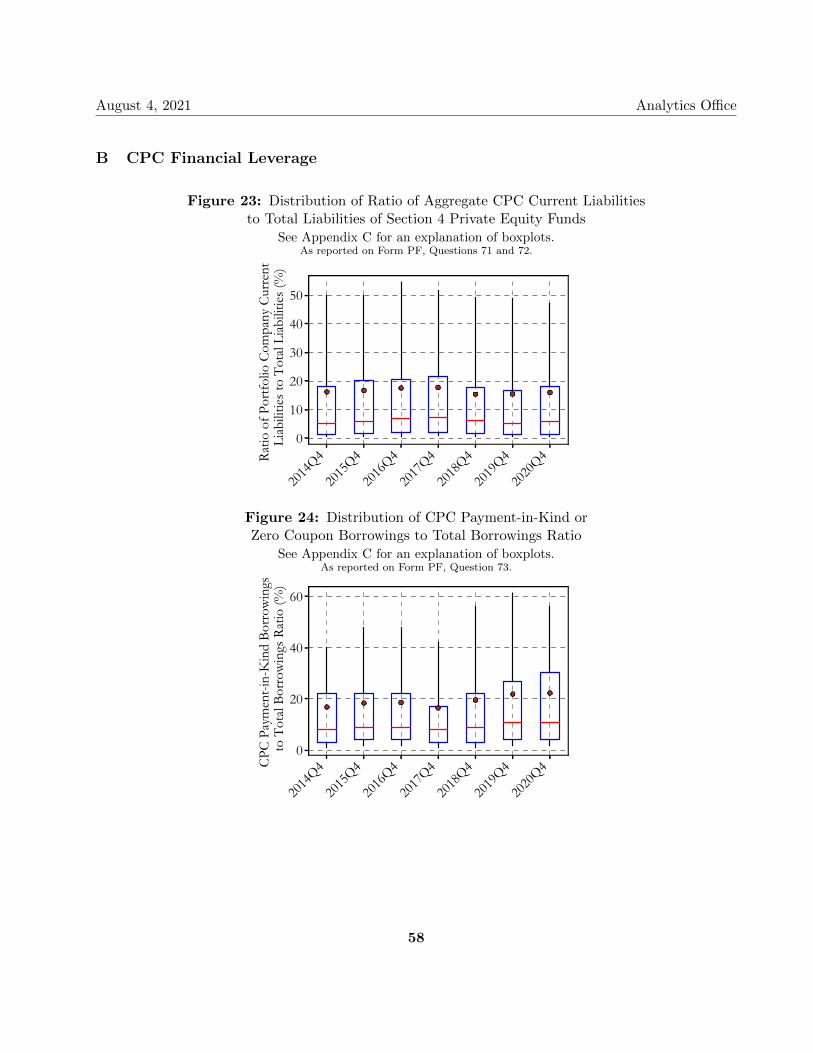
August 4, 2021 Analytics Office
B CPC Financial Leverage
Figure 23: Distribution of Ratio of Aggregate CPC Current Liabilitiesto Total Liabilities of Section 4 Private Equity Funds
See Appendix C for an explanation of boxplots.As reported on Form PF, Questions 71 and 72.
2014
Q4
2015
Q4
2016
Q4
2017
Q4
2018
Q4
2019
Q4
2020
Q40
10
20
30
40
50
Ratio
of P
ortfo
lio C
ompa
ny C
urre
nt
Liab
ilitie
s to
Tota
l Liab
ilitie
s (%
)
Figure 24: Distribution of CPC Payment-in-Kind orZero Coupon Borrowings to Total Borrowings Ratio
See Appendix C for an explanation of boxplots.As reported on Form PF, Question 73.
2014
Q4
2015
Q4
2016
Q4
2017
Q4
2018
Q4
2019
Q4
2020
Q40
20
40
60
CPC
Paym
ent-i
n-K
ind
Borr
owin
gs
to T
otal
Borr
owin
gs R
atio
(%)
58
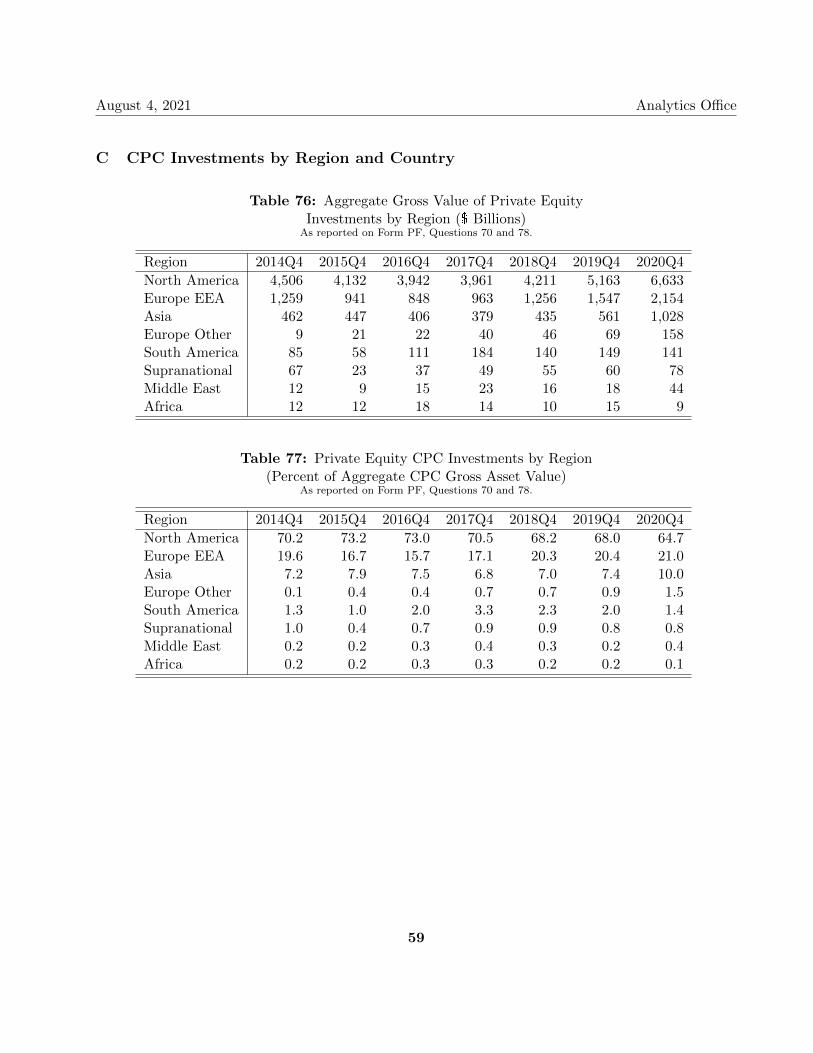
August 4, 2021 Analytics Office
C CPC Investments by Region and Country
Table 76: Aggregate Gross Value of Private EquityInvestments by Region ($ Billions)
As reported on Form PF, Questions 70 and 78.
Region 2014Q4 2015Q4 2016Q4 2017Q4 2018Q4 2019Q4 2020Q4
North America 4,506 4,132 3,942 3,961 4,211 5,163 6,633Europe EEA 1,259 941 848 963 1,256 1,547 2,154Asia 462 447 406 379 435 561 1,028Europe Other 9 21 22 40 46 69 158South America 85 58 111 184 140 149 141Supranational 67 23 37 49 55 60 78Middle East 12 9 15 23 16 18 44Africa 12 12 18 14 10 15 9
Table 77: Private Equity CPC Investments by Region(Percent of Aggregate CPC Gross Asset Value)
As reported on Form PF, Questions 70 and 78.
Region 2014Q4 2015Q4 2016Q4 2017Q4 2018Q4 2019Q4 2020Q4
North America 70.2 73.2 73.0 70.5 68.2 68.0 64.7Europe EEA 19.6 16.7 15.7 17.1 20.3 20.4 21.0Asia 7.2 7.9 7.5 6.8 7.0 7.4 10.0Europe Other 0.1 0.4 0.4 0.7 0.7 0.9 1.5South America 1.3 1.0 2.0 3.3 2.3 2.0 1.4Supranational 1.0 0.4 0.7 0.9 0.9 0.8 0.8Middle East 0.2 0.2 0.3 0.4 0.3 0.2 0.4Africa 0.2 0.2 0.3 0.3 0.2 0.2 0.1
59
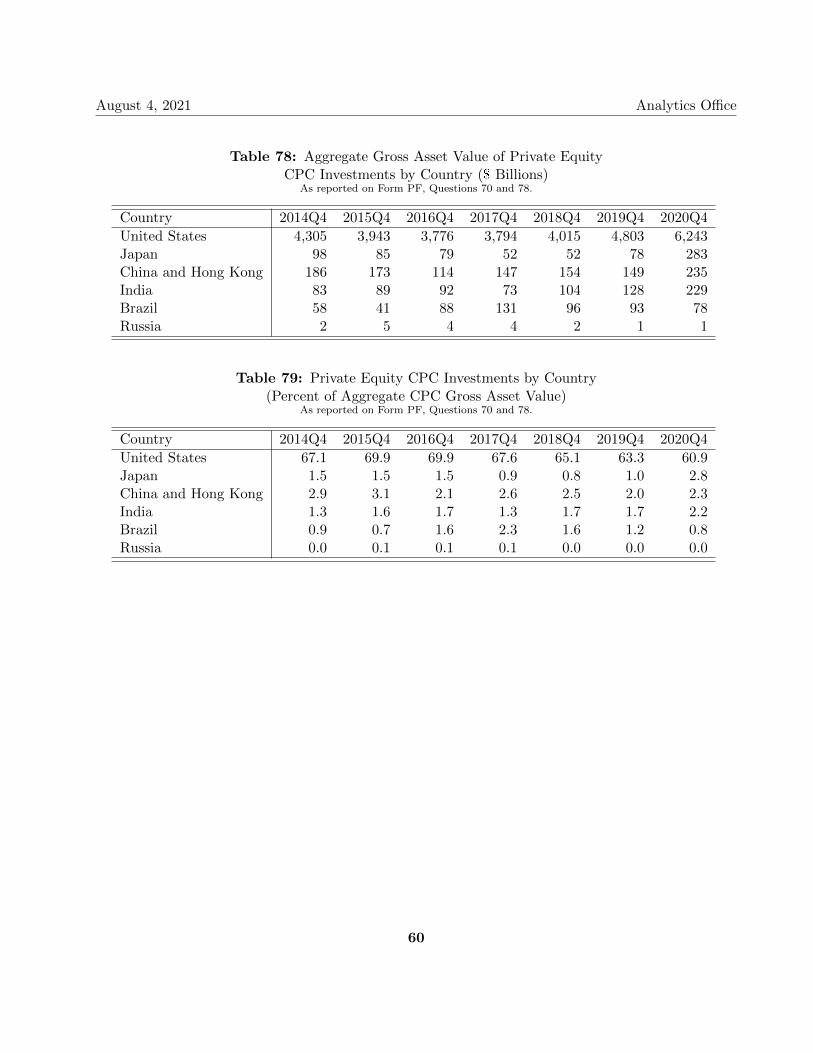
August 4, 2021 Analytics Office
Table 78: Aggregate Gross Asset Value of Private EquityCPC Investments by Country ($ Billions)
As reported on Form PF, Questions 70 and 78.
Country 2014Q4 2015Q4 2016Q4 2017Q4 2018Q4 2019Q4 2020Q4
United States 4,305 3,943 3,776 3,794 4,015 4,803 6,243Japan 98 85 79 52 52 78 283China and Hong Kong 186 173 114 147 154 149 235India 83 89 92 73 104 128 229Brazil 58 41 88 131 96 93 78Russia 2 5 4 4 2 1 1
Table 79: Private Equity CPC Investments by Country(Percent of Aggregate CPC Gross Asset Value)
As reported on Form PF, Questions 70 and 78.
Country 2014Q4 2015Q4 2016Q4 2017Q4 2018Q4 2019Q4 2020Q4
United States 67.1 69.9 69.9 67.6 65.1 63.3 60.9Japan 1.5 1.5 1.5 0.9 0.8 1.0 2.8China and Hong Kong 2.9 3.1 2.1 2.6 2.5 2.0 2.3India 1.3 1.6 1.7 1.3 1.7 1.7 2.2Brazil 0.9 0.7 1.6 2.3 1.6 1.2 0.8Russia 0.0 0.1 0.1 0.1 0.0 0.0 0.0
60
August 4, 2021 Analytics Office
XI Appendices
A Form PF Filer Categories
The amount of information an adviser must report and the frequency with which it must reporton Form PF depends on the amount of the adviser’s private fund assets and the types of privatefunds managed. Reporting advisers must identify the types of private funds they manage on FormPF.
1 All Private Fund Advisers
SEC-registered investment advisers with at least $150 million in private fund assets undermanagement are required to file Form PF. Registered investment advisers with less than $150 millionin private funds assets under management, exempt reporting advisers, and state-registered advisersreport general private fund data on Form ADV, but do not file Form PF.6 Not all Form PF filersreport on a quarterly basis. Smaller private fund advisers and all private equity fund advisers fileForm PF on an annual basis, while larger hedge fund advisers and larger liquidity fund advisers filethe form quarterly.7 As a result of the difference in reporting frequency, information in this reportrelated to funds that are reported annually may be dated by several months.8
2 Large Hedge Fund Advisers
Large Hedge Fund Advisers have at least $1.5 billion in hedge fund assets under management.A Large Hedge Fund Adviser is required to file Form PF quarterly and provide data about eachhedge fund it managed during the reporting period (irrespective of the size of the fund).
Large Hedge Fund Advisers must report more information on Form PF about Qualifying HedgeFunds than other hedge funds they manage during the reporting period. A Qualifying Hedge Fund isany hedge fund advised by a Large Hedge Fund Adviser that had a NAV (individually or incombination with any feeder funds, parallel funds, and/or dependent parallel managed accounts) ofat least $500 million as of the last day of any month in the fiscal quarter immediately preceding theadviser’s most recently completed fiscal quarter. This report provides information about all hedgefunds reported by Large Hedge Fund Advisers, including Qualifying Hedge Funds and smaller hedgefunds. This report also provides an overview of certain data reported solely for Qualifying HedgeFunds.
6Note that these thresholds are on a gross basis. Exempt reporting advisers are advisers that rely on the exemptionsfrom SEC registration in Advisers Act section 203(l) for venture capital fund advisers and section 203(m) for advisersmanaging less than $150 million in private fund assets in the U.S.7An adviser may be a large hedge fund adviser that must file quarterly to report data about the hedge funds it manages
as well as a private equity fund adviser that must file only annually to report data about the private equity funds itmanages.8In addition, because some Form PF filers have fiscal year ends that are not December 31, not all Form PF data is filed
as of a single date.
61
August 4, 2021 Analytics Office
3 Large Liquidity Fund Advisers
Large Liquidity Fund Advisers have at least $1 billion in combined liquidity fund and moneymarket fund assets under management. On a quarterly basis, such advisers report on Form PF dataabout the liquidity funds they managed during the reporting period (irrespective of the size of thefund). This report contains information about all liquidity funds reported by Large Liquidity FundAdvisers (referred to in this report as “Section 3 Liquidity Funds”).
4 Large Private Equity Fund Advisers
Large Private Equity Fund Advisers have at least a $2 billion in private equity fund assetsunder management. These advisers are required to file Form PF annually in connection with theprivate equity funds they managed during the reporting period. Smaller Private Equity FundAdvisers must file annually as well, but provide less detail regarding the private equity funds theymanage. This report provides information about private equity funds managed by Large PrivateEquity Fund Advisers (referred to in this report as “Section 4 Private Equity Funds”).
5 Other Private Fund Advisers
All advisers required to file Form PF that are not Large Hedge Fund Advisers or LargeLiquidity Fund Advisers must file Form PF annually to report data about each private fundmanaged by the adviser.9 These “annual filing advisers” include smaller fund advisers, Large PrivateEquity Fund advisers, and venture capital fund advisers. Annual filers must provide specificinformation about each of the private funds they manage on an annual basis.
9This includes “other private funds,” which are private funds that do not meet the Form PF definition of hedge fund,liquidity fund, private equity fund, real estate fund, securitized asset fund, or venture capital fund.
62
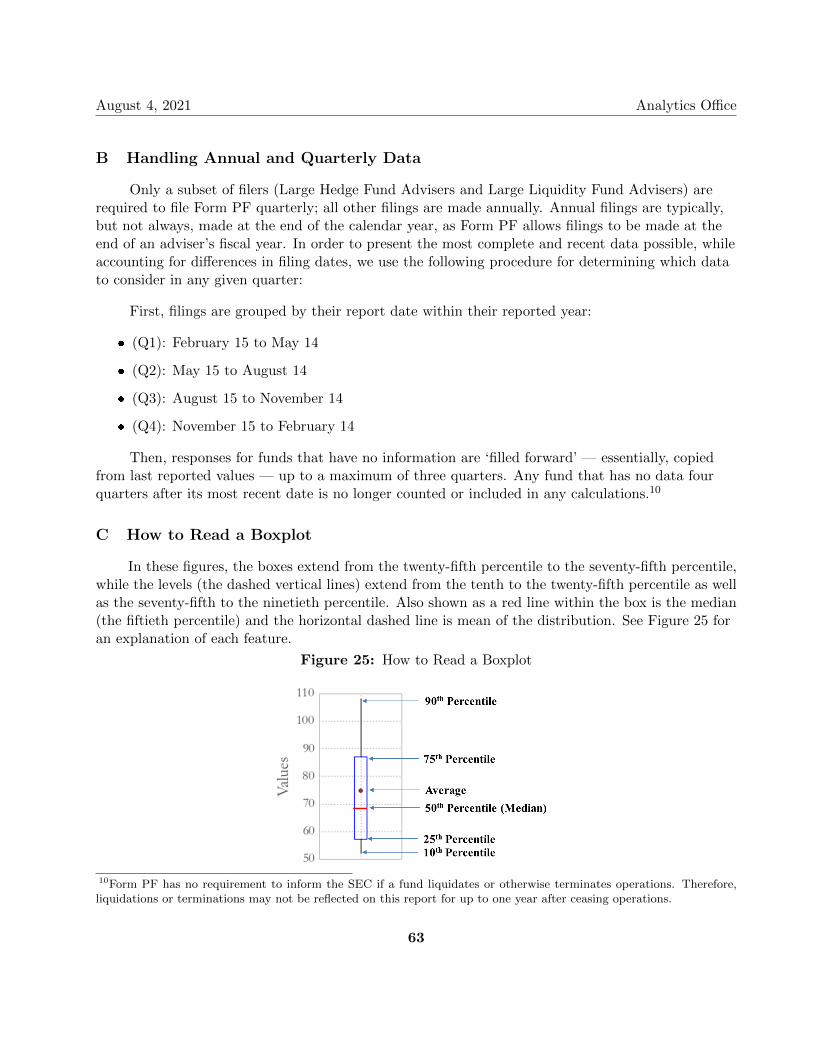
August 4, 2021 Analytics Office
B Handling Annual and Quarterly Data
Only a subset of filers (Large Hedge Fund Advisers and Large Liquidity Fund Advisers) arerequired to file Form PF quarterly; all other filings are made annually. Annual filings are typically,but not always, made at the end of the calendar year, as Form PF allows filings to be made at theend of an adviser’s fiscal year. In order to present the most complete and recent data possible, whileaccounting for differences in filing dates, we use the following procedure for determining which datato consider in any given quarter:
First, filings are grouped by their report date within their reported year:
� (Q1): February 15 to May 14
� (Q2): May 15 to August 14
� (Q3): August 15 to November 14
� (Q4): November 15 to February 14
Then, responses for funds that have no information are ‘filled forward’ — essentially, copiedfrom last reported values — up to a maximum of three quarters. Any fund that has no data fourquarters after its most recent date is no longer counted or included in any calculations.10
C How to Read a Boxplot
In these figures, the boxes extend from the twenty-fifth percentile to the seventy-fifth percentile,while the levels (the dashed vertical lines) extend from the tenth to the twenty-fifth percentile as wellas the seventy-fifth to the ninetieth percentile. Also shown as a red line within the box is the median(the fiftieth percentile) and the horizontal dashed line is mean of the distribution. See Figure 25 foran explanation of each feature.
Figure 25: How to Read a Boxplot
10Form PF has no requirement to inform the SEC if a fund liquidates or otherwise terminates operations. Therefore,liquidations or terminations may not be reflected on this report for up to one year after ceasing operations.
63
August 4, 2021 Analytics Office
D Mitigating the Effects of Outliers
Form PF data occasionally contains spurious outliers. While Analytics Office staff activelyengages in outreach to identify and correct such values, not all aberrant values have been correctedas of this writing. To reduce the effect of these outliers on the aggregate measures reported here, wehave chosen to winsorize or trim some data sets.
Winsorization is a technique for reducing the effect of outliers by reducing the size of the largestand smallest values in a distribution.11 For example, to calculate a 95%/5% winsorized data set, allthe values above the ninety-fifth percentile are set to the value of the ninety-fifth percentile, and allthe values below the fifth percentile are set to the value of the fifth percentile. Effectively, thisprocedure makes the very largest values smaller (but still large), and all the smallest values larger(but still small). This approach can be more effective than trimming (simply removing the largestand/or smallest values) because it does not change the number of data points and does not changethe median or other percentile values within the 95%/5% range. All instances of winsorization ortrimming have been noted and include the affected percentiles.
11Such techniques are known as ‘robust statistics’, reviewed for example in Wilcox (2012), Introduction to RobustEstimation & Hypothesis Testing, 3rd Edition.
64
August 4, 2021 Analytics Office
E Definitions
Included by reference are all definitions included in the glossary of Form PF.
Aggregate Exposure A dollar value for long and short positions as of the last day in eachmonth of the reporting period, by sub-asset class, including all exposurewhether held physically, synthetically or through derivatives. Includesclosed out and OTC forward positions that have not expired, as well aspositions in side-pockets.
Borrowing In Form PF, borrowings include secured borrowings, unsecured borrow-ings, as well as synthetic borrowings (e.g., total return swaps that meetthe failed sale accounting requirements).
CPC Controlled portfolio company, as defined in Form PF.
Gross Notional Exposure (GNE) The gross nominal or notional value of all transactions that have beenentered into but not yet settled as of the data reporting date. Forcontracts with variable nominal or notional principal amounts, the basisfor reporting is the nominal or notional principal amounts as of the datareporting date.
Hedge Fund Any private fund (other than a securitized asset fund): (a) with respectto which one or more investment advisers (or related persons of invest-ment advisers) may be paid a performance fee or allocation calculatedby taking into account unrealized gains (other than a fee or allocationthe calculation of which may take into account unrealized gains solelyfor the purpose of reducing such fee or allocation to reflect net unre-alized losses); (b) that may borrow an amount in excess of one-half ofits net asset value (including any committed capital) or may have grossnotional exposure in excess of twice its net asset value (including anycommitted capital); or (c) that may sell securities or other assets shortor enter into similar transactions (other than for the purpose of hedg-ing currency exposure or managing duration). The definition of a hedgefund for Form PF purposes also includes any commodity pool an adviserreports on Form PF.
IRDs Interest rate derivatives, including foreign exchange derivatives used foreither investment or hedging.
Large Hedge Fund Adviser An adviser that has at least $1.5 billion in hedge fund assets undermanagement.
65
August 4, 2021 Analytics Office
Large Liquidity Fund Adviser An adviser that has at least $1 billion in combined liquidity fund andmoney market fund assets under management.
Large Private Equity Fund Adviser An adviser that has at least a $2 billion in private equity fund assetsunder management.
Parallel Managed Account An account advised by an adviser that pursues substantially the sameinvestment objective and strategy and invests side by side in substan-tially the same positions as the reporting fund.
Qualifying Hedge Fund A hedge fund advised by a Large Hedge Fund Adviser that has a net assetvalue (individually or in combination with any feeder funds, parallelfunds, and/or dependent parallel managed accounts) of at least $500million as of the last day of any month in the fiscal quarter immediatelypreceding the adviser’s most recently completed fiscal quarter.
Section 3 Liquidity Fund A liquidity fund advised by a Large Liquidity Fund Adviser.
Section 4 Private Equity Fund A private equity fund advised by a Large Private Equity Fund Adviser.
Value For derivatives (other than options), “value” means gross notional value;for options, “value” means delta adjusted notional value; for all otherinvestments and for all borrowings where the reporting fund is the credi-tor, “value” means market value or, where there is not a readily availablemarket value, fair value; for borrowings where the reporting fund is thedebtor, “value” means the value you report internally and to currentand prospective investors.
66