Embed Size (px)
Citation preview

Private Equity investment opportunities in a challenging environment: Partners Group strategies 2012
9. Deutsche Investorenkonferenz │ Frankfurt am Main │ 20 March 2012
Risk factors & suitability considerations
This information contained herein is for discussion purposes only and highly confidential and is being provided to you at your request and isnot an offer to sell or solicit an offer to buy an interest in a fund. It is not intended that it be relied on to make any investment decision.The information is not to be published, reproduced and redistributed in any form by recipients without the prior consent of Partners Group.Each person accepting this presentation thereby agrees to return it promptly upon request. A private offering of interests in a fund will onlybe made pursuant to a confidential private placement memorandum (the “PPM”) and the fund’s subscription documents, which will befurnished to a limited number of qualified investors on a confidential basis at their request in connection with such offering. Theinformation contained herein will be superseded by, and is qualified in its entirety by reference to, the PPM, which contains informationabout the investment objective, terms and conditions of an investment in a fund and also contains tax information and risk disclosures thatare important to any investment decision regarding a fund. The information contained herein was prepared without regard to the specificobjectives, financial situation or needs of any particular investor who may receive it. An investment is not a deposit and is not insured bythe federal deposit insurance corporation or any other government agency or by Partners Group AG or any of its affiliates.
Investments in any Partners Group funds are speculative and will involve significant risks, including loss of the entire investment and lackof transparency. Before deciding to invest in a fund, prospective investors should pay particular attention to the risk factors contained inthe PPM. Investors should have the financial ability and willingness to accept the risks inherent in a fund’s investment.
Certain significant risks include, but are not limited to the following risks: lack of operating history; economic, political and legal risks;currency risk; leverage risk of borrowing by a fund; auditing and financial reporting; possible lack of diversification; control issues; financialmarket fluctuations; illiquid investments; mezzanine investments; real estate; hedging risk and adjustment of the relative value weights bythe general partner.
In the event an investor in a fund defaults on its obligation, a fund might be unable to pay its funding obligations to one or more of theinvestment funds and thus be deemed to be in default. In such an event a fund, and therefore all investors in a fund (including those not indefault), could become subject to consequences that may result in significant penalties that could materially adversely affect the returns toinvestors.
Purchasers of interests in a fund will not be limited partners in, or have any other direct interest in, or have any voting rights in any of afunds’ investments. A fund’s investments, or institutions related to a fund’s investment, may have other business relationships with thegeneral partner or its affiliates.
2Important notice
▫
Risk factors & suitability considerations
Investors will not have an opportunity to evaluate specific assets prior to a fund making an investment. Partners Group, in the course ofestablishing and managing the fund has obtained and may in the future obtain certain confidential information relating to the underlyingfunds and their respective portfolio companies that has not been and will not be disclosed. Because of the specialized nature of the funds,an investment in a fund may not be suitable for certain investors and, in any event, an investment in a fund should constitute only alimited part of an investor’s total portfolio.
Partners Group and its affiliates do not provide tax advice. Nevertheless, to ensure compliance with requirements imposed by the IRS, weinform you that, unless specifically indicated otherwise, any US federal tax advice contained in this communication (including anyattachments) is not intended or written to be used, and cannot be used, for the purpose of (i) avoiding penalties under the InternalRevenue Code or (ii) promoting, marketing or recommending to another party any transaction or matter addressed herein.
Certain information contained herein has been obtained from sources Partners Group believes to be reliable. All information may not beupdated or otherwise revised to reflect information that subsequently becomes available. Any forecasts provided herein are based uponPartners Group’s opinion of the market and are subject to change at any time.
Investors should bear in mind that past performance is not indicative of future results. There can be no assurance that any fund willsuccessfully carry out their respective programs and a fund may be a newly formed entity with no significant operating history upon whichto evaluate a fund’s likely performance. Certain information contained herein constitutes forward-looking statements. Due to various risksand uncertainties, actual events or results or actual performance of a fund may differ materially from those reflected or contemplated insuch forward-looking statements. As a result, investors should not rely on such forward-looking statements in making their investmentdecisions.
Unless registration is otherwise required by law, the offering and sale of private placement funds will be exempt from registration in mostjurisdictions. Consequently, funds may not be offered, directly or indirectly, to the public in local jurisdictions. The funds might be classifiedin Guernsey and/or in Luxembourg as a qualifying investor offering and as such are suitable only for those investors who satisfy thedefinition of a qualified investor as defined by the Guernsey Financial Services Commission and/or by the applicable laws and regulations inLuxembourg, respectively. There might be also restrictions with respect to the distribution of the funds in certain jurisdictions.
3Important notice
▫
ZugNew York
LondonGuernsey
Sydney
Luxembourg
San Francisco
Singapore
Beijing
TokyoDubai
São Paulo
SeoulMunichParis
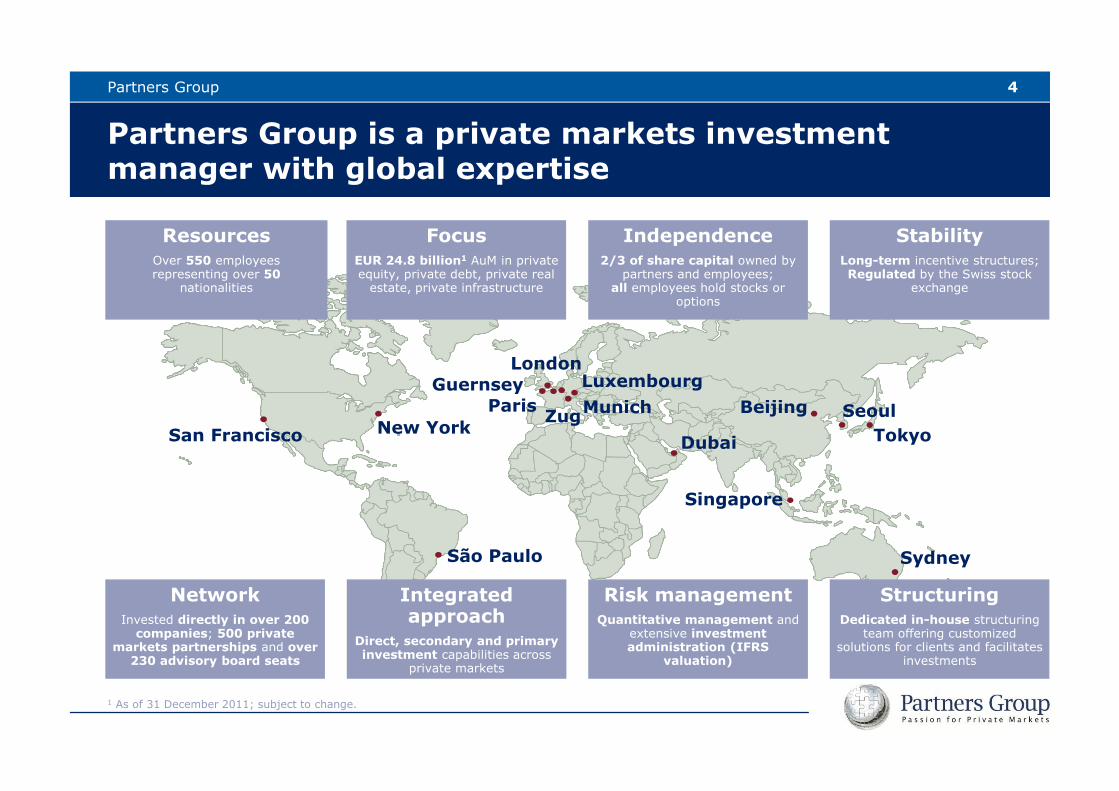
Partners Group is a private markets investment manager with global expertise
4
Integrated approach
Direct, secondary and primary investment capabilities across
private markets
NetworkInvested directly in over 200 companies; 500 private
markets partnerships and over230 advisory board seats
Independence2/3 of share capital owned by
partners and employees;all employees hold stocks or
options
FocusEUR 24.8 billion1 AuM in private equity, private debt, private real
estate, private infrastructure
StabilityLong-term incentive structures;Regulated by the Swiss stock
exchange
StructuringDedicated in-house structuring
team offering customized solutions for clients and facilitates
investments
Risk managementQuantitative management and
extensive investment administration (IFRS
valuation)
Partners Group
1 As of 31 December 2011; subject to change.
ResourcesOver 550 employeesrepresenting over 50
nationalities
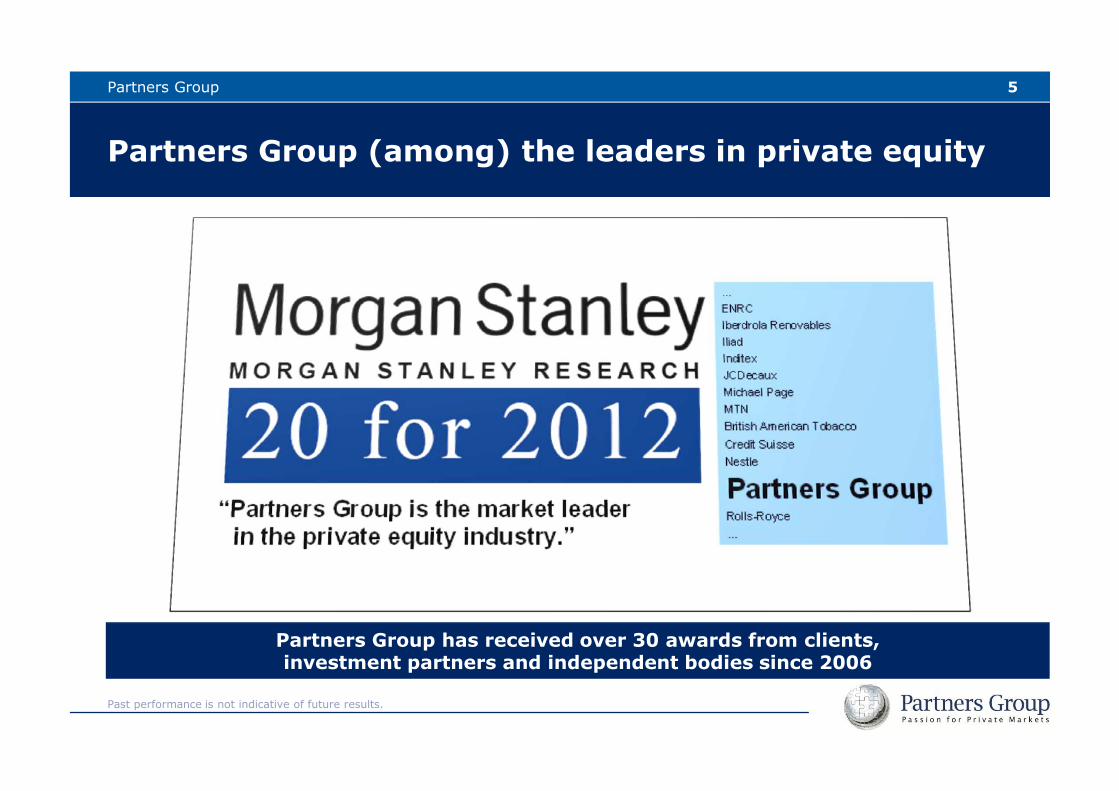
Partners Group (among) the leaders in private equity
Partners Group has received over 30 awards from clients,investment partners and independent bodies since 2006
5Partners Group
Past performance is not indicative of future results.
Content
III. Partners Group Strategies 2012
II. Private Equity Markets Update
I. Economic Outlook
69. Deutsche Investorenkonferenz - FINANCE
IV. “A final word”
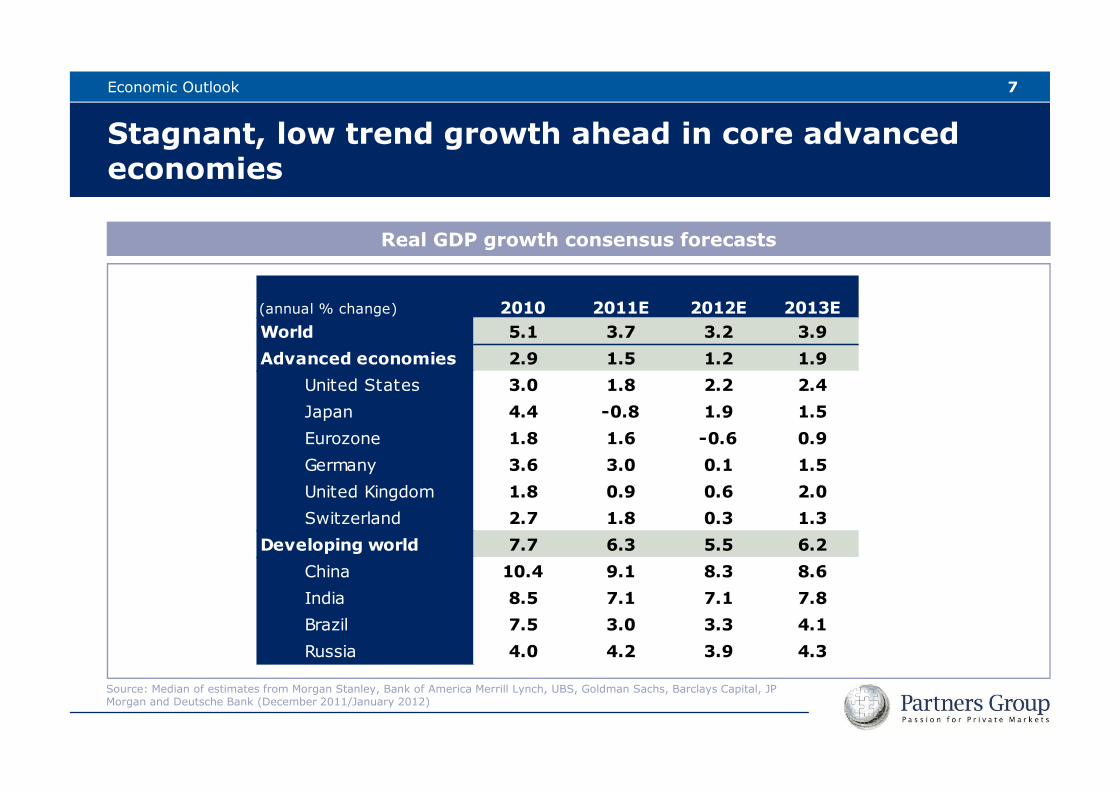
(annual % change) 2010 2011E 2012E 2013E
World 5.1 3.7 3.2 3.9
Advanced economies 2.9 1.5 1.2 1.9
United States 3.0 1.8 2.2 2.4
Japan 4.4 -0.8 1.9 1.5
Eurozone 1.8 1.6 -0.6 0.9
Germany 3.6 3.0 0.1 1.5
United Kingdom 1.8 0.9 0.6 2.0
Switzerland 2.7 1.8 0.3 1.3
Developing world 7.7 6.3 5.5 6.2
China 10.4 9.1 8.3 8.6
India 8.5 7.1 7.1 7.8
Brazil 7.5 3.0 3.3 4.1
Russia 4.0 4.2 3.9 4.3
Stagnant, low trend growth ahead in core advanced economies
Real GDP growth consensus forecasts
Source: Median of estimates from Morgan Stanley, Bank of America Merrill Lynch, UBS, Goldman Sachs, Barclays Capital, JP Morgan and Deutsche Bank (December 2011/January 2012)
7Economic Outlook
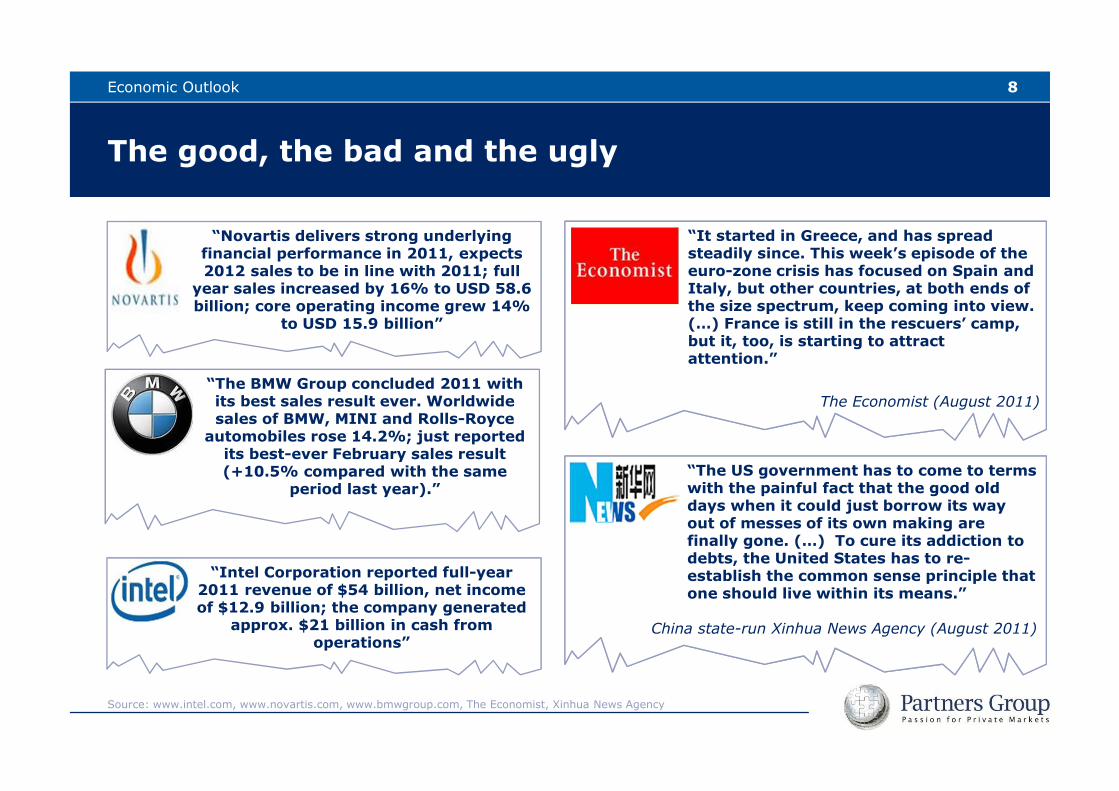
The good, the bad and the ugly
“Novartis delivers strong underlying financial performance in 2011, expects 2012 sales to be in line with 2011; full
year sales increased by 16% to USD 58.6 billion; core operating income grew 14%
to USD 15.9 billion”
“Intel Corporation reported full-year 2011 revenue of $54 billion, net income of $12.9 billion; the company generated
approx. $21 billion in cash from operations”
Economic Outlook
“The US government has to come to terms with the painful fact that the good old days when it could just borrow its way out of messes of its own making are finally gone. (…) To cure its addiction to debts, the United States has to re-establish the common sense principle that one should live within its means.”
China state-run Xinhua News Agency (August 2011)
“It started in Greece, and has spread steadily since. This week’s episode of the euro-zone crisis has focused on Spain and Italy, but other countries, at both ends of the size spectrum, keep coming into view. (…) France is still in the rescuers’ camp, but it, too, is starting to attract attention.”
The Economist (August 2011) “The BMW Group concluded 2011 with its best sales result ever. Worldwide sales of BMW, MINI and Rolls-Royce
automobiles rose 14.2%; just reported its best-ever February sales result(+10.5% compared with the same
period last year).”
Source: www.intel.com, www.novartis.com, www.bmwgroup.com, The Economist, Xinhua News Agency
8
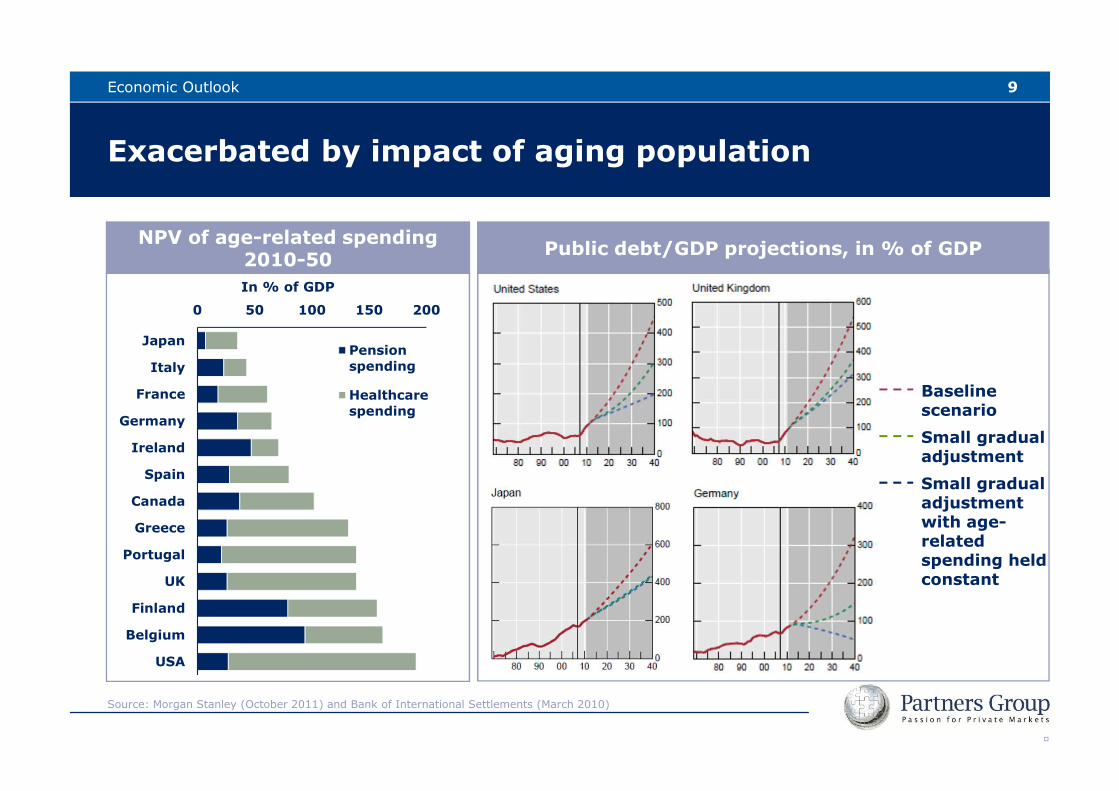
Exacerbated by impact of aging population
Public debt/GDP projections, in % of GDP
Baseline scenario
Small gradual adjustment
Small gradual adjustment with age-related spending held constant
▫
Source: Morgan Stanley (October 2011) and Bank of International Settlements (March 2010)
9
NPV of age-related spending2010-50
In % of GDP
0 50 100 150 200
Japan
Italy
France
Germany
Ireland
Spain
Canada
Greece
Portugal
UK
Finland
Belgium
USA
Pensionspending
Healthcarespending
Economic Outlook
The known unknown: how will governments de-lever?
Economic Outlook 10
-1
1
3
5
2000 2002 2004 2006 2008 2010 2012
HeadlineCPI
ECBtargetrate
-3
-1
1
3
5
7
2000 2002 2004 2006 2008 2010 2012
Retailpriceindex
BoEtargetrate
-3
-1
1
3
5
7
2000 2002 2004 2006 2008 2010 2012
HeadlineCPI
Fedtargetrate
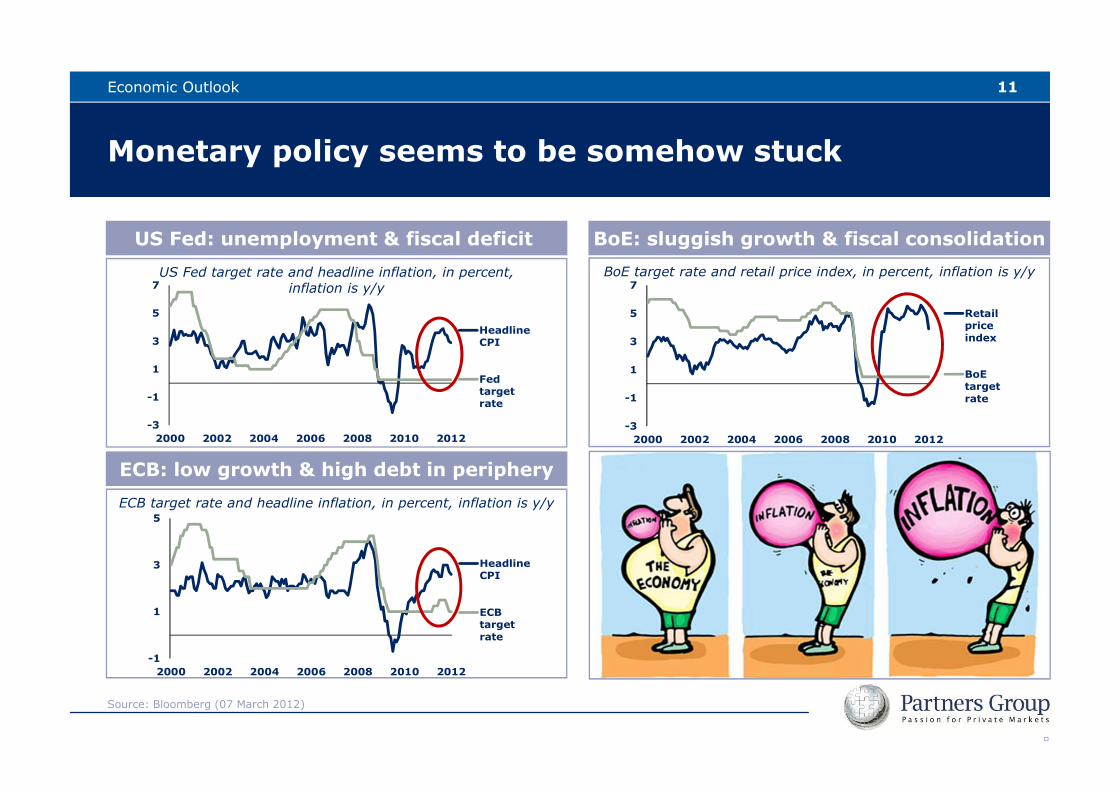
Monetary policy seems to be somehow stuck
Economic Outlook
US Fed: unemployment & fiscal deficit BoE: sluggish growth & fiscal consolidation
ECB: low growth & high debt in periphery
US Fed target rate and headline inflation, in percent, inflation is y/y
ECB target rate and headline inflation, in percent, inflation is y/y
BoE target rate and retail price index, in percent, inflation is y/y
▫
11
Source: Bloomberg (07 March 2012)
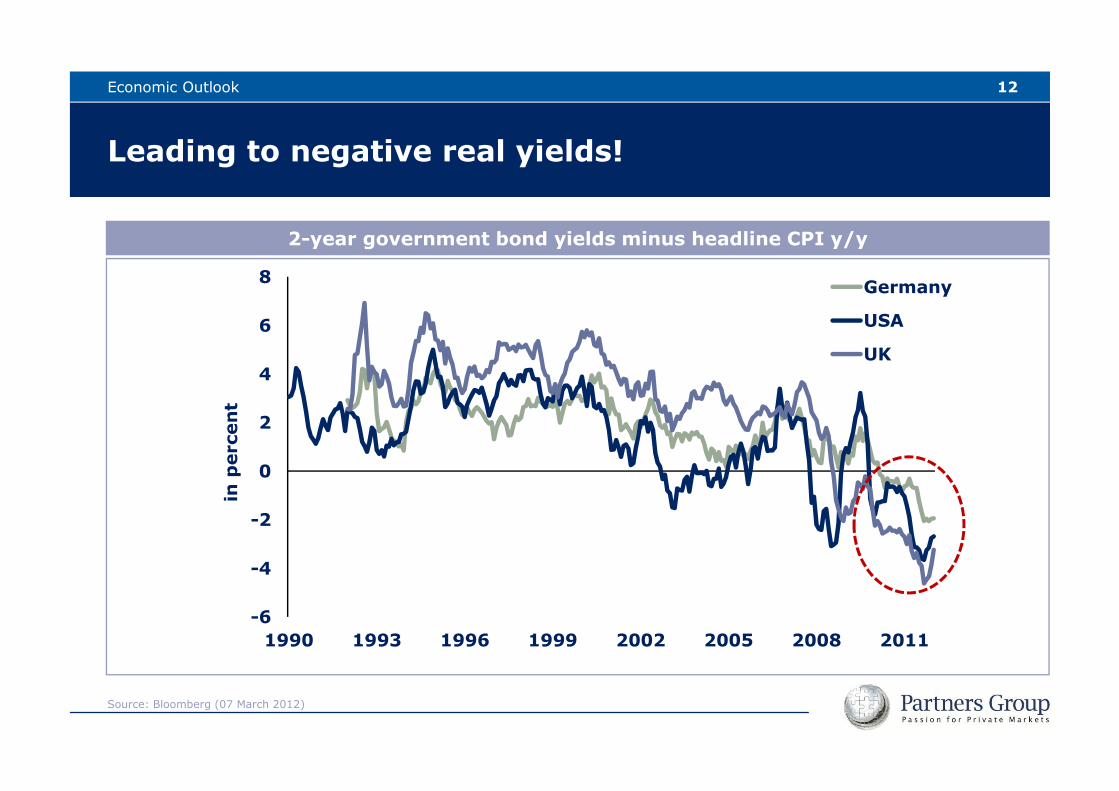
2-year government bond yields minus headline CPI y/y
-6
-4
-2
0
2
4
6
8
1990 1993 1996 1999 2002 2005 2008 2011
in percent
Germany
USA
UK
Leading to negative real yields!
Economic Outlook 12
Source: Bloomberg (07 March 2012)
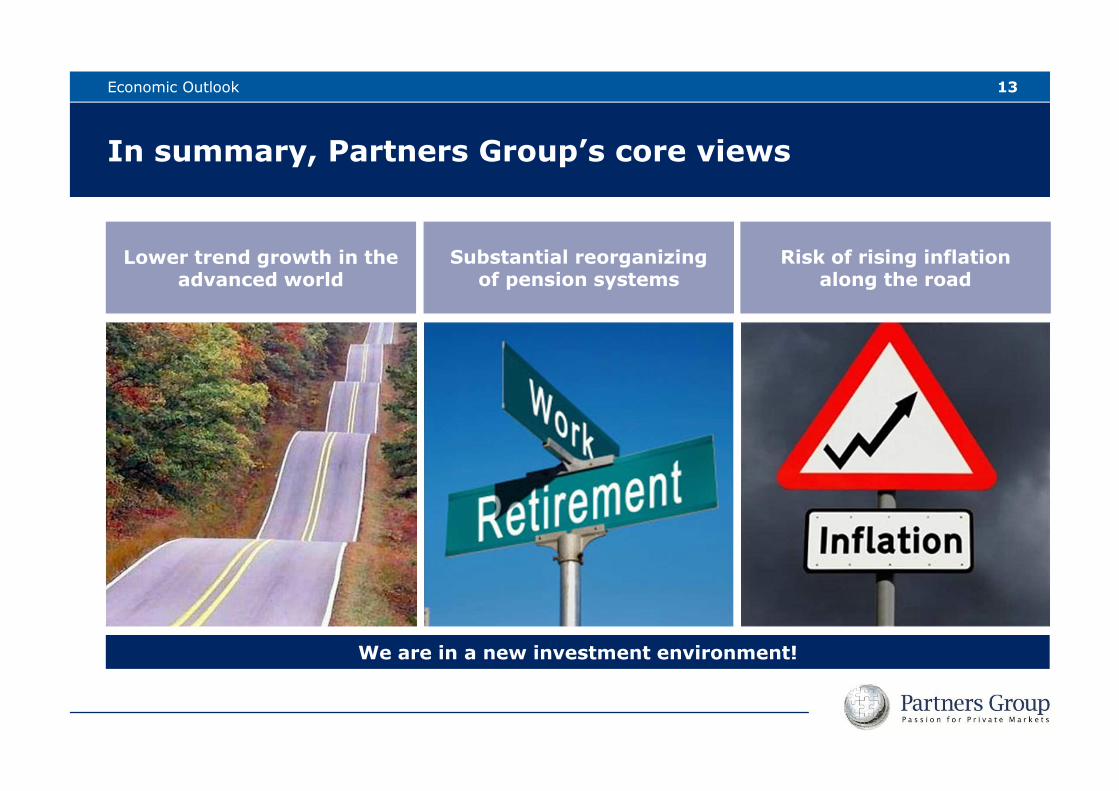
Substantial reorganizing of pension systems
In summary, Partners Group’s core views
13
We are in a new investment environment!
Lower trend growth in the advanced world
Economic Outlook
Risk of rising inflation along the road
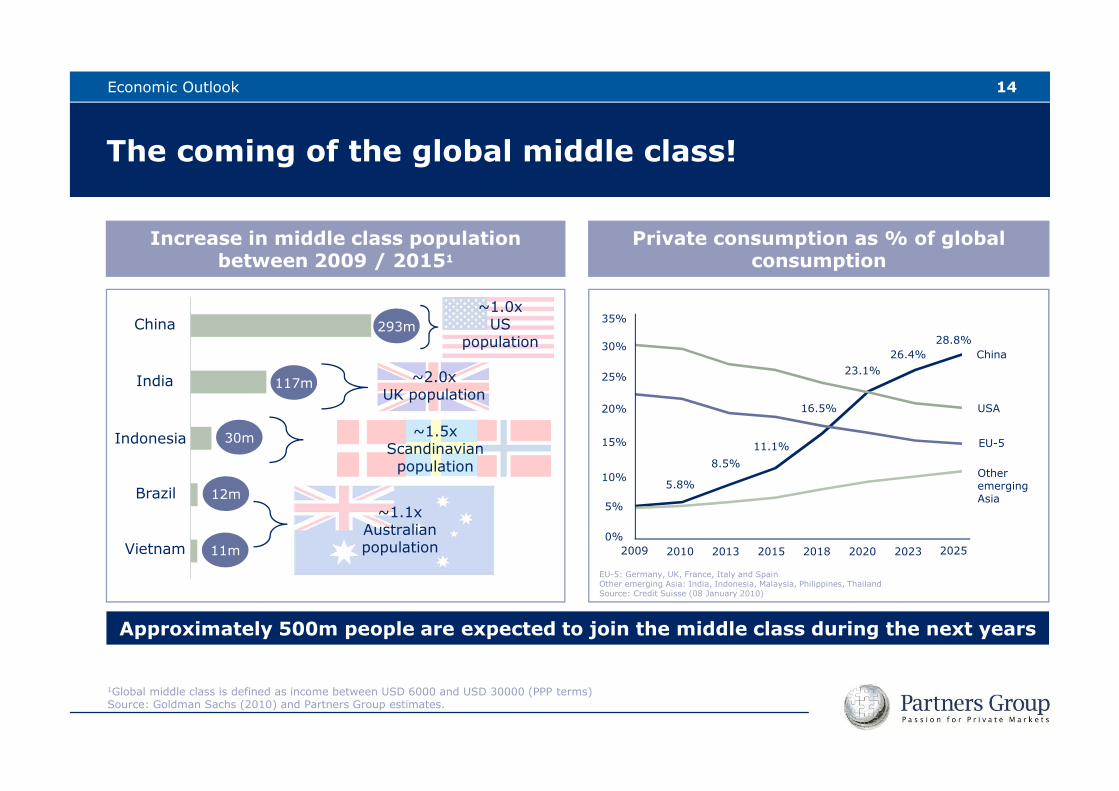
Approximately 500m people are expected to join the middle class during the next years
The coming of the global middle class!
14
Increase in middle class population between 2009 / 20151
China
India
Indonesia
Brazil
Vietnam
293m~1.0x
US population
~2.0xUK population
117m
30m
12m
11m
~1.1xAustralian population
~1.5xScandinavianpopulation
Economic Outlook
Private consumption as % of global consumption
EU-5: Germany, UK, France, Italy and SpainOther emerging Asia: India, Indonesia, Malaysia, Philippines, ThailandSource: Credit Suisse (08 January 2010)
15%
10%
5%
0%
20%
35%
25%
30%
2009 2010 2013 2015 2018 2020 2023 2025
China
USA
EU-5
Other emerging Asia
5.8%
8.5%
11.1%
16.5%
23.1%26.4%
28.8%
1Global middle class is defined as income between USD 6000 and USD 30000 (PPP terms)Source: Goldman Sachs (2010) and Partners Group estimates.

15
China: From the “Factory of the World” …
Source: Google Images
Manufacturing moving from “low end” towards more “value added” products
Economic Outlook
16
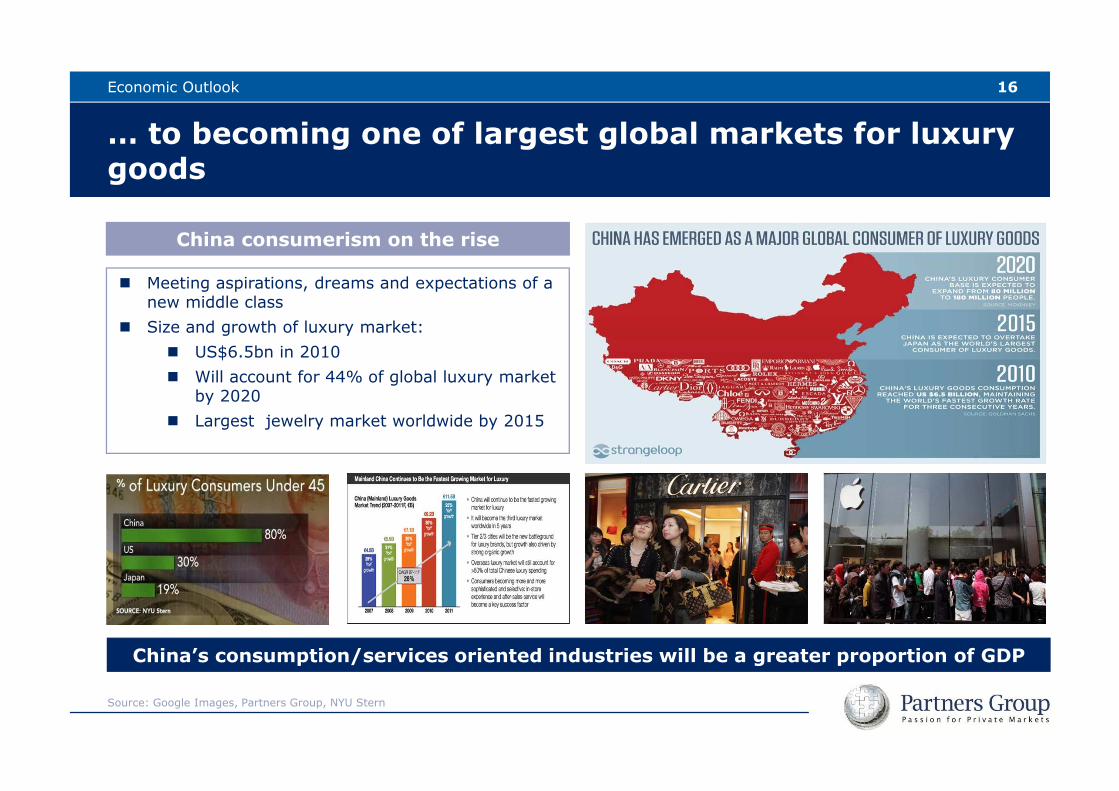
… to becoming one of largest global markets for luxury goods
China consumerism on the rise
Source: Google Images, Partners Group, NYU Stern
� Meeting aspirations, dreams and expectations of a new middle class
� Size and growth of luxury market:� US$6.5bn in 2010� Will account for 44% of global luxury market
by 2020� Largest jewelry market worldwide by 2015
China’s consumption/services oriented industries will be a greater proportion of GDP
Economic Outlook
Content
III. Partners Group Strategies 2012
II. Private Equity Markets Update
I. Economic Outlook
179. Deutsche Investorenkonferenz - FINANCE
IV. “A final word”
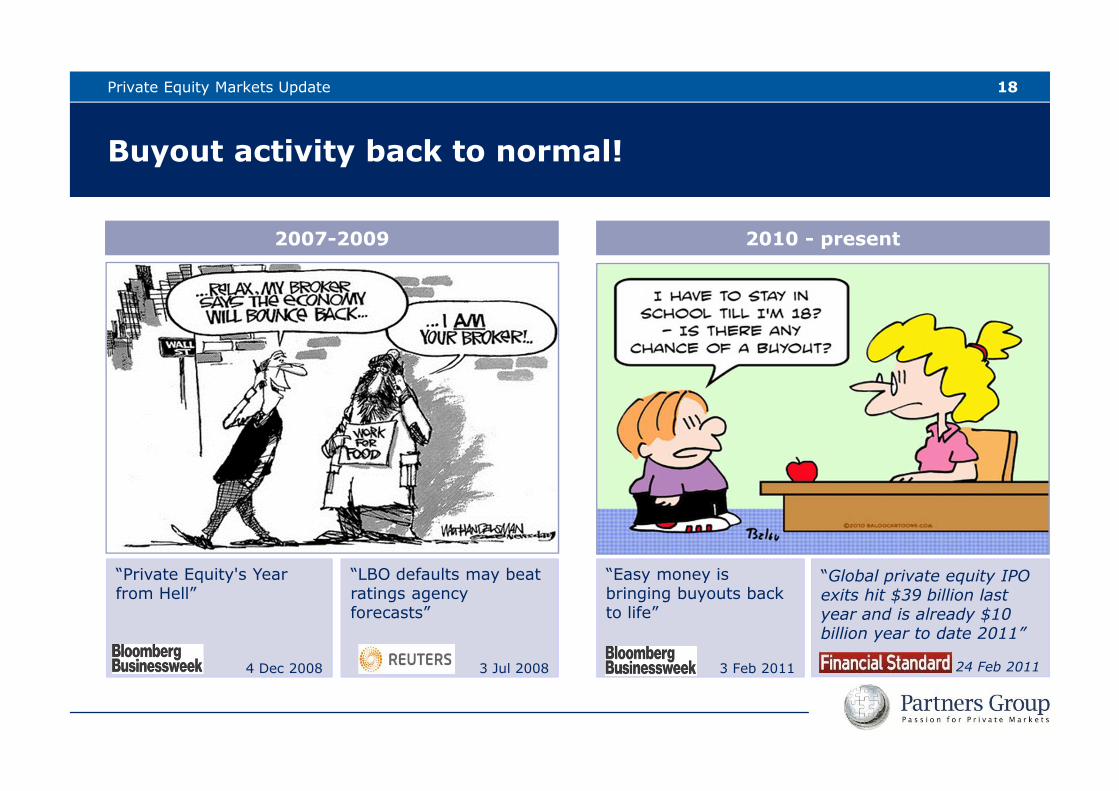
“Private Equity's Year from Hell”
4 Dec 2008
Buyout activity back to normal!
2007-2009 2010 - present
“LBO defaults may beat ratings agency forecasts”
3 Jul 2008
“Easy money is bringing buyouts back to life”
3 Feb 2011
“Global private equity IPO exits hit $39 billion last year and is already $10 billion year to date 2011”
24 Feb 2011
Private Equity Markets Update 18
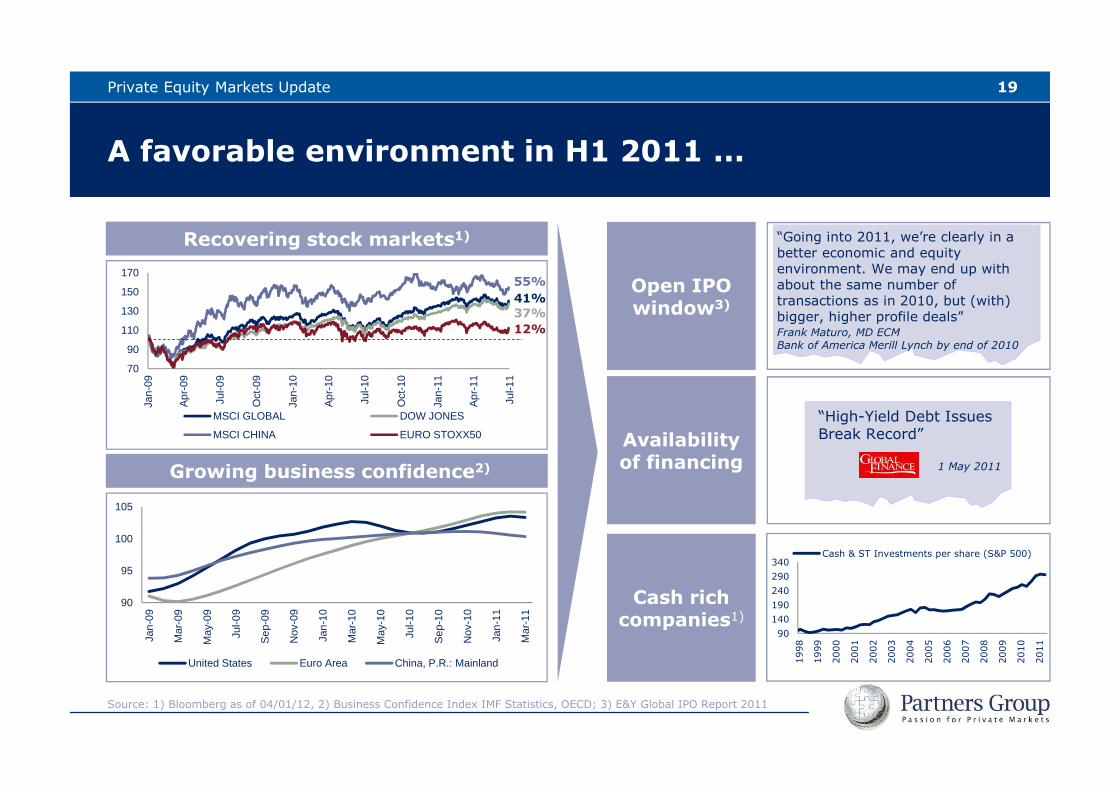
A favorable environment in H1 2011 ...
Recovering stock markets1)
Growing business confidence2)
19Private Equity Markets Update
Open IPO window3)
Cash rich companies1)
Availability of financing
70
90
110
130
150
170
Jan-
09
Apr
-09
Jul-0
9
Oct
-09
Jan-
10
Apr
-10
Jul-1
0
Oct
-10
Jan-
11
Apr
-11
Jul-1
1
MSCI GLOBAL DOW JONES
MSCI CHINA EURO STOXX50
90
95
100
105
Jan-
09
Mar
-09
May
-09
Jul-0
9
Sep
-09
Nov
-09
Jan-
10
Mar
-10
May
-10
Jul-1
0
Sep
-10
Nov
-10
Jan-
11
Mar
-11
United States Euro Area China, P.R.: Mainland
“Going into 2011, we’re clearly in a better economic and equity environment. We may end up with about the same number of transactions as in 2010, but (with) bigger, higher profile deals”Frank Maturo, MD ECM Bank of America Merill Lynch by end of 2010
“High-Yield Debt Issues Break Record”
1 May 2011
90140190240290340
1998
1999
2000
2001
2002
2003
2004
2005
2006
2007
2008
2009
2010
2011
Cash & ST Investments per share (S&P 500)
41%37%
55%
12%
Source: 1) Bloomberg as of 04/01/12, 2) Business Confidence Index IMF Statistics, OECD; 3) E&Y Global IPO Report 2011
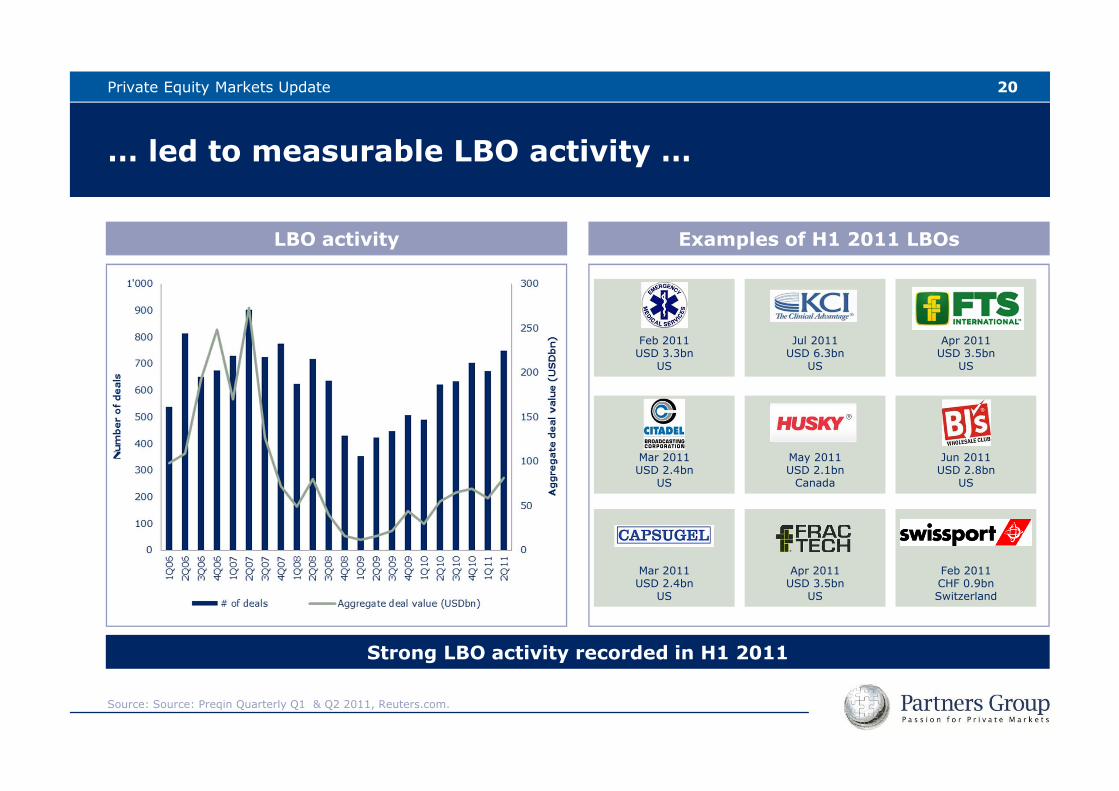
… led to measurable LBO activity …
LBO activity Examples of H1 2011 LBOs
Strong LBO activity recorded in H1 2011
20Private Equity Markets Update
Feb 2011USD 3.3bn
US
Jul 2011USD 6.3bn
US
May 2011USD 2.1bn
Canada
Mar 2011USD 2.4bn
US
Mar 2011USD 2.4bn
US
Apr 2011USD 3.5bn
US
Apr 2011USD 3.5bn
US
Jun 2011USD 2.8bn
US
Feb 2011CHF 0.9bnSwitzerland
Source: Source: Preqin Quarterly Q1 & Q2 2011, Reuters.com.
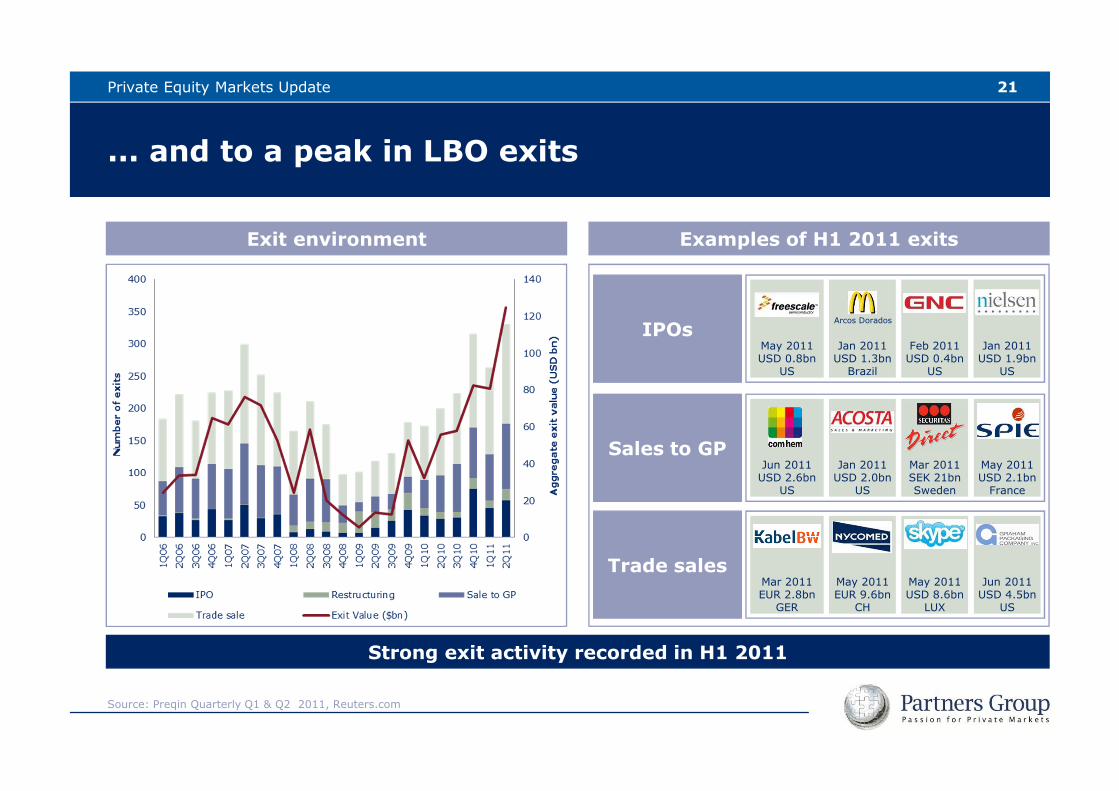
... and to a peak in LBO exits
Exit environment Examples of H1 2011 exits
Strong exit activity recorded in H1 2011
21Private Equity Markets Update
IPOs
Trade sales
Sales to GPJun 2011
USD 2.6bnUS
Jan 2011USD 2.0bn
US
Mar 2011SEK 21bnSweden
May 2011USD 2.1bn
France
May 2011USD 0.8bn
US
Jan 2011USD 1.3bn
Brazil
Arcos Dorados
Jan 2011USD 1.9bn
US
Feb 2011USD 0.4bn
US
Mar 2011EUR 2.8bn
GER
May 2011EUR 9.6bn
CH
May 2011USD 8.6bn
LUX
Jun 2011USD 4.5bn
US
Source: Preqin Quarterly Q1 & Q2 2011, Reuters.com
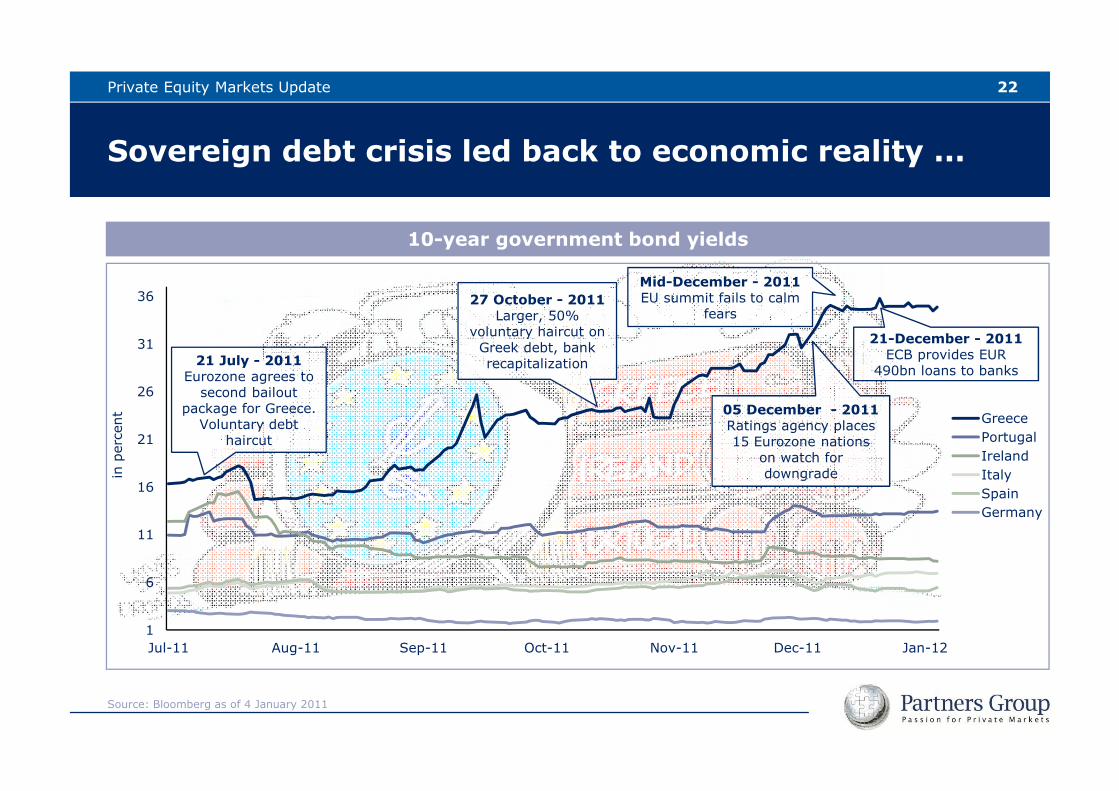
Sovereign debt crisis led back to economic reality ...
10-year government bond yields
22Private Equity Markets Update
1
6
11
16
21
26
31
36
Jul-11 Aug-11 Sep-11 Oct-11 Nov-11 Dec-11 Jan-12
in p
erce
nt Greece
PortugalIrelandItalySpainGermany
27 October - 2011Larger, 50%
voluntary haircut on Greek debt, bank recapitalization21 July - 2011
Eurozone agrees to second bailout
package for Greece. Voluntary debt
haircut
05 December - 2011Ratings agency places 15 Eurozone nations
on watch for downgrade
Mid-December - 2011EU summit fails to calm
fears
Source: Bloomberg as of 4 January 2011
21-December - 2011ECB provides EUR
490bn loans to banks
23
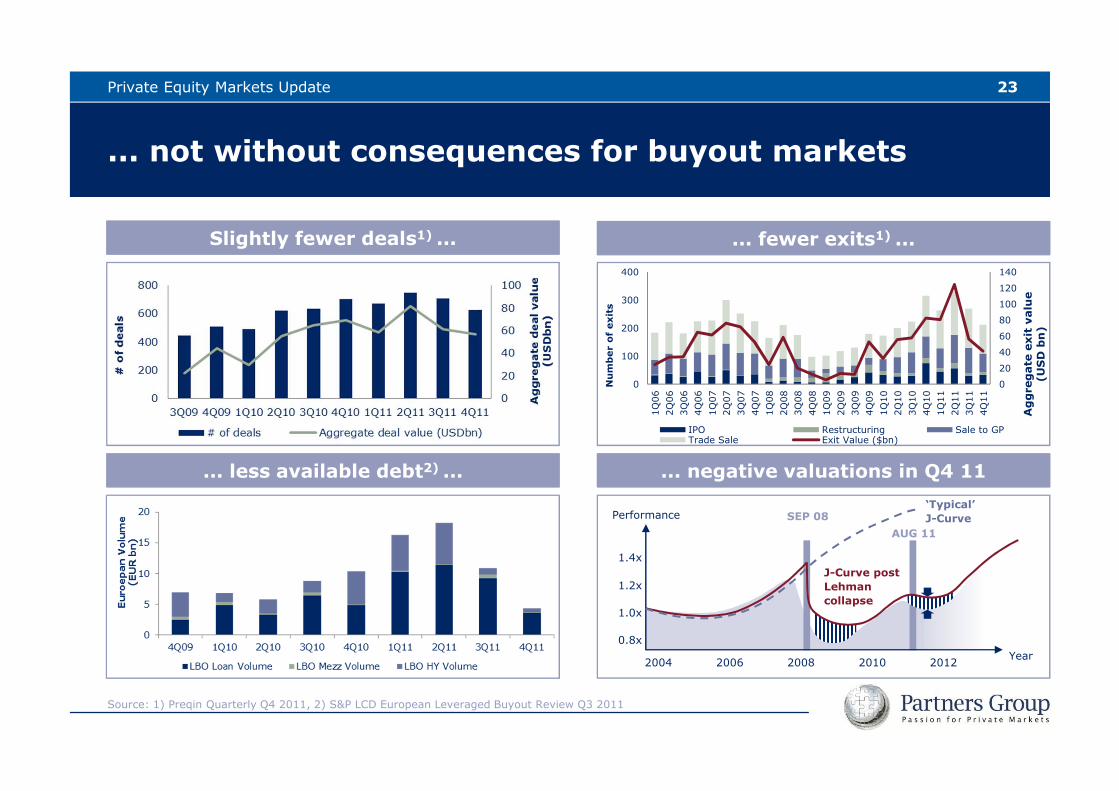
... not without consequences for buyout markets
... fewer exits1) ...
... less available debt2) ... ... negative valuations in Q4 11
Slightly fewer deals1) ...
Private Equity Markets Update
Source: 1) Preqin Quarterly Q4 2011, 2) S&P LCD European Leveraged Buyout Review Q3 2011
0
20
40
60
80
100
120
140
0
100
200
300
400
1Q
06
2Q
06
3Q
06
4Q
06
1Q
07
2Q
07
3Q
07
4Q
07
1Q
08
2Q
08
3Q
08
4Q
08
1Q
09
2Q
09
3Q
09
4Q
09
1Q
10
2Q
10
3Q
10
4Q
10
1Q
11
2Q
11
3Q
11
4Q
11
Aggregate exit value
(USD bn)
Number of exits
IPO Restructuring Sale to GPTrade Sale Exit Value ($bn)
AUG 11
Performance‘Typical’
J-Curve
2004 2006 2008 2010
0.8x
1.0x
1.2x
1.4x
SEP 08
J-Curve post
Lehman
collapse
2012 Year
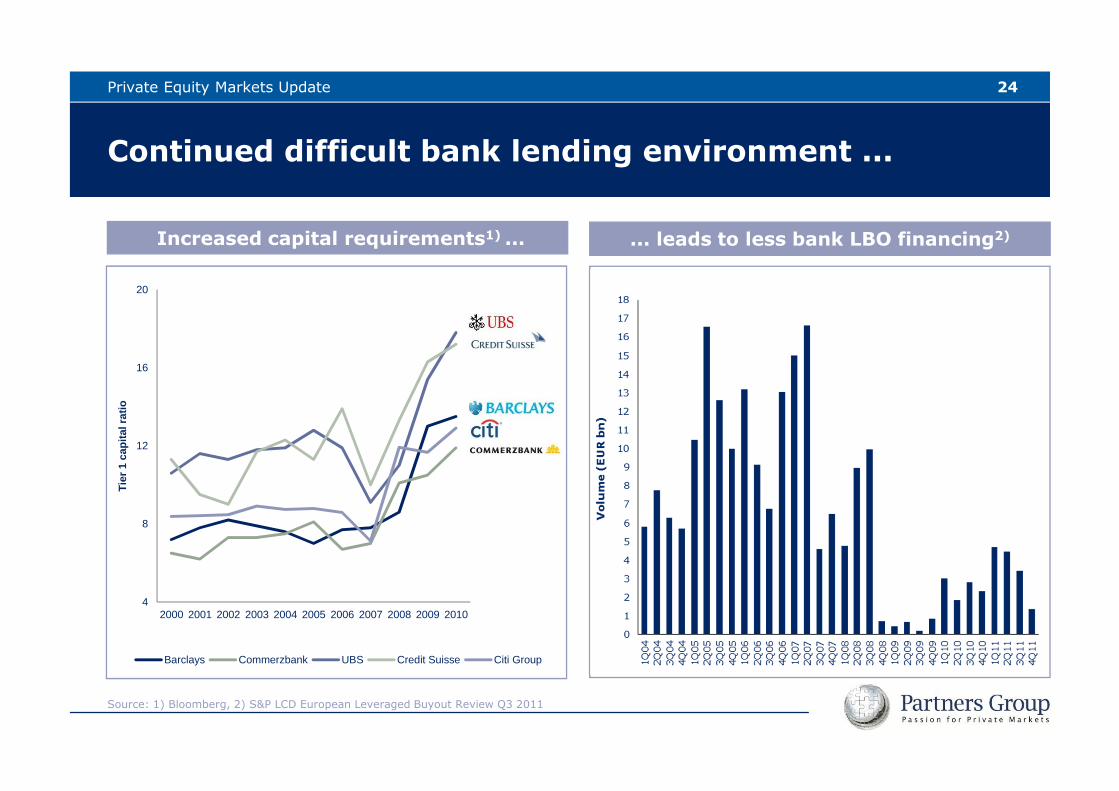
Continued difficult bank lending environment ...
24Private Equity Markets Update
... leads to less bank LBO financing2)Increased capital requirements1) ...
Source: 1) Bloomberg, 2) S&P LCD European Leveraged Buyout Review Q3 2011
4
8
12
16
20
2000 2001 2002 2003 2004 2005 2006 2007 2008 2009 2010
Tie
r 1
cap
ital
rat
io
Barclays Commerzbank UBS Credit Suisse Citi Group
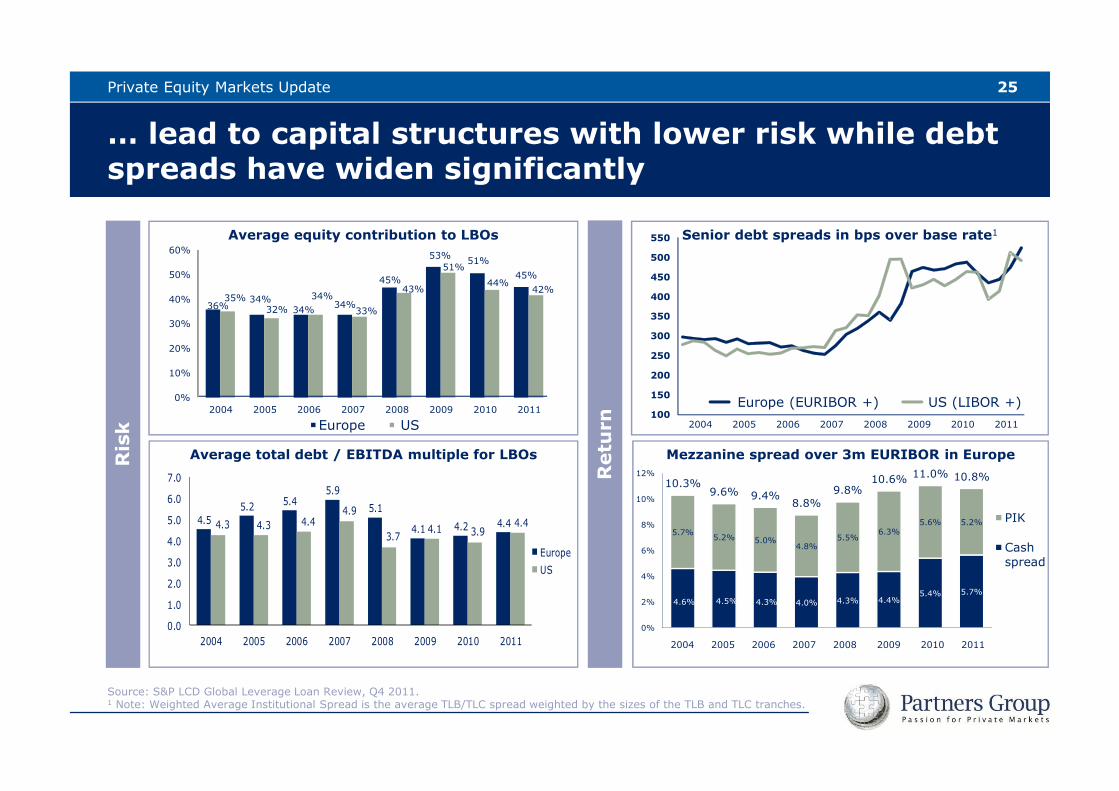
Return
Risk
… lead to capital structures with lower risk while debt spreads have widen significantly
25Private Equity Markets Update
Average equity contribution to LBOs Senior debt spreads in bps over base rate1
Source: S&P LCD Global Leverage Loan Review, Q4 2011.1 Note: Weighted Average Institutional Spread is the average TLB/TLC spread weighted by the sizes of the TLB and TLC tranches.
36%34%
34% 34%
45%
53% 51%45%
35%32%
34%
33%
43%
51%
44%42%
0%
10%
20%
30%
40%
50%
60%
2004 2005 2006 2007 2008 2009 2010 2011
Europe US100
150
200
250
300
350
400
450
500
550
2004 2005 2006 2007 2008 2009 2010 2011
Europe (EURIBOR +) US (LIBOR +)
Average total debt / EBITDA multiple for LBOs
4.6% 4.5% 4.3% 4.0% 4.3% 4.4%5.4% 5.7%
5.7%5.2% 5.0%
4.8%5.5%
6.3%5.6% 5.2%
10.3%9.6% 9.4%
8.8%9.8%
10.6% 11.0% 10.8%
0%
2%
4%
6%
8%
10%
12%
PIK
Cashspread
4.55.2 5.4
5.9
5.1
4.1 4.2 4.44.3 4.3 4.44.9
3.74.1 3.9
4.4
0.0
1.0
2.0
3.0
4.0
5.0
6.0
7.0
2004 2005 2006 2007 2008 2009 2010 2011
EuropeUS
2004 2005 2006 2007 2008 2009 2010 2011
Mezzanine spread over 3m EURIBOR in Europe
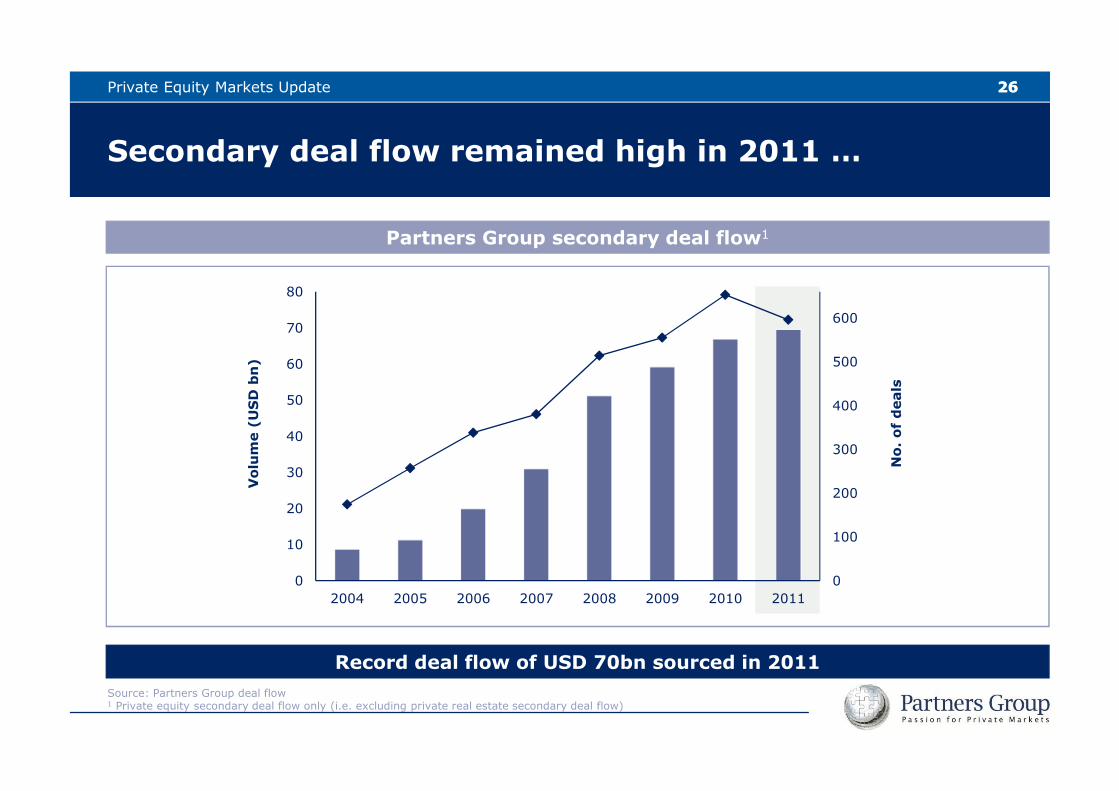
26
Secondary deal flow remained high in 2011 …
Record deal flow of USD 70bn sourced in 2011
Partners Group secondary deal flow1Volume (USD bn)
0
100
200
300
400
500
600
0
10
20
30
40
50
60
70
80
2004 2005 2006 2007 2008 2009 2010 2011
No. of deals
Source: Partners Group deal flow1 Private equity secondary deal flow only (i.e. excluding private real estate secondary deal flow)
26Private Equity Markets Update
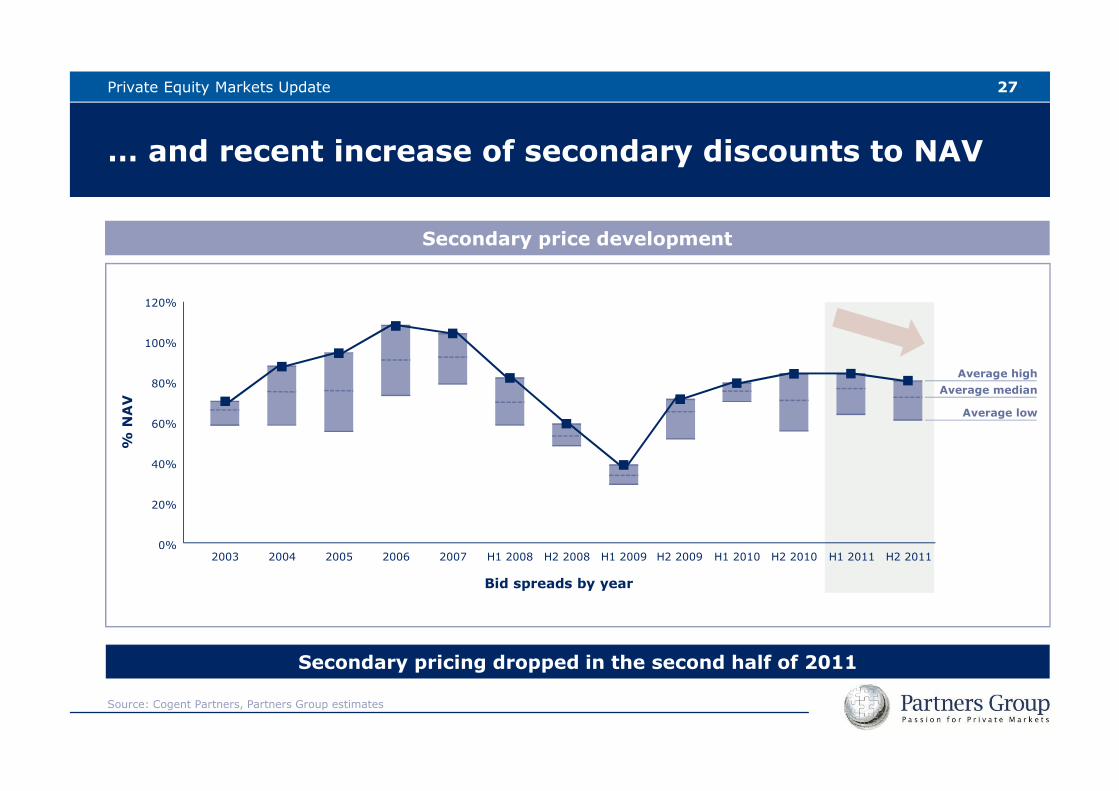
2003 2004 2005 2006 2007 H1 2008 H2 20080%
20%
40%
60%
80%
100%
120%
% NAV
Bid spreads by year
Average high
Average median
Average low
H2 2010 H1 2011 H2 2011H1 2010H1 2009 H2 2009
… and recent increase of secondary discounts to NAV
Secondary price development
Secondary pricing dropped in the second half of 2011
Source: Cogent Partners, Partners Group estimates
Private Equity Markets Update 27
Content
III. Partners Group Strategies 2012
II. Private Equity Markets Update
I. Economic Outlook
289. Deutsche Investorenkonferenz - FINANCE
IV. “A final word”
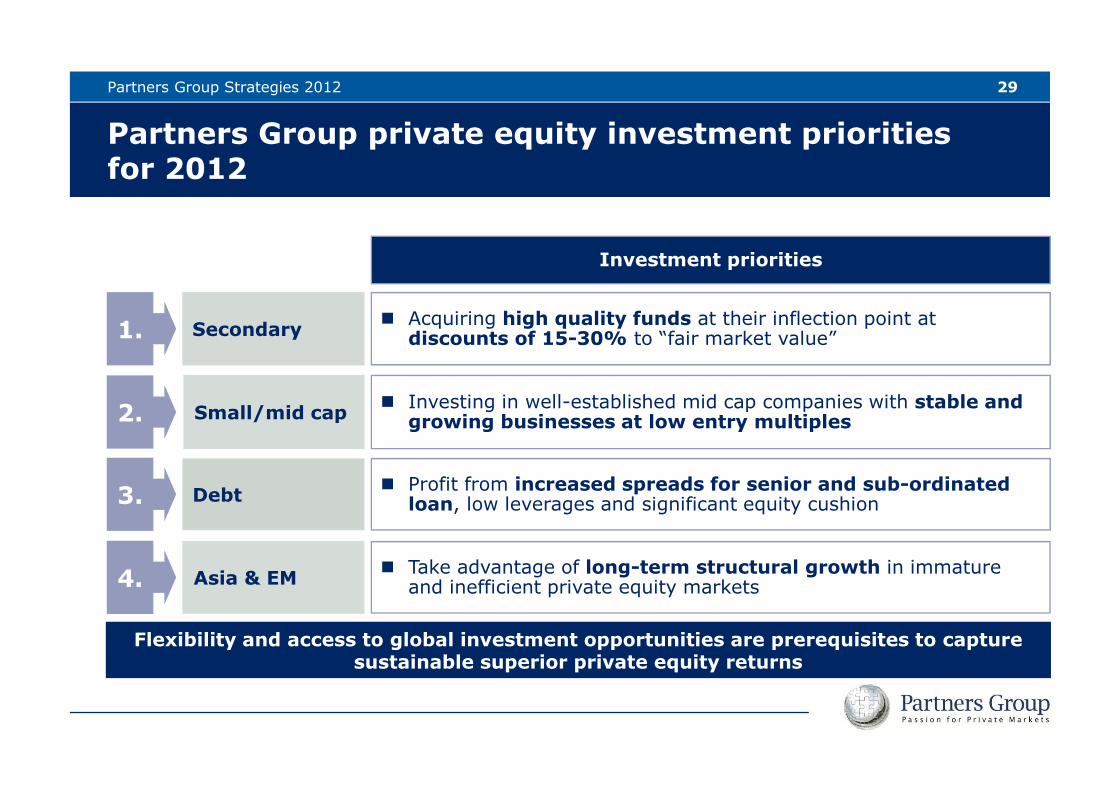
Partners Group private equity investment priorities for 2012
� Profit from increased spreads for senior and sub-ordinated loan, low leverages and significant equity cushion
� Investing in well-established mid cap companies with stable and growing businesses at low entry multiples
� Acquiring high quality funds at their inflection point at discounts of 15-30% to “fair market value”
Investment priorities
Debt
Small/mid cap
Secondary1.
2.
3.
29Partners Group Strategies 2012
Flexibility and access to global investment opportunities are prerequisites to capture sustainable superior private equity returns
� Take advantage of long-term structural growth in immature and inefficient private equity marketsAsia & EM4.
Content
III. Partners Group Strategies 2012
II. Private Equity Markets Update
I. Economic Outlook
309. Deutsche Investorenkonferenz - FINANCE
IV. “A final word”
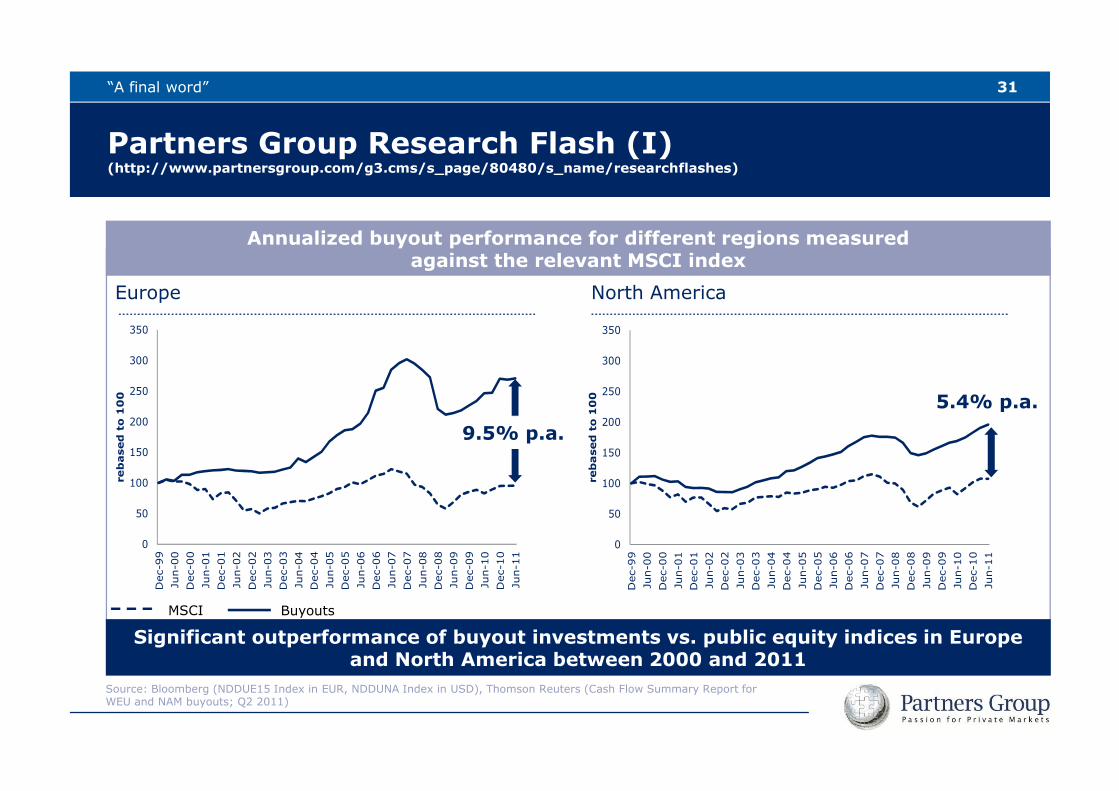
Partners Group Research Flash (I)(http://www.partnersgroup.com/g3.cms/s_page/80480/s_name/researchflashes)
31“A final word”
Europe North America
BuyoutsMSCI
0
50
100
150
200
250
300
350
Dec-
99
Jun-0
0D
ec-
00
Jun-0
1D
ec-
01
Jun-0
2D
ec-
02
Jun-0
3D
ec-
03
Jun-0
4D
ec-
04
Jun-0
5D
ec-
05
Jun-0
6D
ec-
06
Jun-0
7D
ec-
07
Jun-0
8D
ec-
08
Jun-0
9D
ec-
09
Jun-1
0D
ec-
10
Jun-1
1
rebased to 100
9.5% p.a.
0
50
100
150
200
250
300
350
Dec-
99
Jun-0
0D
ec-
00
Jun-0
1D
ec-
01
Jun-0
2D
ec-
02
Jun-0
3D
ec-
03
Jun-0
4D
ec-
04
Jun-0
5D
ec-
05
Jun-0
6D
ec-
06
Jun-0
7D
ec-
07
Jun-0
8D
ec-
08
Jun-0
9D
ec-
09
Jun-1
0D
ec-
10
Jun-1
1
rebased to 100
5.4% p.a.
Annualized buyout performance for different regions measuredagainst the relevant MSCI index
Source: Bloomberg (NDDUE15 Index in EUR, NDDUNA Index in USD), Thomson Reuters (Cash Flow Summary Report for WEU and NAM buyouts; Q2 2011)
Significant outperformance of buyout investments vs. public equity indices in Europe and North America between 2000 and 2011
9.5% p.a.
5.4% p.a.
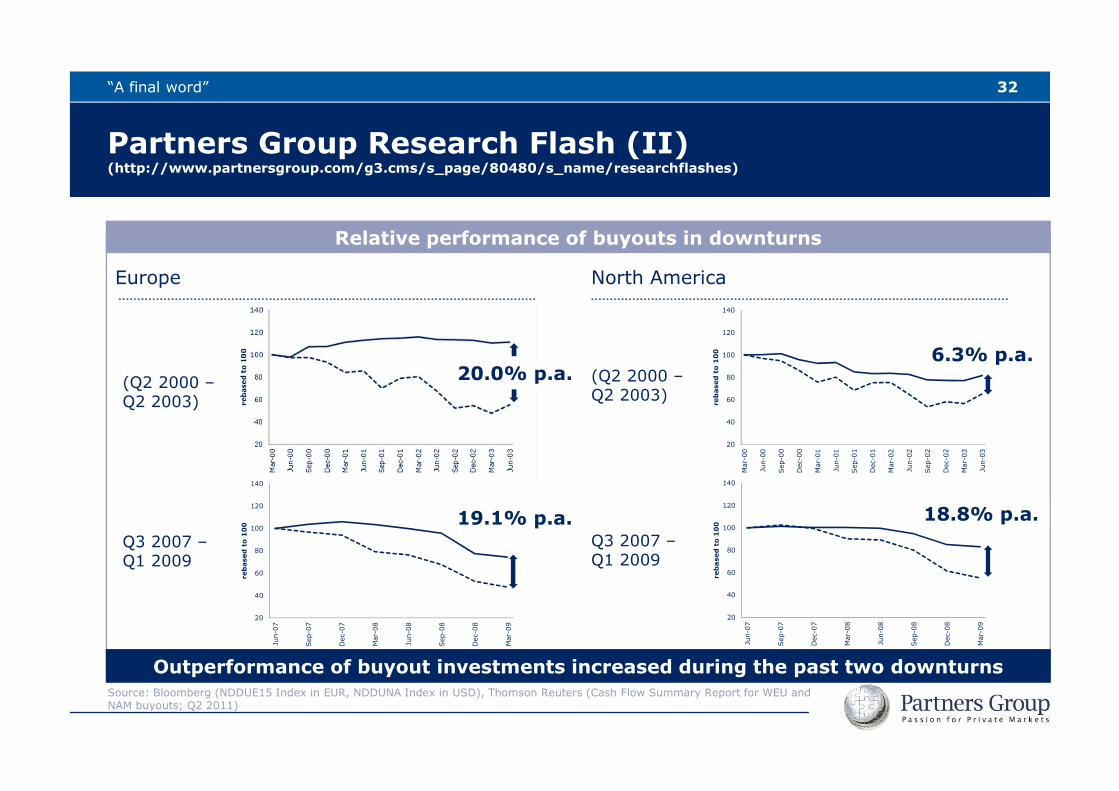
Partners Group Research Flash (II)(http://www.partnersgroup.com/g3.cms/s_page/80480/s_name/researchflashes)
32“A final word”
Europe North America
20
40
60
80
100
120
140
Mar
-00
Jun-
00
Sep
-00
Dec
-00
Mar
-01
Jun-
01
Sep
-01
Dec
-01
Mar
-02
Jun-
02
Sep
-02
Dec
-02
Mar
-03
Jun-
03
rebased to 100
6.3% p.a.
Relative performance of buyouts in downturns
Source: Bloomberg (NDDUE15 Index in EUR, NDDUNA Index in USD), Thomson Reuters (Cash Flow Summary Report for WEU and NAM buyouts; Q2 2011)
(Q2 2000 –Q2 2003)
Q3 2007 –Q1 2009
(Q2 2000 –Q2 2003)
Q3 2007 –Q1 2009
20.0% p.a.6.3% p.a.
20
40
60
80
100
120
140
Jun-
07
Sep
-07
Dec
-07
Mar
-08
Jun-
08
Sep
-08
Dec
-08
Mar
-09
rebased to 100
19.1% p.a.
19.1% p.a.
20
40
60
80
100
120
140
Jun-
07
Sep
-07
Dec
-07
Mar
-08
Jun-
08
Sep
-08
Dec
-08
Mar
-09
rebased to 100
18.8% p.a.
18.8% p.a.
Outperformance of buyout investments increased during the past two downturns
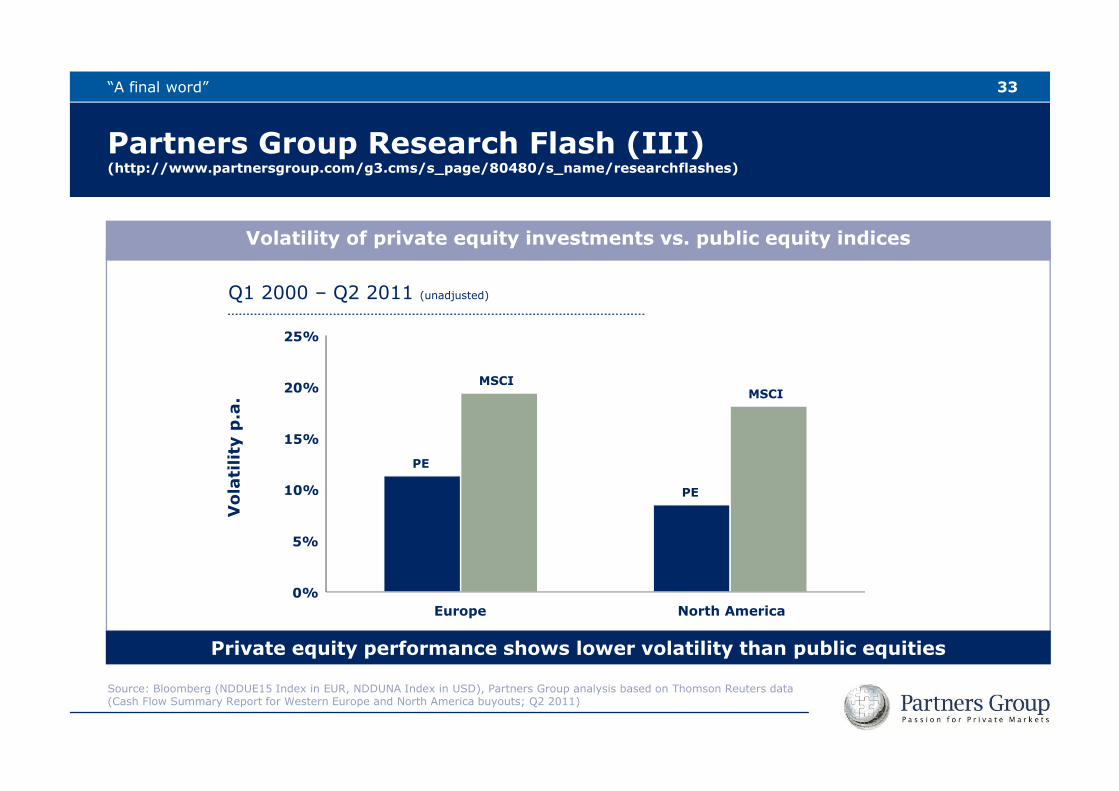
Partners Group Research Flash (III)(http://www.partnersgroup.com/g3.cms/s_page/80480/s_name/researchflashes)
33“A final word”
Q1 2000 – Q2 2011 (unadjusted)
Volatility of private equity investments vs. public equity indices
Private equity performance shows lower volatility than public equities
Source: Bloomberg (NDDUE15 Index in EUR, NDDUNA Index in USD), Partners Group analysis based on Thomson Reuters data (Cash Flow Summary Report for Western Europe and North America buyouts; Q2 2011)
PE
PE
MSCIMSCI
0%
5%
10%
15%
20%
25%
Europe North America
Volatility p.a.

2012: Time to lift anchor to stay afloat
34“A final word”
Contacts
35
Manuel Martiny, Partner
Tel.: +41 41 784 66 02E-Mail: [email protected]
Zugerstrasse 576341 Baar-ZugSwitzerlandTel.: +41 41 784 60 00Fax: +41 41 784 60 01
ZUG | SAN FRANCISCO | NEW YORK | SÃO PAULO | GUERNSEY |LONDON| PARIS| LUXEMBOURG |MUNICH |DUBAI | SINGAPORE |BEIJING |SEOUL |TOKYO | SYDNEY
Disclaimer
This material has been prepared solely for purposes of illustration and discussion. Under no circumstances should the information contained herein be used or considered as an offer to sell, orsolicitation of an offer to buy any security. Any security offering is subject to certain investor eligibility criteria as detailed in the applicable offering documents. The information contained herein isconfidential and may not be reproduced or circulated in whole or in part. The information is in summary form for convenience of presentation, it is not complete and it should not be relied upon assuch.
All information, including performance information, has been prepared in good faith; however Partners Group makes no representation or warranty express or implied, as to the accuracy orcompleteness of the information, and nothing herein shall be relied upon as a promise or representation as to past or future performance. This material may include information that is based, in partor in full, on hypothetical assumptions, models and/or other analysis of Partners Group (which may not necessarily be described herein), no representation or warranty is made as to thereasonableness of any such assumptions, models or analysis. Any charts which represent the composition of a portfolio of private markets investments serve as guidance only and are not intended tobe an assurance of the actual allocation of private markets investments. The information set forth herein was gathered from various sources which Partners Group believes, but does not guarantee, tobe reliable. Unless stated otherwise, any opinions expressed herein are current as of the date hereof and are subject to change at any time. All sources which have not been otherwise credited havederived from Partners Group.Material notes to investors based in Australia Partners Group (UK) Limited ABN 41 130 021 484 is exempt from the requirement to hold an Australian financial services licence by operation of ASIC Class Order 03/1099: UK FSAregulated financial service providers. Partners Group (UK) Limited is regulated by the Financial Services Authority of the United Kingdom under UK laws, which differ from Australian laws.
Material notes to investors based in Brazil This document has been prepared exclusively for the purpose of providing information, and it is not to be considered as an offer for the sale of any security. The securities may not beoffered, sold, redeemed or transferred in Brazil, as any public offering or distribution of securities in Brazil is not legal without prior registration with CVM. Persons wishing to offer or acquire securities in Brazil should consult their owncounsel as to the applicability of the registration requirement or any exemption therefrom.
Material notes to investors based in the People’s Republic of China This material is presented to investors by Partners Group’s Beijing Representative Office on behalf of Partners Group (Singapore) Pte Limited. PartnersGroup’s Beijing Representative Office is not representing any other entity (including, without limitation, Partners Group AG). Partners Group’s Beijing Representative Office is engaged solely in the conduct of market research andliaison activities and is not engaged in direct business operations in accordance with the Regulatory Measures for Registration of Representative Offices of Foreign Companies, Article 3. Any products referenced herein have not beensubmitted to or approved/verified by or registered with the China Securities Regulatory Commission or other relevant governmental authorities in the PRC. Such products may not be offered, sold or delivered or available forreoffering, resale or redelivery directly or indirectly to any person in the PRC, other than in full compliance with the relevant laws and regulations of the PRC. PRC investors are responsible for obtaining all relevant governmentregulatory approvals/licences, verifications and/or registrations.
Material notes to investors based in the Dubai International Financial Centre This material relates to a financial product which is not subject to any form of regulation or approval by the Dubai Financial Services Authority("DFSA"). The DFSA has no responsibility for reviewing or verifying any prospectus or other documents in connection with this financial product. Accordingly, the DFSA has not approved this document or any other associateddocuments nor taken any steps to verify the information set out in this document, and has no responsibility for it. The financial product to which this document relates may be illiquid and/or subject to restrictions on its resale.Prospective purchasers should conduct their own due diligence on the financial product. If you do not understand the contents of this document you should consult an authorized financial adviser.
Material notes to investors based in France This information material is presented to investors at their request by Partners Group (France) SAS, which is regulated by the French Securities and Exchange Commission (“Autoritésdes marches financiers”, “AMF”) as a result of its status of a French financial advisor (“Conseiller en investissements financiers”) through its membership to professional associations (“Anacofi and Anacofi-Cif”) under N° E002832.Partners Group (France) SAS is acting on behalf of Partners Group AG and certain of its affiliates, including Partners Group (UK) Limited, which is regulated by the UK Financial Services Authority and passported to conduct activitieson a cross-border basis in France under N° 71779. Any product referred to in this information material will be either a non -French non-harmonized open end investment collective scheme or a non-French closed- ended fund for thepurposes of the Monetary and Finance Code of the Republic of France (“MFC”). Any product will not be submitted to or approved/verified by or registered with AMF. The promotion of any product and the distribution of any associatedmaterial is accordingly restricted by law. The open end investment collective schemes may be promoted only to qualified investors at their request. The placement of the closed-ended funds may only be undertaken towards qualifiedinvestors acting for their own account through a private placement. The shares or the interests thus acquired in any product cannot be distributed or resold directly or indirectly to the public otherwise than in accordance with theprovisions of the MFC. Potential investors should consult their own authorized financial advisor.
Material notes to investors based in Japan The registration number for Partners Group AG in Japan is Kanto Financial Bureau No. 2141 (Financial Instruments Business). The Financial Instruments Mediation Assistance Center("FINMAC") is the appropriate financial arbitrator for any complaints or disputes regarding our financial products and transactions (FINMAC +81 3 3667 8009).
Material notes to investors based in the United Kingdom This material is presented to investors by Partners Group (UK) Limited, which is regulated by the UK Financial Services Authority (“FSA”). Any product offered will be anunregulated collective investment scheme for the purposes of the Financial Services and Markets Act 2000 of the United Kingdom (“FSMA 2000”). The promotion of any product and the distribution of any associated material isaccordingly restricted by law. Any product related material is therefore issued by Partners Group (UK) Limited only to persons who are of a kind to whom such product may lawfully be promoted under the Financial Services andMarkets Act 2000 (Promotion of Collective Investment Schemes) (Exemptions) Order 2001 (“CIS Order”) and Rule 4.12 of the Conduct of Business Rules published by the FSA (“Relevant Persons”).
Material notes to investors based in the United States of America This material is presented to investors on behalf of Partners Group AG. Statements herein do not necessarily pertain to Partners Group (USA) Inc., which is aSEC registered investment adviser and an affiliate of Partners Group AG. For information specifically regarding Partners Group (USA) Inc., please contact us.
36Important notice
▫