Embed Size (px)
Citation preview
Privacy in the context of Smart Home Environments
Based upon a survey of experts
JAHAIVIS M. ARIAS
KTH ROYAL INSTITUTE OF TECHNOLOGY I N F O R M A T I O N A N D C O M M U N I C A T I O N T E C H N O L O G Y
DEGREE PROJECT IN COMMUNICATION SYSTEMS, SECOND LEVEL STOCKHOLM, SWEDEN 2014

Privacy in the context of Smart Home Environments
Based upon a survey of experts
Jahaivis M. Arias
2014-05-28
Master’s Thesis
Examiner and academic adviser Professor Gerald Q. Maguire Jr.
KTH Royal Institute of Technology School of Information and Communication Technology (ICT) Department of Communication Systems SE-100 44 Stockholm, Sweden

i
Abstract
Smart environments, particularly smart homes have become an increasingly popular topic for research and real world implementations. Despite the popularity of this topic, there is a lack of tools to enable inhabitants of smart environments to perceive which kind of data smart devices generate and to make inhabitants aware of who is accessing their personal information and the purpose for accessing this information. These issues have caused privacy concerns among inhabitants of smart environments – who would like to ensure their personal information is only utilized for their benefits, rather than being used for malicious purposes. Therefore, smart home environments motivate the need for privacy awareness tools to help inhabitants to better understand the privacy implications when their personal information is misused. To address this problem, this thesis suggests guidelines for the design of privacy awareness tools.
A literature review evaluated instruments to conduct research about privacy concerns. The Internet Users’ Information Privacy Concerns (IUIPC) framework from Malhotra, Kim, and Agarwal was selected for the empirical part of this thesis project because it is one of the most reliable models developed to measure privacy concerns at the individual level. Quantitative data was gathered through a survey based on this framework. Data collected from 30 experts in the field of study was analyzed using linear regression analysis techniques and principal component analysis.
These survey results lead to a set of guidelines that could guide designers and service providers as to what aspects of privacy concerns they should consider and what they should concentrate on when designing privacy awareness tools for ubiquitous computing systems, such as a smart home.
Keywords
Privacy, Smart environments, Smart Homes, Ubiquitous Computing, Users’ Privacy Concerns, IUIPC Model

iii
Sammanfattning
Intelligenta omgivningar och framförallt smarta hem har kommit att bli ett popular forskning samt impementationsområde. Trots ämnets popularitet är det en brist på verktyg som låter personer i dessa intelligenta omgivningar att förstå vilken typ av data som genereras av de smarta apparaterna, att de förstår vem som får tillgång till deras privatinformation och syftet till att informationen används. Dessa problem leder till påverkar användarintegriteten för personerna i de intelligenta omgivningarna. Personerna vill försäkra sig om att deras privatinformation används till deras fördel och inte missbrukas. Det finns ett behov av integretetsverktyg som kan hjälpa personerna att få en bättre förståelse över hur deras integritet påverkas när deras privatinformation missbrukas. Den här rapporten syftar till att behandla detta problem genom att ta fram riktlinjer baserade på användarnas oro kring deras integritet.
En litteraturstudie genomfördes för att utvärderade metoder för att genomföra forskning på användarintegritet. Ramverket Internet Users’ Information Privacy Concerns (IUIPC) från Malhotra, Kim, och Agarwal valdes eftersom det var den en av de mest pålitliga modellen för att mäta den individuella oron kring integriteten hos användarna. Kvantitativ data samlades in genom ett formulär baserat på IUIPC ramverket. Datan samlades in under den empiriska fasen utav 30 experter inom forskningsområdet. Linjär regression och principalkomponentanalys användes för att analysera datan från undersökningen.
Resultatet från undersökningen diskuterades med målet att tillhandahålla riktlinjer till utvecklare och tjänsteleverantörer, om vilka integritets aspecter vilket bör övervägas samt focusera på vid utveckling av integretetsverktyg för ubika datasystem.
Nyckelord
Integritet, Intelligenta omgivningar, Smart hem, Ubika datasystem, Användarintegretet, IUIPC ramverket.

v
Acknowledgments
I would like to express my deepest gratitude to my academic advisor and supervisor Professor Gerald Q. Maguire Jr. for his patience, enthusiasm, dedication, and guidance through this thesis work. I highly appreciate his valuable advices and suggestions to improve my work. Without his supervision, this thesis project would not have been possible.
I would like to extend my deepest gratitude to all of those who help me to clear doubts and support morally during this master’s thesis project. Particularly, to Pedro Sanches at SICS for all his valuable ideas and great feedback.
Last but not least, I would also like to acknowledge my appreciation to my mother, father and grandmother for their unconditional and constant love and support.

vii
Table of contents
Abstract ....................................................................................... i Keywords ................................................................................................. i
Sammanfattning ....................................................................... iii Nyckelord .............................................................................................. iii
Acknowledgments ..................................................................... v Table of contents ..................................................................... vii List of Figures ........................................................................... ix List of Tables ............................................................................ xi List of acronyms and abbreviations ..................................... xiii 1 Introduction .......................................................................... 1
1.1 General introduction to the area ................................................ 1 1.2 Problem definition ....................................................................... 1 1.3 Goals ............................................................................................ 2 1.4 Structure of the thesis ................................................................ 2
2 Background .......................................................................... 3 2.1 Ubiquitous Computing ................................................................ 3
2.1.1 Core Characteristics ....................................................... 4 2.1.2 Technology ...................................................................... 6 2.1.3 Challenges ....................................................................... 7
2.2 Smart Homes ............................................................................... 8 2.3 The technology used by Smart Homes ..................................... 9
2.3.1 Home Automation ......................................................... 11 2.3.2 Smart Meters ................................................................. 11
2.4 Privacy ........................................................................................ 12 2.5 Privacy in Ubiquitous Computing ............................................ 14 2.6 Privacy Legislation .................................................................... 15 2.7 User’s Concerns about Privacy ................................................ 16 2.8 Market of personal information ................................................ 18 2.9 Managing Privacy in Ubicomp .................................................. 18
3 Methodology ...................................................................... 21 3.1 Research Process ..................................................................... 21 3.2 Research Paradigm ................................................................... 22 3.3 Data Collection .......................................................................... 24
3.3.1 Literature Review .......................................................... 24 3.3.2 Scenario-based survey ................................................. 25
3.4 The survey Process ................................................................... 25 3.4.1 Sampling ........................................................................ 26 3.4.2 Sample Size ................................................................... 27 3.4.3 Target Population ......................................................... 27 3.4.4 Scale Development ....................................................... 27

viii
3.4.5 Survey Administration .................................................. 28
3.5 Measurements ........................................................................... 28 3.5.1 Reliability ....................................................................... 28 3.5.2 Validity ........................................................................... 29
3.6 Data Analysis ............................................................................. 30 3.6.1 Data Analysis Technique ............................................. 30 3.6.2 Software Tool ................................................................ 30
3.7 Internet Users’ Information Privacy Concerns (IUIPC) Framework ............................................................................................. 31
3.7.1 IUIPC Factors ................................................................ 32 3.7.2 Relationship between Trust, Risk, Usefulness, and
Intention ......................................................................... 33
4 Analysis .............................................................................. 37 4.1 Reliability Analysis .................................................................... 37 4.2 Validity Analysis ........................................................................ 37 4.3 IUIPC Factors ............................................................................. 39 4.4 Discussion ................................................................................. 45
5 Conclusions and Future work .......................................... 49 5.1 Conclusions ............................................................................... 49 5.2 Limitations ................................................................................. 49 5.3 Future work ................................................................................ 50 5.4 Required reflections .................................................................. 50
References ............................................................................ 53 Appendix A: Smart Environment Experience ....................... 63 Appendix B: Survey Results .................................................. 69 Appendix C: SPSS Statistics Results - Reliability ................ 83 Appendix D: Correlation Matrix ............................................. 85 Appendix E: SPSS Statistics Results – Validity ................... 87 Appendix F: Regressions ....................................................... 97 Appendix G: Privacy Concerns PCA ................................... 105

ix
List of Figures
Figure 2.1: Ubicomp Core Characteristics (Inspired by Figure 1.2 on page 10 of [8]) ......................................................................................... 4
Figure 2.2: Typical Smart Home Environment ..........................................11 Figure 3.1: Research Process ..................................................................... 21 Figure 3.2: Type of research design and the structure of the problem ..... 23 Figure 3.3: Literature review process ........................................................ 25 Figure 3.4: Survey Process ......................................................................... 26 Figure 3.5: Privacy Concerns and its dimensionalities .............................. 32 Figure 3.6: Framework overview and relationship among factors ............ 35 Figure 3.7: IUIPC Model variables relationships ...................................... 36 Figure 4.1: Linear Regression Analysis Results ......................................... 42 Figure 4.2: Data Protection ........................................................................44 Figure 4.3: Level of details of personal information Notifications............ 45 Figure 4.4: Frequency of Notifications ...................................................... 45

xi
List of Tables
Table 2.1: Ubicomp characteristics ............................................................ 4 Table 2.2: Dimensions for classifying types of intelligent systems [8] ...... 6 Table 2.3: Smart Home Architecture .......................................................... 9 Table 2.4: Ubiquitous Computing Properties .......................................... 14 Table 2.5: Fair Information Practice Principles (FIPPs) [35] .................. 15 Table 2.6: Summary of users' privacy concerns in the existing literature16 Table 2.7: Scales to measure users' privacy concerns [50] ...................... 17 Table 3.1: Type non-probability sampling ............................................... 26 Table 3.2: Scale development .................................................................. 28 Table 3.3: Factors and sources ................................................................. 34 Table 4.1: Reliability Test Results ............................................................ 37 Table 4.2: KMO and Bartlett's Test ......................................................... 38 Table 4.3: Validity Test Results ............................................................... 38 Table 4.4: Regression1: Privacy concerns predicted to influence ‘Trust &
Belief’ ........................................................................................ 39 Table 4.5: Regression2: Privacy concerns predicted to influence ‘Risk-
Thresholds’ ............................................................................... 39 Table 4.6: Regression3: Privacy concerns predicted to influence
Behavioral-Intention’ .............................................................. 40 Table 4.7: Regression4: Privacy concerns predicted to influence perceived-
usefulness’ ............................................................................... 40 Table 4.8: Regression5: ‘Risk-thresholds’ predicted to influence ‘Trust &
Belief’ ........................................................................................ 41 Table 4.9: Regression6: ‘Behavioral-intention’ predicted to influence ‘Risk-
Thresholds’ ............................................................................... 41 Table 4.10: Regression7: ‘Perceived-usefulness’ predicted to influence ‘Trust
& Belief’ .................................................................................... 41 Table 4.11: Regression8: ‘Behavioral-intention’ predicted to influence ‘Trust
& Belief’ .................................................................................... 42 Table 4.12: KMO and Bartlett's Test .......................................................... 43 Table 4.13: Correlation Matrix Privacy Concerns ...................................... 43 Table 4.14: Factor Loading Privacy Concerns ............................................44


xiii
List of acronyms and abbreviations
6LoWPAN IPv6 over Low power Wireless Personal Area Networks. ACM Association for Computing Machinery AdLoc Advertising Location AI Artificial Intelligence AS Autonomous System Auto-ID Automatic identification AW Awareness CFIP Concerns for Information Privacy CL Control DASH7 Developers’ Alliance for Standards Harmonization of ISO 18000-
7 DB Database DMA Direct Marketing Association DTI Department of Trade and Industry (U.K.) ESM Experience Sampling Method FIPPs Fair Information Practice Principles GDP Gross Domestic Product GPS Global Positioning System HA Home Automation HCI Human Computer Interaction HG Home Gateway HGI Home Gateway Initiative HW Hardware ICT Information and Communication Technology IEEE Institute of Electrical and Electronics Engineers iHCI Implicit Human Computer Interaction INT Intrusion IPTV Internet Protocol Television IT Information Technology ITE Intention IUIPC Internet Users’ Information Privacy Concerns JSTOR Journal StorageKMO Kaiser-Meyer-Olki Measure of Sampling Adequacy KNX Technology proposed by KNX Association LBS Location Base Services LISREL Linear Structural Relation M2M Machine to Machine MSA Measure of Sampling Adequacy SPSS Statistical Package for the Social Sciences OCR Optical Character Recognition Paws Privacy Awareness System PC Personal Computer PCA Principal Component Analysis PLS Partial Least Square QoS Quality of Services RFID Radio Frequency Identification

xiv
RI Risk SC Social Contract Theory SEM Structural Equation Modeling SICS Swedish Institute of Computer Sciences SUR Surveillance SW Software TAM Technology acceptance model TR Trust TRA Theory of Reasoned Action Ubicomp Ubiquitous Computing UN Unauthorized Second Use US Usefulness USD United States Dollar VoIP Voice over IP WAN Wide Area Network Wi-Fi Wireless Fidelity WiMAX Worldwide Interoperability Microwave Access WWW World Wide Web
1
1 Introduction
This master’s thesis concerns privacy and autonomy in the context of ubiquitous computing, particularly in smart home environments. This chapter clearly states the problem and gives a conceptual overview of smart home environments, privacy, and users’ privacy concerns. Chapter 2 provides detailed background information. Users’ privacy concerns in smart home environments were evaluated through a survey based on the Internet Users’ Information Privacy Concerns (IUIPC) framework*. This survey served as the basis for a set of proposed guidelines whose purpose is to help designers or services providers create better tools and services that ease inhabitant’s privacy concerns, as well as to help inhabitants of smart home environments to improve their understanding of their privacy and autonomy. The thesis concludes with a presentation of conclusions and suggestions for future work.
1.1 General introduction to the area Increasingly, physical objects have gained the ability to emit data about their
environment. With the increasing adoption of sensors, intelligent devices, and wireless networks, houses are becoming smart home environments. In these environments highly specialized, intelligent devices collaborate, process, share, and make deductions from the data captured about the state of the house and the activities of its residents (and visitors) [1]. Cook, et al. [2, 3] believe that by living in a smart home environment its residents can increase the quality of their lives. Although on the surface this development appears to be a good thing, it could also reduce the individuals’ security and privacy due to the risks of sensitive personal information being collected and spread.
1.2 Problem definition In today’s smart home environments there is a lack of mechanisms to enable
inhabitants to perceive and control the data generated by smart devices in their home [4]. Intelligent devices may acquire a vast amount of sensitive personal data. The collection and processing of this data raises privacy concerns about how the individuals living in such a smart home environment can ensure that this data is shared only for their own good, rather than be collected, shared, used, or maliciously disclosed for purposes that would violate their autonomy and privacy. Moreover, these intelligent devices are expected to collectively generate very large amounts of data – usually without the users’ consent or their complete awareness of the implications of using such devices [5]. In current smart home environments, individuals are unaware that they are surrounded by a system with sensing capabilities and they are unable to monitor what personal information or other data has been collected nor are they able to effectively control this data.
The invisibility of smart devices also represents another issue, because these devices generally have limited or no user interfaces to inform users of the amount of data collected and how it is used [4]. Even when user interfaces are available,
* See Section 3.7 for details of the IUIPC framework.

2
they present the information to the user in a format that the user is unlikely to understand – typically raw datasets. Moreover, we believe that the currently available tools that have been designed to provide privacy awareness are not designed taking into account users’ privacy concerns. Therefore, the smart home inhabitants’ privacy and autonomy might be compromised.
1.3 Goals In order to develop a solution for the problem stated in previous section we
explore the nature of users’ concerns about information privacy within smart home environments and discussed the results to serve as a set of guidelines. The rationale behind these guidelines is to contribute to the creation of suitable privacy awareness systems for smart home environments that address inhabitants’ privacy concerns by fostering the creation of appealing privacy applications.
To gain a deeper understanding of the nature of users’ privacy concerns, we investigated relationships among the inhabitants’ perceived trust and beliefs in smart home service providers, inhabitants’ perceived risk-thresholds related to provide personal information to smart home service providers, the intention of the inhabitants to allow the disclosure of their personal information (behavioral-intention), and inhabitants’ perceived-usefulness that smart home environments would enhance the quality of their live.
Moreover, this work aims to give a better understanding of the privacy attitude of users within a smart home environment and the relationship between smart home technology and privacy and autonomy by reflecting on the boundaries and tradeoffs that exist between them. This is a very timely aim as we are currently entering a new era as smart home technology is shifting from research laboratories (where subjects have given their informed consent to being monitored) to commercial introduction of smart home technology. However, this new set of users have not been informed about what information is collected, how this information might be used (for and against them), and how they might or might not be able to control the smart devices and the information that these devices collect.
1.4 Structure of the thesis Chapter 1 has introduced this master’s thesis project by stating the research
problem and outlining the goals of this study. Chapter 2 presents relevant background information about the field of ubiquitous computing and smart home environment technology. The chapter also describes the technologies and their most important characteristics. After this the chapter discusses privacy aspects and users’ privacy concerns with regard to these technologies. Chapter 3 describes and justifies the selected methodology as well as the steps followed to accomplish our research, including the data collection, survey process, and measurements. Chapter 4 presents and discusses the data collected from the survey. Chapter 5 concludes the thesis by stating the suggested guidelines. Additionally, this final chapter presents recommendations for future work and describes the limitations of the current work.

3
2 Background
This chapter provides basic background information about ubiquitous computing, smart homes, privacy, and privacy legislation. Additionally, this chapter describes privacy in the context of a smart home environment and users’ concerns about privacy. The chapter also describes related work illustrating state of art of smart home environments.
2.1 Ubiquitous Computing In the beginning of the 1990's Mark Weiser introduced the term “ubiquitous
computing” and its contraction “ubicomp” to explain his vision that computers and computing capacity will be available everywhere, anytime, via any apparatus. His vision also highlighted that computers will vanish into the background becoming transparent to the users. By vanishing into the background and becoming transparent Weiser implied that computers will be so small and inexpensive that users will not think of them as computers. As a result, computers would become similar to electricity, where only its absence is noticed [6]. Today we often use electricity without even thinking about it (e.g., when we switch off or on a light switch). The perception that electricity is available everywhere has become so widespread and common that conscious thoughts about the use of electricity has disappeared from our lives.
Mark Weiser’s vision also suggested that the computer revolution would pass through three different eras. The main frame era in which one computer would be used by many users, to the personal computer era in which one computer would be used by one user, and the ubiquitous computing era in which one user uses many computers [5, 6].
Today’s world is moving closer to Weiser’s vision. Today our home and office environments contain an increasing number of networked computing devices, in the form of chips with all kind of sensors. These devices can be mobile, stationary, or embedded – almost everywhere – in watches, in home appliances, in automobiles, clothes, and so on. Moreover, to an increasing extent these devices communicate to each other in order to seamlessly work together to process and distribute the values sensed (which might include highly personal information) over high-speed wired and wireless networks. These systems assist us in everything we do. Examples of this technology include clocks that automatically set themselves to the correct time after an electric failure, walls that are able to damp certain sounds, and sensors that are able to notify us about intruders [7].
In 1997, Weiser and Brown highlighted that personal computers (PCs), laptops, and tablets could not be considered ubicomp, even though they are Internet-enabled portable devices, as they typically do not seek to understand the context of their environment in order to react appropriately [7]. However, today this is rapidly changing as many of these devices now are incorporating increasing numbers of sensors in order to dynamically adapting to their environment.

4
2
in2
F
T
2
utepo
andfula
Di
Im
Co
Au
In
2.1.1 CoThere a
nformation2.1. Table 2
Figure 2.1:
Table 2.1:
2.1.1.1 Distribu
ubicomp syechnologie
power. Whone system
In ubicoaccessed lonetwork tedata networunctions watency, var
Cistributed I
mplicit Hum
ontext Awar
utonomy
ntelligent
ore Charare five cn and com
2.1 summar
Ubicomp
Ubicomp
Distributed, interlystems. Ines workinghen interac
[8].
omp, netwocally and/
chnologiesrks, etc. Ba
will be requrious types
CharacteriICT
man Compu
reness
racteristcore chara
mmunicatiorizes these
p Core Cha
p character
uted ICTlinked, tra
n this contg and acticting with
work conneor remotels can suppased on thuired from
s of media a
istics
ter Interact
tics acteristics
on technolocharacteri
aracteristic
ristics
ansparent, text, distring as onethese dist
ected intelly from anport ubico
he type of um these neaccess con
Codis
tion HuinvCoopCowiCoint
that distogy (ICT) sistics.
s (Inspired
and open ributed ime computetributed IC
lligent devnywhere anomp interaubicomp setworks, sutrol, and s
omputers stributed, auman comvisible. omputers neptimize theiromputers nithout humaomputers neteractions, g
tinguish usystems [8
d by Figure
are commplies a co
er, combinCT systems
vices offer nd at any taction: datervices a diuch as: mino on [8].
Descrineed to
nd transparmputer inte
eed to be cor operation need to oan interventeed to handgoverned by
ubicomp f8], as show
1.2 on pag
mon characollection ofning their s users pe
services thtime. A wita networkiverse comnimal jitte
iption be int
rently acceseraction n
ontext awarin their env
operate aution. dle dynamicy intelligent
from othewn in Figur
ge 10 of [8])
cteristics if computeprocessin
erceive it a
hat may bde range oks, wireles
mbination oer, bounde
terconnectessible.
needs to b
re and able vironment.utonomousl
c actions ant decisions.
er re
)
n er ng as
be of ss of d
ed,
be
to
ly,
nd

5
Transparency and openness imply that the technology does not intrude into the physical environment or into the activities performed in this environment, but rather that the devices cannot be seen, heard, or consciously touched [9].
Openness implies that these systems are designed to avoid closed implementations. Instead, these systems are designed for interoperability and they can dynamically discover external services. For instance, an ubicomp camera could automatically detect printing services and inform its user about the availability of a printing service. Nevertheless, many systems are still not designed for openness due to the product vendor not being interested in openness, thus vendors may design their products to ignore the presence of competitor’s products in order to preserve their market share [8].
2.1.1.2 Implicit Human Computer Interaction The term human computer interaction (HCI) refers to the interaction between
humans and machines. HCI researchers seek to make these interactions more effective, to empower human interaction and to enhance users’ interactive experience [8]. The area called implicit HCI (iHCI) is based on the premise that computers or other intelligent devices have some knowledge of the behavior or actions of the users in a given situation. Users perform actions without intending to interact with a computerized system, but an iHCI system can utilize these actions as input. Therefore, the intelligent devices become invisible because some of the interactions are hidden due to the iHCI systems using the users’ interactions while doing a task as (implicit) input [10].
Ubicomp devices need to be designed to support iHCI to a great degree in order make computation and digital information access seamless and less obtrusive to the users [8]. To achieve this is important that: (1) the users feel pleasant ceding control to automated systems that – without the users being aware and without the iHCI system intruding into their life; and (2) the system needs to be able to detect users and their context and then adapt accordingly [8].
2.1.1.3 Context Awareness Everyday communication among humans involves the concept of context. For
instance, while speaking with another human being we can perceive odors, environmental conditions, people around us, and so on. In computer science, the concept of context was first used by Schilit, Adams, and Want in 1995 to refer to a system that “can provide context relevant information and services to users and applications” and “adapts itself to the context” [11]. Context awareness includes detecting, identifying, and locating users’ movement, activities, and actions and using this information to provide services that could be beneficial to the user.
Not all ICT systems are context aware. However, in smart environments, the use of sensor technologies facilitates and makes possible the collection of contextual information. The major challenge is selecting what information is relevant in a given context and exploiting the adaptability and dynamism of a context aware system to handle the specific context the user is in, as the user may do the same or different activities in the same location or different locations. By properly distinguishing context, ubicomp system improve the services provided to users and facilitate the interactions of the users with the system [12].

6
2.1.1.4 Autonomy An autonomous system (AS) is a system that is self-governing, able to make its
own decisions, and decide upon its most appropriate behavior. In an AS the user simply specifies a high level task and the system will automatically and dynamically control and perform all the low level subtasks. This reduces the complexity seen by the end user. An AS can also re-plan if some of the subtasks have not achieved their goals [8].
2.1.1.5 Intelligent Intelligent systems are systems – machine or software – which use artificial
intelligence (AI). AI is fundamental in ubicomp in order to handle characteristics such as context awareness and autonomy. Intelligent systems are designed to perceive their environment and take actions that maximize their chances of success [13]. Dimensions for classifying these systems are shown in Table 2.2.
Table 2.2: Dimensions for classifying types of intelligent systems [8]
Strong or weak intelligence Physical (embodied) hardware, e.g. robots or virtual software Fundamental properties such as autonomous, social, reactive, proactive, etc. Thinking (cognitive) or acting (behavior) Human or rational Complex organisms (explicit, high level, knowledge based action selection) or simple cellular organisms (implicit low level action selection) Type of design architecture: reactive, model based, goal based, utility based, etc. Learning or non-learning Certainty or uncertainty The environments in which intelligent systems operate: observable, deterministic, sequential, etc. Individual intelligent entities or as multiple, collective, intelligent entities
2.1.2 Technology There are four key elements that enable ubicomp [14, 15]:
• Automatic identification (Auto-ID): Auto-ID is a technology used to identify, track, and trace objects, people, and animals. It begins by obtaining data, through the analysis of sounds, electronic signals, images or videos. This data is analyzed by a computer to verify the identity of the object. Typically, Auto-ID systems are barcodes, radio frequency identification (RFID), optical character recognition (OCR), smart cards, and biometrics systems. Every Auto-ID system has two processes: (1) capturing the signal associated with an object and (2) recognition based on computer analysis of that signal. An example of this is capturing the image of a barcode and then decoding the encoded information. Barcodes systems are the most widespread auto-ID technology for object recognition. Barcodes are simply an optical machine-readable mechanism to capture information without the need to enter letters and numbers via a keyboard. Current barcode products can store more than 7,089 characters using a barcode. RFID tags consist of a small chip and antenna. Such a tag can be attached to an object. An RFID reader can read the information stored in a tag if it is within range of the

7
RFID reader. OCR converts scanned images of handwritten, typewritten, or printed text into machine-encoded text. Using an OCR scanner printed text can be digitalized, stored in a database (DB), and searched. Smart cards are plastic cards, usually the same size of a credit card, with an embedded microchip and some stored data. Smart cards are widely used for electronic “cash” payments, prepaid telephone calls, and so on. Biometrics technology is used to identify humans by their characteristics (such as anatomical – fingerprint, facial, iris recognition – or behavioral – signature characteristics or traits).
• Location Based Technology: The ability of devices to determine their location enables location based services (LBS). This information can also be used to discovery objects. Location techniques include proximity, lateration, and angulation. If an object is recognized and the position of this object is determined, then the system deduces that the object is in the proximity of the known position. Lateration and angulation, particularly of radio frequency and audio frequency sources, are techniques that utilize timing, distance, or angle measurements between several known points to deduce the position of an object. The global positioning system (GPS) is a widely used location based technology using lateration based upon signals from satellites to provide a global navigation system. A GPS receiver calculates its position by exploiting precise timing signals sent by four or more GPS satellites.
• Sensor Technology: Sensors are devices that detect and respond to certain types of input from the physical environment and produce an output signal. Sensor technologies are used in a broad range of domains, such as medicine, commerce, industry, and so on. Sensors can monitor temperature, humidity, lightning conditions, pressure, presence or absence of objects, and so on. Wireless sensor systems utilize sensors connected to micro-controllers, memory, batteries, and radios. These sensors platforms can form part of a peer-to-peer or mesh network. These wireless sensors systems are generally self-configuring. Many low cost sensor networks exploit redundancy, so that individual node failures can be tolerated.
• Connectivity: Wireless connectivity is fundamental for ubiquitous computing. A wide variety of wireless technologies (such as Wi-Fi, WiMAX, cellular telephony, Bluetooth, and IEEE 802.15.4) can be used to provide connectivity between sensor platforms and gateways to other networks or to other sensors and actuators.
2.1.3 Challenges Despite its proliferation and convenience ubicomp has some remaining
challenges to overcome [16, 17]:
• The need for natural interfaces to support common forms of human expression, in order to allow the user to use more expressive input techniques (such as speech input or handwriting).
• Context-aware applications should adapt their behavior based on the information sensed. For instance, the ability to discard useless information and capture only important events (such as an important decision points during a meeting) would be a great aid to users.

8
• The automation of capture of live experiences and subsequent access would be a powerful aid to memory. Most ubicomp applications lack an appropriate visualization tool to show the user this captured information in an intuitive and understandable way.
• Privacy-enhancing-tools should show individuals what personal information or data is collected. Individuals are generally not aware that they are surrounded by embedded systems with sensing capabilities and they are unable to monitor what data is collected nor deny its collection.
• There is a need for more robust security mechanisms in all the components or nodes within an ubicomp environment in order to make the system less vulnerable to attacks or malfunctions that could disrupt services or destroy/fake data.
Smart home environments can be considered a sub-domain of ubiquitous computing [18]. Therefore, all of the characteristics, technologies, and challenges mentioned above also apply to smart home environments. The next section will cover some important aspects of smart home environments.
2.2 Smart Homes There is no generally accepted definition of what a ‘smart home’ is. The
definition of this term varies based on the technology or the functionality the home provides. Several terms are considered synonymous with this term in different contexts, such as: ‘assistive technology’, ‘e-health’, ‘digital house’, ‘smart environments’, ‘automated house’, and ‘intelligent living’ [19]. The more common definitions, among these synonymous terms, are the definitions proposed by Mark Weiser and U.K. Department of Trade and Industry (DTI). Weiser defined a ‘smart environment’ as “a physical world that is richly and invisibly interwoven with sensors, actuators, displays and computational elements, embedded seamlessly in the everyday objects of our lives, and connected through a continuous network” [6]. The DTI’s Smart Home project defined a ‘smart home’ as residences that include telecommunications networks that interconnect essential electrical appliances and services, and enables them to be controlled, monitored, or accessed from a distance [20].
Today’s homes are evolving into a place for e-health, entertainment, communication, work, commerce, and learning. They are becoming intelligent living environments that provide their residents with proactive services, such as medical care and monitoring of light, temperature, humidity, heating, and energy consumption. This means homes are becoming smart-agents able to perceive the state of the house and its inhabitants through sensor technology. The aim is to increase the comfort, quality of life, productivity of residents, reduce operating costs, and to encourage occupants to use resources more effectively as well as optimize the energy consumption in order to become an environmentally friendly society [2, 3]. Therefore, there are increasing political, social, and commercial interests in the potential of smart homes.
An indication of this interest can be seen in the number of smart homes projects – in academia and business – undertaken around the world. For example, in the United States of America, the ‘house_n’ project by MIT is a live-in-laboratory used to investigate, monitor, and record activities and interactions of everyday home life

9
[21]; and the ‘Aware Home Research Initiative’ by Georgia Institute of Technology is a research effort devoted to the technical, social, and design challenges for inhabitants, especially in areas such as health and well-being, digital media and entertainment, and sustainability [22]. In Europe, assisted interactive houses have been developed in The Netherlands, the ‘PowerMatchingCity’ project focuses on the development of an integral market model based on ICT that facilitates more efficient energy consumption by householders and effective energy distribution by the distributor system operator [23]. In Sweden, ‘The Stockholm Royal Seaport’ project includes a wide variety of projects whose main goal is to use generic ICT infrastructures to help to reduce investment, climate, and environmental costs; while contributing towards a sustainable city [24]. In Asia, the ‘Welfare Techno-Houses’ project explores the use of an automated monitoring system to allow medical care for elderly and disabled persons from their home in order to improve the quality of their lives [25].
2.3 The technology used by Smart Homes Advances in ubiquitous computing technologies have allowed the
implementation of smart home environments. Hardware (HW) embedded devices such as sensors, actuators, gateways, network devices, radio frequency chips, home appliances, etc. are interconnected and interacting with intelligent software (SW) to cooperatively collect environmental information about the state of the home and the activities and behavior of its inhabitants.
Sensors are a key enabler for smart homes. The rapid proliferation and adoption of sensors has made possible the development of smart environments that can assist people in their daily life. A smart environment exploits distributed and networked technology, but remains transparent to the inhabitants of the home. Based on sensor technology our homes are evolving towards ubiquitous computing, as homes become more and more dependent on computers, especially tiny devices with special purpose-designs to perform dedicated functions. This ubiquitous computing evolution contributes to our increasing dependence on digital information technology [1, 26] and the initiatives developed by industry in the creation of universal frameworks (e.g. The AllJoyn Framework) that enable products, systems, applications and services to simply and transparently share information and interoperate among them, independent of the manufacturer or operating system (OS) [27].
Figure 2.2 illustrates a typical smart home architecture. This architecture includes the elements listed in Table 2.3 [28].
Table 2.3: Smart Home Architecture
Elements Description
Sensors and meters Detect, monitor, and measure physical (temperature, humidity, etc.), chemical (carbon dioxide, nitrogen, etc.), electrical, and other properties.
Actuators Perform actions (For instances, if the temperature is too low then turn on the heating system).
Wireless sensor networks Consist of small embedded systems with a microprocessor, radio interface, and one or more sensors that communicate

10
Elements Description
using protocols for home automation (HA) such as KNX, Zigbee, Z-Wave, and DASH7 or through network communication protocols such as Wi-Fi, Bluetooth, 6LoWPAN, IEEE 802.15.4, or cellular telephony technology.
Home Gateway (HG) Located at the border of the home and it is the central point of connectivity from the home to external networks. The HG allows the home owner to control, manage, and monitor the home’s appliances and sensors no matter where they are [29]. For instances, the user can control the heating or cooling system. According to Abramowicz [28] there are some characteristics a smart HG should handle, specifically: (1) connectivity implies connections between the home’s local area network and the Internet – the HG allows the inhabitants to control the home’s connectivity with the outside world; (2) security functions (e.g. firewall, access control, and monitoring) that enable the home user to feel secure against treats coming from the Internet; (3) Quality of Services (QoS) to give preferential treatment to the user’s preferred traffic (e.g. for IPTV or VoIP traffic), remote management to enable remote operations and enhance the provisioning of managed services at home; (4) Software extendibility in order to deliver service in smart home environments as to integrate home devices into the service infrastructure. Therefore, the software platform running on the HG should be able to install, update, uninstall, and stop and start software modules; and (5) monitoring and diagnostics, the HG must provide monitoring and diagnostic tools.

F
2
inhqthhda
tethaFaowc[3
2
e
Figure 2.2:
2.3.1 HThe term
nterconnechome automquality of lihe inhabita
house. Fordesired temanimal pres
HA is anerms HA ahe objectiv
and qualityFor instancaccount theor not. But will come hcome home30].
2.3.2 SmAs stat
environmen
Typical
ome Autm home activity andmation. Thife, and comants of the
r instancesmperature sence is no
n importanand smart ve of both ty of life of ces, a house outside en
HA alone home or ade late ever
mart Meted in prents is to h
Smart Hom
tomationutomation
d control ohe interconmfort of ine home to cs, controlli
and autoot detected
nt factor inhome env
technologif the inhabe with HA nvironmenwould not
dapt to chry Monday
eters eviously (elp to ach
me Environ
n n (HA) refeof devices nnection o
nhabitants control varing heatin
omatically [30].
n a smart hvironment ies can be ubitants). H
A will turn ontal factorst be able to
hanges in ty), while a
(Section 2ieve energ
nment
ers to systwithin th
of househothrough th
rious functng and air
turning o
home enviare usuall
understoodHowever, th
on the air cs and wheto intelligenthe inhabita smart ho
2.2) one gy efficienc
tems or tece home to
old deviceshe provisiotions of the
r conditionoff the ligh
ronment, bly seen as d as the sahere are siconditioninther the inhntly forecatants’ routome enviro
of the aicy within t
chnologieso achieve s improveson of service devices w
ning to mghts when
but unfortsynonymo
ame (increaignificant dng system habitants a
ast what timtines (e.g. ronment w
ims of smthe home.
1
s that allowthe goal o
s the livingces to allowwithin theiaintain thhuman o
tunately thous becausase comfordifferencestaking int
are at homme the useinhabitant
would adap
mart homAs a resul
11
w of g, w ir
he or
he se rt s. to
me er ts pt
me lt
12
smart meter technology has become a fundamental part of smart home environments. Smart meters enable greater energy efficiency because they allow the utility company to learn the home’s real-time energy consumption (e.g., measurements of voltage, frequency, and phase angle) at a fine temporal granularity. This allows the utility company to distribute electricity more efficiently [31].
Using a smart meter architecture utility companies are capable of limiting energy consumption or even cutting energy off in order to encourage householders to adapt their energy consumption behavior, during for instance peak hours (by setting a high price). This would promote energy saving and awareness which in the long term might contribute to the reduction of carbon footprint*. Moreover, smart meters would facilitate utility companies providing feedback to the inhabitants about the most cost-efficient manner to use their household devices. By adjusting their behavior inhabitants would be able to reduce their energy costs [33].
In addition to all the benefits the home’s occupants gain from living in smart home environments, these environments also cause concerns for the users. Particularly, when the privacy and security of the personal data collect by sensors are unknown (or ignored). In most cases, the inhabitants are not fully aware of what information has been collected nor do they have control over the vast amounts of personal data that not only is being collected but also is increasingly being shared and utilized by third parties without the user’s consent. To exemplify, many resident of the municipality of Gävle in Sweden might not be aware that periodic tests for illegal drugs (e.g. cannabis, cocaine, ecstasies) are carried out by the government using the water flushed down toilets that goes in to the municipal wastewater treatment plants. This represents violations to individual’s privacy protection since residents expected that when they put their waste out, their privacy will be protected by the government [34].
2.4 Privacy Debates about privacy are not new topic and violations of privacy did not start
with the introduction of ICT. Privacy has been in people’s minds since the early 14th century with legal references about privacy being traced back to the “Justices of the Peace Act in 1361” in England, which set out sentences for peeping toms and eavesdroppers. Similarly, “The Castle Doctrine” in the 17th century was established as an English law by Sir Edward Coke who proclaimed that “an Englishman's home is his castle” meaning that a man can do as he pleases in his own house. He goes on to say “The house may be frail, its roof may shake, the wind may blow through it, the storm may enter, the rain may enter, but the King of England cannot enter, all his force dares not cross the threshold of the ruined tenement” [17].
During the 19th century Louis Brandeis and Samuel Warren wrote one of the most influential articles that legally frames the term ‘privacy’ as “the right to be let alone”. Brandeis and Warren were stimulated by the arrival of modern photographic films and the printing press, thus reporters or individuals could take pictures of people without their consent and distribute these pictures to the press
* By knowing our carbon footprint we can understand the impact we cause on the environment [32].

13
and tabloids. As a result, individuals should be protected from publications that reveal any details of their personal life that they would like to keep confidential [35]. Another influential book was Alan F. Westin’s book ‘Privacy and Freedom’. In this book Westin defined ‘privacy’ as “the claim of individuals, groups, or institutions to determine for themselves when, how, and to what extent information about them is communicated to others.” [36]
Despite, the concept of privacy and debates about privacy having been going on for so long, there is still not a general consensus of the definition of the term 'privacy' nor its implications. Westin states “no definition [of privacy] is possible, because [those] issues are fundamentally matters of values, interests, and power” [36].
Notions of privacy seem to come from different perspectives, particularly the sociological and legal. A discussion of privacy from the sociological perspective argues that a definition of privacy is not straightforward or static. It is not straightforward because one person’s idea of privacy is prone to be different from the definition of their friends or family members. The term ‘privacy’ means different things to different people [37]. Such a phenomenon also occurs when policymakers, specialists, practitioners, and scholars, from dissimilar theoretical backgrounds, struggle to define the term, its concerns, and its protection. Additionally, the definition of privacy is not static, because its definition will change over time and the scope will extend due to new social norms, individuals’ convictions, philosophical theories, religion, belief and attitudes, or new technologies being introduced [38].
Another approach to privacy in social sciences reflects on how individuals manage and interact with privacy with respect to other individuals by arguing that privacy is not just about establishing rules and imposing its fulfillment, but rather privacy is an ongoing process based on expectation in which disclosure and identity are negotiated among people in everyday life. Individuals expect to disclose information among each other, in order to retain or gain something, and they expect that this information is used in a particular way and not in another way [39].
The legal standpoint sees ‘privacy’ commonly from four aspects: (1) Territorial privacy which places limitation on unauthorized invasions into an environment such as a home, workplace, public space, and so on, of another individual. (2) Bodily privacy which protects individuals’ physical being against invasive procedures, for instance, an unjustified strip search, genetic testing, drug testing, or body cavity search. (3) Privacy of communications encompasses protection and security of telephone and mobile conversations, electronic and postal mail, and other means of communication. (4) Information Privacy set rules about the handling or the processing of personal data, emphasizing that individuals or organization have the right to decide how, when, and to what extend their personal information is communicated to others. The first three aspects generally have been covered in privacy legislation around the world for a long time, but with the advent of ubiquitous computing those seemingly long-solved privacy issues of territorial, bodily, and communication privacy have once again become highly relevant. Laws covering information have been always around, but with the progress of ICT, particularly the world wide web (WWW), legislation faces new challenges in trying

14
to include adequate measures to protect the security and personal data of individuals [17, 40].
2.5 Privacy in Ubiquitous Computing One of the most controversial issues discussed about ubiquitous computing is
privacy. For the end user there are several advantages and disadvantages of living in smart environments. On one side, ubicomp has the capability of radically changing, in a positive way, the safety, efficiency, and convenience of users (e.g., to help family members, doctors, or nurses to monitor elderly persons). However, ubicomp environments also introduce the potential for the misuse of the personal information produced by the system. Users indicate discomfort regarding the possibility for abuse and the absence of control, hence they desire privacy tools in ubicomp systems [41].
In ubicomp the essence of privacy encapsulates ‘not sharing information without the user’s consent’ [5]. Moreover, there are some properties of ubiquitous computing technology that create great concern among computer scientists and practitioners regarding privacy (see Table 2.4) [40]. Due to the properties described above and the proliferation of smart and invisible wireless networked computing devices, no single part of our life will escape digitalization. Langheinrich has stated:“Everything we say, do or even feel, could be digitized, stored and retrieve anytime later” [40]. Therefore, privacy legislation is necessary.
Table 2.4: Ubiquitous Computing Properties
Property Description Ubiquity The ubiquitous computing environment (consisting of computers, sensing-
devices, and infrastructure) will be widespread and present in every aspect of our daily life. Interconnected computers are being embedded in clothes, pets, people, buildings, home, automobiles, work environment, and so on.
Invisibility The computers, sensing devices, and infrastructure will not only be ubiquitous, but they will also be invisible to humans. As a result, users will unaware of whether they are interacting with computing or communication devices.
Sensing The miniaturization of computers and the increase in their computing power enables sensors to evolve to be more accurate and to cover a wide range of activities: monitoring environmental conditions – temperature, humidity, heat; physical conditions – heart rates, blood pressure; sensing the location, proximity, and presence of bodies; emotions – stress, excitement, fear; and so on.
Memory Amplification
With the progress in the field of video and speech processing, the low price of memory, and the high capacity of storage systems, it is possible to record every movement we make, thus enabling every aspect of our life to be searched.

15
2.6 Privacy Legislation Many governments and standardization bodies have studied the how personal
information is handled and collected. As a result, they have regulated these practices to assure that these practices are fair and provide adequate privacy protection to individuals.
The fundamentals of the current laws about privacy can be traced to The Fair Information Practice Principles (FIPPs) [4, 42] which is a broadly accepted framework, followed in the United States, Canada, and Europe, as well as by many international organizations. These principles have been identified as the basis for the European Union directive 95/46/EC and have provided input to legislation in many parts of the word [43]. Table 2.5 summarizes these principles.
Table 2.5: Fair Information Practice Principles (FIPPs) [35]
Principle Description Notice/Awareness Individuals should know what personal information is collected,
maintained, and used by specific entities. Choice and Consent Individuals should have the option to decide how their personal
information is collected, how it may be used, and under what circumstances it may be disclosed to third parties.
Access/Participation Individuals should have access to the data collected and should have the possibility to correct mistakes.
Integrity/Security The data collected should be accurate and secure. Entities should restrict or limit access to the data and ensure that this data is not utilized for unauthorized purposes. Entities should also implement mechanisms to prevent a breach of the integrity of this information.
Enforcement/Redress Each entity should have in place mechanisms to enforce respect for the privacy of each individual. This includes legislation that would create private remedies for consumers or regulatory schemes strengthen through civil and criminal sanctions.
Smart environments should be designed and developed to follow the above principles in order to mitigate, the inhabitant’s complete actions and behavior and daily living activities, being traced, linked together, and accessed by unauthorized parties.
A large corpus of research and design knowledge has resulted in proposed strategies, mechanisms, frameworks, and policies for addressing privacy in smart environments. Haddadi et al. propose an analytic privacy framework that allows queries of personal data without compromising privacy by “verifying query code, and then launching it into the user community to perform its measurement tasks, collect verifiable statistics, and finally perform aggregation and fuzzing while remaining within the community” [44]. Myles et al. suggest a privacy-preserving location sensing system which is a general framework to address privacy concerns by enabling users to apply policies to control the distribution of their information [45]. Arabo et al. proposes an identity management framework which allows users to have full control of their personal information [46]. Nevertheless, privacy in smart homes is still an open research issue and residents of smart home environments still find it hard to manage their privacy with the available tools [47].

16
2.7 User’s Concerns about Privacy The role ubicomp plays in our lives has been recognized as beneficial, but it also
causes some concerns for users, particularly about privacy matters [48]. Although users’ concerns about privacy in ubiquitous computing have been studied, none of these studies cover the holistic aspect of the technology. The existing studies mainly focus on particular key technology elements, such as RFID, LBS, Smart Meters, and The Internet. Table 2.6 summarizes existing studies of major privacy concerns. Common factors from these studies relate to access to the stored data – most importantly who will access it; the use of the data – how it will be used and in which context, and what the residents will gain or lose from reveling this data; and the sensitivity of the information – how sensitive the data is perceived to be [49].
Table 2.6: Summary of users' privacy concerns in the existing literature
Description Reference(s) Being Accessed. Access to personal information without users’ knowledge and consent.
[50], [51], [52]
Individual patterns. Determine users’ general behavior patterns from their devices’ usage.
[50], [52], [53], [54], [55]
Being Categorized. Lead to discrimination and profiling. [51], [54], [55] Real-time surveillance - tracking and tracing. Monitoring consumer behavior as it happens in real-time.
[50], [56]
Information dissemination and use. Selling pieces of information to third parties
[50], [51], [39] [54], [57]
Using a user’s personal information out of the context for which it was originally collected.
[54],
Information maintenance. Not knowing for how long the personal information will be stored and when it will be irreversibly destroyed.
[51]
Physical invasion. Being victimized by individuals with malicious intent, for example to know whether or not a person is home for purposes of burglary or assault.
[50], [54]
Errors. Concern about the protections against deliberate and accidental errors in personal information produced by smart devices.
[52]
Identity theft based upon personal information [58], [39], [54] Lack of knowledge about what kind and how much personal information is being collected (feedback).
[51], [53]
Lack of control about the personal information collected by the devices.
[53]
Concern to be/sign responsible for each intelligent device the users own due to these devices being uniquely identified and in the case of crime of malicious acts the identity associated with the devices could be traced back to the owner who is mainly concerned about the use of this information by law enforcement.
[51], [54]
In a smart environment, the sensing capabilities of the intelligent devices are not only monitoring various attributes of the environment, which are necessary to provide the desired smart functionality; they are also collecting private and sensitive information about the user. This information has caused increasing concerns about the invasion of the individuals’ privacy due to the possibility of the collected information being misused by external parties [5].

17
According to a report by Forrester, 97% of American consumers considered privacy matters their most pressing concern and 94% reported that they believe the benefits received for sharing their personal information do not compensate for their concerns [59]. A multi-national consumer privacy survey*, found that 78% of the respondents expressed that in the past, they have refused to provide information due to concerns about the misuse of their personal information [57]. A privacy survey by the Office of the Australian Information Commissioner concluded that 50% of the respondents normally provide incorrect personal data on purpose [60]. The same survey showed that 95% of the respondents are convinced that laws to protect personal information are necessary [60]. However, consumers are also aware that providing personal data can be worthwhile. The more detailed the information, the higher the quality of services that the users can get. As a result, users are willing to provide personal information, but only under certain conditions. Users will disclose their personal information if the benefits outweigh the risks that could occur if the information is misused [61].
According to Preibusch [55], concerns about privacy has emerged as a research topic in multiples disciplines (such as economics, law, and computer sciences). Despite there being a lot of work done to understand users’ attitudes and opinions towards privacy, most of the work has been done in an ad hoc manner, causing the results to be unreliable. Therefore, to conduct meaningful research about users’ privacy concerns requires the measurement instrument to be reliable. Preibush identified seven reliable scales to measure privacy concerns. Table 2.7 summarizes and describes these scales.
Table 2.7: Scales to measure users' privacy concerns [50]
Model Description The concern for information privacy model – CFIP by Smith, Milberg, and Burke [52]
This model consists of fifteen positive sentences on a seven-point scale by which responders express their level of agreement with each of the sentences. In this model, the privacy concerns were derived from a literature review and emerged as a latent variable form of privacy concerns.
The dimensional model for privacy concern proposed by Sheehan and Hoy [62]
This scale explores the framework proposed by Nguyen and Mynatt [47] and relates it to the FIPPs. It consists of fourteen privacy invasive scenarios that are presented to the responders who indicate their level of concern based on a seven-point scaled anchored by “not at all concerned” and “extremely concerned”.
The Internet users' information privacy concerns model – IUIPC by Malhotra, Kim, and Agarwal [63]
This scale uses the same methodology as proposed by Nguyen and Mynatt [47]. A detailed explanation of this model is given in Section 3.7, starting on page 31.
The instrument for measuring online privacy concern suggested by Buchanan, et al.[64]
This model is structurally different from the previous ones presented (meaning not based on the findings of Nguyen and Mynatt [47]). On a five-point scale ranging from “not at all” to “very much”, the authors ask responders about different aspect of privacy such as data misuse, misrepresentation and online fraud.
* IBM Multinational Consumer Privacy Survey.

18
Model Description The instrument for measuring privacy concern proposed by Earp, et al.[65]
This instrument uses the same methodology as Sheehan and Hoy [62] to measure responders’ concerns about privacy invasive practices by Websites in a five-point scale anchored by “strongly disagree” and “strongly agree”.
The two scales for privacy concern by Dinev and Hart [66]
This model uses the same methodology as Louis Harris & Associates, Inc. [57] based on the combination of two scales: (1) someone finding information about oneself and (2) abusing it. On a five-point scale, responders indicate their level of disagreement or agreement about the sentences.
The indirect measurement of privacy attitudes by Braunstein, Granka, and Staddon[67]
This model measures privacy concerns about the exposure of personal digital content and uses a ranking scale rather than a rating scale. In this model, privacy is seen as a moderating variable.
2.8 Market of personal information Direct marketing is a very lucrative industry. According to the Direct Marketing
Association (DMA) in 2012, US$168.5 billion was spent on direct marketing. This advertising investment generated about US$2.05 trillion in sales, which represented 8.7% of the total United States’ Gross Domestic Product (GDP). The DMA calculates that direct marketing provides a return of around US$11.73 per dollar invested in direct marketing, while non-direct marketing only generates a return of US$5.23 for each dollar invested [68]. With consumers’ personal information in their hands, marketers are able to increase the efficiency of their advertising by convincing and appealing to those prospects who are most likely to buy their services or products, and to create better promotion and reward programs that help to build customer loyalty [69]. To be able to use personal information marketers need to collect data from several sources and reuse the data collected for purposes other than the original purpose when the data was collected. Using consumers’ personal information is not a new practice. For decades, marketers have used consumer information to guide their marketing campaigns. However, the information used was based on generalized characteristics of a consumer group, market segment, or geographic region, rather than specific individual data such as name, address, lifestyle, interest, and purchase history [70].
According to Phelps et al. the use of individual specific data is the primary source of concern among consumers. Ubicomp technologies can collect real-time information about every aspect of our life [70]. The resulting DBs contain valuable personal information. Hence these DBs are a lucrative asset.
2.9 Managing Privacy in Ubicomp Managing privacy in ubiquitous computing environments is complex due to the
characteristics of the technology (which as we noted earlier was designed to be transparent and open – see Section 2.1.1). Additionally, the multidisciplinary aspects of privacy and the numerous different stakeholders involved, each one of them with different perception of privacy, add complexity to the design of privacy tools [71]. Researchers have proposed several models, methods, and techniques to

19
design privacy tools for ubicomp environments, such as: privacy mirrors [47], confab [72], pawS [73], and AdLoc [74].
Designing privacy tools following one these models would facilitate the inhabitants of smart home environments understanding how their personal information may be used by external parties and how their personal information participates in the information flow of the ubicomp system, to control their personal information, and to allow them to decide how and when the information can be disclosed and used by third parties. Designing ubicomp systems under these models will not provide perfect privacy*, but will allow the inhabitants of smart environments to make sense out of the ubiquitous computing world around them [47].
Traditionally, privacy tools were designed to hide, confuse, and control disclosure of personal information. Today there is a need for privacy tools that provoke awareness of the information security practices of a ubicomp system [76] and to enable users to manage the privacy of their personal information. Lederer et al. suggests that this situation occurs because the current design of ubicomp systems, which include SW and HW, inhibits users from understanding the privacy implications of sharing personal information [77]. Current systems do not provide users with any mechanism to control their personal information, to understand the tradeoffs between sharing personal information and privacy, or to provide users with intuitive tools that will allow them to understand how their personal information participates in or contributes to the flow of information in a ubicomp system [47].
Empowering privacy in smart home environments through privacy tools that provoke privacy awareness will permit inhabitants to limit the exposure of their personal information. If inhabitants perceive they have control over their personal information as generated in their own home, they will also perceive themselves as exercising their right to privacy [78]. Moreover, the design of such a privacy tool should be based on the inhabitants’ interests, needs, and concerns as they know best how their personal information should be handle [4].
* According to Gavison an individual enjoys perfect privacy when three elements are present. They are secrecy, anonymity, and solitude. In perfect privacy “no one has any information about X (secrecy), no one pays attention to X (anonymity) , and no one has physical access to X (solitude)”. Loss of privacy occurs “as others obtain information about an individual, pay attention to him, or gain access to him.” This means that perfect privacy only exists when a person is “completely inaccessible to others”. In this sense, the concept of privacy is better understood as a concern for restricting personal information accessibility [75].


3
uthfoourefoe
3
fiulidmtoa
F
3 Meth
The purused in thihe researchor this res
of the sampused in theliability aor the dat
evaluate us
3.1 ResFigure 3
irst step understanditerature r
design andmodel to mo identify
analyzed an
Figure 3.1:
hodolog
rpose of ths thesis. Sh paradigmearch. Secpling, sam
he survey. and validityta analysisers’ privac
search P3.1 shows was to r
ding of thereview resud methods.measure use
and undernd discusse
Research
y
his chapterSection 3.1m. Sectionction 3.4 d
mple size, taSection 3
y of the das. Finally,
cy concerns
Processthe steps eview the
e current sulted in Ch. This inclers’ privacyrstand usered. The foll
h Process
2
r is to provdescribes
n 3.3 focuseescribes tharget popu3.5 explainata collecte
Section 3s.
conductede relevant state of reshapter 2. Tludes the sy concernsrs’ privacylowing sec
21
vide an ovthe resear
es on the dhe survey pulation, anns the teced. Section3.7 describ
d in order literature
search in tThe next ssampling ss. Data wasy concerns.ction explai
verview of rch procesdata collecprocess, in
nd the devechniques un 3.6 describes the fra
to carry oe in ordethis area.
step was tostrategy ans collected. Finally, thins these st
the researss. Sectionction technncluding thelopment oused to evibes the mamework
out this reser to gain
The syntho define thnd the sel
d via a survhe collecte
steps in mo
rch metho 3.2 detail
niques usehe selectioof the scalvaluate th
method useselected t
search. Thn a deepehesis of thihe researchlection of vey in ordeed data waore detail.
d ls d n le
he d
to
he er is h a
er as

22
3.2 Research Paradigm According to Hevner et al. there are mainly two paradigms for research in the
field of Information Systems: design-science and behavioral-science [79]. According to the design-science paradigm researchers approach their research by building innovative artifacts or by analyzing the performance or use of artifacts in order to understand or enhance aspects of the information system. According to the behavioral-science paradigm the information technology (IT) artifacts implemented are themselves the object of study by seeking theories that illustrate, explain, or predict the phenomena of interest [79]. The chosen research paradigm for this thesis is the behavioral-science approach since our study tries to understand users’ privacy concerns in smart home environments, rather than create a new artifact.
After selecting the research paradigm, the next step was to determine the research design and methodology. In a scientific study, all the components should perfectly fit into the whole. To achieve this goal, the researcher needs to prepare a strategy for conducting the study, i.e., the research design. A research design includes the methods and procedures used to collect and analyze information in a research effort including how, when, and where the data will be collected [80]. This research design is the blueprint for conducting the study.
A research design can be classified in several ways, but in general terms there are three major types (shown in Figure 3.2) [81]. An exploratory research design goal is to provide a better understanding of a situation for the purpose of discovering ideas or providing insights. This exploratory research design can be applied to a small group of people who were not randomly selected to participate. Unfortunately, the results of this research cannot be generalized to the population at large. A descriptive research design’s goal is to identify the characteristics of an observable phenomenon in order to discover the frequency with which something occurs and to examine correlations among entities or variables. This research provides data about the universe being studied. On the other hand, casual research design’s goal is to examine cause-and-effect relationships through experiments. This type of research is appropriate to determine which variables are the cause of a phenomenon – “If X then Y” [82, 83].

F
wcmstpTacinpmd
qppbthlemdteuc
Figure 3.2:
An impowhat methoan study
methodologtudies. Qu
procedures These standand validitycounting anstead on
participantsmethods indiscourse a
Due to tquantitativprivacy conplay for thbased survehis framewevel of pri
might percdiscussed toechnology.
understandconcerns.
Type of
ortant deciodology thas well a
gy choicesuantitative in which ndardized my of the stund statisti
n discovers in their
ncluding canalysis, an
the natureve researchncerns as we users ofey was conwork we iivacy concceive in a o serve as . The aim
ding of pri
research d
ision followhe study was the rans usually
research numerical
measuremeudy [85]. Qical techniing and unatural se
ase studiesnd so on [8
of this theh, since wewell as the f ubiquitounducted badentified i
cerns, risksmart ho
guidelinesis to help
ivacy in s
esign and t
wing the swill use. Senge of pos
are betweis the fordata is use
ent and samQualitative
iques are understanetting. Ths, content
86].
esis projece are intere
role perceus technolsed on theinhabitant
k, trust, inome envirs for designp designersmart envi
the structur
election oflecting a m
ssible resueen qualitmal use oed to obtaimpling proresearch isnot the p
ding the ere are a analysis,
ct the appresting in gaeived risk, ogy. To ac
e IUIPC thets’ privacy
ntention, aronment. Tners and ses and servironments
re of the pr
f the researmethodologlts and coative or q
of systematin informaocedures ins a researchprimordial
experiencvariety ofinterviews
oach that aining greatrust, intenchieve thiseoretical fr
concerns nd usefulnThe resultervices provices provi
based on
roblem
rch designgy dictatesonclusionsquantitativ
atic and soation aboutncrease thh methodol focus. Thces and thf qualitativs, ethnome
fit best is ater insightntion, ands an experramework
and deterness that ts of the
oviders of siders to ga
n inhabitan
2
n is to knows “what w
s” [84]. Thve researchophisticatet the worlde reliabilit
ology wherhe focus ihoughts ove researchethodology
explorativt into users
d usefulnesrt scenario[63]. Usinrmined thinhabitantsurvey ar
smart homain a bettents’ privac
23
w we he
h d
d. ty re is of h y,
ve s’ ss o-ng he ts re
me er cy
24
3.3 Data Collection In this study, there are two basic sources of data. First, the secondary sources of
data which include documents such as journals, books, conference, articles, reports, and publications. Second, the primary sources of data which include the results of the survey. From the results of the survey a set of conclusions were drawn. A description of each of these methods is described in the following subsections.
3.3.1 Literature Review Before conducting the survey, a comprehensive literature review was
undertaken. An overview of the literature review process is shown in Figure 3.3. The first step in our literature review process was to define the problem and goal of this thesis project. This step helped us to identify the areas to be covered in this study. The main areas identified were smart home environments, ubiquitous computing, and information privacy concerns. The second step involved searching for relevant documents to support our study. In this step the search terms and databases were determined. The terms smart home, smart home environments, ubiquitous computing, ubicomp, pervasive computing, home automation, context-awareness, privacy personal information, privacy enhancing tools, privacy legislation, information disclosure, users’ concerns, and measuring privacy concerns were rearrange and combined with Boolean operators to retrieve documents from scientific DBs. These DBs included ACM Digital Library, IEEE Xplore*, JSTOR, ScienceDirect, GoogleScholar, and SpringerLink. The third step involved the compilation, storage, and management of the documents retrieved following each DB query. The forth step consisted of reviewing, analyzing the material selected, and discarding irrelevant documents. The final step was to synthesize the findings - resulting in Chapter 2.
* IEEE Xplore is IEEE’s Digital Library service.

F
3
wccbasmbinin
bcuq
3
Pis
Figure 3.3:
3.3.2 ScThis stu
we are intecurrent staconcerns. Wbetween vaand intrusimart hom
beliefs, pernformationnfer these u
Survey based on oconcerns wus a coherquestionna
3.4 TheTo carry
Professor os shown in
Literatu
cenario-udy adoptederested in ate of affaiWe are alsariables (coon) and th
me), as welrceived usn. Since thuser’s conc
questions our study
with a reliabent picturire is inclu
e surveyy out the s
of Applied Sn Figure 3.4
ure review p
-based sud an expergaining a rs regardin
so interesteontrol, aw
he socio-tecll as how efulness aere are fewcerns by su
were adapcontext. T
ble instrume of priva
uded in App
y Processcenario-baStatistics a4.
process
urvey rt scenario-
compreheng what ined in und
wareness, uchnical conthese con
and behavw actual usurveying ex
pted fromThis ques
ment, in thacy concernpendix A.
ss ased surve
at Napier U
-based surensive andnhabitantserstanding
unauthorizntext of th
ncerns inflvioral intensers of suchxperts.
previous stionnairehis case thens at the
ey the procUniversity
vey as oned detailed us think abog the quanzed secondhe relations
uence usention wheh environm
studies [6allows us
e IUIPC fraindividual
cess sugge[89] was f
e of its straunderstanout privacyntitative redary use, sships (in thers’ trust ben releasinment, we at
63, 87] an to measu
amework [l level. Th
ested by Gifollowed. T
2
tegies sincding of thy and thei
elationshipsurveillanchis case thbeliefs, risng personattempted t
nd modifieure privac88], to giv
he complet
illian RaabThis proces
25
ce he ir
ps ce he
k al to
d cy ve te
b, ss

2
F
3
pcchkpwp
su
T
C
P
Q
S
6
Figure 3.4:
3.4.1 SaWhen d
probabilistcriteria muchance of bknown for previous crwas chosenparticular s
There aummarize
Table 3.1:
Type ofConvenience
Purposive sa
Quota sampl
Snowball sam
Survey P
ampling designing ttic or non-pust be fulfibeing selec
each selecriteria cannn because sample bas
are four ms and desc
Type no
f Samplinge sampling
ampling
ling
mpling
Process
this study aprobabilislled: (1) ea
cted (randocted membnot be fulfiit was not
sed on pure
main typeribes these
n-probabil
g In thchosIn thpopupopuThis numIn thbasereseathe qThis poputhe swho targe
a decisionstic sampliach membom selectio
mber. Non-filled. In tht possible e chance (r
es of non-e four type
lity samplin
his samplinsen based onhis samplinulation basulation of in
sampling mber of peop
his samplind on quotasarchers whoquota.
samplingulations, whstudy; and u
they considet populatio
needed toing. To utier of the pon) and (2probabilist
his thesis, tto calcula
random sel
-probabilises.
ng
ng methodn their easy ng method, sed on thenterest and/technique
ple that haveng method, s (e.g., 75% o are free to
g method ho have the using these der have thon.
o be made lize probapopulation2) the probtic samplinthe non-prate the prolection) [8
stic samp
Descriptiod, the mem
access (conthe resear
e presump/or meet this usually
e expertise imembers omale and 2
o choose an
involves characterismembers to
he desired q
as to wheabilistic samn must havbability of ng is usedrobabilistiobability o2].
pling [82].
on mbers of thnvenience). rcher selectption that he specific n
used whenin the area bof the popu
25% female)ny members
locating mstics/qualifio identify adqualification
ether to usmpling twve an equaselection i
d when thc techniquof getting
. Table 3.
he populat
ts membersthey repre
needs of then there is being reseaulation are ) establisheds as long as
members ications needditional mns to belong
se wo al is
he ue
a
.1
ion are
s of the esent a e study. limited
arched. chosen
d by the they fit
of the eded for
members g to the

27
Due to the fact that we had access to a specific group of individuals working
with key technologies that enable ubicomp, the sampling technique selected for this study was purposive sampling a non-probabilistic sampling technique. This sampling technique was chosen based upon our access to experts working in ubicomp as we considered they would be the most appropriate participants for this study. In this case members were selected based on their area of expertise and experience living in and working with smart environments [82]. By using this sampling technique we aimed to have a good basis for our research.
3.4.2 Sample Size As mentioned previously non-probabilistic sampling does not rely on statistical
calculations to estimate the sample size, rather it uses a pragmatic approach. This approach generally involves a small sample size – based on the good judgment of the researcher and what he or she considers will be sufficiently for the survey given the available resources (e.g., time, money, access to the population being studied, etc). According to Denscombe [82] this size should not be fewer than 30 people, in order the calculations executed on this research reflect the level of accuracy of larger samples.
3.4.3 Target Population To perform studies relevant information must be collected. In the process of
collecting the data, one of the important steps is to select the population for the study. The population of a study can be defined as all the set of items in the category of interest that are being researched [82]. Items indicate the organizations, people, objects, devices, etc. from which information would be collected. In this thesis project the selection of the target population was done taking into account the exploratory purposes of the research. Hence, the researcher looked for individuals who are knowledgeable or have experience in the area of study [82], rather than studying individuals who are currently living in smart home environments because such individuals were unavailable. Therefore, the selection criteria were set as:
All the participants should have experiencing working with at least one of the following technologies: Context Awareness, HA, Auto-ID, Location Base Technology, Sensor Technology, Smart Meters, or Smart Home Environment Technology.
Experience in one of the above technologies was a criteria because these technologies form key elements to enable ubicomp or smart environments (as stated in Sections 2.1). Additionally, participation was voluntary and anonymous.
3.4.4 Scale Development For accurate data results an appropriate scale is necessary. A seven-point Likert
scale ranging from strongly disagree (1) to strongly agree (7) was used to ask the respondents their level of agreement or disagreement with each of the proposed statements. Table 3.2 presents the set of question used to measure each privacy concern. Section 3.7 explains in detail each item measured.

28
Table 3.2: Scale development
Items Number of questions per item measured
Related Questions (number)*
Unauthorized Secondary uses (UN) 3 1, 2, 3 Control (CL) 3 4, 5, 6
Awareness (AW) 4 7, 8, 9, 10 Surveillance (SUR) 2 11, 12
Intrusion (INT) 3 13, 14, 15 Trust & Belief (TR) 3 16, 17, 18
Risk-Thresholds (RI) 2 19, 20 Perceived-Usefulness (US) 3 21, 22, 23 Perceived-Intention (ITE) 1 24
* A description of each question is given in Appendix A.
3.4.5 Survey Administration The survey was conducted as an Internet based survey. This survey was
developed using the online web based tool Survey Gizmo (http://www.surveygizmo.com/), in which a link with the questionnaire was distributed via email to the sample population; in this case practitioners and experts at the Swedish Institute of Computer Science (SICS) and at a major telecommunications company. All of these potential participants had experience in one or more of the technologies mentioned in section 3.4.3.
Data collection started on October 18, 2013 and finished on November 18, 2013. The rate of response to the survey was 75% – with 30 out of 40 individuals participating. This high rate of participating might be because the author of this thesis had close collaboration with the target experts.
3.5 Measurements In order to provide high quality outcomes the survey results must be
demonstrated to be conclusively reliable and valid. This is achieved by ensuring that the scale used in the survey measures the intended construct* consistently and precisely (for reliability) and by ensuring that the scale measures the right construct (for validity) [91]. These points will be examined in the following two subsections.
3.5.1 Reliability To be reliable, the results of the survey should be consistent. In other words, a
reliable survey would produce the same results if several measurements are taken over time [92]. To determine if the results of our survey were reliable and to measure how closely each question was related to other questions in their group as well as to assess whether each item of our questionnaire manifests the same result as the entire survey questionnaire, Cronbach’s α score was chosen. According to Nunnally [93] the measured value of each item of the questionnaire should have an * In scientific research a construct is a theoretical concept used to explain a given aspect. For instance, a person’s communication skill which might involve underlying concepts such as the person’s vocabulary, syntax, and spelling, is considered a construct [90].

29
α score between zero and one. The higher the value of α the more reliable the construct is. Cronbach’s α equal or above 0.5 can be considered reliable, but it will depend upon the type of research (e.g., in clinical applications a higher level of α, such as 0.95, is desirable).
3.5.2 Validity To ensure that each question of the survey assesses what it was intended to
measure, validity needs to be calculated. There are several approaches to assess validity. According to Bhattacherjee [90], validity should be assessed using theoretical and empirical approaches. Therefore, in this research validity was evaluated in terms of content validity and convergent validity.
Content validity is an evaluation of how well the measurement scale matches the content domain of the construct that it is trying to assess [90]. This is not done by quantified statistical methods, but rather individuals chosen by convenience assess the validity of the construct based on their judgment. Since we want to ensure that our questions fully represent the domain of study, two professionals at SICS, who have a solid background in ubiquitous computing environments and privacy, reviewed the survey questionnaire. After their feedback some of the questions were modified in order to reduce the ambiguity of the question. The modified questions are marked with an asterisk (*) in Appendix A.
Convergent validity refers to how much the measure is related to the construct that it intends to measure [90]. For convergent validity, the collected data was inspected using factor analysis techniques, varimax as the factor rotation, and principal components analysis (PCA) as the extraction method. By selecting the universally used varimax and PCA we were able to examine the relationship among the correlated variables, obtain a clear pattern of the loading, and reduce the variable observed into components that account for the most of the variance in the observed variables thus providing us a simple representation of the data collected [94]. Nine factors were tested in this study with a 24 scale loading as shown in Table 3.3 on page 34.
According to Hair et al. in order to assess the suitability of the data collected in the survey and consider PCA as a valid statistical method for research certain requirements should be fulfilled [95]:
• The correlation matrix should have at least two coefficients markings with the minimum loading. A rule of thumb proposed by Hair et al. [95] suggest these loadings values should be over ±0.30 for minimum, ±0.40 for important, and ±0.50 for significant correlations. Markings with a factor of 0.3 indicate that the variable accounts for 30% of the relationship with the data.
• The Kaiser-Meyer-Olkin (KMO) index should be equal to or above 0.5. If below the threshold, then an Anti-Image Correlation Matrix analysis would be required. The Anti-Image Correlation Matrix will show us the Measure of Sampling Adequacy (MSA) for each individual variable. Those variables with KMO below 0.5 should be discarded from further analysis. The calculation of MSAs suggests the level of the strength of the relationship among the variables in the model.

30
• The calculated ρ value of the Bartlett's Test of Sphericity (Sig) should be less than 0.001. This indicates that the responses collected are valid and appropriated to the problem addressed in the survey.
Moreover, according Hair et al. in order to use factor analysis techniques it is essential to know how many factors are needed to be extracted. Several different extraction rules and approaches could be combined to assist researchers to decide how many factors to keep. For instance, the cumulative percent of variance extracted, Kaiser’s criteria (an eigenvalue above to 1), the Scree Test, and parallel analysis. The rules used and their combination is a decision that must be made by the researcher.
3.6 Data Analysis This section describes the data analysis techniques and software tool used in
this research to analysis the survey results.
3.6.1 Data Analysis Technique Linear regression analysis was used to analyze the data collected and to
understand the relationship among the clustered observed variables suggested in the IUIPC. By using linear regression the overall regression relationship between the dependent variable and the independent variables should be less or equal to the level of significance (ρ ≤ 0.10) in order to support an existing relationship among the variables. A correlation relationship below 0.20 indicates a very weak relationship, between 0.20 and 0.40 indicates a weak relationship, between 0.40 and 0.60 indicates a moderate relationship, between 0.60 and 0.80 indicates a strong relationship, and above 0.80 a very strong relationship [95].
It is important to highlight that in [63] – the authors of the IUIPC framework – used the Structural Equation Technique (SEM) to analyze the data collected. However, due to the sample size constraints of this study, linear regression analysis was chosen based on the recommendation of Gefen, Straub, and Boudreau [96]. SEM techniques require a large sample size (n ≥ 100) while linear regression requires an smaller sample size (n ≥ 30). Moreover, the selected technique supports the type of research selected for this thesis, i.e., an exploratory one [96].
Additionally, PCA with varimax rotation was used to have a more comprehensive feeling of the five privacy concerns studied in this research. To fulfill the requirements that PCA is a valid statistical method we also followed the steps presented in Section 3.5.2. The resulting correlation matrix and factor loading present the inter-correlation among the concerns studied. This approach helps researchers to detected variables with similar characteristics and group them for further analysis.
3.6.2 Software Tool Cronbach’s α score, PCA, and linear regression analysis are calculated using the
SPSS statistical software.

31
3.7 Internet Users’ Information Privacy Concerns (IUIPC) Framework
As mentioned previously, the questions used in this survey were developed mainly based on the IUIPC model. This model was selected because it is one of the most reliable scales developed to measure users’ privacy concerns at the individual level [88]. As a reliable instrument this framework has previously been slightly modified and applied in several different contexts (for instance, e-commerce [97], cloud-computing [98], mobile payments [87], Internet of Things [99], LBS [100], and social media [101]).
According to Malhotra, Kim, and Agarwa [63] concerns about the privacy of personal information is a very subjective issue - as individuals have different opinions about the collection of personal information and the use of this information. To address this matter, Malhotra, Kim, and Agarwa [63] drew upon social contract theory (SC)* and the CFIP scale [52] to develop a multidimensional scale aiming to capture individuals’ concerns about organizational information privacy practices. The proposed model consists of three factors: collection of personal information, control over the collected personal information, and awareness of how the collected information is used. These three factors are expected to affected users’ trust beliefs, risk beliefs, and perceived intention when releasing personal information at the request of an organization.
In addition to Malhotra, Kim, and Agarwa other practitioners and researchers have pointed out that when applying this framework “the dimensionality is neither absolute nor static, since perceptions of advocates, consumers, and scholars could shift over time” [63]. This implies that applications of the IUIPC should be reinvestigated as new technology emerges. Therefore, in order to apply the framework to the area of smart home environments two dimensionalities (Intrusion and Surveillance) were added to IUIPC model in order to cover all the privacy concerns identified in the literature review (see Section 2.7). Figure 3.5 illustrates the matching of these concerns into the modified framework.
* Social contract theory (SC) is grounded in philosophy and classical writings. In essence SC argues that “humans, acting rationally, consent to the terms of some particular societal agreement”. As result, SC has been used to studied perceptions of fairness and justice and has been applied to understand the relationship among consumers and organizations as well as to explain consumer behavior in the context of information privacy [63].

3
F
3
C
A
* inha be
2
Figure 3.5:
3.7.1 IUThe IUI
Control (CL
Awareness
In this conte
nvolved) is conave an impactperson, the pelieves that th
Privacy
UIPC FacPC factors
L) CctihfAwml
(AW) Atpapihh
ext fairness innducted fairlyt on the fairneerson would b
he procedures
Concerns a
ctors are:
CL is a ncontext of to manageinformatiohandle thfundamentAccording worried abmaking polack of suchAW is a nato Malhotrprivacy refabout his/hpractices. Tinformatiohigher the higher the
ndicates the py. According toess perceptionbe less likely tused to produ
and its dim
native consthis study,
e the releaon [102]. Bheir perstal in thto Malhot
bout data cower over h control inative constra, Kim, anfers to the her awarenThis includ
on and thedegree of perception
perception pero Lind and Tyn of persons. Eto be discontenuce those effec
mensionaliti
struct in , control isase and decause peosonal infhe contextra, Kim, acollection wthe informncreases utruct in thnd Agarwadegree to
ness of orgdes issues oe disclosurawareness
n of fairnes
rsons have thyler [103] factoEven when thented with the cts/consequen
ies
the IUIPCs the users’isseminatiople want formation,xt of infand Agarwwhen they mation collusers’ privahe IUIPC fral [63] awawhich a coanizationaof transparre of specis perceivedss*.
hat a peculiarors such as “coe effects/consenegative effecces were cond
C framewo’ belief in tion of theto have th
, controlformationa
wal [63] usehave somelected. Con
acy concernrameworkareness in onsumer isal informatrency and ific inform
d by the co
r activity (in wontrol over acequences are cts/consequenducted in a fair
ork. In ththeir abilitir persona
he ability tbecome
al privacyers are lese decisionsnsequentlyns. . Accordinthe field o
s concernetion privacproprietar
mation. Thnsumer th
which they arctual outcomesnot positive fo
nces if he or shrly way.
he ty al to es y. ss s-y,
ng of d
cy ry he he
re s” or he
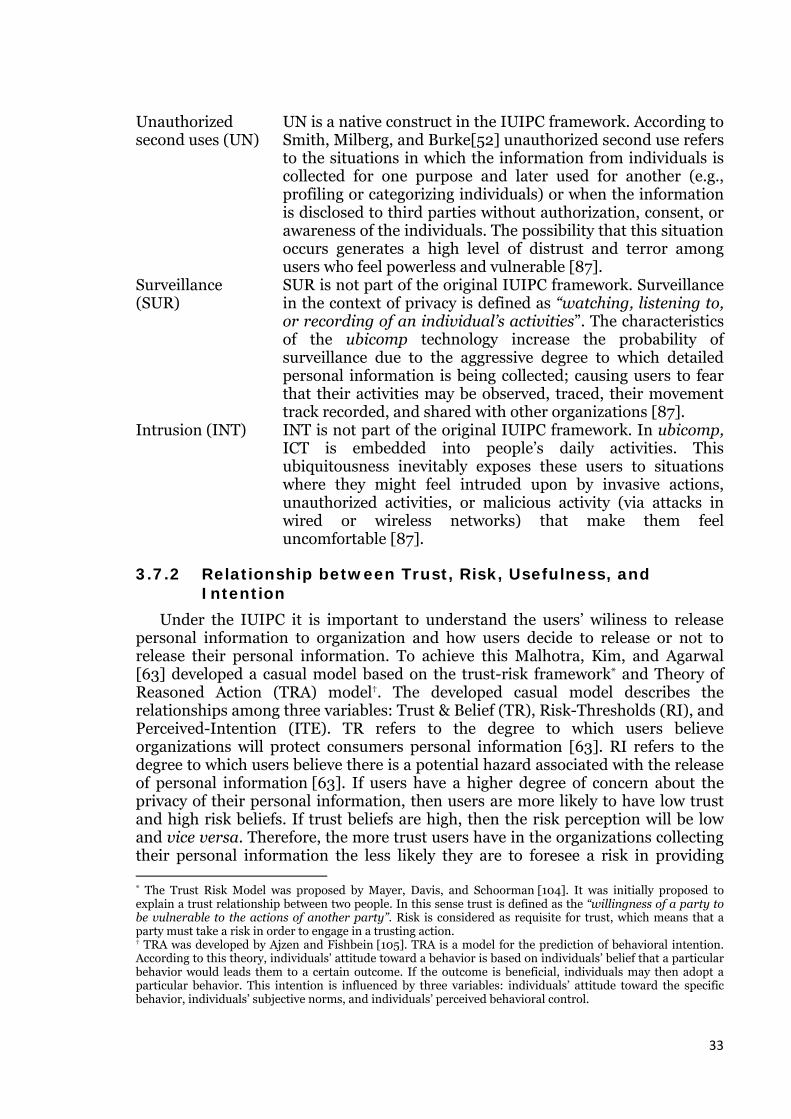
33
Unauthorized second uses (UN)
UN is a native construct in the IUIPC framework. According to Smith, Milberg, and Burke[52] unauthorized second use refers to the situations in which the information from individuals is collected for one purpose and later used for another (e.g., profiling or categorizing individuals) or when the information is disclosed to third parties without authorization, consent, or awareness of the individuals. The possibility that this situation occurs generates a high level of distrust and terror among users who feel powerless and vulnerable [87].
Surveillance (SUR)
SUR is not part of the original IUIPC framework. Surveillance in the context of privacy is defined as “watching, listening to, or recording of an individual’s activities”. The characteristics of the ubicomp technology increase the probability of surveillance due to the aggressive degree to which detailed personal information is being collected; causing users to fear that their activities may be observed, traced, their movement track recorded, and shared with other organizations [87].
Intrusion (INT) INT is not part of the original IUIPC framework. In ubicomp, ICT is embedded into people’s daily activities. This ubiquitousness inevitably exposes these users to situations where they might feel intruded upon by invasive actions, unauthorized activities, or malicious activity (via attacks in wired or wireless networks) that make them feel uncomfortable [87].
3.7.2 Relationship between Trust, Risk, Usefulness, and Intention
Under the IUIPC it is important to understand the users’ wiliness to release personal information to organization and how users decide to release or not to release their personal information. To achieve this Malhotra, Kim, and Agarwal [63] developed a casual model based on the trust-risk framework* and Theory of Reasoned Action (TRA) model†. The developed casual model describes the relationships among three variables: Trust & Belief (TR), Risk-Thresholds (RI), and Perceived-Intention (ITE). TR refers to the degree to which users believe organizations will protect consumers personal information [63]. RI refers to the degree to which users believe there is a potential hazard associated with the release of personal information [63]. If users have a higher degree of concern about the privacy of their personal information, then users are more likely to have low trust and high risk beliefs. If trust beliefs are high, then the risk perception will be low and vice versa. Therefore, the more trust users have in the organizations collecting their personal information the less likely they are to foresee a risk in providing * The Trust Risk Model was proposed by Mayer, Davis, and Schoorman [104]. It was initially proposed to explain a trust relationship between two people. In this sense trust is defined as the “willingness of a party to be vulnerable to the actions of another party”. Risk is considered as requisite for trust, which means that a party must take a risk in order to engage in a trusting action. † TRA was developed by Ajzen and Fishbein [105]. TRA is a model for the prediction of behavioral intention. According to this theory, individuals’ attitude toward a behavior is based on individuals’ belief that a particular behavior would leads them to a certain outcome. If the outcome is beneficial, individuals may then adopt a particular behavior. This intention is influenced by three variables: individuals’ attitude toward the specific behavior, individuals’ subjective norms, and individuals’ perceived behavioral control.

34
personal information. ITE refers to those factors that influence the users’ behavior [63]. These factors “are indications of how hard people are willing to try, of how much of an effort they are planning to exert, in order to perform the behavior” [105]. Therefore, TR and RI will influence the user’s intention to use services associated with the release of personal information. The justification for the existence of this relationship is established by the fact that users will not provide their personal information for a particular service unless they intend to use that service.
Perceived-Usefulness is defined as the degree to which users believes that using a particular system would enhance their job performance and the quality of their life [106]. The original IUIPC model does not include perceived-usefulness, but we adopted it from the Technology Acceptance Model (TAM)* because usefulness gives a strong basis to explain intention and because one of the main goals of smart homes environments is to increase the quality of life of its inhabitants. Therefore, usefulness was added to our model in order to explain in more detail the intention of users when opting to accept living in smart home environments. Table 3.3 presents all the factors measured and references to the related literature.
Table 3.3: Factors and sources
Construct No. of Items
Related Literature
Unauthorized Secondary uses (UN)
3 [52, 63]
Control (CL) 3 [63] Awareness (AW) 4 [63]
Surveillance (SUR) 2 [87] Intrusion (INT) 3 [87]
Trust & Belief (TR) 3 [63] Risk-Thresholds (RI) 2 [63]
Perceived-Usefulness (US) 3 [106] Behavioral-Intention (ITE) 1 [63]
Figure 3.6 presents an overview of the modified framework and the relationships between the factors.
* Technology Acceptance Model – TAM was developed by Davis, Bagozzi, and Warshaw [106] adopted from TRA model. The goal of TAM is to model and provide explanation how users come to accept and use a technology. It also helps to identify the modifications need to be implemented or changed in the information system in order to make it acceptable to users. According to the TAM model there are two main factors that influence the acceptability of a system by the user: perceived usefulness and perceived ease of use.
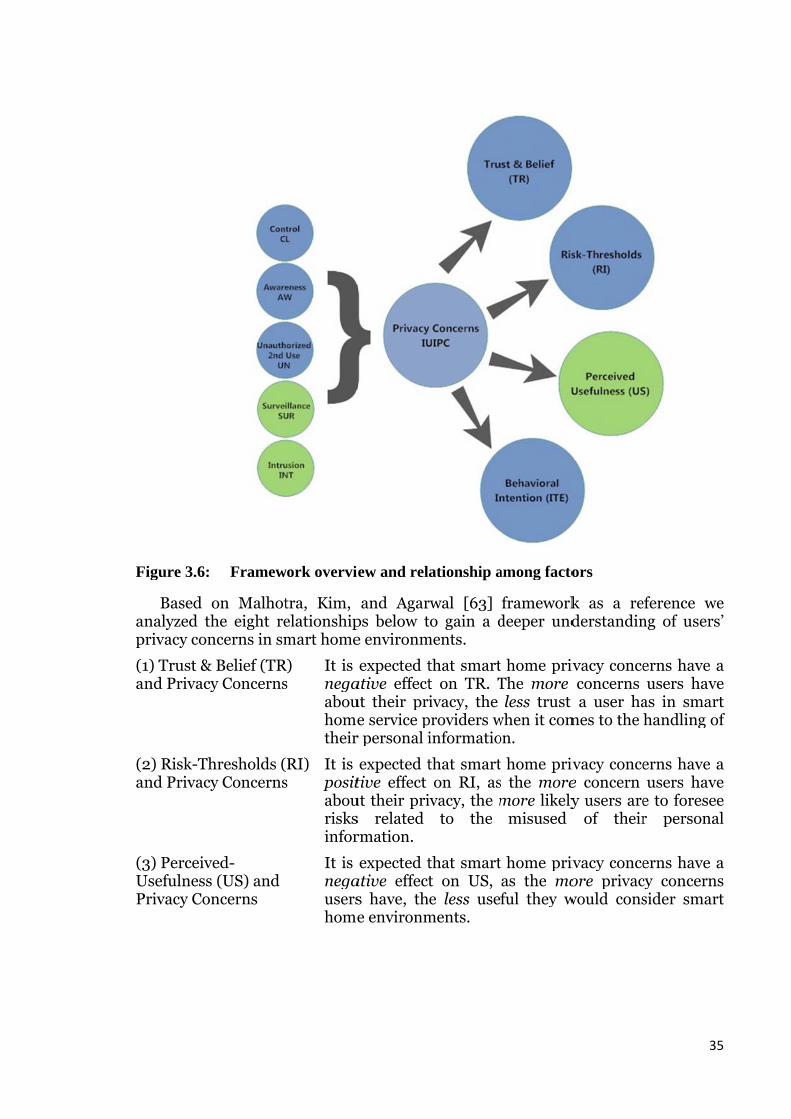
F
ap
(1a
(2a
(3UP
Figure 3.6:
Based oanalyzed thprivacy con
1) Trust & and Privacy
2) Risk-Thand Privacy
3) PerceiveUsefulness Privacy Con
Framew
on Malhothe eight rencerns in sm
Belief (TRy Concerns
hresholds (y Concerns
ed-(US) and
ncerns
work overvi
tra, Kim, elationshipmart home
R) s
It is negaabouhometheir
RI) s
It is positabourisksinfor
It is negausershome
ew and rel
and Agarps below te environm
expected tative effectut their prie service p
r personal i
expected ttive effect ut their pris related rmation.
expected tative effects have, the environm
ationship a
rwal [63]to gain a d
ments.
that smartt on TR. Tivacy, the
providers winformatio
that smarton RI, as
ivacy, the mto the
that smartt on US, e less use
ments.
among facto
frameworkdeeper und
t home privThe more less trust
when it comon.
t home privs the moremore likely
misused
t home privas the moful they w
ors
k as a rederstandin
ivacy conceconcerns a user ha
mes to the
ivacy concee concern y users are
of their
ivacy conceore privac
would cons
3
eference wng of users
erns have users hav
as in smarhandling o
erns have users hav
e to foreser persona
erns have cy concernsider smar
35
we s’
a ve rt of
a ve ee al
a ns rt
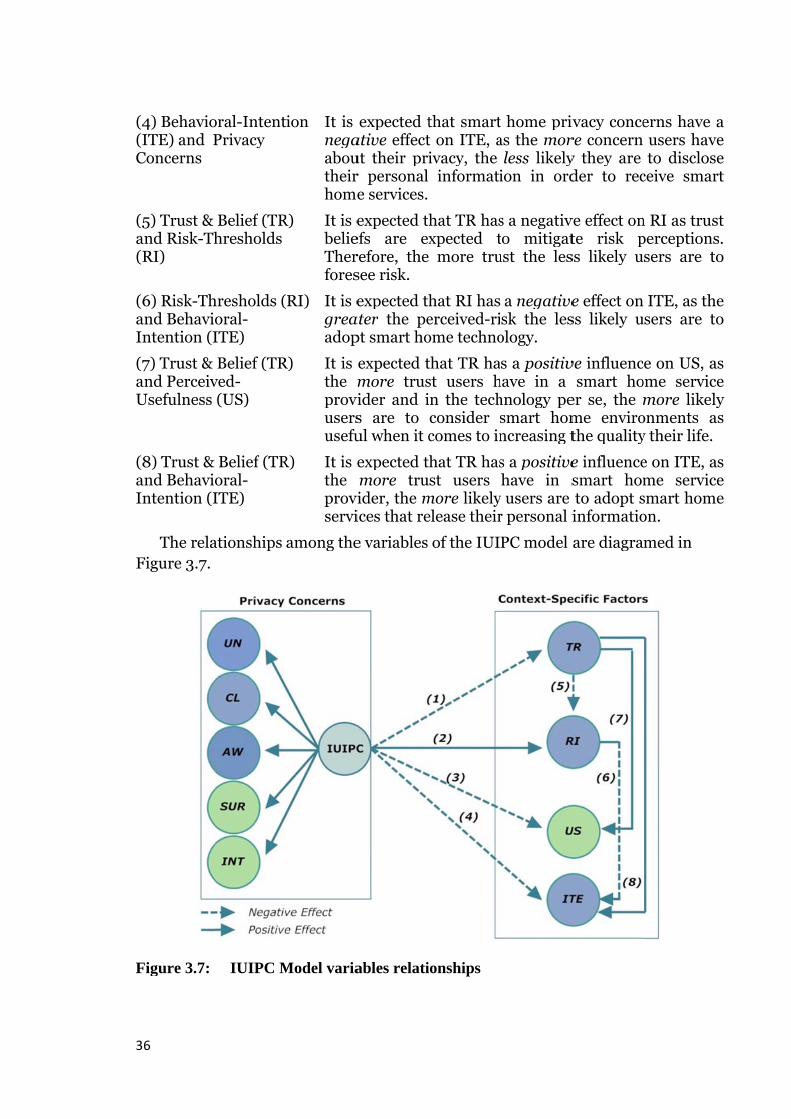
3
(4(IC
(5a(R
(6aIn
(7aU
(8aIn
F
F
6
4) BehavioITE) and P
Concerns
5) Trust & and Risk-ThRI)
6) Risk-Thand Behavintention (I
7) Trust & and PerceivUsefulness
8) Trust & and Behavintention (I
The relaFigure 3.7.
Figure 3.7:
oral-IntentPrivacy
Belief (TRhresholds
hresholds (oral-ITE)
Belief (TRved-(US)
Belief (TRoral-ITE)
ationships
IUIPC M
ion It is negaaboutheirhome
R) It is ebelieTherfores
RI) It is egreaadop
R) It is the mproviusersusefu
R) It is ethe proviservi
among the
Model varia
expected tative effectut their prir personal e services.
expected thefs are exrefore, thesee risk.
expected thater the pept smart ho
expected tmore trusider and is are to ul when it c
expected thmore truider, the mices that re
e variables
ables relati
that smartt on ITE, aivacy, the
informati
hat TR hasxpected t
more tru
hat RI haserceived-riome techno
that TR hast users hn the techconsider scomes to in
hat TR hasst users
more likelyelease their
of the IUI
ionships
t home privas the mor
less likelyion in ord
s a negativto mitigatust the les
a negativesk the les
ology.
s a positivhave in a hnology pesmart homncreasing t
s a positivehave in s
y users are r personal i
PC model
ivacy concere concern y they are der to rec
ve effect onte risk pss likely u
e effect onss likely u
ve influencsmart ho
er se, the mme envirothe quality
e influencesmart homto adopt sinformatio
are diagra
erns have users havto disclos
ceive smar
n RI as trusperceptionssers are t
ITE, as thusers are t
ce on US, aome servicmore likel
onments ay their life.
e on ITE, ame servicsmart homon.
med in
a ve se rt
st s. to
he to
as ce ly as
as ce
me

37
4 Analysis In this chapter, we present the survey results and discuss them. The results are
analyzed and discussed in the following order. First, we calculate the reliability and validity of our survey questionnaire and its responses. Then, the data collected is analyzed and explained based on linear regression analysis and PCA. Finally, we discuss these results in terms of IUIPC factors. The complete survey responses are included in Appendix B.
4.1 Reliability Analysis As noted in Section 3.5.1, to determine if the survey responses are internally
reliability we calculate Cronbach’s α. In terms of reliability the higher the Cronbach’s α value is the higher the level of consistency. In this research, results are considered reliable if as suggested by Nunnally [93] the calculated Cronbach’s α is equal or greater than 0.5. Table 4.1 shows the reliability test results of our survey questionnaire. In this table the alpha values range from 0.515 to 0.937. Hence, all eight construct were assessed as internally consistent and reliable. In other words, all items in each construct measure what was intended and they will produce similar results if the same constructs are applied in a different test or at a different time. Appendix C shows the SPSS reliability test results.
Table 4.1: Reliability Test Results
Construct Number of Items
Cronbach’s α *
UN 3 0.515 CL 3 0.767 AW 4 0.840 SUR 2 0.745 INT 3 0.813 TR 3 0.867 RI 2 0.831 US 3 0.937
* Number (n) of responses; n = 30; Scale: 1 = Strongly Disagree to 7 = Strongly Agree
4.2 Validity Analysis PCA with Varimax as rotation was conducted to assess the convergent validity
of our measurement model. The results show that there are correlation coefficients greater than the suggested threshold of ±0.30, as shown in Appendix D. This indicates that those variables share a level of correlation. To assess that the data collected properly fit the factor analysis KMO MSA and the Bartelet’s Test of Sphericity were performed. The index value of KMO for the set of variables studied is 0.539, which meets the minimum requirement criteria suggested by Hair et al. [95]. Hence, it was unnecessary to examine the Anti-Image Correlation Matrix. Additionally, the Sig. value in the Bartelet’s Test is 0.00 that lead us to conclude the responses are valid and suitable. Table 4.2 shows KMO Test and Bartelet’s Test results.

38
Table 4.2: KMO and Bartlett's Test
Test Values KMO MSA 0.539
Bartlett’s Test of SphericityApproximate Chi-Square 601.174
Df 276 Sig. 0.000
As noted in Section 3.5.2, to obtain a clear pattern of the loadings we used a 3-factor structure based on the ‘Scree test’ since when using the eigenvalue rule we obtained a 6-factor structure in which we were not able to clearly differentiate the load on the factors. In the 3-factor structure, the questions related to the items UN2 and UN3 were removed from the dataset as their loading factors did not reached the required level. After removing these two items from the dataset, the validity test was run again and the results were satisfactory. The removal of these two items allowed us to achieve greater validity during the subsequent data analysis. Detailed information and the interactions performed to go from a 6-factor to a 3-factor structure are shown in Appendix E.
A 3-factor structure with 22-scale loading accounted for 62.47% of the total variance as is shown in Appendix E. This indicates that by choosing three components out of 22 we were able to explain ~62% of the information from the original variables. Moreover, the loaded factors marked with values above 0.50 demonstrate that most items tended to measure the same construct. Hence, the results provide adequate evidence of convergent validity according to the approach highlighted in Section 3.5.2. The final loading factor table is shown in Table 4.3.
Table 4.3: Validity Test Results
Items Factor 1 Factor 2 Factor 3 UN1 0.613 CL1 0.636 CL2 0.703 CL3 0.786 AW1 0.583 AW2 0.798 AW3 0.663 AW4 0.791 SUR1 0.727 SUR2 0.768 INT1 0.633 INT2 0.750 INT3 0.807 TR1 -0.790 TR2 -0.745 TR3 -0.815 RI1 0.517 RI2 0.657 US1 0.911 US2 0.930 US3 0.949 ITE1 -0.593

39
4.3 IUIPC Factors By using linear regression analysis techniques, we gained a deeper
understanding of privacy concerns and their relationship with TR, RI, ITE and US from the point of view of individuals who are knowledgeable or have experience working with the technology under study. An overview of the relationships between the dependent variables and the independent variables and their corresponding coefficient and significance values are shown in Table 4.4 to Table 4.11.
The linear regression analysis results shows that for eight of these results, three (regression1, regression4, and regression7) were not significant (ρ > 0.10); one was statistically significant (ρ < 0.10)(regression6); and four were very statistically significant (ρ < 0.01 or ρ < 0.05) (regression2, regression3, regression5, and regression8). The detailed results of the linear regression analysis are shown in Appendix F.
The relationship between TR and privacy concerns is shown in Table 4.4. These results show that their relationship was not statistically significant, since the ρ value results are not statistically significant (ρ > 0.10).
Table 4.4: Regression1: Privacy concerns predicted to influence ‘Trust & Belief’
Dependent Variable
Independent Variable
R R2 F β τ
TR 0.520 0.270 1.777 3.260 UN -0.310 -1.710 CL 0.162 0.484 AW 0-.311 -0.784 SUR -0.099 -0.364 INT -0.148 -0.613
Table 4.5 shows the relationship between RI and privacy concerns. It was statistically significant (ρ < 0.01) and they both strongly correlate to each other (R=0.719). R2 equals 0.517, thus ~52% of the variance in the dependent variable can be explained by the independent variables. Moreover, with F equals to 5.129 we conclude that the regression analysis results do not happen by chance and that the regression significantly improves our ability to predict the outcome. The analysis of the beta weights indicates that the variables UN (β = 0.144), CL (β = 0.447), AW (β = -0.130), and (β = -0.113) were statistically insignificant (ρ > 0.10) to predict RI. However, there is a significant correlation for the variable SUR (β = 0.610 and ρ < 0.01).
Table 4.5: Regression2: Privacy concerns predicted to influence ‘Risk-Thresholds’
Dependent Variable
Independent Variable
R R2 F β τ
RI 0.719 0.517*** 5.129 -1.506 UN 0.144 0.978 CL 0.447 1.637 AW -0.130 -0.403 SUR 0.610*** 2.759 INT -0.113 -0.577
***indicates a significant level at ρ≤0.01
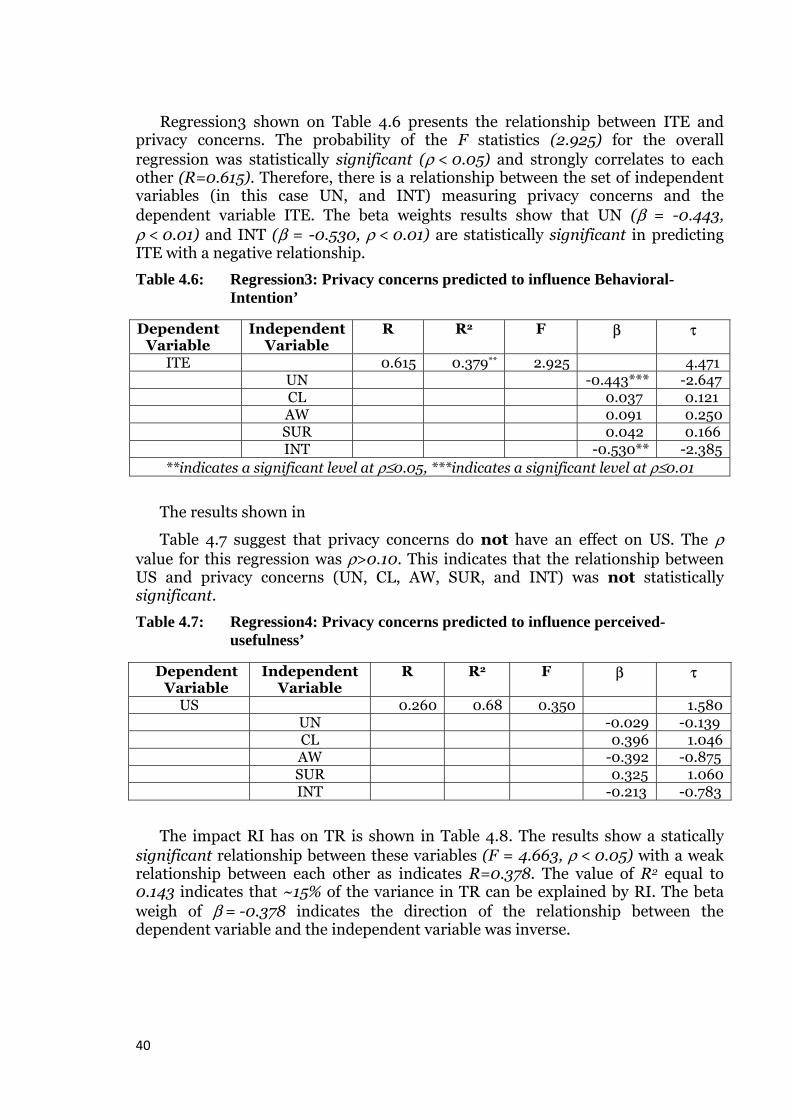
40
Regression3 shown on Table 4.6 presents the relationship between ITE and privacy concerns. The probability of the F statistics (2.925) for the overall regression was statistically significant (ρ < 0.05) and strongly correlates to each other (R=0.615). Therefore, there is a relationship between the set of independent variables (in this case UN, and INT) measuring privacy concerns and the dependent variable ITE. The beta weights results show that UN (β = -0.443, ρ < 0.01) and INT (β = -0.530, ρ < 0.01) are statistically significant in predicting ITE with a negative relationship.
Table 4.6: Regression3: Privacy concerns predicted to influence Behavioral-Intention’
Dependent Variable
Independent Variable
R R2 F β τ
ITE 0.615 0.379** 2.925 4.471 UN -0.443*** -2.647 CL 0.037 0.121 AW 0.091 0.250 SUR 0.042 0.166 INT -0.530** -2.385
**indicates a significant level at ρ≤0.05, ***indicates a significant level at ρ≤0.01
The results shown in
Table 4.7 suggest that privacy concerns do not have an effect on US. The ρ value for this regression was ρ>0.10. This indicates that the relationship between US and privacy concerns (UN, CL, AW, SUR, and INT) was not statistically significant.
Table 4.7: Regression4: Privacy concerns predicted to influence perceived-usefulness’
Dependent Variable
Independent Variable
R R2 F β τ
US 0.260 0.68 0.350 1.580 UN -0.029 -0.139 CL 0.396 1.046 AW -0.392 -0.875 SUR 0.325 1.060 INT -0.213 -0.783
The impact RI has on TR is shown in Table 4.8. The results show a statically significant relationship between these variables (F = 4.663, ρ < 0.05) with a weak relationship between each other as indicates R=0.378. The value of R2 equal to 0.143 indicates that ~15% of the variance in TR can be explained by RI. The beta weigh of β = -0.378 indicates the direction of the relationship between the dependent variable and the independent variable was inverse.
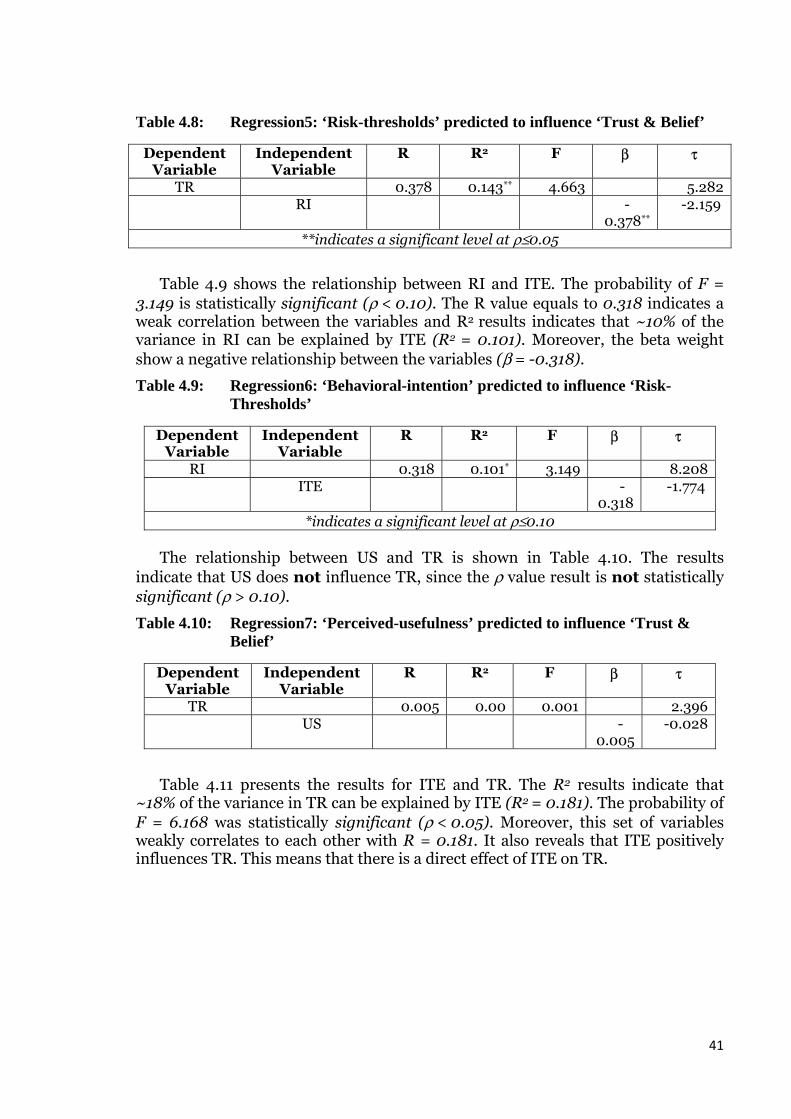
41
Table 4.8: Regression5: ‘Risk-thresholds’ predicted to influence ‘Trust & Belief’
Dependent Variable
Independent Variable
R R2 F β τ
TR 0.378 0.143** 4.663 5.282 RI -
0.378** -2.159
**indicates a significant level at ρ≤0.05
Table 4.9 shows the relationship between RI and ITE. The probability of F = 3.149 is statistically significant (ρ < 0.10). The R value equals to 0.318 indicates a weak correlation between the variables and R2 results indicates that ~10% of the variance in RI can be explained by ITE (R2 = 0.101). Moreover, the beta weight show a negative relationship between the variables (β = -0.318).
Table 4.9: Regression6: ‘Behavioral-intention’ predicted to influence ‘Risk-Thresholds’
Dependent Variable
Independent Variable
R R2 F β τ
RI 0.318 0.101* 3.149 8.208 ITE -
0.318 -1.774
*indicates a significant level at ρ≤0.10
The relationship between US and TR is shown in Table 4.10. The results indicate that US does not influence TR, since the ρ value result is not statistically significant (ρ > 0.10).
Table 4.10: Regression7: ‘Perceived-usefulness’ predicted to influence ‘Trust & Belief’
Dependent Variable
Independent Variable
R R2 F β τ
TR 0.005 0.00 0.001 2.396 US -
0.005 -0.028
Table 4.11 presents the results for ITE and TR. The R2 results indicate that ~18% of the variance in TR can be explained by ITE (R2 = 0.181). The probability of F = 6.168 was statistically significant (ρ < 0.05). Moreover, this set of variables weakly correlates to each other with R = 0.181. It also reveals that ITE positively influences TR. This means that there is a direct effect of ITE on TR.

4
T
b
F
gUG
PmlomBsu
2
Table 4.11:
DependeVariab
TR
Figure 4based on th
Figure 4.1:
To discoget a betterUN, CL AWG gives deta
To deterPCA, the amatrix resuoading of ±
minimum rBartelet’s Tuitable for
RegressiBelief’
ent ble
IndV
4.1 shows he linear re
Linear R
over underr understan
W, SUR, anailed inform
rmine if thapproach hults (see Ta±0.30. MorequiremenTest was r PCA. Tabl
ion8: ‘Beha
ependent Variable
ITE **indicat
the relatiegression re
Regression
rlying dimnding of th
nd INT – Pmation abo
he data collhighlightedable 4.13),
oreover, thent criteria 0.00. Thisle 4.12 sho
avioral-inte
R
0.425
tes a signifi
ionships aesults.
Analysis R
ensions amhe five priv
PCA with vaout this PC
lected for td in Secti, marks at e index vasuggested
s outcomeows the KM
ention’ pre
R2
0.181**
icant level a
mong the
Results
mong the pvacy concearimax rotCA calculat
these five pion 3.5.2least two
lue of the d by Hair ee indicates
MO Test an
dicted to in
F
6.168
at ρ≤0.05
variables
privacy conerns explortation was tion.
privacy conwas followcoefficientKMO is 0.
et al. [95]. s the respd Bartelet’
nfluence ‘T
β
0.425
of the IU
ncerns mered in thisconducted
ncerns prowed. The ts over the.600 whichThe Sig. v
ponses are’s Test resu
Trust &
τ
1.7482.483
UIPC mode
easured an research –
d. Appendi
operly fit focorrelatio
e minimumh meets thvalue in the valid anults.
el
d – ix
or n
m he he
d

43
Table 4.12: KMO and Bartlett's Test
Test Values KMO MSA 0.600
Bartlett’s Test of SphericityApproximate Chi-Square 64.504
Df 10 Sig. 0.000
According to correlation matrix results of Table 4.13, the relationship among the variable UNA with CL, AW, SUR, and INT resulted in loading values above the minimum of ±0.30. As a result, the level of correlation of these variables is acceptable. AW (r=0.826, ρ < 0.01), SUR (r=0.320, ρ < 0.05) and INT (r= 0.393, ρ < 0.05) when correlated with CL received positive significant correlations. Additionally, AW correlated with SUR (r= 0.590, ρ < 0.01) and INT (r= 0.523, ρ < 0.05) also received positive significant correlations. The last variable correlated SUR and INT also showed positive correlation (r= 0.659, ρ < 0.01). Table 4.13: Correlation Matrix Privacy Concerns
Privacy Concerns UN CL AW SUR INT
UN 1.000
CL 0.193 1.000
AW 0.232 0.826*** 1.000
SUR 0.049 0.320** 0.590*** 1.000
INT 0.002 0.393** 0.523** 0.659*** 1.000
*significant level at ρ≤0.10, **significant level at ρ≤0.05, ***significant level at ρ≤0.01
Table 4.14 shows the rotated component matrix based on the eigenvalues criteria. The first factor is associated with the largest eigenvalue and it accounts for ~54% of the variance. Thus it is the most influential factor. The second factor accounted for ~21% of the variance. Together, both factors accounted for 75% of the total variance. Most of the five privacy concerns coefficient loaded highly – above 0.50. Furthermore, they are sorted by the most substantial coefficient relevant in defining the factor’s dimensionality.
The first factor shows high loading for INT, SUR and AW. Therefore, the fear for being watched and intrusion in the home environments are the most influential privacy concerns, followed by concerns about the organizations’ practices. The second factor has high loading basically for UN. The high correlation among the variables in each factor indicates a common underlying dimension. For the first factor the dimension can be interpreted as more related to territorial privacy and for the second factor more related to the correct use of the information collected (information privacy). The rotated matrix did have variables with substantial loading on more than one factor. In this case CL proved to be complex variables. Therefore, control of the dissemination of personal information (CL), exist in both of the resulted dimensions.

4
T
mmfrompretha
F
a7inn
4
Table 4.14:
Figure majority ofmechanismrom the da
of the partimeans. In protected begulationshat expert
and technic
Figure 4.2:
Figure 4and consta73% wouldnformation
notification
Factor L
4.2 illustrf the surve
ms as a funangers relaicipants feeaddition t
by internas proposed ts working cal forces th
Data Pro
4.3 and Figant notificad like to n uses. Figns every tim
Loading Pri
PrivConc
INSUACU
rates the ey participadamental c
ated with ael their perto this tecational law
by privatewith sma
hat provid
otection
gure 4.4 ination of pereceive dure 4.4 ind
me their pe
ivacy Conc
vacy cerns
NT UR
AW CL UN
results foants admitcomponen
abuse or mrsonal infochnical aspws and 50e organizatart home ede a reason
ndicate surversonal inf
detailed indicates thaersonal info
cerns
Factors1
0.8550.8470.7900.627 0
r personatted the im
nt to safegumisuse of thormation spect, 83% 0% considtions. Thes
environmenable level o
vey particiformation
ndication wat 70% of thormation i
s 2
0.5650.864
al informatmportance uard their heir personhould be pconsider
der, it shose results gnts demanof privacy p
ipants expeuses. As s
with regarhe particips used.
ation proteof privacypersonal i
nal data. Aprotected btheir data
ould be prgive a clearnd the desiprotection
ect to receishown in rd to theipants prefe
ection. Thy protectinnformatio
Around 90%by technicaa should brotected br indicatioign of lega
n.
ive detaileFigure 4.3ir persona
er to receiv
he ng
n % al
be by n al
d 3, al ve

F
F
4
ppsmusfobInddasmd
csiinpob
Figure 4.3:
Figure 4.4:
4.4 DiscUbiquito
personal inprivacy whmart hom
understandection discor service
below shoun the dom
due to the ndevised basanalysis. Wmart hom
designing a
Our findconcerns eignificant nformation
personal daof the IUIPbetween pr
Level of
Frequen
ussion ous compu
nformation hen interacme service d the inforcusses the
providersuld be viewmain of ubinature andsed upon t
We expect thme environappealing p
dings indicexist as a
influence n and theata. When PC framewrivacy con
details of p
ncy of Notif
uting techn[73]. The
cting with providers
rmational results fro
s and desiwed as sugg
iquitous cod complexitthe resultshe argumenments to privacy-aw
cate that inreal threon the p
e resultingevaluating
work whencerns and
personal in
fications
nology cauvast majorthis techn
s and desprivacy co
om the previgners of gestions raomputing ty of the ubs of the linents below
better adware applica
n the conteat especiaperceived g intentiong risk, then they sta
d perceived
nformation
uses severarity of the nology [59]signers of oncerns ofvious sectismart hom
ather than general prbicomp tecnear regresto help de
ddress inhations for s
text of smaally due trisk relate
n of the sresults (in
ated that td risks. Th
Notificatio
al concernsusers are c]. This hig
f smart hof users. Foon in orde
me technomandatory
rinciples archnology. Tssion and signers an
habitants’ smart hom
art home eo fact theed to missurvey par Table 4.5)
there is a his positive
ons
s about theconcerned ghlights thome technor these r
er to deriveology. They principlere difficultThese guidprincipal
nd service pprivacy co
me.
environmeese concersuse of thrticipants ) support tpositive r
e relations
4
e privacy oabout thei
he need fonologies treason, thie guideline guideline
es to followt to forese
delines wercomponen
providers ooncerns b
ents privacrns have
he personato disclosthe authorrelationshiship mean
45
of ir
or to is es es w. ee re nt of by
cy a
al se rs p
ns

46
that the more concerned survey participants are about their privacy, the higher the level of risk they are going to perceive. Therefore, for the respondents their privacy concerns increase with the degree to which they believe there could be a potential hazard associated with the release of their personal information.
The behavioral-intention outcome shown in Table 4.6 is also influenced by privacy concerns. These results pointed out that the participants of the survey were more willing to adopt the technology and allow the release of their personal information when they are less concerned about their privacy. These findings matched the results of Malhotra, Kim, and Agarwal [63] which indicate that the greater the level of privacy concerns people perceive, the lower their willingness to adopt systems which might expose their personal information.
Results further indicate that privacy concerns did not influence the trust participants have in smart home service providers and did not influence how useful smart home environments are considered, as shown in Table 4.4 and Table 4.7 (respectively). Table 4.4 reveals that even when the participants of the survey have high concerns about the privacy of their personal information, they do trust the vendor or service provider of smart home in charge of handling their data. This outcome is inconsistence with Malhotra, Kim, and Agarwal [63] findings which state that the higher the level of privacy concern, the less trust exist on the vendors or service providers. This discrepancy may be related to the fact that every person in the target population in my survey had experience working with the technology being studied; hence they know and trust the infrastructure behind it. To some degree, the survey participants believe that companies will not misuse their personal information and that their data would be handled in a proper, trustworthy, and appropriate way while keeping in mind the best interest of the users. Additionally, the results shown in Table 4.7 indicates that even when the survey participants are concerned about the privacy of their personal information, these concerns do not influence the participants’ belief that using smart home technology will positively enhance the quality of their life. Therefore, the benefits the participants perceive of smart home technology overshadow any potential risk associated with the misuse of their data.
‘Trust & Belief’ was a significant affected by ‘Risk-Thresholds’ and Behavioral-Intention as Table 4.8 and Table 4.11 illustrate. Table 4.8 points out that the survey participants trust smart home service providers to properly handle their personal information only if they perceive there are few unexpected problems associated with misuse of their data. This relationship is in alignment with the findings of Malhotra, Kim, and Agarwal [63]. Additionally, the results shown in Table 4.11 demonstrate that the survey participants are willing to adopt smart home environments and disclose their personal data because they trust services provider not to misuse their personal information. This finding also corroborates the results presented by Malhotra, Kim, and Agarwal[63] which indicate the more trust people feel, the stronger their intention to engage in the exchange of their data in a smart home environment. In essence, service providers and designers of smart home should build trust beliefs in inhabitants and reduce the perceived risk, as these will encourage inhabitants to perceive the disclosure of their personal data as beneficial.
47
The results also suggest that perceived usefulness do not influence the trust of the participant in services providers. According to the theory developed by Ajzen and Fishbein [105] if individuals perceived as beneficial the adoption of certain technology to increase the quality of their life, these individuals are more likely to trust their personal information would be handled correctly. However, this relationship could not be found in our results (as shown in Table 4.10). This is a surprising result since the survey participants, even when they are experts in the field and work developing the technology, consider smart home environments useless. In addition, perceived risk has a significant influence on the intention of the respondents to adopt smart home services. The higher the perceived risk-threshold, the less willingness respondents are to disclose their data by adopting smart home technology due to the fear associated with the misuse of their personal information. Therefore, the relationship pointed out by Malhotra, Kim, and Agarwal [63] that perception of higher risk leads to lower intention to deal with smart home technology was corroborated in our findings (as shown in Table 4.9).
The most influential privacy concerns resulted to be intrusion and surveillance (see Table 4.14). Participants describe to be majorly concerns about the possibility of intrusion and being watched. The aggressive data collection and logging capabilities of ubiquitous computing systems induce the participants to believe that their behavior within their home could be constantly monitored and tracked. The lack of confidence generated by these privacy concerns represent a challenge for designer of smart home technology and further investigation is needed to be done to explore the best way to handle these aspects via a privacy aware system.
Another aspect from this research to highlight is that there is a fundamental need to design privacy protecting mechanisms for smart homes that take into account the legal aspects of privacy as 83% of the participants believe their data should be protected by international laws and 50% of them believe that their data should be protected by regulations proposed by private organizations. Although researchers have suggested several privacy models, methods, and techniques (see Section 2.9), none of these suggestions take into account the legal perspective. Therefore, we consider it important to take into account legal aspects of privacy when design a smart home system. Moreover, participants expect to receive detailed and constant notifications every time their personal information is shared or accessed by a service provider. This highlights the important for the survey respondents knowing details of what information about them is being captured and shared with which service provider. This supports the findings of Westin [36] who postulated that when it comes to ubiquitous computing technology and environments people feel the need to know when, how, and to what extent their information is shared with other parties.


49
5 Conclusions and Future work
In this chapter the conclusion are presented and suggestions made for further research as well as stating some of the limitations of this study that impact the quality of our findings.
5.1 Conclusions The motivation for this thesis project was to understand privacy concerns in the
context of smart home environments. Langheinrich [4] pointed out that the aggressive data collection practices by intelligent devices and the possibility that inhabitants personal information could be misused or maliciously disclosed creates discomfort and concerns among the users of such smart home environments. To address these concerns an initial step is to comprehend privacy concerns of experts in the field.
The study described in this thesis was designed to explore and understand the relationships among privacy concerns, the field experts’ perceived trust of service providers (Trust & Belief), the willingness of the field experts to adopt smart home services and to allow the release of their personal information (Behavioral-Intention), the field experts’ perception of the usefulness of smart environments (Perceived-Usefulness), and the risk perception associated with the disclosure of their personal data (Risk-Thresholds). The findings from the analysis presented in Chapter 4 provide clear support for five out of eight of the relationships explored. The three major predictors are the influence that privacy concerns have on risk-threshold, behavioral-intention, and the influence of behavioral-intention on trust & belief.
The fact that smart homes will become more common in the future, means that service providers and designers of these smart home environments must understand the issues exposed in this work and create privacy-awareness tools that appeal to the inhabitants of these smart home environments. Appropriate privacy-aware tools could help ease inhabitants’ privacy concerns, improve the inhabitants’ understanding of their privacy and autonomy, and support the inhabitants’ perception of control over the data generated by smart devices.
5.2 Limitations As with all research, this study also faced some limitations. First, we did not
have access to inhabitants currently living in smart home environments - as we had originally planned. It was impossible to have access to such a population because the expected smart home environment is still under development phase and the technology is slowly shifting from research laboratories to commercial viable implementations. For this reason, our results are biased in that the sample population selected was knowledgeable or had experience working with at least one of the technologies that enable smart home environments. Therefore, this population is more willing to adopt smart home services and to trust the technology and infrastructure behind it. Consequently, a randomly sampling of participants is needed to increase the validity of our findings. Second, the scenario used in this study might have conditioned the survey responses. Thirdly, the sample size was too small. The use of a convenience sample of n=30 restricted the use of more

50
rigorous data analysis methods, such as SEM, linear structural relation (LISREL), or partial least square (PLS). Moreover, correlations among the coefficients that might be significant (even when they are weak) were not detected. A small sample size from a specific geographic area, in this case Sweden, represents a limitation for the generalization of these results to other population. Fourth, there were deficiencies in the measurement. The construct measuring Unauthorized Secondary uses (UN) exhibited unreasonable validity. Therefore, the items UN2 and UN3 were removed from the data analysis. Fifth, our IUIPC framework and the modification may not have covered all necessary aspects for our study of ubicomp environments. Therefore, future research should be done to develop instruments that natively evaluate privacy concerns in smart home environment.
Despite all of these limitations, we believe this study provides reasonable results given that biases and limitation are to some degree inevitable in research.
5.3 Future work This study helps to identified potential future research to extend the body of
knowledge about informational privacy concerns in ubiquitous computing environments, such as smart homes. Future studies should attempt to transform privacy concerns into a set of requirements for the design of smart home environments and services using data from these environments. Moreover, an effort should be made to increase the validity of the findings presented by reviewing and rechecking the current survey results. Researchers could explore other dimensions of privacy concerns in order to create an instrument that naturally supports smart home environments. It would be interesting to explore best practices and approaches that would help to ease privacy concerns by using suitable software applications. Particularly, interesting would be approaches that alleviate the privacy concerns of intrusion and surveillance.
Along with the above proposals, researchers could individually investigate each of the privacy concerns exposed in previous section (UN, INT, SUR, AW, CL), by creating of low-fidelity prototypes or technology probes to trigger feelings (e.g., by irritating them) to study privacy or to stimulate privacy awareness of the inhabitants. The inhabitants’ reactions can be captured and analyzed by the use of ESM to provide a deeper understanding of privacy concerns and determine if the concept of privacy is evolving in the context of a smart home.
As there is still vague data protection rules in Sweden, further work should be done to bring the attention of the government and advance in the implementation of strictest data protection and privacy laws for ubiquitous computing technology. The legal norms must protect individuals from harmful consequences related to the collection of their personal data and rigorously regulate the maintenance, use, access and dissemination of the personal information.
5.4 Required reflections One reflection about this thesis work is that in the social aspects we considered
the discussion should be used in conjunction with the guidelines that we have suggested by business enterprises working with any of the key technologies that enable ubicomp. Another positive social effect is that by further transforming these
51
guideline into technical requirements that later are implemented in the technological infrastructure could enhance privacy in a smart home. This would lead to good balance of trust and respect from the inhabitants towards the ubicomp technology. The aim is not that the ubicomp system necessarily achieves perfect privacy and total security, but rather since the concept of privacy is dynamic and subjective from person to person we should seek to ease privacy concerns of the inhabitants of smart home environments.
One ethical aspect considered in this study is associated with the fact that the nature of term privacy by itself generates ethical discussions among practitioners and researchers. Moreover, the term privacy is one of the most prominent and permanent social issues discussed in ubicomp environments. Ubicomp systems are coming to our homes. This is likely to bring dramatic changes in our understanding and perception of privacy. Therefore, service providers and designers of smart home environments should clearly understand inhabitants’ privacy concerns in order to make these changes less disturbing for inhabitants as well as reducing the possibility for unethical practices by integrating privacy awareness tools into smart home environments.


53
References
[1] I. A. Essa, ‘Ubiquitous sensing for smart and aware environments’, IEEE Personal Communications, vol. 7, no. 5, pp. 47–49, 2000, DOI:10.1109/98.878538.
[2] D. J. Cook, M. Youngblood, I. Heierman, E.O., K. Gopalratnam, S. Rao, A. Litvin, and F. Khawaja, ‘MavHome: an agent-based smart home’, in Proceedings of the First IEEE International Conference on Pervasive Computing and Communications, 2003. (PerCom 2003), 2003, pp. 521–524, DOI:10.1109/PERCOM.2003.1192783.
[3] D. J. Cook, G. M. Youngblood, and G. Jain, ‘Algorithms for smart spaces’, Technology for Aging, Disability and Independence: Computer and Engineering for Design and Applications, Wiley, 2008, Available at http://www.researchgate.net/publication/228018240_Algorithms_for_Smart_Spaces/file/9fcfd5086eb377dc6e.pdf.
[4] M. Langheinrich, ‘Privacy by design—principles of privacy-aware ubiquitous systems’, in Ubicomp 2001: Ubiquitous Computing, 2001, pp. 273–291, Available at http://link.springer.com/chapter/10.1007/3-540-45427-6_23.
[5] M. Weiser, ‘The future of ubiquitous computing on campus’, Commun. ACM, vol. 41, no. 1, pp. 41–42, January 1998, DOI:10.1145/268092.268108.
[6] M. Weiser, ‘The computer for the 21st century’, Scientific American, vol. 265, no. 3, pp. 94–104, 1991.
[7] M. Weiser and J. S. Brown, ‘The coming age of calm technology’, in Beyond calculation, Springer, 1997, pp. 75–85.
[8] S. Poslad, Ubiquitous computing: smart devices, environments and interactions. Chichester, U.K.: Wiley, 2009, ISBN: 9780470035603 0470035609.
[9] W. Buxton, ‘Ubiquitous media and the active office’, Nikkei Electronics, vol. 3, pp. 187–195, 1995.
[10] A. Schmidt, ‘Implicit human computer interaction through context’, Personal Technologies, vol. 4, no. 2–3, pp. 191–199, 2000.
[11] B. Schilit, N. Adams, and R. Want, ‘Context-aware computing applications’, in Mobile Computing Systems and Applications, 1994. WMCSA 1994. First Workshop on, 1994, pp. 85–90, Available at http://ieeexplore.ieee.org/xpls/abs_all.jsp?arnumber=4624429.
[12] S. Panchanathan, J. A. Black Jr, P. Tripathi, and K. Kahol, ‘Cognitive Multimedia Computing’, in Proceedings of IEEE International Symposium on Information Science and Electrical Engineering, 2003, Available at
54
http://citeseerx.ist.psu.edu/viewdoc/download?doi=10.1.1.57.9176&rep=rep1&type=pdf.
[13] S. G. Thompson and B. Azvine, ‘No Pervasive Computing without Intelligent Systems’, BT Technology Journal, vol. 22, no. 3, pp. 39–49, July 2004, DOI:10.1023/B:BTTJ.0000047118.95476.14.
[14] M. Strassner and T. Schoch, ‘Today’s impact of ubiquitous computing on business processes’, in First international conference on pervasive computing, 2002, vol. 2002, pp. 62–74, Available at http://www.alexandria.unisg.ch/EXPORT/DL/21573.pdf.
[15] D. Ley, ‘Emerging Technologies for Learning’, British Educational Communications and Technology Agency, vol. 2, pp. 64–79, 2007.
[16] G. D. Abowd and E. D. Mynatt, ‘Charting past, present, and future research in ubiquitous computing’, ACM Trans. Comput.-Hum. Interact., vol. 7, no. 1, pp. 29–58, March 2000, DOI:10.1145/344949.344988.
[17] J. Krumm, Ubiquitous computing fundamentals. Boca Raton: Chapman & Hall/CRC Press, 2010, ISBN: 1420093614 9781420093612 9781420093605 1420093606.
[18] W. K. Edwards and R. E. Grinter, ‘At Home with Ubiquitous Computing: Seven Challenges’, Computer Science Laboratory, Xerox Palo Alto Research Center, vol. Ubicomp 2001: Ubiquitous Computing, p. 256, 2001.
[19] M. Chan, E. Campo, D. Estève, and J.-Y. Fourniols, ‘Smart homes — Current features and future perspectives’, Maturitas, vol. 64, no. 2, pp. 90–97, October 2009, DOI:10.1016/j.maturitas.2009.07.014.
[20] L. Jiang, D.-Y. Liu, and B. Yang, ‘Smart home research’, in Machine Learning and Cybernetics, 2004. Proceedings of 2004 International Conference on, 2004, vol. 2, pp. 659–663, Available at http://ieeexplore.ieee.org/xpls/abs_all.jsp?arnumber=1382266.
[21] H. R. G. Massachusetts Institute of Technology, ‘House_n The PlaceLab’, The PlaceLab. [Online]. Available: http://architecture.mit.edu/house_n/placelab.html. [Accessed: 09-April-2013].
[22] C. D. Kidd, R. Orr, G. D. Abowd, C. G. Atkeson, I. A. Essa, B. MacIntyre, E. Mynatt, T. E. Starner, and W. Newstetter, ‘The aware home: A living laboratory for ubiquitous computing research’, in Cooperative buildings. Integrating information, organizations, and architecture, Springer, 1999, pp. 191–198.
[23] F. Bliek, A. van den Noort, B. Roossien, R. Kamphuis, J. de Wit, J. van der Velde, and M. Eijgelaar, ‘PowerMatching City, a living lab smart grid demonstration’, in Innovative Smart Grid Technologies Conference Europe (ISGT Europe), 2010 IEEE PES, 2010, pp. 1–8, DOI:10.1109/ISGTEUROPE.2010.5638863.

55
[24] ‘Stockholm Royal SeaPort - | A Wold-Class Enviromental Urban District’, Stockholm Royal Sea Port. [Online]. Available: http://stockholmroyalseaport.com/. [Accessed: 10-April-2013].
[25] T. Tamura, A. Kawarada, M. Nambu, A. Tsukada, K. Sasaki, and K.-I. Yamakoshi, ‘E-healthcare at an experimental welfare techno house in Japan’, The open medical informatics journal, vol. 1, p. 1, 2007.
[26] D. Ding, R. A. Cooper, P. F. Pasquina, and L. Fici-Pasquina, ‘Sensor technology for smart homes’, Maturitas, vol. 69, no. 2, pp. 131–136, June 2011, DOI:10.1016/j.maturitas.2011.03.016.
[27] ‘The AllJoyn Open Source Project - AllSeen Alliance’. [Online]. Available: https://allseenalliance.org/developer-resources/alljoyn-open-source-project. [Accessed: 21-January-2014].
[28] H. Abramowicz, ‘SRS WP 3Smart Communication - Generic Communication Infrastrucutre’, Ericsson, Sweden, April 2011.
[29] ‘HGI - Use Cases and Architecture for a Home Energy Management Service’. Home Gateway Initiative, 05-August-2011.
[30] K. Gill, S.-H. Yang, F. Yao, and X. Lu, ‘A ZigBee-based home automation system’, Consumer Electronics, IEEE Transactions on, vol. 55, no. 2, pp. 422–430, 2009.
[31] S. S. S. R. Depuru, L. Wang, and V. Devabhaktuni, ‘Smart meters for power grid: Challenges, issues, advantages and status’, Renewable and sustainable energy reviews, vol. 15, no. 6, pp. 2736–2742, 2011.
[32] ‘Home (England) - Energy Saving Trust England’. [Online]. Available: http://www.energysavingtrust.org.uk/. [Accessed: 18-November-2013].
[33] R. van Gerwen, S. Jaarsma, and K. Rob Wilhite, ‘Smart metering’, Leonardo-energy. org, vol. 9, 2006, Available at https://idc-online.com/technical_references/pdfs/electrical_engineering/Smart_Metering.pdf.
[34] ‘Stora mängder cannabis i avloppsvattnet - Gävle’, Arbetarbladet. [Online]. Available: http://arbetarbladet.se/nyheter/gavle/1.5906226-stora-mangder-cannabis-i-avloppsvattnet. [Accessed: 05-December-2013].
[35] S. D. Warren and L. D. Brandeis, ‘Right to Privacy’, Harvard Law Review, vol. IV, no. No. 5, pp. 193–220, December 1890.
[36] A. F. Westin, ‘Privacy and freedom’, Washington and Lee Law Review, vol. 25, no. 1, p. 166, 1968.
[37] I. Altman, The environment and social behavior : privacy, personal space, territory, crowding. Monterey, CA: Brooks/Cole Publishing Co, 1975, ISBN:

56
0818501685, Available at http://trove.nla.gov.au/work/10887790?q&versionId=44959295.
[38] M. Bylund, M. Johnson, A. Lehmuskallio, P. Seipel, and S. Tamminen, ‘PRIMA—Privacy research through the perspective of a multidisciplinary mash up’, 2010, Available at http://soda.swedish-ict.se/4046/.
[39] L. Palen and P. Dourish, ‘Unpacking privacy for a networked world’, in Proceedings of the SIGCHI conference on Human factors in computing systems, 2003, pp. 129–136, Available at http://dl.acm.org/citation.cfm?id=642635.
[40] M. Langheinrich, ‘Privacy by design—principles of privacy-aware ubiquitous systems’, in Ubicomp 2001: Ubiquitous Computing, 2001, pp. 273–291, Available at http://link.springer.com/chapter/10.1007/3-540-45427-6_23.
[41] J. I. Hong, J. D. Ng, S. Lederer, and J. A. Landay, ‘Privacy risk models for designing privacy-sensitive ubiquitous computing systems’, in Proceedings of the 5th conference on Designing interactive systems: processes, practices, methods, and techniques, 2004, pp. 91–100, Available at http://dl.acm.org/citation.cfm?id=1013129.
[42] ‘Fair Information Practice Principles’, Federal Trade Commission. [Online]. Available: http://www.ftc.gov/reports/privacy3/fairinfo.shtm. [Accessed: 22-April-2013].
[43] European Parliament, ‘Directive 95/46/EC of the European Parliament and of the Council of 24 October 1995 on the protection of individuals with regard to the processing of personal data and on the free movement of such data.’, EUR-Lex - European Parliament Laws, 24-October-1995. [Online]. Available: http://eur-lex.europa.eu/LexUriServ/LexUriServ.do?uri=CELEX:31995L0046:en:HTML. [Accessed: 22-April-2013].
[44] H. Haddadi, R. Mortier, and S. Hand, ‘Privacy analytics’, SIGCOMM Comput. Commun. Rev., vol. 42, no. 2, pp. 94–98, March 2012, DOI:10.1145/2185376.2185390.
[45] G. Myles, A. Friday, and N. Davies, ‘Preserving privacy in environments with location-based applications’, IEEE Pervasive Computing, vol. 2, no. 1, pp. 56–64, 2003, DOI:10.1109/MPRV.2003.1186726.
[46] A. Arabo, M. Kennedy, Q. Shi, M. Merabti, D. Llewellyn-Jones, and K. Kifayat, ‘Identity management in System-of-Systems Crisis Management situation’, in 2011 6th International Conference on System of Systems Engineering (SoSE), 2011, pp. 37–42, DOI:10.1109/SYSOSE.2011.5966570.
[47] D. H. Nguyen and E. D. Mynatt, ‘Privacy mirrors: understanding and shaping socio-technical ubiquitous computing systems’, 2002, Available at http://smartech.gatech.edu/handle/1853/3268.

57
[48] A. J. Gill, A. Vasalou, C. Papoutsi, and A. N. Joinson, ‘Privacy dictionary: a linguistic taxonomy of privacy for content analysis’, in Proceedings of the 2011 annual conference on Human factors in computing systems, 2011, pp. 3227–3236, Available at http://dl.acm.org/citation.cfm?id=1979421.
[49] A. Adams, ‘Users’ perception of privacy in multimedia communication’, in CHI’99 extended abstracts on Human factors in computing systems, 1999, pp. 53–54, Available at http://dl.acm.org/citation.cfm?id=632752.
[50] E. Quinn, ‘Privacy and the new energy infrastructure’, Available at SSRN 1370731, 2009, Available at http://papers.ssrn.com/sol3/papers.cfm?abstract_id=1370731.
[51] S. Spiekermann, ‘RFID and privacy: what consumers really want and fear’, Personal and Ubiquitous Computing, vol. 13, no. 6, pp. 423–434, November 2008, DOI:10.1007/s00779-008-0215-2.
[52] J. Smith, S. Milberg, and S. Burke, ‘Information Privacy: Measuring Individuals Concerns About Organizational Practices’, vol. 20, Available at http://www.jstor.org/stable/249477.
[53] V. Bellotti and A. Sellen, ‘Design for privacy in ubiquitous computing environments’, in Proceedings of the Third European Conference on Computer-Supported Cooperative Work 13–17 September 1993, Milan, Italy ECSCW’93, 1993, pp. 77–92, Available at http://link.springer.com/chapter/10.1007/978-94-011-2094-4_6.
[54] J. Ayoade, ‘Roadmap to solving security and privacy concerns in RFID systems’, Computer Law & Security Review, vol. 23, no. 6, pp. 555–561, January 2007, DOI:10.1016/j.clsr.2007.09.005.
[55] S. Preibusch, ‘Guide to measuring privacy concern: Review of survey and observational instruments’, International Journal of Human-Computer Studies, vol. 71, no. 12, pp. 1133–1143, December 2013, DOI:10.1016/j.ijhcs.2013.09.002.
[56] M. Duckham and L. Kulik, ‘A formal model of obfuscation and negotiation for location privacy’, in Pervasive computing, Springer, 2005, pp. 152–170.
[57] Louis Harris & Associates, Inc, ‘IBM Multi-National Consumer Privacy Survey’, IBM Corporation, USA, UK, Germany, Survey 938568, October 1999.
[58] D. Hutchison, F. Mattern, M. Naor, and G. Psaila, ‘E-Commerce and Web Technologies: 9th International Conference, EC-Web 2008 Turin, Italy, September 3-4, 2008 Proceedings’. Springer, 2008.
[59] B. Azvine, J. Kolko, and N. Belanger, ‘Online privacy concerns: More than hype’, Forrester Research Inc., Cambridge, MA, Forrester Report Available at http://books.google.se/books?id=ZqMQOT9SMhAC&pg=PA140&lpg=PA140&dq=%22online+privacy+concerns:+more+than+hype%22&source=bl&ots=52jBbX4WmT&sig=3Huj6LLlNhMDzPHcB95_TKsf2b4&hl=en&sa=X&ei=biueUYrMC4vp

58
tQb2lIAI&ved=0CDEQ6AEwAg#v=onepage&q=%22online%20privacy%20concerns%3A%20more%20than%20hype%22&f=false, 2004.
[60] ‘Office of the Australian Information Commissioner’, Protecting Information Rights - Advancing Information Policy. [Online]. Available: http://www.privacy.gov.au/. [Accessed: 23-May-2013].
[61] K.-W. Wu, S. Y. Huang, D. C. Yen, and I. Popova, ‘The effect of online privacy policy on consumer privacy concern and trust’, Computers in Human Behavior, vol. 28, no. 3, pp. 889–897, May 2012, DOI:10.1016/j.chb.2011.12.008.
[62] K. B. Sheehan and M. G. Hoy, ‘Dimensions of Privacy Concern Among Online Consumers’, Journal of Public Policy & Marketing, vol. 19, no. 1, pp. 62–73, March 2000, DOI:10.1509/jppm.19.1.62.16949.
[63] N. K. Malhotra, S. S. Kim, and J. Agarwal, ‘Internet Users’ Information Privacy Concerns (IUIPC): The Construct, the Scale, and a Causal Model’, Information Systems Research, vol. 15, no. 4, pp. 336–355, December 2004, DOI:10.1287/isre.1040.0032.
[64] T. Buchanan, C. Paine, A. N. Joinson, and U.-D. Reips, ‘Development of measures of online privacy concern and protection for use on the Internet’, Journal of the American Society for Information Science and Technology, vol. 58, no. 2, pp. 157–165, 2007, DOI:10.1002/asi.20459.
[65] J. B. Earp, A. I. Anton, L. Aiman-Smith, and W. H. Stufflebeam, ‘Examining Internet privacy policies within the context of user privacy values’, Engineering Management, IEEE Transactions on, vol. 52, no. 2, pp. 227–237, May 2005, DOI:10.1109/TEM.2005.844927.
[66] T. Dinev and P. Hart, ‘Internet privacy concerns and their antecedents - measurement validity and a regression model’, Behaviour & Information Technology, vol. 23, no. 6, pp. 413–422, November 2004, DOI:10.1080/01449290410001715723.
[67] A. Braunstein, L. Granka, and J. Staddon, ‘Indirect content privacy surveys: measuring privacy without asking about it’, in Proceedings of the Seventh Symposium on Usable Privacy and Security, 2011, p. 15, Available at http://dl.acm.org/citation.cfm?id=2078847.
[68] ‘What Is The Direct Marketing Association?’, Direct Marketing Association. [Online]. Available: http://www.the-dma.org/aboutdma/whatisthedma.shtml. [Accessed: 28-November-2013].
[69] S. B. Wicker and D. E. Schrader, ‘Privacy-Aware Design Principles for Information Networks’, Proceedings of the IEEE, vol. 99, no. 2, pp. 330–350, February 2011, DOI:10.1109/JPROC.2010.2073670.

59
[70] J. Phelps, G. Nowak, and E. Ferrell, ‘Privacy Concerns and Cosumers Willingness to Provide Personal Information’, Journal of Public Policy & Marketing, vol. 19, no. 1, pp. 27–41, Spring 2000.
[71] M. Boyle and S. Greenberg, ‘The language of privacy: Learning from video media space analysis and design’, ACM Trans. Comput.-Hum. Interact., vol. 12, no. 2, pp. 328–370, June 2005, DOI:10.1145/1067860.1067868.
[72] J. I. Hong and J. A. Landay, ‘An architecture for privacy-sensitive ubiquitous computing’, in Proceedings of the 2nd international conference on Mobile systems, applications, and services, 2004, pp. 177–189, Available at http://dl.acm.org/citation.cfm?id=990087.
[73] M. Langheinrich, ‘A privacy awareness system for ubiquitous computing environments’, in UbiComp 2002: Ubiquitous Computing, Springer, 2002, pp. 237–245.
[74] C. A. Gunter, M. J. May, and S. G. Stubblebine, ‘A formal privacy system and its application to location based services’, in Privacy Enhancing Technologies, 2005, pp. 256–282, Available at http://link.springer.com/chapter/10.1007/11423409_17.
[75] R. Gavison, ‘Privacy and the Limits of Law’, Yale LJ, vol. 89, p. 421, 1979.
[76] G. Pallapa, M. Kumar, and S. K. Das, ‘Privacy Infusion in Ubiquitous Computing’, in Fourth Annual International Conference on Mobile and Ubiquitous Systems: Networking Services, 2007. MobiQuitous 2007, 2007, pp. 1–8, DOI:10.1109/MOBIQ.2007.4451030.
[77] S. Lederer, J. I. Hong, A. K. Dey, and J. A. Landay, ‘Personal privacy through understanding and action: five pitfalls for designers’, Personal Ubiquitous Comput., vol. 8, no. 6, pp. 440–454, November 2004, DOI:10.1007/s00779-004-0304-9.
[78] S. Jafari, F. Mtenzi, C. O’Driscoll, R. Fitzpatrick, and B. O’Shea, ‘Privacy metrics in ubiquitous computing applications’, in Internet Technology and Secured Transactions (ICITST), 2010 International Conference for, 2010, pp. 1–2.
[79] A. R. Hevner, S. T. March, J. Park, and S. Ram, ‘Design science in information systems research’, MIS quarterly, vol. 28, no. 1, pp. 75–105, 2004.
[80] D. De Vaus, Research design in social research. Sage, 2001, Available at http://books.google.com/books?hl=en&lr=&id=9yurQt7T65oC&oi=fnd&pg=PA1&dq=%22of+a+population+or+the+gender+mix+of+a+workplace.%22+%22description+provokes+the+%60why%27+questions+of%22+%22to+explain+a+non-existent+phenomenon+are%22+%22to+describe+the+crime+rate+in+a+country,+to+examine+trends+over%22+&ots=nnWe12yS3r&sig=8XHKxEPzn413TXp6HQGmelbNvvQ.

60
[81] G. Pervez and D. K. Gronhaug, Research Methods in Business Studies: A Practical Guide, 4th ed. Prentice Hall, 2010, ISBN: 0273712047.
[82] M. Denscombe, The good research guide for small-scale social research projects. Maidenhead, England: McGraw-Hill/Open University Press, 2010, ISBN: 9780335241408 0335241409 9780335241392 0335241395, Available at http://site.ebrary.com/id/10441962.
[83] R. K. Yin, A Case Study Research: Applied Social Research Methods Series, Fifth., vol. 5. California: SAGE Publications Inc., 2013, ISBN: 1452242569.
[84] N. J. Adler and N. Campbell, ‘In Search of appropiate Methodology: From outside People’s Republic of China Looking in.’, Palgrave Macmillan Journals, vol. 20, pp. 61–74, Spring 1989.
[85] C. C. McClintock, D. Brannon, and S. Maynard-Moody, ‘Applying the logic of sample surveys to qualitative case studies: The case cluster method’, Administrative Science Quarterly, vol. 24, no. 4, pp. 612–629, 1979.
[86] M. R. Harwell, ‘Research Design in Qualitative/Quantitative/Mixed Methods’, The SAGE Handbook for Research in Education: Pursuing Ideas as the Keystone of Exemplary Inquiry, p. 147, 2011.
[87] H. Xu, S. Gupta, M. B. Rosson, and J. M. Carroll, ‘Measuring Mobile Users’ Concerns for Information Privacy.’, in ICIS, 2012, Available at http://faculty.ist.psu.edu/xu/papers/Xu_etal_ICIS_2012a.pdf.
[88] S. Preibusch, ‘Guide to measuring privacy concern: Review of survey and observational instruments’, International Journal of Human-Computer Studies, September 2013, DOI:10.1016/j.ijhcs.2013.09.002, Available at http://linkinghub.elsevier.com/retrieve/pii/S1071581913001183.
[89] G. Raab, ‘Background to PEAS project’, Napier University, August-2012, Available at http://www2.napier.ac.uk/depts/fhls/peas/workshops/workshop1presentationGR.ppt.
[90] A. Bhattacherjee, Social science research: principles, methods, and practices. Tampa, FL: A. Bhattacherjee, 2012, ISBN: 1475146124 9781475146127.
[91] W. M. Trochim, ‘The Research Methods Knowledge Base’, 20-October-2006. [Online]. Available: http://www.socialresearchmethods.net/kb/citing.php. [Accessed: 07-November-2013].
[92] J. Mohammad Muaz, ‘Practical Guidelines for conducting research’. Donor Committee for Enterprise Development, February-2013, Available at www.Enterprise-Development.org.
[93] J. C. Nunnally, Psychometric Theory, 2nd Revised. McGraw-Hill Inc., 1978, ISBN: 0070474656.
61
[94] M. S. Lewis-Beck, Factor Analysis and Related Techniques (International Handbook of Quantitative Applications in the Social Sciences). Sage Pubns, 1994, ISBN: 978-0803954311.
[95] Joseph F. Hair Jr, William C. Black, Barry J. Babin, and Rolph E. Anderson, Multivariate data analysis, 7 edition. Prentice Hall, 2009, ISBN: 0138132631.
[96] D. Gefen, D. W. Straub, and M.-C. Boudreau, ‘Structural Equation Modeling and Regression: Guidelines for Research Practices’, 2000, Available at http://www.dina.com.cn/news/UploadFiles/t10.pdf.
[97] A. Gurung, ‘Empirical investigation of the relationship of privacy, security and trust with behavioral intention to transact in e-commerce’, 2007, Available at http://dspace.uta.edu/handle/10106/62.
[98] A. E. Widjaja and J. V. Chen, ‘Using Cloud Computing Services: A perspective from users’ information security, privacy and trust’, Available at http://140.116.240.3/conference/ISAD/files/RA8007037-a.pdf.
[99] T. Kowatsch and W. Maass, ‘Initial Social Acceptance and Impact Evaluation’. HSG, 31-August-2011.
[100] J. Tsai, P. Kelley, L. Cranor, and N. Sadeh, ‘Location-sharing technologies: Privacy risks and controls’, 2009, Available at http://papers.ssrn.com/sol3/papers.cfm?abstract_id=1997782.
[101] L. Becker and K. Pousttchi, ‘Social networks: the role of users’ privacy concerns’, in Proceedings of the 14th International Conference on Information Integration and Web-based Applications & Services, 2012, pp. 187–195, Available at http://dl.acm.org/citation.cfm?id=2428767.
[102] J. Smith, P. Hart, T. Dinev, and H. Xu, ‘Information Privacy Concerns: Linking Individual Perceptions with Institutional Privacy Assurances’, Journal of the Association for Information Systems, vol. 12, no. 12, pp. 798–824, 2011.
[103] E. A. Lind and T. R. Tyler, The Social Psychology of Procedural Justice. Springer, 1988, ISBN: 0306427265.
[104] R. C. Mayer, J. H. Davis, and F. D. Schoorman, ‘An integrative model of organizational trust’, Academy of management review, vol. 20, no. 3, pp. 709–734, 1995.
[105] I. Ajzen and M. Fishbein, Understanding Attitudes and Predicting Social Behavior, 1st ed. Pearson, 1980, ISBN: 0139364358.
[106] F. D. Davis, R. P. Bagozzi, and P. R. Warshaw, ‘User acceptance of computer technology: a comparison of two theoretical models’, Management science, vol. 35, no. 8, pp. 982–1003, 1989.


63
Appendix A: Smart Environment Experience
Basic Instructions: The information collected by this scenario-based survey is used for the purpose of investigating privacy factors in Smart Home Environments. The survey follows a simple pattern: a scenario is presented and then several statements about privacy factor should be responded based on the scenario description. It will take you approx. 10 minutes to complete this survey. Your feedback is highly relevant for the design and implementation of privacy tools in Smart Home Environments. You will be able to see the results of this survey on http://kth.diva-portal.org when my thesis report is published. Enjoy the survey now!
Disclaimer and Privacy Statement Your answers will be treated anonymously, but we retain information about your age, gender and country of residence to
analyze the results of the questionnaire and remove any bias. We will strictly follow the EU directive 95/46/EC (“Protection of personal data”) and national guidelines.
Scenario: Imagine you live in the below smart home environment. Through a computer you are able to control every aspect of your house such as lighting, security, entertainment system, climate, and so on. At any time, you can connect remotely to your home, through mobile devices and change the settings of your house as desired. The house is embedded with a several type of sensors, actuators, displays and computers elements that interact and exchange information between each other to give your home the smart functionality and provide you with automated, customized, and comfortable services. The lights switch automatically on when you enter to a room and switch off when you leave. If there is too bright light coming through the windows, the blinds adjust automatically to the sun intensity. Your home adjusts the heating/cooling system, by combining data from outdoor and indoor temperature, weather forecast from the Internet, and your personal preferences. The computer control and monitor the operation of all the household appliances such as washing machine, dishwasher, water heater, heating system, etc; with the goal of having an smarter and energy-efficient home. When leaving home for work and closing your door, every window opened is automatically closed and the heating, electric devices, water and gas are turn off automatically to assure nothing would happen while you are not there.

64
Alerts about events that you might want to know about while you are gone like water leaks and unexpected access to your home are send to your mobile or to the police, security or utility company who can connect to your home and see what is happening. Health devices, which are capable of transmitting data to doctors and other relevant agencies in case of needed, are also connected to your home network. Moreover, in your house you have the below smart devices:
• "Smart" Refrigerator: It generates your shopping list automatically and sends it to the supermarket. It also advices healthy receipts based on the items inside. Moreover, it notifies you when products (e.g. Milk, eggs) are running low.
• "Smart" Smoke Detector: Smoke sensors in your home turn off oven, microwave oven, and other devices and turn on the fan to ventilate the smoke out of the kitchen.
• "Smart" Bathroom: The toilet analyzed your waste (e.g. urine or excrement) and advises about any possible medical condition. The analysis is send periodically to doctor who will record it as a part of your medical history.
• "Smart" Wardrobe: The wardrobe digitally looks up the weather forecast and advises what to wear based on the outside environment.
General Information: How old are you? ( ) under 25 ( ) 25-35 ( ) 35-44 ( ) 45-54 ( ) Over 65
Users Privacy Factors: 1. Companies or other institutions accessing the information generated by my smart home devices should not use my personal information for other purposes than the original without notifying me or getting my authorization.* ( ) Strongly disagree ( ) Moderately disagree ( ) Slightly disagree ( ) Neutral ( ) Slightly agree ( ) Moderately agree ( ) Strongly agree 2. Companies or other institutions accessing the information generated by my smart home devices should not share my information with other companies/entities without my authorization.* ( ) Strongly disagree ( ) Moderately disagree ( ) Slightly disagree ( ) Neutral ( ) Slightly agree ( ) Moderately agree ( ) Strongly agree 3. Companies or other institutions accessing the information generated by my smart home devices should never sell my personal information in their computer databases to other companies.* ( ) Strongly disagree ( ) Moderately disagree ( ) Slightly disagree ( ) Neutral ( ) Slightly agree ( ) Moderately agree ( ) Strongly agree

65
4. It is important to me to control how much information is collected by my smart home devices. ( ) Strongly disagree ( ) Moderately disagree ( ) Slightly disagree ( ) Neutral ( ) Slightly agree ( ) Moderately agree ( ) Strongly agree 5. I consider consumer privacy is a matter of consumers’ right to exercise control and autonomy over decisions about how their information is collected, used, and shared. ( ) Strongly disagree ( ) Moderately disagree ( ) Slightly disagree ( ) Neutral ( ) Slightly agree ( ) Moderately agree ( ) Strongly agree 6. I believe that my privacy is invaded when I am unable to control how much information is collected by my smart devices. ( ) Strongly disagree ( ) Moderately disagree ( ) Slightly disagree ( ) Neutral ( ) Slightly agree ( ) Moderately agree ( ) Strongly agree 7. It is important to me that I am aware and knowledgeable about how my personal
information will be used. ( ) Strongly disagree ( ) Moderately disagree ( ) Slightly disagree ( ) Neutral ( ) Slightly agree ( ) Moderately agree ( ) Strongly agree 8. It is important to me to know how much personal information is collected by the smart devices. ( ) Strongly disagree ( ) Moderately disagree ( ) Slightly disagree ( ) Neutral ( ) Slightly agree ( ) Moderately agree ( ) Strongly agree 9. It is important to me to know who much personal information is collected by the companies/institutions accessing the information generated by my home. ( ) Strongly disagree ( ) Moderately disagree ( ) Slightly disagree ( ) Neutral ( ) Slightly agree ( ) Moderately agree ( ) Strongly agree 10. I am concerned that smart devices are collecting too much information about me. ( ) Strongly disagree ( ) Moderately disagree ( ) Slightly disagree ( ) Neutral ( ) Slightly agree ( ) Moderately agree ( ) Strongly agree 11. I am concerned that companies or other institutions accessing the information
generated by my home may be monitoring me.* ( ) Strongly disagree ( ) Moderately disagree ( ) Slightly disagree ( ) Neutral ( ) Slightly agree ( ) Moderately agree ( ) Strongly agree 12. I am concern that companies accessing the information produced by my smart home devices may be analyzing my behavioral patterns based on my devices usages (e.g how long TV was ON or OFF).* ( ) Strongly disagree ( ) Moderately disagree ( ) Slightly disagree ( ) Neutral ( ) Slightly agree ( ) Moderately agree ( ) Strongly agree
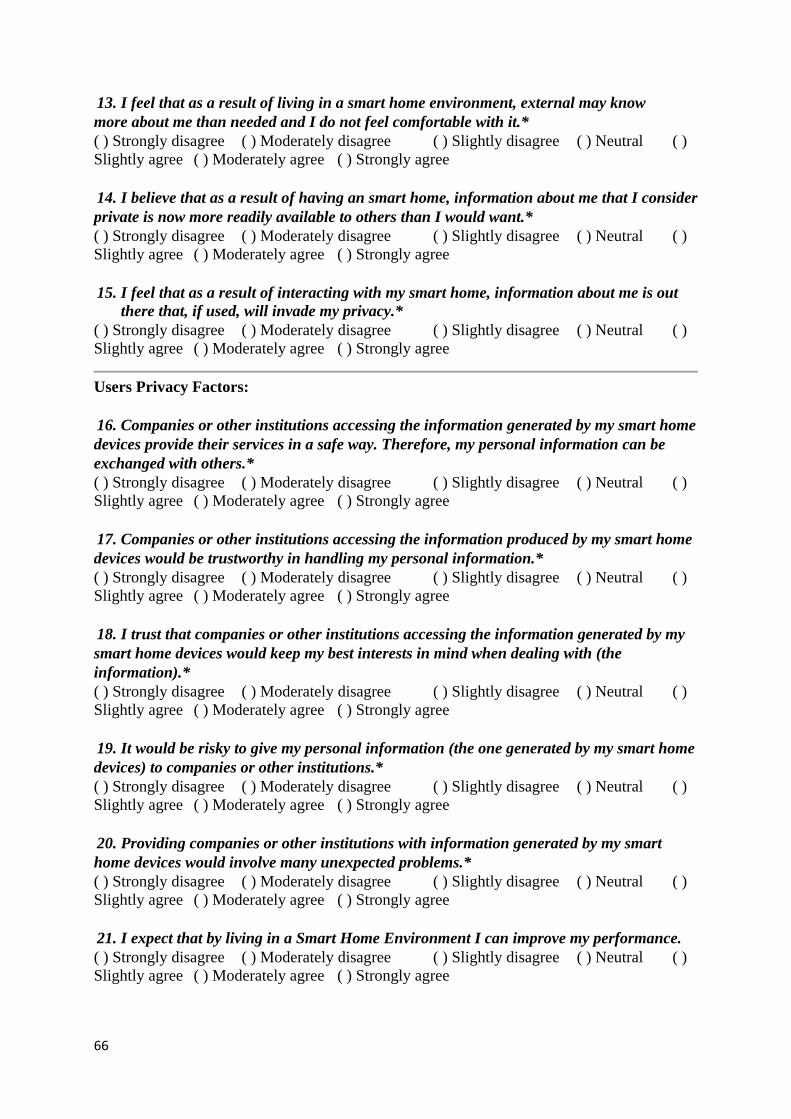
66
13. I feel that as a result of living in a smart home environment, external may know more about me than needed and I do not feel comfortable with it.* ( ) Strongly disagree ( ) Moderately disagree ( ) Slightly disagree ( ) Neutral ( ) Slightly agree ( ) Moderately agree ( ) Strongly agree 14. I believe that as a result of having an smart home, information about me that I consider private is now more readily available to others than I would want.* ( ) Strongly disagree ( ) Moderately disagree ( ) Slightly disagree ( ) Neutral ( ) Slightly agree ( ) Moderately agree ( ) Strongly agree 15. I feel that as a result of interacting with my smart home, information about me is out
there that, if used, will invade my privacy.* ( ) Strongly disagree ( ) Moderately disagree ( ) Slightly disagree ( ) Neutral ( ) Slightly agree ( ) Moderately agree ( ) Strongly agree
Users Privacy Factors: 16. Companies or other institutions accessing the information generated by my smart home devices provide their services in a safe way. Therefore, my personal information can be exchanged with others.* ( ) Strongly disagree ( ) Moderately disagree ( ) Slightly disagree ( ) Neutral ( ) Slightly agree ( ) Moderately agree ( ) Strongly agree 17. Companies or other institutions accessing the information produced by my smart home devices would be trustworthy in handling my personal information.* ( ) Strongly disagree ( ) Moderately disagree ( ) Slightly disagree ( ) Neutral ( ) Slightly agree ( ) Moderately agree ( ) Strongly agree 18. I trust that companies or other institutions accessing the information generated by my smart home devices would keep my best interests in mind when dealing with (the information).* ( ) Strongly disagree ( ) Moderately disagree ( ) Slightly disagree ( ) Neutral ( ) Slightly agree ( ) Moderately agree ( ) Strongly agree 19. It would be risky to give my personal information (the one generated by my smart home devices) to companies or other institutions.* ( ) Strongly disagree ( ) Moderately disagree ( ) Slightly disagree ( ) Neutral ( ) Slightly agree ( ) Moderately agree ( ) Strongly agree 20. Providing companies or other institutions with information generated by my smart home devices would involve many unexpected problems.* ( ) Strongly disagree ( ) Moderately disagree ( ) Slightly disagree ( ) Neutral ( ) Slightly agree ( ) Moderately agree ( ) Strongly agree 21. I expect that by living in a Smart Home Environment I can improve my performance. ( ) Strongly disagree ( ) Moderately disagree ( ) Slightly disagree ( ) Neutral ( ) Slightly agree ( ) Moderately agree ( ) Strongly agree

67
22. I expect that by living in a Smart Home Environment I can improve my productivity. ( ) Strongly disagree ( ) Moderately disagree ( ) Slightly disagree ( ) Neutral ( ) Slightly agree ( ) Moderately agree ( ) Strongly agree 23. I expect that by living in a Smart Home Environment I can improve my effectiveness. ( ) Strongly disagree ( ) Moderately disagree ( ) Slightly disagree ( ) Neutral ( ) Slightly agree ( ) Moderately agree ( ) Strongly agree 24. I am likely to disclose my personal information in order to receive services for my smart
home enviroment.* ( ) Strongly disagree ( ) Moderately disagree ( ) Slightly disagree ( ) Neutral ( ) Slightly agree ( ) Moderately agree ( ) Strongly agree
Evaluations: 25. How do you expected your personal information to be best protected? [ ] By the introduction of international law, which is probably more practical, but take may take longer in developing. [ ] By the introduction of soft law, e.g. regulations established by private organization. [ ] By technical means, e.g. encrypted communication channels. 26. How would you like to be informed that your personal information will be used? [ ] General indication without any details of potential use of personal information. [ ] Specific and detailed indication including potential use of personal information. 27. How often would you like to be informed that your personal information will be used? ( ) Every time when personal information is used. ( ) The first time personal information is used.
Thank You!


Appenndix B: SSurvey RResults
69

70

71

72

73

74

75

76
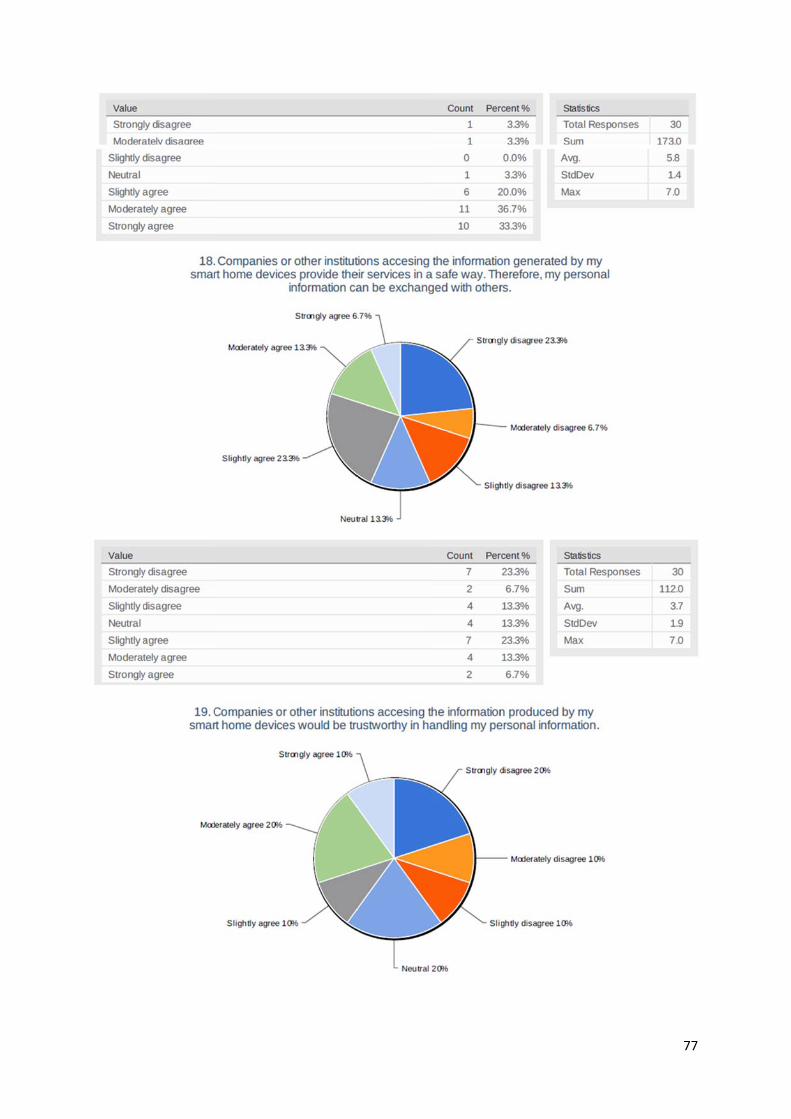
77

78

79

80

81

82

83
Appendix C: SPSS Statistics Results - Reliability
Cronbach’s Unauthorized Secondary Uses (UN)
Cronbach's Alpha N of Items
0.515 3
Mean Variance Std. Deviation N of Items
19.60 6.110 2.472 3
Cronbach’s Control (CL)
Cronbach's Alpha N of Items
0.767 3
Mean Variance Std. Deviation N of Items
18.20 12.303 3.508 3
Cronbach’s Awareness (AW) Cronbach's Alpha N of Items
0.840 4
Mean Variance Std. Deviation N of Items
23.77 25.220 5.022 4
Cronbach’s Surveillance (SUR)
Cronbach's Alpha N of Items
0.745 2
Mean Variance Std. Deviation N of Items
11.53 5.844 2.417 2
Cronbach’s Intrusion (INT)
Cronbach's Alpha N of Items
0.813 3
Mean Variance Std. Deviation N of Items
16.40 13.697 3.701 3
Cronbach’s Trust (TR)
Cronbach's Alpha N of Items
0.867 3
Mean Variance Std. Deviation N of Items
10.80 27.200 5.215 3
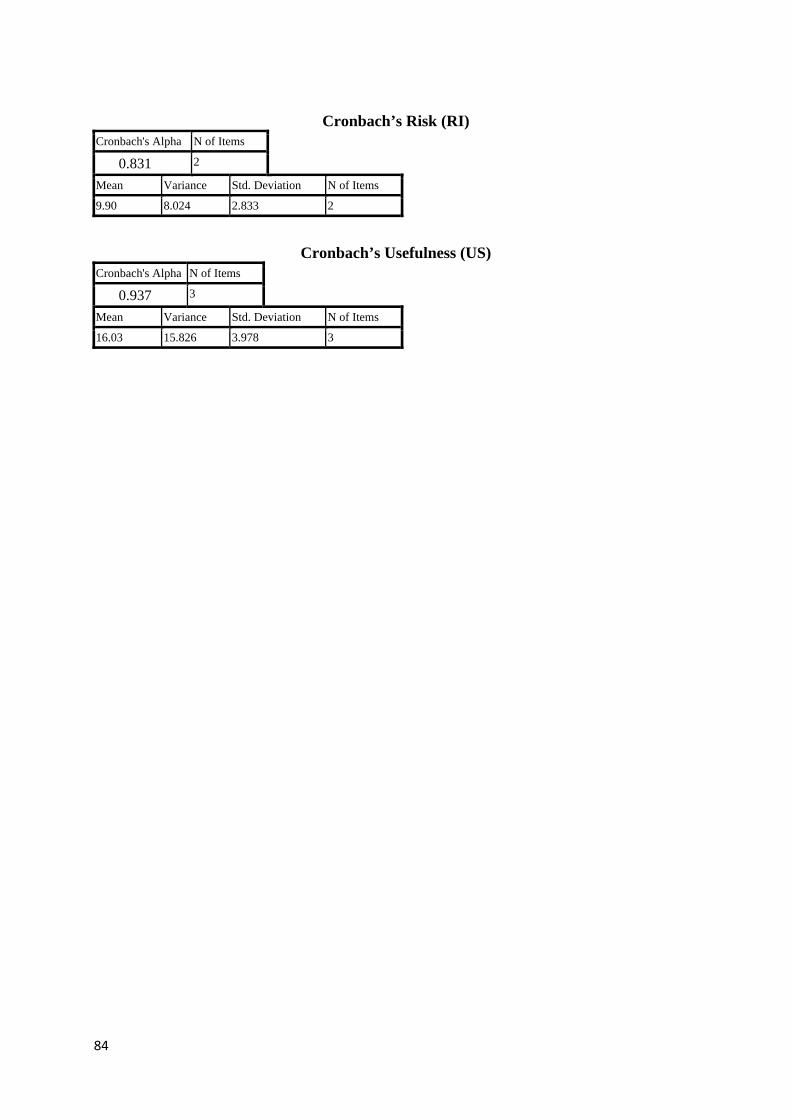
84
Cronbach’s Risk (RI)
Cronbach's Alpha N of Items
0.831 2
Mean Variance Std. Deviation N of Items
9.90 8.024 2.833 2
Cronbach’s Usefulness (US) Cronbach's Alpha N of Items
0.937 3
Mean Variance Std. Deviation N of Items
16.03 15.826 3.978 3

85
Appendix D: Correlation Matrix
UN1 UN2 UN3 CL1 CL2 CL3 AW1 AW2 AW3 AW4 SUR1 SUR2 INT1 INT2 INT3 TR1 TR2 TR3 RI1 RI2 US1 US2 US3 ITE1 UN1 1.00 .437 .192 .198 .211 .113 .232 .224 .249 .080 .085 .010 .055 .006 -.029 -.314 -.318 -.283 .179 .230 -.034 .050 -.095 -.414 UN2 .437 1.00 .307 -.018 -.073 -.070 .056 -.019 -.023 .120 .119 -.074 .090 .135 .090 -.055 .133 .089 -.199 .060 -.249 -.144 -.303 -.360 UN3 .192 .307 1.00 .168 .250 -.028 .165 .031 .025 .201 .183 .033 .085 .204 .034 -.186 -.127 -.229 .093 .253 -.007 .075 .022 -.172 CL1 .198 -.018 .168 1.00 .723 .609 .599 .798 .836 .420 .198 .250 .474 .343 .282 -.210 -.239 -.273 .516 .484 .001 .048 -.035 -.097 CL2 .211 -.073 .250 .723 1.00 .473 .661 .639 .711 .473 .273 .513 .713 .572 .474 -.499 -.251 -.350 .581 .518 .056 .089 .061 -.363 CL3 .113 -.070 -.028 .609 .473 1.00 .377 .805 .646 .728 .605 .458 .395 .462 .599 -.266 -.365 -.309 .430 .513 -.070 -.002 -.159 -.237
AW1 .232 .056 .165 .599 .661 .377 1.00 .540 .517 .487 .351 .391 .430 .304 .424 -.454 -.233 -.205 .494 .463 .046 .290 .071 -.290 AW2 .224 -.019 .031 .798 .639 .805 .540 1.00 .870 .583 .498 .468 .418 .471 .589 -.388 -.347 -.284 .442 .592 -.060 .067 -.031 -.217 AW3 .249 -.023 .025 .836 .711 .646 .517 .870 1.00 .470 .327 .368 .387 .391 .367 -.376 -.316 -.310 .357 .460 .038 .131 .047 -.153 AW4 .080 .120 .201 .420 .473 .728 .487 .583 .470 1.00 .613 .604 .328 .536 .658 -.318 -.321 -.102 .341 .484 .013 -.002 -.088 -.235 SUR1 .085 .119 .183 .198 .273 .605 .351 .498 .327 .613 1.00 .605 .330 .603 .768 -.261 -.332 -.137 .255 .515 .026 .206 .006 -.382 SUR2 .010 -.074 .033 .250 .513 .458 .391 .468 .368 .604 .605 1.00 .458 .689 .570 -.323 -.219 -.062 .499 .590 .028 .143 .069 -.116 INT1 .055 .090 .085 .474 .713 .395 .430 .418 .387 .328 .330 .458 1.00 .624 .483 -.378 -.117 -.246 .453 .350 -.072 -.042 -.197 -.351 INT2 .006 .135 .204 .343 .572 .462 .304 .471 .391 .536 .603 .689 .624 1.00 .671 -.326 -.314 -.199 .288 .429 .108 .112 .081 -.277 INT3 -.029 .090 .034 .282 .474 .599 .424 .589 .367 .658 .768 .570 .483 .671 1.00 -.412 -.278 -.117 .331 .509 -.073 -.058 -.108 -.494 TR1 -.314 -.055 -.186 -.210 -.499 -.266 -.454 -.388 -.376 -.318 -.261 -.323 -.378 -.326 -.412 1.00 .687 .663 -.476 -.460 -.048 -.050 .032 .552 TR2 -.318 .133 -.127 -.239 -.251 -.365 -.233 -.347 -.316 -.321 -.332 -.219 -.117 -.314 -.278 .687 1.00 .713 -.350 -.367 -.226 -.105 -.090 .363 TR3 -.283 .089 -.229 -.273 -.350 -.309 -.205 -.284 -.310 -.102 -.137 -.062 -.246 -.199 -.117 .663 .713 1.00 -.240 -.127 .169 .175 .252 .403 RI1 .179 -.199 .093 .516 .581 .430 .494 .442 .357 .341 .255 .499 .453 .288 .331 -.476 -.350 -.240 1.00 .728 .180 .168 .095 -.352 RI2 .230 .060 .253 .484 .518 .513 .463 .592 .460 .484 .515 .590 .350 .429 .509 -.460 -.367 -.127 .728 1.00 .273 .396 .264 -.290 US1 -.034 -.249 -.007 .001 .056 -.070 .046 -.060 .038 .013 .026 .028 -.072 .108 -.073 -.048 -.226 .169 .180 .273 1.00 .804 .848 .136 US2 .050 -.144 .075 .048 .089 -.002 .290 .067 .131 -.002 .206 .143 -.042 .112 -.058 -.050 -.105 .175 .168 .396 .804 1.00 .857 .169 US3 -.095 -.303 .022 -.035 .061 -.159 .071 -.031 .047 -.088 .006 .069 -.197 .081 -.108 .032 -.090 .252 .095 .264 .848 .857 1.00 .298 ITE1 -.414 -.360 -.172 -.097 -.363 -.237 -.290 -.217 -.153 -.235 -.382 -.116 -.351 -.277 -.494 .552 .363 .403 -.352 -.290 .136 .169 .298 1.00


87
Appendix E: SPSS Statistics Results – Validity
6-factor loading structure with 24 items Interaction No. 1
Rotated Component Matrixa Component 1 2 3 4 5 6
UN1 0.683 UN2 0.849 UN3 0.583 CL1 0.886 CL2 0.532 0.717 CL3 0.600 0.655 AW1 0.501 AW2 0.824 AW3 0.869 AW4 0.730 SUR1 0.878 SUR2 0.706 INT1 0.769 INT2 0.704 INT3 0.848 TR1 0.772 TR2 0.873 TR3 0.854 RI1 0.579 RI2 US1 0.908 US2 0.933 US3 0.947 ITE1
Extraction Method: Principal Component Analysis. Rotation Method: Varimax with Kaiser Normalization. a. Rotation converged in 6 iterations.
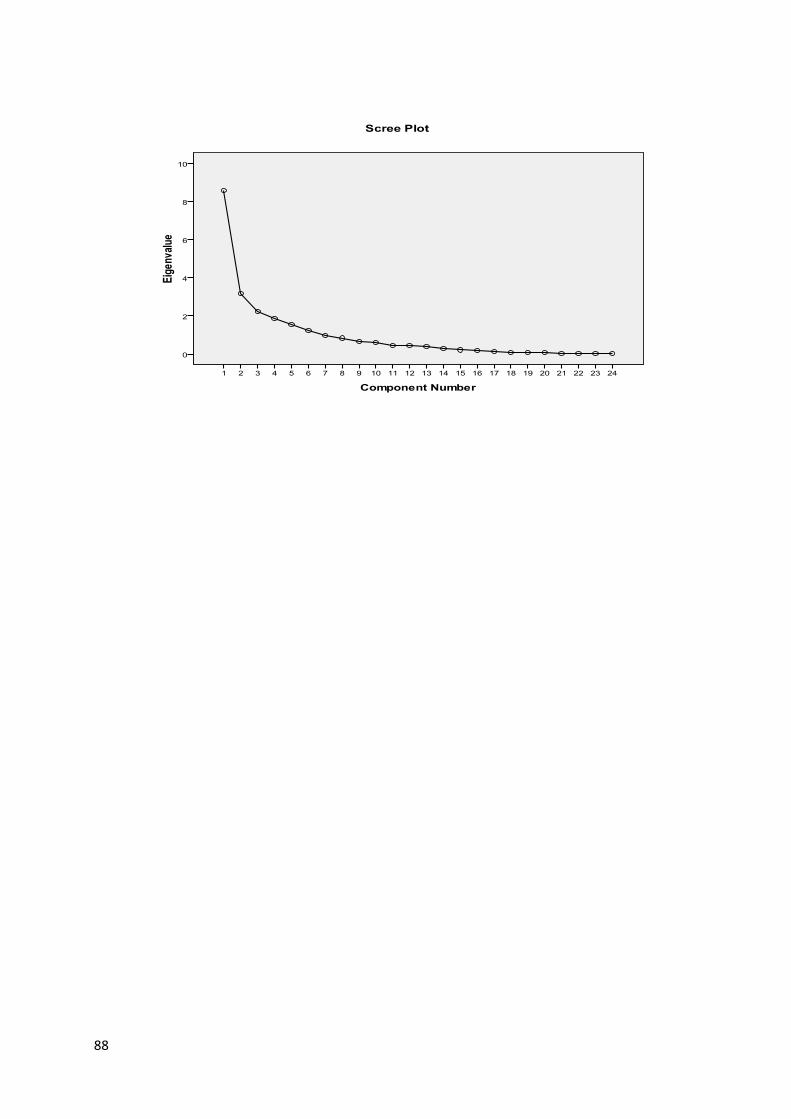
88

89
Total Variance Explained
Component
Initial Eigenvalues Extraction Sums of Squared Loadings Rotation Sums of Squared Loadings
Total % of Variance Cumulative % Total % of Variance Cumulative % Total % of Variance Cumulative %
1 8.557 35.654 35.654 8.557 35.654 35.654 4.287 17.863 17.863 2 3.172 13.216 48.870 3.172 13.216 48.870 3.864 16.099 33.962 3 2.222 9.257 58.126 2.222 9.257 58.126 3.098 12.908 46.870 4 1.873 7.805 65.931 1.873 7.805 65.931 2.837 11.820 58.690 5 1.557 6.488 72.419 1.557 6.488 72.419 2.563 10.678 69.368 6 1.243 5.178 77.597 1.243 5.178 77.597 1.975 8.229 77.597 7 0.977 4.069 81.666 8 0.840 3.499 85.165 9 0.656 2.733 87.899
10 0.589 2.456 90.355 11 0.455 1.894 92.249 12 0.432 1.801 94.050 13 0.377 1.570 95.620 14 0.267 1.113 96.733 15 0.215 0.895 97.628 16 0.166 0.692 98.320 17 0.113 0.470 98.790 18 0.084 0.348 99.139 19 0.075 0.314 99.452 20 0.059 0.244 99.696 21 0.034 0.141 99.837 22 0.022 0.090 99.927 23 0.009 0.039 99.966 24 0.008 0.034 100.000

90
3-factor loading structure with 24 items Interaction No. 2
Rotated Component Matrixa Component 1 2 3
UN1 0.654 UN2* UN3* CL1 0.664 CL2 0.721 CL3 0.806 AW1 0.595 AW2 0.823 AW3 0.695 AW4 0.782 SUR1 0.706 SUR2 0.761 INT1 0.638 INT2 0.735 INT3 0.798 TR1 -0.774 TR2 -0.713 TR3 -0.767 RI1 0.541 RI2 0.657 US1 0.903 US2 0.907 US3 0.950 ITE1 -0.619
Extraction Method: Principal Component Analysis. Rotation Method: Varimax with Kaiser Normalization.
a. Rotation converged in 5 iterations. *. Removed in next interaction due to no loading value

91

92
Total Variance Explained
Component
Initial Eigenvalues Extraction Sums of Squared Loadings Rotation Sums of Squared Loadings
Total % of Variance Cumulative % Total % of Variance Cumulative % Total % of Variance Cumulative %
1 8.557 35.654 35.654 8.557 35.654 35.654 7.384 30.765 30.765 2 3.172 13.216 48.870 3.172 13.216 48.870 3.415 14.228 44.993 3 2.222 9.257 58.126 2.222 9.257 58.126 3.152 13.133 58.126 4 1.873 7.805 65.931 5 1.557 6.488 72.419 6 1.243 5.178 77.597 7 0.977 4.069 81.666 8 0.840 3.499 85.165 9 0.656 2.733 87.899
10 0.589 2.456 90.355 11 0.455 1.894 92.249 12 0.432 1.801 94.050 13 0.377 1.570 95.620 14 0.267 1.113 96.733 15 0.215 0.895 97.628 16 0.166 0.692 98.320 17 0.113 0.470 98.790 18 0.084 0.348 99.139 19 0.075 0.314 99.452 20 0.059 0.244 99.696 21 0.034 0.141 99.837 22 0.022 0.090 99.927 23 0.009 0.039 99.966 24 0.008 0.034 100.000
Extraction Method: Principal Component Analysis.
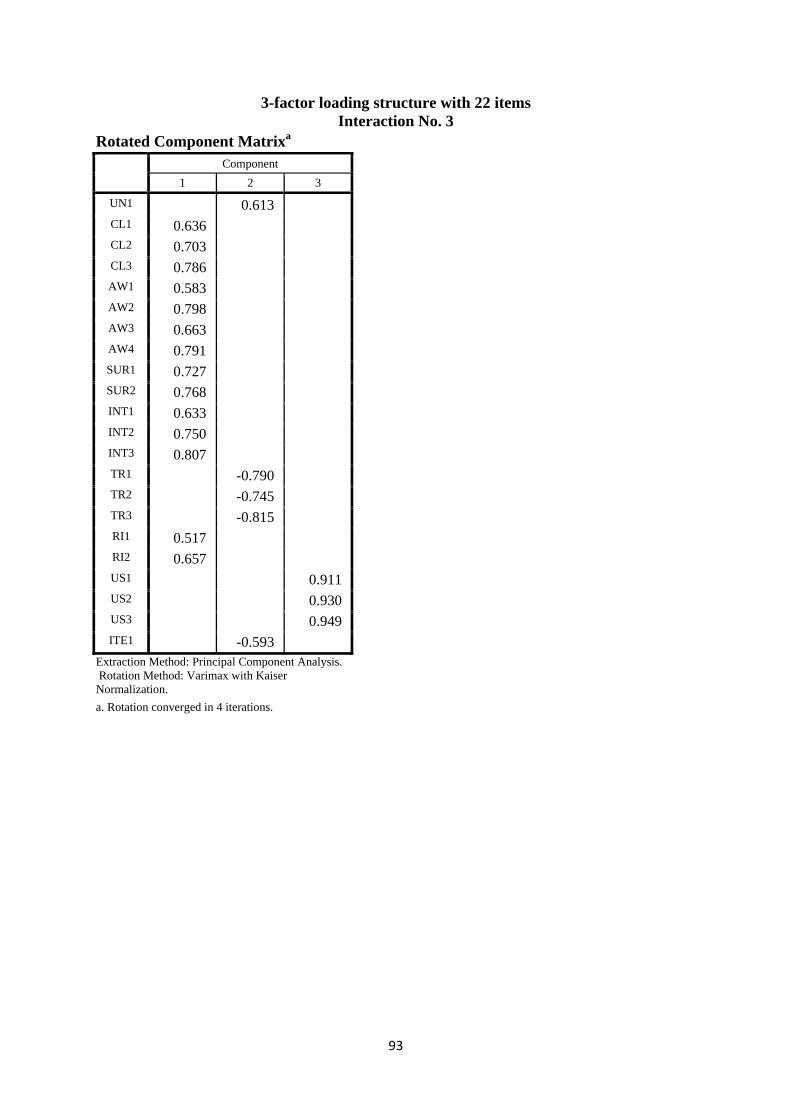
93
3-factor loading structure with 22 items Interaction No. 3
Rotated Component Matrixa Component 1 2 3
UN1 0.613 CL1 0.636 CL2 0.703 CL3 0.786 AW1 0.583 AW2 0.798 AW3 0.663 AW4 0.791 SUR1 0.727 SUR2 0.768 INT1 0.633 INT2 0.750 INT3 0.807 TR1 -0.790 TR2 -0.745 TR3 -0.815 RI1 0.517 RI2 0.657 US1 0.911 US2 0.930 US3 0.949 ITE1 -0.593
Extraction Method: Principal Component Analysis. Rotation Method: Varimax with Kaiser Normalization. a. Rotation converged in 4 iterations.
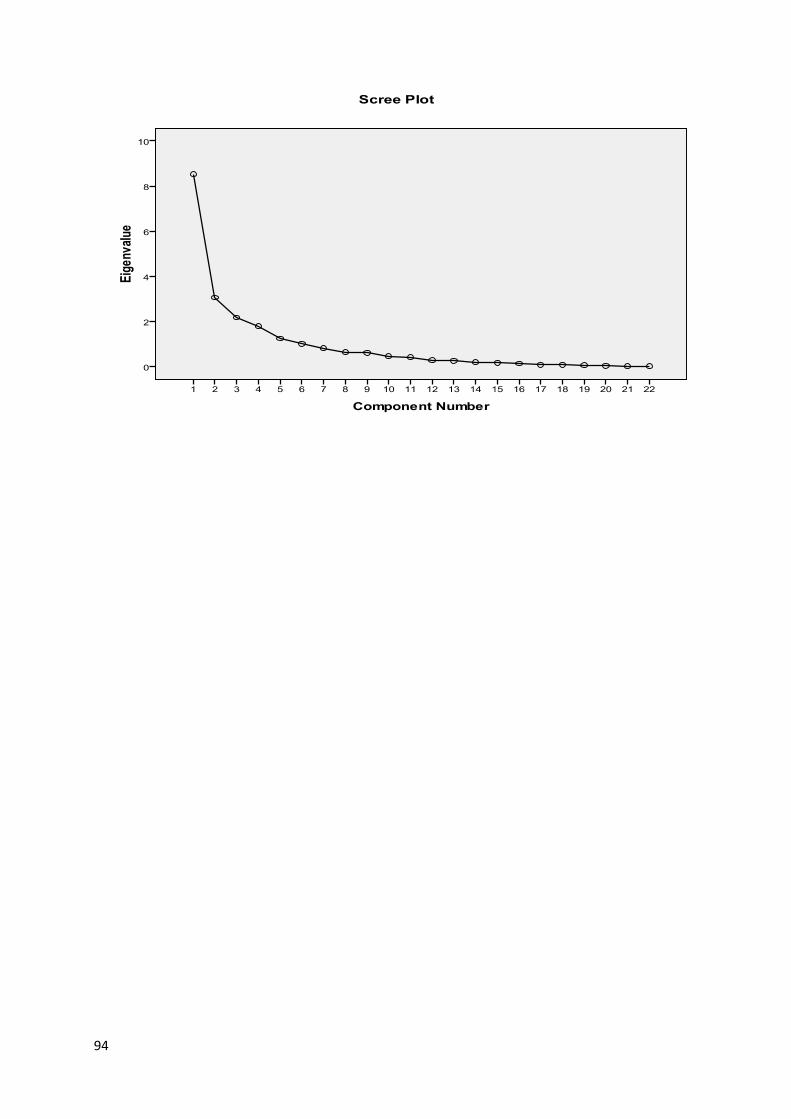
94

95
Total Variance Explained
Component
Initial Eigenvalues Extraction Sums of Squared Loadings Rotation Sums of Squared Loadings
Total % of Variance Cumulative % Total % of Variance Cumulative % Total % of Variance Cumulative %
1 8.513 38.693 38.693 8.513 38.693 38.693 7.211 32.778 32.778 2 3.058 13.898 52.591 3.058 13.898 52.591 3.481 15.823 48.600 3 2.174 9.881 62.472 2.174 9.881 62.472 3.052 13.872 62.472 4 1.792 8.147 70.620 5 1.244 5.655 76.275 6 1.008 4.584 80.858 7 0.809 3.677 84.536 8 0.645 2.932 87.468 9 0.602 2.736 90.204
10 0.450 2.046 92.250 11 0.421 1.913 94.164 12 0.280 1.272 95.436 13 0.248 1.127 96.563 14 0.185 0.839 97.402 15 0.164 0.746 98.148 16 0.136 0.620 98.768 17 0.087 0.394 99.162 18 0.079 0.358 99.520 19 0.051 0.232 99.752 20 0.028 0.128 99.880 21 0.017 0.077 99.957 22 0.009 0.043 100.000
Extraction Method: Principal Component Analysis.

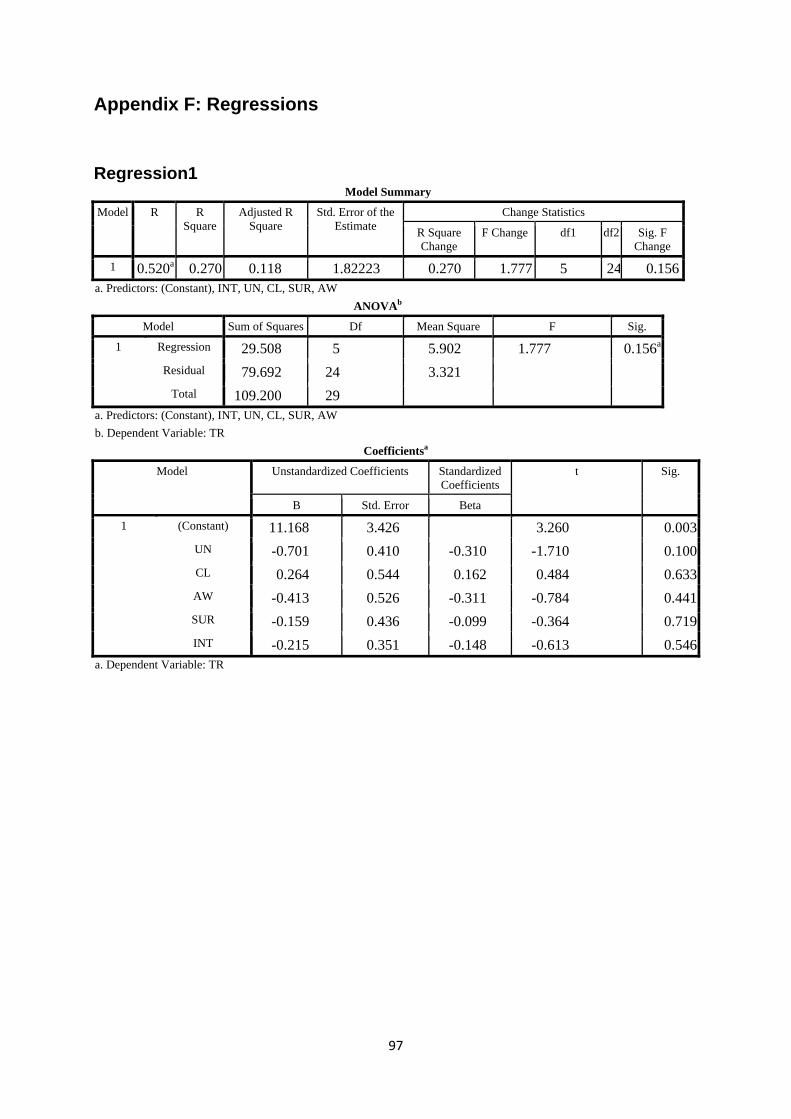
97
Appendix F: Regressions
Regression1
Model Summary
Model R R Square
Adjusted R Square
Std. Error of the Estimate
Change Statistics
R Square Change
F Change df1 df2 Sig. F Change
1 0.520a 0.270 0.118 1.82223 0.270 1.777 5 24 0.156a. Predictors: (Constant), INT, UN, CL, SUR, AW
ANOVAb
Model Sum of Squares Df Mean Square F Sig.
1 Regression 29.508 5 5.902 1.777 0.156a
Residual 79.692 24 3.321 Total 109.200 29
a. Predictors: (Constant), INT, UN, CL, SUR, AW b. Dependent Variable: TR
Coefficientsa
Model Unstandardized Coefficients Standardized Coefficients
t Sig.
B Std. Error Beta
1 (Constant) 11.168 3.426 3.260 0.003UN -0.701 0.410 -0.310 -1.710 0.100CL 0.264 0.544 0.162 0.484 0.633AW -0.413 0.526 -0.311 -0.784 0.441SUR -0.159 0.436 -0.099 -0.364 0.719INT -0.215 0.351 -0.148 -0.613 0.546
a. Dependent Variable: TR
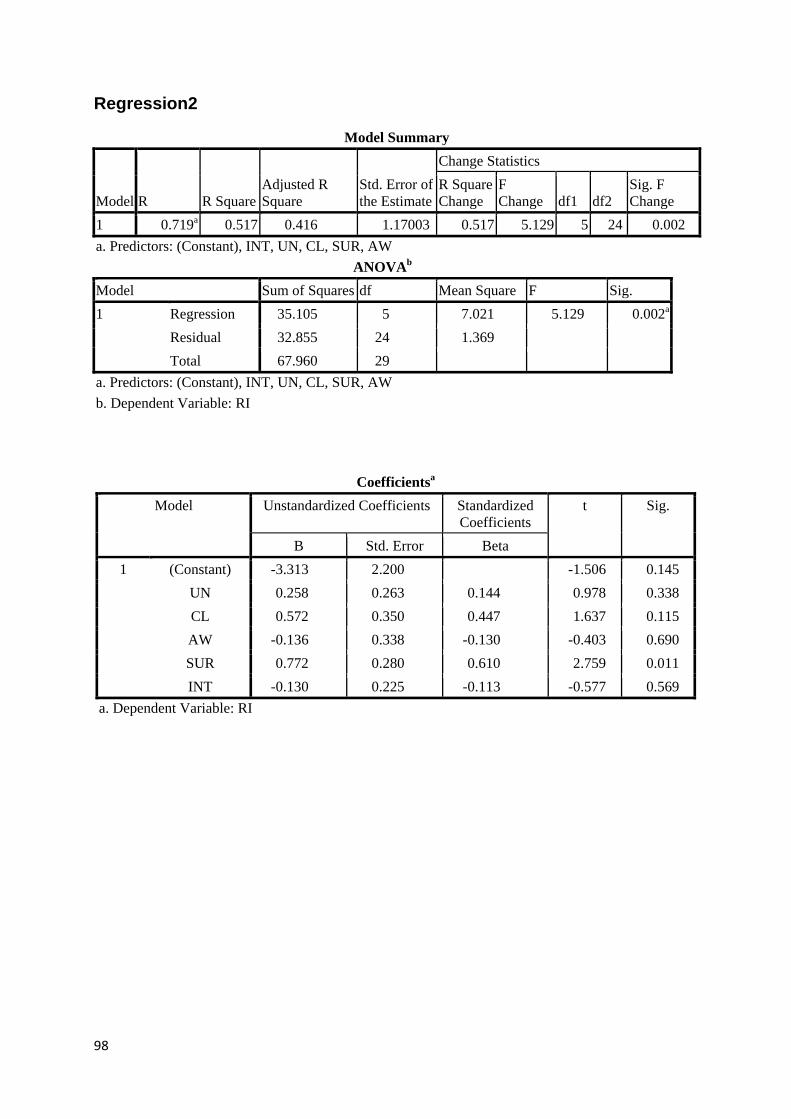
98
Regression2
Model Summary
Model R R Square Adjusted R Square
Std. Error of the Estimate
Change Statistics R Square Change
F Change df1 df2
Sig. F Change
1 0.719a 0.517 0.416 1.17003 0.517 5.129 5 24 0.002 a. Predictors: (Constant), INT, UN, CL, SUR, AW
ANOVAb Model Sum of Squares df Mean Square F Sig. 1 Regression 35.105 5 7.021 5.129 0.002a
Residual 32.855 24 1.369 Total 67.960 29
a. Predictors: (Constant), INT, UN, CL, SUR, AW b. Dependent Variable: RI
Coefficientsa
Model Unstandardized Coefficients Standardized Coefficients
t Sig.
B Std. Error Beta 1 (Constant) -3.313 2.200 -1.506 0.145
UN 0.258 0.263 0.144 0.978 0.338 CL 0.572 0.350 0.447 1.637 0.115 AW -0.136 0.338 -0.130 -0.403 0.690 SUR 0.772 0.280 0.610 2.759 0.011 INT -0.130 0.225 -0.113 -0.577 0.569
a. Dependent Variable: RI

99
Regression3 Model Summary
Model R R Square Adjusted R Square
Std. Error of the Estimate
Change Statistics R Square Change F Change df1 df2
Sig. F Change
1 0.615a 0.379 0.249 1.46412 0.379 2.925 5 24 0.034a. Predictors: (Constant), INT, UN, CL, SUR, AW
ANOVAb
Model Sum of Squares df Mean Square F Sig.
1 Regression 31.352 5 6.270 2.925 0.034a Residual 51.448 24 2.144
Total 82.800 29 a. Predictors: (Constant), INT, UN, CL, SUR, AW b. Dependent Variable: ITE
Coefficientsa
Model
Unstandardized Coefficients
Standardized Coefficients
t Sig. B Std. Error Beta 1 (Constant) 12.306 2.753 4.471 0.000
UN -0.872 0.330 -0.443 -2.647 0.014 CL 0.053 0.437 0.037 0.121 0.905 AW 0.106 0.423 0.091 0.250 0.805 SUR 0.058 0.350 0.042 0.166 0.869 INT -0.672 0.282 -0.530 -2.385 0.025
a. Dependent Variable: ITE

100
Regression4 Model Summary
Model R R Square Adjusted R Square
Std. Error of the Estimate
Change Statistics R Square Change
F Change df1 df2
Sig. F Change
1 0.261a 0.068 -0.126 1.44094 0.068 0.350 5 24 0.877 a. Predictors: (Constant), INT, UN, CL, SUR, AW
ANOVAb Model Sum of Squares df Mean Square F Sig. 1 Regression 3.635 5 0.727 0.350 0.877a
Residual 49.832 24 2.076 Total 53.467 29
a. Predictors: (Constant), INT, UN, CL, SUR, AW b. Dependent Variable: US
Coefficientsa
Model Unstandardized Coefficients
Standardized Coefficients
t Sig. B Std. Error Beta 1 (Constant) 4.280 2.709 1.580 0.127
UN -0.045 0.324 -0.029 -0.139 0.890 CL 0.450 0.430 0.396 1.046 0.306 AW -0.364 0.416 -0.392 -0.875 0.390 SUR 0.365 0.345 0.325 1.060 0.300 INT -0.217 0.277 -0.213 -0.783 0.441
a. Dependent Variable: US
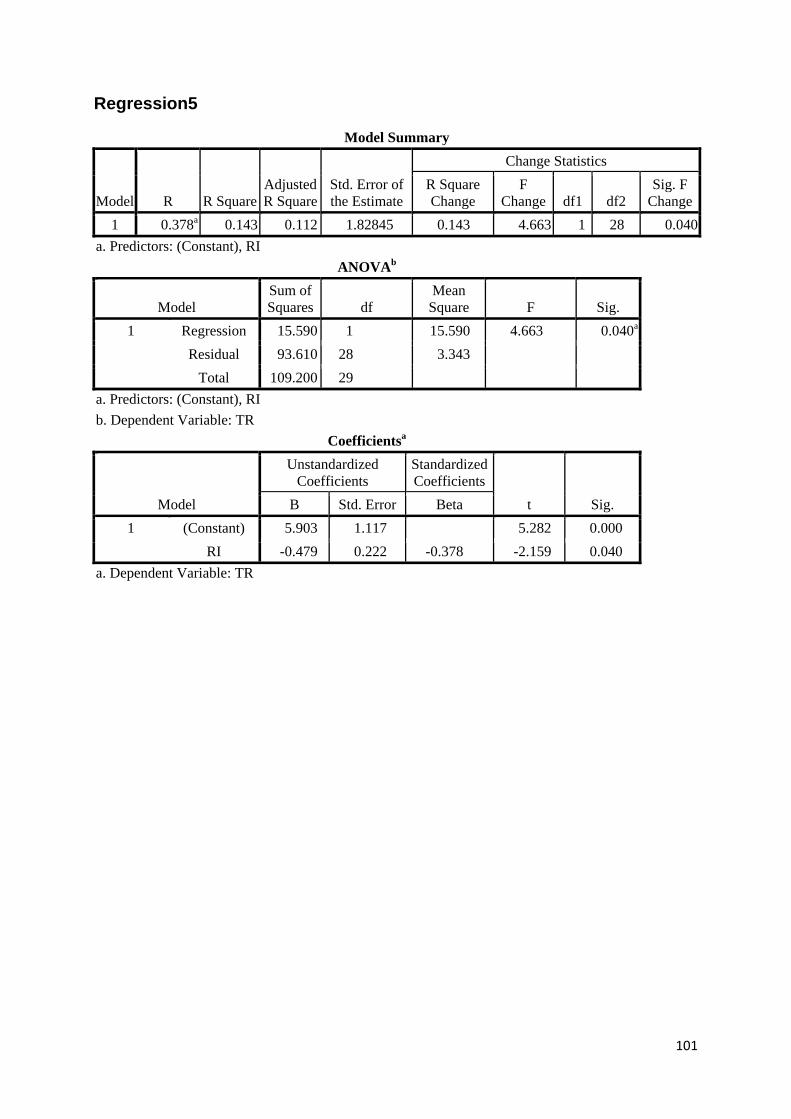
101
Regression5
Model Summary
Model R R Square Adjusted R Square
Std. Error of the Estimate
Change Statistics R Square Change
F Change df1 df2
Sig. F Change
1 0.378a 0.143 0.112 1.82845 0.143 4.663 1 28 0.040a. Predictors: (Constant), RI
ANOVAb
Model Sum of Squares df
Mean Square F Sig.
1 Regression 15.590 1 15.590 4.663 0.040a Residual 93.610 28 3.343
Total 109.200 29 a. Predictors: (Constant), RI b. Dependent Variable: TR
Coefficientsa
Model
Unstandardized Coefficients
Standardized Coefficients
t Sig. B Std. Error Beta 1 (Constant) 5.903 1.117 5.282 0.000
RI -0.479 0.222 -0.378 -2.159 0.040 a. Dependent Variable: TR

102
Regression6
Model Summary
Model R R Square Adjusted R Square
Std. Error of the Estimate
Change Statistics R Square Change F Change df1 df2
Sig. F Change
1 0.318a 0.101 0.069 1.47709 0.101 3.149 1 28 0.087a. Predictors: (Constant), ITE
ANOVAb
Model Sum of Squares df Mean Square F Sig.
1 Regression 6.870 1 6.870 3.149 0.087a Residual 61.091 28 2.182
Total 67.960 29 a. Predictors: (Constant), ITE b. Dependent Variable: RI
Coefficientsa
Model
Unstandardized Coefficients
Standardized Coefficients
t Sig. B Std. Error Beta 1 (Constant) 6.018 0.733 8.208 0.000
ITE -0.288 0.162 -0.318 -1.774 0.087 a. Dependent Variable: RI
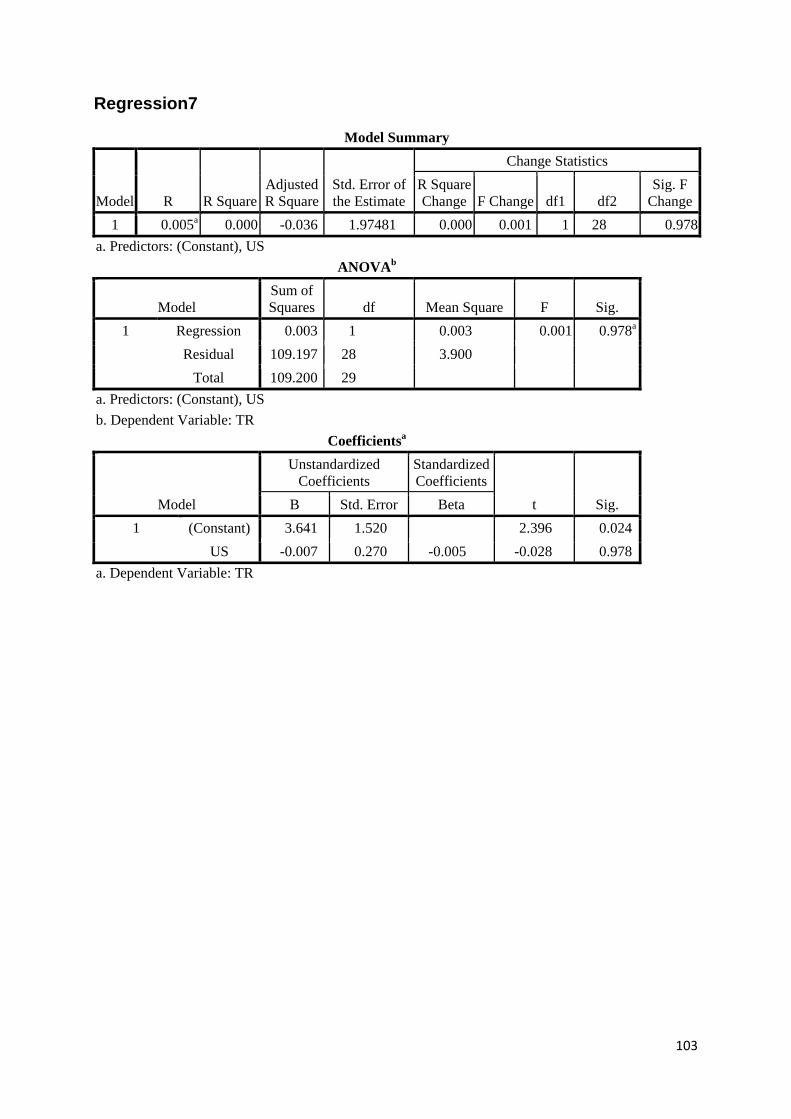
103
Regression7
Model Summary
Model R R Square Adjusted R Square
Std. Error of the Estimate
Change Statistics R Square Change F Change df1 df2
Sig. F Change
1 0.005a 0.000 -0.036 1.97481 0.000 0.001 1 28 0.978a. Predictors: (Constant), US
ANOVAb
Model Sum of Squares df Mean Square F Sig.
1 Regression 0.003 1 0.003 0.001 0.978a Residual 109.197 28 3.900
Total 109.200 29 a. Predictors: (Constant), US b. Dependent Variable: TR
Coefficientsa
Model
Unstandardized Coefficients
Standardized Coefficients
t Sig. B Std. Error Beta 1 (Constant) 3.641 1.520 2.396 0.024
US -0.007 0.270 -0.005 -0.028 0.978 a. Dependent Variable: TR

104
Regression8
Model Summary
Model R R Square Adjusted R Square
Std. Error of the
Estimate
Change Statistics R Square Change F Change df1 df2
Sig. F Change
1 0.425a 0.181 0.151 1.78774 0.181 6.168 1 28 0.019 a. Predictors: (Constant), ITE
ANOVAb
Model Sum of Squares df Mean Square F Sig.
1 Regression 19.712 1 19.712 6.168 0.019a Residual 89.488 28 3.196
Total 109.200 29 a. Predictors: (Constant), ITE b. Dependent Variable: TR
Coefficientsa
Model Unstandardized Coefficients
Standardized Coefficients
t Sig. B Std. Error Beta 1 (Constant) 1.551 0.887 1.748 0.092
ITE 0.488 0.196 0.425 2.483 0.019a. Dependent Variable: TR

105
Appendix G: Privacy Concerns PCA
KMO and Bartlett's Test Kaiser-Meyer-Olkin Measure of Sampling Adequacy. 0.600 Bartlett's Test of Sphericity
Approx. Chi-Square 64.504 df 10 Sig. 0.000
Correlation Matrixa AW_ SUR INT UN CL Correlation AW 1.000 0.590 0.523 0.232 0.826
SUR 0.590 1.000 0.659 0.049 0.320 INT 0.523 0.659 1.000 0.002 0.393 UN 0.232 0.049 0.002 1.000 0.193 CL 0.826 0.320 0.393 0.193 1.000
Sig. (1-tailed) AW 0.000 0.002 0.109 0.000 SUR 0.000 0.000 0.399 0.042 INT 0.002 0.000 0.496 0.016 UN 0.109 0.399 0.496 0.154 CL 0.000 0.042 0.016 0.154
a. Determinant = .088
Component 1 2 INT 0.855 -0.079 SUR 0.847 -0.040 AW 0.790 0.495 CL 0.627 0.565 UN -0.094 0.864 Extraction Method: Principal Component Analysis. Rotation Method: Varimax with Kaiser Normalization. a. Rotation converged in 3 iterations.

106
TRITA-ICT-EX-2014:34
www.kth.se


![Visualisering av mjukvarusystem och systemberoenden1080324/FULLTEXT01.pdf · Visualisering kan därför hjälpa vid underhållning och utökning av mjukvarusystem [4]. Ett sätt att](https://img.pdfslide.us/doc/110x75/5f5efc58788a8b152f05a310/visualisering-av-mjukvarusystem-och-1080324fulltext01pdf-visualisering-kan-drfr.jpg)