Embed Size (px)
Citation preview
Prioritizing Mainstream and Non-mainstream InterventionsGary Ginsberg, DrPH
52
Prioritising Mainstream and non-mainstream interventions
Using economic-epidemiological
evaluations
(cost-utility analysis)
Need for health services when there is a POTENTIAL FOR IMPROVEMENT IN HEALTH STATUS
CULYER: (relates needs to output)
100
50
0 AGE
HSI
LIMP
Natural Healing
Medical Intervention for Broken Leg
POTENTIAL FOR AVOIDANCE OF REDUCTIONS IN HEALTH STATUS:
CULYER: (relates needs to output)
100
50
0
Victim
Epidemic
INNOCULATIONAGE
HSIHealthy Profile
PLAYING DOCTORS (EQUIVALENCE).
We are asked to play the role of a Doctor (G-d) who only has the resources to treat 1 of 2 groups. Both groups will die if one is not helped immediately. We are asked,
" How many people in state of health X" (eg.spina bifida) are equivalent to 100 persons of the same race, age and sex who are from a standard healthy population".
IF X was spina bifida & the reply was 140, then HSI of SB = 100/140 = 0.70
IF X was wheelchair bound people & reply was 110, then HSI of wheelchair bound people is 100/110 = 0.91
VS
TIME TRADE OFF.What length of time (X) in a totally healthy state (HH=1 with HD=0 representing death) would be equivalent to a longer length of time (T) in some dysfunctional state (e.g:HS wheelchair bound)????
HS.T = HH.X
so HS = X/T
Say, we regard 50 years of health life to be equivalent to 75 years in a wheelchair: then::::
HS = 50/75 = 0.666
*high reliability,correlates with gold-standard lottery method BUT JUDGEMENTS ARE HYPOTHETICAL UNLESS PATIENTS HAVEEXPERIENCED THE DYSFUNCTIONAL STATES.
* DURATION OF STATES AFFECTS UTILITY* DISEASE LABEL MATTERS (CANCER PHOBICS) * HAVING THE DISEASE MAKES A DIFFERENCE. Sackett & Torrance, Jnl Chronic Diseases,1978; 31; 697-704:
0 0.2 0.4 0.6 0.8 1
3 mths HOSPITAL
8 years HOSPITAL
8 years HOME
LIFE HOSPITAL
LIFE HOME
DIALYSIS STATE:
HEALTH
STATE:
DIALYSIS PATIENTS GENERAL POPULATION
HEALTH STATE UTILITY:
Sackett & Torrance (1982)
Prioritizing Mainstream and Non-mainstream InterventionsGary Ginsberg, DrPH
53
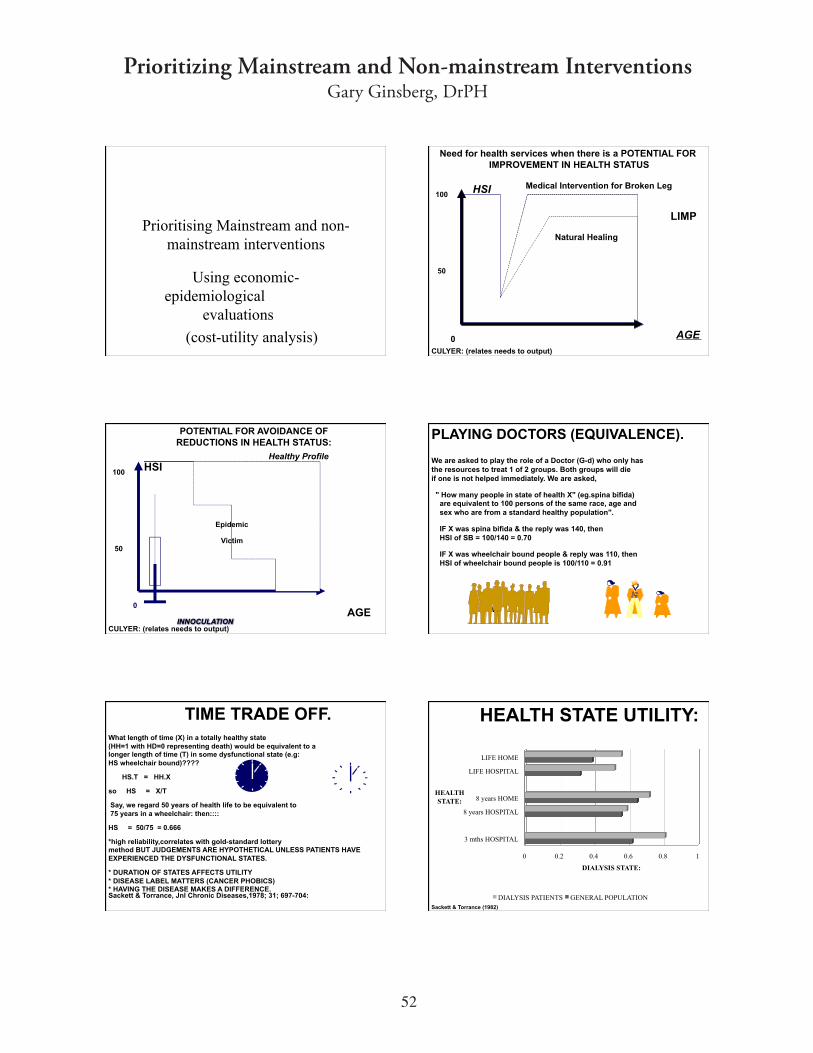
STANDARD GAMBLE:
VON-NEUMAN MORGENSTERN LOTTERY: **** THEORETICALLY CORRECT BUT HARD FOR PATIENTS TO UNDERSTAND & GIVE CONSISTENT ANSWERS TO.****
INTERMEDIATE p ---BETTER OUTCOME H(A) HEALTH vs OUTCOME 1-p --- WORSE OUTCOME H(C) H(B)
!!Choose p, so we are indifferent between being in state H(B= broken ANKLE) or!!choosing a lottery ticket with probability 'p' of H(A= broken finger) and '( 1- p)'!!of worse state H(C=broken hip).
!!say H(A) = 1 and H(B) = 4
Then H(B) = p H(A) + (1-p) H(C)
4 = (.8 x1) + (.2 x H(C))
H(C) = 16
THIS DOES NOT NECESSARILY MEAN A BROKEN HIP IS 16/4 = 4 TIMES AS BAD
AS A BROKEN ANKLE: BUT ORDINAL SCALE IS VALID.0
10
20
30
40
50
60
70
80
90
100
0 1 2 3 4 5
Health
status
index
DRUG A
QUALY: Same Life expectancy
3.10
3.00
0
10
20
30
40
50
60
70
80
90
100
0 1 2 3 4 5 6
Health
status
index
DRUG A
QUALITY ADJUSTED LIFE YEARS:QALY
2.40
3.00
YEARS 0
10
20
30
40
50
60
70
80
90
100
0 1 2 3 4 5 6
Health
status
index
DRUG A
QUALY: earlier death better
3.60
3.00
0
10
20
30
40
50
60
70
80
90
100
0 1 2 3 4 5
HEALTH
STATUS
INDEX
TIME (YEARS) DRUG A
QUALITY ADJUSTED LIFE YEARS (QALY's)
2.5 3.0
$5 $5.4
2 1.8
COST
QALY
C/Q
A B
CAREGIVER QUALYS
•! Chronic illness of a family member impacts on the quality of life of care-givers (eg: Alzheimers, ALS patients)
•! 0.87, 0.87,0.86,0.90,0.93 for
Alzheimers reflecting transfer of care to institutions in later stages (Neumann 1998).
Prioritizing Mainstream and Non-mainstream InterventionsGary Ginsberg, DrPH
54
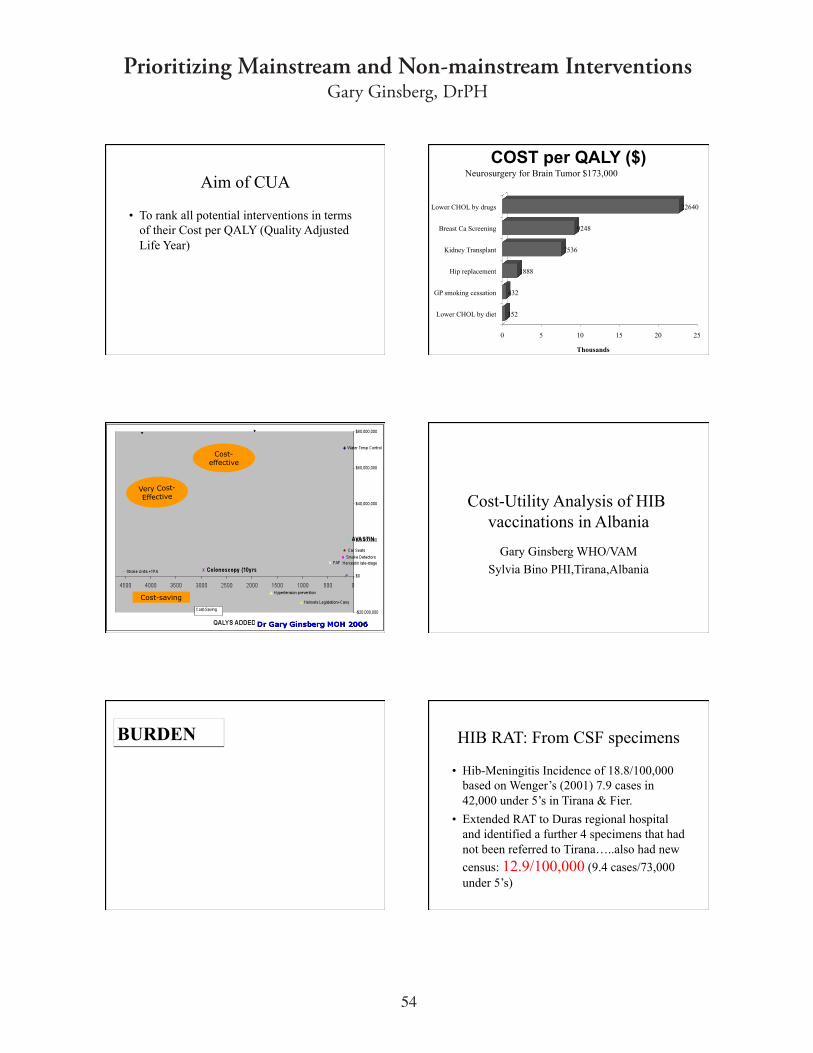
Aim of CUA
•! To rank all potential interventions in terms of their Cost per QALY (Quality AdjustedLife Year)
0 5 10 15 20 25
Lower CHOL by diet
GP smoking cessation
Hip replacement
Kidney Transplant
Breast Ca Screening
Lower CHOL by drugs
352
432
1888
7536
9248
22640
Thousands
COST per QALY ($)Neurosurgery for Brain Tumor $173,000
Cost-
effective
Very Cost-
Effective
Cost-saving
Cost-Utility Analysis of HIB vaccinations in Albania
Gary Ginsberg WHO/VAM
Sylvia Bino PHI,Tirana,Albania
BURDEN HIB RAT: From CSF specimens
•!Hib-Meningitis Incidence of 18.8/100,000 based on Wenger’s (2001) 7.9 cases in 42,000 under 5’s in Tirana & Fier.
•! Extended RAT to Duras regional hospital and identified a further 4 specimens that hadnot been referred to Tirana…..also had new
census: 12.9/100,000 (9.4 cases/73,000
under 5’s)
Prioritizing Mainstream and Non-mainstream InterventionsGary Ginsberg, DrPH
55
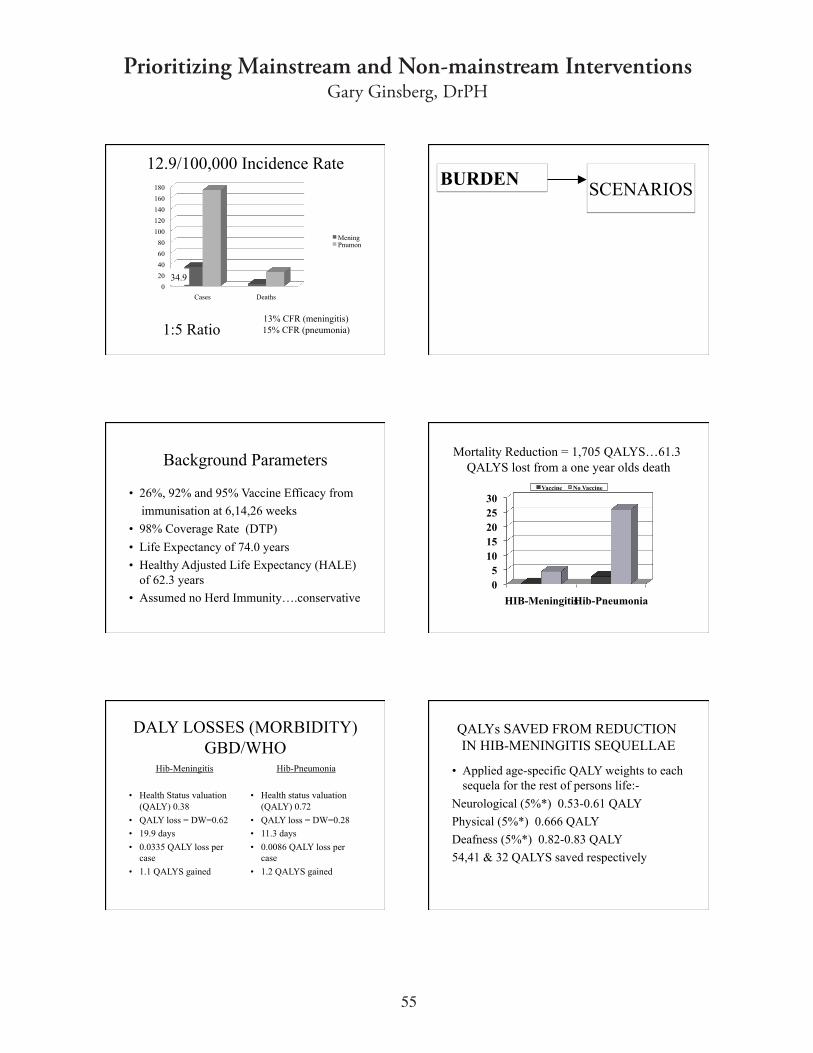
12.9/100,000 Incidence Rate
0
20
40
60
80
100
120
140
160
180
Cases Deaths
MeningPnumon
1:5 Ratio13% CFR (meningitis) 15% CFR (pneumonia)
34.9
BURDENSCENARIOS
Background Parameters
•! 26%, 92% and 95% Vaccine Efficacy from
immunisation at 6,14,26 weeks
•! 98% Coverage Rate (DTP)
•! Life Expectancy of 74.0 years
•!Healthy Adjusted Life Expectancy (HALE) of 62.3 years
•!Assumed no Herd Immunity….conservative
Mortality Reduction = 1,705 QALYS…61.3
QALYS lost from a one year olds death
0
5
10
15
20
25
30
HIB-MeningitisHib-Pneumonia
Vaccine No Vaccine
DALY LOSSES (MORBIDITY)GBD/WHO
Hib-Meningitis
•! Health Status valuation (QALY) 0.38
•! QALY loss = DW=0.62
•! 19.9 days
•! 0.0335 QALY loss per case
•! 1.1 QALYS gained
Hib-Pneumonia
•! Health status valuation (QALY) 0.72
•! QALY loss = DW=0.28
•! 11.3 days
•! 0.0086 QALY loss per case
•! 1.2 QALYS gained
QALYs SAVED FROM REDUCTION IN HIB-MENINGITIS SEQUELLAE
•!Applied age-specific QALY weights to eachsequela for the rest of persons life:-
Neurological (5%*) 0.53-0.61 QALY
Physical (5%*) 0.666 QALY
Deafness (5%*) 0.82-0.83 QALY
54,41 & 32 QALYS saved respectively
Prioritizing Mainstream and Non-mainstream InterventionsGary Ginsberg, DrPH
56
1835 QALY GAINS FROM VACCINATION
•!HIB-Pneumonia mortality 1452
•!HIB-Meningitis mortality 253
•!Neurological sequelae 54
•! Physical sequelae 41
•!Deafness 32
•!HIB-Pneumonia morbidity 1.2
•!HIB-Meningitis morbidity 1.1
BURDENSCENARIOS
VACCINEPROGRAMCOSTS
Vaccine Costs
•! Largest component is vaccine price for 3 doses at $2.82 per dose (UNICEF 10 dose vial) USED IN ANALYSIS
•! Possibility to purchase DTP-HIB 10 dose vials for $2.35 per dose.
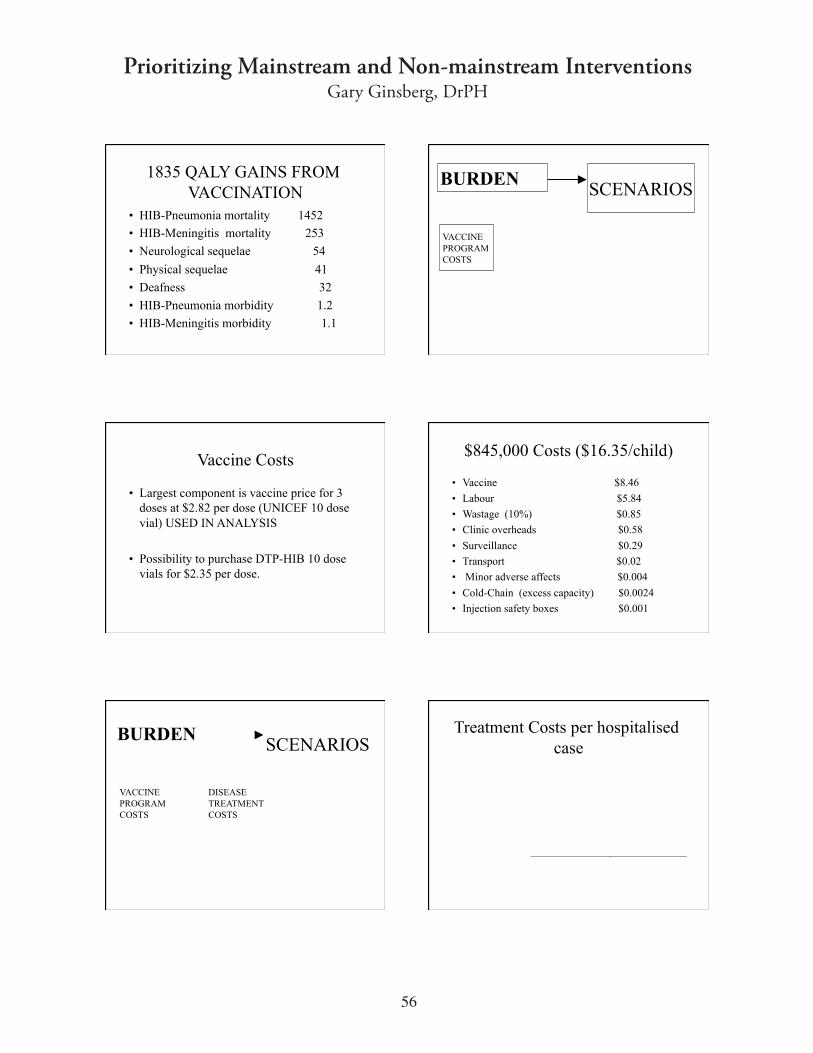
$845,000 Costs ($16.35/child)
•! Vaccine $8.46
•! Labour $5.84
•! Wastage (10%) $0.85
•! Clinic overheads $0.58
•! Surveillance $0.29
•! Transport $0.02
•! Minor adverse affects $0.004
•! Cold-Chain (excess capacity) $0.0024
•! Injection safety boxes $0.001
BURDENSCENARIOS
VACCINEPROGRAMCOSTS
DISEASETREATMENTCOSTS
Treatment Costs per hospitalised case
Prioritizing Mainstream and Non-mainstream InterventionsGary Ginsberg, DrPH
57
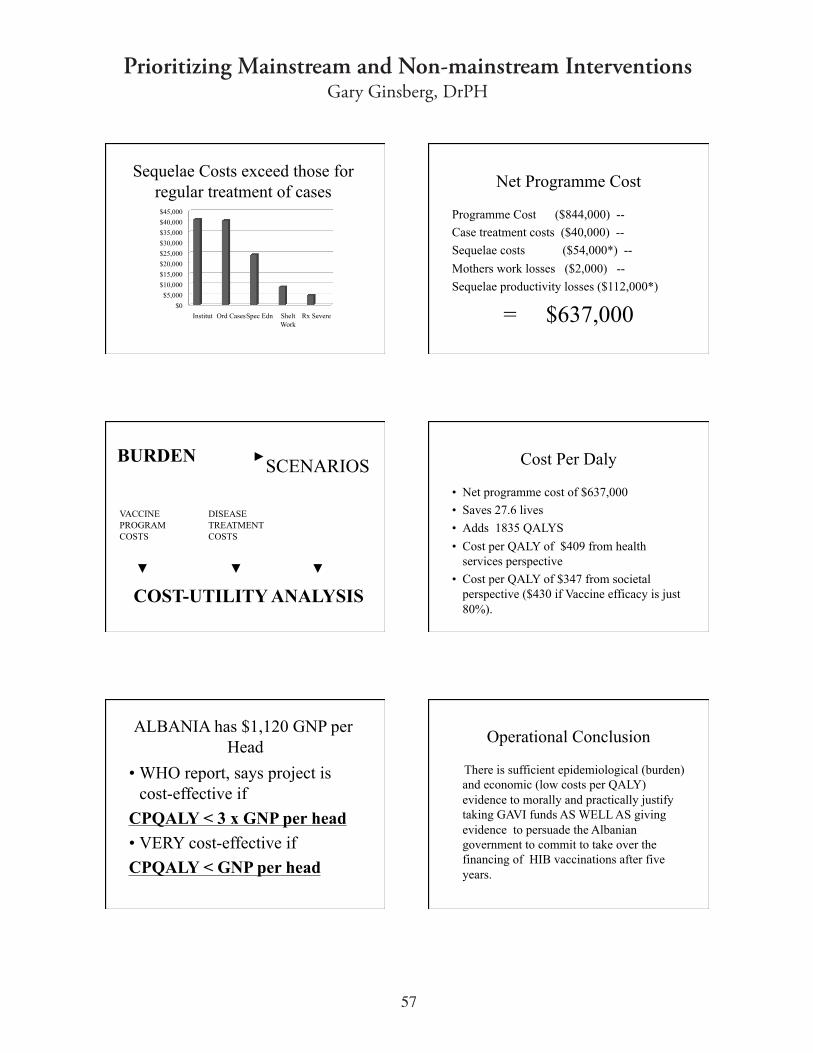
Sequelae Costs exceed those for regular treatment of cases
$0
$5,000
$10,000
$15,000
$20,000
$25,000
$30,000
$35,000
$40,000
$45,000
Institut Ord Cases Spec Edn SheltWork
Rx Severe
Net Programme Cost
Programme Cost ($844,000) --
Case treatment costs ($40,000) --
Sequelae costs ($54,000*) --
Mothers work losses ($2,000) --
Sequelae productivity losses ($112,000*)
= $637,000
BURDENSCENARIOS
VACCINEPROGRAMCOSTS
DISEASETREATMENTCOSTS
COST-UTILITY ANALYSIS
Cost Per Daly
•!Net programme cost of $637,000
•! Saves 27.6 lives
•!Adds 1835 QALYS
•! Cost per QALY of $409 from health services perspective
•! Cost per QALY of $347 from societal perspective ($430 if Vaccine efficacy is just 80%).
ALBANIA has $1,120 GNP per Head
•!WHO report, says project is cost-effective if
CPQALY < 3 x GNP per head
•!VERY cost-effective if
CPQALY < GNP per head
Operational Conclusion
There is sufficient epidemiological (burden)and economic (low costs per QALY)evidence to morally and practically justify taking GAVI funds AS WELL AS giving evidence to persuade the Albaniangovernment to commit to take over the financing of HIB vaccinations after five years.
Prioritizing Mainstream and Non-mainstream InterventionsGary Ginsberg, DrPH
58
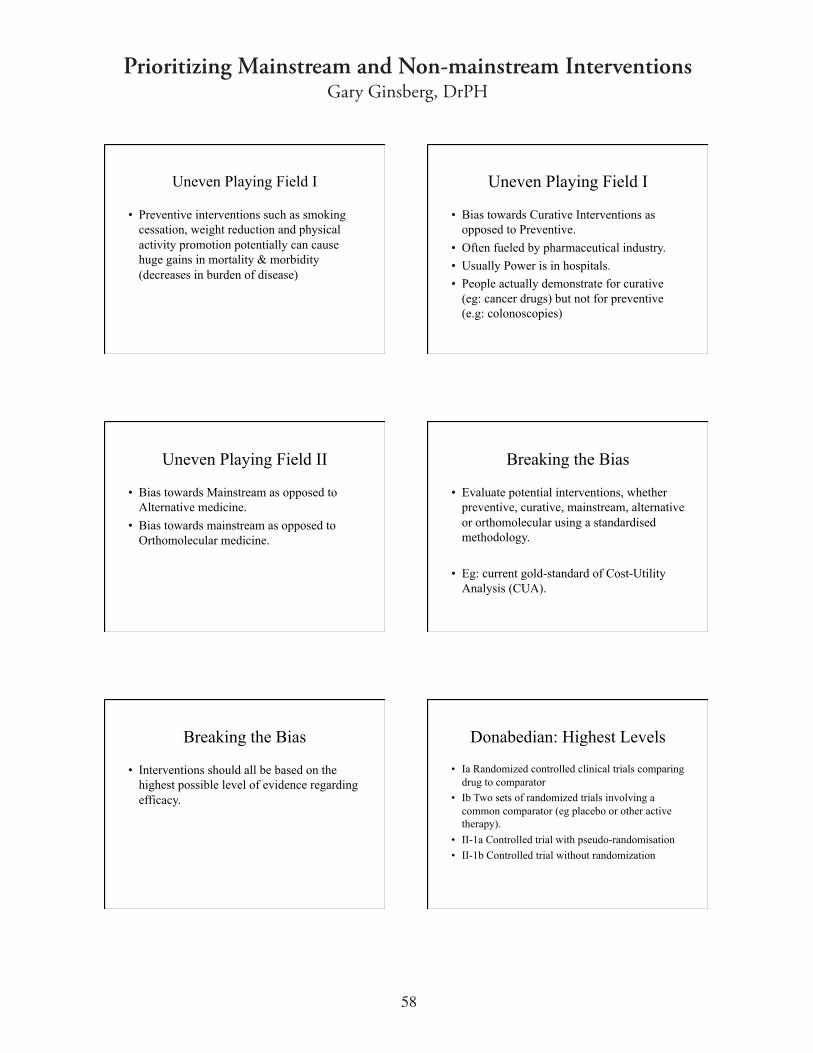
Uneven Playing Field I
•! Preventive interventions such as smoking cessation, weight reduction and physical activity promotion potentially can cause huge gains in mortality & morbidity (decreases in burden of disease)
Uneven Playing Field I
•! Bias towards Curative Interventions as opposed to Preventive.
•!Often fueled by pharmaceutical industry.
•!Usually Power is in hospitals.
•! People actually demonstrate for curative (eg: cancer drugs) but not for preventive (e.g: colonoscopies)
Uneven Playing Field II
•! Bias towards Mainstream as opposed to Alternative medicine.
•! Bias towards mainstream as opposed to Orthomolecular medicine.
Breaking the Bias
•! Evaluate potential interventions, whether preventive, curative, mainstream, alternativeor orthomolecular using a standardised methodology.
•! Eg: current gold-standard of Cost-Utility Analysis (CUA).
Breaking the Bias
•! Interventions should all be based on the highest possible level of evidence regarding efficacy.
Donabedian: Highest Levels
•! Ia Randomized controlled clinical trials comparingdrug to comparator
•! Ib Two sets of randomized trials involving a common comparator (eg placebo or other active therapy).
•! II-1a Controlled trial with pseudo-randomisation
•! II-1b Controlled trial without randomization
Prioritizing Mainstream and Non-mainstream InterventionsGary Ginsberg, DrPH
59
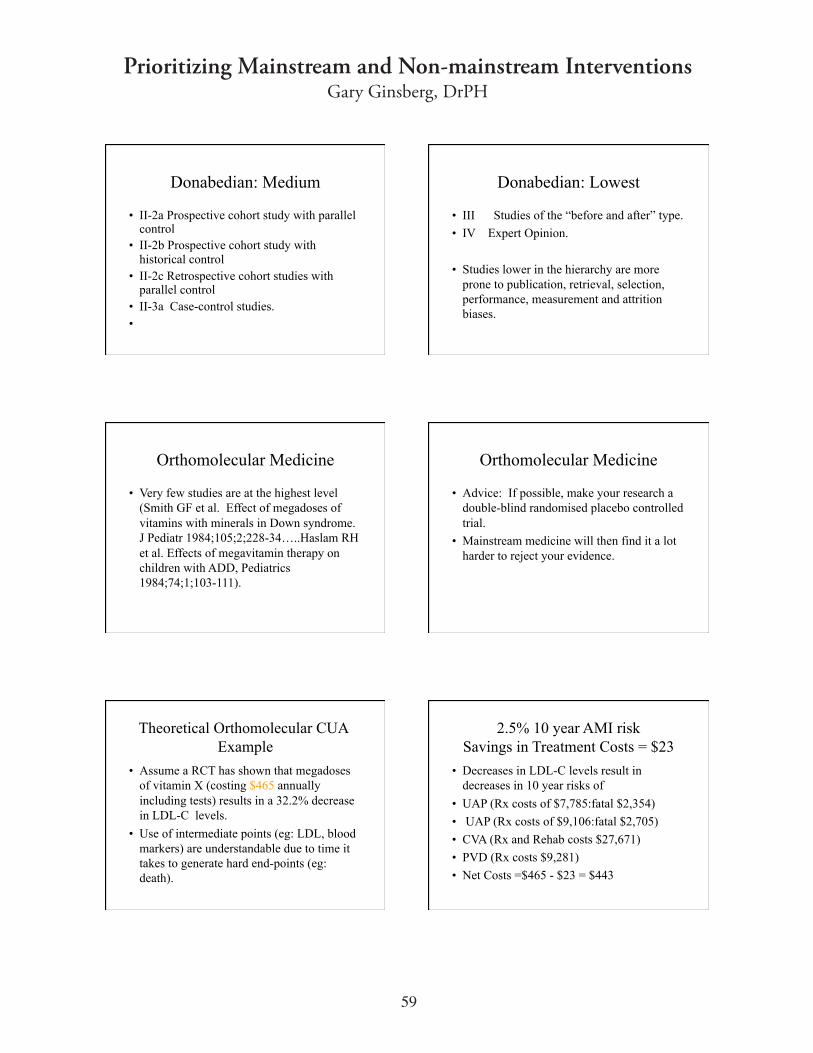
Donabedian: Medium
•! II-2a Prospective cohort study with parallel control
•! II-2b Prospective cohort study with historical control
•! II-2c Retrospective cohort studies with parallel control
•! II-3a Case-control studies.
•!
Donabedian: Lowest
•! III Studies of the “before and after” type.
•! IV Expert Opinion.
•! Studies lower in the hierarchy are more prone to publication, retrieval, selection, performance, measurement and attrition biases.
Orthomolecular Medicine
•!Very few studies are at the highest level (Smith GF et al. Effect of megadoses of vitamins with minerals in Down syndrome. J Pediatr 1984;105;2;228-34…..Haslam RH
et al. Effects of megavitamin therapy on children with ADD, Pediatrics 1984;74;1;103-111).
Orthomolecular Medicine
•!Advice: If possible, make your research a double-blind randomised placebo controlledtrial.
•!Mainstream medicine will then find it a lot harder to reject your evidence.
Theoretical Orthomolecular CUAExample
•!Assume a RCT has shown that megadoses of vitamin X (costing $465 annually including tests) results in a 32.2% decrease in LDL-C levels.
•!Use of intermediate points (eg: LDL, blood markers) are understandable due to time it takes to generate hard end-points (eg: death).
2.5% 10 year AMI riskSavings in Treatment Costs = $23
•!Decreases in LDL-C levels result in decreases in 10 year risks of
•!UAP (Rx costs of $7,785:fatal $2,354)
•! UAP (Rx costs of $9,106:fatal $2,705)
•! CVA (Rx and Rehab costs $27,671)
•! PVD (Rx costs $9,281)
•!Net Costs =$465 - $23 = $443
Prioritizing Mainstream and Non-mainstream InterventionsGary Ginsberg, DrPH
60
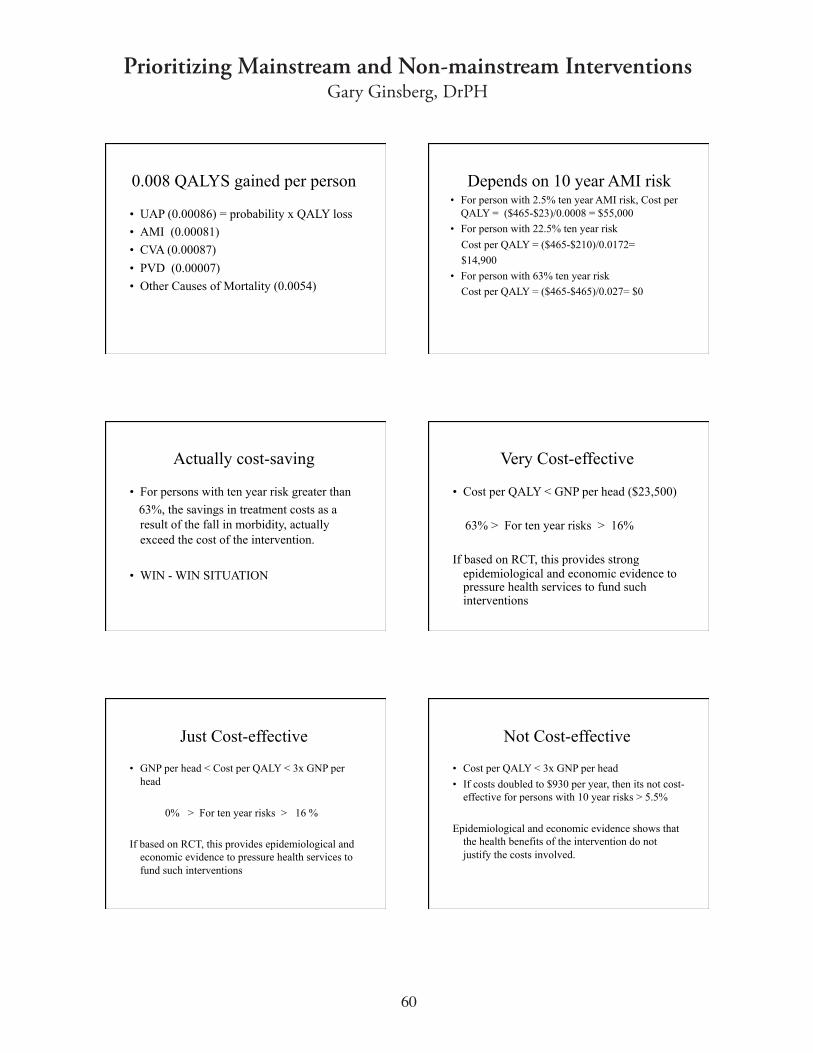
0.008 QALYS gained per person
•!UAP (0.00086) = probability x QALY loss
•!AMI (0.00081)
•! CVA (0.00087)
•! PVD (0.00007)
•!Other Causes of Mortality (0.0054)
Depends on 10 year AMI risk•! For person with 2.5% ten year AMI risk, Cost per
QALY = ($465-$23)/0.0008 = $55,000
•! For person with 22.5% ten year risk
Cost per QALY = ($465-$210)/0.0172=
$14,900
•! For person with 63% ten year risk
Cost per QALY = ($465-$465)/0.027= $0
Actually cost-saving
•! For persons with ten year risk greater than
63%, the savings in treatment costs as a result of the fall in morbidity, actually exceed the cost of the intervention.
•!WIN - WIN SITUATION
Very Cost-effective
•! Cost per QALY < GNP per head ($23,500)
63% > For ten year risks > 16%
If based on RCT, this provides strong epidemiological and economic evidence to pressure health services to fund such interventions
Just Cost-effective
•! GNP per head < Cost per QALY < 3x GNP per head
0% > For ten year risks > 16 %
If based on RCT, this provides epidemiological and economic evidence to pressure health services to fund such interventions
Not Cost-effective
•! Cost per QALY < 3x GNP per head
•! If costs doubled to $930 per year, then its not cost-effective for persons with 10 year risks > 5.5%
Epidemiological and economic evidence shows that the health benefits of the intervention do not justify the costs involved.
Prioritizing Mainstream and Non-mainstream InterventionsGary Ginsberg, DrPH
61
DIFFERENT VIEWPOINTS
QALY's
COST/QALY
Accountants
Just Cost Reduction
HEALTH ECONOMICS
HEALTH ECONOMICS
WITHOUT