Embed Size (px)
Citation preview

International Journal of Economics, Finance and Management Sciences 2019; 7(1): 21-28
http://www.sciencepublishinggroup.com/j/ijefm
doi: 10.11648/j.ijefm.20190701.15
ISSN: 2326-9553 (Print); ISSN: 2326-9561 (Online)
Prioritizing Drivers and Barriers for Applying Green Manufacturing with a System Model Approach: A Case Study
Sumaiya Shahria1, Mst. Nazma Sultana
2, Md. Tariquzzaman
2, Md. Habibur Rahman
2, *
1Department of Textile Engineering, Khwaja Yunus Ali University, Sirajganj, Bangladesh 2Department of Industrial Engineering and Management, Khulna University of Engineering & Technology (KUET), Khulna, Bangladesh
Email address:
*Corresponding author
To cite this article: Sumaiya Shahria, Mst. Nazma Sultana, Md. Tariquzzaman, Md. HabiburRahman. Prioritizing Drivers and Barriers for Applying Green
Manufacturing with a System Model Approach: A Case Study. International Journal of Economics, Finance and Management Sciences.
Vol. 7, No. 1, 2019, pp. 21-28. doi: 10.11648/j.ijefm.20190701.15
Received: January 7, 2019; Accepted: February 19, 2019; Published: March 12, 2019
Abstract: Green manufacturing is the process of producing product by minimizing natural resource use, reducing
environmental pollution or wastes. Garment industry in Bangladesh plays a vital role in the country’s economy. But most of
these industries are indifferent to environmental regulation. A huge amount of river water is being polluted daily by the dyeing
sections. So it is necessary to treat the water to a standard level before discharge. The purpose of this research is to establish an
approach for the modification of dyeing section of textile industries. Before going to the approach a survey with some
questionnaire was performed to identify drivers and barriers regarding green manufacturing implementation. Then these
drivers and barriers were ranked with fuzzy TOPSIS tool. A system model was followed for making an approach of green
manufacturing. ETP (Effluent Treatment plant) plant is suggested along with an existing dyeing process for treating waste
water.
Keywords: Green Manufacturing, Drivers, Barriers, System Model, Effluent Treatment Plant, Fuzzy
1. Introduction
Bangladesh is a country which is the twentieth largest
garment-manufacturing nation in the world. The country’s
foreign exchange earnings from garment sector now accounts
for about 77%, and 50% of its industrial work force. A report
by the World Bank (2010) showed the environmental impacts
of readymade garment on the basis of four categories – Yarn
production, Fabric production, Dyeing and finishing and
Garment production. The environmental pollution was
measured along water contamination, energy usage, and
chemicals discharged. It clearly indicated that the
environment is polluted mostly by the dyeing and finishing
section. There is nation’s standard for concentration of
effluents for the textile sector. But it is merely maintained.
Violation of this standard is mostly performed by the dyeing
section of textile industries. The research and industrial
communities are taking interest in green manufacturing more
and more, since a clear description of what is meant by this
term is becoming more essential GM (Green Manufacturing)
implementation faces many challenges. For the purpose of
making these changes possible, motivation from the
government as well as from the industries should be provided
with some awareness of cumbering factors. The prioritization
plays a vital role for the emerging and developing economies
because of the limited financial and other resources. The
prioritization of GM drivers and barriers are expected to help
the government and industry to focus vital drivers and to
overcome the barriers to facilitate the GM implementation.
The implementation of GM is initiated by proposing a system
model that will incorporate planning activities and qualitative
approach for GM. Textile industries are facing increasing
number of challenges from environmental issues and
environmental legislation which includes increased cost of
water, implementation of more stringent, increased cost of
effluent treatment and disposal, regulations, toxicity and

22 Sumaiya Shahria et al.: Prioritizing Drivers and Barriers for Applying Green Manufacturing with a
System Model Approach: A Case Study
salinity, eco labels and new legislation especially in terms of
color, and the introduction of ISO 14001 [1-3]. At present
sustainability-driven management are being adopted by most
of the businesses however, adoption level varies among
companies [4]. Drivers and barriers for green manufacturing
have been identified by different studies in the past [5-8].
From the combined assistance of industrial managers,
existing literature, and experts opinion in the relevant field
twelve drivers were identified for green manufacturing [9].
Strategies concerning environmental conscious
manufacturing factors [5-6], efficient manufacturing with
energy and resources [10], a preliminary findings of drivers
and barriers for small and medium size enterprises [3, 11],
managing the environment [12], and environmentally sound
technology adoption [13]. Fuzzy TOPSIS multi-criteria
decision making (MCDM) technique is used to prioritize the
drivers and barriers because it is an improved practice to deal
with two most important kinds of uncertainties, i.e.
vagueness and ambiguity that exist in the real life. Also,
fuzzy TOPSIS methodology offers ease of computation with
better understanding [14]. In the TOPSIS approach an
alternative that is nearest to the Fuzzy Positive Ideal Solution
(FPIS) and farthest from the Fuzzy Negative Ideal Solution
(FNIS) is chosen as optimal [15-16]. The literature of green
manufacturing is missing a clear roadmap for manufacturing
enterprises that can assess the existing level of their
greenness and offer a structured transformation plan towards
becoming greener. A system model is approached for dyeing
section of industries to fill this requisite gap [17]. In recent
years, there is a tendency to use biological treatment systems
to treat dye-bearing wastewaters. Biological treatment
technologies have been considered more efficient in treating
waste water [12, 18-20].
Above review reveals that some preliminary findings of
drivers and barriers for green manufacturing were performed
by some researchers but they were all based on overall green
manufacturing implementation. Also no studies examined
Bangladeshi manufacturing origin. It is difficult for a
company to adopt green manufacturing practices all along.
They need a sample model along with drivers and barriers to
initiate for this approach. This study compensates for these
difficulties. The highlights of this research are given
sequentially- Drivers and barriers are identified concerning
dyeing section of textile industries of Bangladesh through
expert’s recommendations and expert reviews, collected
drivers and barriers are prioritized with fuzzy TOPSIS tool to
take the advantages of motivational factors and to overcome
obstacles, a general system model for green manufacturing
(concerning an industrial case) is proposed, finally the
obtained results are further analyzed and a modification of
existing dyeing process is proposed with a modern
technology.
This article is organized into five sections for the
completion its objectives and the organization is industrial
case in section 2, research methodology in section 3, results
and discussion in section 4, conclusion and recommendations
in section 5.
2. Industrial Case
In textile processing there are three major areas of water–
Pre-cleaning and rinsing of fabric or yarn prior to dyeing or
printing. During printing or dyeing operation, soaping and
processing activities after-treatment. Rinsing along with
others such as boiler, ion exchange, cooling water, cleaning,
and steam drying etc. [21].
Several pollutants from wastewater or effluent originated
from yarn dyeing, sizing, bleaching, fancy dyeing,
mercerizing screen printing, and finishing are actually bi-
product of the products produced by the textile and dyeing
industries [21]. Now that effluent removal (and chemical)
costs are increasing, many companies are, almost literally,
throwing money down the drain. It is not necessarily true that
to save money you first need to spend money. The first step
towards saving money by reducing water use and effluent
strength is to appreciate and review water and chemical use
throughout the site. A list of potential actions can be drawn
giving priority to those that are easy to implement and likely
to be the most cost-effective. Implementing those actions will
achieve savings. A process flow chart for dyeing was
collected from a knit processing industry which is not
currently adopting green manufacturing practices. It
discharges water after each process into the river without
treating it. So after searching for literature pertaining to water
treatment a methodology has been proposed with preliminary
findings of drivers and barriers followed by an approach of
system model for green manufacturing.
3. Methodology
3.1. Drivers and Barrier Identification
To identify drivers and barriers for green manufacturing a
list of questionnaires were prepared and a survey was
performed through e-mail in some textile industries in
Bangladesh. Forty three e- mails were sent to executive and
managerial level but twenty six of them were replied. Various
research papers for GM were also analyzed. Ten drivers (D)
and eleven barriers (B) were selected for our research based
on the opinions of experts from different departments
3.2. Ranking of Drivers and Barriers
Fuzzy TOPSIS (Technique for Order Preference by
Similarity to Ideal Solution) developed by Chen, is a
sensible method and helps human thinking under real
environment [22]. Four decision makers (DM) were
selected among experts and fuzzy theory was applied to
prioritize drivers and barriers. The steps of fuzzy TOPSIS
algorithm that was followed during our research is
expressed as follows [23].
Step 1: A proper scale must be chosen to represent the
data. Respondents must be asked to select the best alternative
among the linguistics terms for a given question. Fuzzy
numbers for the selected linguistics terms are presented in
table below-

International Journal of Economics, Finance and Management Sciences 2019; 7(1): 21-28 23
Table 1. Linguistic terms and corresponding fuzzy number.
Linguistic term Fuzzy number
Low(L) (0.0, 0.1, 0.3)
Fairly low(FL) (0.1, 0.3, 0.5)
Medium(M) (0.3, 0.5, 0.7)
Fairly high(FH) (0.5, 0.7, 0.9)
High(H) (0.7, 0.9, 1.0)
To transform the linguistic terms into fuzzy numbers,
fuzzy set theory requires an application of a conversion scale.
Table 1 shows linguistic terms and their corresponding fuzzy
number. In this paper, a rating scale of 0 to 1 will be applied
to rate the criteria. Considering the fuzziness and distance
among the criteria the linguistic variables were chosen for the
values of triangular fuzzy number.
Step 2: Evaluating the following fuzzy decision matrix
D=
xxxx
xxxx
xxxxxxxx
mnmjmm
inijii
nj
nj
......
..................
......
..................
......
......
21
21
222221
111211
(1)
Where, a fuzzy number corresponding to the linguistic
term assigned by the decision maker (DM) to the jth
factor.
i=1, 2… m are the number of DMs and j = 1, 2… n are the
number of Critical Success Factors (CSFs).
Table 2. Decision matrix using linguistic variable.
Barriers Decision Makers
DM1 DM2 DM3 DM4
Result could be unexpected (B1) FH M FL M
GM is considered as non-value added (B2) FH M M FH
Work stations aren’t designed Ergonomically(B3) M FH H M
Indifferent to waste management system (B4) FH FH FH M
People’s dependency on conventional method (B5) FH FH M H
No proper execution of laws (B6) L M L FL
Compliance with ethical and environmental standard is not maintained(B7) M L M FH
No inspiration or motivation(B8) H H FH FH
No strong demand from owner (B9) FL FL L FL
High expenditure of innovation (B10) M M FL L
Guaranty of compensation (B11) M H M M
Table 2 shows a decision matrix using linguistic variable
for the various barriers criteria. Based on experience four
decision makers were chosen to give their weights for the
eleven criteria. Their importance was given in terms of five
linguistic terms as Low (L), Fairly Low (FL), Medium (M),
Fairly High (FH) and High (H) concerning emphasis of each
criterion.
Step 3: Neutralizing the weight of decision matrix and
generating fuzzy un-weighted matrix (R).
If fuzzy ratings of all decision makers are described as
triangular fuzzy numbers
�� = ��� , �� , ��, = 1, 2, ………… . . , �
Where
� = ����{��} � = 1 �� ���
� = ���{��} Then the aggregate fuzzy rating is given by Eq. (2)
� = ������∗ (2)
And
��� = !�����∗ ,�����∗ ,
�����∗" ,Where
��∗ =������� Step 4: Calculating the weighted normalized decision
matrix.
# = �$����∗ (3)
� = 1, 2, …… . . , ���%& = 1, 2, … . . … . , �
The weighted normalized value $�� is calculated as
Where
�$��� = ��� ∗ '� (4)
Where '�is the weight given to each decision-maker.
'� = �1,1,1,1,1∀& ∈ �
Because, all the DMs are considered to have same weight
for this study.

24 Sumaiya Shahria et al.: Prioritizing Drivers and Barriers for Applying Green Manufacturing with a
System Model Approach: A Case Study
Table 3. Aggregate fuzzy weights for barriers.
Decision Makers Barriers
B1 B2 B3 B4 B5 B6 B7 B8 B9 B10 B11
DM1 .5,.7,.9 .5,.7,.9 .3,.5,.7 .5,.7,.9 .5,.7,.9 0,.1,.3 .3,.5,.7 .7,.9,1 .1,.3,.5 .3,.5,.7 .3,.5,.7
DM2 .3,.5,.7 .3,.5,.7 .5,.7,.9 .5,.7,.9 .5,.7,.9 .3,.5,.7 0,.1,.3 .7,.9,1 .1,.3,.5 .3,.5,.7 .7,.9,1
DM3 .1,.3,.5 .3,.5,.7 .7,.9,1 .5,.7,.9 .3,.5,.7 0,.1,.3 .3,.5,.7 .5,.7,.9 0,.1,.3 .1,.3,.5 .3,.5,.7
DM4 .3,.5,.7 .5,.7,.9 .3,.5,.7 .3,.5,.7 .7,.9,1 .1,.3,.5 .5,.7,.9 .5,.7,.9 .1,.3,.5 0,.1,.3 .3,.5,.7
After having all the criteria with their importance in
linguistic term it becomes necessary to interpret this
linguistic term with fuzzy number for further calculation. For
each linguistic term a certain fuzzy number is maintained (as
shown in table 1) and it is shown in table 3. Aggregate fuzzy
weights for criteria are put in the row whereas decision
makers are put on column wise.
Step 5: Determining the positive ideal and negative-ideal
solution for the CSFs proposed by Chen [22]
*∗ = �$+∗, $,∗, … , $ ∗ (5)
*- = �$+-, $,-, … , $ - (6)
Since the positive and negative ideas introduced by Chen
[22] are used for the research. The following terms are used
for ideal and negative ideal solution
$�∗ = �1, 1, 1 (7)
$�- = �0, 0, 0 (8)
Step 6: Calculate the sum of distances from positive and
negative ideal solution for each factor.
/�∗ =∑ 12345-34∗67489� 'ℎ;�;& = 1,2, … .… � (9)
D ($�� − $�∗) is the distance between two fuzzy numbers
which can be calculated using the vector algebra. For
example distance between two numbers A1 (�+ ,�+ ,�+ )and
A2(�+, �+, �+)can be calculated as
%�*1 − *2 = =+> ?��, − �+, + ��, − �+, + ��, − �,A (10)
Table 4. Distance /�∗ for barriers.
Decision Makers B1 B2 B3 B4 B5 B6 B7 B8 B9 B10 B11
DM1 .342 .342 .525 .342 .342 .876 .525 .183 .719 .525 .525
DM2 .525 .525 .342 .342 .342 .525 .876 .183 .719 .525 .183
DM3 .719 .525 .183 .342 .525 .876 .525 .342 .876 .719 .525
DM4 .525 .342 .525 .525 .183 .719 .342 .342 .719 .876 .525
Average .528 .434 .394 .388 .348 .749 .567 .2623 .758 .661 .440
Table 4 shows separation from positive ideal solution for
each barrier criterion. The positive ideal solution is
composed of all best criteria values attainable. According to
the concept of TOPSIS it is defined as positive ideal solution
(FPIS).
/�- =∑ 1�345-34B7489� j = 1, 2… n (11)
Table 5. Distance /�- for barriers.
Decision Makers B1 B2 B3 B4 B5 B6 B7 B8 B9 B10 B11
DM1 .719 .719 .526 .719 .719 .183 .526 .879 .342 .526 .526
DM2 .526 .526 .719 .719 .719 .526 .183 .879 .342 .526 .879
DM3 .342 .526 .879 .719 .526 .183 .526 .719 .183 .342 .526
DM4 .526 .719 .526 .526 .879 .342 .719 .719 .342 .183 .526
Average .528 .622 .662 .6708 .710 .309 .489 .796 .302 .394 .614
Table 5 shows separation from negative ideal solution for
each barrier criterion. The negative ideal solution is
composed of all worst criteria values attainable. According to
the concept of TOPSIS it is defined as positive ideal solution
(FNIS).
Step 7: Calculate the relative closeness to the ideal
solution. The relative closeness with respect to *∗ is defined
as
CCj = F5BF5∗GF5B j = 1, 2… , n (12)
Step 8: Prioritize the preference order based on the order
of the values ofHH�. Table 6. Closeness coefficients (CCj) of the barriers.
SI. No Barriers I∗ I- CCj Priority
1 Result could be unexpected (B1) .528 .528 .500 7
2 GM is considered as non-value added (B2) .434 .622 .590 5
3 Work stations are not designed Ergonomically(B3) .394 .662 .627 4

International Journal of Economics, Finance and Management Sciences 2019; 7(1): 21-28 25
SI. No Barriers I∗ I- CCj Priority
4 Indifferent to waste management system (B4) .388 .6708 .634 3
5 People’s dependency on conventional method(B5) .348 .710 .716 2
6 No proper execution of laws (B6) .749 .309 .292 10
7 Compliance with ethical and environmental standard is not maintained (B7) .567 .489 .463 8
8 No inspiration or motivation(B8) .2623 .796 .752 1
9 No strong demand from owner (B9) .758 .302 .284 11
10 High expenditure of innovation(B10) .661 .394 .373 9
11 Guaranty of compensation (B11) .440 .614 .582 6
Table 6 shows closeness coefficient of the barriers. After
putting the values to the equation no 12 closeness coefficient
for each criterion was determined. Criterion having the
highest value of closeness coefficient has the first priority
and vice versa. The highest value gained was 0.752 for the
criterion ‘No inspiration or motivation’ so was given the first
priority. Same case is applied for other the criteria.
With the same algorithm drivers for green manufacturing
are also prioritized-
Table 7. Decision matrix using linguistic variable for drivers.
Drivers Decision Makers
DM1 DM2 DM3 DM4
Financial incentives for GM (D1) H FH FH M
Organizational Commitment for GM (D2) FL M FH FH
Owner values or employee aspirations towards GM(D3) FH FL M H
Availability of Comprehensive training and education in GM (D4) M M FH FL
New market opportunities towards GM (D5) FL FL FH H
Competitors pressures towards GM (D6) FL H FH FL
Public awareness to Green initiatives (D7) M L M FH
Customer’s demand of Green products/process (D8) FH FH FH FL
Organizational belief of cost reductions through GM (D9) FL FH FL H
Improved company image through GMP (D10) FH M FH FL
Table 8. Aggregate fuzzy weights for drivers.
Decision Makers D1 D2 D3 D4 D5 D6 D7 D8 D9 D10
DM1 .7,.9,1 .1,.3,.5 .5,.7,.9 .3,.5,.7 .1,.3,.5 .1,.3,.5 .3,.5,.7 .5,.7,.9 .1,.3,.5 .5,.7,.9
DM2 .5,.7,.9 .3,.5,.7 .1,.3,.5 .3,.5,.7 .1,.3,.5 .7,.9,1 0,.1,.3 .5,.7,.9 .5,.7,.9 .3,.5,.7
DM3 .5,.7,.9 .5,.7,.9 .3,.5,.7 .5,.7,.9 .5,.7,.9 .5,.7,.9 .3,.5,.7 .5,.7,.9 .1,.3,.5 .5,.7,.9
DM4 .3,.5,.7 .5,.7,.9 .7,.9,1 .1,.3,.5 .7,.9,1 .1,.3,.5 .5,.7,.9 .1,.3,.5 .7,.9,1 .1,.3,.5
Table 9. Distance /�∗ for drivers.
Decision Makers D1 D2 D3 D4 D5 D6 D7 D8 D9 D10
DM1 .183 .719 .342 .525 .719 .719 .525 .342 .719 .342
DM2 .342 .525 .719 .525 .719 .183 .876 .342 .342 .525
DM3 .342 .342 .525 .342 .342 .342 .525 .342 .719 .342
DM4 .525 .342 .183 .719 .183 .183 .342 .719 .183 .719
Average .348 .482 .4425 .52775 .49075 .49075 .567 .43625 .491 .482
Table 10. Distance /�- for Drivers.
Decision Makers D1 D2 D3 D4 D5 D6 D7 D8 D9 D10
DM1 .876 .342 .719 .526 .342 .342 .526 .719 .342 .719
DM2 .719 .526 .342 .526 .342 .876 .183 .719 .719 .526
DM3 .719 .719 .526 .719 .719 .719 .526 .719 .342 .719
DM4 .526 .719 .876 .342 .876 .342 .719 .342 .876 .342
Average .71 .5765 .61575 .52825 .56975 .56975 .4885 .62475 .56975 .5765
Table 11. Closeness coefficients (CCj) of the drivers.
S. No Drivers IJ∗ IJ- CCj Priority
1 Financial incentives for GM (D1) .348 .71 .671 1
2 Organizational Commitment for GM (D2) .482 .5765 .545 4
3 Owner values or employee aspirations towards GM(D3) .4425 .61575 .582 3
4 Availability of Comprehensive training and education in GM (D4) .5277 .52825 .5 9
5 New market opportunities towards GM (D5) .49075 .56975 .537 8
6 Competitors pressures towards GM (D6) .49075 .56975 .537 7
7 Public awareness to Green initiatives (D7) .567 .4885 .463 10
8 Customer’s demand of Green products/process (D8) .43625 .62475 .589 2

26 Sumaiya Shahria et al.: Prioritizing Drivers and Barriers for Applying Green Manufacturing with a
System Model Approach: A Case Study
S. No Drivers IJ∗ IJ- CCj Priority
9 Organization’s belief of cost reductions through GM (D9) .491 .56975 .537 6
10 Improved company image through GM (D10) .482 .5765 .545 5
3.3. Establishing an Approach for GM
A general system model [17] for green manufacturing in
the perspective of dyeing section of Bangladeshi textile
industries is proposed in figure 1.
In identifying color, output colors can be Black (low),
Brown (Medium), Grey (High), and transparent based on
green level. Water samples from dyeing sections of different
textile industries show significant differences from the
standard level. Analyzing present green culture; waste level
and eco level a quantitative assessment was performed with
structured questionnaires. After the assessment of dyeing
section of concerning textile industry the color was chosen as
‘Black’. In order to prepare brush, green implementation plan
is generated in the beam of previous assessment score. This
is particularly important to ensure manufacturers that green
improvements or implementation will not pessimistically
affect their productivity as traditionally assumed. From the
previous assessment score, level of energy consumption,
creation of wastes and cost impact, the implementation of
ETP (Effluent treatment plant) is suggested. To paint the
existing process green, emphasize is give on how the water
should be treated with the ETP and how the layout will be
modified and the plant will be implemented. With the
successful implementation of these criteria a smooth
execution for ETP can be uphold resulting in green
manufacturing at dyeing section. Green manufacturing
realization should have sustainability as an inherent
component in any green planning activity. For keeping the
green level, dyeing process with the proper execution of ETP
should be practiced. This is not enough. Continuous
improvement that is kaizen should also be incorporated.
There is no limit for improvement. Purpose of the company
should be to look for better level such as online monitoring
of effluent level, incorporation of new software, training of
the operator etc. Finally green manufacturing policies and
guidelines for dyeing section should be established. The two
way arrow indicates that the process should be continued
until the expected result is obtained.
Figure 1. General system model for green manufacturing.
4. Results and Discussions
Figure 2 shows the graphical presentation of the
importance of GM drivers obtained from fuzzy TOPSIS. The
results of MCDM (Multi- Criteria Decision Making) of GM
drivers using inputs from Bangladeshi experts reveals that '
financial incentives' is top ranked (1/10) driver which can
facilitate the easy implementation of GM in manufacturing
industry. For the competitiveness of global market
‘customers demand of green product’ is ranked second (2/10)
driver followed by ‘owner values or employee aspirations
towards GM’ (3/10) and so on. Among the least important
drivers are - ‘public awareness’, ‘availability of
comprehensive training and education’ and ‘new market
International Journal of Economics, Finance and Management Sciences 2019; 7(1): 21-28 27
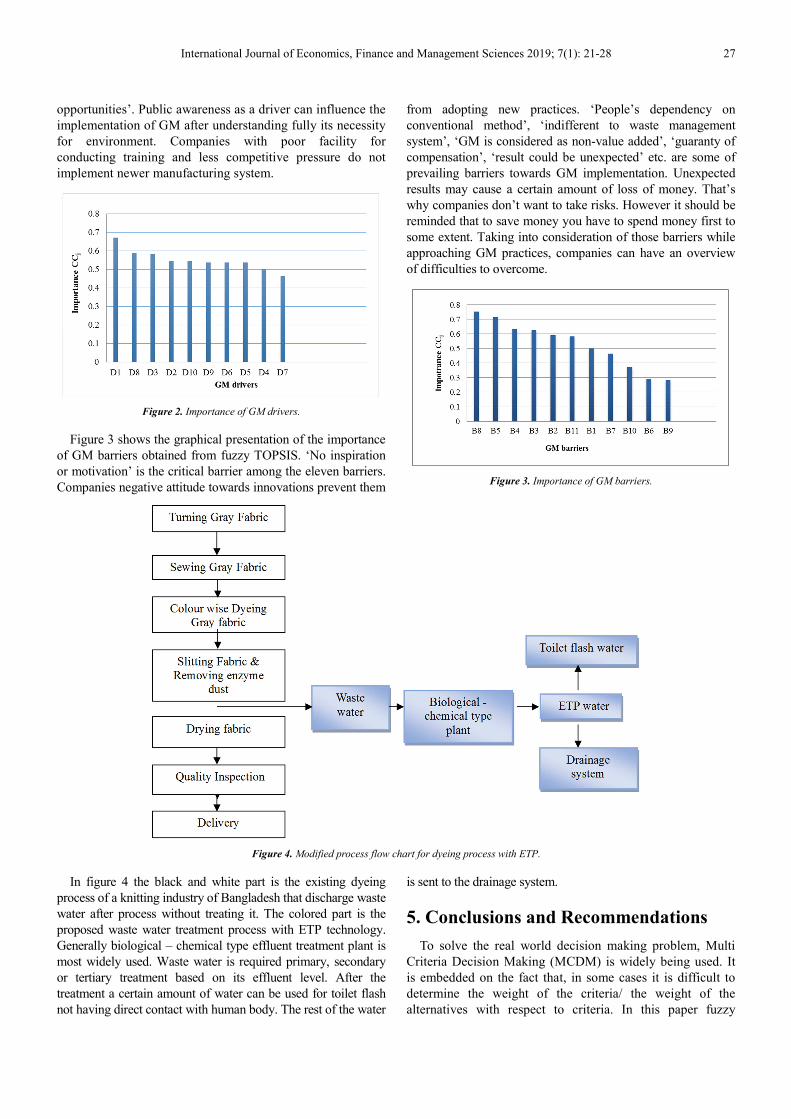
opportunities’. Public awareness as a driver can influence the
implementation of GM after understanding fully its necessity
for environment. Companies with poor facility for
conducting training and less competitive pressure do not
implement newer manufacturing system.
Figure 2. Importance of GM drivers.
Figure 3 shows the graphical presentation of the importance
of GM barriers obtained from fuzzy TOPSIS. ‘No inspiration
or motivation’ is the critical barrier among the eleven barriers.
Companies negative attitude towards innovations prevent them
from adopting new practices. ‘People’s dependency on
conventional method’, ‘indifferent to waste management
system’, ‘GM is considered as non-value added’, ‘guaranty of
compensation’, ‘result could be unexpected’ etc. are some of
prevailing barriers towards GM implementation. Unexpected
results may cause a certain amount of loss of money. That’s
why companies don’t want to take risks. However it should be
reminded that to save money you have to spend money first to
some extent. Taking into consideration of those barriers while
approaching GM practices, companies can have an overview
of difficulties to overcome.
Figure 3. Importance of GM barriers.
Figure 4. Modified process flow chart for dyeing process with ETP.
In figure 4 the black and white part is the existing dyeing
process of a knitting industry of Bangladesh that discharge waste
water after process without treating it. The colored part is the
proposed waste water treatment process with ETP technology.
Generally biological – chemical type effluent treatment plant is
most widely used. Waste water is required primary, secondary
or tertiary treatment based on its effluent level. After the
treatment a certain amount of water can be used for toilet flash
not having direct contact with human body. The rest of the water
is sent to the drainage system.
5. Conclusions and Recommendations
To solve the real world decision making problem, Multi
Criteria Decision Making (MCDM) is widely being used. It
is embedded on the fact that, in some cases it is difficult to
determine the weight of the criteria/ the weight of the
alternatives with respect to criteria. In this paper fuzzy

28 Sumaiya Shahria et al.: Prioritizing Drivers and Barriers for Applying Green Manufacturing with a
System Model Approach: A Case Study
TOPSIS method was proposed to solve MCDM problem.
The investigation and prioritization of GM drivers and
barriers suggest very interesting and useful results. In
Bangladesh, The textile dyeing industries consume huge
amounts of water and produces large volumes of wastewater
from different steps in the dyeing and finishing processes.
For proper treatment of waste water of dyeing section, an
ETP is needed and is an initiative to have green
manufacturing. After understanding the system model of
green manufacturing for dyeing section, there is need for
implementation, proper execution and looking for ways to
improve the current level. Likewise dyeing section, knitting
and yarn production are in a great need to be eco-friendly.
Those would be useful area of research.
References
[1] Paul, L. D., Bholeb, G. P., and Chaudharic, J. R. (2014) ‘A review on green manufacturing: it’s important, methodology and its application’, 3rd International Conference on Materials Processing and Characterisation (ICMPC 2014),6, 1644 – 1649.
[2] Masupha, T. M. (2007) ‘Water management at a textile industry: a case study in Lesotho’, A Research Report, 1- 89.
[3] Talapatra, S., Uddin, M. K., & Rahman, M. H. (2018). Development of an Implementation Framework for Integrated Management System Based on the Philosophy of Total Quality Management. American Journal of Industrial and Business Management, 8(6), 1507-1516.
[4] Berns, M., Bussey, K., Murray, S., and Vismans D. (2011) ‘Sustainability: the 'embracers' seize advantage’, Research Report by MIT Sloan Management Review and The BCG, 1-28.
[5] Mittal, V. K., and Sangwan, K. S. (2014) ‘Development of a model of barriers to environmentally conscious manufacturing implementation’, International Journal of Production Research, 52(2), 584-594.
[6] Mittal, V. K., and Sangwan, K. S. (2014) ‘Modelling Drivers for Successful Adoption of Environmentally Conscious Manufacturing’, Journal of Modelling in Management, 9(2), 127-140.
[7] Singh, A., Singh, B., and Dhingra, A. K. (2012) ‘Drivers and barriers of green manufacturing practices: a survey of Indian industries’, International Journal of Engineering Sciences1(1), 5-19.
[8] Singh, P. J, Mittal, V. K., and Sangwan, K. S. (2013) ‘Development and validation of performance measures for environmentally conscious manufacturing’, International Journal of Services and Operations Management, 14(2), 197-220.
[9] Govindan, K., Diabat, A., and Shankar, K. M. (2015)
‘Analyzing the drivers of green manufacturing with fuzzy approach, Journal of cleaner production, 96, 182-193.
[10] Duflou, J. R., Sutherland, J. W., Dornfeld, D., Herrmann, C., Jeswiet, J., Kara, S., Hauschild, M., and Kellens, K. (2012) ‘Towards energy and resource efficient manufacturing: a processes and systems approach, CIRP Annals - Manufacturing Technology, 61(2), 587-609.
[11] Ariffin, R., Ghazilla, R., Sakundarini, N., Hanim, S., Rashid, A., Ayub, N. S., Olugu, E. U., and Musa, S. N., (2015) ‘Drivers and barriers analysis for green manufacturing practices in Malaysian SMEs: a preliminary findings’, 12th Global Conference on Sustainable Manufacturing,26, 658 – 663.
[12] Post, J. E., and Altma, B. W. (1994) ‘Managing the environmental change process: barriers and opportunities’, Journal of Organizational Change Management, 7(4), 64 – 81.
[13] Luken, R., and Rompaey, F. V. (2008) ‘Drivers for and barriers to environmentally sound technology adoption by manufacturing plants in nine developing countries’, Journal of Cleaner Production, 16(1), 67-77.
[14] Wang, J. W., Cheng, C. H., and Huang, K. C. (2009) ‘Fuzzy hierarchical TOPSIS for supplier selection’, Applied Soft Computing, 9(1), 377-386.
[15] Jiang, Y. P., Fan, Z. P, and Ma, J. (2008)‘A Method for group decision making with multigranularity linguistic assessment information’, Information Sciences, 178(4), 1098–1109.
[16] Boran, F. E., Genc, S., Kurt, M., and Akay, D. (2009) ‘A multi-criteria intuitionistic fuzzy group decision making for supplier selection with TOPSIS method’, Expert Systemswith Applications, 36(8), 11363- 11368.
[17] Deif, A. M. (2011) ‘A system model for green manufacturing’, Advances in Production Engineering and Management,6(1), 27- 36.
[18] Kapdan, I. K., and Alparslan, S. (2005) ‘Application of anaerobic-aerobic sequential treatment system to real textile wastewater for color and COD removal’, Enzyme and Microbial Technology, 36(2–3), 273–279.
[19] Somasiri, W., Li, X. F., Ruan, W. Q., and Chen Jian, C. (2008) ‘Evaluation of the efficacy of upflow anaerobic sludge blanket reactor in removal of color and reduction of COD in real textile wastewater’, Bioresource Technology,99(9), 3692–3699.
[20] Yang, Q., Li, C., Li, H., Li, Y., and Yu, N. (2009) ‘Degradation of synthetic reactive azo dyes and treatment of textile wastewater by a fungi fonsortium reactor’, Biochemical Engineering Journal, 43(3), 225–230.
[21] Talapatra, S., & Rahman, M. H. (2016). Safety Awareness and Worker’s Health Hazards in the Garments Sector of Bangladesh. European Journal of Advances in Engineering and Technology, 3(9), 44-49.
[22] Chen, C. T. (2000) ‘Extensions of the TOPSIS for group decision-making under fuzzy environment’, Fuzzy Sets and Systems, 114(1), 1–9.


![HEARTLINE KNIT WRAP | KNIT · 2018. 5. 11. · HEARTLINE KNIT WRAP | KNIT 2 of 2 HEARTLINE KNIT WRAP | KNIT CAK0126-010003M measures approx 58" [147.5 cm], ending on a WS row with](https://img.pdfslide.us/doc/110x75/5fd034989f28e2726c32dbf7/heartline-knit-wrap-knit-2018-5-11-heartline-knit-wrap-knit-2-of-2-heartline.jpg)