Embed Size (px)
Citation preview
58 TRANSPORTATION RESEARCll RECORD 1216
Prioritization and Optimization of Pavement Preservation Treatments
J. J. HAJEK AND W. A. PHANG
This paper describes a framework for selecting the best pavement preservation treatments for an available pavement preservation budget. It includes formulation of project-specific strategies, evaluation of funding requirements, and setting of priorities. The technology is illustrated using data for 75 sections from the Stratford district. The key component of this framework is an action plan that recommends preferred and fall-back pavement preservation strategies for all individual pavement management sections. The task of preparing action plans is assigned to experienced regional staff. The action plan documents the existing pavement condition, integrates all major pavement maintenance and rehabilitation efforts into a unified preservation plan, and coordinates pavement preservation functions of different offices within the Ontario Ministry of Transportation. Linear programming is used to allocate pavement investments in a manner that yields maximum benefits to the total pavement network. The linear programming solution considers all section-specific strategies listed in the action plans. Sensitivity analyses are used to evaluate the effect on the linear programming solution of using different optimization goals and different budget constraints. While the objective function used only maximizes the technical benefits of pavement investments, it can be modified to include societal benefits.
The pavement management process can be roughly divided into three related phases:
1. A data gathering phase, in which the data required to make pavement preservation decisions are collected and stored;
2. A decision phase, in which pavement inventory data are used to make recommendations regarding pavement preservation actions; and
3. A feedback phase, in which the consequences of pavement investments are evaluated.
This paper is mainly concerned with the second phase. Its objective is to describe the methodology for recommending pavement preservation actions that was developed for the Ontario Ministry of Transportation's pavement management system. This methodology consists of the following steps:
1. Development of a preferred pavement preservation •tr:itl"gy, "' wPll "' "ltPrn:<tivP fall-h::ick str::itegies , for every pavement management section;
2. Aggregation of funding requirements for individual pavement sections and their evaluation on district, regional, or provincial levels; and
Research and Development Branch, Ministry of Transportation of Ontario, 1201 Wilson Avenue, Downsview, Ontario, Canada.
3. Selection of pavement preservation strategies that would best use the available budget.
Step 1 represents project-level evaluation, while steps 2 and 3 represent network-level evaluation and prioritization. The application of the methodology is illustrated using recent data obtained for the Stratford district.
Any methodology for recommending pavement preservation actions depends on the amount and quality of inventory data. For this reason, the current method of gathering and storing pavement inventory data is briefly described.
DATA REQUIRED FOR PAVEMENT PRESERVATION DECISIONS
To facilitate planning of pavement rehabilitation actions, the Ministry of Transportation has been systematically rating pavement deterioration since the mid-1960s. The original rating scheme was based on a subjectively assigned pavement condition rating (1). It was realized in the 1970s that pavement deterioration should be evaluated using a more objective and consistent measure. This led to the development and recent introduction of the Pavement Condition Index (PCI) (2).
The PCI is measured on a scale of 0 to 100. Newly constructed pavements have a PCI of about 95, and rehabilitation is usually done when the PCI is between 60 and 40. The PCI comprises two different physical parameters:
1. The riding quality of the pavement surface measured by a response-type pavement roughness meter, and
2. The extent and severity of 15 pavement surface distresses evaluated against well-defined measurement scales.
These two parameters are combined using a mathematical formula.
The basic pavement management unit is a pavement management section. Pavement management sections have relatively uniform pavement structure and traffic loadings, and exhibit relatively uniform pavement deterioration. The typical length of pavement management sections is approximately 10 ~!'?'? .
The pavement condition surveys used to determine the PCI are done every 2 yr, and all data obtained during these surveys are stored as historical records in a pavement management data base. These include roughness data, the severity and density of 15 pavement surface distresses, and the PCI. The data base operates under the FOCUS data base management system (3) and contains data for approximately 2,000 pave-
Hajek and Phang
ment sections. The data base was designed to store and retrieve all basic data needed to plan specific pavement preservation treatments for individual sections.
Examples of data that can be readily retrieved from the pavement management data base are shown in Tables 1 and 2. Table 1 is an example of a pavement performance record, which summarizes past pavement deterioration data , for a section in the Stratford district.
Table 2 shows an action plan fact sheet for the same section. This fact sheet consists of two parts . The first part summarizes pavement inventory data, such as pavement structural data, functional class, and past performance. The second part lists two key estimates:
1. The expected change in PCI during the next 3 yr ( 6.PC/3).
This estimate provides a systematic measure of the expected rate of pavement deterioration. It is based on the assumption that no preservation action , other than routine maintenance , will be taken during the 3-yr period. 6.PCI3 is used for the section-specific pavement deterioration prediction to estimate when the pavement performance will reach the minimum acceptable level and when a pavement preservation action will be needed.
2. The action plan , which lists all pavement preservation actions planned within a 5-yr planning period.
The action plan is prepared for all sections. It is the key pavement management tool that documents the existing pavement condition, integrates all major pavement maintenance and rehabilitation efforts into a unified preservation plan, and coordinates pavement preservation functions of different offices within the ministry (such as district maintenance, regional rehabilitation, and Head Office policy and funding functions).
PROJECT-LEVEL PRIORITIZATION
The tasks of predicting the expected rate of pavement deterioration and recommending pavement preservation strategies for action plans are assigned to experienced regional staff. These individuals are in constant contact with the portion of the highway network over which they have responsibility and can fully exercise their engineering judgment and knowledge of local conditions . They also work closely with district staff, who are in charge of pavement maintenance, to coordinate and plan pavement maintenance. To help the regional staff, detailed guidelines have been prepared for these tasks ( 4). Salient features of the guidelines for recommending pavement preservation strategies are briefly described below.
These guidelines provide a structured procedure on how to identify, for each section:
• A preferred pavement preservation strategy, and • Its alternative , fall-back (or contingency) strategies.
The preferred pavement preservation strategy is defined as the one that addresses in the most cost-effective way the problem of keeping the pavement in an adequate state of pavement preservation. It encompasses both major maintenance treatments (such as patching) and rehabilitation treatments (such as overlays), taken singly or in combination with each other.
59
The preferred strategy must take into account existing resources and procedures and is usually based on life-cycle economic analysis. Preferred strategies are usually recommended for implementation before the pavement reaches a minimum acceptable serviceability level.
The fall-back strategies provide recommendations of what to do if a postponement or rescheduling of expenditures is required for the preferred strategy. Compared with the preferred strategy, the fall-back strategies would likely result in lower pavement performance or higher construction costs.
The fall-back strategies should provide "substantial" alternatives to the preferred strategy. Small variations in the preferred strategy, such as a change in overlay thickness by 20 percent or a postponement of the overlay by only 1 yr, do not usually constitute substantial alternatives.
Fall-back strategies should be developed that
• Provide a substantial postponement of expenditures , • Enable a systematic assessment of the consequences of
not implementing the recommended preferred strategies on time, and
• Enable comparisons of these consequences among different sections.
Using a structured format, two types of fall-back strategies are developed: holding strategies and deferred strategies.
A holding strategy is designed to hold the pavement for at least 2 or 3 yr until the preferred strategy can be undertaken. For example, according to the action plan given in Table 2, the preferred strategy calls for a 90 mm overlay in 1989. The corresponding holding strategy recommends patching in 1988 and the same 90 mm overlay in 1991. The patching component of the holding strategy is intended to hold the pavement until 1991 and to postpone the major part of the expenditure from 1989 to 1991.
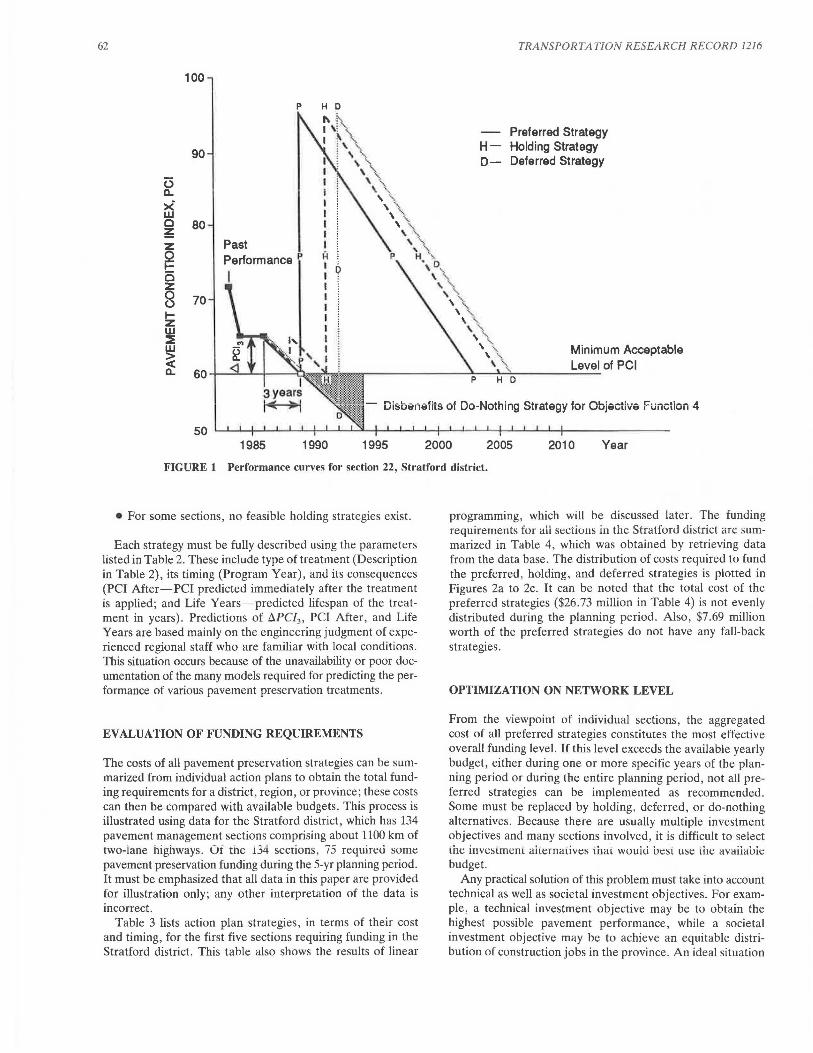
A deferred strategy assumes that it is necessary to defer all expenditures associated with the preferred strategy by at least 3 yr if the preferred strategy is a rehabilitation treatment. If the preferred strategy only recommends a maintenance treatment, the deferral may be just 1 or 2 yr. Returning to the example in Table 2, the deferred strategy assumes that no funds (other than those for routine maintenance) are available until 1992 and , based on this constraint, recommends deferring padding and resurfacing until that time. The deferred strategy should address the new situation in the most costeffective manner. The expected pavement performance curves for all strategies listed in Table 2 are shown in Figure 1.
By default, all sections also have do-nothing strategies, which assume that no pavement preservation expenditures (other than those for routine maintenance) will be made during the 5-yr planning period. The consequences of do-nothing strategies can be judged by the t..PCI3 estimates.
Not all sections require the full palette of preservation strategies for the 5-yr planning period. For example,
• Many sections do not require any specific preservation treatment other than routine maintenance, which is not included on the action plans;
• Some preferred strategies, particularly those scheduled for the beginning of the planning period , are already approved and do not require any fall-back strategies; and
TABLE 1 PAVEMENT PERFORMANCE RECORD, SECTION 22, STRATFORD DISTRICT
P A Y E H E N I P E R F O R H A N C E R E C O R D DlSTRICJI 3 HIGHMAY :a
LllRS OFFSET LEHGl II DIRECTION FACILITY CLASS LAtlES AADI TRUCK X FROH: FREEPORT DR. 15870 ....L1!! ...!..:..! !! A ~ ~ 32600 10.8
IO : FAIRHAY RD. IIHERCHAllGe
RVERALL PAVEHENT PERFORllANCE HISTORY
VEllR 78 79 80 81 82 83 8'i 85 86 87 88 &<J• 90 <J1 92 93 94 95 AGE 16 21 22 23 PCR 80 6ll 60 68 PCI 78 71 66 66 RCR 7.0 7.0 5.9 7.0 5.7 DHI 22.8 40.0 40.0 38.5 38.!"
RETAILED PAVEHENT PERfORllAHCE lllS'TORY SEVERllY OF DISTRESS
19711 l<JU l<J8'i 1985 1'86 19 19 CODES SEV.=~EYFRllYt UEH.=DEHSllV SEY. DEN. SEY. DEN. SEY. DEN. SEY. DEN. SEY. DEN. SEV. DEN. SEY. DEtl.
C. AGG. LOSS & RAV. HUSlllllG nIPPLl llG AllD !:llOVlllG WllEEL TRACK RUil me DISIORI IOll I OllGil UOJllAL SING. & MULT. I WHEEL 1 RACK I AUIGAIOR CEIHRE LJllE SJN1;. & MUll.
ALU GATOR PAVEHEIU EDGE lHllG. & HULT.
All.JGATllR IRAHSVERSE llALF ,FULL & HULi.
llLLIGlllOR llEllllDER AND lflDLAtlE llAllDOH
l!AJOR MAINTENANCE HISTORY
VEAR> ITEM TYPECCDIJEI EXIENT % cosr
1986 II
0 0 .o .o
• DISTRESS COHHENISI
OfllER COHHENT'S
[11\JE: AUGUST 26, 19117
2
2
2
2
Ill
0 .o
5 3 3
2 2
1 3
2
5 2
2
1. VERY SLIGHT 2. SLIGIU 3. llODERAlE
5 3 5 3 5 4. SEVERE 2 3 2 3 1 S. VERY SEVERE 4 2 4 2 4
2 3 2 3 2 DEtlSITY (EXIENTI CODES
2 2 2 2 2 1. <10%
' 2. 10-20 5 2 5 2 5 3. 20-50
4. 50-80 1 2 1 2 1 5. 80-100
SHOULDER COHDIIION FOR GRAVEL SHOULDERS
YEAR> 1986 SEY. DEN.
.EXIEIH Of HAIN!ENANCE JREAIHEN! IN 1986 ICODEl
PAYEHENf SHOULDER HAHllAL PAIClllNG 0 0 HAClll NE PA I CHING 0 0 SPRAY PAIClllNG 0 ROllT & SEAL CRACKS 0 0 CHIP SEAL 0 0
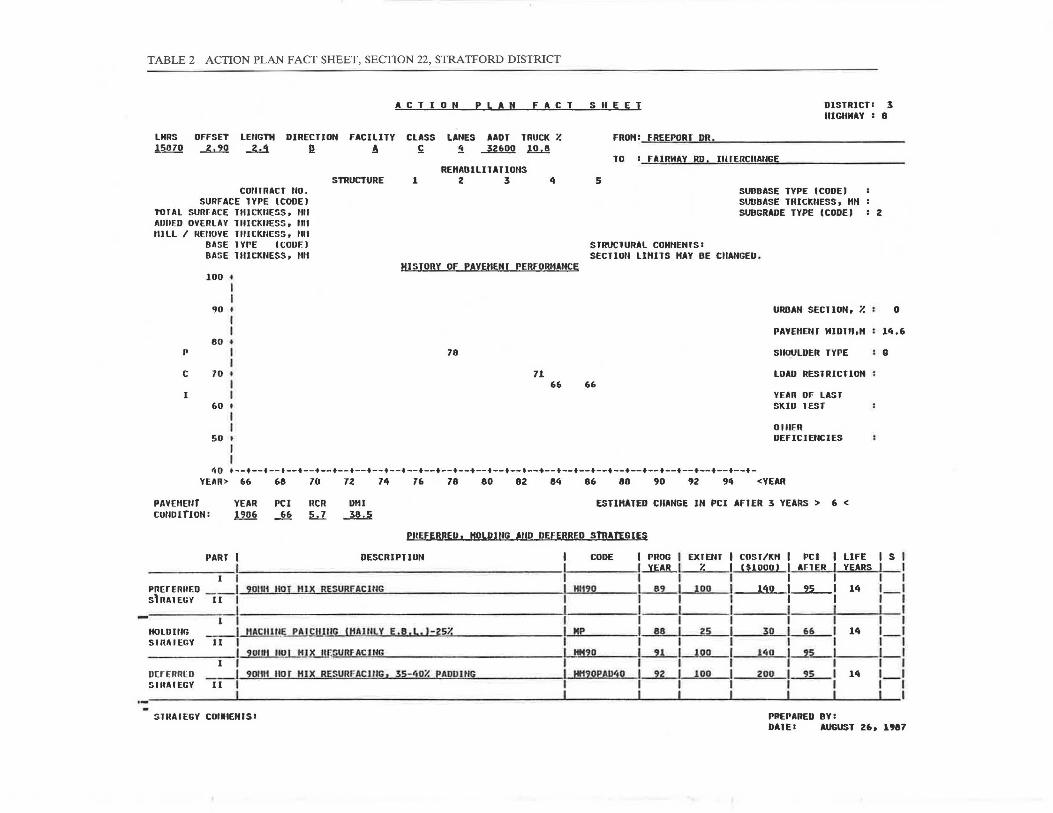
TABLE 2 ACTION PLAN FACT SHEET, SECTION 22, STRATFORD DISTRICT
A C T I 0 N p l A N F A C T S H E E T DISTRICTI 3 lllGHNAY I 8
LMRS OFFSET LEllGTff DIRECTION FACILITY CLASS LANES lAOT TRUCK % 1so10 ~ J..:.!i D A ~ ! 32600 !.!!.....!!
COJITRACT 110. SURFACE TYPE (CODE)
TUTAL SllRfACE TllJCl<llESS, tlll Aum:D OVERLAY llllCkllESS. '"' Hill I llEllOVE TlllCkllESS, 1111
DASE TYPE ICOIJF.I BASE llllCKHESS, tlll
100
90 •
STRUCTURE REHAOILITATIOHS
1 2 3 4
HISTORY OF PAVEtlENl PERFORMANCE
FROHI FREEPORT DR.
TO : FAIRWAY IW, llHERCHANGE
5
SfRUCTURAl COHHENJS:
SUBBASE TYPE ICODEI SUIJBASE THICKHESS, HH SUBGRADE TYPE (CODE) I 2
SEC Tl OH LIHITS HAY BE CHANGED.
URBAN SECTION, ?. 0
PAVEHEIH HIUTll,H : 14 .6 80 •
p 78
c 70 • 71 66 66
I 60
50 I
'oO +--t--•--•--•--t--+--•--t--t--t--t--+--t--+--t--+--•--+--+--+--t--t--t--t--+--+--+--t--+--t-
SHOULDER TYPE
LOAD RESTRICTION
YEAR OF LAST SKID TEST
OlllFR DEFICIEtlCIES
G
YEAR> 66 68 70 72 74 76 78 80 82 84 86 88 90 92 94 <YEAR
PAVEHEllf COllDlfJON:
YEAR PCI RCR UHi 1906 ~ 5.7 38.5
ESTIHATED CHANGE IN PCI AflER 3 YEARS > 6 <
PllEFERREU, HOLDJ!IG AllD DEFERRED STRATIGIES
PART I DESCRIPTION CODE I PROG I EXJEtlT I COST/KH I PCI I LIFE I S
-------------------------!------!'~' ?. I 1$1000) I AFTER I YEARS I 1 I I I I I I I I
PRHERllEO __ I 901111 HOT HLX RESURFACHIG Hlt90 l 89 I 100 I 140 l 95 I 14 l_I slRAlEGY 11 I I I I I I I I
I I__ I I .-----1-I I I I I I I I HOLDlllG __J HAClllllE PAIClllllG IHAHILY E.B.L. 1-?5% MP I 88 I ?5 I 30 I 66 I 14 l_I s 111111 EGY 11 I I I I I I I I ------' ?UIU! llO! HIX l! f.SURFACING HM90 l--2!..._[ 100 I l '•O I 25 I I
I I I I I I I I I 11urnm:o __ I 9011H nor HIX RESURf'ACJllG, 35-40% PADDHIG l!t90PAU'10 I n I 100 I 200 l~I 14 l_I SIRAIEGY II I I I I I I I I
I __l__ _l_ . I _ L_ I I I I
STRAIEGY COllHENJSI PREPARED ey: DAJE: AUGUST 26, 1987
62
100
90
(3 0...
~ c 80 ~
s Ci z 8 70 tz w ::E w ~
p
Past Performance P
HD-
TRANSPORTATION RESEARCH RECORD 1216
Preferred Strategy Holding Strategy Deferred Strategy
Minimum Acceptable Level of PCI
0... 60 -~~--t-----i...l""" ~~~~~~~-'.______,.........,~~~~~~-
I 3years
P H D
~ Disbenefits of Do-Nothing Strategy fo; Objective Function 4
so 1985 1990 1995 2000 2005 2010 Year
FIGURE 1 Performance curves for section 22, Stratford district.
• For some sections, no feasible holding strategies exist.
Each strategy must be fully described using the parameters listed in Table 2. These include type of treatment (Description in Table 2), its timing (Program Year), and its consequences (PCJ After-PCI predicted immediately after the treatment is applied; and Life Years-predicted lifespan of the treatment in years) . Predictions of l:l.PC/3 , PCI After , and Life Years are based mainly on the engineering judgment of experienced regional staff who are familiar with local conditions. This situation occurs because of the unavailability or poor documentation of the many models required for predicting the performance of various pavement preservation treatments.
EVALUATION OF FUNDING REQUIREMENTS
The costs of all pavement preservation strategies can be summarized from individual action plans to obtain the total funding requirements for a district, region, or province ; these costs can then he compared with available budgets. This process is illustrated using data for the Stratford district, which has 134 pavement management sections comprising about 1100 km of two-iane highways . Of the i34 sections , /j requireu sume pavement preservation funding during the 5-yr planning period. It must be emphasized that all data in this paper are provided for illustration only; any other interpretation of the data is incorrect.
Table 3 lists action plan strategies, in terms of their cost and timing, for the first five sections requiring funding in the Stratford district. This table also shows the results of linear
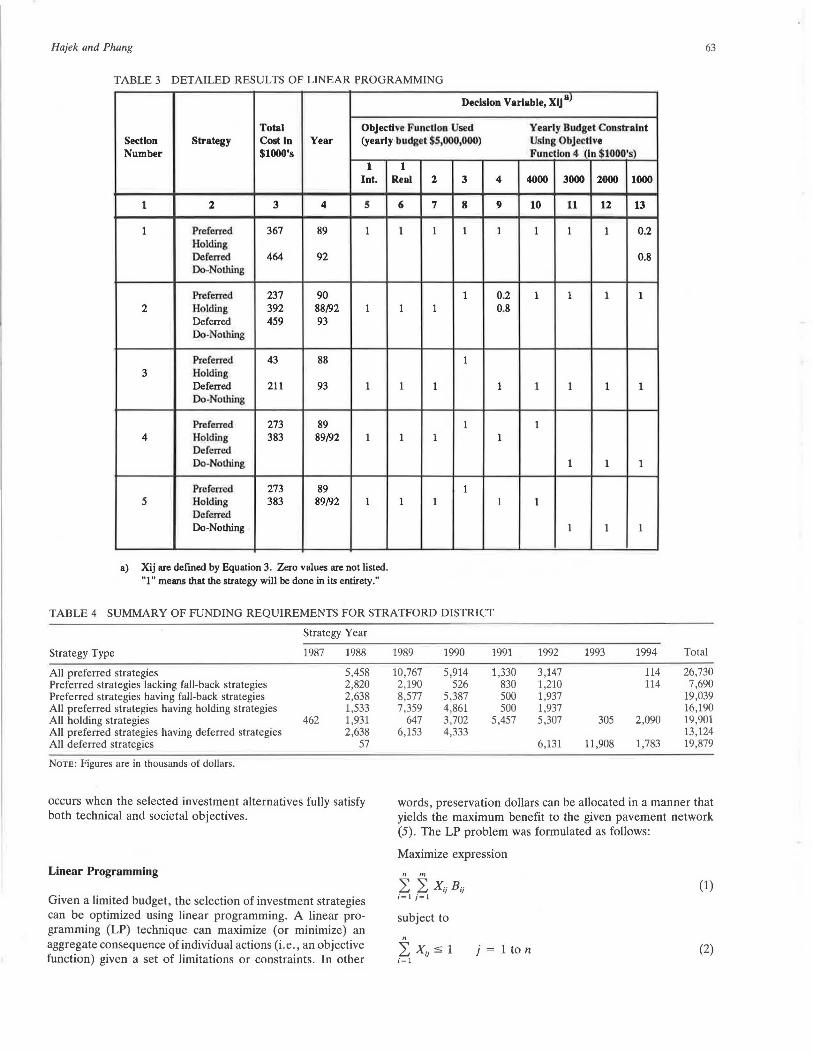
programming, which will be discussed later. The funding requirements for all sections in the Stratford district are summarized in Table 4, which was obtained by retrieving data from the data base. The distribution of costs required to fund the preferred, holding, and deferred strategies is plotted in Figures 2a to 2c. It can be noted that the total cost of the preferred strategies ($26.73 million in Table 4) is not evenly distributed during the planning period. Also , $7.69 million worth of the preferred strategies do not have any fall-back strategies.
OPTIMIZATION ON NETWORK LEVEL
From the viewpoint of individual sections, the aggregated cost of all preferred strategies constitutes the most effective overall funding level. If this level exceeds the available yearly budget, either during one or more specific years of the planning period or during the entire planning period , not all preferred strategies can be implemented as recommended. Some must be replaced by holding, deferred, or do-nothing alternatives. Because there are usually multiple investment objectives and many sections involved, it is difficult to select the investmem alternatives that wuuiu uesi use the avaiiauie budget.
Any practical solution of this problem must take into account technical as well as societal investment objectives. For example, a technical investment objective may be to obtain the highest possible pavement performance, while a societal investment objective may be to achieve an equitable distribution of construction jobs in the province. An ideal situation
Hajek and Phang
TABLE 3 DETAILED RESULTS OF LINEAR PROGRAMMING
Decision Variable, Xlja)
Total Objective Function Used Section Strategy Cost In Year (yearly budget $5,000,000) Number $1000's
1 1 Int. Real 2 3
1 2 3 4 5 6 7 8
1 Preferred 367 89 1 1 1 1 Holding Deferred 464 92 Do-NotJli.ng
Preferred 237 90 1 2 Holding 392 88/92 1 1 1
Deferred 459 93 Do-Nothing
Preferred 43 88 1 3 Holding
Deferred 211 93 1 1 1 Do-Nothing
Preferred 273 89 1 4 Holding 383 89/92 1 1 1
Deferred Do-Notlting
Preferred 273 89 1 5 Holding 383 89/92 1 1 1
Deferred Do-NotJting
a) Xij are defined by Equation 3. Zero values are not listed. "1" means that the strategy will be done in its entirety."
4
9
1
0.2 0.8
1
1
1
TABLE 4 SUMMARY OF FUNDING REQUIREMENTS FOR STRATFORD DISTRICT
Strategy Year
Strategy Type 1987 1988 1989 1990 1991
All preferred strategies 5,458 10,767 5,914 1,330 Preferred strategies lacking fall-back strategies 2,820 2,190 526 830 Preferred strategies having fall-back strategies 2,638 8,577 5,387 500 All preferred strategies having holding strategies 1,533 7,359 4,861 500 All holding strategies 462 1,931 647 3,702 5,457 All preferred strategies having deferred strategies 2,638 6,153 4,333 All deferred strategies 57
NOTE : Figures are in thousands of dollars.
Yearly Budget Constraint Using Objective Function 4 (In $1000's)
4000 3000 2000 1000
10 11 12 13
1 1 1 0.2
0.8
1 1 1 1
1 1 1 1
1
1 1 1
1
1 1 1
1992 1993 1994
3,147 114 1,210 114 1,937 1,937 5,307 305 2,090
6,131 11,908 1,783
63
Total
26,730 7,690
19,039 16,190 19,901 13,124 19,879
occurs when the selected investment alternatives fully satisfy both technical and societal objectives.
words, preservation dollars can be allocated in a manner that yields the maximum benefit to the given pavement network (5). The LP problem was formulated as follows:
Linear Programming
Given a limited budget , the selection of investment strategies can be optimized using linear programming. A linear programming (LP) technique can maximize (or minimize) an aggregate consequence of individual actions (i.e., an objective function) given a set of limitations or constraints. In other
Maximize expression
n m
L L X,j B,j i = l i=l
subject to
n
2: x,j :s 1 j = 1 to n i=l
(1)
(2)
64
PREFERRED
89 90 91 92
al Distribution of Preferred Strategy Costs
HOLDING
88 89 90 91 92
b/ Distribution of Holding Strategy Costs
88 89 90 91 92
cl Distribution of Deferred Strategy Costs
COMBINATION
93
93
93
94 YEAR
94 YEAR
94 YEAR
0-'--.--'-......... '"""'--'---'---,--''----'~.---'-'--~-'--88 89 90 91 92 93 94
YEAR d/ Distribution of Costs Obtained by Linear Programming
FIGURE 2 Cost composition for linear programming solution, objective function 4, Stratford district.
and
" m 2: 2: xij cij, ~ B, i = l j= l
t = each year within the planning period (3)
where
B;i = benefit associated with implementing strategy i for section j;
X;i = a decision variable (for mixed integer programming model, X;i = l 1t strategy 1 1s selected and U otherwise);
C;i, = cost of strategy i for section j in year t; n = number of strategies for a given section (four maxi
mum: preferred, holding, deferred, and do-nothing); m = number of sections requiring funding during the 5-
yr period (75 for the Stratford district); and B, = budget available in year t.
TRANSPORTATION RESEARCH RECORD 1216
Equation 1 is called the objective function and represents the sum of benefits that can be obtained by implementing all selected strategies. Its goal is to maximize the value of the objective function subject to the constraints (Equations 2 and 3). Equation 2 ensures that only one strategy "unit" is selected per section, while Equation 3 makes sure available yearly budgets are not exceeded. The investment alternatives considered by LP are the strategies listed on the action plan fact sheets. They are practical, feasible alternatives with systematically evaluated costs and consequences.
To explore different ways of measuring pavement investment benefits and the consequences of different benefits on the LP solution, the benefits were measured in four different ways and the resulting LP solutions were obtained and compared. The following objective functions were evaluated using nonmonetary benefits.
Objective Function 1
The benefits used to calculate the value of objective function 1 (B1 ) were expressed as the time in years at which pavement performance will be above the acceptable level (y), multiplied by the section length (L):
" m
81 = LL Yij Lj (4) i=l j = l
For example, considering data given in Table 2 and Figure 1, the benefit of the preferred strategy is the product of 14 yr (the strategy is expected to last from 1989 to 2003) and the length of2.4 km. The benefit of the do-nothing alternative for the same section was calculated as the ratio of the section's tJ.PC/3 (six PCI units in Table 2) and the average tJ.PC/3 for all sections in the Stratford district (6.3), multiplied by 5 (years). Given a limited budget, this formulation maximizes the number of sections with an acceptable level of pavement performance.
Objective Function 2
The benefits used to calculate the value of objective function 2 (B2) were similar to those of objective function 1 but were also factored to include the influence of traffic:
" m
B2 = L L Y;i Lj ~ (5) i=1 }=1
where
Ti = log (AADT of cars + 3 AADT of trucks), and AADT = annual average daily traffic.
This formulation increases benefits for sections with high traffic volumes, particularly truck volumes. Truck volumes were multiplied by three because user savings attributed to the improved pavement performance have been estimated to be roughly three times greater for trucks than for cars (6).
Objective Function 3
The benefits used for objective function 3 were the same as those of objective function 2 and were expressed as a benefit/

Hajek and Phang 65
TABLE 5 EVALUATION OF OBJECTIVE FUNCTIONS FOR YEARLY BUDGET OF $5 MILLION
Type of Objective Function
Evaluation Parameter
Total benefits Strategy
Preferred Coste Number
Holding Cost Number
Deferred Cost Number
Do Nothing Number
Total Cost Number
Number of split strategy solutions
•Nonmonetary benefits. •Not applicable for comparison . ccosts are in thousands of dollars.
Integer Solution
7,493.6"
12,357.0 39
15,013.0 30
2,633.0 6
0
30,003.0 75 0
cost ratio. The costs were the estimated strategy costs given on the action plan fact sheets . No penalty was included for do-nothing alternatives.
Objective Function 4
Objective Function 4 attempted to max1m1ze user benefits (B4 ) by using the area underneath the performance curve (PCI-time curves in Figure 1) rather than the length of the expected lifespan as in objective functions 1, 2, and 3:
n m
B4 = L L Aij Li Ti (6) i=l j = 1
where A;i equals the area under the performance curve of strategy i for section j.
For simplicity, all pavement performance curves used to calculate B4 were assumed to be straight lines, even though the performance curves for individual pavement sections in Ontario can also show an increasing or decreasing rate of pavement deterioration with time (7). The linear rate is a compromise; there is some evidence from the AASHO Road Test that the rate of pavement deterioration due to traffic loadings is linear when results are plotted against a roughnessdominated measure such as the PCI (8) . It should also be noted that performance curves established for groups of similar pavements in Ontario are approximately linear (9).
The objective functions evaluated in this paper were based on technical considerations alone. While the LP model can optimize the value of only one objective function, it is possible to construct a single objective function that incorporates both technical and societal objectives. For example, the technically calculated benefits, such as objective function 4, can be adjusted according to their geographical area . However, the funds that can be saved by using optimization instead of ranking are substantial and should be considered seriously (10).
The linear programming solution was obtained by LP83/
Real Solution
2 3 4
7,520.2" NI Ab NIA NIA
13,324.8 13,470.3 16,015.0 15 ,134.2 38 38 51 45
14,322.3 14,111.2 10,581.6 8,784.9 31 32 21 20
2,356.0 2,329.2 1,071.4 6,110.0 6 5 2 10
0 0 0
30,003 .1 29.910.7 27 ,668 .0 30,029. I 75 75 75 75
5 5 4 4
MIP83 microcomputer software (11), which can provide both real number linear programming (RNLP) and mixed integer linear programming (MILP) solutions. The MILP solution ensures that X;i of Equation 1 is either 1 or 0, while the RNLP solution allows X;i to be real numbers, which may result in "split" strategy solutions. For example, a split strategy solution may recommend implementing 20 percent of the preferred strategy and 80 percent of the do-nothing strategy (see section 1, column 13, in Table 3) .
The differences between the RNLP and MILP solutions were evaluated for the 75 sections in the Stratford district using objective function 1. The computation time required for the MILP solution using an IBM-AT microcomputer was about 24 hr, while the time for the RNLP solution was only 5 min. Despite the large difference in the computation time, the solutions were quite similar in terms of total benefits (7493.6 versus 7520.2, as shown in Table 5) and in terms of the strategies selected for individual pavement sections. The number of split strategy solutions allowed by RNLP (five) represented only 7 percent of the 75 sections. Furthermore, it can be shown that the number of split strategy solutions cannot exceed the number of constraints defined by Equation 3 (that is, the number of years in the planning period). After considering the computation time savings and the intended use of the LP solution as a management decision support tool, RNLP was used for all subsequent analyses.
Sensitivity Analysis of the Objective Function
The example results of a sensitivity analysis of the four objective functions using data from the Stratford district are listed in Table 3, columns 5 to 9, and in Table 5. The analysis assumed a yearly budget of $5 million for 7 consecutive years. The total yearly cost of the preferred strategies during this period reached a maximum of $10.8 million in 1989 (see Table 4 and Figure 2a).
The linear programming solution keeps the total yearly cost
66 TRANSPORTATION RESEARCH RECORD 1216
550
500
450
~ 400 LL w z 350 w CD ...I
300 ~ ~ 250
200
150
100 1000 2000 3000 4000 5000 6000
YEARLY BUDGET, $ 1000
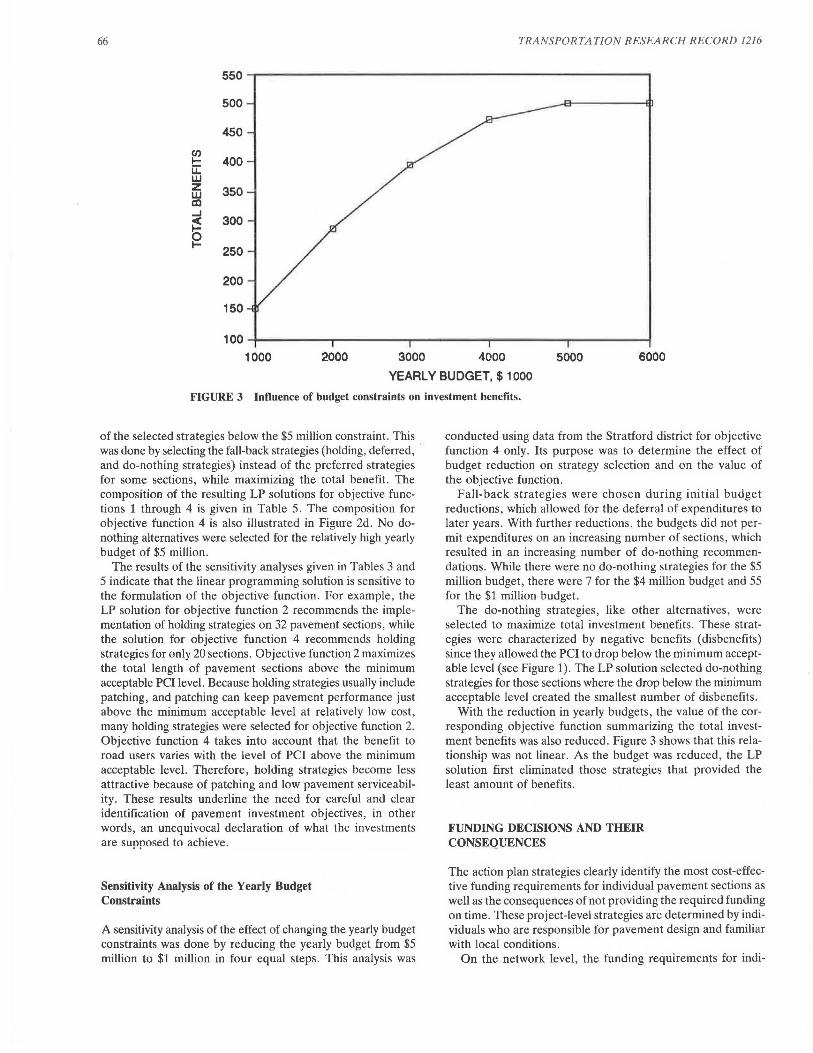
FIGURE 3 Influence of budget constraints on investment benefits.
of the selected strategies below the $5 million constraint. This was done by selecting the fall-back strategies (holding, deferred, and do-nothing strategies) instead of the preferred strategies for some sections, while maximizing the total benefit. The composition of the resulting LP solutions for objective functions 1 through 4 is given in Table 5. The composition for objective function 4 is also illustrated in Figure 2d. No donothing alternatives were selected for the relatively high yearly budget of $5 million.
The results of the sensitivity analyses given in Tables 3 and 5 indicate that the linear programming solution is sensitive to the formulation of the objective function. For example, the LP solution for objective function 2 recommends the implementation of holding strategies on 32 pavement sections, while the solution for objective function 4 recommends holding strategies for only 20 sections. Objective function 2 maximizes the total length of pavement sections above the minimum acceptable PCI level. Because holding strategies usually include patching, and patching can keep pavement performance just above the minimum acceptable level at relatively low cost, many holding strategies were selected for objective function 2. Objective function 4 takes into account that the benefit to road users varies with the level of PCI above the minimum acceptable level. Therefore , holding strategies become less attractive because of patching and low pavement serviceability. These results underline the need for careful and clear identification of pavement investment objectives, in other words, an unequivocal declaration of what the investments are supposed to achieve.
Sensitivity Analysis of the Yearly Budget Constraints
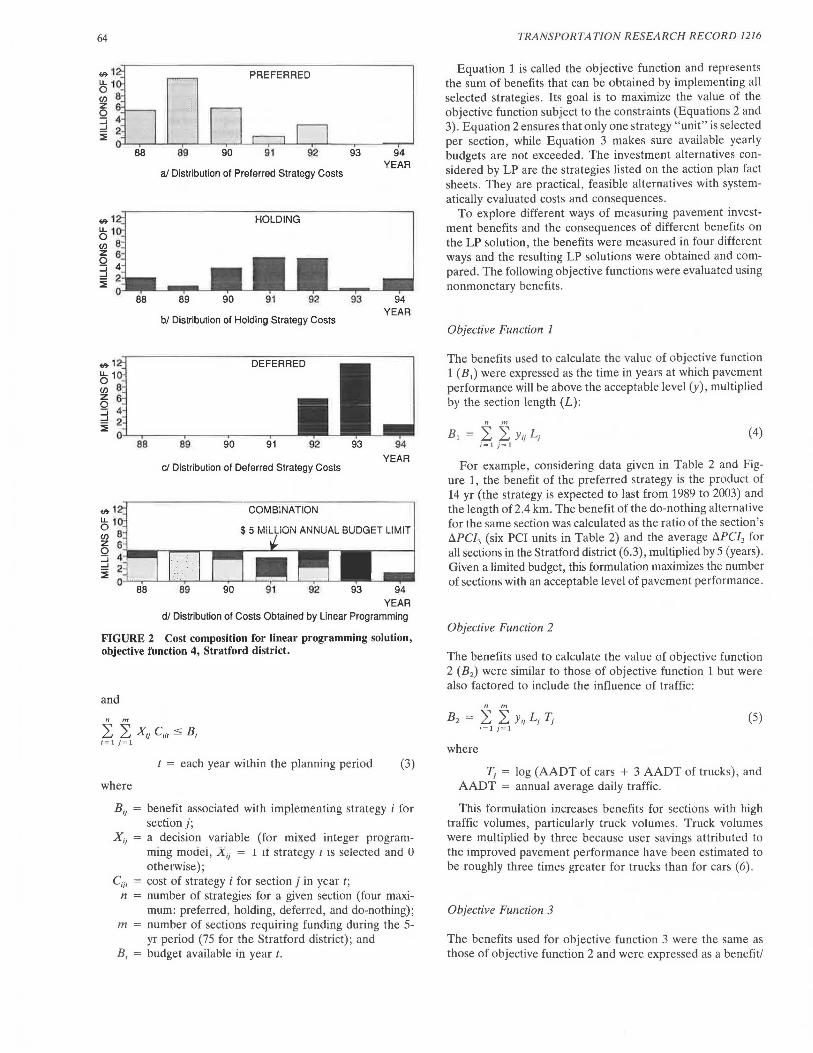
A sensitivity analysis of the effect of changing the yearly budget constraints was done by reducing the yearly budget from $5 million to $1 million in four equal steps. This analysis was
conducted using data from the Stratford district for objective function 4 only. Its purpose was to determine the effect of budget reduction on strategy selection and on the value of the objective function.
Fall-back strategies were chosen during initial budget reductions, which allowed for the deferral of expenditures to later years. With further reductions, the budgets did not permit expenditures on an increasing number of sections, which resulted in an increasing number of do-nothing recommendations. While there were no do-nothing strategies for the $5 million budget, there were 7 for the $4 million budget and 55 for the $1 million budget.
The do-nothing strategies, like other alternatives, were selected to maximize total investment benefits. These strategies were characterized by negative benefits (disbenefits) since they allowed the PCI to drop below the minimum acceptable level (see Figure 1). The LP solution selected do-nothing strategies for those sections where the drop below the minimum acceptable level created the smallest number of disbenefits.
With the reduction in yearly budgets, the value of the corresponding objective function summarizing the total investment benefits was also reduced. Figure 3 shows that this relationship was not linear. As the budget was reduced, the LP solution first eliminated those strategies that provided the least amount of benefits.
FUNDING DECISIONS AND THEIR CONSEQUENCES
The action plan strategies clearly identify the most cost-effective funding requirements for individual pavement sections as well as the consequences of not providing the required funding on time. These project-level strategies are determined by individuals who are responsible for pavement design and familiar with local conditions.
On the network level, the funding requirements for indi-
Hajek and Phang 67
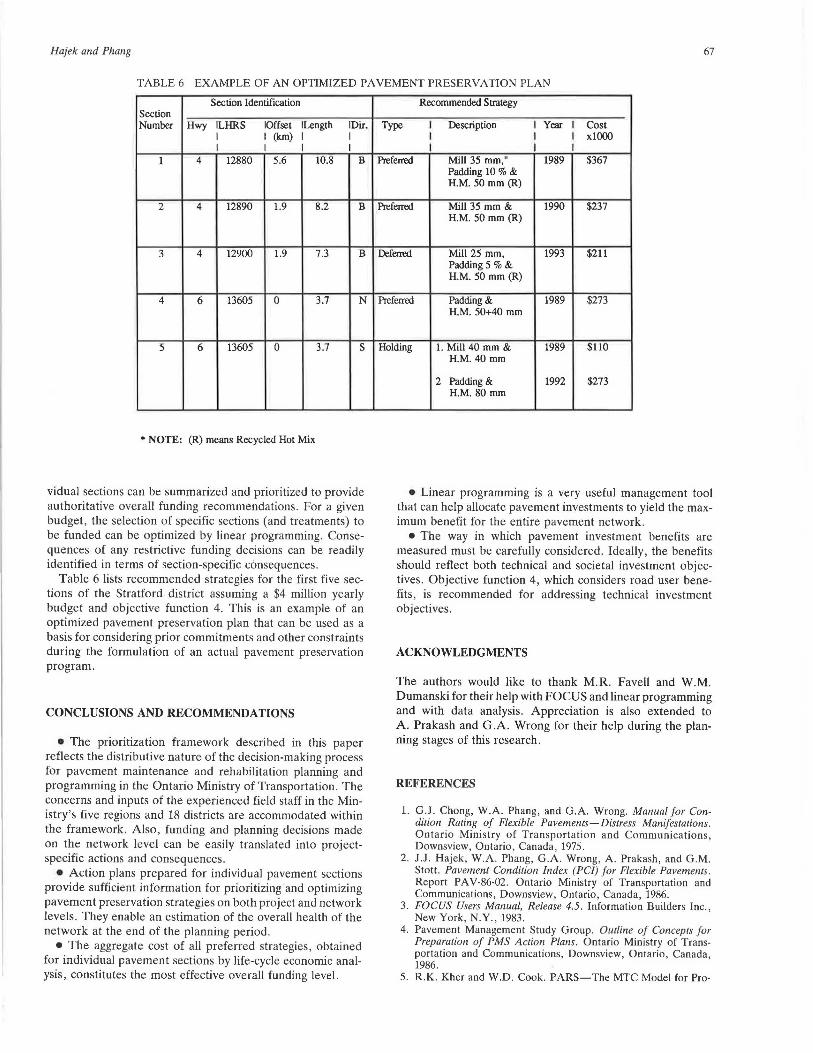
TABLE 6 EXAMPLE OF AN OPTIMIZED PAVEMENT PRESERVATION PLAN
Section Identification Section Number Hwy ILHRS !Offset I Length !Dir.
I I (km) I I I I I I
l 4 12880 5.6 10.8 B
2 4 12890 1.9 8.2 B
3 4 12900 1.9 7.3 B
4 6 13605 0 3.7 N
5 6 13605 0 3.7 s
• NOTE: (R) means Recycled Hot Mix
vidual sections can be summarized and prioritized to provide authoritative overall funding recommendations. For a given budget, the selection of specific sections (and treatments) to be funded can be optimized by linear programming. Consequences of any restrictive funding decisions can be readily identified in terms of section-specific consequences.
Table 6 lists recommended strategies for the first five sections of the Stratford district assuming a $4 million yearly budget and objective function 4. This is an example of an optimized pavement preservation plan that can be used as a basis for considering prior commitments and other constraints during the formulation of an actual pavement preservation program.
CONCLUSIONS AND RECOMMENDATIONS
• The prioritization framework described in this paper reflects the distributive nature of the decision-making process for pavement maintenance and rehabilitation planning and programming in the Ontario Ministry of Transportation. The concerns and inputs of the experienced field staff in the Ministry's five regions and 18 districts are accommodated within the framework. Also, funding and planning decisions made on the network level can be easily translated into projectspecific actions and consequences.
• Action plans prepared for individual pavement sections provide sufficient information for prioritizing and optimizing pavement preservation strategies on both project and network levels. They enable an estimation of the overall health of the network at the end of the planning period.
• The aggregate cost of all preferred strategies, obtained for individual pavement sections by life-cycle economic analysis, constitutes the most effective overall funding level.
Recommended Strategy
Type I Description I Year I Cost I I I xlOOO I I I
Preferred Mill 35 mm," 1989 $367 Padding IO % & H.M. SO mm (R)
Preferred Mill 35 mm & 1990 $237 H.M. SO mm (R)
Deferred Mill 25 mm, 1993 $211 Padding S % & H.M. 50 mm (R)
Preferred Padding& 1989 $273 H.M. 50+40 mm
Holding 1. Mill 40 mm & 1989 $110 H.M. 40 mm
2 Padding & 1992 $273 H.M. 80 mm
• Linear programming is a very useful management tool that can help allocate pavement investments to yield the maximum benefit for the entire pavement network.
• The way in which pavement investment benefits are measured must be carefully considered. Ideally, the benefits should reflect both technical and societal investment objectives. Objective function 4, which considers road user benefits, is recommended for addressing technical investment objectives.
ACKNOWLEDGMENTS
The authors would like to thank M.R. Favell and W.M. Dumanski for their help with FOCUS and linear programming and with data analysis. Appreciation is also extended to A. Prakash and G .A. Wrong for their help during the planning stages of this research.
REFERENCES
1. G.J. Chong, W.A. Phang, and G.A. Wrong . Manual for Condition Rating of Flexible Pavements-Distress Manifestations. Ontario Ministry of Transportation and Communications, Downsview, Ontario , Canada, 1975 .
2. J.J. Hajek , W.A. Phang, G .A . Wrong, A . Prakash, and G .M. Stott. Pavement Condition Index (PC!) for Flexible Pavements. Report PAV-86-02. Ontario Ministry of Transportation and Communications, Downsview, Ontario, Canada, 1986.
3. FOCUS Users Manual, Release 4.5. Information Builders Inc., New York, N.Y., 1983.
4 . Pavement Management Study Group. Outline of Concepts for Preparation of PMS Action Plans. Ontario Ministry of Transportation and Communications, Downsview, Ontario, Canada, 1986.
5. R.K. Kher and W.D. Cook. PARS-The MTC Model for Pro-

68
gram and Financial Planning in Pnvemcnt Rehabilitation. froc., North A111erica11 Pflvemcnt Ma11nge111e111 Co11ference, Toronto, Ontario, Canada, 1985, pp. 6.23-6.40.
6. Highway User Benefit Assessment Model HUBAM. Highway Branch , Trnnsp rl Canada, O ttawa, 1986.
7. J .J . Hajek. W.A . Phang, A . Praka h , and G .A . Wrong. Perfornrnncc Prcdiotion fo r Pavement Management. Proc., North American Pavement Management Conference, Toronto, Ontario, Canada, 1985, pp. 4.122-4.134.
8. P. Ullidtz, P. Simonsen, and G. Lentz. The Analytical-Empirical Method Used in a Pavement Management System. Proc., 6th International Conference on Structural Design of Asphalt Pavements, University of Michigan , Ann Arbor, 1987, pp . 795-806.
TRANSPORTATION RESEARCH RECORD 1216
9. A. Bacchus, W.D. Cook, and R. Kher. Developmenl of Pavement Performance Curves: PCRIA ;1£ Curve A nalysis. PARS Report 2. Onrario Ministry of Transportation and Communications, Downsview, Ontario, Canada, 1979.
10. R.L. Lynon. Optimization Met hodologies. Proc., North American Pavement Mwm •ement Conference. Toronto, Ontario, Can-11da , 1985, p. 6.3.
11. lP83 and MJP8J- A Professional Linear Programming System. Sunset Software , San Marino, Calif., 1985.
Publication of this paper sponsored by Committee on Pavement Maintenance.