Embed Size (px)
Citation preview
Prior Financial Ratio Information andDifferential Market Response toRegulatory Changes
RAJIV D . BANKER*
SOMNATH DAS**
CHIN S. QU***
This paper presents empirical evidence that previously disclosed financialratio information is useful in explaining differential market reactions fora cross-section of firms facing subsequent common industry-level changes.We focus our attention on the Airline Deregulation Act of 1978 (PublicLaw 95-504), which was aimed at complete deregulation of the U.S. air-line industry after 40 years of federal regulation. Our empirical resultsindicate that market reaction to the deregulatory changes is positivelyassociated with operating performance and asset utilization. This suggeststhat an airline firm's operating efficiency as measured by these ratios isa key determinant of how investors expect it to perform in a deregulatedcompetitive environment.
1. Introduction
This paper presents empirical evidence that financial ratio information is usefulin explaining cross-sectional differences in the market's reaction to subsequentregulatory changes in the airline industry. Deregulation presents firms with hothopportunities and threats that depend on their relative positions within the industry.Thus two firms facing the same regulatory changes may experience different marketreactions to this event hecause of the market's assessment of their existing relativecompetitive positions and their consequences in a changed environment. In thispaper, we demonstrate that previously disclosed firm specific accounting informa-tion, such as measures of operating performance, financial leverage, and liquidity
•University of Minnesota**University of Califomia, Berkeley***National Chengchi University, TaiwanThis paper has benefitted from the comments and suggestions of seminar participants at National
Chengchi University, National Taipei College of Business, University of Minnesota, the 1994 AnnualCongress of the European Accounting Association, the 1994 Summer Symposium on Accounting Re-search at the Hong Kong University of Science and Technology, the 1994 JAAF-KPMG Conferenceon the Economics of Financial Statements, and especially those of Eli Bartov, Ray Ball, AndrewChristie, Prem Jain, S. P. Kothari, Holly Johnston, Joshua Livnat, Tom Lys, Joshua Ronen, EamonnWalsh, and an anonymous referee.
699
700 JOURNAL OF ACCOUNTING, AUDITING & RNANCE
position, is used by market participants to assess the impact of regulatory changeson individual firms. Specifically, even though one may not detect any statisticallysignificant market reaction, on average, to a given regulatory event, predictablecross-sectional differences may exist. Thus the informational content of previouslydisclosed financial ratio information in interpreting subsequent announcement ofregulatory changes is the primary focus of this paper.
Several previous studies (Schipper and Thompson [1983]; Madeo and Pincus[1985]; Schipper, Thompson, and Weil [1987]; Praegar [1989]) have examined theimpact of regulatory changes on shareholder wealth using the event study meth-odology. We extend this body of literature by examining whether previously dis-closed firm-specific financial ratio information is useful in explaining the revisionin investors' beliefs about firm values subsequent to the announcement of regula-tory changes. Much of accounting research has evaluated the information contentand usefulness of accounting disclosures by focusing on a narrow window aroundthe time of the disclosure. Such an approach may be inconclusive if the information,although concurrently useless, is useful in assessing the impact of a subsequentevent. This idea of joint informativeness is consistent with Gonedes's (1978) def-inition of two signals being strict complements if they have information contentjointly but not separately.' Recent research in accounting and finance has alsoexamined the use of financial statement information in assessing the value impli-cations of subsequent events such as eamings announcements (Antle, Demski, andRyan [1994]), provision for loan losses in banks (Liu and Ryan [1995]), stockdistributions (Banker, Das, and Datar [1993]), and dividend changes (John andLang [1991]).
Regulatory events provide a particularly attractive economic context in whichto examine the use of financial ratio information by market participants. Regulatoryevents typically affect a particular industry and thus provide a relatively homoge-nous set of firms for the empirical study. Alternative regulatory regimes often alterthe managerial incentives for performance (Abdel-Khalik [1988, 1991]) and thetime series of the earnings generating process (Lee and Chen [1990]). Degree ofcompetition (Stigler [1963, p. 70]; Lev [1983]) and regulation (Teets [1992]) havealso been found to be associated with earnings behavior. We argue in this paperthat a firm in a stronger competitive position is likely to benefit more from dereg-ulation. The consequences of regulatory changes for a given firm can be betterunderstood in the context of prior accounting information. For complementary in-formation as defined by Gonedes (1978), regulatory announcements and financialratios may not have information content individually, but may have informationcontent jointly. Consequently, there may be a differential market reaction to de-regulation conditional on the financial statement information.
1. It may not be surprising therefore that previous researchers did not find any contemporaneousinformation content in replacement cost disclosures (Watts and Zimmerman [1980]). Thus, the valueof replacement cost infonnation, although not useful at the time of its disclosure, may be useful laterin evaluating the impact of events such as takeovers and bankruptcy (Ronen [1979, p. 444]; Bilderseeand Ronen [1987]).

PRIOR FINANCIAL RATIO INFORMATION 701
In this paper, we focus our attention on the Airline Deregulation Act of 1978(Public Law 95-504), which was aimed at complete deregulation of the U.S. do-mestic airline industry after 40 years of federal regulation. Our empirical resultsindicate that market reaction to deregulation is positively associated with operatingperfonnance. We do not find empirical support for our hypotheses that financialcondition in addition to operating efficiency is also useful in assessing the impactof regulatory changes. This suggests that a firm's operating efficiency and notfinancial health is a key determinant of how investors expect it to perform in aderegulated competitive environment.
The remainder of this paper is organized as follows. In the next section, wediscuss how financial ratio infonnation is useful to investors in assessing the impactof airline deregulation. In Section 3, we describe the sample data used to test ourempirical hypotheses. We discuss our empirical methodology and results in Section4 and conclude the paper in Section 5.
2. Development of Hypotheses
We examine the cross-sectional differences in market reaction to the legislativedeliberations that preceded the enactment of the Airline Deregulation Act of 1978.The effective date of actual legislative action is an imprecise measure of the eventunder examination because events such as congressional hearings that lead up to alegislative act themselves convey information and in a semi-strong efficient marketsuch information is rapidly impounded into prices. Some of the congressional hear-ings are extensively reported in the financial press and involve participation byindustry and consumer representatives. These press reports provide considerableinfonnation regarding the form and substance of the impending legislative act. Weposit that market expectations are revised as information is released at the hearings,rather than at the actual enactment of the legislation (Brown and Warner [1985]).^
In developing hypotheses relating investor response to airline deregulation andtheir use of financial ratio information, we first briefly review key aspects of airlinederegulation. The Airline Deregulation Act of 1978 involved two important ele-ments. First, rate regulation was relaxed to allow price competition among airlines.Second, route restrictions were relaxed to permit airlines to operate in any market.Prior to deregulation, the Civil Aeronautics Board (CAB) not only restricted entryby firms but also restricted the number of existing carriers competing in a givenmarket. Airlines could only engage in nonprice and nonroute competition, such asflight frequency and in-fiight services. Relaxation in price and route regulationsignified major changes in the competitive environment of the industry, and
2. Event study methodology is more powerful when the date the expectations change is knownwith greater certainty. As an explanation for their finding that the Motor Carrier Act of 1980 met withlittle market reaction, Schipper, Thompson, and Weil (1987) note: "While deregulation was significantto the profitability of established trucking companies, the act itself represented a point in the regulatorychange process that was foreseeable on the basis of prior economic events."
702 JOURNAL OF ACCOUNTING, AUDMNG & FINANCE
therefore was expected to affect future cash flows of airline firms and their capi-talized values.
Throughout the legislative deliberation process, weaker airlines had continuedto oppose deregulation. They feared that they would be driven out of business oncefare and route protection was withdrawn, as they could not compete with the re-sources available to some other airlines. Mr. Francesco Lorenzo, the president ofTexas International and a spokesperson for the small carriers, predicted that dereg-ulation would produce a "highly concentrated, less competitive system" (Hearingof the Senate Subcommittee on Aviation, 1977). Mr. L. B. Maytag, chairman ofNational Airlines, was quoted as saying that deregulation would destroy some car-riers (Wall Street Journal, March 17, 1977). In contrast. United Airlines, then thelargest firm in the industry, supported deregulation as early as 1975 when almostall other airlines were opposed to it (Wall Street Journal, October 31, 1975). Thissuggests that United believed that it would benefit under a deregulated environmentin which it could set prices and choose profitable routes to operate. Maloney andMcCormick (1982) argue that regulatory events may lead to intraindustry transfersof wealth such that not all firms may benefit, even when regulation is industrysponsored. Indeed, as Spiller (1983) notes, individual companies in the airline in-dustry were not homogeneous in their response to deregulation and that regulationdid in fact benefit some of them.^ Furthermore, Spiller (1986) posits the existenceof mobility barriers resulting from costs associated with adjusting to unregulatedroute and rate structures in a newly emerging competitive market. Operating char-acteristics of individual airlines refiect their ability to cope with competition and,therefore, are likely to be related to the magnitude of these adjustment costs. Ad-justment costs are thus likely to vary across individual airlines.
Since deregulation relaxes control over firms' operation and management, firmsin a competitively advantageous position are likely to benefit from a deregulatedenvironment, whereas firms in a less advantageous position are likely to be ad-versely affected. As the congressional hearings unfolded, and the likelihood of aderegulated environment increased, shareholder expectations of airline firms' futurecash flows changed. Financially healthy firms are in a better position to withstandcut-throat price competition and also avail themselves of opportunities opened upin a deregulated environment. We hypothesize, therefore, that as the likelihood ofderegulation increases, the change in the value of financially strong firms will bemore positive (or less negative) than of firms that are more financially distressed."
3. A few regulatory event studies have attempted to examine the differential impacts on firms'values by measuring the association between stock price changes of regulatory or mandatory changesand explanatory variable such as firm size. See, for example, Hughes and Ricks (1984) and Rose (1985).
4. It is, of course, possible that financially healthy firms are typically large, old, and unionizedand these nonaccounting operating factors work in the opposite direction. In this paper, we focus onlyon accounting information and are therefore unable to reject this alternative hypothesis. In related work,Beneish (1991) examines nonfinancial operating characteristics, such as stage length, hub structure, andproportion of first class passengers, and finds significant association of these variables with airline stockretums around deregulatory events. To the extent that nonfinancial information interacts with the fi-nancial information in the formation of the market's expectations, our specification has an omitted
PRIOR FINANCIAL RATIO INFORMATION 703
Deregulatory changes were expected to have several effects on airlines thatwere financially weak. First, without the protective umbrella of government regu-lation to guarantee air fares, these firms were likely to experience even greaterdifficulty in improving their operating performance. Even before the deregulationact in 1978, CAB had begun to loosen its regulatory policy. For example, it hadauthorized the expansion of the popular discount fares, which ranged up to 45percent less than coach, after 15 airlines had requested it (" 'Super-Saver' FaresAre Cleared for Most of U.S. Air Routes," Wall Street Journal, June 3, 1978, p.8.) The introduction ofthe cutthroat "Super-Saver" competition was an indicationto market participants of the possible intensity of competition that might be ex-pected in a deregulated environment. In other words, the nature of competition wasto change from nonprice to price, requiring greater emphasis on cost control. Sec-ond, financially weak firms were likely to find it difficult (or be required to incura substantially higher cost) to attract new capital essential to reposition themselvesfor the newly competitive environment with changing route structures.
Several concerns were voiced about the financial risk faced by airline firmsduring the period when the deregulation statute was being discussed in the U.S.Congress. Citing the status of government regulation and bailout requests from PanAmerican Airlines, the Wall Street Journal (September 25, 1975) reported, "Thebig banks and insurance companies that have financed the air-transport industry aregrowing even more doubtful about the wisdom of maintaining the support andabout their ability to do so." An insurance company executive was quoted aswaming, "There isn't a question that there is a growing group within our ranksthat's all in favor of pulling the plug on the next airline that comes along needinganother bailout from us to carry it through a crisis.. . . We're getting tired of car-rying the industry while watching the outlook for our loans growing more andmore uncertain" ("Airline Industry Lenders Grow More Doubtful That TheyShould and Can Continue Support," Wall Street Journal, September 25, 1975).The same article reported Frederick W. Bradley, Jr., vice president of the FirstNational City Bank of New York, as saying that institutional lenders have notindicated any interest in extending long-term loans to the industry and many banksare much less interested in airline loans than in the past. In a deregulated regime,airlines with increased financial leverage were less likely to be supported by insti-tutional lenders, and consequently, less likely to enjoy an advantageous competitiveposition in a deregulated environment.
In this paper, we use publicly available financial statement information tomeasure airline firms' financial strength along four dimensions: operating perform-ance, asset utilization efficiency, financial leverage, and liquidity position. Theseare four categories of financial ratios suggested by textbooks on financial statement
variable. If, however, nonaccounting variables such as unionization are important omitted variables andare uncorrelated with the included accounting variables in our specification, the results are unbiasedbut also unduly conservative, because the omission of a variable that is uncorrelated with an includedvariable results in upwardly biased standard errors (Kmenta [1971, p. 394]).
704 JOURNAL OF ACCOUNTING, AUDITING & HNANCE
analysis (Lev [1974]; Foster [1986]; Gibson [1989]; and Stickney [1990]) to meas-ure different economic aspects of a firm's operations.
2.1 Operating Performance
Operating performance ratios measure a firm's ability to generate financialresources internally from its operations. Airline firms exhibiting improvements inoperating performance were expected to enhance their advantage when the oppor-tunities for entering new markets became available to them in a deregulated en-vironment. A major structural change such as the move to a deregulatedenvironment was expected to increase the potential for the firms with worseningoperating performance to be losers in the newly deregulated era (Lee and Chen[1990]). Improved operating performance also indicated a greater ability to surviveand succeed when airline firms began competing with each other on the pricedimension. We expect, therefore, that improvement in operating perfonmance ispositively correlated with the market response. Specifically, we hypothesize
//,: Market response to the airline deregulatory changes is an increasing functionof the improvement in an airline's operating performance.
2.2 Asset Utilization Efficiency
Under deregulation, route protection for the inefficient airlines would be removed.The threat of potential entry, therefore, was likely to force firms to become more effi-cient in their operations. As a result, inefficient airlines that could not offer productswith the desired price and service combinations were likely to be driven out ofthe mar-ket or be acquired by other more efficient airlines. Therefore, in the long run, only theairlines that were improving their efficiency in utilizing their assets were likely to sur-vive in a deregulated environment. Even in the short run, the airlines' asset utilizationefficiency was likely to affect their competitive advantage in adapting to the newly de-regulated environment. Therefore, we hypothesize
H^. The market response to the airline deregulatory changes is an increasing func-tion of the improvement in an airline's asset utilization efficiency.
2.3 Financial Leverage
Financial leverage measures the amount of debt a firm carries relative to itsequity. It reflects the likelihood that a firm can maintain its solvency in the future.High financial leverage increases the risk of a firm being unable to meet interestand principal payment schedules, and being forced into recontracting its debt, orentering bankruptcy or involuntary liquidation proceedings. In addition, such a firmmay be forced to give up profitable long-term projects to avoid violating its loan
PRIOR HNANCIAL RATIO INFORMATION 705
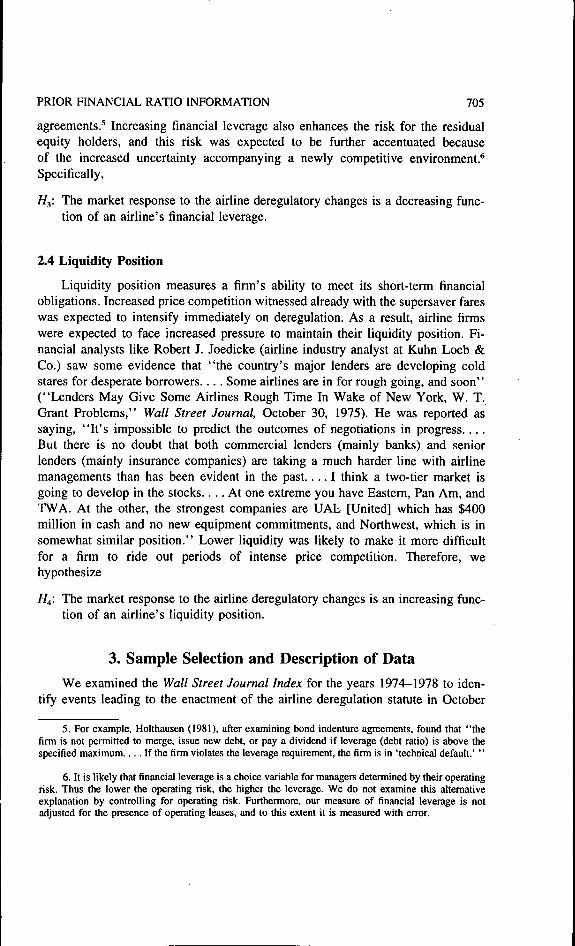
agreements.' Increasing financial leverage also enhances the risk for the residualequity holders, and this risk was expected to be further accentuated becauseof the increased uncertainty accompanying a newly competitive environment.*Specifically,
H^: The market response to the airline deregulatory changes is a decreasing func-tion of an airline's financial leverage.
2.4 Liquidity Position
Liquidity position measures a firm's ability to meet its short-term financialobligations. Increased price competition witnessed already with the supersaver fareswas expected to intensify immediately on deregulation. As a result, airline firmswere expected to face increased pressure to maintain their liquidity position. Fi-nancial analysts like Robert J. Joedicke (airline industry analyst at Kuhn Loeb &Co.) saw some evidence that "the country's major lenders are developing coldstares for desperate borrowers. . . . Some airlines are in for rough going, and soon''("Lenders May Give Some Airlines Rough Time In Wake of New York, W. T.Grant Problems," Wall Street Journal, October 30, 1975). He was reported assaying, "It's impossible to predict the outcomes of negotiations in progress....But there is no doubt that both commercial lenders (mainly banks) and seniorlenders (mainly insurance companies) are taking a much harder line with airlinemanagements than has been evident in the past . . . . I think a two-tier market isgoing to develop in the stocks.... At one extreme you have Eastern, Pan Am, andTWA. At the other, the strongest companies are UAL [United] which has $400million in cash and no new equipment commitments, and Northwest, which is insomewhat similar position." Lower liquidity was likely to make it more difficultfor a firm to ride out periods of intense price competition. Therefore, wehypothesize
H^: The market response to the airline deregulatory changes is an increasing func-tion of an airline's liquidity position.
3. Sample Selection and Description of DataWe examined the Wall Street Journal Index for the years 1974—1978 to iden-
tify events leading to the enactment of the airline deregulation statute in October
5. For example, Holthausen (1981), after examining bond indenture agreements, found that "thefirm is not permitted to merge, issue new debt, or pay a dividend if leverage (debt ratio) is above thespecified maximum.... If the firm violates the leverage requirement, the firm is in 'technical default.' "
6. It is likely that financial leverage is a choice variable for managers determined by their operatingrisk. Thus the lower the operating risk, the higher the leverage. We do not examine this altemativeexplanation by controlling for operating risk. Furthermore, our measure of financial leverage is notadjusted for the presence of operating leases, and to this extent it is measured with error.
706 JOURNAL OF ACCOUNTING, AUDOING & RNANCE
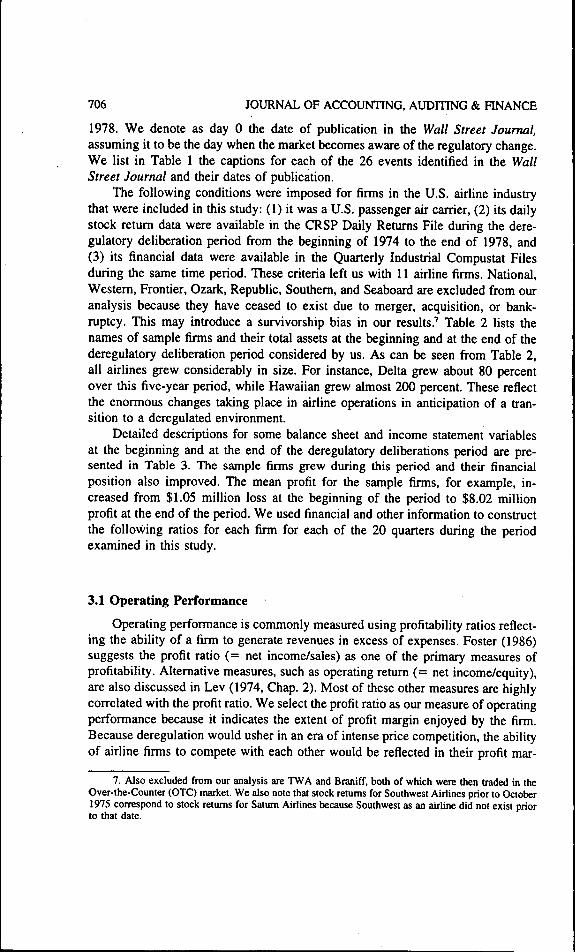
1978. We denote as day 0 the date of publication in the Wall Street Joumai,assuming it to be the day when the market becomes aware of the regulatory change.We list in Table 1 the captions for each of the 26 events identified in the WallStreet Joumai and their dates of publication.
The following conditions were imposed for firms in the U.S. airline industrythat were included in this study: (1) it was a U.S. passenger air carrier, (2) its dailystock retum data were available in the CRSP Daily Retums File during the dere-gulatory deliberation period from the beginning of 1974 to the end of 1978, and(3) its financial data were available in the Quarterly Industrial Compustat Filesduring the same time period. These criteria left us with 11 airline firms. National,Westem, Frontier, Ozark, Republic, Southem, and Seaboard are excluded from ouranalysis because they have ceased to exist due to merger, acquisition, or bank-ruptcy. This may introduce a survivorship bias in our results.' Table 2 lists thenames of sample firms and their total assets at the beginning and at the end of thederegulatory deliberation period considered by us. As can be seen from Table 2,all airlines grew considerably in size. For instance. Delta grew about 80 percentover this five-year period, while Hawaiian grew almost 200 percent. These reflectthe enormous changes taking place in airline operations in anticipation of a tran-sition to a deregulated environment.
Detailed descriptions for some balance sheet and income statement variablesat the beginning and at the end of the deregulatory deliberations period are pre-sented in Table 3. The sample firms grew during this period and their financialposition also improved. The mean profit for the sample firms, for example, in-creased from $1.05 million loss at the beginning of the period to $8.02 millionprofit at the end of the period. We used financial and other information to constructthe following ratios for each firm for each of the 20 quarters during the periodexamined in this study.
3.1 Operating Performance
Operating performance is commonly measured using profitability ratios reflect-ing the ability of a firm to generate revenues in excess of expenses. Foster (1986)suggests the profit ratio (= net income/sales) as one of the primary measures ofprofitability. Altemative measures, such as operating retum (= net income/equity),are also discussed in Lev (1974, Chap. 2). Most of these other measures are highlycorrelated with the profit ratio. We select the profit ratio as our measure of operatingperformance because it indicates the extent of profit margin enjoyed by the firm.Because deregulation would usher in an era of intense price competition, the abilityof airiine firms to compete with each other would be reflected in their profit mar-
7. Also excluded from our analysis are TWA and Braniff, both of which were then traded in theOver-the-Counter (OTC) market. We also note that stock retums for Southwest Airlines prior to October1975 correspond to stock retums for Satum Airlines because Southwest as an airline did not exist priorto that date.

PRIOR HNANCIAL RATIO INFORMATION 707
TABLE 1
Deregulatory Change Events Leading up to the Enactment of theAirline Deregulation Act of 1978
Deregulatory Change Events
Pan Am's request for a new $10.2 million-a-month subsidyrejected by Transportation Secretary.
Legislative Push to Slash CAB's Powers Over Airlines IsExpected From Ford.
Fewer but Stronger Airlines, Railroads Is Goal of NewTransportation Secretary.
CAB to Support Airline Financial Health and LimitDeregulation.
Airline Deregulation Proposal Dropped by CAB;Piecemeal Approach Is Sought.
Subsidies Asked for Air Service to Small Cities; Ford Bidto Aid Commuter Lines Likely to Help Bill on AirlineDeregulation.
CAB Urges a Sharp Cut in Own Powers to Control AirlineServices and Prices.
Ford Widens Proposal to Deregulate Airlines.
Carter Wants Airline-Deregulation Law by Summer, CitingNeed for Competition.
Senate's Bill to Limit CAB Powers Gets Lift From Carter,Others.
Carter Urges Senate Panel to Strengthen AirlineDeregulation Bill It's Weighing.
Deregulation Bill Aimed at Airlines Clears Big Hurdle;Significant Easing of Rules on Expansion of RoutesBacked by Senate Panel.
Air Competition Widened in Vote By Senate Panel; KeyDeregulation Provision Lets Carriers Add Routes WithoutCAB's Approval.
Bill to Deregulate Airlines Clears Panel But Senate IsUnlikely to Act This Year.
CAB Studies Policy Changes to Foster Cheaper AirlineFares, Chairman Says.
House Republicans, Some Democrats Put Obstacles inPath of Airline Deregulation.
Airline Deregulation Falters Under Conservative's Attack.
EventNumber
1.
2.
3.
4.
5.
6.
7.
8.
9.
10.
11.
12.
13.
14.
15.
16.
17.
Event Date(Year-Month-Day)
74-09-19
75-02-05
75-04-09
75-10-31
76-01-09
76-03-30
76-04-09 ,
77-01-10
77-03-07
77-06-21
77-08-01
77-09-23
77-09-30
77-10-28
78-02-03
78-03-16
78-04-07
708
TABLE 1 (continued)
JOURNAL OF ACCOUNTING, AUDITING & HNANCE
EventNumber
Event Date(Year-Month-Day) Deregulatory Change Events
18.
19.
20.
21.
22.
23.
24.
25.
26.
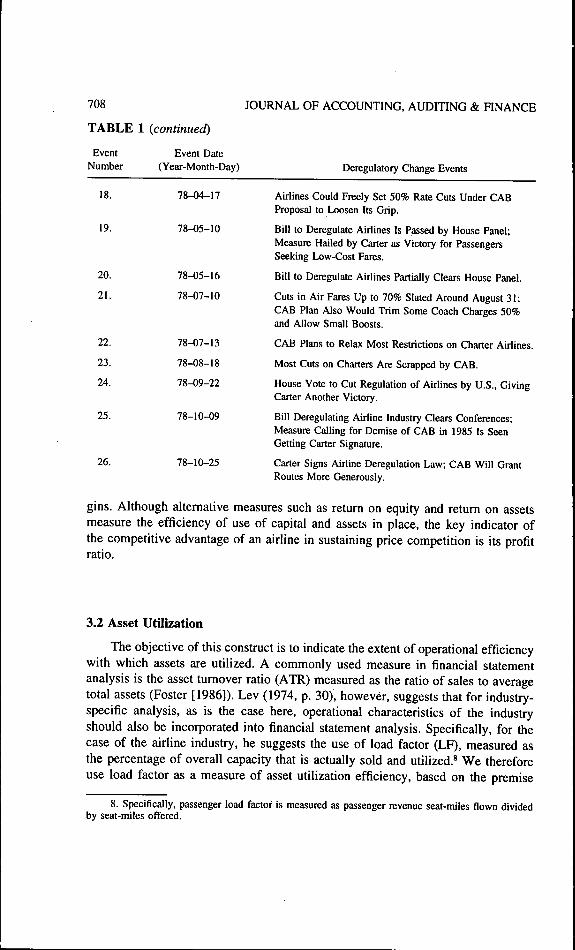
78-04-17 Airlines Could Freely Set 50% Rate Cuts Under CABProposal to Lx>osen Its Grip.
78-05-10 Bill to Deregulate Airlines Is Passed by House Panel;Measure Hailed by Carter as Victory for PassengersSeeking Low-Cost Fares.
78-05-16 Bill to Deregulate Airlines Partially Clears House Panel.
78-07-10 Cuts in Air Fares Up to 70% Slated Around August 31;CAB Plan Also Would Trim Some Coach Charges 50%and Allow Small Boosts.
78-07-13 CAB Plans to Relax Most Restrictions on Charter Airlines.
78-08-18 Most Cuts on Charters Are Scrapped by CAB.
78-09-22 House Vote to Cut Regulation of Airlines by U.S., GivingCarter Another Victory.
78-10-09 Bill Deregulating Airline Industry Clears Conferences;Measure Calling for Demise of CAB in 1985 Is SeenGetting Carter Signature.
78-10-25 Carter Signs Airline Deregulation Law; CAB Will GrantRoutes More Generously.
gins. Although altemative measures such as return on equity and return on assetsmeasure the efficiency of use of capital and assets in place, the key indicator ofthe competitive advantage of an airline in sustaining price competition is its profitratio.
3.2 Asset Utilization
The objective of this construct is to indicate the extent of operational efficiencywith which assets are utilized. A commonly used measure in financial statementanalysis is the asset tumover ratio (ATR) measured as the ratio of sales to averagetotal assets (Foster [1986]). Lev (1974, p. 30), however, suggests that for industry-specific analysis, as is the case here, operational characteristics of the industryshould also be incorporated into financial statement analysis. Specifically, for thecase of the airline industry, he suggests the use of load factor (LF), measured asthe percentage of overall capacity that is actually sold and utilized.* We thereforeuse load factor as a measure of asset utilization efficiency, based on the premise
8. Specifically, passenger load factor is measured as passenger revenue seat-miles flown dividedby seat-miles offered.

PRIOR FINANCIAL RATIO INFORMATION 709
TABLE 2
List of Airline Firms Included in This Study
Total Assets (millions of dollars)
Name of Firm
1. American Airlines (AMR Corp.)2. Alaska Airlines3. Continental Airlines4. Delta Airlines5. Eastern Airlines6. Hawaiian Airlines (HAL, Inc.)7. Northwest Airlines (NWA, Inc.)8. Pan Am World Airways9. Southwest Airlines
10. United Airlines (Allegis Corp.)11. USAir Group (Allegheny Corp.)
as of Dec. 31, 1973
1,680.2124.45
666.85907.93
1,432.6226.80
1,085.631,683.72
14.032,417.20
269.97
as of Dec. 31, 1978
2,767.7292.43
677.271,646.681,908.56
79.581,392.862,048.30
118.713,697.22
403.61
that under a deregulated environment, airlines with increasing load factors £ire themore efficient airlines in using their flight equipment.
3.3 Financia] Leverage
We measure financial leverage by the debt ratio (DR), defined as the ratio oftotal debt to total assets. This measure refiects the extent of financial risk of a firm.It is also highly correlated with altemative measures, such as total debt to stock-holders' equity ratio and long-term debt to total assets ratio (Foster [1986]).
3.4 Liquidity Position
Liquidity position refiects a firm's ability to meet its short-term financial ob-ligations. We measure it using the defensive ratio (DEFR) defined as the ratio ofdefensive assets to daily cash expenditure, where defensive assets = cash -I- ac-counts receivable, and cash experiditure = cost of goods sold -I- selling and ad-ministrative expanse — depreciation expense + interest expense. Current ratio andquick ratio are two popularly used ratios to measure liquidity position for manu-facturing firms (Lev [1974]). These ratios compare short-term assets to short-termliabilities comprising largely accounts payable to suppliers. For a firm in the airlineindustry, however, current liabilities comprise largely deferred revenues, becauseunpaid vendor invoices for supplies are relatively small. Therefore, the defensiveratio is a better measure of an airline's ability to meet short-term financial obli-gations as it refiects the availability of funds to cover expenses on a daily basis.
Descriptive statistics for the financial ratios used are presented in Table 4. Allfinancial ratios, except the asset turnover ratio, exhibit improvement over the five-year period of deregulatory deliberation considered by us.

710 JOURNAL OF ACCOUNTING, AUDITING & HNANCE
TABLE 3
Descriptive Statistics for Key Financial Variables (in millions of dollars)
Variable Description
Balance Sheet Variables
1. Total assets2. Total liability3. Total equity4. Current assets5. Quick assets6. Accounts receivable7. Current liability
Income Statement Variables
8. Sales9. Cost of goods sold
10. Sales and administration expense11. Depreciation expense12. Interest expense13. Net income
N
11111111111111
111111111111
Beginning ofDeregulator]r Change
Deliberations(4th Quarter of 1973)
Mean
928.12643.95284.17198.45168.8696.63
180.94
206.85153.7933.0419.448.27
-1.05
Std. Dev.
812.38577.10258.21198.32166.23100.07155.80
180.30129.4531.0417.387.11
14.00
N
11111111111111
1111111111
11
End of DeregulatoryChange Deliberations(4th Quarter of 1978)
Mean
1,348.44884.30464.14377.76334.88158.70337.75
366.25268.9056.5927.06
8.998.02
Std. Dev.
1,202.85840.20397.96416.85371.15157.99326.98
327.87243.00
54.9822.95
8.8313.23
4. Empirical Methodology and Results
To empirically test our hypotheses, we use a two-stage approach. Iti the firststage, we estitnate the market response coefficients to assess the extent of revisionin the value of an individual airline firm's stock, consequent to a specific deregu-latory decision event. Following Schipper and Thompson (1983) and others, wespecify a multivariate regression model with one equation for each airline firm.Additionally, the model controls for possible changes in the systematic risk (beta)of the firm with the change in the political regime from the Republican Ford ad-ministration (1974-76) to the Democratic Carter administration (1977-78) (Banker,Das, and Ou [1995]). We also control for other firm-specific events such as strikes,mergers, and acquisitions that may confound the effect of the deregulatory delib-eration event of interest.' Therefore, we estimate the coefficients of market response
9. Several firm-specific merger and strike activities took place during the deregulatory deliberationperiod. Strikes, mergers, and acquisition events have been found to have significant impacts on firms'stock retums. See Becker and Olson (1986); Davidson, Worrell, and Garrison (1988)- Dodd (1980)-and Yen (1987).

PRIOR nNANCIAL RATIO INFORMATION
TABLE 4
Descriptive Statistics for Financial Ratios
711
Beginning ofDeregulatory Change
Deliberations(4th Quarter of 1973)
End of DeregulatoryChange Deliberations(4th Quarter of 1978)
Ratio Description N Mean Std. Dev. Mean Std. Dev.
1. Profit ratio (PR)2. Load factor (LF)3. Debt ratio (DR)4. Defensive ratio (DEFR)
11111111
-0.00646.82
0.737291.0
0.0576.370.139
123.4
11111111
0.03051.25
0.661377.2
0.0655.330.112
141.6
PR = net income/sales.LF = the percentage of overall capacity that is actually sold and utilized.DR = total debt/total assets.DEFR = defensive assets/daily cash expenditure, where defensive assets = cash + accounts
receivable, and daily cash expenditure = (cost of goods sold + selling and administrative expense —depreciation expense + interest expense)/365.
to the deregulatory deliberation events for individual airline firms using the follow-ing specification:
= a,
+ e, Vj, (1)
where
r,, = Stock retum of firm i at time ta,- = Intercept of firm iPj = Systematic risk parameter of firm i during Ford administrationPic = Systematic risk parameter of firm i during Carter administrationr^, = Equally weighted market index at time tF, = Dummy variable for Ford administration; 1 during Ford administration and
0 during Carter administrationC, = Dummy variable for Carter administration; 1 during Carter administration
and 0 during Ford administration5y = Market response coefficient that measures the impact of deregulatory delib-
eration event j on firm i stock returnDJ, = Dummy variables for deregulatory events; 1 for the period of five calendar
days surrounding deregulatory event y and zero otherwise(JL, = Coefficient that measures the impact of merger event k on firm i stock retumMiia = Dummy variables for merger events; 1 for the period of five calendar days
surrounding merger event k and zero otherwise0,;, = Coefficient that measures the impact of strike event h on firm i stock retum

712 JOURNAL OF ACCOUNTING, AUDITING & HNANCE
5,7,, = Dummy variables for strike events; 1 for the period of five calendar dayssurrounding strike event h and zero otherwise
e,, = Residuals of firm i stock retum at time /.
The model thus captures the stock market response to the events leading up to theairline deregulation. The stock price changes refiect the changes in the capitalizedvalue of firms indicating the extent to which financial markets revised their expecta-tions about firms' future cash flows. We employ the seemingly unrelated regression(SUR) method to estimate the system of equations in the model of eq. (1).'°
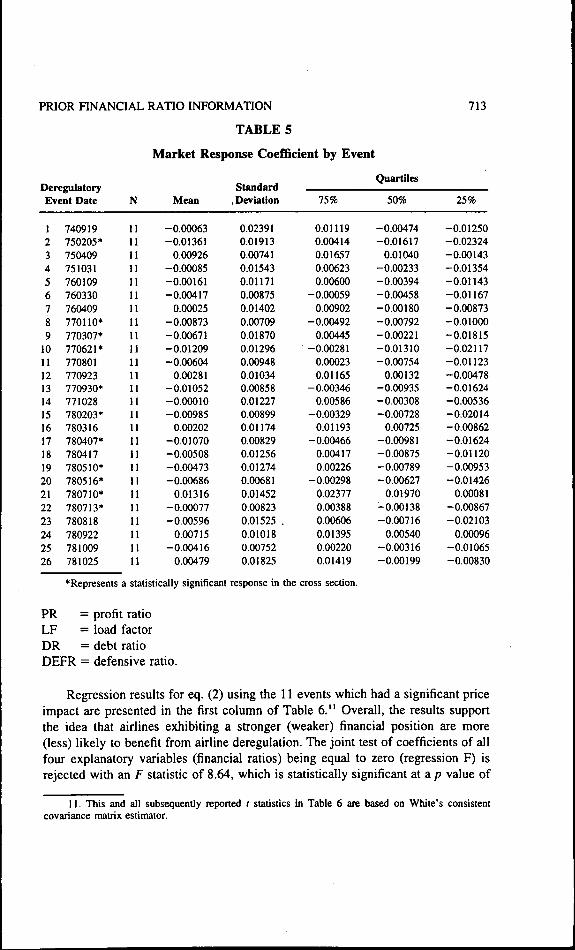
Table 5 summarizes the estimated market response coefficients by for the first-stage regression in eq. (1), for individual deregulatory deliberation events sum-marized across all of the sample firms. The median market reaction coefficientacross all 11 firms was negative for 21 of the 26 deregulatory deliberation events.However, the upper quartiles for the market response coefficients were positive for19 of the 26 events. This suggests that all of the deregulatory deliberation eventsdid not affect the different airline firms uniformly. These results are generallyconsistent with previous findings on airline deregulation reported by Spiller (1983)and Michel and Shaked (1984). Table 5 also identifies 11 of the 26 events that hada significant price impact. We will first use this subset of events to test our hy-potheses and then use the entire sample of events to examine the robustness of ourresults to the more general setting that includes the deregulatory events for whichthe price impact is not significant across our sample firms.
In the second stage, we assess the association between the market responsecoefficients 8, , obtained from the first stage, and the four financial ratios repre-senting our hypotheses. Use of sequential regressions with multiple explanatoryvariables is likely to lead to downward-biased estimates .for the incremental ex-planatory power of the variables introduced at the second stage (Beaver [1987]).This is likely to make it more difficult to reject the null of no association.
Our hypotheses predict that an airline's market response is an increasing func-tion of profit ratio (PR), asset turnover ratio (LF), and defensive ratio (DEFR), anda decreasing function of its financial leverage (DR). We use the following regres-sion model to test our hypotheses:
8, = ao + b, PRy + b^ LFy + b, DR. ^ + b, DEFR^ + e , (2)
where
8y = market response coefficient that measures the effects of the deregulatorychange event; on firm Vs stock return, obtained by estimating eq. (1)
10. Because the airline deregulatory deliberations affect all firms in the airline industry at thesame time, the simultaneous effects on all firms are likely to result in contemporaneous cross-sectionalcorrelations. Zellner's (1962) SUR estimation procedure yields estimators that are asymptotically moreefficient than OLS estimation applied to each individual equation. Note that given our primary interestin the magnitudes of the coefficient estimates and not their standard errors, we could have used OLSestimation, which also provides consistent coefficient estimates. However, the use of SUR estimationallows us to identify which of the selected events had a statistically significant price impact.
PRIOR RNANCIAL RATIO INFORMATION
TABLE 5
Market Response Coe£Bcient by Event
713
QuartilesDeregulatoryEvent Date
1234567891011121314151617181920212223242526
740919750205*750409751031760109760330760409770110*770307*770621*770801770923770930*771028780203*780316780407*780417780510*780516*780710*780713*780818780922781009781025
N
1111U11111111111111111111111111111111It111111111111
Mean
-0.00063-0.013610.00926
-0.00085-0.00161-0.004170.00025
-0.00873-0.00671-0.01209-0.006040.00281
-0.01052-0.00010-0.009850.00202
-0.01070-0.00508-0.00473-0.006860.01316
-0.00077-0.005960.00715
-0.004160.00479
Standard, Deviation
0.023910.019130.007410.015430.011710.008750.014020.007090.018700.012960.009480.010340.008580.012270.008990.011740.008290.012560.012740.006810.014520.008230.01525 .0.010180.007520.01825
75%
0.011190.004140.016570.006230.00600
-0.000590.00902
-0.004920.00445
-0.002810.000230.01165
-0.003460.00586
-0.003290.01193
-0.004660.004170.00226
-0.002980.023770.003880.006060.013950.002200.01419
50%
-0.00474-0.016170.01040
-0.00233-0.00394-0.00458-0.00180-0.00792-0.00221-0.01310-0.007540.00132
-0.00935-0.00308-0.007280.00725
-0.00981-0.00875-0.00789-0.006270.01970
-0.00138-0.007160.00540
-0.00316-0.00199
25%
-0.01250-0.02324-0.00143-0.01354-0.01143-0.01167-0.00873-0.01000-0.01815-0.02117-0.01123-0.00478-0.01624-0.00536-0.02014-0.00862-0.01624-0.01120-0.00953-0.014260.00081
-0.00867-0.021030.00096
-0.01065-0.00830
*Represents a statistically significant response in the cross section.
PR = profit ratioLF = load factorDR = debt ratioDEFR = defensive ratio.
Regression results for eq. (2) using the 11 events which had a significant priceimpact are presented in the first column of Table 6." Overall, the results supportthe idea that airlines exhibiting a stronger (weaker) financial position are more(less) likely to benefit from airline deregulation. The joint test of coefficients of allfour explanatory variables (financial ratios) being equal to zero (regression F) isrejected with an F statistic of 8.64, which is statistically significant at a p value of
11. This and all subsequently reported t statistics in Table 6 are based on White's consistentcovariance matrix estimator.

714 JOURNAL OF ACCOUNTING, AUDITING & FINANCE
TABLE 6
Results of Multiple Regressions Explaining Market Response Coefficients
Coefficient Estimates(White corrected t statistics in parentheses)
Independent PredictedVariables Sign
Intercept —
Profitability ratio -1- {b,)
Load factor H- (fcj)
Debt ratio — ( 3)
Defensive ratio + (b^)
Adjusted IP
Test: by = b^ = b, = b^ = 0F statistic(p value)X statistic'(p value)
Test: bt + b^ - b, + b^ = 0F statistic(p value)X statistic(p value)
Number of EventsNumber of Observations
SignificantEvents
-0.0334(-4.20)
0.0482(2.90)
0.0007(3.36)
-0.0132(-1.55)
0.0393E-5*(0.70)
0.203
8.64• (0.0001)
22.92(0.0001)
19.72(0.0001)17.40(0.0000)
11121
All Events
-0.0232(-4.10)
0.0199(2.03)
0.0004(2.84)
-0.0007(-0.11)
0.0350E-5(0.99)
0.064
5.63(0.0002)17.71(0.0014)
5.06(0.0253)5.09
(0.0241)
26273
Nonevents
0.0036(0.43)
0.0169(0.85)
-0.0001(-0.21)
-0.0008(-0.06)
0.0366E-5(139)
-0.010
0.56(0.6959)3.71
(0.4464)
1.16(0.2822)1.46
(0.2272)
20186
'The chi-square values reported above are based on White's consistent estimator of the covariancematrix.
*Read as 0.0393 X 10"'
O.OOOI. Similarly, a test that bi + b2 - b^ + b^ is zero (to reflect the expectedsigns of these coefficients) is also rejected with an F statistic of 19.72, which isstatistically significant at a/? value of 0.0001. The overall results are thus consistentwith the notion that capital markets utilize previously disclosed financial ratio in-formation to differentiate firms' competitive advantage in adapting to a newly de-regulated environment. The second column of Table 6 reports the results from usingall 26 regulatory events. The results are very similar to the results based on onlythe 11 events that had a significant price impact. This reinforces our primary hy-pothesis that investors use previously disclosed financial information to assess thevaluation consequences of subsequently announced regulatory events.

PRIOR FINANCIAL RATIO INFORMATION 715
Specifically, we find that changes in profitability ratio and load factor aresignificantly associated with market response coefficients in the expected direction.We did not find statistically significant evidence to support the use of leverage andshort-term liquidity by market participants. These results are consistent with theexplanation that investors assess competitive strength in a deregulated environmentprimarily on the basis of operating perfonnance irrespective of the existing financialcondition.'^
To assess the robustness of our conclusions that investors use previously dis-closed accounting infonnation to assess the impact of deregulatory announcements,we estimate eq, (2) using a sample of nonevent dates. To select the nonevent dates,we first delete all of the 26 deregulatory events and the strike and merger eventsfrom the period January 1974 through December 1978, including the five calendardays surrounding each of the events. We then randomly select dates from eachfiscal quarter in each of the five fiscal years yielding a total of 20 nonevent dates.We estimate the market response coefficient for each of these 20 nonevent datesusing eq. (1), with the exception that no merger or strike dummies are included.Thejjoefficient estimates for the nonevent dates obtained from eq. (1) are then usedto reestimate eq. (2). The results from this estimation are presented in the thirdcolumn of Table 6. It can be seen that there is very little explanatory power in theregression, and that none of the explanatory variables are statistically significant.Moreover, these results are not sensitive to the choice of the randomly selectednonevent dates. Similar results were obtained when we repeated this procedure 25times, each time randomly generating aitemative nonevent dates.
5. Conclusion
In this paper, we have examined the relation between publicly available finan-cial ratio information and cross-sectional differences in capital market reactions forfirms in the airline industry facing common deregulatory change. We hypothesizedthat the market response to the deregulatory deliberation events is an increasingfunction of an airline's financial strength as measured by ratios reflecting operatingperformance, asset utilization efficiency and liquidity position, and a decreasingfunction of financial leverage. Overall, the results support the idea that marketparticipants use previously disclosed financial ratio information to differentiate be-tween airline firms in assessing the impact of deregulatory changes. The empiricalresults confirmed that profit ratio and load factor are related to the market reactionin the expected direction. We did not find statistically significant relation betweenmarket response coefficients and short-term liquidity, and a financial leverage. Thefocus in this paper has been on the use of financial ratios by market participants.This leaves open the question of how market participants weigh different financial
12. Replacing load factor with asset tumover ratio yielded similar results for PR, ATR,although the sign of the leverage variable changed to positive. It is possible that asset tumover ratio isa noisy measure because leased aircrafis were not capitalized on the balance sheet for some airlines.

716 JOURNAL OF ACCOUNTING, AUDITING & HNANCE
and nonfinancial information in evaluating a finn's competitive advantage. This isan interesting question that remains for further investigation.
REFERENCES
Abdel-Khalik, R. A. 1988. "Incentives for Accruing Cost and Efficiency in Regulated MonopoliesSubject to ROE Constraint." Journal of Accounting Research 26 (Supplement): 147-174.
Abdel-Khalik, R. A. 1991. "Managerial Incentives and Relative Performance Evaluation Under Dif-ferent Regulatory Regimes." Working Paper, University of Florida.
Antle, R., J. S. Demski, and S. Ryan. 1994. "Multiple Sources of Information, Valuation, and Ac-counting Eamings." Joumai of Accounting. Auditing and Finance 9 (4): 675-696.
Banker, R. D., S. Das, and S. M. Datar. 1993. "Complementarity of Prior Accounting Information:The Case of Stock Dividend Announcements." The Accounting Review 68 (January)- 28-47
Banker, R. D., S. Das, and C. S. Ou. 1995. "Shareholder Wealth Effects of Legislative Events: TheCase of Airline Deregulation." Public Choice, forthcoming.
Beaver, W. H. 1987. "The Properties of Sequential Regressions with Multiple Explanatory Variables."The Accounting Review (January): 137-144.
Becker, B. E., and C. A. Olson. 1986. "The Impact of Strikes on Shareholder Wealth." IndustrialLabor Relation Review 39 (April): 425^38.
Beneish, M. D. 1991. "The Effect of Regulatory Changes in the Airline Industry on Shareholders'Wealth." Joumai of Law and Economics34 (October): 395^30.
Bildersee, J. S., and J. Ronen. 1987. "Stock Retums and Real Activity in an Inflationary Environment:The Informational Impact of FAS No. 33." Contemporary Accounting Research 4 (1): 89-110
Brown, S. J., and J. B. Wamer. 1985. "Using Daily Stock Retums: The Case of Event Studies."Joumai of Financial Economics 14: 3-31.
Davidson, W. N., D. L. Worrell, and S. H. Garrison. 1988. "Effects of Strike Activity on Firm Value."Academy of Management Journal 31 (2): 387-394.
Dodd, P., 1980. Merger Proposals, Management Discretion and Stockholder Wealth, Joumai of Finan-cial Economics 8 (2): 105-138.
Foster, G. 1986. Financial Statement Analysis. 2d ed. Englewood Cliffs, N.J.: Prentice-Hall.Gibson, C. H. 1989. Financial Statement Analysis: Using Financial Accounting Information. Boston:
Kent Publishing.Gonedes, N. 1978. "Corporate Signalling, Extemal Accounting, and Capital Market Equilibrium: Ev-
idence on Dividends, Income and Extraordinary Items." Joumai of Accounting Research(Spring): 26-79.
Hearing of the Senate Subcommittee on Aviation, 1977. In Annual Abstracts of CongressionalPublications, 1974-1978, Congressional Information Service, Inc. Washington, D.C.
Holthausen, R. W. 1981. "Evidence on the Effects of Bond Covenants and Management CompensationContracts on the Choice of Accounting Techniques: The Case of Depreciation Switch-Back."Joumai of Accounting and Economics 3 (1): 73-109.
Hughes, J. S., and W. E. Ricks. 1984. "Accounting for Retail Land Sales: Analysis of MandatedChanges." Journal of Accounting and Economics 6 (2): 101-132.
John, K., and L. H. P. Lang. 1991. "Insider Trading Around Dividend Announcements: Theory andEvidence." Journal of Finance (September): 1361-1389.
Kmenta, J. 1971. Elements of Econometrics. New York: Macmillan.Lee, C. J., and C. Chen. 1990. "Structural Changes and the Forecasting of Quarterly Accounting
- Eamings in the Utility Industry." Joumai of Accounting and Economics 13 (2): 93-122.Lev, B. 1974. Financial Statement Analysis: A New Approach. Englewood Cliffs, N.J.: Prentice-Hall.Lev, B. 1983. "Some Economic Determinants of Time Series Properties of Eamings." Joumai of
Accounting and Economics 5: 31-48.Liu, C , and S. G. Ryan. 1995. "The Effect of Bank Loan Portfolio Composition on the Market Reaction
to and Anticipation of Provision for Loan Losses." Journal of Accounting Research 33 (1): 77-94.Madeo, S., and M. Pincus. 1985. "Stock Market Behavior and Tax Rule Changes: The Case of the
Disallowance of Certain Interest Deductions Claimed by Banks." The Accounting Review 60(July): 407-429.
Maloney, M. T., and R. E. McCormick. 1982. "A Positive Theory of Environmental Quality Regula-tion." Joumat of Law and Economics 25: 99-123.

PRIOR FINANCIAL RATIO INFORMATION 717
Michel, A., and I. Shaked. 1984. "Airline performance under deregulation: The Shareholder's Per-spective," Financial Management 13: 5-14,
Praegar, R, A. 1989, "Using Stock Price Data to Measure the Effects of Regulation: The InterstateCommerce Act and the Railroad Industry." Rand Journal of Economics 20 (2): 280-290,
Ronen, J, 1979, "The Dual Role of Accounting: A Financial Economic Perspective," Chapter 20 inHandbook of Financial Economics, edited by J, L, Bicksler, pp. 415-454, Amsterdam: North-Holland Publishing.
Rose, N. 1985, "The Incidence of Regulatory Rents in the Motor Carrier Industry," Rand Journal ofEconomics 16 (3): 299-318.
Schipper, K., and R. Thompson. 1983. "The Impacts of Merger-Related Regulations on the Share-holders of Acquiring Firms," Journal of Accounting Research 12 (Spring): 184-221,
Schipper, K,, R, Thompson, and R, Weil. 1987. "Disentangling Interrelated Effects of RegulatoryChanges on Shareholder Wealth: The Case of Motor Carrier Deregulation," Journal of Law andEconomics 30 (April): 67-100.
Spiller, P. T. 1983, "The Differential Impact of Airline Deregulation in Individual Firms and Markets:An Empirical Analysis." Joumat of Law and Economics 26: 655-689,
Spiller, P. T. 1986. "Mobility Barriers in the U.S. Airline Industry." Working Paper, StanfordUniversity.
Stickney, C. P. 1990. Financial Statement Analysis: A Strategic Perspective. New York: Harcourt BraceJovanovich.
Stigier, G. J. 1963. Capital and Rates of Return in Manufacturing Industries. Princeton, N.J.: PrincetonUniversity Press,
Teets, W. 1992. "An Empirical Investigation Into the Association Between Stock Market Responsesto Eamings Announcements and Regulation." Journal of Accounting Research 30 (Autumn):274-285.
Wall Street Journal. Various Issues.Watts, R., and J. Zimmerman. 1980. "On the Irrelevance of Replacement Costs for Security Prices."
Journal of Accounting and Economics 2 (2): 95-106.Yen, G. 1987. "Merger Proposals, Management Discretion and Magnitude of Shareholders' Wealth
Gain." Journal of Economics and Business 39: 251-266,Zellner, A. 1962. "An Efficient Method for Estimating Seemingly Unrelated Regressions and Test for
Aggregate Bias." Journal of American Statistical Association 57 (June): 348-368.


![The Method of Difference Potentials for the Helmholtz ... › publications › a66e.springer.pdf · theory of partial differential equations [7, 42, 46]. Prior developments of the](https://img.pdfslide.us/doc/110x75/5f03978a7e708231d409cfb6/the-method-of-difference-potentials-for-the-helmholtz-a-publications-a-a66espringerpdf.jpg)

![DehazeGAN: When Image Dehazing Meets Differential … · improves the GAN's interpretability ... posed, e.g. constant albedo prior[Fattal, 2008], dark chan-nel prior ... as a recurrent](https://img.pdfslide.us/doc/110x75/5cbe520c88c9933f378c2812/dehazegan-when-image-dehazing-meets-differential-improves-the-gans-interpretability.jpg)
![Filing at a Glance - myportal.dfs.ny.gov HCA_SG... · Loss Ratio Report, 3231(e) Loss Ratio Report, Experience Rating Formula, or Other with brief explanation).]: Yes- Prior Approval](https://img.pdfslide.us/doc/110x75/5c0733d509d3f2987a8ca6b1/filing-at-a-glance-hcasg-loss-ratio-report-3231e-loss-ratio-report.jpg)