Embed Size (px)
Citation preview

i
SAND2004-3114 Printed June 2004
Solderability Study of 63Sn-37Pb on Zinc-Plated and Cadmium-Plated
Stainless Steel For The MC4636 Lightning Arrestor Connector
Edwin P. Lopez, Corrosion, and Surface Sciences, Dr. Paul T. Vianco, Jerome A. Rejent, and Joe Martin, Materials Reliability
Sandia National Laboratories1 Albuquerque, NM
Abstract
Cadmium plating on metal surfaces is commonly used for corrosion protection and to
achieve good solderability on the 304L stainless steel shell of the MC4636 lightning
arrestor connector (LAC) for the W76-1 system. This study examined the use of zinc as
a potential substitute for the cadmium protective surface finish. Tests were performed
with an R and RMA flux and test temperatures of 230ºC, 245ºC, and 260ºC. Contact
angle, θC, served as the generalized solderability metric. The wetting rate and wetting
time parameters were also collected. The solderability (θC) of the Erie Plating Cd/Ni
coatings was better than that of similar Amphenol coatings. Although the θC data
indicated that both Cd/Ni platings would provide adequate solderability, the wetting rate
and wetting time data showed the Amphenol coatings to have better performance. The
Zn/Ni coatings exhibited non-wetting under all flux and temperature conditions. Based
on the results of these tests, it has been demonstrated that zinc plating is not a viable
alternate to cadmium plating for the LAC connectors
1Sandia is a multiprogram laboratory operated by Sandia Corporation, a Lockheed Martin Company, for the United States Dept. of Energy’s National Nuclear Security Administration under Contract DE-AC04-94AL85000.

ii
Acknowledgements
The authors greatly appreciate the analytical work of Richard P. Grant and Michael J. Rye of Sandia National Laboratories. Mike Hosking graciously reviewed the manuscript.

iii
Contents Pg. Tables iv Figures iv 1. Introduction 1 2. Experimental Procedures 3
2.1 Substrate Preparation 3 2.2 Solders and Fluxes 4 2.3 Solderability Testing 4
3. Test Results and Discussion 6
3.1 Contact Angle Test Data/Cadmium-Nickel Plated 304L Stainless Steel Samples 6
3.2 Contact Angle Test Data/ Zinc-Nickel Plated 304L Stainless Steel 9 3.3 Wetting Rate Versus Time Maximum Force Results 9
4. Summary 10 5. References 11 6. Distribution List 21

iv
Table Pg.
1. “Relative Wettability Guideline” Using Contact Angle (θC) As “General” Metric 12
2. Solderability Parameters of Contact Angle (θC), Solder Flux Interfacial Tension (γLF), Wetting Rate (WR) and Time to Maximum Wetting Force (TFmax) for Cd and Zn-plated
Stainless Steel 12
Figure
1. Equilibrium Balance of Three Interfacial Tensions (γSF, γSL, and γLF) 13
2. Test Configuration for the Meniscometer and Wetting Balance Techniques 13
3. Wetting Balance Data Representing The Development of the Solder Meniscus With Time 14
4. Amphenol Plate SEM Image of 304L Stainless Steel Plated With Nickel Under Layer and Cadmium Top Layer 14
5. Erie Plate BES Image of 304L Stainless Steel Plated With Nickel Under Layer and Cadmium Top Layer 15
6. Erie Plate BES Image of 304L Stainless Steel Plated With Nickel Under Layer and Zinc Top Layer 15
7. EDS Spectral Imaging - reaction area at the solder front of coupon 16 8. Contact Angle As A Function of Temperature for R Flux
On Cd-Ni Plated 304LSS 17 9. Contact Angle As A Function of Temperature for RMA Flux
On Cd-Ni Plated 304LSS 17 10. Erie Plated Wetting Balance Trace For Zn-Ni Plated 304l SS at 260ºC 18 11. Wetting Rate (WR) As A Function of Temperature for Cd-Ni
Plated 304LSS Using R Flux 18 12. Wetting Rate (WR) As A Function of Temperature for Cd-Ni
Plated 304LSS Using RMA Flux 19 13. Time To Maximum Force (TFmax) As A Function of
Temperature Using R Flux 19 14. Time To Maximum Force (TFmax) As A Function of
Temperature Using RMA Flux 20

1
1. INTRODUCTION
Carcinogenic risks associated with the use of cadmium (Cd) as a plating material
have led to the consideration of zinc (Zn) as an alternative coating. Cadmium over nickel
(Ni) has been a standard plating method on 304L stainless steel in order to provide both
corrosion protection and good solderability for next assembly operations. The purpose of
the Ni coating is to provide a solderable layer for next assembly processes. The Cd
coating serves as the protective surface finish, preserving the solderability of the Ni layer
surface. Because of these attributes, Cd/Ni coatings have been specified for the MC4636
Lightning Arrestor Connector on the W76 system. The present study examined the
solderability of 63Sn-37Pb (wt.%) on Zn/Ni-plated and Cd/Ni-plated 304L stainless steel
as a function of solder flux and temperature. The solder fluxes were a rosin-based
material (R) and a rosin-based mildly activated (RMA) composition. The solderability
tests were performed at three different test temperatures: 230ºC, 245ºC, and 260ºC.
The solderability metric was the contact angle, θC, formed when a substrate coupon is
immersed edge-on into molten solder.1 The contact angle is determined by the
equilibrium balance of the three interfacial tensions, as expressed by Young’s equation:
CLFSLSF θγγγ cos=− Equation 1
where γSF is the solid (substrate)-flux interfacial tension; γSL is the solid-liquid (solder)
interfacial tension, and the γLF is the liquid-flux interfacial tension (Figure 1). The
smaller the value of θC, the better the solderability performance. The value of θC is
minimized when γLF is minimized, γSF is maximized and γSL is minimized.

2
The meniscometer/wetting balance test was used to determine the value of θC.2 The
measurements are illustrated in Figure 2. The meniscometer test was used to measure the
maximum meniscus rise or height (H) of molten solder on the face of a coupon test
sample immersed edge-on into the solder bath. The wetting balance test was used to
determine the weight of the solder meniscus as a function of time. Shown in Figure 3 is a
generalized representation of the plot of meniscus weight as a function of test time.
When a coupon is initially immersed into the solder bath, an “upwards” force is exerted
on the sample. This force has two contributions, (1) the solder displaced by the sample
volume and (2) the solder displaced by the action of the surface tension, that is, the
“negative” meniscus. As wetting takes place, the negative meniscus decreases and the
solder wets/spreads up the sample surface, creating a downward force due to its weight.
The buoyancy force due to solder displaced by the submerged volume of the coupon
remains the same and must be accounted for in the meniscus weight calculations by
subtracting its fixed value from the total measured force. The maximum meniscus
weight, W, is used in the calculation of θC.
The value of θC was calculated from H and W, using equation (2):
⎥⎥⎥⎥⎥⎥
⎦
⎤
⎢⎢⎢⎢⎢⎢
⎣
⎡
⎟⎟⎠
⎞⎜⎜⎝
⎛+
⎟⎟⎠
⎞⎜⎜⎝
⎛−
−= 2224
22241sin
gPHw
gPHw
c
ρ
ρθ Equation 2
where ρ is the solder density (gm/cm3), g is the acceleration due to gravity (cm/sec2), and
P is the sample perimeter (cm). The solder flux interfacial tension, γLF, can also be
independently determined from the experimental data using equation (3):

3
( ) ⎪⎭
⎪⎬⎫
⎪⎩
⎪⎨⎧
+= 2H2ρgPH
2w44ρg
LFγ Equation 3
In addition to the parameter, W, the wetting balance curve is used to identify the wetting
rate and time to maximum wetting force parameters, which are also depicted in Figure 3.
The meniscometer/wetting balance tests were performed with 63Sn-37Pb on Cd/Ni
and Zn/Ni-plated 304L stainless steel coupons. The objective of these evaluations was to
determine the solderability of Zn/Ni coatings on stainless steel substrates. The
performance of the Zn/Ni finish was compared to that of the Cd/Ni finish that is currently
used in the MC4636 LAC in order to determine the suitability of the former on this
component.
2. EXPERIMENTAL PROCEDURES
2.1 Substrate Preparation
The 304L stainless steel substrates had nominal dimensions of 2.54 x 2.54 x 0.0254
cm. The coupons were sheared from rolled sheet stock and flattened to remove any
residual curvature. Only those coupons were used that had length and width dimensions
to within ±0.013 cm of their nominal values. Amphenol Plating Company and Erie
Plating Company provided the electroplating services. The electroplated Ni layer had a
Ni-P composition (0.0026 to 0.0038 wt.% P). The Cd/Ni-plated coupons that were
prepared by Amphenol had a 5.5 μm-thick Ni solderable layer and a 10 μm-thick Cd
protective layer. These thicknesses were determined by Scanning Electron Microscopy
(SEM), as shown by Figure 4. The coupons prepared at Amphenol were plated in a
caustic/cyanide solution having the following nominal concentrations: (1) 2
ounces/gallon cadmium, (2) 17 ounces/gallon cyanide, (3) 3 ounces/gallon caustic
4
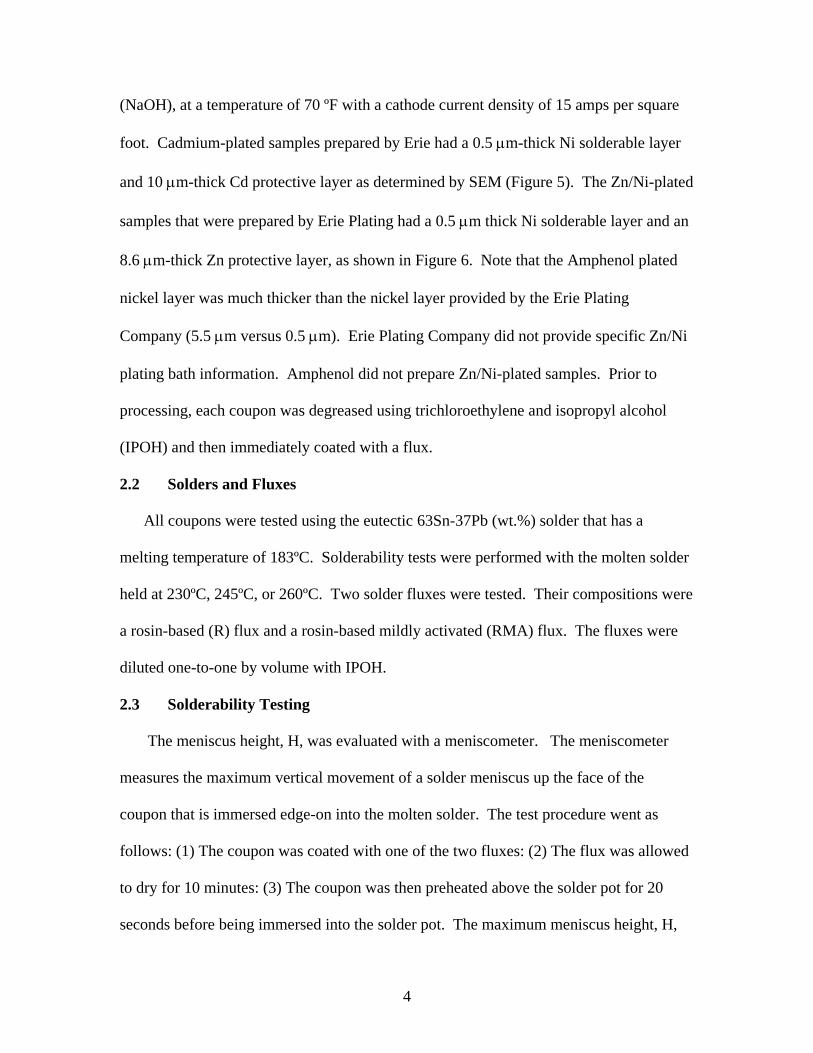
(NaOH), at a temperature of 70 ºF with a cathode current density of 15 amps per square
foot. Cadmium-plated samples prepared by Erie had a 0.5 μm-thick Ni solderable layer
and 10 μm-thick Cd protective layer as determined by SEM (Figure 5). The Zn/Ni-plated
samples that were prepared by Erie Plating had a 0.5 μm thick Ni solderable layer and an
8.6 μm-thick Zn protective layer, as shown in Figure 6. Note that the Amphenol plated
nickel layer was much thicker than the nickel layer provided by the Erie Plating
Company (5.5 μm versus 0.5 μm). Erie Plating Company did not provide specific Zn/Ni
plating bath information. Amphenol did not prepare Zn/Ni-plated samples. Prior to
processing, each coupon was degreased using trichloroethylene and isopropyl alcohol
(IPOH) and then immediately coated with a flux.
2.2 Solders and Fluxes
All coupons were tested using the eutectic 63Sn-37Pb (wt.%) solder that has a
melting temperature of 183ºC. Solderability tests were performed with the molten solder
held at 230ºC, 245ºC, or 260ºC. Two solder fluxes were tested. Their compositions were
a rosin-based (R) flux and a rosin-based mildly activated (RMA) flux. The fluxes were
diluted one-to-one by volume with IPOH.
2.3 Solderability Testing
The meniscus height, H, was evaluated with a meniscometer. The meniscometer
measures the maximum vertical movement of a solder meniscus up the face of the
coupon that is immersed edge-on into the molten solder. The test procedure went as
follows: (1) The coupon was coated with one of the two fluxes: (2) The flux was allowed
to dry for 10 minutes: (3) The coupon was then preheated above the solder pot for 20
seconds before being immersed into the solder pot. The maximum meniscus height, H,

5
was recorded 20 seconds after the immersion. Five tests were performed per each test
condition. A mean value for H, along with one standard deviation was determined from
those replicate tests.
During meniscometer testing, a false solder wetting front was formed on all of the
Cd-plated coupons, which gave rise to erroneous meniscus height measurements. Energy
Dispersive X-ray Spectral Imaging was used to determine the composition and thickness
of the reaction area at the solder front of the samples. The three samples (one from
Amphenol Plating and two from Erie Plating) that were analyzed indicated that the solder
front actually advanced undercutting the Cd layer, as shown in Figure 7. Only one
sample showed a Ni, P layer between the 304L SS and the Cd layer. In this sample, the
solder front undermined the Ni, P layer and the Cd layer. Because of this phenomenon,
the height measurements for each Cd dipped sample were re-evaluated using precision
calipers.
The meniscus weight of the solder was measured using the wetting balance test
apparatus.2 Five separate tests were performed with this technique as well. The
maximum meniscus weight, W, was determined for each test; these values were
combined to determine a mean value and one standard deviation that served as the error
term.
The contact angle, θC, and solder flux interfacial tension, γLF, were calculated through
the use of equations (2) and (3), respectively. The mean values of θC and γLF were
determined by inserting the mean values of H and W into those equations. In the case of
63Sn-37Pb solder, the value of ρ is 8.49 g/cm2. The parameter g and P were 980 cm/sec2
and 5.085 cm, respectively. The error terms for θC and γLF were calculated by the

6
following procedure. The maximum value of W, which equaled the mean plus one
standard deviation, and minimum value of H, which equaled the mean minus the standard
deviation, were inputed into equations (2) and (3). The resulting θC and γLF values were
the maximum. The reverse process was performed to determine the minimum values of
θC and γLF. The minima and maxima of θC and γLF provided the error terms for these
parameters.
Solderability was quantified by the contact angle, θC, formed between the liquid
solder and the substrate and calculated from equation (2). A qualitative solderability
guideline is depicted in Table 1.3 Wetting is considered to take place when the contact
angle is less than 90º. Preferable solderability is accompanied by contact angles that are
generally <30º.
3. Test Results and Discussion
3.1 Contact Angle Test Data: Cd/Ni Plated 304L Stainless Steel Samples
An analysis of the solderability behavior [i.e., θC, γLF, and (γSF- γSL)] of the Cd/Ni
plated substrates began by addressing those samples having the Amphenol coating. The
performance of the Erie Plating samples was evaluated next. Lastly, comparative
generalizations were developed from these individual analyses of the two plating sources.
With the exception of the R flux and 230ºC test temperature, the remaining flux and
temperature test combinations resulted in values of θC in the range of 30 – 39º on the
Amphenol Cd/Ni plated samples (Table 2 & Figures 8-9). Although the contact angle
values were considered to represent “good” solderability, they did not exhibit the
expected, systematic dependence upon either the flux strength – the contact angle is
reduced by the stronger RMA flux – or test temperature – the contact angle decreases

7
with higher test temperature. A contributing factor may have been the thicker nickel
layer, which would not be completely dissolved by the solder even at the higher test
temperature. The limited temperature effect was not unexpected, based upon prior
solderability studies. It was interesting that the dependence of γLF on temperature was
not monotonic for either flux, showing a maximum at 245ºC. Both R and RMA fluxes
exhibited values of (γSF- γSL) that decreased with increasing temperature – more so, this
was true of the R flux – suggesting that re-oxidation of the plating surface was
responsible for the loss of efficacy at the higher test temperatures.
On the other hand, it was considered unusual that the RMA flux did not provide an
improved performance vis-à-vis the R flux. In fact, the mean values of θC attributed to
the R flux were slightly lower than those associated with the RMA flux. A review of the
solder-flux interfacial tension parameter indicated that the values of γLF were
significantly lower for the R flux than for the RMA flux. (It is emphasized that γLF is an
independently calculated parameter.) Although a lower γLF can give rise to a reduced θC
value, the magnitudes of the differences in γLF between the two fluxes were much greater
than would be required to cause the small differences in θC. Therefore, there was a
compensating effect provided by the (γSF- γSL) term. The R flux resulted in a value of
(γSF- γSL) that was smaller relative to that associated with the RMA flux in each case.
This trend was expected because the less active R flux has a reduced oxide removal
efficacy and, as such, produces a lower γSF as compared to the performance of the RMA
flux. (The value of γSF remains unchanged because of the similar solderable finish, Ni.)
In conclusion, the similarity in the contact angles of 63Sn-37Pb solder on the Amphenol

8
Cd/Ni plated substrates was a result of the R flux having a lower γLF value than the RMA
flux, which compensated for the former fluxes’ lower efficacy (i.e., lower γSF).
Next, the solderability of the Erie Plating Cd/Ni plated samples was assessed. The
contact angle values in Table 2 and plot in Figure 9 indicate an overall solderability
performance that ranged from excellent to adequate. Unlike the Amphenol Cd/Ni layer,
the contact angle θC exhibited the expected tendencies on flux type and test temperature
with the Erie Plating layers. First, solderability improved with higher test temperature.
In the case of the R flux, non-monotonic changes of both γLF and (γSF- γSL) combined to
give rise to the overall trend of improved solderability with higher test temperature. On
the other hand, the RMA flux exhibited monotonic decreases of both γLF and (γSF- γSL).
The decrease in γLF was exclusively responsible for improved solderability with increased
test temperature because (γSF- γSL) also decreased with temperature, a trend that would
cause an increase of θC. The drop in the value (γSF- γSL) with increased temperature was
not likely the result of increased Cd/Ni oxidation as was hypothesized for the Amphenol
plated samples because the R flux did not exhibit the same behavior, which would be
expected from the latter’s due to its reduced strength and, therefore, increased sensitivity
to surface degradation.
The Erie Plating Cd/Ni finish exhibited better solderability with the RMA flux than
was recorded with R flux. The better performance of the RMA flux at 230ºC was due to
a higher value of (γSF- γSL) versus that of the R flux. At 245ºC and 260ºC, lower values
of γLF were responsible for the RMA flux having greater solderability at these test
temperatures.

9
A comparison was made of the solderability parameters [θC, γLF, and (γSF- γSL)]
calculated for the two Cd/Ni coating types (Amphenol and Erie Plating). It was clear
from the trends discussed above, as well as from a direct comparison of the data listed in
Table 2, that there was very little similarity in the solderability behavior – that is, flux
type and temperature dependencies as well as actual parameter magnitudes – between the
Amphenol and Erie Plating, Cd/Ni coatings. In conclusion, if the solderability metric
were based just on the contact angle θC, the Erie Plating Cd/Ni coatings exhibited
generally better solderability than did the Amphenol coatings.
3.2 Contact Angle Test Data: Zn-Ni Plated 304L Stainless Steel
The Zn/Ni plated samples were provided by the Erie Plating Company. Non-wetting
resulted from all tests regardless of solder flux or test temperature. A sample of a wetting
balance plot generated by the use of an RMA flux and test performed at 260 ºC is shown
in Figure 10. The solder meniscus was never formed. In fact, the trace did not reach the
zero point. Non-wetting was similarly observed with the meniscometer tests. These tests
were reflected in Table 2 by NW (non-wetting). The poor solderability could be related
to the cracked morphology of the zinc layer and requires further study.
3.3 Wetting Rate (WR) and Wetting Time (TFmax) Test Results
An analysis was also performed on the wetting rate: WR, and the wetting time, TFmax.
In the case of the Amphenol Cd/Ni plated samples, both fluxes exhibited the expected
increase in wetting rate (Figures 11-12) and concurrently, decrease in wetting time
(Figures 13-14), as the test temperature was increased. The magnitude of these trends
was similar between the two fluxes. As expected, the RMA flux resulted in significantly

10
faster wetting rate than was observed with the R flux. Similarly, the wetting times were
shorter with the RMA flux. This trend is typical for nickel surface finishes.
Analyses of wetting rate (Figures 11-12) and wetting time (Figures 13-14) were also
performed on the Erie Plating Cd/Ni coatings. The values of the wetting rate were
significantly less than those observed with the Amphenol coatings. This could be a result
of the solder dissolving all of the nickel plating and wetting the underlying stainless steel.
Typically stainless steel does not wet as readily as nickel. The wetting rate increased
with test temperature in the case of both the R and RMA flux types. The wetting time
was equal to the entire test duration for all flux and temperature combinations with the
exception of the RMA flux used at 260ºC. As such, this parameter was considerably
longer than the wetting times recorded on Amphenol coatings. In summary, the wetting
rate and wetting time performance of 63Sn-37Pb solder was better on the Amphenol
Cd/Ni coating and more so, with the RMA flux. The difference was of considerably
lesser magnitude for the R flux. Converse to the contact angle data, the wetting rate and
wetting time data suggests that the Amphenol coatings have better solderability than the
Erie Plating Cd/Ni coatings.
4. Summary
Cadmium plating is the preferred method for providing corrosion protection and
solderability of the stainless steel shell on the MC4636 lightning arrestor connector
(LAC) to be used on the W76-1 system. This study considered the use of Zn as an
environmentally friendly replacement for cadmium in this application. The solderability
of Cd/Ni-plated and Zn/Ni-plated stainless steel samples was studied using the wetting
balance and the meniscometer test methods. Tests were performed with an R and RMA

11
flux and test temperatures of 230ºC, 245ºC, and 260ºC. Contact angle, θC, served as the
generalized solderability metric. The wetting rate and wetting time parameters were also
collected.
The solderability of the Erie Plating Cd/Ni coatings was better than that of similar
Amphenol coatings. Although the θC data indicated that both Cd/Ni platings would
provide adequate solderability, the wetting rate and wetting force data showed the
Amphenol coatings to have better performance. The Zn/Ni coatings exhibited non-
wetting under all flux and temperature conditions, although cracks in the Zn surface layer
could degrade solderability under the test conditions.
References
1. Edwin P. Lopez, Paul T. Vianco, and Jerome Rejent, “Solerability Testing of
95.5Sn-3.9Ag-0.6Cu Solder on Oxygen-Free High Conductivity Copper and Au-
Ni-Plated Kovar”, Journal of Electronic Materials, Vol. 32, No. 04, 2003, Pg.
254-260.
2. P. Vianco, “An Overview of the Meniscometer/Wetting Balance Techniques for
Wettability Measurements”. The Metal Science of Joining, eds. By M. Cieslak,
etal (TMS, Warrendale, PA: 1992) pp. 265-284.
3. R. J. Klein Wassink, Soldering in Electronics (Ayr, Scotland: Electrochemical
Publications Limited, 1984), p. 235.

12
Table 1 - “Relative Wettability Guideline” Using Contact Angle (θC) As “General” Metric
Contact Angle (θC) Range Relative Wettability 0º < 0 < 10º Perfect
10º < 0 < 20º Excellent 20º < 0 < 30º Very Good 30º < 0 < 40º Good 40º < 0 < 50º Adequate 55º < 0 < 70º Poor
Table 2 - Solderability Parameters of Contact Angle (θC), Solder Flux Interfacial Tension (γLF), Wetting Rate (WR) and Time to Maximum Wetting Force (TFmax) for Cd/Ni and Zn/Ni plated Stainless Steel
Substrate Material
Solder Alloy
T ºC Flux
θC ° γLF (dyne/cm)
WR (mN/sec)
TFmax (sec)
Cd-plated Stainless Amphenol
63Sn-37Pb
230 RMA R
35.6 ±4.1 19.1 ±5.9
466.3 ±28.5 345.6 ±28.8
15.3 4.9
4.2 10.0
245 RMA R
39.4 ±6.0 31.8 ±3.5
489.3 ±44.2 349.2 ±27.0
22.0 6.4
2.5 7.1
260 RMA R
33.1 ±4.6 30.0 ±8.5
428.6 ±30.3310.5 ±51.1
24.0 10.7
2.2 6.9
Cd-plated Stainless Erie
63Sn-37Pb
230 RMA R
31.1 ±5.7 43.1 ±8.3
428.9 ±36.9 418.4 ±92.1
3.8 2.2
19.9 19.9
245 RMA R
21.5 ±6.6 38.9 ±7.5
368.3 ±35.1 442.3 ±63.4
6.8 3.2
19.7 20.0
260 RMA
R 20.0 ±9.6 26.5 ±12.5
312.2 ±45.2 362.0 ±73.0
9.1 4.7
11.0 19.4
Zn-plated SS-Erie
230 RMA R
NW NW
NW NW
NW NW
NW NW
245 RMA R
NW NW
NW NW
NW NW
NW NW
260 RMA R
NW NW
NW NW
NW NW
NW NW
NW = Non-Wetting RMA = Rosin Mildly Activated R = Rosin

13
Figure 1 – Equilibrium Balance of Three Interfacial Tensions (γSF, γSL, and γLF)
Figure 2 – Test Configuration for the Meniscometer and Wetting Balance Techniques

14
Figure 3 - Wetting Balance Data Representing The Development of the Solder Meniscus With Time
Figure 4 – SEM Image (secondary electron, SE) of 304L Stainless Steel Plated with Ni solderable layer and Cd protective layer by Amphenol.
Nickel
Cadmium
304L SS

15
Figure 5 – SEM Image (backscatter electron, BSE) of 304L Stainless Steel electroplated with Ni solderable layer and Cd protective layer by Erie Plating.
Figure 6 - Erie Plate BES Image of 304L Stainless Steel Plated With Nickel Under Layer and Zinc Top Layer
Cadmium Nickel
Zinc
Nickel
304L SS
304L SS

16
Figure 7 – EDS Spectral Imaging - reaction area at the solder front of coupon (Amphenol) 200 um field of view.
Red = Substrate (Fe, Cr, Ni) Green = Si, Sn, Cd, Pb, Ni Blue = Pb, Sn Cyan = Cd, Si Magenta = Ni, P, Fe Yellow = Sn, Ni, Pb White = glass (Si, O, Na, Cd)
Cd, Si
304L SS
Sn, Pb, Cd, Ni
Ni-P, Fe
C, Si, O, Cd
200 um field of view

17
Figure 8- Contact Angle As A Function of Temperature for R Flux On Cd-Ni Plated 304LSS
0
10
20
30
40
50
225 230 235 240 245 250 255 260 265
Alpha 100 on Cd/Ni/304L SS
Alpha 100-Cd/Ni/304L SS-ErieAlpha 100-Cd/Ni/304L SS-Amphenol
Con
tact
Ang
le º
Temperature (C)
Figure 9 - Contact Angle As A Function of Temperature for RMA Flux On Cd-Ni Plated 304LSS
0
10
20
30
40
50
225 230 235 240 245 250 255 260 265
Alpha 611 on Cd/Ni/304L SS
Alpha 611-Cd/Ni/304L SS-ErieAlpha 611-Cd/Ni/304L SS-Amphenol
Con
tact
Ang
le º
Temperature (C)
Erie
Amphenol
A
E

18
Figure 10 – Erie Plated Wetting Balance Trace For Zn-Ni Plated 304l SS at 260ºC
-20.0
-10.0
0.0
10.0
20.0
0 5 10 15 20
Sn63-Pb37260°C
Alpha 611 : IPOHErie Plating
Force1 (mN)
Time (Sec)
Figure 11 – Wetting Rate (WR) As A Function of Temperature for Cd-Ni Plated 304LSS Using R Flux
-20
-10
0
10
20
30
225 230 235 240 245 250 255 260 265
Alpha 100 on Cd/Ni/304L SS
Wetting Rate (mN/sec.)-ErieWetting Rate (mN/sec.)-Amphenol
Wet
ting
Rat
e (m
N/s
ec)
Temperature (C)

19
Figure 12 - Wetting Rate (WR) As A Function of Temperature for Cd-Ni Plated 304LSS Using RMA Flux
-20
-10
0
10
20
30
225 230 235 240 245 250 255 260 265
Alpha 611 on Cd/Ni/304L SS
Wetting Rate (mN/sec.)-ErieWetting Rate (mN/sec.)-Amphenol
Wet
ting
Rat
e (m
N/s
ec)
Temperature (C)
Figure 13 - Time To Maximum Force (TFmax) As A Function of Temperature Using R Flux
-20
-10
0
10
20
30
225 230 235 240 245 250 255 260 265
Alpha 100 on Cd/Ni/304L SS
Time to Fmax (sec.)-ErieTime to Fmax (sec.)-Amphenol
Tim
e to
Fm
ax (s
ec)
Temperature (C)

20
Figure 14 - Time To Maximum Force (TFmax) As A Function of Temperature Using RMA Flux
-20
-10
0
10
20
30
225 230 235 240 245 250 255 260 265
Alpha 611 on Cd/Ni/304L SS
Time to Fmax (sec.)-ErieTime to Fmax (sec.)-Amphenol
Tim
e to
Fm
ax (s
ec)
Temperature (C)

21
6. Distribution List Sandia National Laboratories Copies Mail Stop Dept. 1 0523 1733 L. A. Andrews 1 0523 1733 J. E. Christensen 1 0523 1733 T. L. Ernest 1 0523 1733 J. O. Harris 1 0523 1733 D. L. South 3 0888 1832 E. P. Lopez 1 0888 1832 N. R. Sorensen 1 0888 1832 F. D. Wall 1 0889 1833 F. M. Hosking 1 0889 1833 M. F. Smith 1 0889 1861 P. T. Vianco 1 0889 1861 J. A. Rejent 1 0889 1861 J. J. Martin 1 0889 1861 J. W. Braithwaite 1 0481 2132 D. R. Helmich 1 0481 2132 M. A. Rosenthal 1 0481 2132 S. E. Slezak 1 0481 2132 H. D. Radloff 1 0481 2132 J. E. Riggs 1 0523 1733 D. R. Salmi 1 0523 1733 W. D. Cain 1 9034 8221 R. A. Van Cleave 1 9018 8940-2 Central Technical Files 2 0899 4916 Technical Library 1 0612 4912 Review & Approval Desk For DOE/OSTI Honeywell FM&T KCP 1 2B37 462 J. M. Emmons 1 2B37 462 S. Halter 1 2B37 462 R. Taylor 1 2D39 EE3 D. Ferguson 1 2D39 EE3 D. Prigel