Embed Size (px)
Citation preview

Printed in the United States of America. Available fromNational Technical Information Service
U.S. Department of Commerce5285 Port Royal Road, Springfield, Virginia 22161
NTIS price codes-Printed Copy: A04; Microfiche A01
This report was prepared as an account of work sponsored by an agency of theUnited nor thereof, nor any of their employees, makes any warranty, express or implied, orassumes any legal liability or responsibility for the accuracy, completeness, orusefulness of any information, apparatus, product, or process disclosed, orrepresents that its use would not infringe privately owned rights. Reference hereinto any specific commercial product, process, or service by trade name, trademark,manufacturer, or otherwise, does not necessarily constitute or imply itsendorsement, recommendation, or favoring by the United States Government orany agency thereof. The views and opinions of authors expressed herein do notnecessarily state or reflect those of the United States Government or any agencythereof.

ORNL/TM-8597
Contract W-7405-eng-26
HEALTH AND SAFETY RESEARCH DIVISION
RADIUM-226 IN DRINKING WATER AND TERRESTRIAL FOOD CHAINS:A REVIEW OF PARAMETERS AND AN ESTIMATE OF
POTENTIAL EXPOSURE AND DOSE
A. P. Watson, E. L. Etnier, and L. M. McDowell-Boyer
Date Published: April 1983
NOTICE This document contains information of a preliminary nature.It is subject to revision or correction and therefore does not represent afinal report.
Prepared for theFLORIDA INSTITUTE OF PHOSPHATE RESEARCH
under Interagency Agreement DFP#81002/DOEERD-81-163
OAK RIDGE NATIONAL LABORATORYOak Ridge, Tennessee 37830
operated byUNION CARBIDE CORPORATION
for theU. S. DEPARTMENT OF ENERGY

iii
V

SUMMARY
Environmental transport of 226Ra from geological formations to
drinking water and from soil to vegetation, meat and milk were quantita-
tively analyzed following a review of literature. Both natural and
industrial sources were investigated. Particular attention was given to
references specific for the phosphate-mining region of southwestern
Florida.
Literature sources have been interpreted to develop concentration
factors describing terrestrial food-chain transport. Unweighted means
and associated ranges of concentration factor values, representing
averages of data collected over a variety of environmental conditions,
soil types, and chemical forms, are also provided. Annual human exposure
and 50-year dose commitments to bone, lung, liver, kidney and whole body
were estimated by assuming mean concentration factors as well as annual
food and water consumption rates.
vii
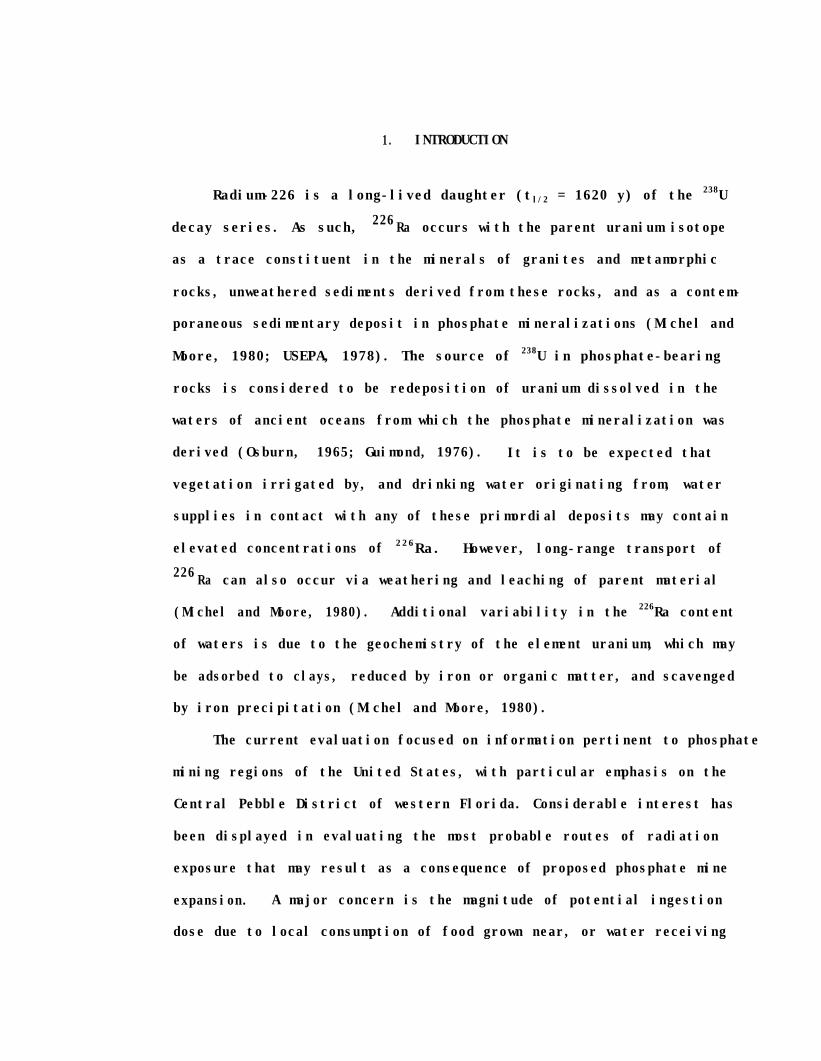
1. INTRODUCTION
Radium-226 is a long-lived daughter (tl/2 = 1620 y) of the 238U
decay series. As such, 226Ra occurs with the parent uranium isotope
as a trace constituent in the minerals of granites and metamorphic
rocks, unweathered sediments derived from these rocks, and as a contem-
poraneous sedimentary deposit in phosphate mineralizations (Michel and
Moore, 1980; USEPA, 1978). The source of 238U in phosphate-bearing
rocks is considered to be redeposition of uranium dissolved in the
waters of ancient oceans from which the phosphate mineralization was
derived (Osburn, 1965; Guimond, 1976). It is to be expected that
vegetation irrigated by, and drinking water originating from, water
supplies in contact with any of these primordial deposits may contain
elevated concentrations of 226Ra. However, long-range transport of
226 Ra can also occur via weathering and leaching of parent material
(Michel and Moore, 1980). Additional variability in the 226Ra content
of waters is due to the geochemistry of the element uranium, which may
be adsorbed to clays, reduced by iron or organic matter, and scavenged
by iron precipitation (Michel and Moore, 1980).
The current evaluation focused on information pertinent to phosphate
mining regions of the United States, with particular emphasis on the
Central Pebble District of western Florida. Considerable interest has
been displayed in evaluating the most probable routes of radiation
exposure that may result as a consequence of proposed phosphate mine
expansion. A major concern is the magnitude of potential ingestion
dose due to local consumption of food grown near, or water receiving

2
effluent from, phosphate mines or reclamation sites. To characterize
such transfer and estimate potential dose, an evaluation of pertinent
food chain parameters governing exposure was performed.
2. RADIUM-226 IN POTABLE WATERS
2.1 DOMESTIC OCCURRENCE
The quantity of 226Ra found in water supplies is directly determined
by the geology of the surface water drainage system or underground
aquifer supplying the consumer(s). In general, it is thought that
waters from shallow wells usually contain less 226Ra than that from
deeply drilled wells, with wells bored into granitic and deep sandstone
formations containing the highest concentrations (Smith et al., 1961;
Snihs, 1973; Brinck, et al., 1976). Hot springs, wells, or boreholes in
geothermal areas often contain elevated amounts of 226Ra and other
members of the 238 U decay series as a result of reservoir proximity to
the earth's mantle. Studies to date demonstrate that 226Ra in municipal
water supplies at the point of use is considerably lower than that found
in raw groundwater due to the purification regime at the treatment
plant; oxidation and filtration, reverse osmosis, sodium cation exchange,
and lime-soda ash softening are particularly effective and generally
remove 50 to 90% of the 226Ra present in untreated waters (Kiefer,
Wicke, and Glaum, 1980; Asikainen and Kahlos, 1980; Brinck et al.,
1976).

3
A number of municipal and private drinking water sources have been
sampled for 226Ra throughout the United States as well as in the Florida
Pebble Districts. The results of several surveys, presented in Tables 1
and 2, are by no means exhaustive. Nevertheless, these data illustrate
the large range of 226Ra concentrations measured in domestic drinking
waters available from wells, surface waters, springs, and as commercial
bottled water.
The groundwater system of central Florida is composed of two
aquifers separated by a central matrix unit of clay, sand, and phosphate
rock. The shallow water table aquifer is made up of springs, wetlands,
lakes, streams, and surface runoff; it is located above the central unit
and is unconfined (USEPA, 1978). The central matrix not only contains
the commercial phosphate ores of the region (i.e., the Bone Valley
formation), but also serves as an aquiclude preventing upward movement
of the underlying Floridan aquifer (USEPA, 1978). Since the upper
reaches of the Floridan aquifer are in closest contact with the phosphate
mineralization, these waters should contain higher concentrations of
226Ra than the deeper portions of the aquifer. Such appears to be the
case, as verified by the sample results of Kaufman and Bliss (1977) for
the Upper and Lower Floridan Aquifer (Table 2).
Several conclusions may be drawn from evaluation of the data
presented in Tables 1 and 2:
(1) Very few studies have correlated their results with the
phosphate-bearing status of the aquifer being sampled
(i.e., unmineralized vs. mineralized and unmined or
mined). Thus, only the findings of Kaufman and Bliss

4

Table 2. Radium-226 in public and private supplies of potable water in Florida
Source of drinking water Activity (pCi/L)
Average Range Distribution Reference
Municipal wells
Central Florida
Arcadia Auburndale Avon Park Bartow Bowling Green Clermont Dade City Dundee Haines City Lake Alfred Lakeland Lake Wales Wedula Rec. Center Mulberry Plant City Hinter Haven Zephyr Hills
Drilled wells
Central Florida (1=105)
Private wells
Central Florida (Y=OO)
Surface waters
Central Florida Apalachicola River
110 km upstream from mouth Suwanee River
38 km upstream from mouth
0.06
0.95
2.5-3.3 0.50-0.53 0.98 1.4-1.6 2.7 0.29-0.39 0 0 0.73-0.74 1.8-4.1 0.80-0.84 0.47-0.76 0.23 0.45 0.0-0.77 0.58-0.67 0.31
~4.6~ 9oxa c2.4 75% Cl.2 50% co.5 25% O-O-76 100%
q4.6 c3.9 Cl.4 q0.5 0.0-76
90% Irwin and Hutchinson, 1976 75% Irwin and Yutchinson, 1976 50% Irwin and Hutchinson, I976 25% Irwin and Yutchinson, 1976
100% Irwin and Hutchinson, 1976
Irwin and Hutchinson. 1976 Irwin and Yutchinson; 1976 Irwin and Hutchinson. 1976 Irwin and Yutchinson, 1976 Irwin and Hutchinson, 1976 Irwin and Yutchinson, 1975 Irwin and Hutchinson, 1976 Irwin and Yutchinson, 1975 Irwin and Yutchinson, 1976 Irwin and Yutchinson, 1975 Irwin and Hutchinson, 1976 Irwin and Yutchinson, 1975 Irwin and Yutchinson, lQ?fi Irwin and Yutchinson, 1976 Irwin and Hutchinson, 1975 Irwin and Yutchinson, 1975 Irwin and Yutchinson, 1976
Irwin and Yutchinson, 1976 Irwin and Wtchlnson, 1975 Irwin and Yutchinson, 1976 Irwin and Hutchinson, 1976 Irwin and Yutchinson, 1976
Fanning, nreland, and Rryne, I982
Fanning, et-eland, and Rryne, 19X2

ln

(1977) permit a comparison of the effects of phosphate
mining on 226Ra in groundwater (Table 2). The surface
water effects of potential discharge from a phosphate
fertilizer plant may be partly considered from the sample
survey performed by Strain, Watson, and Fong (1979) in
eastern North Carolina (Table 1). Downstream concentra-
tions of 226Ra were roughly twice that of upstream;
however, the maximum was still less than 0.5 pCi/L.
(2) Available data indicate that phosphate mining does not
significantly alter the 226Ra content of the Floridan
aquifer (Kaufman and Bliss, 1977). However, surface
water in mined areas contains 226 Ra in quantities approxi-
mately three times that of surface water in unmined areas
(i.e., 0.55 vs. 0.17 pCi/L).
_(3) The 226Ra content of the upper Floridan aquifer in
unmineralized regions of central Florida (X = 5.1 pCi/L)
may exceed that of the same aquifer in phosphate-bearing
regions. This value is slightly greater than EPA's cur-
rent National Interim Primary Drinking Water Regulations,
which limit the combined 226Ra and 228Ra content of potable
waters to 5 pCi/L (Mills, Ellett, and Sullivan, 1980).
(4) Excepting the mean value noted in (3) above, the 226Ra
content of all municipal, drilled and private wells, and
surface waters in central Florida is comparable to that
found in many other regions of the U.S. that do not possess
phosphate deposits (Tables 1 and 2). The highest values

8
identified in this summary were geothermal wells in both
California (1500 pCi/L) and Utah (300 pCi/L), mineral
springs in New York (430 Ci/L), and shallow wells in
eastern North Carolina (150 pCi/L).
2.2 ESTIMATED INGESTION EXPOSURE AND DOSE
Human adults are assumed to ingest between 1 and 2 L of water
each day in the form of drinking water, beverages, and cooking water
(Fletcher and Dotson, 1971; USNRC, 1977). For the present assessment,
the upper level assumption of 2 L/day, or 730 L/y, was chosen. Annual
drinking water exposure to 226Ra was estimated from the concentrations
summarized in Tables 1 and 2 for central Florida as well as example
U.S. regions. The resulting exposures were converted to 50-year dose
commitments to target organs upon multiplying annual intake by current
ingestion dose commitment factors for 226Ra (Dunning et al., 1979).
Exposure and dose estimates are presented in Table 3.
3. UPTAKE OF RADIUM-226 BY EDIBLE CROPS
3.1 SOURCES
The relative importance of soil and air as sources of 226Ra in
edible crops will depend on the conditions of environmental contamina-
tion and the types of crops considered. For naturally occurring 226Ra,
it seems likely that uptake by roots and translocation to edible por-
tions of the plant is the primary contamination pathway, with resuspen-
sion being the largest aerosol source. However, in areas directly

Table 3. Estimated exposure and 50-year dose commitment for one year's exposure to radium-226 in drinkino water
Estimated dose (rem) Source of drinking water Annual exposure
(uCi) Bone Lung Liver Kidnev Ihole hodv
Central Florida
Municipal wells (range)
Drilled and private wells (range)
(90% of total sampled)
0 - 3E-3 0 - 1.3E-1
0 - 5.5E-2 0 - Z.iE+O 3.4E-3 1.5E-1
0 - 1,5E-3
0 - 3,OE-2 ?.OE-3
0 - 1.8E-3
0 - 3.m?-2 ?.!lE-3
n - 1.957
') - 3.V-? 2.v-7
n - l.l-lE-2
n- l.QF-1 l.nc-?
Surface waters (range) (mean)
Unnineralized
Upper Floridan (mean) Lower Floridan (mean)
Mineralized, unmined
Surface water (mean) Upper Floridan (mean) Lower Floridan (mean)
Mineralized, mined
Surface water (mean) Upper Floridan (mean) Lower Floridan (mean)
United States
1.5E-1 - 1.5E+O 2.OE-3 - 2.OE-2 2.OE-3 - 2.X-2 2.1-E-3 - ','.'-I?-" 5.1E-4 - 5.1F--J 3.OE-2 4.OE-4 4.OF-4 A.W-A ?.Y-7
1.5E-4 - 1.5E-3 6.7E-4
3.7E-3 1.6E-1 2.2E-3 3.2E-3 2.X-7 l.T-7 l.OE-3 4.OE-2 6.X-4 6.OC-4 ci.W-4 ?.AF-7
1.2E-4 l.OE-2 : 7.2E-5 7.X-5 7.?F-5 4.1~4 1.7E-3 7.OE-2 l.DE-3 l.DE-3 l.‘)F-7 I.57 1.5E-3 6.DE-2 9.OE-4 9.OE-4 9.nE-4 l.nE-3
4.OE-4 Z.OE-2 2.4E-4 2,4E-4 ?,4F-4 l.AF-2 1.2E-3 5.OE-2 7.2E-4 7.?F-4 7.y-4 4.lC-3 1.4E-3 6.9E-2 8.4E-4 S.4E-4 9.4E-4 A,F-7
klunicipal wells (range)
Other public water supplies (range)
Geothermal wells/springs
6.6E-5 - l.OE-2
2.9E-5 - 2.6E-2
7.3E-6 - l.OE+O
2.8E-3 - 4.3E-1 4.OE-5 - 6.nE-2 4.w5 - km-2 4.nE-5 - 6.w? ?,?E-4 - 7,nF-2
1.2E-3 - l.lE+O 1.7E-5 - 2.DE-2 1.7E-5 - 2.w2 1.7E-5 - 7.E-? Q.9F-5 - 9,4?-3
3.3E-4 - 4.3E+l 4.5E-6 - 6.OE-1 4.5E-6 - r;.'-F-1 4.5E-6 - e.nr-1 7.r;=-5 - 7,aF+n

10
downwind of anthropogenic 226 Ra sources, aerosol deposition may become
the most significant source of 226 Ra in edible crops, especially in
leafy vegetables or forage crops.
The uptake of 226Ra from soil by plant roots is influenced by
soil type, as well as by factors such as soil pH, content of other
alkaline-earth elements in the soil, clay content, exchangeable calcium
and potassium, plant species, and chemical form of 226Ra in soil
(Grzybowska, 1974; Garner, 1971; Rusanova, 1964; Verkhovskaja, Vavilov,
and Maslov, 1966; Kirchmann, Boulenger, and LaFontaine, 1968; Nishita,
Wallace, and Romney, 1978). Numerous studies have been performed to
investigate the behavior of 226Ra in the soil-plant system and its
incorporation into plant tissues from nutrient solutions. However,
experiments quantifying uptake from nutrient solutions are less useful
for our purposes, since retention of 226Ra by soil particles and its
interaction with soil components are important properties in determining
transfer efficiencies (Grzybowska, 1974; Garner, 1971; Verkhovskaja,
Vavilov, and Maslov, 1966; Rusanova, 1964; Taskayev et al., 1977).
The mobility of 226Ra within plant tissues appears to be high during
transport from root to shoot, but low after deposition within leaf
tissues, resulting in an acropetal concentration gradient. A potential
for uptake by animals feeding
(Taskayev et al., 1977; Vavilo
of translocation to other non
been well documented.
on forage or leafy vegetables exists
v, Popova, and Kodaneva, 1964). Dynamics
leafy edible portions of plants has not

11
3.2 CONCENTRATION FACTORS
Transfer to edible portions of vegetation may be characterized by
the soil-plant concentration factor (CFsp), the unitless ratio of fresh
weight specific activity in plants to dry weight specific activity in
soil at harvest or equilibrium.
Since naturally occurring 226Ra originates in soil, the question of
direct foliar uptake has generally been neglected in studies of radium
translocation in agricultural crops. It is known that 17 to 79% of
total radium activity measured in air-cleaned samples of native grasses
and shrubs collected near inactive uranium mill sites in New Mexico is
due to surficial contamination (Marple, 1980). Thus is is reasonable to
assume that deposition of 226Ra-containing aerosols or resuspended soils
containing 226Ra could be an important consideration for some crops in
certain areas. Therefore, the CFsp's describing soil-plant transfer and
presented here may overestimate the actual ratio if deposition of aerosol
radium was a significant source of total plant radium at a given study
site.
We have chosen to provide estimates of unweighted averages and
ranges of CF's as calculated from existing literature available for
edible crops. These are presented for vegetables, fruit, grain, forage,
feed, and hay (Table 4). In all likelihood, CF's are lognormally distri-
buted (Ng, 1982), and a geometric mean of the measured values would be
the most accurate estimate. Nevertheless, the arithmetic average will
be the most conservative value.

Table 4. Concentration factors representing soil-to-plant transfer of **'Ra (CFsp)'*b
Edible plant portion Mean concentratEon Number of
factors (CF ) derived Range
(*lo-2)sp (x10-q Reference
values
Vegetables (fresh weight)
Beet Cabbage
Carrot Potato
Unspecifiedd
Unweighted average
Fruit (fresh weight)
Orange Grapefruit Unspecifiede
Unweighted average
Grain (fresh weight)
Barley Buckwheat Millet Peanuts Rice Wheat
3.7 2 1.4-6.0 130
Kirchmann, Boulenger, and LaFontaine, 1968 130 Mordberg et al., 1976
40 : Mordberg et al., 1976 4.1 3 29.5 EERF, personal communication
100 24 48-175 Adriano, McLeod, and Ciravnlo, 1981 100 1 100 Mordberg et al., 1976
Unweighted average
Forage, hay (dry weight)
63 ‘32 1.4-178
_A _ , . 1 . , .‘
Ng;;a hay 7.0 24 1.0-34 Grzybowska, 1974 21 6 1.1-48 Kirchmann, Boulenger, and LaFontaine, 1968;
Taskayev et al., 1977; Rusanova, 1964 Fescue 2.8 2.8 Taskayev et al., 1977 Grass indian ricegrass
13 2; 2.0-63 Grzybowska, 1974, 1.5 1 1.5 Rajno, Momenf, and Sabau. 1980
Mixed grasses 17 :47
3.5-28 Ibrahim, Flot, and Whicker, 1982 Rye grass 24 2.0-62 Kirchmann, Boulenger, and LaFontaine, 1968;
Taskayev et al., 1977 Timothy hay 1 Wetch hay 1 ::;’
Taskayev et al., 1977 Taskayev et al., 1977
Unweighted average 10.0 103 1.0-63
aAerosol radium-226 was assumed to contribute‘insigniticant amounts of radium-226 to the plant. b Table adapted from McDowell-Boyer, Watson, and Travis, 1980.
>,
::6” 5 2 <O.!ll-4.0 0.6-3.0
i:: 2 3 0.07-13.6 1.0-3.0
0.1 1 0.1
1.2 13 CO.Ol-4.0
E 4 0.3-1.1 a:05 1 0.2
1 0.05 ,, .
0.3 6 0.05-1.1
Kirchmann, Boulenger, and LaFontaine, 1968 Kirchmann, Boulenger, and LaFootaine, 196R; Vavilov, Popova, and Kodaneva, 1964 Kirchmann. Boulenger, and LaFontaine, 1968 Kirchmann, Boulenger, and LaFontaine. 1968 Vavilov, Popova, and Kodaneva, 1964 DeBortoli and Gaglione, 1972
EERF, personal ccmmunication EEQF, personal communication 9eBortoTi and,Gaglione, 1972
'Values express ratios of fresh-weight radium-226 concentrations in plants to dry-weight concentrations in soil for all food crops directly edible by man. Dry-weight concentrations in both plants and soil were used for forage, hay, and feed calculations.
d Sample consisted of tomatoes, beans, lettuce and small pumpkins in equal amounts.
eSample consisted of peaches, pears, apples, plums, and grapes in equal amounts,
12

13
The CFsp
's are given in dry weight concentrations for forage, hay
and feed; and in fresh weight concentrations for vegetables, fruits
and grains (i.e., moisture content as normally consumed). When neces-
sary, conversion of literature data to fresh or dry weight was made
with the use of information supplied in the text of each paper cited
or by standard conversions documented in Spector (1956). Both the
unweighted arithmetic average of mean CFsp
's and range of individual
values are given for each food category. The ranges indicate that
much uncertainty is involved in determining a single value for CF;
much of this uncertainty is probably due to the variability in experi-
mental, conditions among the studies cited as well as the wide range of
soil, climatic, and nutritional conditions evaluated.
Values presented in Table 4 indicate that grains tend to concentrate
226Ra when compared to vegetables and fruit. The actual fraction of
total grain 226Ra present in the hull versus that present within the
kernel is not known; most of the available studies do not mention
whether analyses were performed on whole or de-hulled grain. The one
study that described grain processing stated that "no attempt was made
to dehull" (Adriano, McLeod and Ciravolo, 1981). This is probably
true for the majority of grain analyses. A single CF value availablespfor flour equals 0.5 (DeBortoli and Gaglione, 1972), which further
supports the assumption that the values in Table 4 are for whole grain.
The unweighted mean CFsp for 226 Ra transfer to grain is 0.63.
The averages for fruit CFsp 's are based on a very small number of
samples, most of which originated in a limited field study performed
for the U. S. Environmental Protection Agency (EPA) by staff of the

14
Eastern Environmental Radiation Facility (EERF, 1978, personal communi-
cation) at various study sites in southwestern Florida. An estimate
of dietary exposure and dose from potential consumption of oranges and
grapefruit sampled in the EERF study will be included in Sect. 5.2.
The results of the current review suggest that the unweighted mean
CFsp for 226Ra transfer to fruits (3.0 x 10⁻³) is reasonable for assess-
ment purposes.
For forage and hay, an average dry weight CF of 1.0 x 10⁻¹sp
was
estimated. The value for forage, hay, and feed expressed in dry weight
is most useful since herbivore ingestion studies seldom consider fresh
weights. Observation of the wide range of values of CFsp's derived
from the literature suggests that experimental conditions can greatly
influence the value calculated for a particular forage species. Only
one forage study, cited in Table 4, involved vegetation grown in
naturally contaminated environments (Rusanova, 1964).
From this review, specific values of CF sp for soil to plant transfer
of 226Ra are recommended for use in environmental transport assessments
where the food category is known (i.e., fruit, grain, etc.). A previously
recommended generic value for this parameter, labeled Biv by the U. S.
Nuclear Regulatory Commission in its Regulatory Guide 1.109 (USNRC,
1977), is 3.1 x 10⁻⁴. This generic estimate does not distinguish
between forage or other crops but is useful as a default value., Ng
(1982) recommended separate values for different commodities and pointed
out the extreme variability in values available for soil-plant CF
estimates (i.e., range extends from 10-5 to 10-l).

15
4. RADIUM-226 IN MEAT AND MILK
The most common pathways by which 226Ra may be potentially trans-
ferred to milk and animal muscle used for human consumption are via
(1) fugitive dust deposition onto surfaces of forage plants, and (2) root
uptake from soils and eventual translocation to plant parts consumed
as forage or feed supplements. The transfer of any element from feed
to meat or milk by these means can be predicted with the use of various
parameters derived from experimental feeding studies or field measure-
ments. The concentration factor (CF) parameter is one, and is defined
as an expression of the equilibrium concentration of the element in
milk or meat as a fraction of the chronically ingested concentration
in feed. Specifically, CFm is the unitless ratio of activity concentra-
tion in milk (fresh weight) to the activity concentration in the dairy
animal's diet (dry weight); CFf represents the same ratio for meat
(beef in our analysis). As stated in Sect. 3.2, CF's are probably
lognormally distributed. However, only the conservative arithmetic
mean will be derived in the present analysis.
The number of sources documenting trophic transfer of 226Ra from
feed to animal products is small. Despite the availability of numerous
publications presenting the 226Ra content of milk and meat products
from market basket surveys (Morse and Welford, 1971; Fisenne and Keller,
1970; Hallden, Fisenne, and Harley, 1963; Hallden and Harley, 1964;
Muth et al., 1960; Wu and Weng, 1977), most of the literature does not
contain the necessary information on 226Ra concentration in the feed
of livestock from which the products were obtained. As a result, many

16
available sources were considered inadequate for
present analysis.
inclusion in the
4.1 DISTRIBUTION IN MILK
A few attempts have been made to measure the concentration of
radium isotopes in milk resulting from their ingestion by dairy cattle
(Table 5). A biological half-time of 50 hours for radium elimination
via milk has been estimated from monitoring data on two dairy cows
exposed to single oral administrations of 5 mCi 224Ra (Sansom, Garner,
and West, 1966). It may be estimated that 93% of the total 224Ra
elimination via milk (0.35% of the total administered 224Ra) occurred
during the eight days following acute administration. At that time,
sampling was discontinued. The major fate of ingested 224Ra was fecal
excretion (99%). The average diet-to-milk CFm is estimated to equal
3.7 x 10⁻³ (range of 3.1 to 4.4 x 10⁻³ reported by Sansom, Garner, and
West, 1966) in Table 5, although the isotope was not technically
administered in feed.
Kirchmann and his colleagues consider forage ingestion to be a
major source of radium excreted in milk (Kirchmann et al., 1972).
Analysis of data obtained by these investigators from individual animals
exposed to either drinking water containing 226RaC12 or hay harvested
from industrially contaminated pastures indicates that forage only
slightly exceeds drinking water as a source of radium in milk. Similar
results have been observed for another alkaline-earth element, 85Sr
(Van den Hoek et al., 1969). Equilibrium estimates of CFm from the
hay ingestion experiment are also presented in Table 5.

Table 5. Concentration factors (CF,,,)a for 226 Ra ingested by dairy animals
and transferred to milk
Radium source
Vean CFm
milk; diet
(x1o-3)
Number of derived values
Reference
Oral administration of 5 mci'radium-224; Britain 3.7 2 Sansom, Garner and blest, 1966
Radium from industrial emissions incorporated into forage; Belgium 8.4 4 Kirchmann et al., 1972
Natural radium-226 in native upland meadows; central Yugoslavia 14.0 7 MiloS'evii et al., 1980
Dairy farms on or adjacent to reclaimed phosphate land, Polk County, Florida 0.71 1 EERF, 1978 (personal
0.79 2 communication)
Unweighted avg. CFm 5.5
aCF defined as equilibrium ratio of specific activity in milk (fresh wt) to specific activity"in diet (dry wt).
18
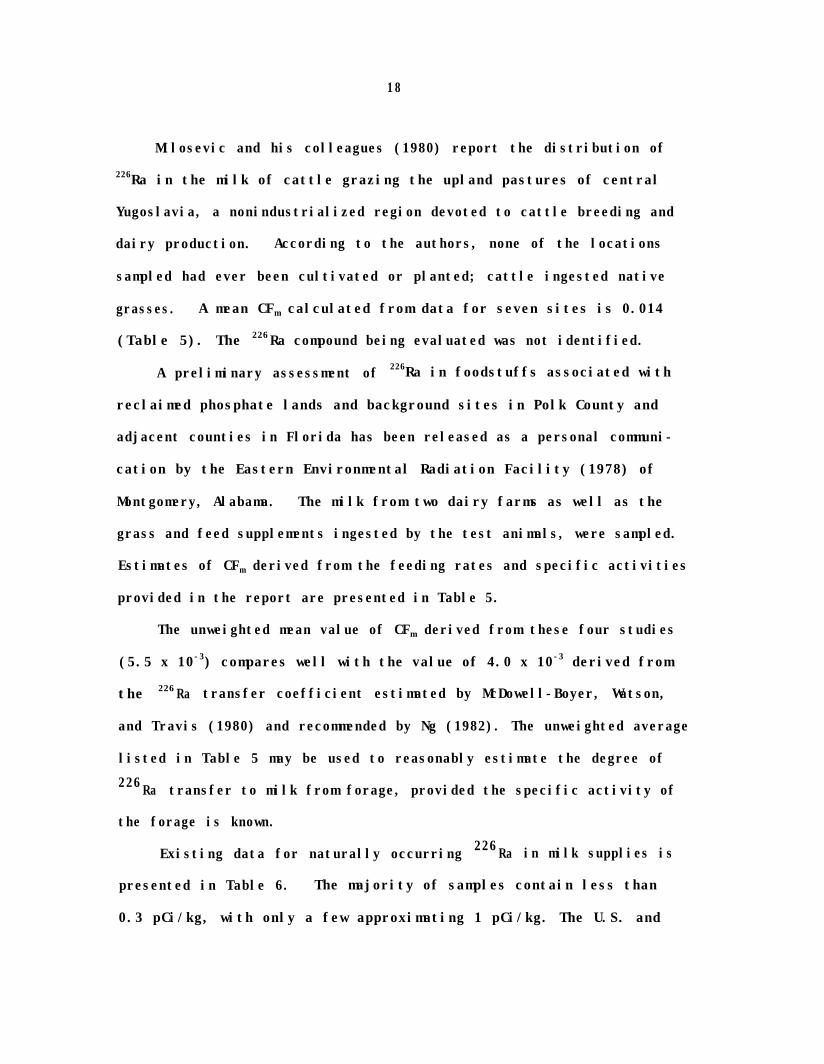
Milosevic and his colleagues (1980) report the distribution of
226Ra in the milk of cattle grazing the upland pastures of central
Yugoslavia, a nonindustrialized region devoted to cattle breeding and
dairy production. According to the authors, none of the locations
sampled had ever been cultivated or planted; cattle ingested native
grasses. A mean CFm calculated from data for seven sites is 0.014
(Table 5). The 226Ra compound being evaluated was not identified.
A preliminary assessment of 226Ra in foodstuffs associated with
reclaimed phosphate lands and background sites in Polk County and
adjacent counties in Florida has been released as a personal communi-
cation by the Eastern Environmental Radiation Facility (1978) of
Montgomery, Alabama. The milk from two dairy farms as well as the
grass and feed supplements ingested by the test animals, were sampled.
Estimates of CFm derived from the feeding rates and specific activities
provided in the report are presented in Table 5.
The unweighted mean value of CFm derived from these four studies
(5.5 x 10⁻³) compares well with the value of 4.0 x 10⁻³ derived from
the 226Ra transfer coefficient estimated by McDowell-Boyer, Watson,
and Travis (1980) and recommended by Ng (1982). The unweighted average
listed in Table 5 may be used to reasonably estimate the degree of
226Ra transfer to milk from forage, provided the specific activity of
the forage is known.
Existing data for naturally occurring 226Ra in milk supplies is
presented in Table 6. The majority of samples contain less than
0.3 pCi/kg, with only a few approximating 1 pCi/kg. The U.S. and
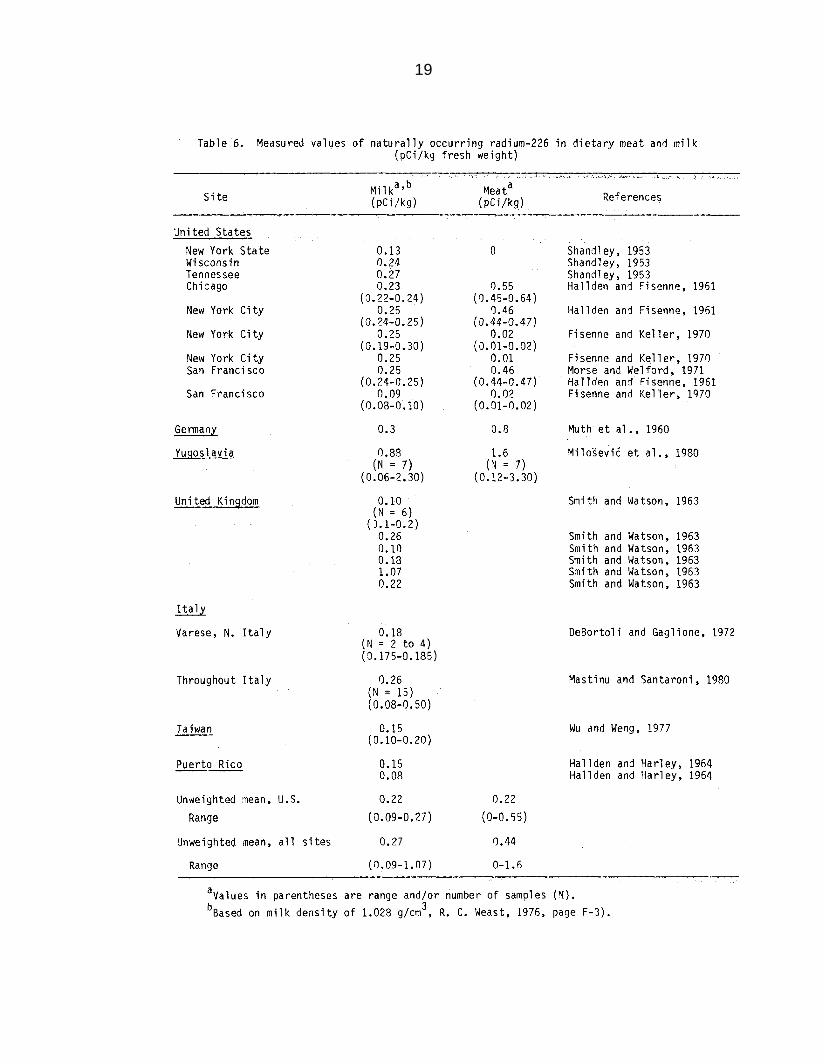
Table 6. Measured values of naturally occurring radium-226 in dietary meat and milk (pCi/kg fresh weight)
Site
: . . .._ ., . z 1 ",, . _, ,j .~ , Milka,b '-- ".Meata _ "'.' '
(pCi/kg) (pCi/kg) References
---
United States
New York State Wisconsin Tennessee Chicago
New York City
New York City
New York City San Francisco
0.13 0.24 0.27 0.23
(0.24-0.25) 0.09
(0.08-0.10) San Francisco
Germany 0.3
Yuqoslavia 0.88 (N = 7)
(0.06-2.30)
United Kingdom 0.10 (N = 6)
Yl%**) 0:10 0.18 1.07 0.22
Italy
Varese, N. Italy 0.18 (N = 2 to 4) (0.175-0.185)
Throughout Italy 0.26 (N = 15) (0.08-0.50)
Taiwan 0.15 (0.10-0.20)
Puerto Rico -- 0.15 0.08
Unweighted mean, U.S. 0.22 0.22
Range (0.09-0.27) (O-0.55)
Unweighted eean, all sites 0.27 0.44
Range (0,09-1.07) O-l.6
0
0.01 0.46
Shandley, 1953 Shandley, 1953 Shandley, 1953 Hallden and Fisenne, 1961
Hallden and Fisenne, 1961
Fisennc and Keller, 1970
Fisenne and Keller, 1970 Morse and Welford, 1971 Hallden and Fisenne, 1961 Fisenne and Keller, 1970
Muth et al., 1960
MiloZeviS et al., 1980
Smith and Watson, 1963
Smith and Watson, 1963 Smith and Watson, 1963 Smith and Watson, 1963 Smith and Watson, 1963 Smith and Watson, 1963
DeBortoli and Gaglione, 1972
Mastinu and Santaroni, 1980
Wu and Weng, 1977
Hallden and Harley, 1964 Hallden and Harley, 1964
aValues in parentheses are range and/or number of samples (Y). b
Based on milk density of 1.028 g/cm3, R. C. Weast, 1976, page F-3).
19

20
global means derived from these literature values are very similar,
i.e., 0.22 and 0.27 pCi/kg, respectively.
The average 226Ra content of three milk samples collected from
two dairies on or adjacent to reclaimed phosphate lands in Polk County,
Florida, was 2.51 pCi/kg (range of 1.43 to 3.85 pCi/kg) (EERF, 1978,
personal communication), or approximately 1 order of magnitude greater
than the U.S. and global means presented in Table 6. Milk samples
were not collected from reference areas on unmined or nonphosphate
lands, so no comparison with normal background levels in the same
region can be made. If it is assumed that the average adult milk
consumption is 110 kg/y (USNRC, 1977) and that the target adult would
exclusively consume milk of the same specific activity as the two
Florida dairies sampled, then the average annual exposure from milk
consumption would be 276 pCi. Using the dose conversion factors of
Dunning et al. (1979), this exposure would translate into a 50-year
dose commitment factor for bone, lung, liver, kidney, and whole body
of 1.2 x 10⁻², 1.7 x 10⁻⁴, 1.7 x 10⁻⁴, 1.7 x 10⁻⁴, and 9.4 x 10⁻⁴ rem,
respectively. Those individuals ingesting milk of 226Ra specific
activities equal to the U.S. or global mean presented in Table 6 would
receive estimated doses of approximately 1 order of magnitude lower
than those derived above.
4.2 DISTRIBUTION IN MEAT
Holtzman and his colleagues have recently examined human food
chain samples collected from rangeland areas surrounding tailings
piles created by milling and processing uranium ore (Holtzman et al.,

21
1979). Radium-226 concentrations in the stomach contents and muscle
of two cattle grazing in a reference area located 20 km from uranium
tailings piles were used to derive the average CFf of 6.5 x 10⁻³
presented in Table 7. The mean value for cattle grazing in the unpol-
luted mountain meadows of central Yugoslavia was derived from the
previously described study by Milosevic et al. (1980).
Data collected from caribou and reindeer populations have been
included in the assessment of forage-to-meat transfer for two reasons:
(1) the paucity of information regarding cattle ingestion of 226Ra,
and (2) caribou, reindeer, and cattle all possess similar digestive
systems (i.e., they are all ruminants). Most of the pertinent caribou
and reindeer information addresses incidental radionuclide uptake via
grazing on Cladonia lichens in Alaska and Finland (Holtzman, 1966a, b).
Due to their slow growth habit and large surface-to-volume ratio,
lichens accumulate dust particles containing significant quantities of
the naturally occurring isotope 226Ra, Because data characterizing
the radium concentration of rumen contents was unavailable, an alternate
method of estimating the concentration factor to these ruminants (CFr)
was developed. Although it is known that caribou and reindeer freely
ingest annual grasses, sedges, and horsetails during the short Arctic
summer, the present calculation conservatively assumes lichen ingestion
as the principal source of forage. Annual mean values of lichen 226Ra
activity in Alaska and Finland were used to compute the caribou CFr of
4.7 x 10⁻³ and the reindeer CFr of 8.6 x l0-3 (Table 7) (Holtzman,
1966a, b). It must be noted that Holtzman's data represent a special
case.

Table 7. Concentration factors (CF, and CFf) for radium-226 ingested by cattle and other
ruminants and transferred to meat
Animal Radium source Mean CFf, CFra No. of
( x1o-3) derived Reference values
Cattle Uncontaminated pasture; 7.4 5 MiloS'evic' et al., 1980 central Yugoslavia
Cattle Reference area 20 km 6.5 2 Haltzman et al., 1979 from uranium ore tailings piles; range- land in New Mexico
Other ruminants
Caribou Lichens contaminated with naturally occurring radium-226
Reindeer Lichens contaminated with naturally occurring radium-226
Mean for ruminants other than cattle
4.7 12 Holtzman, 1966a, b
8.6
6.7
Mean for all ruminants 6.8
1 Holtzman, 1966a, b
aCFr is concentration factor for ruminants; CF is defined as equilibrium ratio of activity in meat
(fresh wt) to specific activity in diet (dry wt).

23
Radium-226 is a known bone-seeker due to its metabolic similarity
to calcium; the greatest body burden of an animal ingesting 226Ra would
be in the skeleton (Hardy et al., 1969). Thus, the human populations
potentially exposed to the highest concentrations in animal tissue
would be those who ingest significant quantities of bone meal. The
transfer of 226Ra from bone to soup broth or bouillon is unknown; it
is known that such transfer for the daughter products 210Pb and 2l0Po
can be equal to a maximum of 1.0% and 13.8%, respectively (Milosevic
et al., 1980).
The average transfer value estimated for all ruminants (CFf =
6.8 x 10⁻³; Table 7) is in close agreement with the value of 5.1 x 10⁻³
previously recommended by (McDowell-Boyer, Watson, and Travis, 1979;
Ng, 1982).
Although no measurements of 226Ra uptake in beef were made in the
previously described Polk County study (EERF, 1978, personal communi-
cation), an estimate of beef specific activity (26.5 pCi/kg) was made
from the mean CFf above and the measured values of226Ra in grass
ingested by dairy cattle. If it is assumed that all beef consumed has
been produced by animal s ingesting grass of the same activity measured
by the EERF, and that every adult consumes the average quantities of
beef estimated by the U.S. Department of Agriculture (32 kg/y) (USDA,
1977), then the average adult exposure would equal 848.2 pCi. Again
using the conversion factors of Dunning et al. (1979), this exposure
translates to an individual 50-year dose commitment factor for bone,
lung, liver, kidney, and whole body of 3.6 x l0-2, 5.0 x 10⁻⁴,
5.0 x 10⁻⁴, 5.0 x 10⁻⁴, and 2.9 x 10⁻³ rem, respectively. Similar

24
exposure to the average U.S. beef specific activity of 0.22 pCi/kg
226Ra (Table 6) would result in exposure and dose approximately 2 orders
of magnitude lower than that estimated above.
5. TOTAL DIETARY INTAKE OF RADIUM-226
5.1 CONSUMPTION OF FOODSTUFFS
Several investigators have attempted to estimate daily intake of
226 Ra from total diet samples containing naturally occurring radium
(Morse and Welford, 1971; Fisenne and Keller, 1970). Other investi-
gators have reported 226Ra in a limited number of food items and esti-
mated intake for a diet composed of those items alone (Mastinu and
Santaroni, 1980; Lalit and Ramachandan, 1980; DeBortoli and Gaglione,
1972; Oakes et al., 1977; and EERF, 1978, personal communication).
Problems in comparing results from these various studies arise from
differences in daily intake of individual food items and variability
in total intake. As an illustration, Table 8 lists reported intake
rates for various food items, as well as values recommended by the
USNRC (1977) for the maximum and average individual.
The Oakes et al. (1977) study investigated fruits and vegetables
only, which represent 14.3% of the total southeastern U. S. diet on a
kg/y basis. Statistics for consumption in the Southeast were provided
by the U. S, Department of Agriculture (USDA). Total intake for persons
ingesting the Oakes et al. (1977) diet is approximately 675 kg/y,
midway between the values recommended by the USNRC. Morse and Welford
(1971) as well as Fisenne and Keller (1970) report a total annual

Table 8. Annual intake of foodstuffs (kg/y) as reported by various authors
aUSNRC Reg. Guide 1.109.bOakes et al., 1977. Only fruits and vegetables were considered; total intake of these
food items is estimated to be 14.3% by weight of the total annual intake.cFisenne and Keller, 1970; Morse and Welford, 1971.d DeBortoli and Gaglione, 1972. A survey of a sample diet representing 61% of the total
annual intake.eLalit and Ramachandran, 1980.fEERF, 1978 (personal communication). Intake values are listed for maximum and average
individual. Food categories such as grain, poultry, and fish are ignored.

26
intake of 637 kg, based on numbers available from USDA. This latter
intake estimate is similar to that of Oakes et al. (1977), although
much higher in the fruit, vegetable, and potato categories. The
DeBortoli and Gaglione (1972) study measured the 226Ra content of
commodities representing 61% of 497 kg/y total intake (excluding wine
and water). Only a few grains, and no meat were considered. Lalit
and Ramachandran (1980), reporting on a 5-year study in India, discuss
a diet of only 196 kg/y, which they consider to be representative of
the normal Indian diet.
The U. S. Environmental Protection Agency, Office of Radiation
Programs report (EERF, 1978, personal communication) presents a diet for
maximum and average individuals (Table 8) based on local food intake
in southwestern Florida. These values represent only 65% and 56%
of the respective USNRC maximum and average individual dietary intake.
The EERF did not include shellfish, poultry, eggs, grains or juices in
their analyses.
5.2 INGESTION RATES OF RADIUM-226
In spite of the wide variability in total intake of foodstuffs as
reported in the above studies, and with that variability in mind, it
is helpful to list the range of estimates for daily dietary intake of
226Ra. Table 9 summarizes reported data from literature evaluating
total dietary intake of naturally occurring 226Ra .
The studies by Morse and Welford (1971), Fisenne and Keller (1970),
and Oakes et al. (1977) were based on "market basket" surveys-in which
selected food items were purchased at local commercial supermarkets.

27
Table 9. Daily intake of naturally occurring radium-226 in the adult diet
aThis estimate includes a contribution from both milk and, water.b This estimate includes solid foods, but not milk or drinking water.cThis estimate includes a contribution from milk, but not from
drinking water.d This estimate is for fruits and vegetables only.

28
Food items studied by DeBortoli and Gaglione (1972) and Lalit and
Ramachandran (1980) were grown locally, and assumed to be in a zone of
natural radioactivity. Crops analyzed in Florida by the EERF (personal
communication) were grown locally under varying conditions of phosphate
exposure. However, only those grown under background conditions are
summarized in Table 9.
Mastinu and Santaroni (1980) studied various foods, milk, and
mineral waters in Italy, although the dietary composition was not
reported. Daily estimates for total 226Ra intake equalled 0.3-2 pCi for
adults (Table 9), 0.3-0.9 pCi for teenagers, and 1.2-5.9 pCi for one-
year-old children (l-month: 0.7-2.2 pCi; 3-month: 0.17-3.2 pCi; 6-month:
0.7-4.5 pCi). Natural levels of 226Ra in another Italian diet were
analyzed by DeBortoli and Gaglione (1972). Adults consuming foods of
local origin were estimated to ingest 1.4 pCi/d (Table 9). This esti-
mate includes a 24% contribution from milk, wine and water (estimated
intake from solid foods only was 1.1 pCi/d).
Lalit and Ramachandran (1980) reported the results of a study
measuring the concentration of 226Ra in some foodstuffs forming the
principal ingredients of a standard Indian diet. Measurements were
made over a 5-year period (1970-1974). Total average daily intake of
226 Ra for the period 1970-1974 was 3.8 pCi/d, based on a daily intake
of 410 g/d (150 kg/y) of solids (Table 8). The greatest 225Ra intake
rate recorded in Table 8 (3.8 pCi/d) results from ingestion of this
minimal diet as a result of the high specific activities found in the
principal dietary components rice, wheat, potatoes and "pulses" (peas

29
and beans). Radium-226 concentrations in milk were not analyzed, and
the estimate above does not include intake via milk or water.
Morse and Welford (1971) sampled and measured the specific activity
of 226Ra in 19 categories of food in a New York City diet. A daily
226Ra intake of 1.6 pCi (Table 9) was estimated, and included milk but
not drinking water. Fisenne and Keller (1970) also studied New York
City foodstuffs, as well as those in San Francisco; daily intake of
1.7 pCi and 0.8 pCi were reported for the two cities, respectively
(Table 9). This estimate includes milk, but not tap water.
The southwestern Florida study of the EERF (1978, personal communi-
cation) determined 226 Ra specific activities in a limited number of
food samples. Sampled fruits and vegetables were grown locally on
three types of soil:
(1) land assumed to be representative of background,
(2) reclaimed land, and
(3) land overlying unmined phosphate deposits.
An adult daily intake of 1.5 pCi/d 226Ra was estimated to result from
ingestion of local fruits and vegetables grown on land representative
of background (Table 9).
Oakes et al. (1977) calculated a total daily intake of 0.94 pCi
(Table 9), based only on a "market basket" survey of fruits and vegeta-
bles collected in Oak Ridge, Tennessee. Results do not distinguish
between locally grown and imported items.
Inspection of the available summary values (Table 9) indicates
that average daily adult intake of226Ra is similar for each region
studied. The adult range is 0.3-3.8 pCi/d.

30
5.3 DOSE ESTIMATE
The total dietary exposure estimated from annual ingestion of
selected food items (Table 9) was converted to 50-year dose commitments
by multiplying exposure and dose conversion factors recommended by
Dunning et al. (1979). These estimates are presented in Table 10.
Based on the limited range of food items sampled to date, the
average adult exposed to background dietary levels in southwest Florida
receives critical organ and whole body doses comparable to those deter-
mined for sites elsewhere in the U. S. and abroad, and less than diets
sampled in India. The average adult exposed to a diet of food items
grown on phosphate reclaimed land is estimated to receive a dose approxi-
mately twice that of background. That is, bone, 5.3E-2 rem; lung,
liver and kidney each 7.3E-4 rem, and whole body, 4.2E-3 rem.
6. RECOMMENDATIONS
During the present evaluation, the authors have identified a
number of
more real
currently
(1)
research areas that should be addressed in order to obtain a
istic quantification of food chain transport of 226Ra than
possible in the absence of site-specific data.
A principal problem area is the lack of experimentation
specifically designed to determine milk and meat trans-
fer coefficients in cattle. Not only should transfer
coefficients for the chemical forms of 226 Ra specific
to background, historical, and current phosphate mining

Table 10. Individual adult 50-year dose commitments for one year's dietary intake of radium-226 (rem) from natural sources"
Target organ Italyb
Data source
ItalyC Indiad New York Citye Yew York Cityf San Franciscof Southwest Fast Florida Tennesseeh
Bone
Lung
Liver
Kidney
Whole Body
4.71E-3 to 3.1E-2 2.2E-2 6.OE-2 2.5E-2 2.7E-2 1.3E-? 2.4F-2 1.5E-?
6.5E-5 to 4.2E-4 3.OE-4 8.2E-4 3.5E-4 3.7E-4 1.7E-4 3.2t-4 7,flE-4
6.5E-5 to 4.2E-4 3.OE-4 8.2E-4 3.5E-4 3.7E-4 1.7E-4 3.?E-4 ?.rlE-4
6.5E-5 to 4.2E-4 3.OE-4 8.2E-4 3.5E-4 3.7E-4 1.7E-4 3.2F-4 P.Qrr-4 CA w
3.7E-4 to 2.5E-3 1.7E-3 4.7E-3 Z.DE-3 2.1E-3 9.9E-4 1.9E-3 l.?F-3
aUsing dose commitment factors developed by Dunning et al., 1979. b Mastinu and Santaroni, 1980.
'DeBortoli and Gaglione, 1972.
dLalit and Ramachandran, 1980.
eMorse and Welford, 1971.
fFisenne and Keller, 1970.
gEERF, 1978, personal communication. h Oakes et al., 1977.

32
areas of southwestern Florida be determined; but releases
from tailings piles should also be simulated as nearly as
possible in feeding studies by offering contaminated feed.
In addition, sufficient numbers of animals should be
investigated to allow statistical comparison of results.
(2) The importance of ingested soil as a source of contamina-
tion for milk and meat has not been critically examined.
Data from feeding studies are needed to determine the
degree of 226 Ra solubilization from ingested mineral
soil in the digestive tract, and the subsequent internal
transport.
(3) Experimental data are needed to distinguish between
the contributions of soil and atmospheric 226Ra to
total plant 226Ra content. Particular attention should
be paid to simulation of field conditions by the use
of 226Ra compounds which may occur in soil or air
naturally, or as a product of mining activities.
(4) There is a lack of experimental data documenting soil-
to-plant transfer of 226Ra to the chief agricultural
produce commodities of the phosphate mining region,
ie., citrus and strawberries. Limited numbers of
samples have been collected for which specific activi-
ties of both the edible portions and local agricultural
soils are known. Sufficient numbers of samples should
be collected to permit statistical comparisons among
background, reclaimed, and unmined soils.

33
REFERENCES
Adriano, D. C., K. W. McLeod, and T. G. Ciravolo, 1981, "Plutonium,curium and other radionuclide uptake by the rice plant from anaturally weathered, contaminated soil," Soil Science 132(1):83-88.
Asikainen, M. and H. Kahlos, 1980, "Natural radioactivity of drinkingwater in Finland," Health Phys. 39:77-83.
Aulenbach, D. B. and R. E. Davis, 1976, "Long-term consumption ofmineral spring water containing natural 226Ra" pp. 154-164 inProceedings Tenth Midyear Topical Symposium of the Health PhysicsSociety, October 11-13, 1976, Saratoga Springs, New York.
Brinck, W. L., R. J. Schliekelman, D. L. Bennett, C. R. Bell, and I. M.Markwood, 1976, "Determination of radium removal efficiencies inwater treatment processes," pp. 370-389 in Proceedings Tenth Mid-year Topical Symposium of the Health Physics Society, October 11-13,1976, Saratoga Springs, New York.
DeBortoli, M. and P. Gaglione, 1972, "Radium-226 in environmentalmaterials and foods," Health Phys. 22(1):43-48.
Dunning, D. E. Jr., S. R. Bernard, P. J. Walsh, G. G. Killough, andJ. C. Pleasant, 1979, Estimates of Internal Dose Equivelents to22 Target Organs for Radionuclides Occurring in Routine Releasesfrom Nuclear Fuel-Cycle Facilities, Vol. II, NUREG/CR-0150,ORNL/NUREG/TM-19O/V2, Oak Ridge National Laboratory, Oak Ridge,Tennessee.
Eastern Environmental Radiation Facility (EERF), personal communication,1978, A Preliminary Assessment of Radiation Doses due to Consump-tion of Food Associated with Phosphate Reclaimed Land and OreByproduct Usage. EERF, P. 0. Box 3009, Montgomery, Alabama 36109.
Fanning, K. A., J. A. Breland III, and R. H. Bryne, 1982, "Radium-226and radon-222 in the coastal waters of West Florida: High concen-trations and atmospheric degassing," Science 215:667-670.
Fisenne I. M. and H. W. Keller, 1970, "Radium-226 in the diet of twoU.S. cities," pp. 12-18 in Health and Safety Laboratory FalloutProgram Quarterly Summary Report, December 1, 1969 to March 1,2970, USAEC Report HASL-224, UC-41, USAEC Health and SafetyLaboratory, National Technical Information Service, Springfield,Virginia.
Fletcher, J. F. and W. L. Dotson, 1971, HERMES: A Digital ComputerCode for Estimating Regional Radiological Effects from the NuclearPower Industry, HEDL-TME-71-168, Hanford Engineering, Hanford,Washington.

34
Garner, R. J., 1971, "Transfer of radioactive materials from the terres-trial environment to animals and man," CRC Critical Reviews inEnvironmental Control 2:337-385.
Guimond, R. J., 1976, "Radiation and the phosphate industry - an over-view," p. 13-28 in Proceedings Tenth Midyear Topical Symposium ofthe Health Physics Society,New York.
October 11-13, 1976, Saratoga Springs,
Grzybowska, D., 1974, "Uptake of 226Ra by plants from contaminatedsoils," Nucleonika 19(1):71-78.
Hallden, N. A. and I. M. Fisenne, 1961, "Radium-226 in the diet ofthree U. S. cities," pp. 90-94 in Summary Report USAEC ReportHASL-113, USAEC Health and Safety Laboratory (E. P. Hardy, Jr.editor), National Technical Information Service, Springfield,Virginia.
Hallden, N. A., I. M. Fisenne, and J. H. Harley, 1963, "Radium-226 inhuman diet and bone," Science 140:1327-1329.
Hallden, N. A. and J. H. Harley, 1964, "Radium-226 in diet and humanbone from San Juan, Puerto Rico," Nature 204(4955):240-241.
Hardy, E., J. Rivera, I. Fisenne, W. Pond, and D. Hogue, 1969, "Compara-tive utilization of dietary radium-226 and other alkaline earthsby pigs and sheep," pp. 183-190 in Proceedings of the 9th AnnualHanford Biological Symposium (M. R. Sikov and D. D. Mahlum,editors), CONF-690501, May 5-8, 1969, Richland, Washington.
Holtzman, R. B., 1964, "Lead-210 (RaD) and Polonium-210 (RaF) in potablewaters in Illinois,” pp. 227-237 in The Natural Radiation Environ-ment (J.A.S. Adams and W. Lowder, editors), University of ChicagoPress, Chicago.
Holtzman, R. B., 1966a, "Natural levels of Pb-210, Po-210 and Ra-226in humans and biota of the Arctic," Nature 210:1094-1097.
Holtzman, R. B., 1966b, "Ra-226 and the natural airborne nuclides 210Pband 210Po in Arctic biota," pp. 1087-1096 in Proceedings 1st Inter-national Congress Radiation Protection (W. S. Snyder, H. H. Abee,L. K. Burton, R. Maushart, A. Benco, F. Buhamel, and B. M.Wheatley, editors), Rome, Italy, September 5-10, 1966, PergamonPress.
Holtzman, R. B., P. W. Urnezis, A. Padova, and C. M. Bobula III, 1979,Contamination of the Human Food Chain by Uranium Mill TailingsPiles, NUREG/CR-0758, ANL/ES-69, Argonne National Laboratory,Argonne, Illinois.

35
Ibrahim, S. A., S. L. Flot, and F. W. Whicker, 1982, "Concentrationsand observed behavior of 226Ra and 210Pb around uranium mill tail-ings," in International Symposium on Management of Wastes fromUranium Mining and Milling, IAEA-SM 262/32, Albuquerque, N.M.,May 10-14, 1982 (IAEA/OECD).
Irwin, G. A. and C. B. Hutchinson, 1976) Reconnaissance Water Samplingfor Radium-226 in Central and Northern Florida, December 1974 -March, 2976, USGS Water Resources Investigations 76-103.
Kaufman, R. F. and J. D. Bliss, 1977, Effects of the Phosphate Industryon Radium-226 in Ground Water of Central Florida, U. S. Environ-mental Protection Agency, Office of Radiation Program, Las VegasFacility.
Keefer, D. H. and E. J. Fenyves, 1980, "Radiation exposure from radium-226 ingestion," pp. 839-853 in Natural Radiation Environment III(T. F. Gesell and W. M. Louder, editors), Vol. 1, CONF-780422,Technical Information Center, U.S. Department of Energy, Oak Ridge,Tennessee 37830.
Kiefer, J., A. Wicke, and F. Glaum, 1980, "226Ra and 222Rn content ofdrinking water," pp. 315-318 in 5th International Conference ofthe International Radiation Protection Association, March 8, 1980,Jerusalem, Israel, INSL-MF-5876, Vol. 2. Pergamon Press, Oxford,England.
Kirchmann, R., R. Boulenger, and A. LaFontaine, 1968, "Absorption of226Ra in cultivated plants," pp. 1045-51 in Proceedings of theFirst International Congress Radiation Protection (W. A. Snyder,H. H. Abee, L. K. Burton, R. Maushart, A. Benco, F. Duhamel, andB. M. Wheatley, editors), Rome, Italy, September 5-10, 1966,Pergamon Press, Oxford.
Kirchmann, R., A. LaFontaine, J. Van den Hoek, and G. Koch, 1972,"Comparison of the rate of transfer to cow milk of 226Ra fromdrinking water and 226Ra incorporated in hay," Comptes Rendus desSeances de la Societe de Biologie et de ses Filiales 166(11):1557-1562.
Krause, D. P., 1960, "Ra-228 (Mesothorium I) in Midwest well waters,"pp. 85-87 in ANL Radiological Physics Div. Semiannual Report,USAEC Report ANL-6199, Argonne National Laboratory, NationalTechnical Information Service, Springfield, Virginia.
Krause, D. P., 1959, "Ra-228 (Mesothorium I) in Illinois well waters,”pp. 51-52 in ANL Radiological Physics Division Semiannual Report,USAEC Report ANL-6049, Argonne National Laboratory, NationalTechnical Information Service, Springfield, Virginia.

36
Lalit, B. Y. and T. V. Ramachandran, 1980, "Natural radioactivity inIndian foodstuffs," pp. 800-809 in Natural Radiation EnvironmentIII (T. F. Gesell and W. M. Lowder, editors), Vol. I, CONF-780422,Technical Information Center, U.S. Department of Energy, Oak Ridge,Tennessee 37830.
Lee, R. D., J. E. Watson, Jr., and S-W. Fong, 1979, "An assessment ofradium in selected North Carolina drinking water supplies," HealthPhys. 37:777-779.
Lucas, H. F., Jr. and F. H. Ilcewicz, 1958, "Natural radium-226 contentOf Illinois water supplies," J. Am. Water Works Assoc. 50:1523-1532.
Lucas, H. F., Jr. and F. H. Krause, 1960, "Preliminary survey ofradium-226 and radium-228 (MsThI) contents of drinking water,"Radiology 74:114.
Marple, M. L., 1980, Radium-226 in Vegetation and Substrates at InactiveUranium Mill Sites, LA-8183-T, UC-41, Los Alamos ScientificLaboratory, P. 0. Box 1663, Los Alamos, New Mexico 87545.
Mastinu, G. G. and G. P. Santaroni, 1980, "Radium-226 levels in Italiandrinking waters and foods," pp. 810-825 in Natural RadiationEnvironment III, (T. F. Gesell and W., M. Lowder, editors), Vol. 1CONF-780422, Technical Information Center, U. S. Department ofEnergy, Oak Ridge, Tennessee 37830.
McCurdy, D. A. and R. A. Mellor, 1981, "The concentration of 226Ra and228Ra in domestic and imported bottled waters," Health Phys.40:250-253.
McDowell-Boyer, L. M., A. P. Watson, and C. C. Travis, 1980, "A reviewof parameters describing terrestrial food-chain transport oflead-210 and radium-226," Nuclear Safety 21(4):486-495.
Michel, J. and W. S. Moore, 1980, "228Ra and 226Ra content of ground-water in fall line aquifers," Health Phys. 38:663-671.
Mills, W. A., W. H. Ellett, and R. E. Sullivan, 1980, "Monitoring for228Ra in water supplies," Health Phys. 39:1003.
Milosevic, Z., E. Horsic, R. Kljajic, and A. Bauman, 1980, "Distributionof uranium, 226Ra, 210Pb and 210Po in the ecological cycle inmountain regions of central Yugoslavia," pp. 1123-1126 in 5th Inter-national Conference of the International. Radiation ProtectionAssociation, INLS-MF-5876, Vol. 2, March 8, 1980, Jerusalem,Israel. Pergamon Press, Oxford, England.

37
Mordberg, E. L., V. M. Aleksandruk, G. F. Kovygin, I. I. Shevchenko,V. M. Blyumshtein, and G. F. Yushkevick, 1976, "Translocation ofisotopes of the uranium-radium series into the grain of someagricultural crops," Chem. Abstr. 84:134563 (Abstract from Gig.Sanit. 2:58-61).
Morse, R. S. and G. A. Welford, 1971, "Dietary intake of 210Pb," HealthPhys. 21:53-55.
Muth, H., B. Rajewsky, H.-J. Hantke, and K. Aurand, 1960, "The normalradium content and the 226Ra/Ca ratio of various foods, drinkingwater and different organs and tissues of the human body," HealthPhys. 2:239-245.
Ng, Y. C., 1982, "A review of transfer factors for assessing the dosefrom radionuclides in agricultural products," Nuclear Safety23(1):57-71.
Nishita, H., A. Wallace, and E. M. Romney, 1978, Radionuclide Uptakeby Plants, NRC Report NUREG/CR-0336 (UCLA 12-1158), University ofCalifornia at Los Angeles, Laboratory of Nuclear Medicine andRadiation Biology, NTIS.
Oakes, T. W., K. E. Shank, C. E. Easterly, and L. R. Quintana, 1977,"Concentrations of radionuclides and selected stable elements infruits and vegetables," pp. 123-132 in Proceedings University ofMissouri Annual Conference on Trace Substances in EnvironmentalHealth XI (D. D. Hemphill, editor). University of Missouri,Columbia, Missouri.
O'Connell, M. F. and R. F. Kaufmann, 1976, Radioactivity Associatedwith Geothermal Waters in the Western U.S., ORP/LV-75-8a, U. S.Environmental Protection Agency, Office of Radiation Programs,LVF, P. 0. Box 15027, Las Vegas, Nevada 89114.
Osburn, W. S., 1965, "Primordial radionuclides: their distribution,movement, and possible effect within terrestrial ecosystems,"Health Phys. 11:1275-1295.
Rayno, D. R., M. H. Momeni, and C. Sabau, 1980, "Forage uptake ofuranium series radionuclides in the vicinity of the Anacondauranium mill," pp. 57-66 in Uranium Mill Tailings Management,Proceedings of the 3rd Symposium, November 24-25, 1980. ColoradoState University, Fort Collins, Colorado.
Rusanova, G. V., 1964, "Behavior of radium and calcium in the soilplant system," Soviet Soil Sci. 3:275-280.
Sansom, B. F., R. J. Garner, and L. C. West, 1966, "The metabolism ofradium in dairy cows," Biochem. J. 99:677-681.

38
Schliekelman, R. J., 1976, "Determination of radium removal efficienciesin Iowa water supply treatment processes," U.S. EnvironmentalProtection Agency Technical Note ORP-TAD-76-1.
Shandley, P. D., 1953, The Radium Content of Common Foods, U. S. AtomicEnergy Commission Report, UR-255.
Smith, B. H., W. N. Grune, F. B. Higgins, Jr., and J. G. Terrill, Jr.,1961, "Natural radioactivity in ground water supplies in Maine andNew Hampshire," J. Am. Water Works Assoc. 53:75-88.
Smith, K. A. and P. G. Watson, 1963, "Radium-226 in diet in the UnitedKingdom - a preliminary survey," pp. 79-80 in ARCRL-10, Agricul-tural Research Council Radiobiological Laboratory, Wantage,Berkshire, England.
Snihs, J. O., 1973, "The significance of radon and its progeny asnatural radiation sources in Sweden," pp. 115-126 in Noble Gases(R. E. Stanley and A. A. Moghissi, editors), CONF-730915.
Spector, W. S. (Ed.), 1956, Handbook of Biological Data, Committeeon the Handbook of Biological Data, Division of Biology and Agri-culture, the National Academy of Sciences, The National ResearchCouncil, W. B. Saunders Co., Philadelphia and London.
Strain, C. D., J. E. Watson, Jr., and S. W. Fong, 1979, "An evaluationof 226Ra and 222Rn concentrations in ground and surface water neara phosphate mining and manufacturing facility," Health Phys.37:779-783.
Taskayev, A. I., V. Y. Ovchenkov, R. M. Aleksakhim, and I. L.Shuktomova, 1977, "Uptake of 226Ra by plants and change in itsstate in the soil-plant-tops-litterfall system," Pochvovedeniye2:42-48.
U. S. Department of Agriculture (USDA), 1977, Food Consumption, Pricesand Expenditures, National Economic Analysis Division Supplementfor 1975 to the Agriculture Economic Report No. 15, AgriculturalResearch Service, USDA, Washington, D. C.
U. S. Environmental Protection Agency (EPA), 1978, Draft AreawideEnvironmental Impact Statement, Central Florida Phosphate Industry,EPA 904/9-78-006. EPA, Reg. IV, 345 Courtland St., N.E., Atlanta,Georgia 30308.
U. S. Nuclear Regulatory Commission, 1977, "Calculation of annualdoses to man from routine releases of reactor effluents for thepurpose of evaluating compliance with 10 CFR Part 50; Appendix I,"Regulatory Guide 1.109 (Rev. 1, October, 1977).

39
Van den Hoek, J., R. J. Kirchmann, J. Colard, and J. E. Sprietsma, 1969,"Importance of some methods of pasture feeding, of pasture typeand of seasonal factors on 85Sr and 139Cs transfer from grass tomilk," Health Phys. 17:691-700.
Vavilov, P. O., 0. N. Popova, and R. P. Kodaneva, 1964, "The behaviorof radium in plants," NSA 19(2):2016. (Abstracted from Dokl AkadNauk SSSR 157:992-994).
Verkhovskaja, I. N., P. 0. Vavilov, and V. I. Maslov, 1966, "The migra-tion of natural radioactive elements under natural conditions andtheir distribution according to biotic and abiotic environmentalcomponents," pp. 313-328 in Radioecological Concentration Processes(B. Aberg and F. P. Hungate, editors), Pergamon Press.
Weast, R. C. (editor), 1976, Handbook of Chemistry and Physics, 57thEdition, CRC Press, Boca Raton, Florida.
Wu, T-Y and P-S. Weng, 1977, "Determination of radium-226 in bone ofthe native Taiwan buffalo and in environmental samples of NorthTaiwan Power Reactor Site," Health Phys. 32:565-567.

41
ORNL/TM-8597
INTERNAL DISTRIBUTION