Embed Size (px)
Citation preview

(t) ©
E.R.
I.M./S
tone
/Get
ty Im
ages
; (c)
©Ji
m Z
ucke
rman
/Cor
bis;
(b) ©
Anto
nio
Scor
za/A
FP/G
etty
Imag
es
Chapter 11 Summary
SeCtion 1 Water Resources Objectives Key terms
• Only a small fraction of Earth’s water supply is fresh water. The two main sources of fresh water are surface water and groundwater.
• River systems drain the land that makes up a water-shed. The amount of water in a river system can vary in different seasons and from year to year.
• Groundwater accumulates in underground formations called aquifers. Surface water enters an aquifer through the aquifer’s recharge zone.
• If the water in an aquifer is pumped out faster than it is replenished, the water table drops, which can affect humans and animals that depend on the groundwater.
surface water
river system
watershed
groundwater
aquifer
porosity
permeability
recharge zone
SeCtion 2 Water Use and Management
Objectives Key terms
• There are three main types of water use: residential, industrial, and agricultural. Worldwide, most water use is agricultural.
• Dams and water diversion projects are built to manage surface-water resources. Damming and diverting rivers can have environmental and social consequences.
• Water conservation is necessary to maintain an adequate supply of fresh water. Desalination and transporting water are options to supplement local water supplies.
potable
pathogen
dam
reservoir
desalination
SeCtion 3 Water Pollution Objectives Key terms
• Water can become polluted by chemical, physical, or biological agents. Most water pollution in the United States is caused by nonpoint-source pollutants.
• Groundwater pollution is difficult to clean up because aquifers recharge slowly and because pollutants cling to the materials that make up an aquifer.
• Ocean pollution is mainly caused by coastal, nonpoint-source pollutants.
• Government legislation, such as the Clean Water Act of 1972, has succeeded in reducing surface-water pollution. Future challenges include reducing nonpoint-source pollution and groundwater pollution.
water pollution
point-source pollution
nonpoint-source pollution
wastewater
artificial eutrophication
thermal pollution
biomagnification
296 Unit 4: Water, Air, and Land
DO NOT EDIT--Changes must be made through “File info”printcode=a
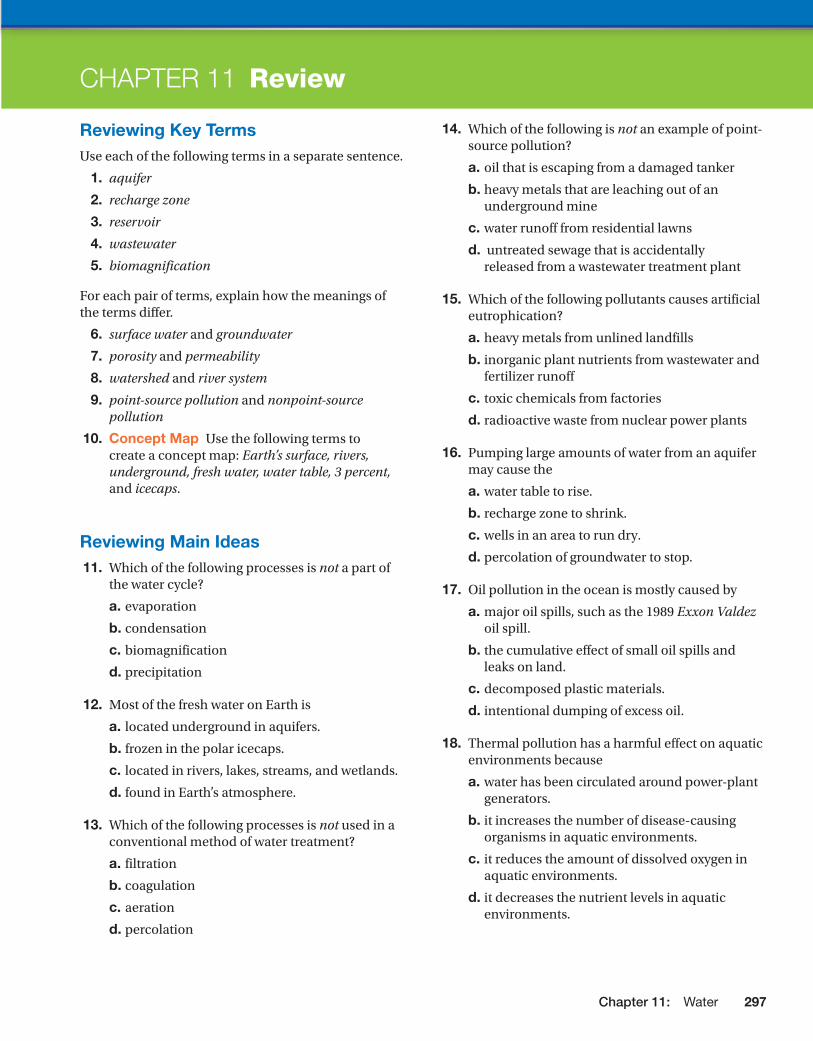
reviewing Key termsUse each of the following terms in a separate sentence.
1. aquifer
2. recharge zone
3. reservoir
4. wastewater
5. biomagnification
For each pair of terms, explain how the meanings of the terms differ.
6. surface water and groundwater
7. porosity and permeability
8. watershed and river system
9. point-source pollution and nonpoint-source pollution
10. concept map Use the following terms to create a concept map: Earth’s surface, rivers, underground, fresh water, water table, 3 percent, and icecaps.
reviewing main ideas 11. Which of the following processes is not a part of
the water cycle?
a. evaporation
b. condensation
c. biomagnification
d. precipitation
12. Most of the fresh water on Earth is
a. located underground in aquifers.
b. frozen in the polar icecaps.
c. located in rivers, lakes, streams, and wetlands.
d. found in Earth’s atmosphere.
13. Which of the following processes is not used in a conventional method of water treatment?
a. filtration
b. coagulation
c. aeration
d. percolation
14. Which of the following is not an example of point-source pollution?
a. oil that is escaping from a damaged tanker
b. heavy metals that are leaching out of an underground mine
c. water runoff from residential lawns
d. untreated sewage that is accidentallyreleased from a wastewater treatment plant
15. Which of the following pollutants causes artificial eutrophication?
a. heavy metals from unlined landfills
b. inorganic plant nutrients from wastewater and fertilizer runoff
c. toxic chemicals from factories
d. radioactive waste from nuclear power plants
16. Pumping large amounts of water from an aquifer may cause the
a. water table to rise.
b. recharge zone to shrink.
c. wells in an area to run dry.
d. percolation of groundwater to stop.
17. Oil pollution in the ocean is mostly caused by
a. major oil spills, such as the 1989 Exxon Valdez oil spill.
b. the cumulative effect of small oil spills and leaks on land.
c. decomposed plastic materials.
d. intentional dumping of excess oil.
18. Thermal pollution has a harmful effect on aquatic environments because
a. water has been circulated around power-plant generators.
b. it increases the number of disease-causing organisms in aquatic environments.
c. it reduces the amount of dissolved oxygen in aquatic environments.
d. it decreases the nutrient levels in aquatic environments.
Chapter 11 Review
297Chapter 11: Water
DO NOT EDIT--Changes must be made through “File info”printcode=a

10,000
9,000
8,000
7,000
6,000
5,000
4,000
3,000
2,000
1,000O N D J F M A M J J A S
1988 1989
Mea
n da
ily d
isch
arge
(ft3
/s)
Hydrograph of the Yakima River
Months
Chapter review
short Answer 19. What effect can buildings and parking lots have
on an aquifer’s recharge zone?
20. Why is the use of overhead sprinklers for irrigation inefficient? What is a more efficient method of irrigation?
21. List three advantages and three disadvantages of dams.
22. What is the process of eutrophication, and how do human activities accelerate it?
23. Describe the steps that are involved in the primary and secondary treatment of wastewater.
interpreting GraphicsThe graph below shows the annual flow, or discharge, of the Yakima River in Washington. Use the graph to answer questions 24–26.
24. Determine In which months is the river’s discharge highest? What might explain these discharge rates?
25. compare What might cause the peaks in river discharge between November and March?
26. Predict How might the data be different if the hydrograph readings were taken below a dam?
critical thinking 27. making comparisons Read the description of
artificial eutrophication in this chapter. Do you think artificial eutrophication is more disturbing to the stability of a water ecosystem than natural eutrophication is?
28. Analyzing relationships Water resources are often shared by several countries. A river, for example, might flow through five countries before it reaches an ocean. When water resources are shared, how should countries determine water rights and environmental responsibility?
29. making inferences Explain why it takes about 136 liters of water to produce a single serving of rice, but it takes more than 7,571 liters of water to produce a single serving of steak. What do you think the water is used for in each case?
30. making inferences Why is there so little fresh water in the world? Do you think that there would have been more fresh water at a different time in Earth’s history?
31. social studies Find out how freshwater resources affected the development of one culture in history. Use at least five key terms from this chapter to write a two-paragraph description of how the availability of fresh water affected the culture you chose.
32. investigation Find out about the source of the tap water in your home. Where does the tap water come from, and where does your wastewater go? Does the water complete a cycle? Make a poster to illustrate your findings. You may want to work with several classmates and visit the sites you discover.
Unit 4: Water, Air, and Land298
DO NOT EDIT--Changes must be made through “File info”printcode=a

STUDYSKILL
STUDYSKILLPu
mpi
ng ra
te (g
al/m
in)
0
2
4
6
8
10
Well A Well B Well C Well D Well E
Why It Matters
Why It Matters
Chapter review©
Ralp
h A.
Cle
veng
er/C
orbi
s
Analyzing DataThe graph below illustrates the pumping rates for a set of wells that provide water to a small community. Use the graph to answer question 33.
33. Analyzing Data How many gallons does Well B pump per day? What is the average pump rate for all of the wells? In one hour, how many more gallons of water will Well A pump than Well C?
34. making calculations If placing a container of water in your toilet tank reduces the amount of water per flush by 2 L, how much water would be saved each day if this were done in 80 million toilets? (Assume that each toilet is flushed five times per day.) Convert your answer into gallons (1 L = .26 Gal).
making connections 35. communicating main ideas Why is water
pollution a serious problem?
36. Writing Persuasively Write a letter to a senator in which you voice your support or criticism of a hypothetical water diversion project.
CASESTUDY
37. After reading the passage, explain why the Ogallala aquifer is so important.
38. How might global climate change affect the aquifer?
39. How could towing icebergs to water-poor areas be made more economical?
Root Words To practice vocabulary, write the key terms and definitions on a piece of paper and fold the paper lengthwise so that the definitions are covered. First, see how many definitions you already know. Then, write the definitions you do not know on another piece of paper, and practice until you know all of the terms.
Chapter 11: Water 299
DO NOT EDIT--Changes must be made through “File info”printcode=a