Embed Size (px)
Citation preview
Orignal Research Article Open Access
32
International Journal of Education and Psychological Research (IJEPR)Print - ISSN: 2349 - 0853, e-ISSN: 2279 - 0179
Volume 7, Issue 1, March 2018Available online at www.ijepr.org
I. INTRODUCTIONThe admission system to higher education institutions in Saudi Arabia has shifted from using only high school grade point average (GPA) as the criterion for admission to a more comprehensive criteria consisting of three major components: (1) high school GPA, (2) the General Aptitude Test (GAT) scores, and (3) the Standardized Achievement Admission Test scores (SAAT). Thus, officers in Saudi higher education institutions use an admission equation that consists of the three subscores mentioned above to produces one composite score. Therefore, students in high schools all over Saudi Arabia are required to provide universities and other colleges with those three components in order to be admitted. Most relevant to this study is the SAAT test score component. The SAAT is a high-stakes, large-scale standardized achievement test developed by the National Center for Assessment (NCA). It covers key general concepts in biology, chemistry, physics, mathematics, and English in the three grades of general secondary school. According to the SAAT Manual, it is hypothesized that the SAAT test items should reflect one dominant construct. This dominant construct is called “High School Achievement.” That is, all SAAT items across its five subcomponents should be influenced by only one dominant factor: high school achievement. The scoring system of the SAAT is clear. Only one averaged score of the five subcomponents included in the SAAT is generated for each student, which reflects his/her high school achievement. In other words, admission officers accept only one score from each student nationwide to represent the SAAT test component.
Given the increase in demand for SAAT test scores, and being a major component of the required test for university and college admission nationwide, the NCA, as the SAAT developer, is obliged to continually check and maintain the quality of the SAAT test by collecting evidence of validity to support the interpretation and use of its scores. One important process that the NCA team routinely examines during test construction and development is validity. This is an important test feature and a never-ending process that must be investigated and examined. Validity, as defined in the literature review of educational and psychological test theory, is a process that ensures a test measures what it is intended to measure. In addition, it can be viewed as the agreement between test score and what it is believed to measure (Kaplan & Saccuzzo, 2012). The earlier work of the joint committee of American Educational Research Association, American Psychological Association, and National Council on Measurement in Education (AERA, APA, & NCME) viewed validity as a collection of evidence to support test score inferences. This evidence includes, for instance, the most commonly collected and investigated validity aspects in educational and psychological measurement literature, such as content-related validity evidence, criterion-related validity evidence, and construct-related validity evidence. Content-related validity evidence is about the representation and relevance of items to a content domain. Thus, according to this evidence, one needs to validate whether the content of a test is representative and relevant to the test domain that is being assessed. On the other hand, criterion-related validity
Investigating the Structural Aspect Validity of a Large-Scale StandardizedAchievement Test Using Rasch and CFA of Item Parceling Analysis
[1, 2]Amjed A. Al-Owidha
Abstract:
This study aims to collect evidence on the structural aspect validity of Standardized Achievement Admission Test (SAAT) scores. Over a thousand examinees were randomly selected and their responses used in this analysis. Two approaches were used to investigate the structural aspect validity of SAAT test scores; Rasch analysis and confirmatory factor analysis (CFA) of item parceling. First, Rasch analysis was applied to the SAAT test scores. Several Rasch indices were used. Overall fit statistics, item fit statistics, the person reliability index, point–measure correlations, principle components analysis of Rasch residuals, and differential item functioning were computed and used in the analysis. Second, the CFA of item parcels was applied to the SAAT. Several fit statistical indices were used to evaluate the fit of the measurement model to the SAAT data. Specifically, the Chi- square test, root mean square error of approximation, goodness of fit index, comparative fit index, Tucker–Lewis index, Standardized mean square residuals, and Akaike Information Criterion were all used to further investigate the structural aspect validity of the SAAT test scores. The findings of both paradigms lend support to the hypothesized structure of the SAAT test. Also, as an attempt to evaluate the plausibility of the current position of English items as being one major component of the SAAT composite score, both frameworks showed an agreement supports the notion that the English items of the SAAT are measuring mastery level of English proficiency rather than high school achievement. However, given the fact that the current study was applied only to the SAAT tests for male science majors; we suggest conducting further studies that include more representative sample of the SAAT population.
Key words: Achievement test, construct validity, Rasch model, CFA of item parceling.
Article History: Received: 28th February 2018, Revised: 13th March 2018, Accepted: 21st March 2018, Published: 31st March 2018.
[1] King Fahd University of Petroleum & Minerals, Department of General Studies, 31261 Dhahran, KSA; E-mail: [email protected][2] National Center for Assessment, Division of Testing and Measurement, P.O. Box 68566, 11537 Riyadh, KSA; Email: [email protected]
33
International Journal of Education and Psychological Research (IJEPR) Volume 7, Issue 1, March 2018
evidence is about assessing the relationship between test scores and some criterion measure. Thus, this type of evidence is statistical in nature and is expressed in the form of correlation coefficients. Finally, the construct-related validity subsumes content- and criterion-related validity evidence. This type of evidence is about the interpretation of assessment outcomes as a reflection of the construct. In collecting this type of evidence, one attempts to find an answer to the following question: “Is the usage of interpreted test scores justifiable and meaningful?” More recently, however, the standard for Educational and Psychological Testing (AERA, APA, & NCME, 2014) has viewed validity as a unitary concept that embodies all the evidence that supports the intended interpretation of test scores for the proposed use. More relevant to this study is a very important consideration that was emphasized in the recent Standards for Educational and Psychological Testing (AERA, APA, & NCME, 2014) and is called construct-irrelevant variance. This consideration acknowledges that there might be some irrelevant components that distort the studied construct. For instance, a math test that contains items that require more reading skills than math-solving skills only confounds the math construct, which in turn could threaten the structural aspect of test score validity. One possible way to investigate the concept of construct-irrelevant variance that exists within the literature of psychometric theory and that was highlighted in the recent Standards for Educational and Psychological Testing (AERA, APA, & NCME, 2014) is to evaluate structural aspect validity of test score. The idea of structural aspect validity depends on the degree to which test items reflect the construct that is being measured. In other words, it depends on the degree to which there is harmony between the objective of the test and what is being measured by the test (Kirsch & Guthrie, 1980). To appraise this harmony, Wright and Stone (1999) recommended the use of the Rasch measurement model as an approach to collect evidence of internal structure. On the other hand, the most recent Standards for Educational and Psychological Testing (2014) recommended the use of factor analysis to examine item interrelationships.
Review of the SAAT Manual indicated that the SAAT test has never been subjected to any study of its internal structure in support of construct-related validity using the Rasch model and confirmatory factor analysis (CFA) of item parceling. In other words, only two aspects of validity studies, so far, have been applied to the SAAT test: content-related evidence and criterion-related evidence. The former study involved a test specification table that had been formally constructed, completed, and evaluated carefully by subject matter experts under the supervision of the NCA. The latter study collected data by establishing correlations between the SAAT test and the first-year GPA of several university colleges (see Appendix A). Therefore, the objective of this study was to assess the structural aspect validity of SAAT scores to support its intended interpretations for the proposed use by means of Rasch modeling and the CFA of item parcels. The specific purpose of the study was twofold: (1) to assess the structural aspect validity of SAAT scores, and (2) to evaluate the plausibility of the current position of English items as being one major component of the SAAT composite score. In other words, to investigate whether removing or retaining English item components would enhance or reduce the internal
structure of the SAAT test. The reason for investigating the English component of the SAAT test is because it is controversial among SAAT developers. That is, some English content experts in the NCA have argued that the English section of the achievement test has three subsections, namely, vocabulary, grammar, and reading comprehension. The grammatical points on which the students are tested are those points rehearsed in their English books. In this case, one could argue that the test items based on those English book materials are achievement items. The vocabulary items are largely based on a word list given in the student book, but the correct meanings and/or synonyms may not be included in the list. Therefore, one could argue that they do not measure achievement. The reading comprehension items are from sources other than the student books. It is true that items are professionally calibrated to a level close to the texts, but they end up measuring more proficiency than achievement. One then could ask whether the English component is congruent with the other test components (Dr. Al-Shammrany, personal communication). Therefore, the current research study addresses the following research questions:
(1) Does the structural aspect validity of the SAAT test support interpretation and use of SAAT scores for achievement admission purposes?
(2) Does the English component in its current position enhance or reduce the structural aspect validity of the SAAT test?
As an attempt to answer the first research question, two approaches were used, namely, item response theory (the Rasch model) and CFA of item parcels. The two approaches were used to test whether the combined SAAT items reflect one dominant construct as hypothesized by the SAAT Manual. With respect to the second research question, another Rasch analysis and CFA of item parcels was implemented to evaluate the plausibility of the current position of the English component of the SAAT. Given the importance of the Rasch model and CFA of item parcels to this study, they will be discussed briefly in the following sections.
The Rasch Model
The dichotomous Rasch model (1960) is a mathematical formula that specifies the relationship between examinees and items on a test that measures one trait at time. According to Rasch model, the likelihood of a person’s success increases when more of the trait is measured. Conversely, their likelihood of failure increases as less of a trait is measured (Frantom & Green, 2002). Also, with the Rasch model, only the interaction between a person’s position on the underlying ability being measured by a test and item difficulty are modeled. In order to establish structural aspect validity evidence, the Rasch model provides researchers with fit statistics that help evaluate the hypothesized structure of a test. In other words, it informs the researcher on whether responses to items are forming and following a logical pattern. For instance, items that do not fit the logical pattern are most likely harmful to the internal structure of a test and should be modified or deleted, whereas items that fit the logical pattern nicely are most likely to enhance the construct validity and should be kept. Following the same logic, a good test or measure should produce invariant scores regardless of
34
International Journal of Education and Psychological Research (IJEPR) Volume 7, Issue 1, March 2018
which subgroup classification has taken the test (Frantom & Green, 2002). For instance, test scores should be indifferent to the gender of people who take the test. The Rasch model provides researchers with statistical indices (e.g., differential test and item functioning) that help to detect bias or irrelevant factors. This, in turn, is regarded as a tool for collecting additional pieces of internal structure validity evidence.
CFA of Item Parcels
One of the correlational techniques that researchers frequently use in the educational and psychological sciences to evaluate the structural aspect validity of a measure is factor analysis. In its simplest form, factor analysis is a data reduction technique that reduces many test items into fewer factors or constructs. For instance, groups of test items that correlate highly with each other can be placed into one factor. Because factor analysis provides understanding as to how a group of items can be lumped together to form a common construct, it became a popular method for establishing construct-related validity evidence (Keith, 2014). There are two types of studies that exist within the literature of factor analysis. The first type is called exploratory factor analysis. With this type, researchers do not explicitly state hypotheses about the internal structure of the item relationships that are being studied. Thus, they are using it to explore the relationships between items. More important and relevant to the current study is the second type of factor analysis, i.e., CFA. With this type, researchers hypothesize the structure that is being tested. Thus, CFA is used to test certain hypotheses about the construct of interest.
To establish evidence of appropriate internal structure, a confirmatory factor model provides researchers with several statistical indices that help evaluate the fit between the model and the data. In other words, with CFA, researchers must have a particular hypothesis in mind and thus must attempt to test it statistically. Poor fit indices indicate issues with the test structure, whereas good fit indices suggest that the hypothesized structure fits the test data. Regardless of the popularity and the advantages of classical CFA as an approach for test validation, the use of a confirmatory factor model based on item level is not free of limitations, especially with educational testing data, which has binary responses. For instance, one of the problems involved in using CFA with items is that a single item, when compared to the scales, is not reliable. This, in turn, could diminish the correlations between the items, resulting in low factor loadings, low communalities, and large unique variances compared to the shared variance. Moreover, it is known that CFA relies on two main assumptions: linearity and normality. Unfortunately, these two assumptions are most likely to be violated when using item CFA, particularly with data that are binary. This violation of confirmatory factor assumptions, in turn, could inflate the likelihood chi-square tests of fit, reduce standard errors, and inflate error variances (De Bruin, 2004). Therefore, to avoid the limitations associated with using CFA based on the item level, a CFA based on item parcels could be employed. An item parcel is defined as an aggregated level indicator consisting of the average of two or more items (De Bruin, 2004). According to Hall, Snell, and Froust (1999), the idea of using factor analysis of item parcels is not new. Rather, it was originally introduced by Cattell in 1956 and
further explored by Cattell and Burdsal in 1975. It has also been suggested for use in areas of structural equation modeling by several researchers, such as Lawrence and Dorans (1987), Manhart (1996), and Marsh (1994), Previous studies have adopted and shown some advantages to using item parceling. For instance, a study conducted by Comrey (1988), Little et al. (2002), Bandalos (2002), and Kishton and Widaman (1994) indicated that item parcels are effective and useful in solving the limitations found in the factor analysis of items, such as improving the fit of the model to the data. Bagozzi and Edwards (1998) and Bagozzi and Heatherton (1994) have also found item parceling to be useful in improving the stability of item parameters, specifically those with small sample sizes. Therefore, this study will utilize this strategy along with the Rasch model to assess the internal structure of SAAT test scores and compare the generated solution by item parceling with that found in the Rasch model.
II. METHODS
Sample
Official SAAT data were obtained from the NCA database. For the purpose of this study, 1,115 (approximately 10%) of the participants who took the 9040 form of the SAAT test in 2012 were randomly selected. All participants were Saudi males majoring in science. Out of 1,115 participants who were selected for this study, 727 came from public schools, whereas 388 participants came from private schools.
Measure
The SAAT is a paper-and-pencil, high-stakes standardized test given to high school students (both boys and girls) all over Saudi Arabia. The SAAT test was developed by the NCA to cover the general key concepts in biology, chemistry, physics, mathematics, and English that are covered by the three grades of general secondary schools. More specifically, SAAT focuses on the material of the official three-year (science major) curriculum of Saudi high schools. The items on the SAAT are distributed as follows: 20% of each subject for the first year of the high school syllabus and 40% of each subject for the second and third years of the high school syllabus, respectively. The SAAT booklet contains five major subcomponents: biology, chemistry, physics, English, and math. Each subcomponent contains 20 items. The whole SAAT test consists of 130 items, all in multiple-choice format that contains four alternatives. The total number of scorable items is 100, whereas 30 nonscorable items are trial items. The SAAT test item is separated into five sections. Students are required to finish the whole test in three hours. It should be noted that this study is investigating only the 100 real SAAT items and not the trial items.
Data Analysis
To evaluate the structural aspect of the SAAT, two analyses were carried out. First, Winsteps version 3.75.1 (Linacre, 2012a) was used to fit the SAAT data to the Rasch model. Several Rasch indices were used to evaluate the internal structure of the SAAT. Mainly, overall fit statistics, item fit statistics (e.g., infit and outfit mean squares), person reliability index, point–measure correlations (PMCs),
35
International Journal of Education and Psychological Research (IJEPR) Volume 7, Issue 1, March 2018
principal component analysis (PCA) of Rasch residuals, and differential item functioning within the framework of Rasch model were all computed and used. More specifically, to evaluate whether the SAAT items measure one dominant factor, the overall mean square infit and outfit was used. According to the Rasch model, the overall fit statistics provide researchers and test developers with an indication as to how the expected and observed response patterns agree with each other. The overall fit statistics are expected to be 1.0, and its associated z-value should be 0.0 (Frantom & Green, 2002). Item infit and outfit mean square statistics should be 1.3 or below for items with good fit (Bond & Fox, 2007). Moreover, no more than 5% of the items should misfit the Rasch model expectations (Wright & Masters, 1982). Another Rasch index that was used to evaluate the structural aspect validity of the SAAT was the person separation reliability. This index indicates the degree to which the persons ordering along the construct is replicable when the same sample of persons is exposed to another set of parallel items measuring the same construct (Bond & Fox, 2007). The person separation reliability is analogous to Cronbach’s alpha reliability, that is, it ranges between 0.0 and 1.0, where an index of 1 means perfect reliability (Frantom & Green, 2002). An adequately reliable measure should have a reliability index of at least 0.7 (The Standards for Educational and Psychological Testing, 1999). Point–measure correlations were another indicator that was used to investigate the structural aspect validity of the SAAT. According to the Rasch model, this correlation index answers a question fundamental to the Rasch paradigm: do examinees’ responses line up adequately with their abilities? That is, a person with higher ability should score higher on the test, and a person with lower ability should score lower. PMC falls between +1 and –1. To conclude that the SAAT items harmoniously combine to form a logical pattern, the PMC is expected to be positive. Negative PMC is an indication that items contradict the construct of interest. A slightly positive PMC indicates that items are not functioning as intended and therefore should be further investigated (Linacre, 2012b). A PCA of Rasch residuals was another Rasch criterion that was used to confirm the dimensionality of the SAAT test. The PCA is a factor analysis of the residuals left over after applying the Rasch model to the data. One strict assumption of the Rasch paradigm is that a test should measure one trait at a time. Hence, to conclude that the data fit the Rasch model, the eigenvalue for the first contrast extracted after fitting the data to the Rasch model should be below, or equal to, 2 eigenvalue units (Linacre, 2012b). Finally, to further investigate if irrelevant factors might exist and thus confound the SAAT scores, a uniform differential item functioning (DIF) within the framework of the Rasch measurement was used. A major requirement of the Rasch model is that a good measure should function the same way regardless of its subgroup classification (e.g., gender, school type, etc.). To conclude that an item is biased against a subgroup, DIF must show significant statistical differences with a P value of 0.05 or below, and the DIF contrast must be at least 0.5 logit to merit a noticeable DIF difference. Furthermore, as an attempt to answer the second research question of this study, another Rasch analysis without English items was applied. The purpose of this analysis was to evaluate whether removing
the English subcomponent would influence the structural aspect validity of the SAAT.
In the second stage of analysis, LISREL version 8.8 (Jöreskog & Sörbom, 2006) was used to confirm the factor model of item parcels to the SAAT items. The purpose of conducting CFA of item parceling was to further investigate the structural aspect validity of the SAAT test scores. De Bruin (2004) explained that item parcels can be constructed in the three following ways: (1) random assignment of items to parcels, (2) empirical assignment of items to parcels, and (3) a priori parcel construction. With the first method, the researcher assigns random items to parcels without replacement. With this method, however, the data must be unidimensional to justify the use of random parceling. On the other hand, when using the method of empirical assignment of items to parcels, the researcher constructs item parcels based on exploratory factor analysis results. That is, items with high correlations are combined to form a parcel. The third method that can be used is a priori parcel construction. Using this method, the researcher intentionally constructs sets of similar items that are combined to form parcels; this method is used in the current study. Thus, the 20 items within each subcomponent of the SAAT were divided into four groups to produce five item parcels (e.g., each parcel has four averaged items). The total number of the item parcels across the five subcomponents of the SAAT was 20. Several fit indices were used to evaluate the fit of the model to the SAAT data. More
2specifically, the chi-square test (X ), root mean square error of approximation (RMSEA), Goodness of Fit Index (GFI), comparative fit index (CFI), Tucker–Lewis index (TLI), standardized mean square residuals (SRMR), and Akaike Information Criterion (AIC) were all used. To test the hypothesis that the SAAT data fit a one-factor model (high school achievement), as written in the SAAT Manual, the chi-square test should have a P value of more than 0.05. Stated differently, there should be no significant difference between the actual and implied data matrix. Unfortunately, one drawback of using the chi-square as a test of fit is its sensitivity to sample size. Thus, to lessen this sensitivity to sample size, the test was divided by associated degrees of freedom. A value of 3 or less indicates a good fit of the data to the model (Kline, 2005). Assessment of RMSEA was another index designed to assess the approximate fit of the model to the data. In general, RMSEA values below 0.05 suggest a good fit, and those below 0.08 suggest reasonable fit (Hu & Bentler, 1999). The GFI is an index that provides an estimate of the total covariance accounted for by the model. The GFI is expected to be 0.95 or above for a good fit, whereas values of 0.90 suggest adequate fit (Hu & Bentler, 1999). Another goodness of fit statistic used in this study is the CFI. This index provides a population estimate of the improvement of the fit compared to the null model (Keith, 2014). As with GFI, CFI is expected to be 0.95 or above for a good fit and 0.90 for adequate fit (Hu & Bentler, 1999). The TLI is another fit index used in the current study. The TLI provides a slight adjustment for parsimony and is relatively independent of sample size (Tanaka, 1993). As with CFI, a value of 0.95 and above suggests a good fit of the model to the data. Standardized mean square residuals, which are conceptually obtained from averaging the differences between actual correlation matrix and that predicted by the model, were also used.
36
International Journal of Education and Psychological Research (IJEPR) Volume 7, Issue 1, March 2018
The SRMR is expected to be 0.08 or below for a good fit. Lastly, the AIC is a cross-validation index that can be used to compare the fit of two or more confirmatory factors modes that are not nested (Keith, 2014). Smaller values of AIC are better. Moreover, as an attempt to answer the second research question of this study, another CFA of item parcels was implemented. The purpose of this analysis was to evaluate whether removing the English subcomponent from the one-factor model would influence the structural aspect validity of the SAAT.
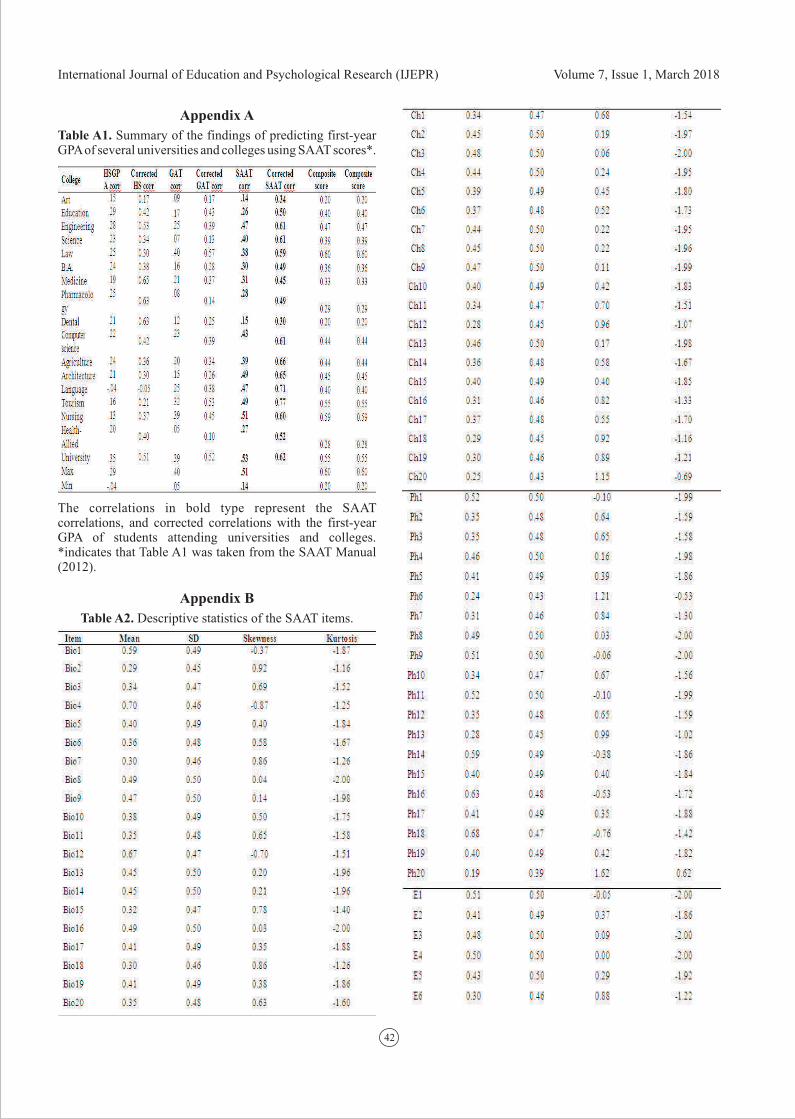
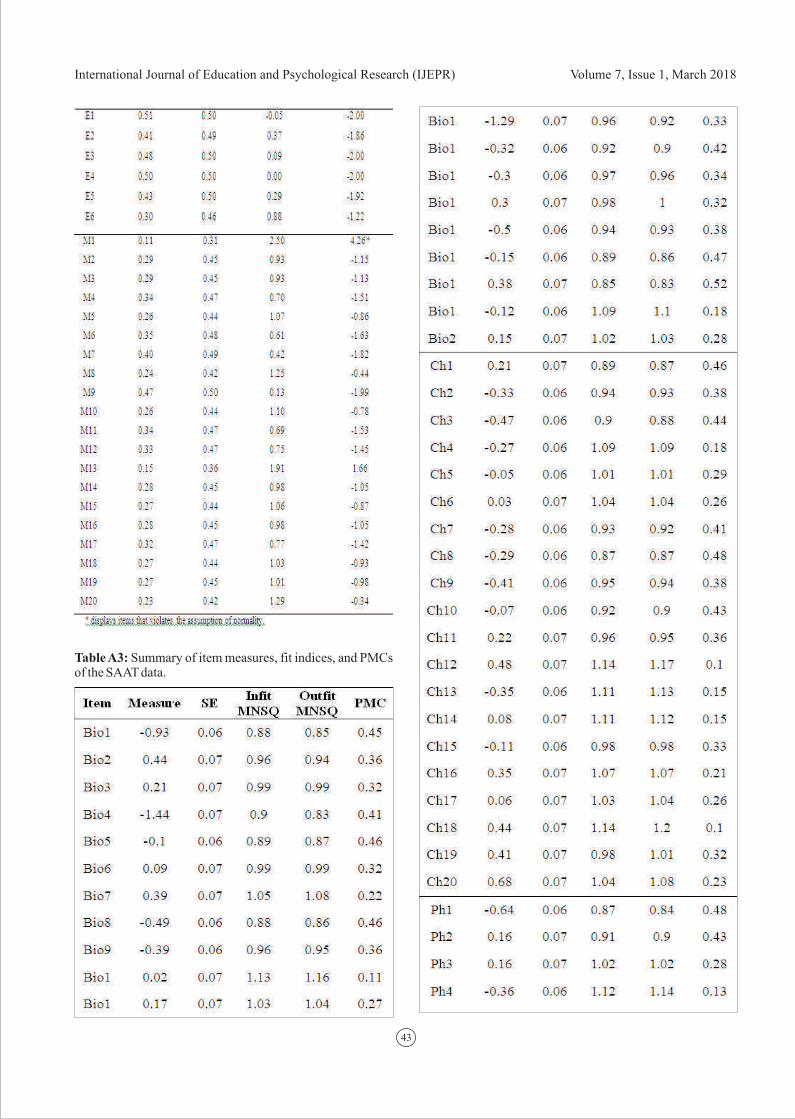
III. RESULTSPrior to the use of Rasch and CFA, descriptive statistics for each individual item of the SAAT test were obtained. The mean, standard deviation (SD), Skewness, and kurtosis were calculated for each individual test item across the five subcomponents of SAAT data (see Appendix B). For normally distributed data, Skewness is expected to be zero. However, a value between positive or negative 2 is considered to be within an acceptable range (Bachman, 2004). Kurtosis values should range between ±2, otherwise the distribution deviates from the norm. The findings indicate that the first item of the math subcomponent violated the assumption of normality. It had a Skewness value of 2.5 and a kurtosis value of 4.2, with a small mean of 0.11 and a narrower SD value of 0.31 compared to other items of the SAAT. On the other hand, Items 8 and 16 of the biology subcomponent, Item 3 of the chemistry subcomponent, Items 8 and 9 of the physics subcomponent, and Items 1, 3, 4, 7, 8, and 11 of the English subcomponent all had kurtosis values of -2, which indicates that the distributions of those items were flattened. Overall, the findings suggest that there were some items that deviated from normality.
Rasch Analysis
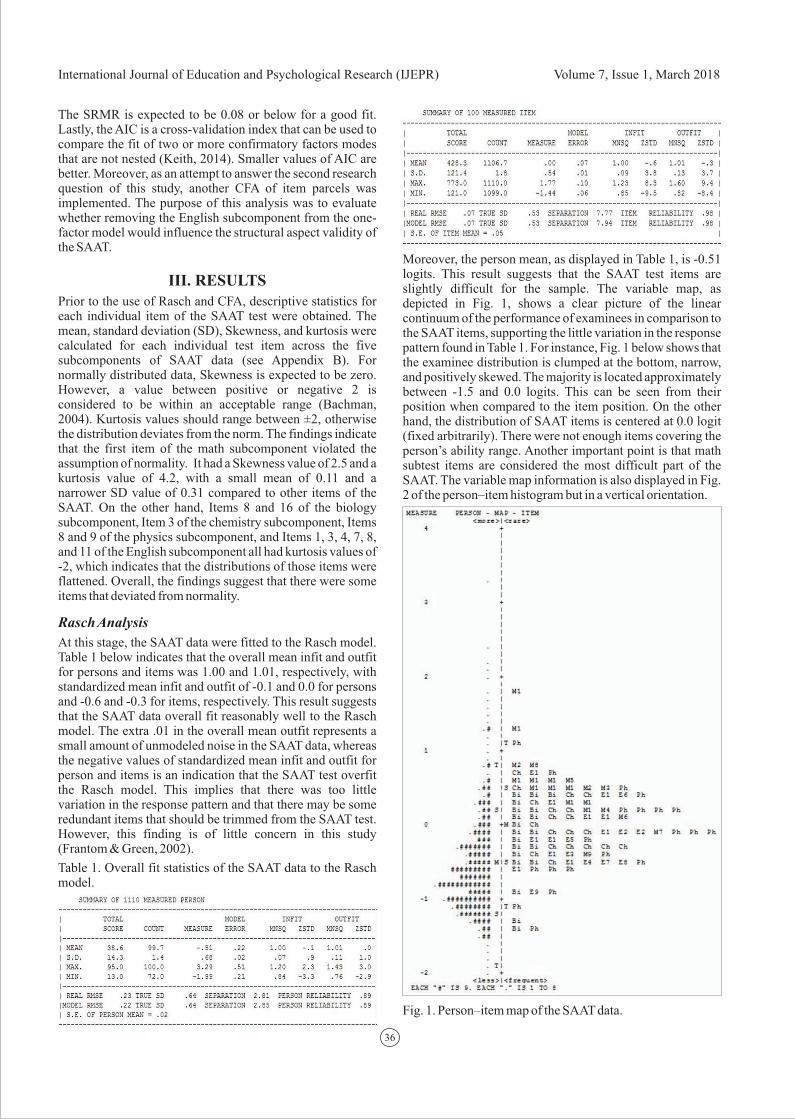
At this stage, the SAAT data were fitted to the Rasch model. Table 1 below indicates that the overall mean infit and outfit for persons and items was 1.00 and 1.01, respectively, with standardized mean infit and outfit of -0.1 and 0.0 for persons and -0.6 and -0.3 for items, respectively. This result suggests that the SAAT data overall fit reasonably well to the Rasch model. The extra .01 in the overall mean outfit represents a small amount of unmodeled noise in the SAAT data, whereas the negative values of standardized mean infit and outfit for person and items is an indication that the SAAT test overfit the Rasch model. This implies that there was too little variation in the response pattern and that there may be some redundant items that should be trimmed from the SAAT test. However, this finding is of little concern in this study (Frantom & Green, 2002).
Table 1. Overall fit statistics of the SAAT data to the Rasch model.
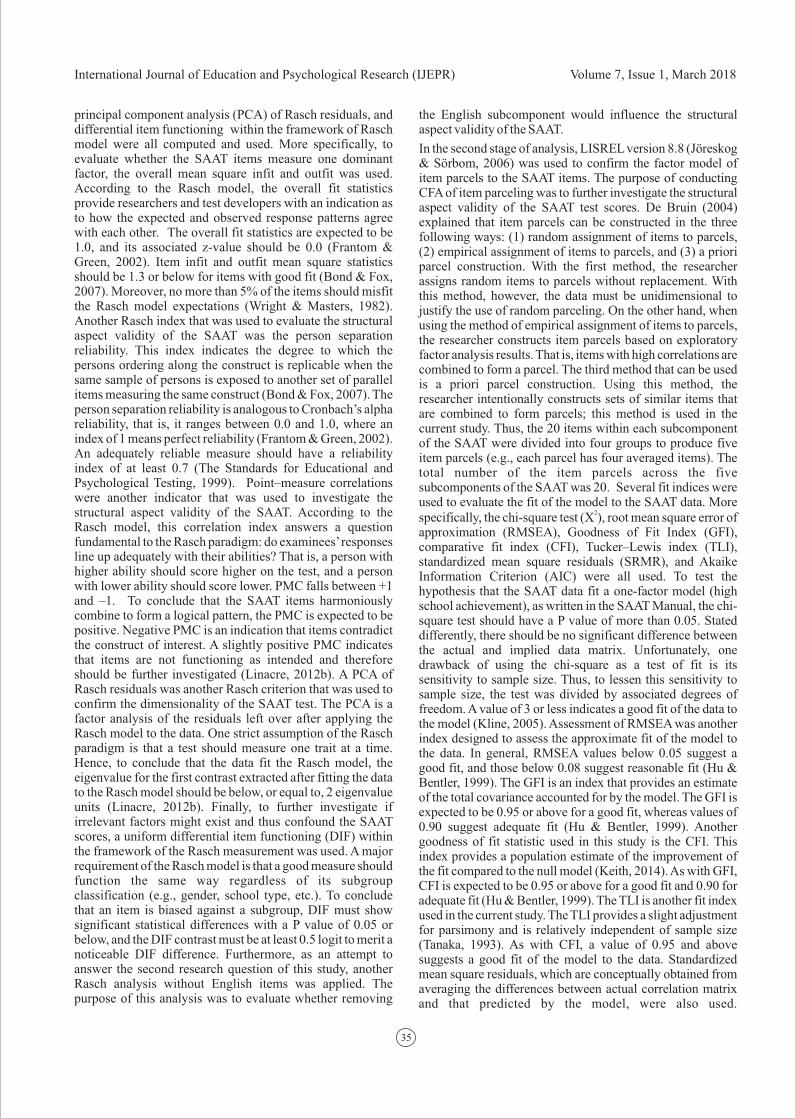
Moreover, the person mean, as displayed in Table 1, is -0.51 logits. This result suggests that the SAAT test items are slightly difficult for the sample. The variable map, as depicted in Fig. 1, shows a clear picture of the linear continuum of the performance of examinees in comparison to the SAAT items, supporting the little variation in the response pattern found in Table 1. For instance, Fig. 1 below shows that the examinee distribution is clumped at the bottom, narrow, and positively skewed. The majority is located approximately between -1.5 and 0.0 logits. This can be seen from their position when compared to the item position. On the other hand, the distribution of SAAT items is centered at 0.0 logit (fixed arbitrarily). There were not enough items covering the person’s ability range. Another important point is that math subtest items are considered the most difficult part of the SAAT. The variable map information is also displayed in Fig. 2 of the person–item histogram but in a vertical orientation.
Fig. 1. Person–item map of the SAAT data.
37
International Journal of Education and Psychological Research (IJEPR) Volume 7, Issue 1, March 2018
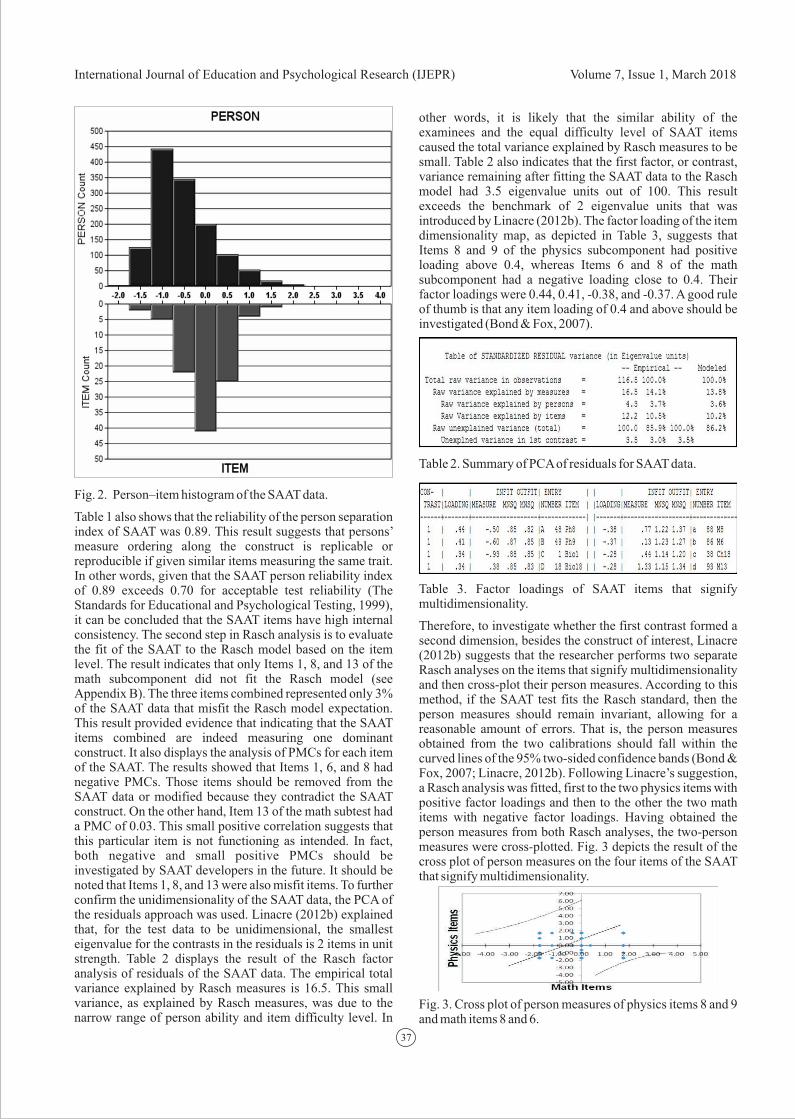
Fig. 2. Person–item histogram of the SAAT data.
Table 1 also shows that the reliability of the person separation index of SAAT was 0.89. This result suggests that persons’ measure ordering along the construct is replicable or reproducible if given similar items measuring the same trait. In other words, given that the SAAT person reliability index of 0.89 exceeds 0.70 for acceptable test reliability (The Standards for Educational and Psychological Testing, 1999), it can be concluded that the SAAT items have high internal consistency. The second step in Rasch analysis is to evaluate the fit of the SAAT to the Rasch model based on the item level. The result indicates that only Items 1, 8, and 13 of the math subcomponent did not fit the Rasch model (see Appendix B). The three items combined represented only 3% of the SAAT data that misfit the Rasch model expectation. This result provided evidence that indicating that the SAAT items combined are indeed measuring one dominant construct. It also displays the analysis of PMCs for each item of the SAAT. The results showed that Items 1, 6, and 8 had negative PMCs. Those items should be removed from the SAAT data or modified because they contradict the SAAT construct. On the other hand, Item 13 of the math subtest had a PMC of 0.03. This small positive correlation suggests that this particular item is not functioning as intended. In fact, both negative and small positive PMCs should be investigated by SAAT developers in the future. It should be noted that Items 1, 8, and 13 were also misfit items. To further confirm the unidimensionality of the SAAT data, the PCA of the residuals approach was used. Linacre (2012b) explained that, for the test data to be unidimensional, the smallest eigenvalue for the contrasts in the residuals is 2 items in unit strength. Table 2 displays the result of the Rasch factor analysis of residuals of the SAAT data. The empirical total variance explained by Rasch measures is 16.5. This small variance, as explained by Rasch measures, was due to the narrow range of person ability and item difficulty level. In
other words, it is likely that the similar ability of the examinees and the equal difficulty level of SAAT items caused the total variance explained by Rasch measures to be small. Table 2 also indicates that the first factor, or contrast, variance remaining after fitting the SAAT data to the Rasch model had 3.5 eigenvalue units out of 100. This result exceeds the benchmark of 2 eigenvalue units that was introduced by Linacre (2012b). The factor loading of the item dimensionality map, as depicted in Table 3, suggests that Items 8 and 9 of the physics subcomponent had positive loading above 0.4, whereas Items 6 and 8 of the math subcomponent had a negative loading close to 0.4. Their factor loadings were 0.44, 0.41, -0.38, and -0.37. A good rule of thumb is that any item loading of 0.4 and above should be investigated (Bond & Fox, 2007).
Table 2. Summary of PCA of residuals for SAAT data.
Table 3. Factor loadings of SAAT items that signify multidimensionality.
Therefore, to investigate whether the first contrast formed a second dimension, besides the construct of interest, Linacre (2012b) suggests that the researcher performs two separate Rasch analyses on the items that signify multidimensionality and then cross-plot their person measures. According to this method, if the SAAT test fits the Rasch standard, then the person measures should remain invariant, allowing for a reasonable amount of errors. That is, the person measures obtained from the two calibrations should fall within the curved lines of the 95% two-sided confidence bands (Bond & Fox, 2007; Linacre, 2012b). Following Linacre’s suggestion, a Rasch analysis was fitted, first to the two physics items with positive factor loadings and then to the other the two math items with negative factor loadings. Having obtained the person measures from both Rasch analyses, the two-person measures were cross-plotted. Fig. 3 depicts the result of the cross plot of person measures on the four items of the SAAT that signify multidimensionality.
Fig. 3. Cross plot of person measures of physics items 8 and 9 and math items 8 and 6.
38
International Journal of Education and Psychological Research (IJEPR) Volume 7, Issue 1, March 2018
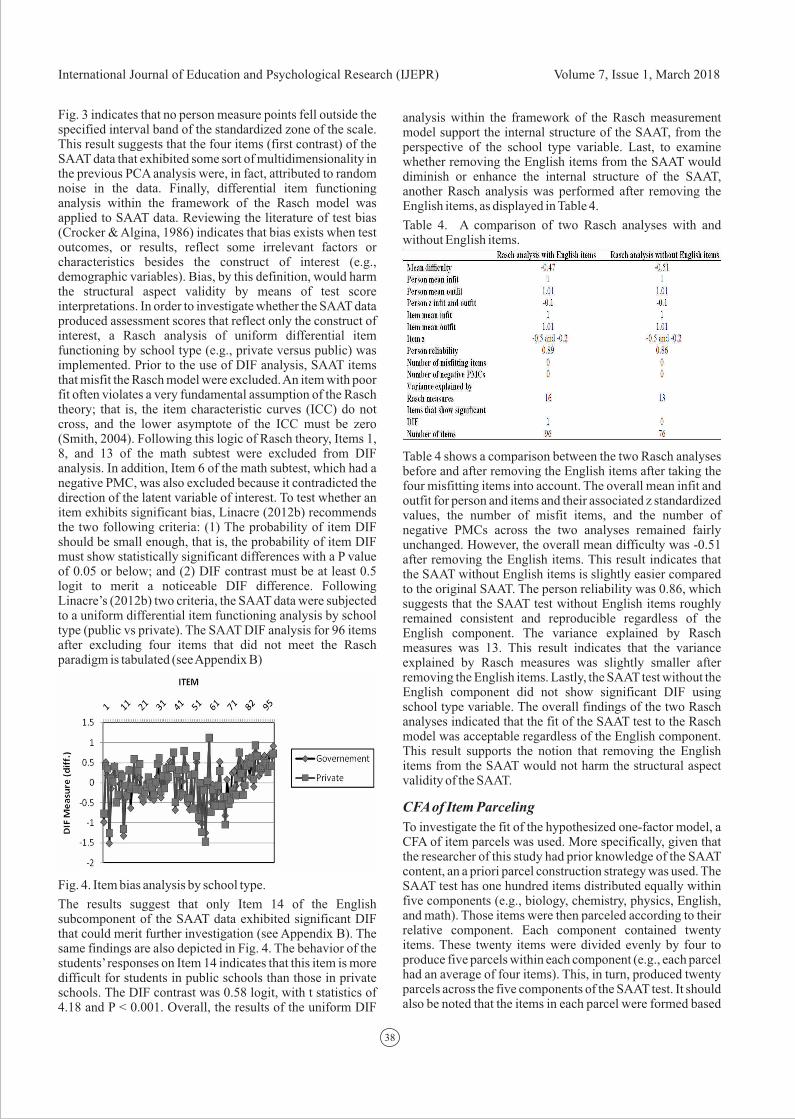
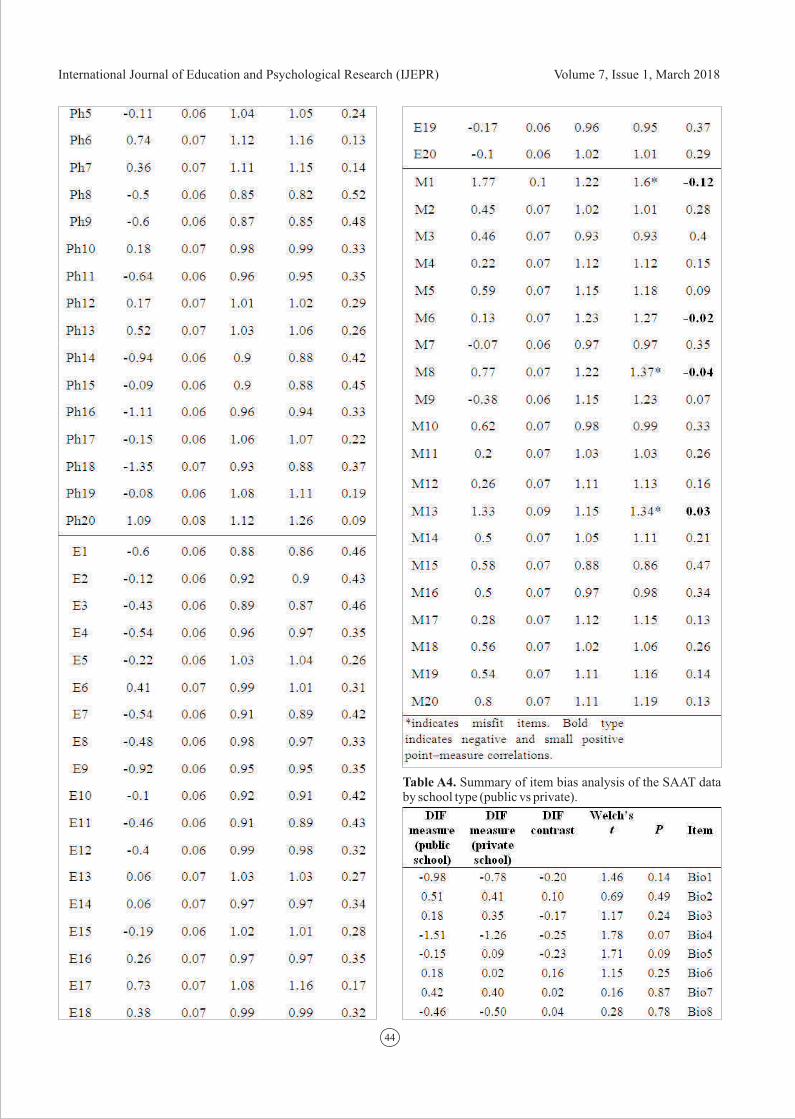
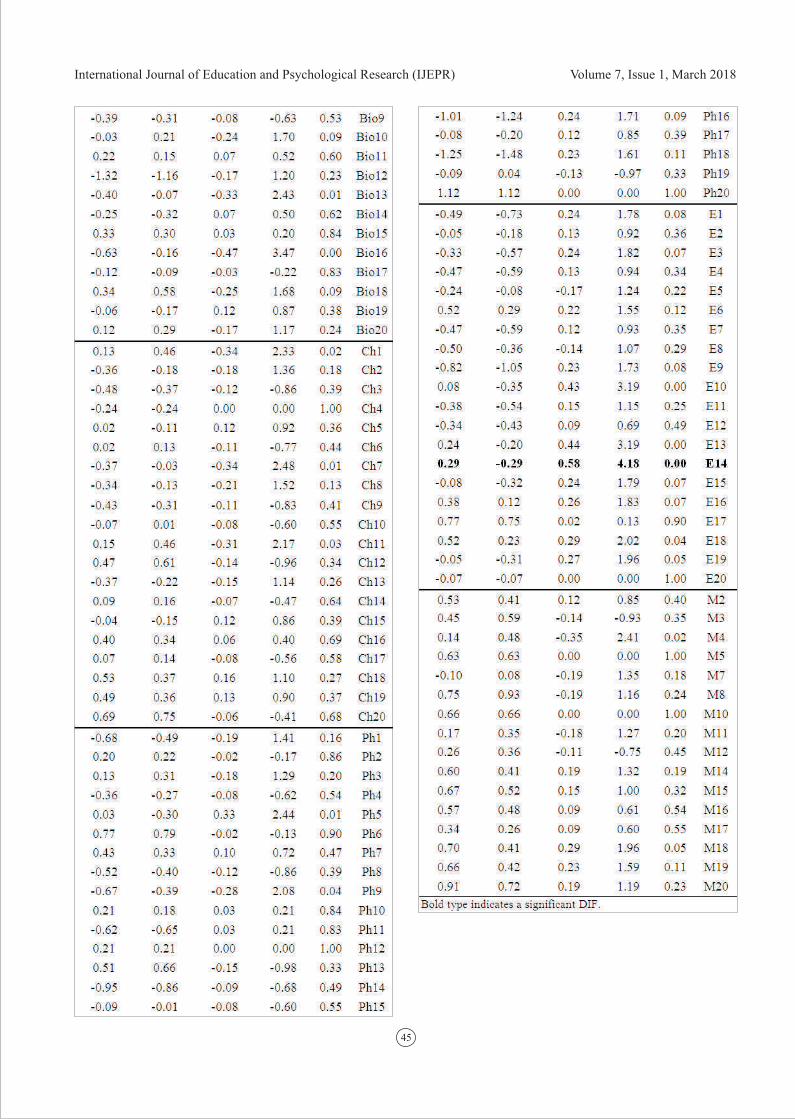
Fig. 3 indicates that no person measure points fell outside the specified interval band of the standardized zone of the scale. This result suggests that the four items (first contrast) of the SAAT data that exhibited some sort of multidimensionality in the previous PCA analysis were, in fact, attributed to random noise in the data. Finally, differential item functioning analysis within the framework of the Rasch model was applied to SAAT data. Reviewing the literature of test bias (Crocker & Algina, 1986) indicates that bias exists when test outcomes, or results, reflect some irrelevant factors or characteristics besides the construct of interest (e.g., demographic variables). Bias, by this definition, would harm the structural aspect validity by means of test score interpretations. In order to investigate whether the SAAT data produced assessment scores that reflect only the construct of interest, a Rasch analysis of uniform differential item functioning by school type (e.g., private versus public) was implemented. Prior to the use of DIF analysis, SAAT items that misfit the Rasch model were excluded. An item with poor fit often violates a very fundamental assumption of the Rasch theory; that is, the item characteristic curves (ICC) do not cross, and the lower asymptote of the ICC must be zero (Smith, 2004). Following this logic of Rasch theory, Items 1, 8, and 13 of the math subtest were excluded from DIF analysis. In addition, Item 6 of the math subtest, which had a negative PMC, was also excluded because it contradicted the direction of the latent variable of interest. To test whether an item exhibits significant bias, Linacre (2012b) recommends the two following criteria: (1) The probability of item DIF should be small enough, that is, the probability of item DIF must show statistically significant differences with a P value of 0.05 or below; and (2) DIF contrast must be at least 0.5 logit to merit a noticeable DIF difference. Following Linacre’s (2012b) two criteria, the SAAT data were subjected to a uniform differential item functioning analysis by school type (public vs private). The SAAT DIF analysis for 96 items after excluding four items that did not meet the Rasch paradigm is tabulated (see Appendix B)
Fig. 4. Item bias analysis by school type.
The results suggest that only Item 14 of the English subcomponent of the SAAT data exhibited significant DIF that could merit further investigation (see Appendix B). The same findings are also depicted in Fig. 4. The behavior of the students’ responses on Item 14 indicates that this item is more difficult for students in public schools than those in private schools. The DIF contrast was 0.58 logit, with t statistics of 4.18 and P < 0.001. Overall, the results of the uniform DIF
analysis within the framework of the Rasch measurement model support the internal structure of the SAAT, from the perspective of the school type variable. Last, to examine whether removing the English items from the SAAT would diminish or enhance the internal structure of the SAAT, another Rasch analysis was performed after removing the English items, as displayed in Table 4.
Table 4. A comparison of two Rasch analyses with and without English items.
Table 4 shows a comparison between the two Rasch analyses before and after removing the English items after taking the four misfitting items into account. The overall mean infit and outfit for person and items and their associated z standardized values, the number of misfit items, and the number of negative PMCs across the two analyses remained fairly unchanged. However, the overall mean difficulty was -0.51 after removing the English items. This result indicates that the SAAT without English items is slightly easier compared to the original SAAT. The person reliability was 0.86, which suggests that the SAAT test without English items roughly remained consistent and reproducible regardless of the English component. The variance explained by Rasch measures was 13. This result indicates that the variance explained by Rasch measures was slightly smaller after removing the English items. Lastly, the SAAT test without the English component did not show significant DIF using school type variable. The overall findings of the two Rasch analyses indicated that the fit of the SAAT test to the Rasch model was acceptable regardless of the English component. This result supports the notion that removing the English items from the SAAT would not harm the structural aspect validity of the SAAT.
CFA of Item Parceling
To investigate the fit of the hypothesized one-factor model, a CFA of item parcels was used. More specifically, given that the researcher of this study had prior knowledge of the SAAT content, an a priori parcel construction strategy was used. The SAAT test has one hundred items distributed equally within five components (e.g., biology, chemistry, physics, English, and math). Those items were then parceled according to their relative component. Each component contained twenty items. These twenty items were divided evenly by four to produce five parcels within each component (e.g., each parcel had an average of four items). This, in turn, produced twenty parcels across the five components of the SAAT test. It should also be noted that the items in each parcel were formed based
39
International Journal of Education and Psychological Research (IJEPR) Volume 7, Issue 1, March 2018
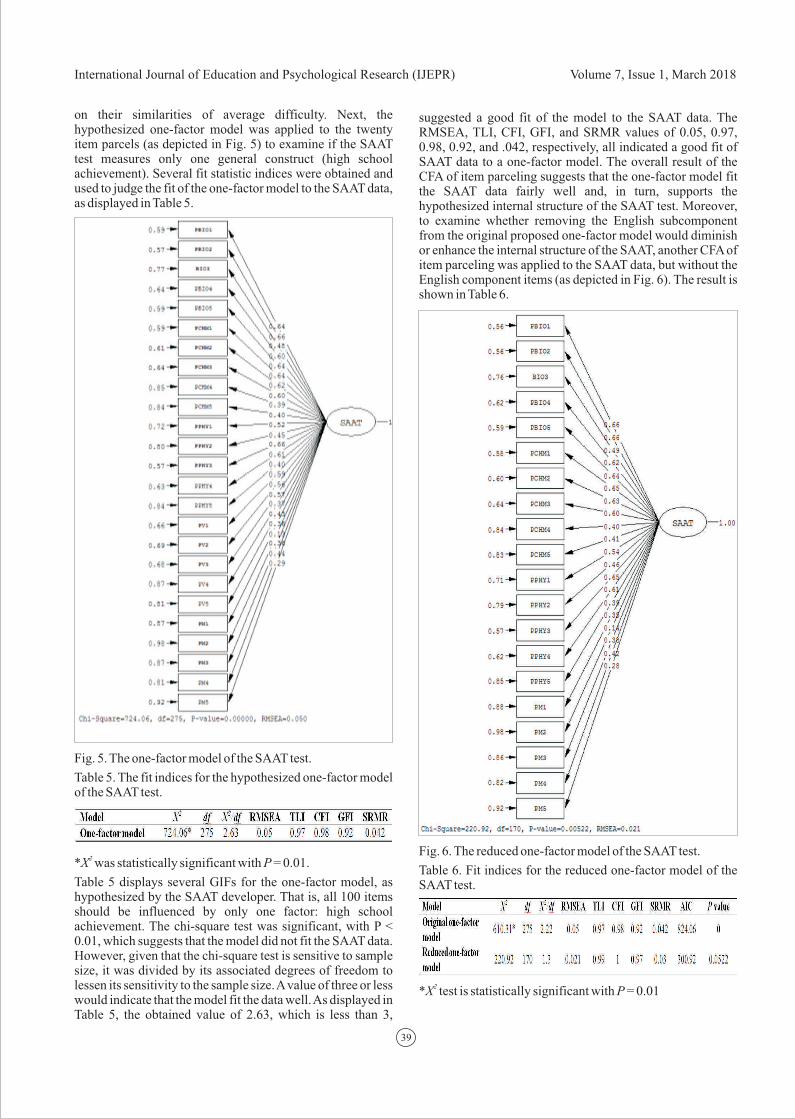
on their similarities of average difficulty. Next, the hypothesized one-factor model was applied to the twenty item parcels (as depicted in Fig. 5) to examine if the SAAT test measures only one general construct (high school achievement). Several fit statistic indices were obtained and used to judge the fit of the one-factor model to the SAAT data, as displayed in Table 5.
Fig. 5. The one-factor model of the SAAT test.
Table 5. The fit indices for the hypothesized one-factor model of the SAAT test.
2*X was statistically significant with P = 0.01.
Table 5 displays several GIFs for the one-factor model, as hypothesized by the SAAT developer. That is, all 100 items should be influenced by only one factor: high school achievement. The chi-square test was significant, with P < 0.01, which suggests that the model did not fit the SAAT data. However, given that the chi-square test is sensitive to sample size, it was divided by its associated degrees of freedom to lessen its sensitivity to the sample size. A value of three or less would indicate that the model fit the data well. As displayed in Table 5, the obtained value of 2.63, which is less than 3,
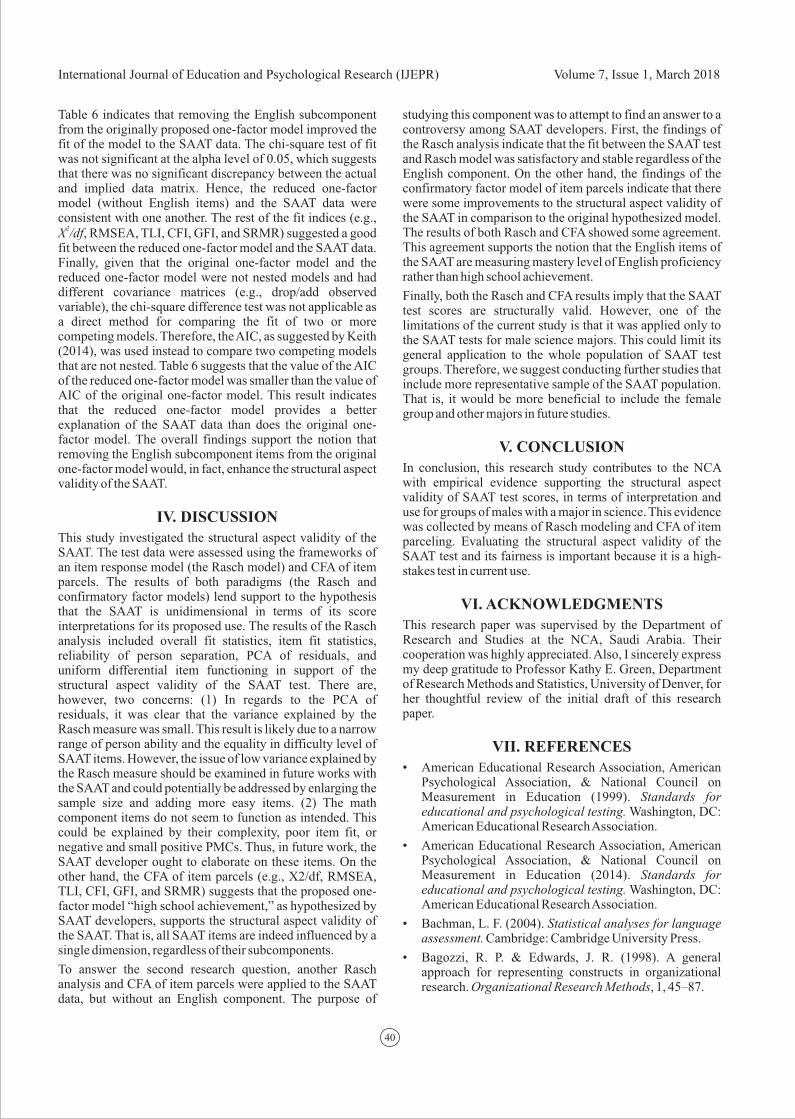
suggested a good fit of the model to the SAAT data. The RMSEA, TLI, CFI, GFI, and SRMR values of 0.05, 0.97, 0.98, 0.92, and .042, respectively, all indicated a good fit of SAAT data to a one-factor model. The overall result of the CFA of item parceling suggests that the one-factor model fit the SAAT data fairly well and, in turn, supports the hypothesized internal structure of the SAAT test. Moreover, to examine whether removing the English subcomponent from the original proposed one-factor model would diminish or enhance the internal structure of the SAAT, another CFA of item parceling was applied to the SAAT data, but without the English component items (as depicted in Fig. 6). The result is shown in Table 6.
Fig. 6. The reduced one-factor model of the SAAT test.
Table 6. Fit indices for the reduced one-factor model of the SAAT test.
2*X test is statistically significant with P = 0.01
40
International Journal of Education and Psychological Research (IJEPR) Volume 7, Issue 1, March 2018
Table 6 indicates that removing the English subcomponent from the originally proposed one-factor model improved the fit of the model to the SAAT data. The chi-square test of fit was not significant at the alpha level of 0.05, which suggests that there was no significant discrepancy between the actual and implied data matrix. Hence, the reduced one-factor model (without English items) and the SAAT data were consistent with one another. The rest of the fit indices (e.g.,
2X /df, RMSEA, TLI, CFI, GFI, and SRMR) suggested a good fit between the reduced one-factor model and the SAAT data. Finally, given that the original one-factor model and the reduced one-factor model were not nested models and had different covariance matrices (e.g., drop/add observed variable), the chi-square difference test was not applicable as a direct method for comparing the fit of two or more competing models. Therefore, the AIC, as suggested by Keith (2014), was used instead to compare two competing models that are not nested. Table 6 suggests that the value of the AIC of the reduced one-factor model was smaller than the value of AIC of the original one-factor model. This result indicates that the reduced one-factor model provides a better explanation of the SAAT data than does the original one-factor model. The overall findings support the notion that removing the English subcomponent items from the original one-factor model would, in fact, enhance the structural aspect validity of the SAAT.
IV. DISCUSSION This study investigated the structural aspect validity of the SAAT. The test data were assessed using the frameworks of an item response model (the Rasch model) and CFA of item parcels. The results of both paradigms (the Rasch and confirmatory factor models) lend support to the hypothesis that the SAAT is unidimensional in terms of its score interpretations for its proposed use. The results of the Rasch analysis included overall fit statistics, item fit statistics, reliability of person separation, PCA of residuals, and uniform differential item functioning in support of the structural aspect validity of the SAAT test. There are, however, two concerns: (1) In regards to the PCA of residuals, it was clear that the variance explained by the Rasch measure was small. This result is likely due to a narrow range of person ability and the equality in difficulty level of SAAT items. However, the issue of low variance explained by the Rasch measure should be examined in future works with the SAAT and could potentially be addressed by enlarging the sample size and adding more easy items. (2) The math component items do not seem to function as intended. This could be explained by their complexity, poor item fit, or negative and small positive PMCs. Thus, in future work, the SAAT developer ought to elaborate on these items. On the other hand, the CFA of item parcels (e.g., X2/df, RMSEA, TLI, CFI, GFI, and SRMR) suggests that the proposed one-factor model “high school achievement,” as hypothesized by SAAT developers, supports the structural aspect validity of the SAAT. That is, all SAAT items are indeed influenced by a single dimension, regardless of their subcomponents.
To answer the second research question, another Rasch analysis and CFA of item parcels were applied to the SAAT data, but without an English component. The purpose of
studying this component was to attempt to find an answer to a controversy among SAAT developers. First, the findings of the Rasch analysis indicate that the fit between the SAAT test and Rasch model was satisfactory and stable regardless of the English component. On the other hand, the findings of the confirmatory factor model of item parcels indicate that there were some improvements to the structural aspect validity of the SAAT in comparison to the original hypothesized model. The results of both Rasch and CFA showed some agreement. This agreement supports the notion that the English items of the SAAT are measuring mastery level of English proficiency rather than high school achievement.
Finally, both the Rasch and CFA results imply that the SAAT test scores are structurally valid. However, one of the limitations of the current study is that it was applied only to the SAAT tests for male science majors. This could limit its general application to the whole population of SAAT test groups. Therefore, we suggest conducting further studies that include more representative sample of the SAAT population. That is, it would be more beneficial to include the female group and other majors in future studies.
V. CONCLUSIONIn conclusion, this research study contributes to the NCA with empirical evidence supporting the structural aspect validity of SAAT test scores, in terms of interpretation and use for groups of males with a major in science. This evidence was collected by means of Rasch modeling and CFA of item parceling. Evaluating the structural aspect validity of the SAAT test and its fairness is important because it is a high-stakes test in current use.
VI. ACKNOWLEDGMENTSThis research paper was supervised by the Department of Research and Studies at the NCA, Saudi Arabia. Their cooperation was highly appreciated. Also, I sincerely express my deep gratitude to Professor Kathy E. Green, Department of Research Methods and Statistics, University of Denver, for her thoughtful review of the initial draft of this research paper.
VII. REFERENCES • American Educational Research Association, American
Psychological Association, & National Council on Measurement in Education (1999). Standards for educational and psychological testing. Washington, DC: American Educational Research Association.
• American Educational Research Association, American Psychological Association, & National Council on Measurement in Education (2014). Standards for educational and psychological testing. Washington, DC: American Educational Research Association.
• Bachman, L. F. (2004). Statistical analyses for language assessment. Cambridge: Cambridge University Press.
• Bagozzi, R. P. & Edwards, J. R. (1998). A general approach for representing constructs in organizational research. Organizational Research Methods, 1, 45–87.
41
International Journal of Education and Psychological Research (IJEPR) Volume 7, Issue 1, March 2018
• Bagozzi, R. P. & Heatherton, T. F. (1994). A general approach to representing multifaceted personality constructs: Application to state self-esteem. Structural Equation Modeling, 1, 35–67.
• Bandalos, D. L. (2002). The Effects of item parceling on goodness-of-fit and parameter estimate bias in structural equation modeling. Educational Psychology Papers and Publications, 65.
• Bond, T. G. & Fox, C. M. (2007). Applying the Rasch model: fundamental measurement in the human sciences. Mahwah, NJ: Lawrence Erlbaum Associates.
• Cattell, R. B. (1956). Validation and intensification of the sixteen personality factor questionnaire. Journal of Clinical Psychology, 12, 205–214.
• Cattell, R. B., & Burdsal, C. A., Jr. (1975). The radial parceling double factoring design: A solution to the item-vs.-parcel controversy. Multivariate Behavioral Research, 10, 165–179.
• Comrey, A.L. (1988). Factor analytic methods of scale development in personality and clinical psychology. Journal of Consulting and Clinical Psychology, 56, 754-761.
• Crocker, L. & Algina, J. (1986). Introduction to classical and modern test theory. Philadelphia: Harcourt Brace Jovanovich College Publishers.
• De Bruin, G. (2004). Problems with the factor analysis of items: solutions based on item response theory and item parceling. Journal of Industrial Psychology, 30(4), 16-26
• Frantom, C. G. & Green, K. E. (2002). Survey development and validation with the Rasch model. Paper presented at the International Conference on Questionnaire Development, Evaluation, and Testing, Charleston, SC, November
• Hall, R., Snell, A. F., & Foust, M. S. (1999). Item parceling strategies in SEM: investigating the subtle effects of unmodeled Secondary Constructs. Organizational Research Methods, 2(3), 233-256
• Hu, L. T. & Bentler, P. M. (1999). Cutoff criteria for fit indexes in covariance structure analysis: Conventional criteria versus new alternatives. Structural Equation Modeling, 6(1), 1–55. Jöreskog, K.G. & Sörbom, D. (2006). LISREL 8.8 for Windows [Computer software]. Lincolnwood, IL: Scientific Software International, Inc.
• Kaplan, R.M. & Saccuzzo, D.P. (2012). Psychological testing: Principles, applications, and issues, (8th ed.). Belmont, CA: Wadsworth, Centage Learning
• Keith, T.Z. (2014). Multiple regression and beyond: An introduction to multiple regression and structure equation modeling (2nd ed). NY: Routledge.
• Kirsch, I.S. & Guthrie, J.T. (1980). Construct validity of functional reading tests. Journal of Educational Measurement, 17(2), 81-93.
• Kishton, J.M. & Widaman, K.F. (1994). Unidimensional versus domain representative parceling of questionnaire items. Educational and Psychological Measurement, 54, 757-765.
• Kline, R. B. (2005). Principles and practice of structural equation modeling (2nd ed). New York, NY: Guilford Press.
• Linacre, J.M. (2012a). Winsteps® (Version 3.75.1) [Compute r Sof tware ] . Beaver ton , Oregon : Winsteps.com.
• Linacre, J. M. (2012b). Winsteps® Rasch measurement computer program User's Guide. Beaverton, Oregon: Winsteps.com
• Little, T.D., Cunningham, W.A., Shahar, G. & Widaman, K.F. (2002). To parcel or not to parcel: Exploring the question, weighing the merits. Structural Equation Modeling, 9, 151-173.
• Lawrence, I. M., & Dorans, N. J. (1987, April). An assessment of the dimensionality of SAT-Mathematical. Paper presented at the annual meeting of the National Council on Measurement in Education, Washington, DC.
• Manhart, J. J. (1996). Factor analytic methods for determining whether multiple-choice and constructed-response tests measure the same construct. Paper presented at the annual meeting of the National Council on Measurement in Education, New York.
• Marsh, H. W. (1994). Confirmatory factor analysis models of factorial invariance: A multifaceted approach. Structural Equation Modeling, 1, 5-34.
• National Center for Assessment in Higher Education (2012). Standardized Achievement Admission Test (SAAT) Manual. Riyadh, Saudi Arabia: National Center for Assessment.
• Rasch, G. (1960). Probabilistic models for some intelligence and attainment tests. Copenhagen: Danmarks Paedagogiske Institute.
• Smith, R. M. (2004). Detecting item bias with the Rasch model. In Jr., Smith & R. M. Smith (Eds.), Introduction to Rasch measurement (391-418). Maple Grove, Minnesota: JAM Press.
• Wright, B. D. & Masters, G. N. (1982). Rating scale analysis. Chicago: MESA Press.
• Wright, B. & Stone, M. H. (1999). Measurement essentials. (2nd ed). Wilmington, Delaware: Wide Range, Inc.
• Tanaka, J.S. (1993). Multifaceted conceptions of fit in structural equation models. In K.A. Bollen & J.S. Long (Eds.), Testing Structural Equation Models (pp. 10–39). Newbury Park, California: Sage Publications, Inc.
42
International Journal of Education and Psychological Research (IJEPR) Volume 7, Issue 1, March 2018
Appendix A
Table A1. Summary of the findings of predicting first-year GPA of several universities and colleges using SAAT scores*.
The correlations in bold type represent the SAAT correlations, and corrected correlations with the first-year GPA of students attending universities and colleges. *indicates that Table A1 was taken from the SAAT Manual (2012).
Appendix B
Table A2. Descriptive statistics of the SAAT items.
43
International Journal of Education and Psychological Research (IJEPR) Volume 7, Issue 1, March 2018
Table A3: Summary of item measures, fit indices, and PMCs of the SAAT data.
44
International Journal of Education and Psychological Research (IJEPR) Volume 7, Issue 1, March 2018
Table A4. Summary of item bias analysis of the SAAT data by school type (public vs private).
45
International Journal of Education and Psychological Research (IJEPR) Volume 7, Issue 1, March 2018