Embed Size (px)
Citation preview

ED 356 968
AUTHORTITLEINSTITUTION
SPONS AGENCY
REPORT NOPUB DATECONTRACTNOTEAVAILABLE FROM
PUB TYPE
EDRS PRICEDESCRIPTORS
DOCUMENT RESUME
SE 053 457
Bergandine, David R.; Holm, D. AndrewPlastics in Perspective.Illinois Univ., Springfield. Center for Solid WasteManagement and Research, Springfield.Illinois State Dept. of Energy and Natural Resources,Springfield.ILENR/RR-91-18Sep 91SWR-280p.Illinois Dept. of Energy and Natural Resources, ENRClearinghouse, 325 West Adams Street, Room 300,Springfield, IL 62704-1892.Guides Classroom Use Teaching Guides (ForTeacher) (052)
MF01/PC04 Plus Postage.Class Activities; Consumer Education; CurriculumGuides; Environmental Education; High Schools; JuniorHigh Schools; Learning Activities; Lesson Plans;Middle Schools; *Plastics; *Recycling; ScienceEducation; *Solid Wastes; Teaching Methods; Units ofStudy; Values; Was e Disposal
IDENTIFIERS Environmental Impact; *Environmental Issues;Illinois; Packaging; Social Impact
ABSTRACTThe materials in this curriculum supplement,
developed for middle school or high school science classes, presentsolid waste problems related to plastics. The set of curriculummaterials is divided into two units to be used together orindependently. Unit I begins by comparing patterns in solid wastefrom 1960 to 1990 and introducing methods for plasticsidentification. The 11 lessons in the unit explore the raw materialsof plastics, leads observations of what happens to plastic litter,and introduces alternatives to dumping, including incineration,reuse, and recycling. A community suivey is proposed as a basis fordeveloping a plan for recycling and waste reduction for thecommunity. Biodegradable and photodegradable plastics are studied inunit II as the factors that cause degradable plastics to break downin the environment are explored. The unit describes severaldegradation tests that allow students to set up projects that monitorthe rate of degradation for a variety of plastics. The lessors arespecific to Illinois classrooms but may be adapted for other states.(MC0)
***********************************************************************
Reproductions supplied by EDRS are the best that can be madefrom the original document.
***********************************************************************

ILENR/12R-91/18September 1991
Plasticsin
Perspective
"PERMISSION TO REPRODUCE THIS
MATERIAL HAS BEEN GRANTED BY
Kathy En elson
TO THE EDUCATIONAL RESOURCES
INFORMATION CENTER (ERIC)."
U.S. DEPARTMENT OF EDUCATIONOffice Cl EduLaUonal Research and Improvement
EDUCATIONALCENTER (RESOURERIC)CES INFORMADON
I<TOtS document bye been reproduced asreceived from the person or OrgantzattonoriginatingMinor changes have been made to improveeproduction quality
Points of view or opinions stated in this docusoent do nOt necessarily represent othc.a,OEM position or policy
IIM111111IMM MUM IIIllinois Department of
Energy and Natural Resources
University of IllinoisCenter for Solid Waste
Management and Research
BEST L'371 OAP tr;LfrAmfir

Plasticsin
Perspective
Plastics: Waste Reduction/RecyclingDavid R. Bergandine
Degradable Plastics and the EnvironmentPart of the Solution or Just More Pollution?
D. Andrew Holm, Ph.D.
3
Li

ACKNOWLEDGMENTS
Authors:
David R. Bergandine, University High School, Urbana, Illinois
D. Andrew Holm, Ph.D., Parkland College, Champaign, Illinois
Artists:Jody Anselment Boles, Graphic Design
John Sherrod, Illustrations
Advisory Committee:
Marilyn Sinclair Charlie Weller
T. J. Jacob Kathy Engelson
University of Illinois
Center for Solid Waste Management and Research, 1991Funded by Grant No. SWR-2Illinois Department of Energy and Natural ResourcesOffice of Recycling and Waste ReductionSpringfield, Illinois 62704-1892
This document has been reviewed by the Illinois Department of Energy and Natural Resources (ENR)and approved for publication. Statements made by the authors may or fi:ay not represent the views ofthe department. Additional copies of this document are available through the ENR clearinghouse at1-800-252-8955.
4

FOREWORD
Plastics in Perspective
Many of the most troubling aspects of the solid waste problems facing our society center around plastics,that versatile family of substances developed from petroleum--a nonrenewable resourcethat does notreadily recycle through the natural ecosystem. The materials in this curriculum supplement have beendeveloped for use with students in middle school or high school science classes.
This set of curriculum materials is divided into two units, each developed and written by a different author.It is not essential that both sections be taught. However, the writers and reviewers feel that the twosections complement each other and when presented together provide an in-depth picture of the plasticwaste dilemma facing us all. It is hoped that this material will help our young people become betterfnforme.: citizens and decision makers, prepared to improve our record of resource use.
Unit I begins by comparing patterns in solid waste from 1960 and 1990. It introduces the plastics used inour everyday lives and gives methods for identifying the various kinds of plastics Trough laboratory work.The unit explores the raw materials of plastics and leads observations of what happens to plastic litter. Al-ternatives to dumping, including incineration, reuse, and recycling, are explored. A community survey isproposed as a basis for developing a plan for recycling and waste reduction for the community.
Unit II explores the factors that cause degradable plastics to break down in the environment. Two maintypes of degradable plastics are studied: biodegradable and photodegradable. The unit describes severaldegradation tests which allow the students to set up projects that monitor the rate of degradation for avariety of plastics.
The authors used several sources for the statistics used in their units. These sources do not always agreeand small differences exist. It is important to note the source of information. You might have the studentsdiscuss why these numbers are different.
5
t)

Table of Contents
Unit IPlastics: Waste Reduction/Recycling
Introduction
Overview
Lesson One Hanging in the Balance
Lesson Two The Scavengers
Lesson Three Plastic in the Laboratory
Lesson Four A Chain Reaction
Lesson Five Longevity of Litter
Lesson Six Getting Into Trash
Lesson Seven A Mountain of Trash
Lesson Eight Where Do We Go From Here?
Lesson Nine The Reality of Recycling
Lesson Ten Surveying the Situation
Lesson Eleven Wrapping It Up
Bibliography
Mailing List
11
13
17
23
27
31
43
45
47
49
53
57
63
65
69
75
77
79
81
83
85
87
91
93
97
Unit 11Degradable Plastics and the EnvironmentPart of the Solution or Just More Pollution?
Introduction
The Problem
A Potential Solution
Types of Degradation
Biodegradation
Photodegradation
Examples of Independent Research Projects
Other Projects Dealing With Degradation Variables
Possible Degradation Tests
References
7

Plastics:Waste Reduction/
Recycling
David R. BergandineUniversity High School
Urbana, Illinois
9

Introduction
PLASTICS: WASTE REDUCTION/RECYCLING
Plastic is by far the fastest growing portion of the solid waste stream in America, and it will likely increaseby another 50 percent in the next 10 years. Plastic seems to be destined for the junk heapbut why? Whatis plastic made of? What is it used for? How much plastic is manufactured? How much plastic is discarded?What happens to it after it is thrown away? What is in the future for plastic? What are the costs in a societywith plastic? What are the costs in a society without plastic? How long can we ignore the issue?
Without doubt, Americans are part of a throwaway society, and according to data published by FranklinAssociates for the U.S. EPA, we are rapidly becoming more wasteful. In the 30 years from 1960 to 1990,the weight of trash produced in our cities and towns has nearly doubled. While this in and of itself may notseem alarming (amounts of trash would probably grow with populationthough our population has notdoubled in that same time), what is more strik'ng is the behavior of the individual. Over this same period, thepounds of trash per person per day graw from 2.48 to 3.27 (almost one-third more). In other words, in 1990,everyone in the United States is personally responsible for almost 1,200 pounds of trash per year, a total ofmore than 300 billion pounds of garbage.
We literally create a mountain of trash every year that should become an obvious mountain range on ourlandscape. However, rather than leaving this refuse where it might be seen, we have buried it. Once out ofsight it is out of mind. But placing trash in landfills has not solved the problem of solid waste. In fact, landfillspace is rapidly declining, and many operating landfills have problems with leaching and gas production,among others. Entombing our waste has merely postponed addressing the real issues and in the meantimewe have buried billions of tons of potentially valuable resources.
Burying our trash is a waste both materially and economically. In dollars, a typical community spends moreof its municipal funds to operate a landfill and dispose of trash than it does to support social programs. Thecost of landfilling trash has risen significantly in our country, and the cost is passed on directly to thecustomer by raising pickup fees.
Material resources present in our discards include metals, glass, paper, yard waste, food waste, plastic,wood, rubber, leather, and textiles. When analyzing these various components of solid waste, somepatterns become clear. Though the amount of most constituents of trash actually decreased, remainedlevel, or marginally increased, two have changed quite dramatically. In our modem information age, theaverage person discards almost two-thirds more paper and paperboard than someone in 1960. But evenmore astounding is the fact that the amount of plastic discarded is 25 times more in 1990 than in 19C,',1
The problem of solid waste is rapidly becoming a crisis, but garbage is a social as well as economic andecological problem, and though it will require technical solutions, engineering alone is not sufficient to solveit. Although some experts believe that the necessary technology is "on the shelf," the final remedy mustinvolve all parties in a concerted effort. It can be done, but it must be chosen.
In this unit, you and your students will have a chance to investigate the problem of solid waste as it relatesto plastics. You will begin by comparing patterns in solid waste from 1960 and 1990. You will hunt forplastics in your everyday life and learn to identify some of them through laboratory work. You will fmd outwhat plastics are made from and how they are formed. You will observe what happens to plastic litter. Youand your students will analyze your own trash and see what plastics are contained there. You will visit alandfill and find out what happens to plastic that is discarded. You will consider alternatives to dumpingsuch as incineration, reuse, and recycling. You will look at case studies of plastics being recycled. You willsurvey your community and develop a plan for recycling and waste reduction in your area.
A complete guide for teaching this unit and an extensive bibliography has been included for yourconvenience.
111111111111A
11

An Overview
The goal of this curriculum unit is to convey the importance of plastic waste reduction and recycling. As aresult of the following outcomes, students will not only have an opportunity to learn about plastic waste,they will also obtain the knowledge, skills, and perhaps the motivation to do something about it..
Many communities across the nation lack the markets and facilities to support plastic recycling. However,momentum is gaining in the recovery, processing and remanufacturing of plastic into various usefulproducts. If children in schools can be informed of the problem and given the ability to address it, perhapsthese barriers can be overcome.
This project will take from three to four weeks to complete if all of the activities are included. You will alsoneed to do a fair amount of preparation in the organization and reviewing of the references listed for thelessons. Some of the lessons also require material preparation.
Outcomes, timing, and materials for each lesson are summarized below. Each lesson includes: back-ground information, detailed preparation and teaching plans, discussion questions, and a bibliography. Atthe end of the unit, you will also find a complete bibliography and a mailing list with contacts for free videos,books, brochures, samples, etc.
LESSON ONE1) Students will become aware of the amount of trash produced by the average American each day.
2) Students will analyze trash using mass, volume, and percent.
3) Students will make comparisons between trash in 1960 and 1990.
4) Students will also draw conclusions from trends in graphs over the same period.
This lesson should take only one period. However, you will need to take time to prepare the trash samplesin advance. You can use "clean" items for the trashmost of the materials can be saved to use again.
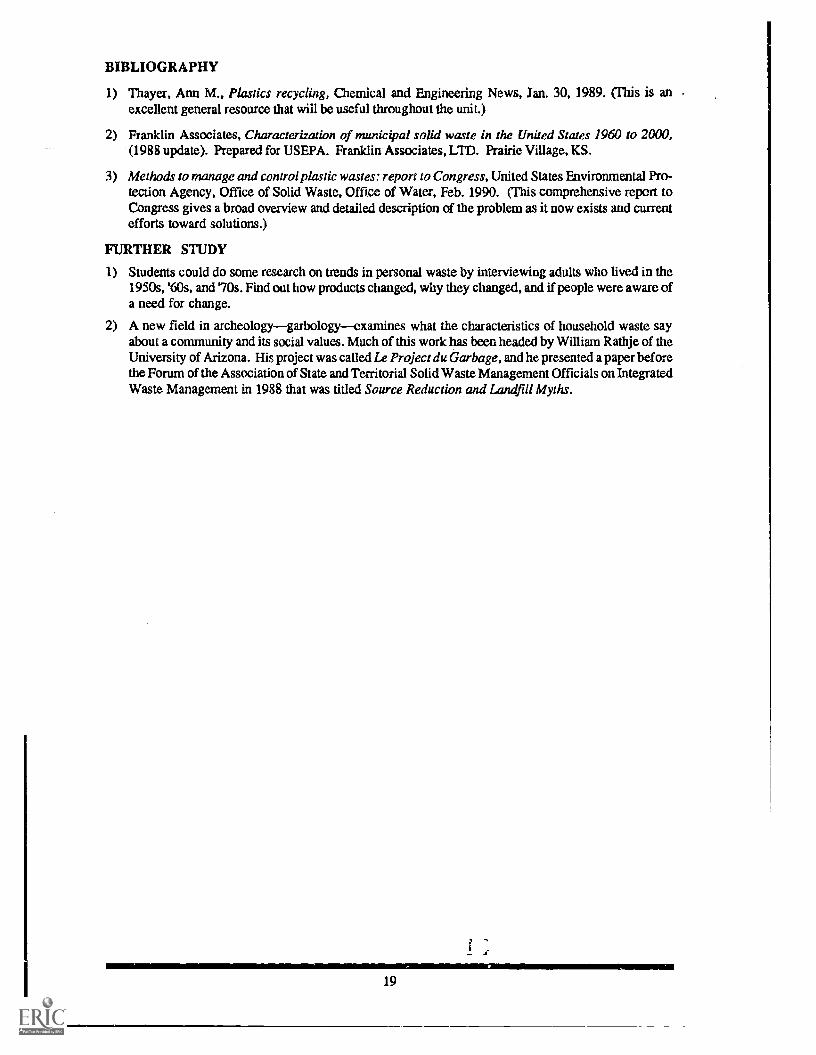
Create the trash samples using the chart in Table 1 as a materials guide.
LESSON TWO
1) Students will recognize that plastic is a common material for everyday uses, especiallypackaging.
2) Students will become aware that plastic has many specialized and technical applications.
3) Students will group plastic items by general physical characteristics or functions.
4) Students will realize that most ordinary plastic items are meant to be disposable.
This lesson should take one to two class periods depending on how many items are brought in and thelength of discussion. You need to take plenty of time for students to handle, observe, and classify theplastics.
You should begin saving plastic bottles, tubs, containers, bags, etc., well in advance to expand the collectionif necessary. Be sure to look at the Society of the Plastics Industry brochure on container coding. Someproducts are already coded so it will be easier for you to identify them by resin type.
LESSON THREE1) Students will be able to carry out a variety of simple laboratory tests on plastic items.
2) Students will be able to develop a flow chart for identifying unknown samples.
The laboratory experiment may take more than one period, depending on the abilities of your students andthe number of unknowns that are tested.
See the lesson for safety information and the student procedure. The Dow guide for identifying rigid plasticcontainers is a useful summary of properties.
13

Also, see the lesson for sample preparation. You will need to cut or chip two or three pieces of each of thesix plastics listed for every group doing the experiment, Each group will need a pair of forceps, a candle,and a container of water for the tests.
LESSON FOUR
1) Students will be aware that plastics are formed from chemicals found in petroleum.
2) Students will recognize that plastics are based on a nonrenewable resource.
3) Students will understand the basic processes of polymerization by simulating the formation of poly-ethylene.
This lesson should take only one period. You may want to duplicate DI' make a transparency of thediagrams for polymer formation. This is meant to be only an introduction to polymers, and the lesson can beeasily expanded using the resources listed in the bibliography.
If you do the simulation activity, you will need a large open space for the students to move in and linktogether.
LESSON FIVE
1) Students will observe the effect of nature on various items in typical litter.
2) Students will compare the behavior of degradable vs. other plastics.
This lesson can take one nr two periods, depending on how much you do before to the activity. If you set upthe "litter" area or compol heap several months early, you could photograph the items periodically forcomparison in class. Or if you have students create the site you will need to continue observing it for manyweeks into the future.
The audio tape and many excellent articles are well worth discussing. Students can be assigned readingsbefore this period, and the tape can be played as a catalyst for discussion.
LESSON SIX
1) Students will understand their own personal involvement in the solid waste problem.
2) Students will measure mass and calculate percent for the components of trash.
3) Students will consider ways to reduce their contribution to waste.
For this lesson you will need one or more periods, depending on how many students bring in trash foranalysis. It will take a whole period for a group of students to go through one person's trash.
You will need to come prepared to cover the floor or tables to protect them from the mess, and you willneed a plan for disposing of the trash at the end of the activity.
LESSON SEVEN
1) Students will realize where most of their trash goes.
2) Students will be more aware of the mounting problem of solid waste, both in terms of space and cost.
The tour itself may take more than one period so you will need to make arrangements for taking studentsout of classes for a field trip. Arranging the tour should be done in advance with a backup plan in case ofbad weather.
If you plan to use the video tape, be sure to order it early and have it copied.
LESSON EIGHT
1) Students will acquire a broader and deeper knowledge of solid waste management alternatives.
2) Students will become aware of the need for an integrated approach to solid waste management.
3) Students will apply this learning specifically to plastic in solid waste.
4) Students will create an integrated approach to address this problem.
This lesson can take one to two periods. Students need enough time to make their presentations to class.
141 't1

Also, if class time is used for preparation (which is reasonable), you may need to take two or three moredays. This is an important learning experience for the students.
The materials required are, for the most part, the suggested readings, but students will also need someitems for visual aids, such as poster board or overhead transparencies, etc.
LESSON NINE
1) Students will be introduced to the fundamental ideas and procedures involved in plastics recycling.
2) Students will consider steps for initiating a plastics recycling project in the community.
If you use the videotape and discuss the readings, you will need two periods for this lesson. Be sure to bookthe videotape in advance.
LESSON TEN
1) Students will administer a survey to community members.
2) Students will assess the results of the survey.
3) Students will draw conclusions concerning attitudes and participation from the results of the survey.
4) Students will devise a plan for initiating plastics recycling in the community based on their conclusions.
From start to finishhaving students take the survey for practice, doing the survey in the community,analyzing the responses, and discussing the resultsthis activity may require more than a week. You maywish to begin working with it in class before starting lesson eight so that class time will not be lost while youare waiting for surveys to be returned.
Be sure to duplicate enough copies for each student to distribute.
LESSON ELEVEN
1) Students will create an integrated plan for action based on the information gathered in this unit.
2) Students will test the feasibility of the plan by submitting it for consideration to the municipal govern-ing board. (optional)
If you choose to use this final lesson and its outcomes, you may need several days to put your plan intoaction. While this may be too much to take from a class schedule, the result could be important to thestudents. They may even be willing to get more involved outside of the classroom on their own time.
15

Lesson OneHANGING IN THE BALANCE
On this first day, it is important to impress the student with the immensity of the problem of solid waste. Avivid demonstration using real garbage will initiate a thoughtful discussion on the issue of personal involve-ment and responsibility.
OUTCOMES:
1) Students will become aware of the amount of trash produced by the average American each day.
2) Students will analyze trash using mass, volume, and percent.
3) Students will make comparisons between trash in 1960 and 1990.
4) Students will also draw conclusions from trends in graphs over the same period.
PREPARATION:
For the demonstration, you will need two bags of trash. One will represent average 1960 discards, and theother will represent average 1990 trash. Use informat;on from Table 1 to create these sample bags. Inlooking at the data, it should be obvious that the most dramatic change has been in the segment of plastictrash. By mass, plastic discards in 1960 were equivalent to three or four plastic sandwich bags. The 1990figure is 25 times greater, and this could include plastic bottles, bags, candy bar wrappers, food containers,etc.
The components of the trash samples should be placed in clear plastic bags for convenience. Then each ofthe components should be placed in the appropriate 1960 or 1990 trash bag. Except for the food waste andyard waste, the separate bags of paper. glass, metal, etc., for each sample can be saved for future use soit is worth trying to be fairly accurate in the amount of each present. (For the "inorganic miscellaneous,"you might just put some table salt in the bag to represent these materials that end up in trash. This caninclude batteries, mineral waste, etc.)
You will also need a hand spring scale or pan balance for finding the mass of the trash and its components.These can probably be borrowed from a science classroom if you do not have one yourself.
You might choose to dress up as a garbage collector to set the mood for the unit. These people play a keyrole in one of the most important AND expensive problems we face today.
TEACHING PLAN
Place the two sealed bags of trash on the table, and let the students pick them up and handle them. Askthem what they might do to find out more about the difference between the two bags. This should lead toa decision to weigh them and look at their contents.
Weigh the two trash bags and have the students record their masses. Spill out the contents of the bags;have the students describe the various components weigh; and record each of their masses as well.
Using the mass of a particular component (for example, glass) and the total mass from the year (say 1960),have the students calculate the percent of that component in the trash for the year:
Mass of glassx 100= % glass in trash
Mass of trash
17

It is possible to make some rough visual comparisons of volume of each component of trash. This can beaccomplished by placing the components from each year in rank order of which appears the largest downto the smallest. It should be quite obvious that at least some of the volume in the bags is due to the emptyspace in rigid containers. But unless they are thoroughly crushed, these empty spaces also contribute tovolume in landfills.
Using the data from Table 1 on an overhead transparency or a handout, have students make bar graphs ofthe trends in discards for each of the categorises. The students can be split up into groups for this part, andeach group can do one graph. For example, one group would deal with paper and paperboard, one withglass, metal, etc. The resulting growth curves should .nake it quite clear that the accelerated climb byplastics is unusual and of great consequence.
Based on these growth curves, have the students project to the year 2050 (most of them will be retiring bythen). From these graphs, the students can determine the amount of each component in trash and totaltrash discarded in that year.
DISCUSSION
These questions can help to guide a discussion of the previous activities:
1) What changes have taken place in the last 30 years?
2) Have all segments increased?
3) Have all the increases been at the same rate?
4) How have percentages of each segment changed over the years?
5) How has the volume of each segment changed over the years? (Does it seem to be in proportion withthe chaage in mass?) For this question, it is important to note that for plasticswhich have exception-ally small mass for their size and which tend to trap air even when crushedthe volume increase mayseem more dramatic. Plastics are about 8 percent of trash by mass but can be more than 30 percent byvolume.
6) What do the graphs of the separate segments over time suggest concerning patterns of wastedisposal?
7) What factors might explain some of these changes since 1960? (For example, glass and metals are stillused extensively in packaging and disposable items, but advances in technology have led to lighterweight materials; paper waste has grown rapidly in our "information age"; disposable plastic contain-ers have become very popular since the raid- 1960s.)
8) In what time period did plastic in waste increase the most?
9) Why are plastic containers and packages so popular?
10) Why has the amount of plastic in waste increased so much while other materials have increased onlyslightly?
II) The metal, glass, and plastic in a person's daily trash have about the same mass. Why does it look likethere is more plastic present?
12) Can you draw any general conclusions about our society from these patterns of waste disposal?
At this point, it should be obvious that plastic waste is rapidly increasing. Let students ponder whether theythink something should be done about this, why they feel that way, and what could be done.
If they are not sure that the issue of discarded plastic is so important, reinforce the magnitude of theproblem by doing the following calculations. Multiply the number of pounds of plastic discarded per day perperson by the number of days in a year and by the number of people in the U.S. (0.26 X 365 X 250,000,000= 23.7 billion lbs.). This is an incredible amount of material. This can lead to other questions like:
1) From what is plastic made, and can we afford to throw it away?
2) Where does trash go, and what happens to the plastic in it?
3) How much does all of this cost us?
These issues will be addressed in later lessons.
18
BIBLIOGRAPHY
1) Thayer, Ann M., Plastics recycling, Chemical and Engineering News, Jan. 30, 1989. ('This is anexcellent general resource that will be useful throughout the unit.)
2) Franklin Associates, Characterization of municipal solid waste in the United States 1960 to 2000,(1988 update). Prepared for USEPA. Franklin Associates, LTD. Prairie Village, KS.
3) Methods to manage and control plastic wastes: report to Congress, United States Environmental Pro-tection Agency, Office of Solid Waste, Office of Water, Feb. 1990. (This comprehensive report toCongress gives a broad overview and detailed description of the problem as it now exists and currentefforts toward solutions.)
FURTHER STUDY
1) Students could do some research on trends in personal waste by interviewing adults who lived in the1950s, '60s, and 70s. Find out how products changed, why they changed, and if people were aware ofa need for change.
2) A new field in archeologygarbology--examines what the characteristics of household waste sayabout a community and its social values. Much of this work has been headed by William Rathje of theUniversity of Arizona. His project was called Le Project du Garbage, and he presented a paper beforethe Forum of the Association of State and Territorial Solid Waste Management Officials on IntegratedWaste Management in 1988 that was titled Source Reduction and Landfill Myths.
7
19
TA
BL
E 1
Dis
card
s of
Mun
icip
al S
olid
Was
te B
y In
divi
dual
s, 1
960
to 2
000
(In
poun
ds p
er p
erso
n pe
r da
y)
Mat
eria
ls19
6019
6519
7019
7519
8019
8519
9019
9520
00
Pape
r an
d Pa
perb
oard
0.74
0.91
0.98
0.87
1.01
1.12
1.20
1.20
1.27
Gla
ss0.
190.
240.
330.
330.
340.
280.
270.
260.
25
Met
als
0.32
0.30
0.36
0.34
0.31
0.28
0.29
0.29
0.29
Plas
tics
0.01
0.04
0.08
0.11
0.18
0.22
0.26
0.29
0.32
Rub
ber
and
Lea
ther
0.05
0.06
0.08
0.09
0.10
0.08
0.08
0.08
0.08
Tex
tiles
0.05
0.05
0.05
0.06
0.06
0.06
0.07
0.07
0.07
Woo
d0.
090.
100.
110.
110.
120.
120.
120.
120.
12
Oth
er0.
000.
000.
000.
000.
000.
000.
000.
000.
00
TO
TA
L N
ON
FOO
D P
RO
DU
CT
S1.
461.
712.
001.
922.
132.
162.
292.
372.
48
Food
Was
tes
0.37
0.35
0.34
0.34
0.29
0.28
0.27
0.26
0.25
Yar
d W
aste
s0.
610.
610.
620.
640.
640.
640.
650.
650.
65
Mis
cella
neou
s In
orga
nics
Was
tes
0.04
0.05
0.05
0.05
0.05
0.06
0.06
0.06
0.07
TO
TA
L W
AST
E D
ISC
AR
DE
D2.
482.
713.
012.
953.
113.
143.
273.
353.
45
Det
ails
may
not
add
to to
tals
due
to r
ound
ing.
Sour
ce: F
rank
lin A
ssoc
iate
s, L
td.;
Cha
ract
eriz
atio
n of
Mun
icip
al S
olid
Was
te in
the
Uni
ted
Stat
es, 1
960
to 2
000
(Upd
ate
1988
); p
age
24, t
able
9
Not
e: A
ll nu
mbe
rs p
an th
e 19
85 d
ate
are
proj
ectio
ns m
ade
in 1
988.
Stud
ents
may
wis
h to
get
cur
rent
num
bers
to c
heck
the
accu
racy
of
thos
e pr
ojec
tions
.
Lesson TwoTHE SCAVENGERS
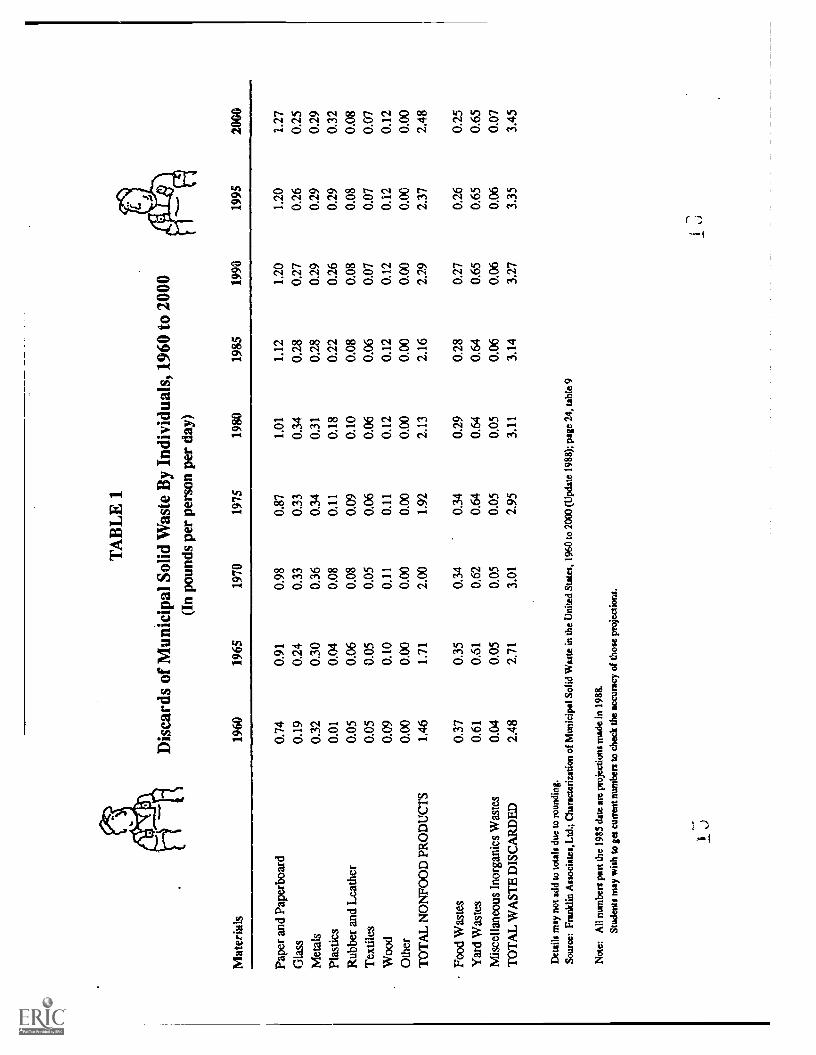
We are certainly all familiar with the many forms that plastic can take in packagingbottles, bags, films,cartons, padding, etc. However, this is only one part that plastics plays in our lives. Innovations in formulasand preparation of plastics have made them some of the most versatile materials for space travel,construction, automotive, health care, electronics, and many other technical applications.
The very high strength-to-weight ratio of plastics has made them important in the construction of energy-saving jets and space vehicles. And their "invisibility" to radar has made plastics extremely important inthe development of the stealth bomber.
In our modem society, it is nearly possible to construct an entire house out of plastic building materials andtrim, from plastic pipes for water, plastic lumber for decking, and plastic foam for insulation to plastic sidingand window frames, bathroom fixtures, and molded trim pieces for a decorative touch. Use of plastics inconstruction is second only to use of plastics in packaging and is continuing to increase at a rapid pace. Lowcost and high strength and durability of the materials make them attractive substitutes.
In transportation, plastics again play the role of weight-saving for fuel efficiency, but they have become amaterial of choice and not just necessity. Every car made today has some plastic in the exterior body parts,interior passenger compartment, and engine components. There are a few cars that have all-plastic bodies(such as the Pontiac Fiero), and there are plans for an all-plastic car in the future.
Amazing advances have taken place in the fields of medicine and health care because of plastics. Bloodvessel replacements, artificial kidneys, and even artificial hearts are made almost entirely of plastic. Sterileplastic gauze and adhesive strips are used to cover wounds, and plastic devices can be implanted to deliverdoses of a medication on a timed-release schedule.
The light weight, water and corrosion resistance, and electrical insulating abilities of plastics have madethem ideal for uses in both consumer and highly technical electronic components. Plastic is used for theases of most computers, stereos, TV's, etc. Plastics also are an important part of the circuit boards for
computer chips, disks for data storage and retrieval, devices to protect from dust and humidity, and fiberoptic cables that transmit telephone calls.
Plastic is all around you right now. Can you find anything that is plastic that has not been mentioned yet? Inthe next section, you will have a chance to think about these innovative uses of plastics. What has broughtthem about? What materials have they replaced? And what does the future hold for plastics?
Though it is apparent that plastic is important in all aspects of our lives, by creating a collection of plasticitems it should become clear that most plastic seems to be destined for the trash.
OUTCOMES
1) Students will recognize that plastic is a very common material for everyday uses, especiallypackaging.
2) Students will become aware that plastic has many specialized and technical applications.
3) Students will group plastic items by general physical characteristics or functions.
4: Students will realize that most ordinary plastic items are meant to be dispos "31e.
PREPARATION
This list of common plastic items can be used to create a scavenger hunt or classroom display. The list hasbeen organized by material type for easy identification, but the student should not be told this beforehand.This activity should allow students to explore and classify based on their own observations. The six mostcommon plastics included here are:
High-density polyethylene (HDPE)dairy product containers, detergent and cosmetic bottles, antifreeze containers, motor oil bottles, milk andwater jugs, 2-liter soft drink bottle base cups, margarine tubs, and bleach bottles.
23

Low-density polyethylene (LDPE)films (like food wrap), trash bags, sandwich bags, grocery sacks, dry-cleaning bags, mustard containers,flexible bottle caps, coffee can lids, and food storage containers.
Polypropylene (PP)cellophane-like snack food bags and wrappers (glossy and crinkly), candy wrappers, squeezable catsupbottle, linings of disposable diapers, aerosol can caps, rigid caps on soft drink bottles, deli tubs, and someplastic cutlery.
Polystyrene (PS)high- impact plastic cutlery, disposable razors, prescription and vitamin bottles.semi-rigid lids; single-service mini-containers for cream, jelly, butter pats; and cottage cheese tubs,clear deli carryout containers; cookie package trays; cellophane-like films.foam packing and insulation materials, food trays, egg cartons, carryout containers, hot cups, "clamshell" containers for fast foods.
Polyvinyl chloride (PVC)durable construction products (pipes, siding, conduits, cables, gutters, flooring, paneling), luggage, footwear, upholstery, brief cases, clothing, camping gear, beach rafts, vegetable oil bottles, imported mineralwater bottles (Evian), household cleaner bottles, bottle cap liners.
Polyethylene terephthalate (PET)soft drink bottles, liquor bottles, microwave freezer containers.
Some plastic containers already have been imprinted with the plastic container codes described in the SP!brochure. Using this guide, you can quickly identify the plastic resin used in a particular item that has beencoded. See the bibliography for details.
The students should have an opportunity to handle and observe the items very closely. The purpose is toclassify the materials by similarities in properties or uses. Examples of groups might be:a. colored - uncoloredb. opaque - translucent - transparentc. rigid - flexible
d. food - non-food containere. disposable - durable
By letting students know that six different plastics are represented here, students can become moreparticular in their grouping. It is not likely they will be completely accurate, but they should begin to realizemore subtle differences and similarities between the items.
At this point, further work can be carried out in the laboratory to determine other physical and chemicalproperties of the plastics.
Several other interesting observations may be made here as well. Some items contain two or moredifferent plastics, e.g., the 2-liter soda bottle is PET with an HDPE base cup and possibly a PP cap with aPVC liner. The squeeze catsup bottle is not pure PP: it actually has five to seven layers of plastics andadhesives, though PP is a major component. The variety of PVC products clearly demonstrates thediverse properties that can be obtained with additives such as colorants, plasticizers, stabilizers, fillers, etc.
Plastics are also used more frequently in highly technical and engineering applications. Some of these arediscussed in a series of articles from Modern Plastics (a set of brochures and pamphlets produced bySociety of the Plastics Industry) and an article from U.S. News and World Report. (See bibliography forcomplete reference.)
TEACHING PLAN
Using this information, organize a scavenger hunt for plastic items in the home. Be sure to get a goodrepresentative sample of ordinary items, but also challenge students to bring in "exotic" items made ofplastic or items that only recently have appeared on the market.
Create a display that the students can handle and group according to characteristics or functions. It mightbe nice to keep the display intact for the next few days as you continue to study plastics. Some of the itemsmay also be tested in the laboratory activity to follow.
24
DISCUSSION
1) What desirable characteristics make plastics so good for these many uses?
2) Are plastic items meant to be durable or disposable? Give examples.
3) How many df these items do you throw away in one day? (The average person discards about fiveplastic packages per day.)
4) How long have plastics been in use compared to paper, metals, wood, ceramics, glass, etc.?
5) Are plasues used mainly to replace other materials, i.e., metal, wood, glass, or for unique applications?Give examples.
6) Is the use of plastics increasing or decreasing? If increasing, what are some of the new uses?
7) Predict new uses for plastics in the next year, 10 years, your lifetime.
8) Americans used to sneer at "cheap plastic" products, especially imports. Are plastics "cheap" eithereconomically or materially?
9) What happens to discarded plastics? Do they break down or burn or otherwise "disappear"? (Thiswill be studied later.)
BIBLIOGRAPHY
1) Plastics and you, A Quarterly Review of Innovations in Plastics, Society of the Plastics Industry (SPI).
2) Plastics in "aerospace, building and construction, electronics, health care, packaging, transportation"pamphlets from SPI.
3) Sheets, Kenneth R, The new high-tech world of plastics, U.S. News and World Report, Feb. 24, 1986.
4) Typical container materials, Plastics Group, The Dow Chemical Company, 1989.
5) Plastics: A D.2000 production and use through the turn of the century, Chem Systems, 1987. (This isa comprehensive look at plastic authorized by SPI. It is available through interlibrary loan.)
6) SPr s Voluntary plastic container coding system brochure.
7) Polymers, the material of choice today, tomorrow, and thereafter, The Polymer Group of the Univer-sity of Illinois, 1304 W. Green St., Urbana, IL 61801.
FURTHER STUDY
1) Someone could do more research into the future of plastic products. One good resource would bePlastics: A.D. 2000, an industry guide to the trends in applications and markets. Another good sourcewould be the industry publication Modern Plastics. These may be available through interlibrary loan.The pamphlets from SPI are also good summaries of plastic's future.
2) A student could investigate what process accompanied the replacement of glass soda bottles withplastic. How was this initiated? Was there a consumer demand? Was there a public debate? How wasthe glass industry affected?
25

Lesson ThreePLASTIC IN THE LABOF ATOM(
If plastic is to be recycled, and that is our ultimate goal, consumers must know which plastic is which.However, that can be very complicated today with so many different resins as well as composite, orlayered, plastics. One way to find out what a plastic is made of is bring it into the laboratory and perform thefollowing experiment. A simpler answer for the consumer will be introduced later.
OUTCOMES
1) Students will be able to observe or carry out a variety of simple laboratory tests on plastic items.
2) Students will be able to identify unknown samples.
PREPARATION
This is a laboratory experiment and it requires full attention to safety. This means wearing goggles, havingfire extinguishers nearby, and having good ventilation and water available. It is possible to work safely in aregular classroom or even outside, but it might be preferable to be in a science laboratory.
The Dow guide (see Bibliography) to identifying rigid plastic containers provides a useful summary ofproperties to be observed in this experiment.
A. Safety
Due to the potential safety hazards involved with this particular experiment, we request that teacherponlyconduct these procedures as demonstrations under proper safety considerations (i.e., hooded ventilation,etc.)
While burning, the plastic could spatter and drip.
Also, use great care when handling the burning plastic as it can drip and cause burns, or it could ignite othercombustible materials.
Caution students about inhaling the vapors. The PVC does release hydrochloric acid gas when burned orheated. In a large quantity, this could be harmful. But in this experiment, the amount of HCL produced issmall and should not be dangerous. However, a well-ventilated room or open window is advised. Test theventilation for yourself to decide. You may feel it inappropriate for students to do the burning and maychoose to do it as a demonstration.
Be sure to a:: ete procedure yourself first. Pellets, chips, or small sheets cut from each material will workin these tests. Just be carefui of the amoLdu. Keep pellets and chips to the size of a pea or sheets about1 inch square.
B. Materials and equipment
Safety goggles, forceps, a container of water and a candle with matches are the only equipment. Thesamples of the HDPE, LDPE, PP, PS, PVC, PET may be supplied as pellets in a kit or can be obtained fromthe following consumer items.
HDPE milk jugs, LDPE coffee can lids, PPsome deli-tubs or plastic cutlery, PSaspirin bottles orplastic cutlery, PVCEvian mineral water bottles, PET 2-liter soda bottles
27

C. ProcedureThis part of the procedure is related to laboratory work with known plastic samples. The purpose is toobserve and record the behaviors and properties of the six mast common consumer plastics. The results ofthis work with known samples will lead to the development of a scheme for working with unknown plasticsamples.
1) Be sure that the plastic is not just suspended on the surface tension of the water.2) Encourage students to develop precise descriptions of various levels of transparency, translucence.
etc.3) Again encourage precision in de, -iption.4) Caution students about flying plastic. It should be pointed away from other people when it is being bent.5) There are dangers related to dripping and spattering as well as smoke and vapors (see above). To be
done correctly, the plastic must be removed from the flame within one or two seconds or it will simplyburn up.
6) Students should be able to use the procedure to work with unknown materials.
D. UnknownThese unknowns can be chips or cuttings from some of the "tousehold products listed previously. You mayalso want to encourage students to test their own samples. This is really what the experiment is all about.In a short time students can become "experts" on the composition of plastic household products.
A word of safety is important here though. When burned, polyurethanes (mostly as foams inupholstery cushions, rigid foam insulation, or wood coatings) can release isocyanate, which in smallquantity will sting and burn the eyes and nose. Greater quantities of the gas (from samples larger than apea) could be dangerous. Working outside or under a hod is recommended if polyurethanes are to beburned.
DISCUSSION1) Why do some plastics float and some sink?
(density of material: LDPE = 0.92 gfml; HDPE = 0.96 g/rril; PP = 0.90 gfml, PS =1.05 gfml, PVC =1.39 glml, PET =1.35 g/mlthose with a density greater than water at 1 g/ml will sink)
2) How are the characteristics of the various plastics matched with their uses as containers, e.g., rigidbottles, flexible bottles, thin sheets or bags, etc?(holding soda under pressure, squeezability, tight food wrap, light weight puncture resistant bags)
3) What is the benefit of a flow chart when identifying unknowns?(makes work efficient, eliminates possibilities by negative result)
4) Do all of the plastics have the same properties?
5) Why might it be important to separate different plastics if they are to be recycled?
6) Are the methods we used suitable for the consumer at home? Are they reasonable?
7) Think of ways to assist the consumer in easy but accurate identification and separation of differentplastics.
BIBLIOGRAPHY
1) ldentifing Rigid Plastic Containers, Plastics Group, The Dow Chemical Company, 1989.
2) SPF s Voluntary Plastic Container Coding System, SPI.
FURTHER STUDY
Look carefully at the container coding system for the plastic container industry. What are its advantages?Are there shortcomings? Who benefits from the recycling of plastic containers? What are some otherfactors involved in making recycling of plastics work? Does this coding system make recycling of allplastics much more likely to happen?
28

Plastic Identification Laboratory Procedure
A. Safety
1) Plastic matt_ als will be burned in this experiment. Some may drip or splatter hot or flaming residue.Use caution, burn only the amount indicated (burning larger amounts is an extreme fire hazard), keepa container of water nearby to extinguish the burning plastic, and wear goggles at all times.
2) Vapors from some heated or burned plastics can be noxious. Use only the amount indicated, and do notbreathe directly over the material.
B. Introduction
In this experiment you will investigate the properties of six different plastics. You will record your obser-vations of their appearance, test their densities, and bum samples. The results of these experiments shouldallow you to identify an unknown material consisting of one of these plastics.
Of course, there are many more plastics than these six, and some of them may appear or behave similarlyto these. However, this simple procedure is sufficient to identify the plastic in many ordinary householditems.
C.
1)
Procedure
Place a small fragment of each of the plastic samples in a container of water. Observe whether thefragment floats or sinks and record your observation in a data table. (You may need to push thefragment under the water and shake off any trapped air bubbles to get an accurate result.)
2) Observe and record whether the material is transparent or cloudy.
3) Observe and record whether the surface is glossy. Use terms like high, low or none to compare.
4) Try to bend samples of each plastic. Note whether they are rigid or flexible, and again use descriptiveterms to record comparisons in the data table. (Use caution when bending. Some materials may breakand send pieces flying at high speeds. Hold the materials away from yourself and others to avoidaccidents. For greater safety, bend toward a box lined with foam padding.)
5) Using forceps (tweezers), place a pea-sized pellet or 1-inch-square piece in a candle flame for one ortwo seconds. Withdraw it and observe whether it ignites. Hold the burning plastic over a container ofwater. Notice the nature of the burningcrackling, dripping, color of smoke, or odor. Note thecautions in the safety section. Record all these observations.
6) Compare results with other groups. Where you differ, repeat tests until there is general agreement.
7) Now use steps 1-5 of the procedure to identify an "unknown" plastic fragment. Record your observa-tions and the name of the unknown plastic in your data table.

Lesson FourA CHAIN REACTION
It is now obvious that we are constantly surrounded by plastic materials, but how are they made, and ofwhat are they made? It is important to know this if we are going to do something with plastics besides burythem in a landfill.
OUTCOMES
1) Students will be aware that plastics are formed from chemicals found in petroleum.
2) Students will recognize that plastics are based on a nonrenewable resource.
3) Students will understand the basic processes of polymerization by simulating the formation ofpolyethylene.
PREPARATION
This lesson will require some open space for the polymer dance that forms the chain. It would also beconvenient to have an overhead projector in the same room to help guide the activity.
Prepare overhead transparencies from following diagrams.
TEACHING PLAN
Simply stated, plastics are petroleum products. There are a few minor exceptions where research is pro-ducing small quantities of polymeric materials from living organisms or their by-products. But of nearly 60billion pounds of plastic produced this year, essentially all of it is from oil. While this accounts for only aboutone-tenth of all petroleum used (most is burned for heat or fuel), the data from the overhead show thatknown oil reserves are being rapidly depleted.
Using the information from the overhead, have students calculate the number of barrels of oil used everyyear. Then have the students calculate the date that known oil reserves will be exhausted at current ratesof consumption (approximately 21.5 billion barrels per year, all gone mid-2019). Consider the followingquestions:
1) Compare throwing away plastic and burning petroleum. How are they similar? How do they differ?
2) Can plastics be burned as fuel or for heat? (The fuel value of plastic is comparable to that of oil fuels,but the energy used in making the plastic is not recovered if it is burned.)
3) What should be done to change this outcome?
For a second activity, students can learn about polymer formation by performing the simulation describedbelow. By following the instructions and using the overhead transparencies as a guide, students can do thepolymer dance. This should be for fun, but it also provides an easy way to see how chain reactions occur.Remember that in real polymers, the number of units in each chain is in the millions, and a regular sandwichbag contains billions times billions of these chains.
Plastics are formed in two waysaddition polymerization and condensation polymerization. Five of theplastics mentioned here are addition polymers; they are formed by a reaction similar to that for polyethyl-ene. The addition polymers differ only by side chains on the main hydrocarbon strands. Only PET is acondensation polymer. Its structure and process of formation are more complicated and will not be shownhere.
In the classroom, students can participate in a simulation of addition polymers. The simplest is PE:
1) Have pairs of students lock elbows with each other while back to back.
2) The reaction begins when one "molecule" encounters an initiator. (For this you can "break" one ofthe bonds by opening one set of elbows of a pair of students leaving the other set of elbows locked.Place an object an initiator in the open arm of one of the students in this pair. The other student'sarm is now the reactive portion of the molecule.)
31
ld4"
"--4

3) The "reactive" student can then unlock another molecule and form a new bond with one end (bylocking elbows). Now the student with a free arm at the end of this "chain" becomes reactive.
4) The process continues until all of the monomers have combined to form one long chain.
5) To be somewhat more accurate, the last pair to be added will still have a reactive end. The chain maybe terminated by allowing this to react with another one of the initiators.
For a final activity, it is possible to form a polymer quite simply as a demonstration of chain formation. Avery long strand of nylon can be pulled out of a beaker containing two clear liquids. A complete descriptionof a safe procedure can be found in reference 3 below.
BIBLIOGRAPHY
1) Alper, Joseph, Polymers, Chem Matters, April 1986, p. 4.
2) Any encyclopedia and most chemistry textbooks will have helpful sections for more specific details onpolymers.
3) There are several excellent sources for chemical demonstrations that contain procedures for polymerdemonstrations such as the nylon formation. These include: Shakhashiri, Bassam, ChemicalDemonstrations, PP. 213-215. Summer lin, Lee, and James Ea ly, Chemical Demonstrations, pp. 126-127, and the National Science Teachers Association publication called Polymer Chemistry. Anotherexcellent source of laboratory investigations on the synthesis and analysis of polymers is: Polymers,The Polymer Group of the University of Illinois, 1304 W. Green St., Urbana, IL, 61801. It is availablefree by writing the above address or calling (217)333-0149.
32

Can
We
Kee
p M
akin
g Pl
astic
s Fo
reve
r?
Kno
wn
Wor
ldw
ide
Oil
Res
erve
s (1
/1/8
7)
700
Bill
ion
Bar
rels
Cur
rent
Con
sum
ptio
n R
ate
of O
il (1
/1/8
7)
(58.
9 M
illio
n B
arre
ls p
er d
ay o
f O
il)
Info
rmat
ion
take
n fr
om E
nerg
y in
Am
eric
a's
Futu
re: T
he C
hoke
Bef
ore
Us

I
Eth
ylen
ePa
rtne
rs
I
Initi
ator
(tri
es to
cut
in)
Lea
ves
a "F
ree
Han
d" o
r Fr
eeR
adic
al to
con
tinue
the
proc
ess
Free
Rad
ical
atta
cks
Eth
ylen
eFr
ee R
adic
al G
row
s
Hun
dred
s of
thou
sand
s of
par
tner
s ar
e at
tack
ed a
nd a
dded
to th
e ch
ain.
The
Bal
lroo
m D
ance
bec
omes
Cra
ck th
e W
hip.
All
beca
use
of o
ne li
ttle
initi
ator
.in
dica
tes
mill
ions
mor
eno
t pic
ture
d
TA
Ter
min
ator
put
san
end
to th
e ch
ain
f3

Dou
ble
Bon
d
A B
allr
oom
Dan
ce
Eth
ylen
e un
its (
mon
omer
s)
C2H
4

Oth
er m
onom
ers
like
Eth
ylen
e ar
e ... -.--
>Pr
opyl
ene
Vin
yl C
hlor
ide
Chl
orin
e
Styr
ene
3A
Ben
zene
Rin
g
Poly
prop
ylen
e
Poly
viny
l chl
orid
ePv
cvi
nyl
Poly
styr
ene
Styr
ofoa
m
IT
3;

A r
eal p
olye
thyl
ene
chai
n lo
oks
like
a fl
exib
le z
ig-z
ag.
Now
imag
ine
mill
ions
of
thes
e at
omic
cha
ins
wra
ppin
g ar
ound
eac
h ot
her
like
a be
d of
sna
kes.
...
or
Dep
endi
ng o
n ho
w th
e ne
twor
k fo
rms,
the
mat
eria
l cou
ld b
e a
fibe
r, a
fle
xibl
eor
rig
id f
ilm, o
r a
shee
t. T
his
is g
ener
ally
how
pla
stic
s ar
e fo
rmed
.
A te
rmin
ator
end
sth
e ch
ain.

Lesson FiveLONGEVITY OF LITTER
The amount of trash littering our landscape is actually quite small considering that over 300 billion poundsof garbage is generated in the U.S. each year. However, the problem of littering is obvious, especially in thecase of plastic. Unlike paper, wood, food, and even some metals, plastic is not broken down naturally in theenvironment. In fact, plastic left in the open may remain essentially unchanged for several hundred years.To address this aspect of the problem, some new "degradable" plastics have been tested and marketed.
Degradable plastics include photodegradable products that decompose when exposed to sunlight for someperiod of time. The material seems to disappear. Biodegradable products are made edible to smallorganisms by including some fraction of starch in the network of molecules in the plastic. The starch isconsumed by bacteria or larger organisms (such as insects), and the remaining plastic, after being chewedand swallowed, is reduced to dust in the organism's waste.
In this activity, you will compare the behavior of some degradable plastics to other plastics and othercommon litter items. This can be accomplished either in an open area or on a compost heap.
OUTCOMES
1) Students will observe the effect of nature on various items in other litter.
2) Students will compare the behavior of degradable vs. other plastics.
PREPARATION
This activity can be performed in two ways. You may prepare a more normal litter setting for students toobserve, or you might speed up the process by placing the materials in a compost heap. The purpose hereis to get some idea of what happens to plastics in nature and compare it to some other materials as well asdegradable plastics.
For a normal litter setting, you might want to prepare several weeks or even months ahead so your studentscan see the result at this point in the unit, or you can set it up now as part of an ongoing project and continueto monitor it for some time.
Choose an area of the school yard that can remain undisturbed for a long period of time. Select a sample ofeach of the resins used so far (PE, PET, PVC, PP, PS) and, for comparison, add photodegradable and bio-degradable items as available. (You may wish to add some other typical litter for referencelike drinkcups, soda cans, glass bottles, etc.) Observe and record (photograph) the condition of each of the items forthe next few months.
The same items can be tested more rapidly in a compost heap (except for the photodegradable itemswhich require sunlight) by observing their condition each time you turn the pile. Instructions for creating amini-composter can be found in reference 1 (see Bibliography).
Back in class, have the students predict what they think will happen to the objects and how much time theythink it will take. These predictions can be compared with the actual outcome at the completion of theproject.
TEACHING PLAN
The audio tape recording of "Plastic: Here Today, Here Tomorrow" is an excellent introduction to thisaspect of plastic waste. It should help generate a great deal of discussion, which can be enhanced byhaving the students read some of the articles from the bibliography on degradable plastics. There are somevery important questions to answer concerning degradability before it is mandated as a solution to theproblem of litter.
43

DISCUSSION
Answers to most of these questions are not known, but they are addressed in the readings. And theopinions of an educated public can affect the outcome on this issue
1) What happens to normal plastic litter left out in the open?
2) How long does plastic take to break down in nature?
3) How does this durable plastic litter affect the environment?
4) How is plastic litter different from/similar to paper, glass, and metal litter?
5) Does degradability really lead to waste reduction?
6) Will these plastics degrade in the real environment?
7) Will these plastics degrade in landfills?
8) What is the effect on a landfill if they do?
9) What is left after the plastic has degraded?
10) How will these new "food sources" affect the life cycles of organisms and their ecosystems?
11) How will degradable plastic be protected during storage?
12) Is it desirable to use degradable plastics for packagingespec;a1ly for food items?
13) How will degradable plastics affect plastic recycling?
14) Who benefits from the use of starch-based biodegradable plastics?
BIBLIOGRAPHY
1) Mitchell, William H. Recycling lessons for science teachers, Biocycle, Jan. 1989, p. 59.
2) Brown, Elizabeth A. Answers sought to mounting plastic, The Christian Science Monitor, July 11,1989, pp. 12-13.
3) Beardsley, Tim. Disappearing act, Scientific American, Nov. 1988, p. 135.
4) Stover, Dawn. Plastic from starch: not such a corny idea, Popular Science, June 1988, p. 21.
5) Weisskopf, Michael. Plastic reaps a grim harvest in the oceans of the world, Smithsonian, March1988, pp. 58-66.
6) Conner, Daniel Keith and Robert O'Dell. The tightening net of marine plastics pollution, Environment,Jan./Feb.1988, pp. 16-20, 33-36.
7) "Plastic: here today, here tomorrow," an audio tape from Soundprint, WJHU, 2216 N. Charles Street,Baltimore, MD 21218.
8) Thayer, Ann M. Degradable plastics generate controversy in solid waste issues, Chemical and Engi-neering News, June 25, 1990, pp. 7-14.
44
3,;

Lesson SixGETTING INTO TRASH
You have seen that Americans produce an incredible amount of trash. In fact, we could fiii two Super-domes every day with our garbage. How much do you produce, and are you really average? Thesequestions can only be answered by getting into your own trash.
OUTCOMES
1) Students will understand their own personal involvement in the solid, waste problem.
2) Students will measure mass, and calculate percent for the components of trash.
3) Students will consider ways to reduce their contributions to waste.
PREPARATION
As seen in the data on solid waste, the average American is responsible for about 1,200 lbs. of trash eachyear. Broken down by percentages, this means that each person discards about 95 pounds of plasticsannually. To get some idea of the mass and volume of garbage individuals or families produce, one of theseactivities could be performed.
1) Have students save their own trash for a day or two - even a week if approved by parents. This mustinclude all food scraps, paper waste, etc., throughout the day. This may present some problemsincluding odor, transportation to school, or inconvenience of taking a bag along to save trash. But it canbe most rewarding to actually account for all of the things one throws away over the course of a dayor week. For this to be successful, students must carry a bag with them to deposit all trash as it isgenerated.
2) Volunteers could bring in a family's trash. The contents of a can of trash on trash day might be morerepresentative of average solid waste. To do this, garbage cans or bags must be transported to school.Be sure to obtain parental permission first.
3) The contents of a school trash receptacle could be analyzed. This could be quite interesting, but it willlikely be different from household trash.
4) All three of the above could be done and then compared. This would provide an opportunity to discussthe variations between the trash generated in one setting and another.
5) Along with collecting, students could be asked to keep a log of all items they throw away for someperiod of time. They might address questions such as:What kind of item is this?What is its approximate size, mass?Why is it being thrown away?Of what is it made?Could the item be reused?
Remember that trash can be very personal and embarrassing - especially those relating to personalhygiene. You may want to remind students to be discrete concerning these things.
45

TEACHING PLAN
Depending on how this is done, there could be a great deal of trash in a small classroom. Make arrange-ments beforehand for its removal.
Spread out newspaper or plastic to protect the floor, and empty the garbage onto this covering. Sort thegarbage into piles of paper/cardboard, wood, yard waste, glass, metal, food waste, textiles, leather/rubber,and plastics. Try to estimate proportion of each for items containing more than one material. Items clearlynot fitting into one of these categories may be called "other."
Once separated, the piles may be weighed by placing them in bags and having a student stand on abathroom scale, hold each bag, and record the increase in weight. This should be recorded. (Smaller itemscould be weighed with a spring scale or laboratory balance.)
Now create bar graphs of the percent mass of the various fractions. Compare these with the graphs youmade on the first day.
DISCUSSION
After analyzing the trash according to the scheme and recording data, consider the following more generalissues:
1) What are some simple ways to reduce the amount of material discarded? (What else could be donewith it?)
2) How do reuse, redesign of products, and recycling lead to waste reduction?
3) Describe how one of your "trash" items might be reused.
4) Describe how one of the items might be redesigned for more durability (longer life).
5) Can any of the items in your waste be recycled?
6) Looking at the plastic in your trash, what is the lifetime of each item from the time of purchase to thetime of disposal?
7) How does this compare with the expected lifetime of the material from which it is made?
8) Estimate the volume of one person's trash. About how much space would a week's worth of garbagetake up? How much space for one week of trash from each person in the class? How much space forone year of trash from each person in the class? How much space would be taken up by a year of trashfrom each person in the United States (250 million)?
BIBLIOGRAPHY
1) Livermore, Beth. Cleaning up our act, Health, March 1989, pp. 41-47 & 94.
2) Wann, David. Recipes for managing and preventing waste problems, The Christian Science Monitor,Aug. 9,1989, p.19.
J
46
Lesson SevenA MOUNTAIN OF TRASH
Do you really know what happens to your trash? For many people, the biggest problem of solid waste isgetting it out to the comer in time for the weekly pickup. But where does it go? What is done with thismountain (or Superdome) of trash? What does it cost to dispose of all of this garbage? (Nationwide, about$5 billion is spent annually to remove our trash from our sight.) A visit to your city dump or municipal landfillmight be enlightening.
OUTCOMES
1) Students will realir3 where most of their trash goes.
2) Students will be more aware of the mounting problem of solid waste, in terms of both space and cost.
PREPARATION
Make arrangements with appropriate municipal authorities to visit the landfill. It would be best to have thetour hosted by an official who could not only point out the various processes or stations involved but whocould also answer questions about the theory and purpose of the landfill, how it works, problems associ-ated with the technique, cost to the community, etc.
If this is not possible, as a backup, arrange for an individual to come to your class to make a presentation onthe local facility (with slides if possible) and answer questions from your students.
Videotapes are available from the Illinois Department of Energy and Natural Resources that look at thestate of landfills and their future. These could be shown in lieu of an on-site visit (see "Mailing List" on page69).
TEACHING PLAN
Take the tour or have the talk as scheduled and encourage the students to get involved with lots of ques-tions. Students can prepare for their questions by reading from some of the articles on landfills in the bib-liography.
DISCUSSION
Students should frame their own questions, but you might draw from the areas listed below:1) How many years has the facility been in operation?2) Is it licensed by the EPA as a sanitary landfill or otherwise?
3) What is its total volume/mass capacity?4) Why was it located where it is?5) Is collection done by the city or by private haulers?6) How much does it cost to collect, dump, and treat the garbage?7) How does this compare to other items in the municipal budget?8) What happens to the materials in the landfill?9) What happens to biodegradable materials?10) Is there a problem with leaching, gas production, or pests?
11) What has been done to contain these?12) Where is the nearest ground or surface water?13) What alternatives have been considered for the future?
47

BIBLIOGRAPHY
1) Overview: Solid waste disposal alternatives, Keep America Beautiful Inc., pp. 21-23.
2) Glenn, Jim and David, Riggle. Where does the waste go?, Biocycle, April 1989, pp. 34-39.
3) MacFadyen, J. Tevere. Where will all the garbage go?, Atlantic, March 1985.
4) Raloff, J. Are landfills a major threat to climate ?, Science News, Vol. 131, p. 150.
5) Available disposal capacity for solid waste in Illinois, IEPA publication available through ENR.
6) "Garbage: The Mounting Crisis", a 25-minute VHS videotape from ENR. It is available free by calling800/252-8955.
48
Lesson EightWHERE DO WE GO FROM HERE?
You have examined the incredible amount of trash that is generated by Americans. It has been estimatedthat our trash could fill two sports stadiums like the Superdome each day. Is it reasonable to think we couldsafely store that volume of trash? Think of the expense. Is placing the trash into a hole in the ground anybetter in principle? Wbile cities are runni-s out of usable landfill space, there are areas of the country (orthe -'orld) with expanses of unused land. Why not haul garbage to these places, or export it to othercountries for a fee? (Remember the KHIAN SEA from Philadelphia and her year-and-a-half voyage?)Couldn't we just dump the trash into the ocean or shoot it into space?
These are alternatives that may have crossed your mind, and some have been attempted. But they may beexpensive, unethical, or simply undesirable. One reason more landfill space is not being created is thatpeople don't want a landfill near them. This is sometimes called the "not in my back yard" (NIMBY)syndrome.
Although they will probably always be a part of solid waste management strategies, landfills are certainlynot the best choice for resource management. After further research on landfills, you will compare thismethod of handling trash with some other options.
One of these options is incineration. This is a term that can simply mean bUrning. However, very strictguidelines govern what kind of gases and how much of them can be released into the atmosphere duringthe burning of trash. Imagine if all the residents of a large city burned their own trash. Besides the firehazard, there would be a terrible odor, hazy smoke and dangerous gases in the air. Also, the ash left behindwould have to be disposed of. This would still be the case if there were one incinerator for all the solidwaste of a large city like Chicago. For this reason, incinerators require careful control and monitoring tokeep them from creating problems in the atmosphere. But there would still be a problem with the ashproduced.
Reduction of the trash to ash that is one-tenth of the original volume may be a good enough reason forincinerating, but there is one more very important benefit. A great deal of energy created in the burningcan be captured for use in heating buildings or supplying power to factories, etc. This is referred to as"waste to energy." After research, you will determine how this method might be incorporated mosteffectively into a waste management program.
In the last few decades, recycling has become an important factor in dealing with the solid waste problem.What is meant by recycling, and what can be recycled? Typically, recycling refers to taking a product backthrough the process of forming in a factory. For instance, used 'ex:minima cans can be melted down andreformed into more cans or other products. Glass, paper, and other metals have been handled in this wayfor many years. The cost of recycling a material for reuse is suitially less than using virgin materials.
Plastic is and has been recycled since the beginning of the industry by miming in-house scrap and overrun,but only recently has consumer waste been accepted for rtvycling xs wcil. It appears that plastic may benearly as valuable a recycled material as aluminum.
Recycling an be accomplished in many ways using incentives, r2! .:g oil good feelings of individuals,providing convenient drop-off sites, curbside pickup, etc. Communities involved in recycling have foundthat these methods and others can lead to a successful recycling program. You will continue to explore thereasons behind recycling and determine which methods might be most appropriate for a community likeyours.
No waste management program would be complete without considering reduction (sometimes calledsource reduction). The problem of solid waste is really many-sided. The cost of disposal is rapidlyincreasing, space is running out for landfills, some landfills leach damaging chemicals into the environment,and people are more aware that we are throwing away valuable material resources.
49

Reduction of waste can be achieved simply by reusing items before discarding them, by not using itemsthat cannot be reused, by banning some items from the market, or by charging users' fees, or by chargingper bag or per pound for waste disposal. Think about how source reduction differs from recycling.
Spending all of this time looking at the refuse of a society could become quite dreary if it were not for theincredible value of all those materials being buried. It is quite true that one person's trash is another'streasure. The trick is finding a good way of getting the treasure out. This may mean mining old dumpseventually, but more profitable methods are on the horizon. For this lesson, students will do some researchon alternatives to landfills and create visuals for a class presentation.
OUTCOMES1) Students will acquire a broader and deeper knowledge of solid waste management alternatives.
2) Students will become aware of the need for an integrated approach to solid waste management.
3) Students will apply this learning specifically to plastic in solid waste.
4) Students will create an integrated approach to address this problem.
PREPARATION
Either as a prior homework assignment or using some extra class time, have groups of students prepareposters, overhead transparencies, etc., to illustrate a short presentation on the alternatives to landfills.These include waste reduction, recycling, and incineration. (You may also want someone to summarize allof the information on landfills from the various readings and the tour of your local facility.) Several readingshave been recommended in the bibliography for each topic, but more can be found by searching theReader's Guide or other indexes.
TEACHING PLAN
Since the students will be teaching today, pass these hints on to them. In each case, the method proposedshould be clearly defined. All requirements (equipment, costs, licenses, etc.), processes involved, andoutcomes should be concisely described and illustrated. Also include a brief comparison of advantagesversus disadvantages. When possible, make specific references to how these methods would relate toplastic waste.
DISCUSSION
The three alternatives are quite unique, so there is a set of guiding questions for each.
Source Reduction:1) Why do we desire disposable products?
2) How does source reduction differ from the other methods of waste management?
3) How is waste reduction related to product design?4) What are the economic benefits?
5) What are the environmental benefits?
6) What is required to make source reduction work?
7) How could manufacturers be induced to create products that are easier on the environment and morereusable?
8) List several common plastic products and describe bow they would have to change to make themmore durable or reusable.
9) When considering source reduction of waste by product replacement, how should you account for theenergy used in the production of the materials? (See reference 7 under this heading.)
10) Can product bans help reduce waste in America?
Waste to Energy:1) What are the environmental costs in terms of the Greenhouse Effect?
2) Does this address the problem of dwindling resources?
3) What are the special advantages/disadvantages of burning plastics? (heat output, toxic by-products,etc.)
50

4) Where should these incinerators be located?
5) Is there a unique place for incineration in a total solid waste management system?
Recycling:1) Can 100 percent of trash be recycled?
2) What are the barriers to recycling plastics?3) What are the incentives to recycle plastics?
4) How do you get people to participate?
5) How can manufacturers or stores assist in making consumers aware that some items are recyclable?
6) How is product design related to recycling?
7) Are there uses for recycled plastics?8) In what way is recycling a "band-aid"----that is, only a temporary solution?
9) What is the role of recycling in a long-term integrated solution?
BIBLIOGRAPHY
The Keep America Beautiful brochure, Overview: solid waste disposal alternatives, is a good generalresource with a section on each of tb5 previous topics. Other general sources are:
1) Long, Robert, ed. The problem of waste disposal, The Reference Shelf series, vol. 60, #5.
2) Lawren, Bill. Getting into a heap of trouble, National Wildlife, Aug./Sept., 1988, pp. 18-24.
Source Reduction:1) Source reduction emerges as a solid waste strategy, Modern Plastics, Feb. 1989, pp. 8-9.
2) Riggle, David. Only pay for what you throw away, Biocycle, Feb. 1989, pp. 39-41.
3) Is Minneapolis' anti-plastics law a blueprint for the future ?, Modem Plastics, May 1989, pp. 10-11.
4) Schmidt, William E. Ban on plastics wins approval in Minneapolis, New York Times, March 31, 1989.
5) Mitchell, Russell. A word of advice, Benjamin: stay out of plastics, Business Week, April 17, 1989,
p. 23.
6) Wann, David. Recipes for managing and preventing waste problems, The Christian Science Monitor,Aug. 9, 1989,p. 19.
7) Partial to plastic bags, Environment, Jan./Feb., 1988, pp. 23-24.
Waste to Energy:1) Mann, Carolyn. Garbage in, garbage out, Sierra, Sept./Oct. 1987, pp. 22-27.
2) Leaversuch, Robert D. Incineration: Is it areal option? Or is it just an illusion?, Modem Plastics, May1989, pp. 34-39.
3) Peterson, I. Keeping dioxins down in the dumps, Science News, Vol. 132, pp. 118-119.
4) Davis, Tony. To burn or not to burn, Technology Review, Mar. 1987, p. 19. (Also in The problem ofwaste disposal, pp. 17-19.)
5) Hershkowitz, Allen. Burning trash: how it could work, Technology Review, July 1987, pp. 26-34. (Alsoin The problem of waste disposal, pp. 24-34.)
Recycling:1) Goldoftas, Barbara. Recycling: coming of age, Technology Review, Nov./Dec. 1987, pp. 28-35. (Also
in The problem of waste disposal, pp. 31 46.)
2) Thayer, Ann M. Solid waste concerns spur plastic recycling efforts, Chemical and Engineering News,Jan. 30, 1989, pp. 7-15.
51 n qt, 717 94 f.;; r.
UL4i Q.5L+t- givi,it.4..6.avia.

Lesson NineTHE REALITY OF RECYCLING
Historic ally,Illinois nas relied heavily on landfill disposal for the management of solid waste. The numberof permitted sanitary landfills, however, has declined dramatically from 147 in 1987 to 126 in 1989 to 117in 1990 and, as landfill capacity has decreased, collection and disposal costs have continued to rise. Totalstatewide landfill disposal capacity will be exhausted later in this decade without waste reduction andrecycling programs.
Landfill disposal is no longer the preferred method of waste management in Illinois. Many of the materialswe now discard can be recycled, converting the value of these resources into other useful products.Recycling reduces pollution, saves energy and natural resources, and can create new industries. Recy-cling, however, does have its limitations. The number of times some materials may be recycled is finite.Furthermore recycling has economic limitations. In the end the best way to handle solid waste may be toreduce waste through reuse, redesigning products, and product delivery systems. Successful recyclingrequires a familiarity with community efforts, markets, and technical procedures, and it is important todevote at least a day to study these various aspects. With this background, it will be easier to develop afeasible approach for your community.
Despite these virtues, some individuals consider recycling to be a "band-aid" because it does not reducethe amount of material that is discarded, though it does give it a longer life. Since the number of times thatany material can be recycled is finite, even recycled products eventually will end up on the trash heap.Therefore, further reduction of waste through reuse and redesign of products will have to be achieved. Ithas been suggested that, for a number of technical and economic reasons, much less than 50 percerr of allplastics destined for the landfill can be recycled. Even so, recycling will be useful despite effective stepstoward reduction because durable goods still wear out. Recycling, however, should not be used as anexcuse for continuing our wasteful habits.
Since a venture in recycling requires a familiarity with community efforts, economics and market re-search, and technical procedures, it is important to devote at least a day to study these various aspects.With this background, it will be easier to develop a feasible approach for your own community.
OUTCOMES1) Students will be introduced to the fundamental ideas and procedures involved in plastics recycling.
2) Students will consider steps for initiating a plastics recycling project in the community.
PREPARATION
This lesson works best with the aid of either a videotape, a slide presentation, or both. These visual aidshave been prepared by the Society of the Plastics Industry and portray plastics recycling in a very positivemanner. They obviously promote recycling, and they demonstrate what a currently being done and look tothe future.
53
4 ;

TEACHING PLAN"Plastics Recycling Today: A Growing Resource" (available from the Society of the Plastics Industry,see page 69) is a videotape that goes from the many roles that plastics play in our lives to the need forrecycling. It is a good introduction to the issue. 'Plastics Recycling: A Strategic Vision" is another videosimilar to the article of the same title. It looks at the more technical aspects of collection, processing, andeconomics. It is based on research supported by the plastics industry.
The slide set is meant to accompany the article, Plastics Recycling: From Vision to Reality. Using the textas a script and the slides as illustrations provides a thorough introduction to the fundamentals of plasticsrecycling.
The materials might be most effective if used together, with the slides and talk first and the tape ofrecycling in action after. These are the same materials used by professionals from the plastics industrywhen they make presentations on recycling.
For further discussion, students can be assigned readings from the extensive list in the bibliography. Thearticles contain more specialized information on collection and sorting, processes, and markets andeconomics.
DISCUSSION
Armed with all of this information, the students should be ready to do something about the solid wasteproblem and recycling of plastics in particular. Discussion should focus on whether the students want toinitiate a plastics recycling program in the community, if that seems possible, and what steps would benecessary. The following questions may help:
1) More than 1 billion pounds of PET soft drink bottles and more than 1 billion pounds of PE milk jugs willbe sold in the U.S. this year. How many pounds of these plastic containers are there for each person inthe U.S.? (population is about 250 million)
2) How many pounds of these plastics would be discarded by your community in one year? (Multiplyyour answer by the total population.)
3) How much money could your community earn by selling plastics to recycling companies at 15 centsper pound? (Assume 100% recovery.)
4) If each person in your community discards a quarter of a pound of plastics per day, how much plasticdoes your entire city discard in one year?
5) Assuming that 25 percent of this plastic trash could be recycled, how much money could your commu-nity earn in one year at 15 cents per pound?
6) Do you think consumers will be willing to purchase goods made from recycled plastics? Why or whynot?
7) What other factors affect recycling?8) What would be required to make recycling work in your community?
9) What are some other benefits of recycling besides money?
10) Would you still be willing to recycle if recycling were not self-supporting?
11) What makes some plastic resins/products easier to recycle than others?
12) What are some technical, economic, and social barriers to recycling?
13) How are recycled plastics currently being used?
14) Are there enough new uses for recycled plastics to create viable markets for consumer plasticwaste?
15) Can you imagine some other uses for recycled plastics?
There are many other questions to ponder before you are ready to get involved. Take time to discuss these,and consider inviting municipal officials or recyclers from your area to provide more guidance.
54

BIBLIOGRAPHY
General Articles:1) Plastics recycling: an overview, Plastics Recycling Foundation.
2) Plastics recycling: from vision to reality, Plastics Recycling Foundation.
3) Plastics recycling: a strategic vision, Plastics Recycling Foundation.
4) Promoting recycling to the public, National Soft Drink Association. (A how to guide)
5) Plastics recycling action plan for Massachusetts, Commonwealth of Massachusetts.
6) Chamberlain, Gary. Recycled plastics: building blocks of tomorrow, Design News, May 4,1987,pp. 51-58.
7) Hocking, Martin B. Paper vs. polystyrene: a complex choice, Science, Vol.251, Feb. 1, 1991,pp. 504-505.
8) Rathje, William L. Once and future landfills, National Geographic, Vol 17.9, No.5, May 1991,pp. 116-34.
Markets and Economics:1) Market research on plastics recycling, Plastics Recycling Foundation.2) Curlee, T. Randall. Plastics recycling: economic and institutional issues, Conservation and
Recycling, Vol. 9, No. 4,1986, pp. 335-350.
Collection:1) Plastics recycling: collection case studies, Plastics Recycling Foundation.
2) Dropoff collection equipment, Biocycle, Feb. 1989, pp. 46-47.
3) "New Age" dropoff programs, Biocycle, Feb. 1989, pp. 42-45.
4) Advances in collecting plastics, Biocycle, Feb. 1989, p. 50.
5) How to finance curbside recycling, Biocycle, Feb. 1989, pp. 31-33.
6) s voluntary plastic container coding system, SPI.
Processes in use:1) Plastic bottle recycling: case histories, Society of the Plastics Industry.
2) Leaversuch, Robert. HDPE recycling: It's a big-volume opportunity waiting to happen, ModernPlastics, Aug. 1988, pp. 44-47.
3) Leaversuch, Robert. Landfill fodder? It doesn't have to be, Modern Plastics, March 1989, pp. 69-73.
4) Now plastic cups can be born again, Business Week, Dec. 19, 1988, p. 95.

Lesson TenSURVEYING THE SITUATION
Even if you are convinced of the need to recycle plastics, your own personal contribution of a few poundswill be small compared to the billions of pounds discarded annually. You need community support and co-operation, but in order to obtain them, you must know if people are willing and ready to literally "pitch in."
One way to find out is through the use of a survey. The questionnaire provided already has been used invarious places in Illinois to determine attitudes toward recycling and to predict levels of participation. Thissurvey will be a crucial step in the development of a recycling program your community.
OUTCOMES
1) Students will administer a survey to community members.
2) Students will assess the results of the survey.
3) Students will draw conclusions concerning attitudes and participation from the results of the survey.
4) Students will devise a plan for initiating plastics recycling in the community based on their conclusions.
PREPARATION
You might consider doing one of several things. To feel for the survey, you could have your students takeit first and compile the results. This will allow them to see how they feel as a group, and it will also providea practice session in both giving and analyzing the survey. This could be carried one step further by givingthe survey to the students at some time before the study of plastics begins. They could see how theirattitudes had changed over the course of their education and might clarify the need for public education aswell.
Remind the students that the purpose of the survey is to find out what people thinknot to teach them orhave them agree with what you believe. Have them arrange to interview at least two individuals who havenot previously discussed the project. This should give you a fair sampling of your community. Also, toensure that you get a good return, suggest that the students wait while the form is being filled out orschedule a definite time when it can be picked up. The survey has been designed so that a short version(Sections I and L only) can be used, or the entire document may be used to obtain more information.
Once the surveys have been collected, the responses for each item should be tallied and averaged (thiscould be done beforehand or as a class project).
TEACHING PLAN
With the class, look more closely at the data gathered. Try to see patterns. Are people currently recyclinganything? What are the most important factors for/against recycling? Is there an overall disinterest inrecycling? What did people indicate the city should do to encourage recycling? Are people generally willingto make an effort and be inconvenienced? Do people have strongly positive attitudes concerning theenvironment? Are people most concerned with the financial rewards?
57

Section I is designed to provide some baseline data on how much recycling is currently taking place.Section II looks at people's attitudes concerning recycling. Section III is optional, and the questions aredesigned to look at general attitudes people hold about the environment and personal responsibility for itscare.
For the multiple choice questions, have students record the rumber of each response, calculate percent-ages for comparison, and draw histograms (bar graphs) to ciisplay these data. Other useful informationmight be the average response (median) or the most frequently given response (mode).
The results of this survey have indicated that the most important reasons for or against recycling are moreclosely tied to internal motivating factors like reducing litter or saving energy. Economic factors are theleast important. The level of information about recycling and social pressure also plays a key role in deter-mining the level of participation.
It is evident that the beliefs of individuals will affect their behaviors, but weak beliefs may not be actedupon in the absence of some external motivation. This could be as simple as a newspaper article, pamphlet,or other information; convenient dropoff sites or pickup service; or rewards, fines, and mandatoryinvolvement.
Some research indicates that the longest-lasting participation will result from strengthening the beliefs andpersonal commitment of the individual. Further, some communities have found that this can be accom-plished by creating a grass roots public education effort and providing inexpensive but convenient dropofflocations.
DISCUSSION*
In a more elaborate study done in the Champaign-Urbana area, results indicate that individuals recycle fora number of different reasons. Though it is true that a strong concern for the environment can be anincentive to recycle, it alone may not be enough. The matter of convenience seems to be extremelyimportant. When colored buckets were provided for curbside pickup, participation soared. (Social pres-sure also becomes a factor in that it is obvious to neighbors if someone does not have the bucket out in fronton collection day.) But other studies have shown that individuals will make the effort to drop off goods forrecycling if the site is conveniently placed, for example, at a local grocery store.
While some are motivated by economic incentives, many people will participate at a loss, considering theirtime and transportation costs. Some sort of reward system early in a new recycling effort can be effectivein helping to establish participation, but as the behavior becomes habitual, the reward can be removed.
A successful recycling program seems to boil down to attitudes and convenience. Strong attitudes canlead to positive behavior if recycling is made convenient. And weak attitudes can be improved throughpublic education. The factor of social pressure can also help to instill the habit when the attitude is weak. Ithas also been indicated that the act of recycling can be a valuable reinforcement, helping to strengthenenvironmental attitudes.
Try to look for indications of environmental, convenience, social, and economic factors in your surveys,and discuss them in light of information presented here.
BIBLIOGRAPHY
The survey questions included here were taken from a survey prepared by the staff of the University ofIllinois Institute for Environmental Studies.
The analysis of the survey was reported in IFS Staff Paper No. 48 entitled, Changes in RecyclingAttitudes, Behavior, and Motivation as a Result of Community Recycling Information and EducationProgram, by Joanne Vining, et.al.
*For classroom discussion, spend time with the survey questions. Let students air their views andcomment on what they believe is conveyed by the questions. Also discuss the use of a survey as a tool forgathering information. How wili you select a population for the survey? Is there a particular way toadminister the surveyby interview, by phone, written response by individual, etc.? How will you interpretthe responses?
58
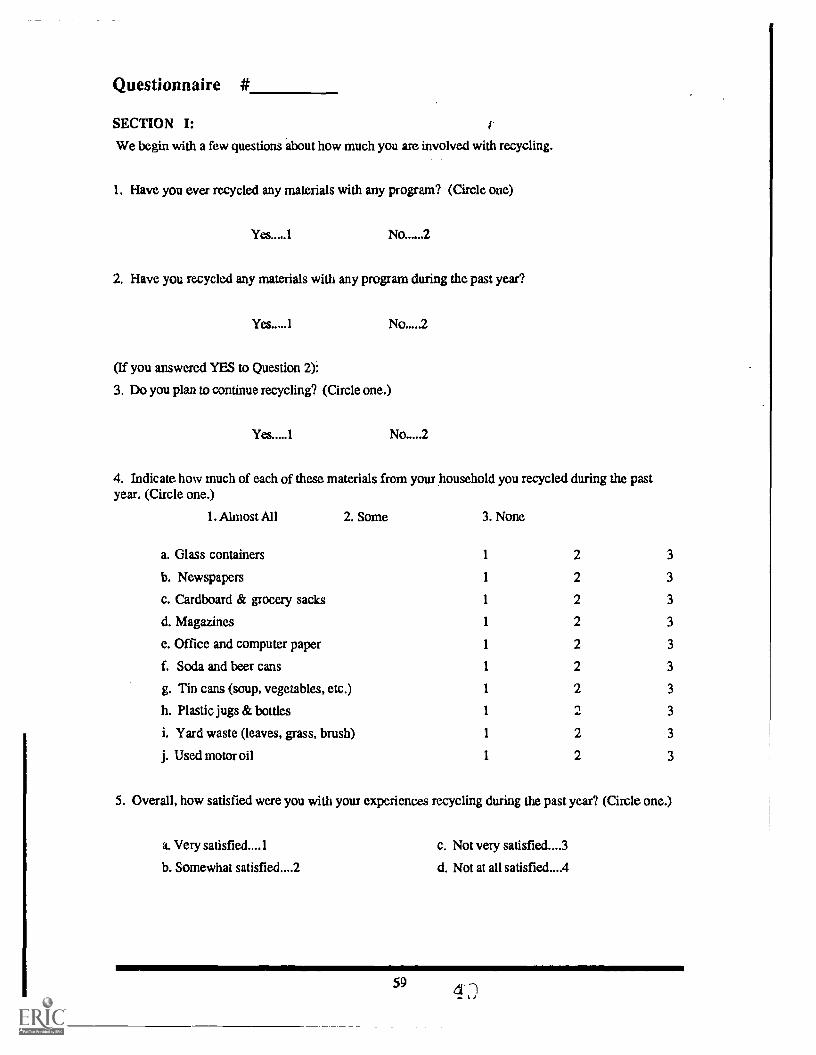
Questionnaire #
SECTION I:We begin with a few questions about how much you are involved with recycling.
1. Have you ever recycled any materials with any program? (Circle one)
Yes.....1 No 2
2. Have you recycled any materials with any program during the past year?
Yes.....1 No....2
(If you answered YES to Question 2):
3. Do you plan to continue recycling? (Circle one.)
Yes 1 No 2
4. Indicate how much of each of these materials from your household you recycled during the pastyear. (Circle one.)
1. Almost All 2. Some 3. None
a. Glass containers 1 2 3
b. Newspapers 1 2 3
c. Cardboard & grocery sacks 1 2 3
d. Magazines 1 2 3
e. Office and computer paper 1 2 3
f. Soda and beer cans 1 2 3
g. Tin cans (soup, vegetables, etc.) 1 2 3
h. Plastic jugs & bottles 1 2 3
i. Yard waste (leaves, grass, brush) 1 2 3
j. Used motor oil 1 2 3
5. Overall, how satisfied were you with your experiences recycling during the past year? (Circle one.)
a. Very satisfied....1
b. Somewhat satisfied....2
c. Not very satisfied....3
d. Not at all satisfied....4
59

6. What do you think the city could do to encourage residents to recycle?
Section II.
We would like you to tell us what, in your opinion, are the reasons for and against recycling.
7. How important is each of the following possible reasons in favor of recycling? (Circle one.)
1. Extremely important 2. Very important 3. Moderately important
4. Somewhat important
a. To receive payment for materials
b. To reduce the cost of my household's
garbage collection
c. To conserve natural resources
d. To reduce litter
e. To save energyf. To reduce the use of land
g. To create more jobs
h. To help charity or club
i. Because neighbors and friends recycle
j. Because other members of the family recyclek. Use of free collection container
1. Other
5. Not at all important
1 2 3
1 2 3
1 2 3
1 2 3
1 2 3
1 2 3
1 2 3
1 2 3
1 2 3
1 2 3
1 2 3
8. How important is each of the following possible reasons against recycling? (Circle one.)
a. Household does not produce enoughrecyclable materials
b. Not enough storage space at home
c. Storage in home attracts pests and insects
d. No one to pick up the materials
e. Too busy; not enough time to prepare materials
f. Too difficult to prepare materials for recycling
g. Don't receive enough money from recycling tomake it worthwhile
h. Don'. know how or where to recycle; notenough information
i. Lack of container for convenient drop off
j. No curbside pickup
k. Don't like public display of my recyclablesat curbside
1. No one else in my neighborhood recycles.
m Oter
1 2 3
1 2 3
1 2 3
1 2 3
1 2 3
1 2 3
1 2 3
1 2 3
1 2 3
1 2 3
1 2 3
1 2 3
4 5
4 5
4 5
4 5
4 5
4 5
4 5
4 5
4 5
4 5
4 5
4 5
4 5
4 5
4 5
4 5
4 5
4 5
4 5
4 5
4 5
4 5
4 5
60,J

SECTION III: (Optional)The views of people like you are very important in designing workable community recycling programs.The next few questions ask for your reactions to some possible new programs as well as some old ones.(Circle one.)
1. Strongly agree 2. Agree 3. Disagree 4. Strongly Disagree
9. Local governments should:
a. require that recyclables are separated from garbagegoing to the landfill 1
b. require a deposit on all glass beverage containers 1
c. require a deposit on all beverage cans 1
d. ban any nonrecyclable plastic containers for which
there are no recyclable alternatives 1
e. give priority to purchasing products made of
recycled material 1
f. incinerate (burn) all combustible waste material
that is not recycled 1
g. require residents to separate recyclables from other
garbage going to the landfill 1
10. Your opinions please. Circle the number most closely representing your opinion.
a. Household recycling is a major way to conserve vitalnatural resources 1
b. The balance of nature is very delicate and easily upset 1
c. Almost no one I know recycles any household materials 1
d. Plants and animals exist primarily to be used by humans 1
e. Household recycling is a major way to reduce litter 1
1. There are limits to growth beyond which our industrializedsociety cannot expand 1
g. I feel a strong personal obligation to recycle a large portionof my household's recyclables 1
h. When humans interfere with nature it often producesdisastrous results 1
i. Households like mine produce very little of the material thatis disposed of in local landfills 1
j. We are approaching the limit to the number of people theearth can support 1
k. I am willing to go blocks out of my way to recycle householdmaterials on a regular basis 1
I. Mankind was created to rule over the rest of nature 1
m. For me, recycling is just a matter of moneyI wouldn'trecycle materials I didn't get paid for doing it 1
n. Humans must live in harmony with nature in order to survive 1
o. Household recycling is a major way to conserve energy 1
p. The earth is like a spaceship with limited room and resources 1
2 3 4
2 3 4
2 3 4
2 3 4
2 3 4
2 3 4
2 3 4
2 3 4
2 3 4
2 3 4
2 3 4
2 3 4
2 3 4
2 3 4
2 3 4
2 3 4
2 3 4
2 3 4
2 3 4
2 3 4
2 3 4
2 3 4
2 3 4
61
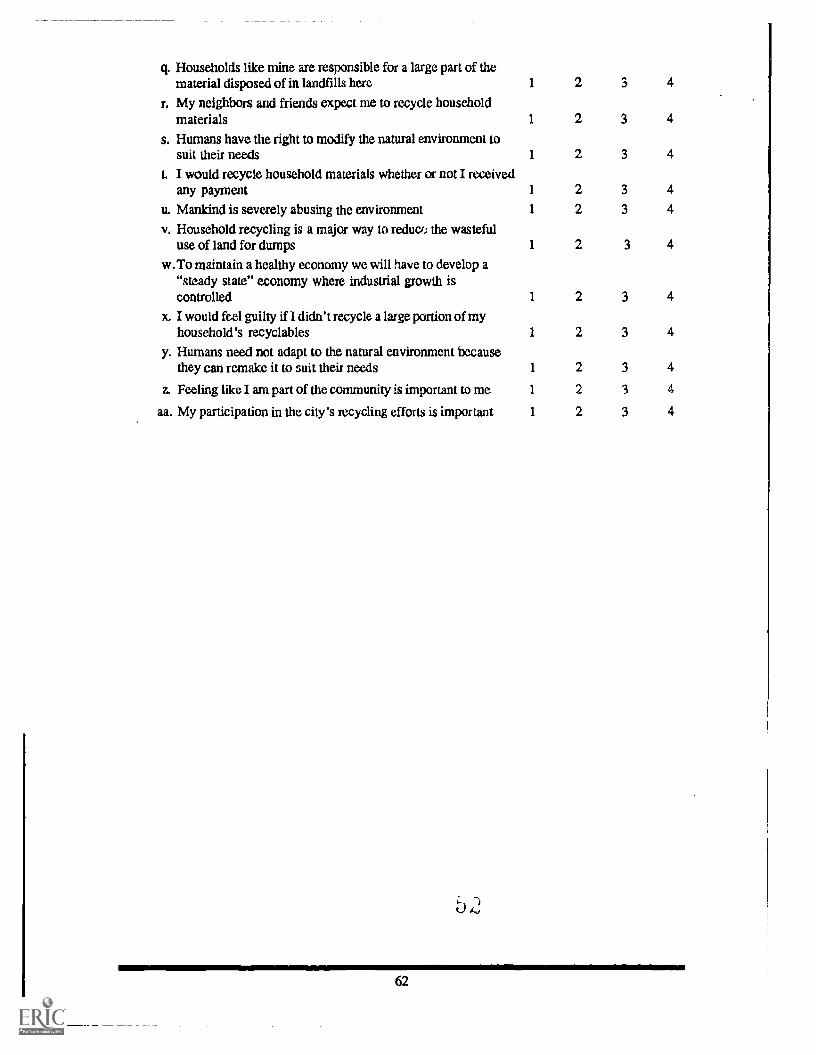
q. Households like mine are responsible for a large part of thematerial disposed of in landfills here
r. My neighbors and friends expect me to recycle householdmaterials
s. Humans have the right to modify the natural environment tosuit their needs
L I would recycle household materials whether or not I receivedany payment
u. Mankind is severely abusing the environment
v. Household recycling is a major way to reducr.: the wastefuluse of land for dumps
w.To maintain a healthy economy we will have to develop a"steady state" economy where industrial growth iscontrolled
x. I would feel guilty if I didn't recycle a large portion of myhousehold's recyclables
y. Humans need not adapt to the natural environment becausethey can remake it to suit their needs
z. Feeling like I am part of the community is important to me
aa. My participation in the city's recycling efforts is important
1 2 3 4
1 2 3 4
1 2 3 4
1 2 3 4
1 2 3 4
1 2 3 4
1 2 3 4
1 2 3 4
1 2 3 4
1 2 3 4
1 2 3 4
62

Lesson ElevenWRAPPING IT UP
You now know a fair amount about plastics, solid waste issues, and recycling. It is time to put it all togetherinto an integrated package that will suit your local community. The purpose is to draw up a reasonable andworkable plan for action in your area.
OUTCOMES
1) Students will create an integrated plan for action based on the information gathered in this unit.
2) Students will test the feasibility of the plan by submitting it for consideration to the municipal govern-ingboard. (optional)
PREPARATION
Recycling
The best way to create a plan of this nature is to do lots of research or, the area and then look at how othershave done it. References in previous lessons have provided details on successful programs in a number oflocations around the world. The Plastics Recycling Action Plan For Massachusetts is a comprehensivedocument that carefully treats all issues involved. And there is a mailing list of industries involved inrecycling that can be contacted for more information. However, utilizing all of the resources availablecould be extremely difficult to manage as well as time consuming. Consider the following simpleralternative.
Start with your own survey. This will tell you how hard you will have to work to make something happen,but remember that by strengthening beliefs already held, people will be more willing to become. active andeven face some inconvenience in "doing the right thing." For this reason, public education may be yourbest tool (after all, it is what you do for a living). To be most effective, you will need to decide at what levelto promote this education, i.e., newspaper articles, radio/TV advertisements, distributing pamphlets, signsin store windows, public forums, etc.
To make this education possible, you will need both monetary and moral support. This could be solicitedfrom local businesses and/or political officials in the form of donated materials for building dropofffacilities, free paper and printing for a newsletter or pamphlet (use recycled paper if possible), listing of allbusinesses that contribute to and participate in recycling efforts (social pressure), free space in thenewspaper or on the radio/TV, printing on grocery sacks, etc.
To keep costs and chances for failure low, join together with other communities in your area - especiallyif one already has a recycling program in action. A recent newspaper article indicates that small towns inChampaign County have surpassed predicted levels of participation in a dropoff only program by joiningtogether with the existing Champaign/Urbana program. By becoming a part of an existing recyclingprogram, you can reduce some of the economic headaches related to dealing directly with the industrialbuyers.
Finally, explore the possibility of small grants for this purpose available from state or federal agencies.Consider extra incentives like a drawing or coupons (supported by donors) or other unique motivationalfactors to help initiate the program. And try to be innovative. It is important to draw from the successes ofothers, but you know your community best, and you need a program that will keep people involved.
Reduction
Waste reduction is the second component of this unit. Though perhaps not as technological as recycling,reduction is also related to strongly held beliefs and values. But to be successful, waste reduction requiresa double commitment. Consumers must be willing to modify their wasteful patterns and demands forconvenient disposable items, and manufacturers must be willing to produce goods that are more durableand less harmful to the environment.
63
The action plan should contain a second section that focuses on waste reduction.
TEACHING PLAN .
Recycling
Let the students imaginations be their guide. Allow a brainstorming session to consider all of the aboveissues. Let students decide:
1) how best to educate their parents and other adults,
2) who to contact and how to go about it,
3) what donations and support to request,
4) how to design dropoff facilities and where to place them,
5) what to call the campaign (very important), a mascot, a logo, and a slogan
6) what types of motivation to employ,
7) who to contact in other cities,
8) what time line to follow.
Then draw up a document that summarizes the need for such a plan (what you just studied) and spells outdetails for all the steps mentioned above. Include any pertinent data in charts or graphs (try to show themoney to be earned by recycling and the saving in trash disposal costs avoided), and draw a map showinglocation of dropoff facilities.
Thus far the plan only addresses recycling. Now have a second brainstorming session on what can be doneto reduce waste at the source.
Waste Reduction
This component of solid waste management will also require some public education, but the outcome willbe much different than that of recycling. The students should concentrate on two areas: 1) How do weencourage people to change their wasteful habits over time? 2) How can we influence the plastics industryto create more durable, environmentally safe, and more recyclable products?
Actions in this area could include how to educate the public on solid waste issues and the growth of plasticsin solid waste, how to look for products that have been recycled or can be recycled, and how tocommunicate with manufacturers and make consumer demands heard.
This part of the plan may be less structured than for recycling, but students can begin to put it into action im-mediately by modifying their own patterns of wasteful behavior.
The finished plan could be a blueprint for a waste management program in your community. Going beyondclass, you could share this plan with municipal officials and encourage your students to become involved inthe community to help initiate the program.
Also, remember that plastics are only one component of solid waste. Total solid waste could be reducedsignificantly by recycling paper, glass, and metals and composting. Keep what you have learned aboutplastics in mind as you explore these other areas.
BIBLIOGRAPHY
1) Plastics recycling action plan for Massachusetts, Commonwealth of Massachusetts, July 1988.
2) Promoting recycling to the public: an illustrated guide to recycling and litter reduction programs,National Soft Drink Association.
3) Garhart, Rosemary T. Small towns' efforts to recycle paying off, Champaign-Urbana News Gazette,July 25,1989, p. A-4.
4) Glenn, Jim. Enforcing mandatory recycling ordinances, Biocycle, March 1989, p. 31.
5) How to get the word out, Biocycle, April 1989, pp. 66-67.
6) A number of ENR publications also provide a great deal of useful information (see page 69 to requestpublications list).
64 L'1
41111MOMMIVIONIIk

BIBLIOGRAPHY
Advances in collecting plastics, Biocycle, Feb. 1989, p. 50.
Alper, Joseph. Polymers, Chem Matters, April 1986, p. 4.
Available disposal capacity for solid waste in Illinois, IEPA publication.
Beardsley, Tim. Disappearing act. Scientific American, Nov. 1988, p. 135.
Brown, Elizabeth A. Answers sought to mounting plastic, The Christian Science Monitor. July 11, 1989.pp. 12-13.
Chamberlain, Gary. Recycled plastics: building blocks of tomorrow, Design News, May 4,1987, pp. 51-58.
Characterization of municipal solid waste in the United States 1960 to 2000, (1988 update). Prepared forUSEPA, Franklin Associates LTD, Prairie Village, KS.
Conner, Daniel Keith and Robert O'Dell. The tightening net of marine plastics pollution, Environment,..Feb. 1988, pp. 16-20, 33-36.
Curlee, T. Randall. Plastics recycling: economic and institutional issues, Conservation and Recycling,Vol. 9, No.4, 1986, pp. 335-350.
Davis, Tony. To burn or not to burn, Technology Review, Mar. 1987, p. 19.
Dropoff collection equipment, Biocycle, Feb. 1989, pp. 46-47.
"Garbage: the mounting crisis,"a 25-minute VHS videotape from ENR. It is available free by calling(800)252-8955.
Garhart, Rosemary T. Small towns' efforts to recycle paying off, Champaign-Urbana News Gazette,July 25, 1989, p. A-4.
Glenn, Jim. Enforcing mandatory recycling ordinances, Biocycle, March 1989, p. 31.
Glenn, Jim and David Riggle. Where does the waste go?, Biocycle, April 1989, pp. 34-39.
Goldoftas, Barbara. Recycling: coming of age, Technology Review, Nov./Dec. 1987, pp. 28-35.
Hershkowitz, Allen. Burning trash: how it could work, Technology Review, July 1987, pp. 26-34.
How to finance curbside recycling, Biocycle, Feb. 1989, pp. 31-33.
How to get the word out, Biocycle, April 1989, pp. 66-67.
Identifying rigid plastic containers, Plastics Group,The Dow Chemical Company, 1989.
Is Minneapolis' anti-plastics law a blueprint for the future ?, Modern Plastics, May 1989, pp. 10-11
Lawren, Bill. Getting into a heap of trouble, National Wildlife, Aug./Sept., 1988, pp. 18-24.
Leaversuch, Robert D. Incineration: is it a real option? or is it just an illusion?, Modern PLastics, May 1989,pp. 34-39.
Leaversuch, Robert. HDPE recycling: it's a big-volume opportunity waiting to happen, Modern Plastics,Aug. 1988, pp. 44.47.
Leaversuch, Robert. Landfill fodder? It doesn't have to be, Modern Plastics, March 1989, pp. 69-73.
Livermore, Beth. Cleaning up our act, Health, March 1989, pp. 41-47&94.
MacFadyen, J. Tevere. Where will all the garbage go?, Atlantic, March 1985.
Mann, Carolyn, Garbage in, garbage out, Sierra, Sept./Oct. 1987, pp. 22-27.
Markett research on plastics recycling, Plastics Recycling Foundation.
Methods to manage and control plastic wastes: Report to Congress, United States Environmental Protec-tion Agency, Office of Solid Waste, Office of Water, Feb. 1990.
Mitchell, Russell. A word of advice, Benjamin: stay out of plastics, Business Week, April l 7, 1989, p. 23.
65
)

Mitchell, William H. Recycling lessons for science teachers, Biocycle, Jan. 1989, p. 59.
"New Age" dropoff programs, Biocycle, Feb. 1989, pp. 42-45.
Now plastic cups can be born again, Business Week, Dec. 19,1988, p. 95.
Overview: solid waste disposal alternatives , A Keep America Beautiful brochure. Partial to plastic bags,Environment, Jan./Feb., 1988,pp. 23-24.
Peterson, I. Keeping dioxins down in the dumps, Science News, Vol. 132, pp. 118-119.
Plastic bottle recycling: case histories, Society of the Plastics Industry.
"Plastic: here today, here tommorow," an audio tape from Soundprint, WJHU, 2216 N. Charles St.,Baltimore, MD 21218.
Plastics: AD. 2000 production and use through the turn of the century, Chem Systems, 1987.
Plastics and you, A Quarterly Review of Innovations in Plastics, Society of the Plastics Industry (SPI).
Plastics identification table, from Simple Methods for Identification of Plastics by Dietrich Braun.
Plastics in "aerospace, building and consruction, electronics, health care, packaging, transportation"pamphlets from SPI.
Plastics recycling action plan for Massachusetts, Commonwealth of Massachusetts, July 1988.
Plastics Recycling Foundation. Plastics recycling: a strategic visison, (a brochure)
"Plastics Recycling: a strategic vision," An 8-minute VHS videotape by SPI.
Plastics recycling: an overview, Plastics Recycling Foundation.
Plastics recycling: collection case studies, Plastics Recycling Foundation.
Plastics recycling: from vision to reality, Plastics Recycling Foundation.
Polymer chemistry, A National Science Teachers Association publication.
Polymer chemistry, The Polymer Group of the University of Illinois, 1304 W. Green St., Urbana, IL, 61801.
Polymers, The Polymer Group of the University of Illinois, 1304 W. Green St., Urbana, IL, 61801.
Polymers, the material of choice today, tomorrow, and thereafter, The Polymer Group of the Univer-sity of Illinois, 1304 W. Green St., Urbana, IL, 61801.
Promoting recycling to the public, National Soft Drink Association.
Raloff, J. Are landfills a major threat to climate?, Science News, VoL 131, p. 150.
Riggle, David. Only pay for what you throw away, Biocycle, Feb. 1989, pp. 39-41.
Schmidt, William E. Ban on plastics wins approval in Minneapolis, New York Times, March 31, 1989.
Shakhashiri, Bassam. Chemical demonstrations, PP. 213-215.
Sheets, Kenneth R. The new high-tech world of plastics, U.S. News and World Report, Feb. 24, 1986.
Source reduction emerges as a solid waste strategy, Modem Plastics, Feb. 1989, pp. 8-9.
SPI's voluntary plastic container coding system, The Society of the Plastics Industry.
Stover, Dawn. Plastic from starch: not such a corny idea, Popular Science, June 1988, p. 21.
Summerlin, Lee, and James Ealy. Chemical demonstrations, pp. 126-127.
Vining, Joanne. et.al. Changes in recycling attitudes, behavior, and motivation as a result of communityrecycling information and education program , Institute for Environmental Studies Staff Paper No. 48.University of Illinois at Urbana-Champaign.
Thayer, Arm M. Degradable plastics generate controversy in solid waste issues, Chemical andEngineering News, June 25, 1990, pp. 7-14.
Thayer, Ann M. Solid waste concerns spur plastic recycling efforts, Chemical and Engineering News,Jan. 30, 1989, pp. 7-15.
Robert Long, ed., The problem of waste disposal, The Reference Shelf series, vol. 60, #5.
Typical container materials, The Dow Chemical Company, 1989.
66

Wann, David. Recipes for managing and preventing waste problems, The Christian Science Monitor,Aug. 9,1989, p.19.
Weisskopf, Michael. Plastic reaps a grim harvest in the oceans of the world, Smithsonian, March 1988,pp. 58-66.
111111.1Mr
67

MAILING LIST
Illinois Department of Energy and NaturalResources Information Clearinghouse325 W. Adams St., Rm. 300
Springfield, IL 62704-18921 (800) 252-8955
Ask for their solid waste publications order form.
Dow Chemical USA(517) 636-5847
Ask for a laminated copy of IDENTIFYINGRIGID PLASTIC CONTAINERS.
University of Illinois Film/Video Center1325 S. Oak St.
Champaign, IL 618201 (800) 367-3456
Ask for the catalog of solid waste managementvideo resources.
Keep America BeautifulMill River Plaza
9 W. Broad St.
Stamford, CT 06902
Ask for OVERVIEW: SOLID WASTEDISPOSAL ALTERNATIVES. They also havea catalog of other resources related to recyclingand litter. (The overview also contains a usefulglossary of terms related to solid waste issuesand alternatives.)
National Soft Drink Association1101 Sixteenth St. NW
Washington, D.C. 20036(202) 463-6732
Ask for PROMOTING RECYCLING TO THEPUBLIC. This guide has an extensive list of recy-cling programs throughout the nation. (The guidealso contains a useful glossary of recyclingterms.)
Plastics Recycling Foundation1275 K St. NW
Suite 400Washington, D.C. 20005
(202) 371-5200
Ask for a catalog of their free publications andvideos. Many of the resources in the bibliographyare available through this office. Also ask for thePLASTICS RECYCLING DIRECTORY, whichcontains information and contacts for the plasticsrecycling industry.
The Society of the Plastics Industry1275 K St. NW, #400
Washington. D.C. 20005
(202) 371-5212
Ask for a catalog of their free publications. Manyof the resources in the bibliography are availablethrough this office.
The Polymer Group of theUniversity of Illinois1304 W. Green St.
Urbana, IL 61801
(217) 333-0149
Fabri -Kal CorporationPlastics PlaceKalamazoo, MI 49001
(616) 385-5050
69
AVALALLELoa:7.) bLiA d 11
Degradable Plasticsand the
EnvironmentPart of the Solution
OrJust More Pollution?
D. Andrew Holm, Ph.D.Parkland CollegeChampaign, IL

Table of Contents
Page
Introduction 75
The Problem 77
A Potential Solution 79
Types of Degradation 81
Biodegradation 83
Photodegradation 85
Examples of Independent Research Projects 87
Other Projects Dealing with Degradation Variables 91
Possible Degradation Tests 93
References 97
6,1
73

IntroductionDegradable Plastics and the Environment
In this unit, you will have an opportunity to explore the factors that cause degradable plastics to breakdown in the environment. You will begin by learning how degradable plastics are being suggested asa solution to the plastics solid waste problem. You will then leant about the two main types of degradableplastics: biodegradable and photodegradable. Next you will design an independent research project andselect one of several degradation tests to monitor the rate of degradation. Several suggested projects aswell as specific degradation tests are described in this unit.

The Problem
As we consider the enormous challenge of solid waste management, one of the biggest problems we faceis how to deal with plastics. About six million tons of plastics are disposed of in the United States eachyear (Wool, 1989). Where does this all end up? According to an article in the Smithsonian (Smithsonian,1988), the following plastic materials were gathered in a three-hour cleanup of 157 miles of Texasshoreline in September 1987:
31,773 plastic bags30,295 plastic bottles28,540 plastic lids15,631 plastic six-pack rings7,460 plastic milk jugs1,914 disposable diapers1,040 plastic tampon applicators
This accumulation of these nondegradable plastic products not only poses an eyesore that impacts onthe economics of tourism but also kills wildlife and creates a major solid waste disposal problem, withour cities paying the enormous costs of pickup and disposal. (Sudol and Zach, 1988).
What exactly are the problems that result from the dumping of plastics?There are three major ones:
A. Litter in the environmentPlastic materials were designed at great cost by engineers to last a long time. Now, after years of beingdumped, this plastic debris is showing up on beaches, in parks, in waterways, and on streets. At ameeting of the Society of the Plastics Industry, Inc., in 1987, the following percentages of debris oncoastal beaches were found to be plastic materials (SPII, 1987):
Year Location Percentage Plastics (by weight)1986 Oregon over 70%1982 Alaska over 75%1986 Maine over 60%1986 Massachusetts over 55%1986 New Jersey 50%1986 Texas over 45%
B. Destruction of Wildlife in the WaterwaysA 1984 study by Dahlberg (SPII, 1987) reported that plastic materials comprised over 80% of thefloating debris sighted at sea.
It is estimated that plastic junk kills two million sea birds and 100,000 marine mammals each year. Partof the problem is the attraction of the animals to the plastics because they look like food. (Blunck, 1989)
Other studies give more details. The 1986 Sievert study showed that plastic debris was found in thestomachs of 100 percent of the chicks of the Laysan Albatross, and 80 percent of the species of birdsat the Midway Island sampling location showed evidence of plastics consumption. Sea turtles are beingfound suffocated and starved to death by plastics caught in their lungs and digestive tracks; sea gulls andsea lions are being choked by plastic carriers for six-packs of beverage cans. (Sudol and Zach, 1988)
The situation has caused David Laist of the Marine Mammal Commission in Washington, D.C. to state,"Plastics may be as great a source of mortality among marine mammals as oil spills, heavy metals, orother toxic materials." (Sudol and Zach, 1988)
77

C. MAjor Contribution to Volume of Garbage in LandfillMost sources report municipal solid waste on a percentage by weight basis. One of the more commonlycited sources is the Franklin Associates, which did a study for the EPA in March 1988:
Material Percentage, by weight (rounded)Paper and paperboard 36%Yard Wastes 20%Food Wastes 9%Metals 9%Glass 8%Plastic 7%Other 11%
Most other studies also report about 7 percent of our municipal solid waste is composed of plastics. Butthis is based on weight, not volume. On a volume basis, we can again cite a study by Franklin Associates,Ltd., concluded in February 1990:
Material Percentage, by volumepaper 38%plastics 18%metal 14%yard waste 11%food waste 4%glass 2%other 13%
Novice that only 7 percent of the MSW is plastics by weight, although 18 percent is plastics by volume.
In other words, about one-fifth of the space occupied by our solid waste is taken up by plastics, eventhough less than one-tenth of the total weight is due to plastics. Since most of us are more concernedabout space occupied by landfills rather than weight of landfilled materials, this figure seems to be abetter one with which to work.
78

A Potential Solution
One common method for disposal of plastics has been "open dumping," i.e., discarding plastics into theenvironment. This has led to the problems discussed in Part I. What is a better way to manage thesetons of discarded plastics? The most obvious solution is to use less plastic. This is certainly the bestsolution but, with most people ignoring the pleas to change their lifestyles, it seems that other optionsmust be considered.
Many citizens and legislators are looking at"degradable" plastics as one way to help solve the nation'ssolid waste problem. Federal, state, and local legislators are proposing legislation that would requireplastics packaging to be degradable. Apparently the thinking is that if plastics were degradable, theywould simply disappear, thereby minimizing both the litter and the landfill problems.
There are several possible benefits if plastics can be made degradable:
A. LandfillsAccording to Professor Richard Wool, head of the degradable plastics laboratory at the University ofIllinois in Urbana, one benefit to landfills would be the use of degradable plastic covers to replace the6 inches to 12 inches of dirt that are deposited daily on landfills as a cover. This could saveapproximately 18 percent of the space in landfills. This earth covering is needed to prevent the escapeof odors and to stop the accumulation of flies and animals. (Wool, 1989)
B. LitterIf it were not for major problems with litter both on land and in our waterways, recycling would be theoptimal solution to the solid waste problem rather than degradability. But a significant portion of litteris plastic (see Part I). If plastics can be made degradable, this litter would eventually degrade whenexposed to sun, wind, rain, insects, waterways, the soil, and microorganisms. At least the visible litterwould disappear as the plastic breaks into pieces and eventually into dust.
This technique has been used since the late '70s in Hi-Cone plastic six-pack carriers for cannedbeverages, which have been made photodegradable to meet the mandates of states that requiredegradable carriers (Harlan & Nichols, 1987). Environmer is now manufacturing degradable baitcontainer lids that often end up in waterways after disposal by fishermen (Redpath, 1990). There areobvious additional benefits to wildlife in the waterways if plastic that commonly ends up as litter is madedegradable.
C. Yard WastesAbout 20 percent of the wastes in landfills (see EPA figures listed in Part I) is due to yard wastes suchas grass clippings, weeds and leaves. Under the right composting conditions, these materials arenaturally degradable. The resultant compost can be used on lawns, gardens, or as soil cover in landfills.The main problem with large-scale composting is the time and labor needed to pick up bags, open them,empty them, and then dispose of the bags. If, however, the bags themselves are degradable, a singleworker can quickly dispose of the bag with its grass or leaves together without emptying the bags.Elevated temperatures (as high as 160 degrees Fahrenheit) found in compost heaps will enhance thedegradation process (Wool, 1989).
An experimental large-scale composting program is currently underway in Urbana, Illinois. The YardWaste Reclamation Project uses biodegradable U-Bags containing 6 percent cornstarch, which arecollected curbside and composted (Fletcher, 1990).
6 ;
79

Types of Degradation
There are essentially four mechanisms by which plastics can degrade (Wool, 1989):
A. Microbial DegradationBacterial and fungi attack the plastic either in the presence of air (aerobic) or in the absence of air(anaerobic). There are several factors that will affect how quickly the plastic degrades (rate ofdegradation):
1. temperature2. oxygen3. moisture4. number of microbes present
B. Macro-Organism DegradationLarger organisms such as insects and invertebrates consume the plastic as food. Examples includecrickets, worms, snails, slugs, and other organisms in the soil.
C. Photodegr, adation
The plastic absorbs ultraviolet (UV) radiation from the sun, which causes a breakdown of the largemolecules in plastics.
D. Chemical DegradationCertain chemicals added into the structures of plastics during the manufacture promote reactions thatcause the breakdown of the plastics molecules.
NOTE:It is important to note that a number of other environmental factors will further contribute to any of theabove mechanisms of degradation: wind, rain, ice, heat, abrasion, etc., could speed up the process.
81

Biodegradation
The first two mechanisms described on page 81 can be grouped together as "biodegradation." Ordinaryplastics have been developed to be resistant to break down by microorganisms; this stability is primarilydue to two factors (Guillet, Haskins, Spencer, year unknown):
1. The low surface area and the difficulty of other substances penetrating and passing through("impermeability") of plastic films and molded objects.
2. The extremely large size of the molecules (high "molecular weight') in the plastic materials.
It seems that when the microorganisms attack a substance, they tend to attack the ends of the molecules.If a substance is made up of small molecules, a greater number of molecules are present in a given amountof the substance than there would be in the same amount of a substance made up of large molecules.Therefore, in a substances with small molecules, there are more ends to be attacked than in a substancemade up of large molecules. Plastics are made up of extremely large molecules, and therefore, there arevery few ends that can be attacked. This makes it difficult for the microorganisms to break down theplastics.
If plastics are to be made degradable, somehow more ends of molecules need to be made available tothe microorganisms. This can be done by breaking the plastics down into very small particles with amuch 'larger surface area. It can also be done by making the molecules within the particles much smaller(reducing their "molecular weight").
The process is much like eating spaghetti. Assume that you can only devour it by finding the end ofa piece and slurping it up. If you have a large bowl of spaghetti with very long pieces, it will be difficultto eat:
But if you cut the long pieces into shorter chunks, then there are more ends exposed and it will be easierto eatmore like eating macaroni.
683
Remember, in biodegradation, the plastics are broken down when living organismseither very smallones (like bacteria or fungi) or larger ones (like crickets, bugs, snails)consume the plastics as food;but the molecules are long, and not easily broken down. However, microrganisms can easily break downa substance such as cornstarch and use it as a food source. Cornstarch can be incorporated into the longplastics molecules. When this is done, the organisms can devour the starch and thus break down theplastic molecules into many smaller molecules. These can then be degraded, since more "ends" areexposed.
Consumption by insects can be a much faster way of eliminating litter than by other methods (on theorder of days rather than months or years). In order for this to happen in plastic films (polyethylene),the films must contain about 20 percent starch; they are then considered to be "food" by many insectsand will be completely ingested (Wool, 1989). Wool also claims that insects will not only consume theseplastics as open litter but will also cause breakdown of these plastics at solid waste sites.
For polyethylene film that has been buried, the time for degradation depends on the percentage of starchin the molecules (Sudol and Zach, 1988):
% Starch Time for Degradation15% six months6% three to five years
There are several potential advantages and disadvantages to the use of cornstarch as an additive in poly-ethylene:
A. Advantages
In addition to the advantage of improving the biodegradability of plastics, the use of cornstarch couldreduce corn surpluses, raise farm income, and reduce government subsidies ($12 billion a year for corn).It would also lower oil import bills since plastics come from petroleum.
B. DisadvantagesResearchers at Rutgers University argue that there are several potential problems with degradableplastics. Are the conditions in a landfill, where much will be dumped, going to cause rapid degrada-tion? Are there studies that have been done under landfill conditions? Do we know what the productsof degradation are? If these products are just shorter pieces of plastic, will these cause an even greaterthreat to the environment (that is, more mobile and leachable) (Renfree and Forster, 1989; Warren,1989)?
Keep America Beautiful, Inc., also raises concerns about degradation in landfills (Keep AmericaBeautiful, no date). It claims that "research shows that a 65% moisture level is necessary for a significantrate of biodegradation to occur." However, apparently there is only 25 percent to 30 percent moisturein the solid waste that typically enters landfills. And landfills are purposely kept dry to prevent surfacewater from leaking through and contaminating the aquifer.
Other concerns relate to possible opposing directions for the use of degradable plastics and recyclableplastics. Recyclers want a rigid container product to be recycled into durable construction products.Cornstarch impregnation may just be an impurity that weakens the recycled product (Renfree, Forster,1989; Warner, 1989). Wool however argues that up to a ratio of 30 percent degradable plastics mixedwith 20 percent normal plastics will still make a product without a significant change in durability(Wool, 1989).
Sonic argue that the plastic bags and films containing cornstarch are less durable, not as strong, and areconsiderably more expensive than the traditional plastic bag (Keep America Beautiful, no date).
84
7
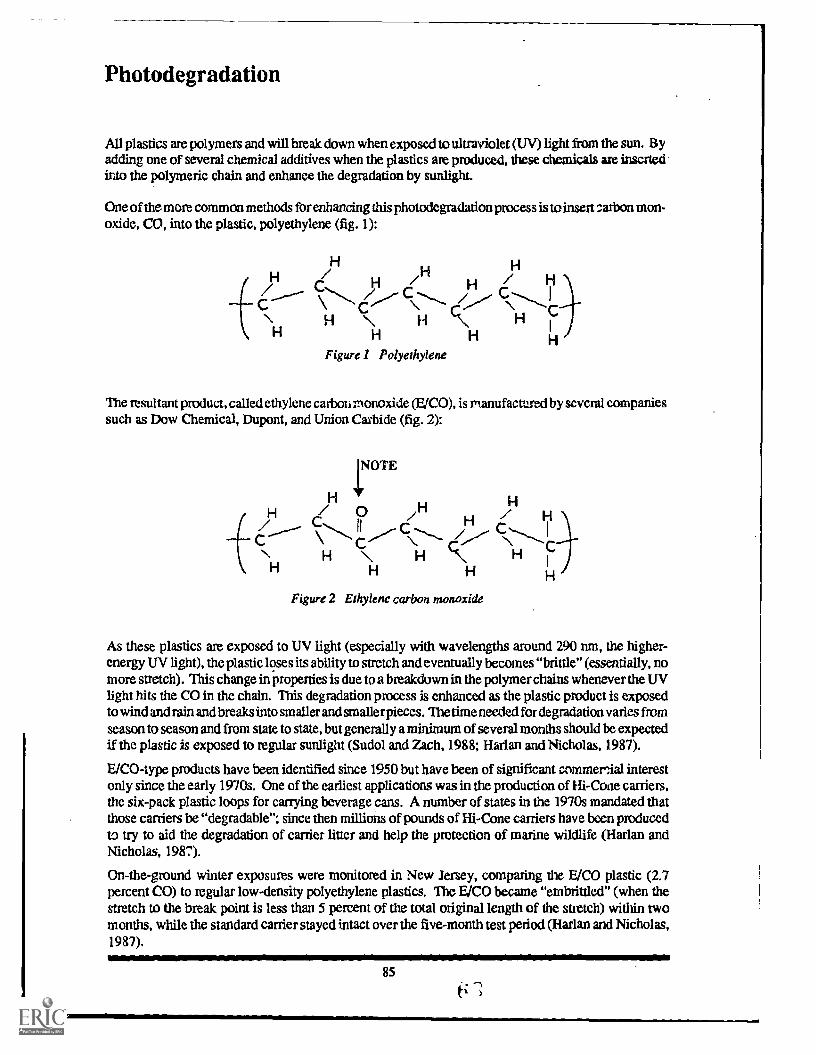
Photodegradation
All plastics are polymers and will break down when exposed to ultraviolet (UV) light from the sun. Byadding one of several chemical additives when the plastics are produced, these chemicals are insertedinto the polymeric chain and enhance the degradation by sunlight_
One of the more common methods for enhancing this photodegradation process is to insert carbon mon-oxide, CO, into the plastic, polyethylene (fig. 1):
H
/ C H H\/HC
CH H
HFigure 1 Polyethylene
The resultant product, called ethylene carbon monoxide (E/CO), is manufactured by several companiessuch as Dow Chemical, Dupont, and Union Carbide (fig. 2):
NOTE
H 0
H \C
H
\H C\H
Figure 2 Ethylene carbon monoxide
H j\H
As these plastics are exposed to UV light (especially with wavelengths around 290 rim, the higher-energy UV light), the plastic loses its ability to stretch and eventually becomes "brittle" (essentially, nomore stretch). This change in properties is due to a breakdown in the polymer chains whenever the UVlight hits the CO in the chain. This degradation process is enhanced as the plastic product is exposedto wind and rain and breaks into smaller and smaller pieces. The time needed for degradation varies fromseason to season and from state to state, but generally a minimum of several months should be expectedif the plastic is exposed to regular sunlight (Sudol and Zach, 1988; Harlan and Nicholas, 1987).
E/CO-type products have been identified since 1950 but have been of significant commerial interestonly since the early 1970s. One of the earliest applications was in the production of Hi-Cone carriers,the six-pack plastic loops for carrying beverage cans. A number of states in the 1970s mandated thatthose carriers be "degradable"; since then millions of pounds of Hi-Cone carriers have been producedto try to aid the degradation of carrier litter and help the protection of marine wildlife (Harlan andNicholas, 1987).
On-the-ground winter exposures were monitored in New Jersey, comparing the E/CO plastic (2.7percent CO) to regular low-density polyethylene plastics. The E/CO became "embrittled" (when thestretch to the break point is less than 5 percent of the total original length of the stretch) within twomonths, while the standard carrier stayed intact over the five-month test period (Harlan and Nicholas,1987).wrorrsmrmoowrmsoomromoimoosrmrmoiomooro.rrmoomoorg.rr
85
6
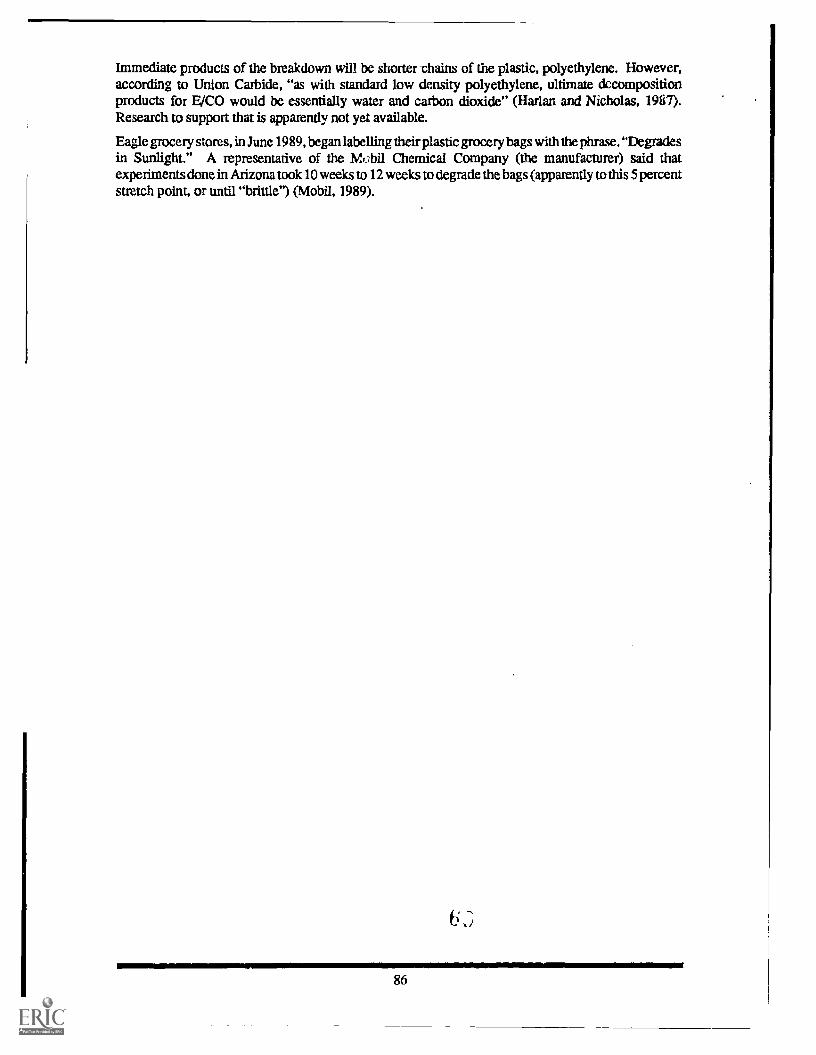
Immediate products of the breakdown will be shorter chains of the plastic, polyethylene. However,according to Union Carbide, "as with standard low density polyethylene, ultimate decompositionproducts for E/CO would be essentially water and carbon dioxide" (Harlan and Nicholas, 1987).Research to support that is apparently not yet available.
Eagle grocery stores, in June 1989, began labelling their plastic grocery bags with the phrase, "Degradesin Sunlight." A representative of the Mobil Chemical Company (the manufacturer) said thatexperiments done in Arizona took 10 weeks to 12 weeks to degrade the bags (apparently to this 5 percentstretch point, or until "brittle") (Mobil, 1989).
86

Examples of Independent Research Projects
COMPARISON OF GROCERY BAGS: PHOTODEGRADABLE VS. NORMALSeveral grocery store chains are now using photodegradable polyethylene grocery bags. For example,In the summer of 1989, Eagle stores started using bags that made the claim, "Degrades in Sunlight."
Students can design a project to test that claim by placing several photodegradable grocery bags (PGBs)and several normal grocery bags (NGBs) in the sunlight for a period of months and periodically doingseveral degradation tests on each type of bag. (These tests are described on pages 93-96.)
There are a few general guidelines to keep in mind for any of these experiments. Make every effort tobe sure that every part of the bag is equally exposed to the conditions. For example, if the bag exposedto the sun, rotate it at regular intervals to allow both sides to have equal exposure to the sun. Cut thebag so that it is only one sheet thick, this allows both skies to be exposed to weather, soil, or water. Donot use the whole bag since the interior surfaces are then unexposed. If possible, leave one samplecompletely undisturbed throughout the process; then do one final test at the end. This is true especiallyfor buried samples; digging up for testing alters the conditions in the soil.
1. Exposure to SunlightSeveral techniques have been used to expose the bags to sunlight. Fust choose an area with as muchsun exposure as possible.
a. Hanging on clotheslineUse several clothespins to fasten the bags to the line. Good exposure to sunlight is assured and niceagitation from the wind will hasten the degradation process. In order to minimize the amount ofwinding around the line, it is good to weight the bag down somehow (rocks or bolts in the bag workwell). Strong winds will still wind the bag around the line, so regular (at least daily) unraveling isnecessary in order to maximize the exposure to the sunlight.
b. At a Rigid 45-Degree AngleResearchers in the field of plastics degradation place the plastic bags at a 45-degree angle to the sun,facing south. This is in accordance with the ASTM (American Society for Testing and Materials)Standard Practice for Outdoor Weathering of Plastics. Students can design a simple wooden framefrom any one of a variety of thin wooden sticks.
7/South
The grocery bag is attached with metal tacks or staples to keep it in place. This design is of coursenot very close to the type of exposure real grocery bags would get if discarded into the environment,but it does allow for a nice comparison of PGBs with NGBs under the same conditions to see whichones really do degrade more rapidly.
Sample strips must be taken from evenly spaced locations in order to prevent a big hole being cut inthe bag and thereby loosening the bag from its frame. (NOTE: Florida State Legislature simplysuggests mounting on a plywood board.)
wow Irmsmerriar87 P-,
t)BES1' AV'T

c. Free-Moving, Caged ContainerCAUTION: This test seems to give the most erratic data because of the random motion.
In order to more closely approximate the random motion of litter, a wooden cage with wire mesh canbe used to contain the bags. They will blow around or lie in a pile, so the motion is random andtherefore adds an additional variable into the experiment. But this procedure does approximate muchmore closely the condition of the real world of the littered bag.
Periodic pictures of the arrangement of the bags in the cage will make this experiment moreinformative.
d. Natural Conditions of Bag ReuseEnvironmentally concerned people are making an effort to reuse materials as much as possible. Arethere some natural ways of reusing photodegradable grocery bags that would enhance their exposureto sunlight? Have students devise their own conditions and test them out.
Some suggestions:1. Use the bags as "beach bags" for a period of months and monitor the degradation.2. Store them in the back seat of your car (in the heat and sunlight) and reuse them to buy groceries;
then monitor the degradation.3. Normal kitchen fluorescent lights emit some UV radiation. Leave several bags exposed to kitchen
lights for several months and monitor the degradation.
2. Other Conditions for DegradationIn addition to considering the effect of exposure to sunlight, students need to think about other placeswhere the bags will be discarded. Two of the more likely places are in waterways or buried in a landfill.Students might also design experiments using both POBs and NGBs that try to approximate theseconditions.
a In WaterwaysStudents might place bags in a river, stream, lake or pond and make regular tests on the exposed bags.Or students might simply use pans of water and immerse both bags in this water exposed to sunlight.This alters the conditions from those in air in several ways; less exposed 02, some filtering of thesunlight, less agitation from the wind, and exposure to additional components in the waterways.
b. In LandfillsRealistically, this is where most of these bags will be disposed. Students can bury several bags (singlesheets, not whole bags) in their lawns or gardens, making sure to use the same soil depth and samesoil type. Ideally, students should bury one sheetfor each sampling of the bags for degradation tests;digging up and reburying will probably disturb the growth of microorganisms on the buried bags andcause greater deviation from "reality."
3. Frequency of Degradation TestsStudents can select one of the degradation tests, described on pages 93-96, to use on their bags. Thestretch test is probably the best test; it is most easily administered, allows for multiple trials, and givesreasonable reproducibility.
Students should make initial tests on both types of bags (8-10 trials) and then sample every 10 days to14 days for at least two months. (Three months is even better.)
NOTE: Florida State Legislative: "Plastic bags must degrade within 120 days, effective January 1,1990."
88

Students can average their eight trials each time or somehow try to indicate range or uncertainty. Onesimple way to indicate this variation in the stretch is to record the average deviation from the calculatedmean. For example: using the sample data from Part IX:
Trial Length of Stretch Deviation From the Mean1. 30 cm 2 cm2. 25 cm 3 cm3. 18 cm 10 cm4. 23 cm 5 cm5. 44 cm 16 cm6. 29 cm 1 cm
Mean: 28 cm Ave. Dev.: 6 cm
RESULT: 28 cm 6 cm
NOTE: It may be wise, based on the wide range of variation that occurs, to eliminate the highest andlowest values before averaging.
4. Degradation vs. Disintegration
There are no clearly stated definitions for what is meant by "degradable." Most researchers are usingthe "Brittle Point" standard: When the polyethylene stretches to no more than 5 percent beyond itsoriginal length, it is considered"degraded." This can occur in as little as two months of Illinois summersun, with optimal exposure.
Most students, however, look at the finished product and respond, "That bag's not degraded; I can stillsee it!" In other words, they're equating degradation to disintegration (the point where the bag is tornup into such little pieces that it is no longer visible).
If students want to carry their experimentation through to that extent of disintegration, additional testswill have to be devised. One method would simply be a visual record of the size of the pieces remainingusing photographs.
AN ANALYSIS OF THE EFFECT OF VARYING OUTDOOR CONDITIONS ON THEDEGRADATION OF PHOTODEGRADABLE GROCERY BAGSThis project is just a variation of Project A (page 15). Instead of comparing two types of bags underone or two different conditions, students would instead take one type of photodegradable plastic bag andchoose three or four of the conditions described in Part A. For example:
1. Sunlight - Free Movement in Wind (handing on clothesline)2. Sunlight - Rigidly Fastened (on wooden frame)3. In Waterway4. In Landfill5. Free-Moving (in cage)
7 -1
89

COMPARISON OF PHOTODEGRADABLE FISHBAIT LIDS TO NORMALBAIT LIDSEnvironmer Enterprises is now manufacturing a vented lid for plastic bait packages used by dealers offishing baits. The lids, to be marketed by Fabri-Kal Corporation of Michigan, are made with ECOLYTEdegradable polystyrene, which is "a polymer with special molecules sensitive to ultraviolet light." Youcan obtain current information concerning this material by writing to: Fabri-Kal Corporation (seemailing list on page 69).
Degradation will occur "only in direct sunlight, not in artificial indoor Lght." Sunlight caus theplastic "to eventually disintegrate into an inert material resembling sand." The lids are particularlydesigned to help alleviate this unique litter problem.
"The degradable bait lid will help ease litter problems when the lids are blown out of a boat, carelesslydiscarded or accidentally left on a lake shore," says Robert Kettridge, president of Fabri-Kal.
Alan Coxhead, sales development manager, emphasized that the ECOLYTE products are bothdegradable and recyclable. For student testing, if outdoor sunlight is used, he suggested it be combinedwith the effects of wind and rain. Additional samples for testing are available from him.
1. Conditions for TestingStudents would probably want to test Photodegradable Bait Lids (PBLs) compared to Normal Bait Lids(NBLs). Samples of each could be placed in the sunlight immersed in water, and/or placed on a lakeshore where they would be exposed to water. Bait lids could be rigidly fastened down, placed in a cageto allow more agitation by wind in rain, or left dangling on a string or wire attached to the ground.Suggested degradation tests would be the Maria Bend Test or the Todd Poke Test.
Another monitoring technique to either supplement or replace the two degradation tests would beweekly photographs of the bait lids until complete disintegration occurred.
2. Frequency of Sampling; Length of ExposureA minimum of three months' exposure (four months are better) is required. Sampling should occur everytwo weeks or so; that frequency requires a minimum of four bait lids of each type exposed to the elementssince whole lids are needed for the degradation tests. Duplicate trials would require eight lids of eachtype.
NOTE: Florida State Legislature: "Polystyrene foam must degrade within one year."
90

COMPARISON OF PHOTODEGRADABLE SIX-PACK RINGS TO NORMALSIX-PACK RINGS
Illinois Tool Works (ITW) manufactures a photodegradable "Hi-Cone ECO" plastic six-pack ring thatis used to hold a variety of six-pack canned beverages. ITW also manufactures a non-photodegradablering, using a diamond symbol to identify the photodegradable rings.
Between August 1985 and March 1986, the state of Oregon did a series of tests at nine different outdoorlocations to see if these photodegradable six-pack rings (PSPRs) decompose within the 120-day (four-month) deadline of the Oregon State Legislature.
When the PSPRs reach "maximum brittleness," they tend to crack and break into small pieces when"subjected to sufficient environmental action" such as the blowing wind. The Oregon study concludedthat "the Hi-Cone ECO material generally attains maximum brittleness in about 40 days in Oregonduring the middle of the summer," but takes as long as 200 days (6-7 months) during periods of weakestsunlight in the fall and winter.
1. Their DesignEight PSPRs were placed in sunny locations at each of the nine stations. The rings were containedon the top and sides by wire cages that were about one foot high and three feet square. This allowedthe rings to blow around and simulate the wind action of the natural environment.
At the end of each month, experimenters removed two rings from the cages, photographed them, andtested for brittleness by three methods:
a. The Stretch Testb. The Crumple Testc. The Bend Test
(All are described in Part IX.)
2. Our Design
Students could attempt to replicate the Oregon study under the conditions of Illinois weather. Onemodification would be to test samples every two weeks rather than every month.
Other Projects Dealing With Degradation Variables
Comparison of ecolyte photodegradable styrofoam food containers to normal styrofoam containers 0percent, 5 percent, 10 percent: sunlight and landfill.
Comparison of photodegradable garbage bags to normal garbage bags: brief sunlight exposure pluslandfill vs. just landfill.
Comparison of biodegradable lawn waste bags (U-Bags) to normal lawn waste bags: compost pile vs.landfill.
Comparison of biodegradable book bags to normal book bags: landfill
Comparison of insect degradation to either microbiol or environmental degradation: sunlight,waterways, or landfill.
Accelerated degradation techniques for photodegradable plastics: normal "black light" vs. water spray
91

Possible Degradation Tests
STRETCH TEST (For plastic bags and films such as Low Density Polyethylene - LDPE)
As polyethylene degrades, it becomes less and less elastic. Normal polyethylene will stretch to 400percent to 500 percent of its original length before breaking. As defined earlier, "brittle" plastic bagsare ones that stretch to 5 percent or less of their original length.
To do the test, cut a rectangular strip of plastic about 2 cm by 8 cm.
Be sure the cuts are smooth with no tears or cuts on the edges.
Grasp the plastic with your thumb and forefinger at both ends. Using a yardstick or meter stick, veryslowly stretch the plastic strip, watching for the length at which it breaks.
To calculate the percentage elongation, use the following equation:
% Elongation = ckiginaluagt x 100Original Length
Percentage elongation would decrease steadily as the polyethylene is exposed to various degradationconditions.
TIPS:
1. Do multiple tests each time (at least 8 to 10), then eliminate the highest and lowest values and takethe average of the remaining trials. There can be considerable variation. (See Sample Data below)
2. It may be helpful to cut a card 8 cm x 12 cm. Trace this on your plastic bag. Cut out the section. Thencut eight equal 8 cm x 2 cm pieces for your eight tests.
3. It may be good to have students begin with one bag. Have them break into groups of three or four.Then have them cut eight or nine strips per group and do the stretch test on each one. Tabulate thedata; compute a class average; notice the variation.
4. "Andy Grain Observation." Andy observed that plastic bags may have a different stre^h whenstretched "across the grain" of the plastic than when stretched "with the grain." Watch for that. Tryto take samples uniformly from the bag.
5. It doesn't matter whether your thumb and forefinger extend over the ends by a half an inch or sothe plastic will stretch underneath your fingers as well, so the total length can be used for yourcalculation.
6. Do all stretch tests under the same temperature conditions. We suggest taking the bags indoors, allowthem to come to room temperature, and then do the stretch tests.
7. A slow stretch is crucial. If you stretch the sample too quickly, it will break too soon. We recommendtiming the stretch; it should take at least 30 seconds from start to break. If the sample breaks before30 seconds, do the test again more slowly.
8. Record visual observations in a separate column each time the stretch test is done. Look for changesin color, texture, and flexibility, and also try to observe any evidence of breakdown such as holes ortears.
9. Some feel greater consistency is achieved by keeping one end of the sample rigid and stretching theother end.
93
Sample Data (from original photodegradable Eagle grocery bag)
Original Length: 8 cm
Length of Stretch (6 trials): 30 cm, 25 cm, 18 cm, 44 cm, 29 cm
Average: 28 cm
% Elongation 21E1 x 100 = 250% (ave.)8
(this kind of variation in six trials is typical student data)
STRENGTH TEST (a less refined modification of the stretch test)
Spread the plastic film over the opening of a large jar. Affix it with several rubber bands. While oneperson holds the plastic firmly (reinforcing the rubber bands), the other person slowly pours lead shotinto the center of the plastic film until the film breaks. The container of lead shot is weighed before andafter to determine how much lead the plastic holds at the point of breakage.
Again three to five trials are suggested. Other massive objects can be substituted for the lead shot, suchas coins, stones, nuts (as in nuts and bolts), etc. Some experimentation will be necessary to find a jarlarge enough to allow for enough metal to break the plastic films. Remember, plastic bags are designedto be strong; one strength test for a certain brand of grocery bag is to fill it with several six-packcontainers of pop.
This test is not as tried and true as the stretch test. It is good for the more creative and pioneering studentwho wants to perfect the method or add his/her own special twist to the design.
CRUMPLE TEST (for polystyrene, any rigid or semi-rigid plastic, or heavy LDPE)
This is a fai qualitative test that needs refinement. The object is simply crumpled in the hand, heldfor five seconds, and then released. The object is then timed to see how long it takes to return to itsoriginal form. Observations are also made on breaks, or crumbling into pieces; record number of breaksor number of pieces.
94

MARIA BEND TEST (for styrofoam or other rigid or semi-rigid plastics)
Simply place the piece of plastic on the edge of a bench or table, half on, half off. Using a protractorto measure the angle, slowly bend the plastic down until it breaks. (Caution: Safety glasses should beworn for this procedure.)
Measure Angle to Break
This test needs modification for some plastics. They will not break at a 90-degree angle. Using a thin,flat overhang, one can allow for a 180-degree bend.
Broader Angle
A third modification that has been used by some P.:-adents is to repeat the 180-degree bend over and overuntil breakage occurs. They then count the anber of repetitions needed for breakage.
Dr. Violet Jonas, who directed an Oregon study on plastic six-pack rings, has defined brittleness in termsof angle of bend as follows:
1. Maximum Brittleness: a six-pack ring that breaks upon being bent through an angle of less than 90degrees.
2. Near-maximum Brittleness: Breaks between 90 degrees and 135 degrees3. Substantial Brittleness: Breaks between 135 degrees and 180 degrees
95

TODD POKE TEST (for styrofoam or heavier films)
LEAD SHOT(added until nail
breaks completelythrough the plastic)
GLASS TUBING
NAIL(head is the samediameter as tubing)
PLASTIC
The diagram shows the procedure. Again the lead shot is weighed before and after to determine theweight of lead supported at the point of breakage.
ERIC TRANSPARENCE TEST (for films and bags)This test needs some refining but has potential. Simply take a bright, concentrated source of light suchas a lamp, place the film or bag near it, and note the degree of transparency. Only qualitative data areavailable from this test unless you use a light meter.
TUMBLE TEST (being investigated)
STANDARDIZED TESTS AND FACILITIESTests on various physical properties are done by researchers and industry to monitor plastic degradation.Such tests include elongation, tensile strength, molecular weight, impact strength, tear resistance,friability (tumble test) and flex test. Three companies that will do standardized "outdoor weathering"for comparison to your own tests are the following:
Suggested Testing Facilities
South Florida Test Services9200 Northwest 58th StreetMiami, Florida 33178Mr. Steve Lane(305) 592-3170
Eco Plastics518 Gordon Baker RoadWillowdale, Ontario M2H 3B4Canada(416) 499-3060
Subtropical Testing8290 Southwest 120 StreetMiami, Florida 33156Mr. M. Mailman(305) 233-5341
96

REFERENCES
1. Blunck, Susan M. From global to local: The pressing plastic problem, Chautauqua Notes, ScienceEducation Center, University of Iowa. Vol. 4, #4; Jan/Feb,1989; p. 5.
2. Plastic reaps a grim harvest in the oceans of the world. Smithsonian. 1988, pp. 59-66.
3. Sudol, F. J. and A. L. Zach. "Plasticscan they be made degradable? Available free from NewarkDepartment of Engineering, 920 Broad St., Newark, NJ 07102, (1983) Telephone 201-733-8520.
4. An overview of degradable plastics. Proceedings of Symposium on Degradable Plastics, Societyof the Plastics Industry, Inc., Washington, D.C, June 10, 1987; pp. 6-12.
5. Special advertising section sponsored by the Council for Solid Waste Solutions (a program of TheSociety of the Plastics Industry, Inc.), rime, July 17, 1989.
6. Solid waste concerns spur plastic recycling efforts. Chemical and Engineering News, Vol. 67, Jan.30, 1989, p. 7.
7. Wool, Richard. Perspectives on degradable plastics. Proceedings on the Symposium on Corn-Based Degradable Plastics, Des Moines, Iowa, Jan. 9, 1989.
8. Harlan, G. M. and A. Nicholas. Degradable ethylene-carbon monoxide copolymer. Proceedings ofSymposium on Degradable Plastics, The Society of the Plastics Industry Inc., Washington, D.C.June 10, 1987.
9. Redpath, A. E. EcoPlastics Limited, Willowdale, Ontario, Canada. Personal communication.March 28, 1990.
10. Fletcher, Rod. Coordinator of U-Cycle Program, Urbana, IL. Personal communication, March 29,1990.
11. Guillet, J. E., M. Haskin, and L. R. Spencer. Studies of the biodegradability of photodegradedplastic compositions. University of Toronto, Ontario, Canada. No date given.
12. Renfree, R. and R. Forster. Center for Plastics Recycling Research, Rutgers University, New Jersey.Personal communications, June 1989.
13. Warren, T. Office of Recycling and Waste Reduction, Illinois Department of Energy and NaturalResources, Springfield, IL. Personal communication, June 1989.
14. Wool, R. Degradable Plastics Laboratory, University of Illinois, Urbana, IL. Personal communi-cations, June 1989.
15. Keep America Beautiful, Inc. Overview: solid waste disposal alternatives. No date given.
16. Mobil Chemical Company, phone call to number given by Eagle degradable grocery bag (800 -476-4300), June 1989.
97

Evaluation
Your comments can help us to improve the quality of our educational materials.
Please fill out and return this form. Thank you!
1. Title of curriculum unit evaluated
2. User's Name
3. Work Address
city state
phone ( )
4. Materials were used with: Grade Level
Other
5. In which areas of study were you able to use these materials?
Science Social Stitches Language Arts
Other
6. Number of students who used the materials
7. Would you teach this unit again? Please comment.
8. Did you encounter any problems using these materials? Please comment.
9. Do you have any suggestions for additions to this unit? Please comment.
10. How did you find out about these materials?
11. Other comments
Please return to:Kathy EngelsonOffice of Recycling and Waste ReductionIllinois Department of Energy and Natural Resources325 West Adams Street, Room 300Springfield, Illinois 62704-1892