Embed Size (px)
DESCRIPTION
Principles of Economics-DBM1313 Chapter 4: Market Equilibrium. Definition of Market Equilibrium : Market equilibrium is the condition when demand equals to supply (D=S). - PowerPoint PPT Presentation
Citation preview
ALL RIGHTS RESERVEDNo part of this document may be reproduced without written approval from Limkokwing University of Creative Technology
1-1
Principles of Economics-DBM1313
Chapter 4:
Market Equilibrium
ALL RIGHTS RESERVEDNo part of this document may be reproduced without written approval from Limkokwing University of Creative Technology
1-2
Definition of Market Equilibrium :
•Market equilibrium is the condition when demand equals to supply (D=S).
•Equilibrium also referred to as market clearing. It occurs at any price and quantity where the quantity demanded is equal to the quantity supplied. The price at which the quantity demanded equal to quantity supplied is known as equilibrium price.
ALL RIGHTS RESERVEDNo part of this document may be reproduced without written approval from Limkokwing University of Creative Technology
1-3
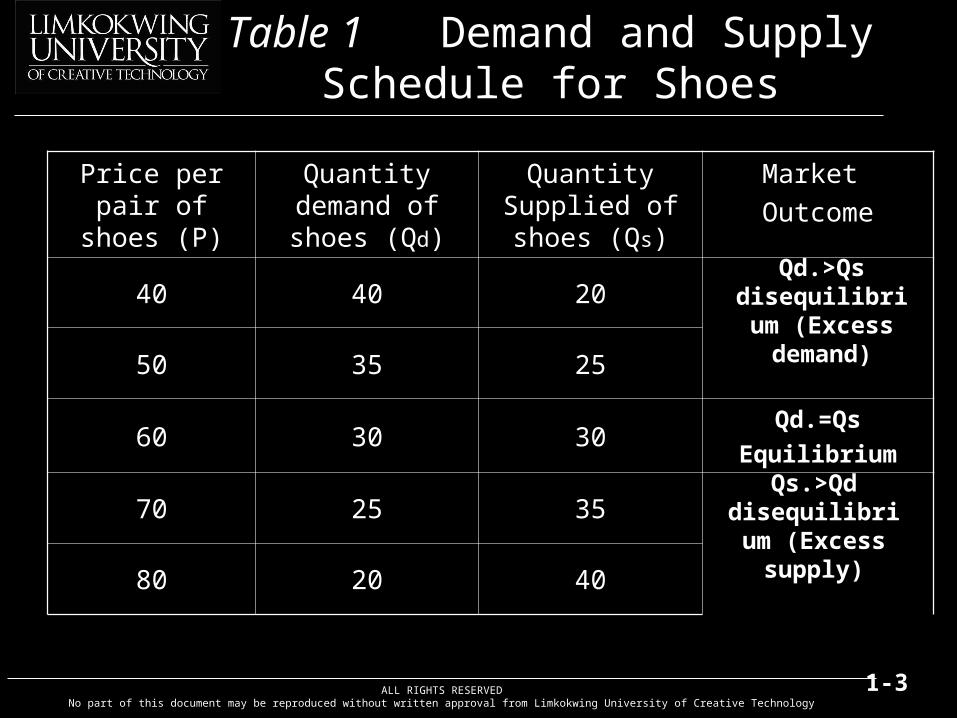
Price per pair of shoes (P)
Quantity demand of shoes (Qd)
Quantity Supplied of shoes (Qs)
Market
Outcome
40 40 20
50 35 25
60 30 30Qd.=Qs
Equilibrium
70 25 35
80 20 40
Qd.>Qs disequilibrium
(Excess demand)
Qs.>Qd disequilibrium (Excess supply)
Table 1 Demand and Supply Schedule for Shoes
ALL RIGHTS RESERVEDNo part of this document may be reproduced without written approval from Limkokwing University of Creative Technology
1-4
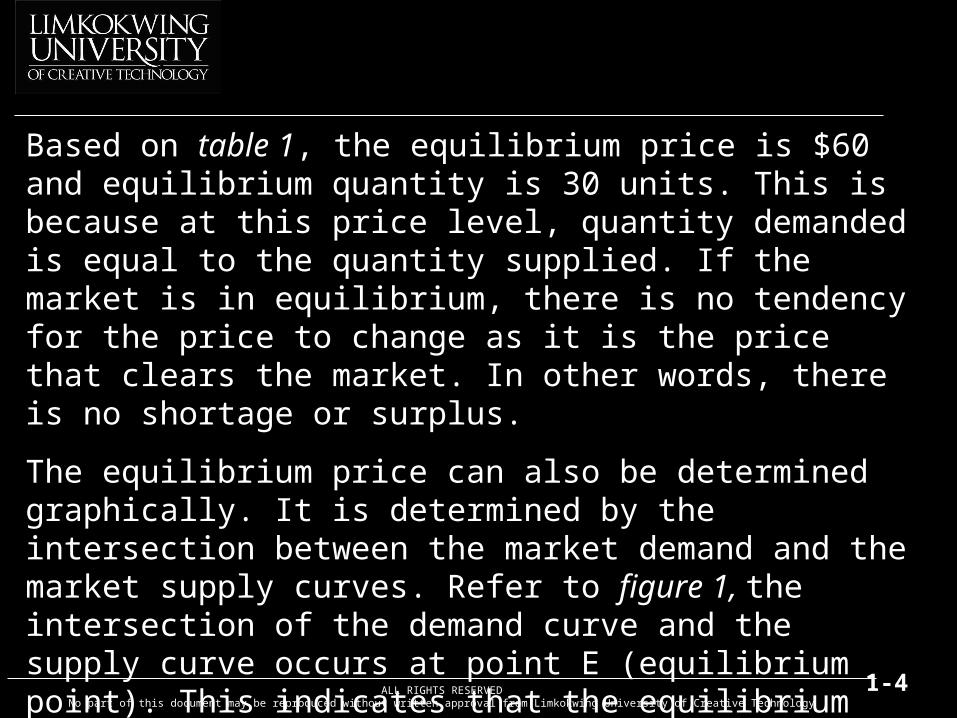
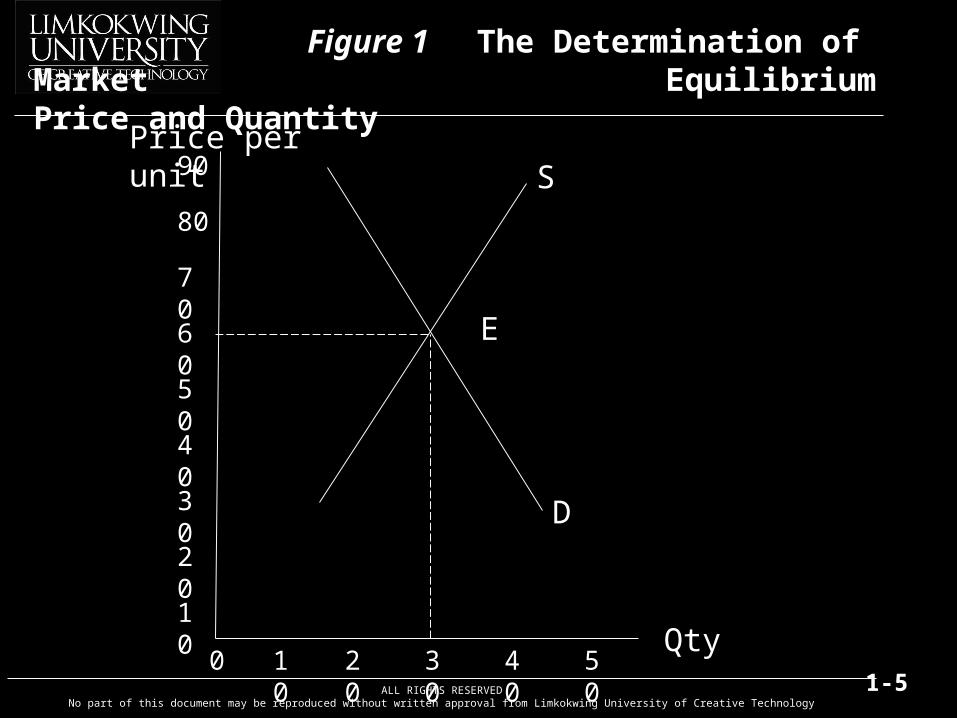
Based on table 1, the equilibrium price is $60 and equilibrium quantity is 30 units. This is because at this price level, quantity demanded is equal to the quantity supplied. If the market is in equilibrium, there is no tendency for the price to change as it is the price that clears the market. In other words, there is no shortage or surplus.
The equilibrium price can also be determined graphically. It is determined by the intersection between the market demand and the market supply curves. Refer to figure 1, the intersection of the demand curve and the supply curve occurs at point E (equilibrium point). This indicates that the equilibrium price is $60 and the equilibrium quantity is 30 pair of shoes.
ALL RIGHTS RESERVEDNo part of this document may be reproduced without written approval from Limkokwing University of Creative Technology
1-50 10 20 30 40 50
10
20
30
40
50
60
70
80
90 S
D
E
Price per unit
Qty
Figure 1 The Determination of Market Equilibrium Price and Quantity
ALL RIGHTS RESERVEDNo part of this document may be reproduced without written approval from Limkokwing University of Creative Technology
1-6
P2
P0
P1
Q2 Q0 Q1
E2
E0
E1
D2
D0
D1
Qty
Price per unit
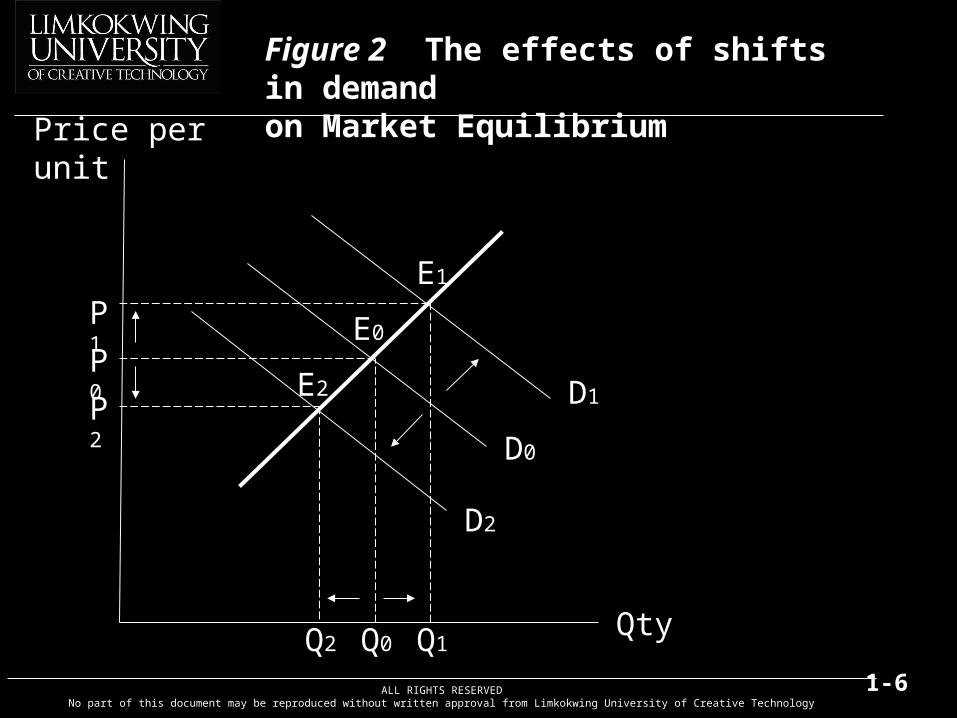
Figure 2 The effects of shifts in demand on Market Equilibrium
ALL RIGHTS RESERVEDNo part of this document may be reproduced without written approval from Limkokwing University of Creative Technology
1-7
Originally, equilibrium point is E0 where demand equals to supply. The equilibrium price and quantity are P0 and Q0 respectively. Now assume that there is a change in demand as a result of increase in consumers’ income. The demand curve will shift to the right from D0 to D1. The new equilibrium point is E1 will be achieved at the intersection point of a new demand curve (D1) and the supply curve (S0). Therefore, the new equilibrium price is P1 and the new equilibrium quantity is Q1
Similarly, a fall in demand will cause a leftward shift in the demand curve from D0 to D2. As a result, both equilibrium price and quantity will fall to P2 and Q2 respectively.
Effects of a change in demand, assuming supply is constant (refer to Figure 2)
ALL RIGHTS RESERVEDNo part of this document may be reproduced without written approval from Limkokwing University of Creative Technology
1-8
Note:
1. An increase in demand causes a rise in equilibrium price and quantity
2. A decrease in demand causes a fall in equilibrium price and quantity
ALL RIGHTS RESERVEDNo part of this document may be reproduced without written approval from Limkokwing University of Creative Technology
1-9
P1
P0
P2
Q2 Q0 Q1
S2
S0
S1
D0
E2
E0
E1
Qty
Price per unit
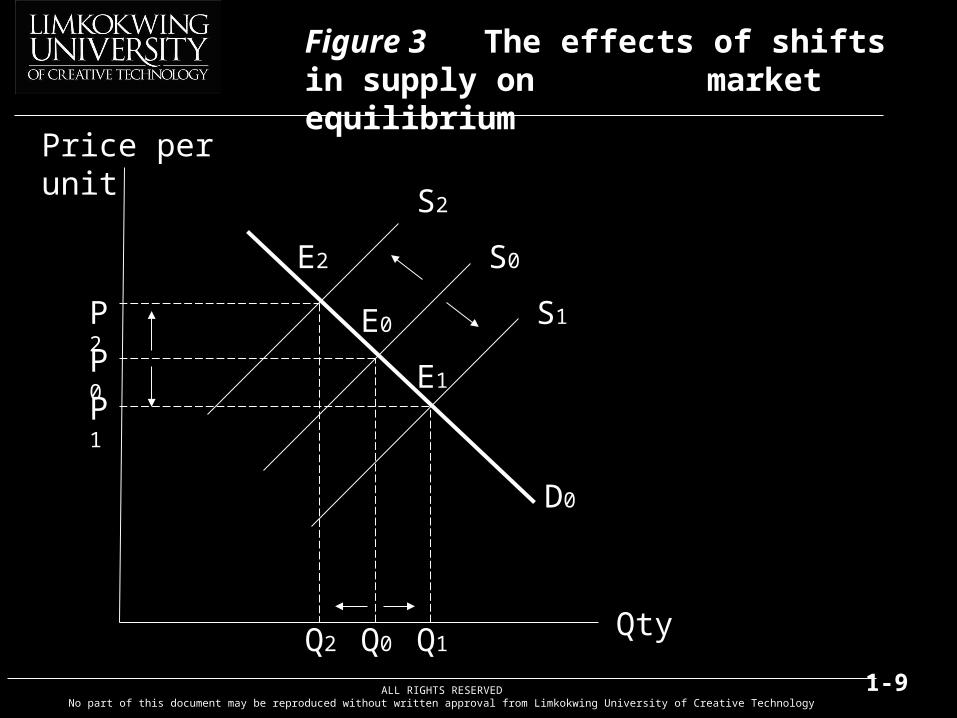
Figure 3 The effects of shifts in supply on market equilibrium
ALL RIGHTS RESERVEDNo part of this document may be reproduced without written approval from Limkokwing University of Creative Technology
1-10
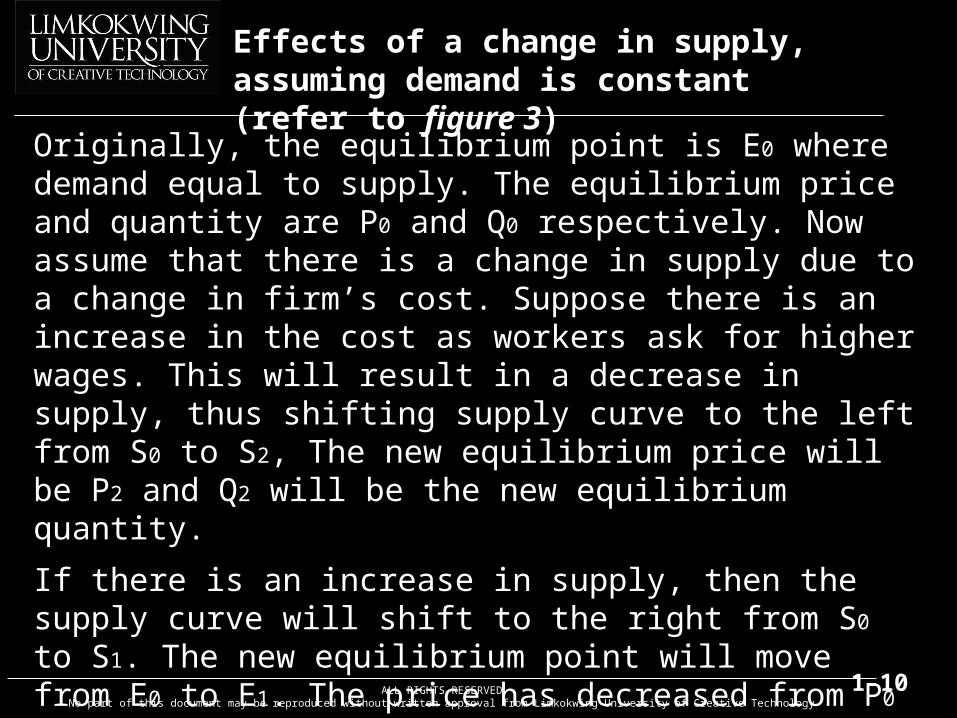
Originally, the equilibrium point is E0 where demand equal to supply. The equilibrium price and quantity are P0 and Q0 respectively. Now assume that there is a change in supply due to a change in firm’s cost. Suppose there is an increase in the cost as workers ask for higher wages. This will result in a decrease in supply, thus shifting supply curve to the left from S0 to S2, The new equilibrium price will be P2 and Q2 will be the new equilibrium quantity.
If there is an increase in supply, then the supply curve will shift to the right from S0 to S1. The new equilibrium point will move from E0 to E1. The price has decreased from P0 to P1 and the quantity has increased from Q0 to Q1
Effects of a change in supply, assuming demand is constant (refer to figure 3)
ALL RIGHTS RESERVEDNo part of this document may be reproduced without written approval from Limkokwing University of Creative Technology
1-11
Note:
1. An increase in supply will cause a fall in equilibrium price and a rise in quantity
2. A decrease in supply will cause a rise in equilibrium price and a fall in quantity
ALL RIGHTS RESERVEDNo part of this document may be reproduced without written approval from Limkokwing University of Creative Technology
1-12
P0
P1
Q0 Q1
D0
S1
S0
E1
E0
Qty
Price per unit
D1
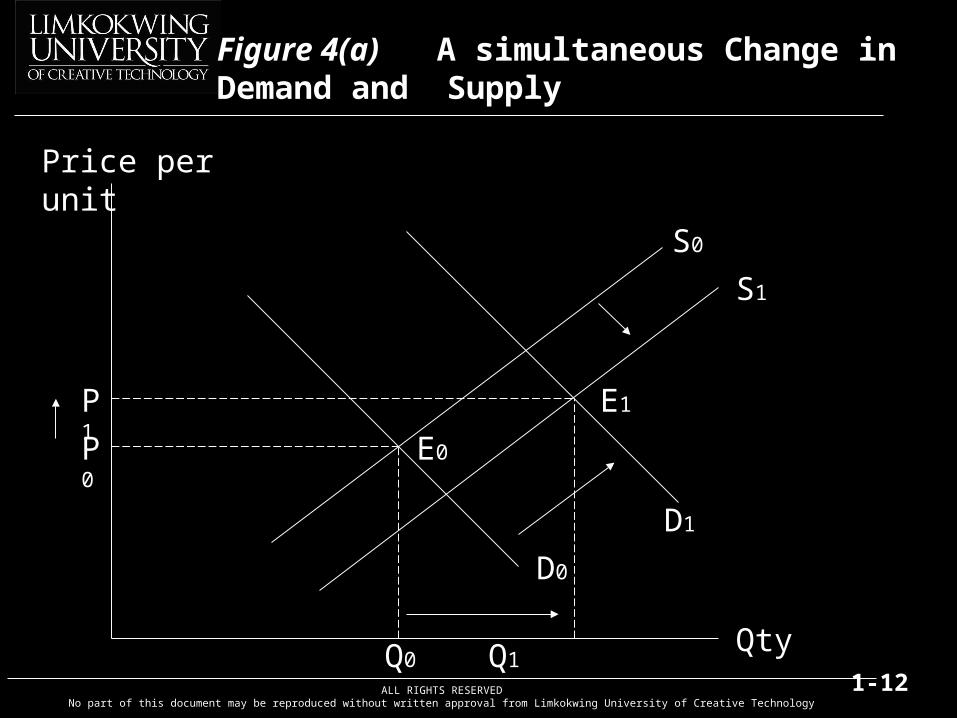
Figure 4(a) A simultaneous Change in Demand and Supply
ALL RIGHTS RESERVEDNo part of this document may be reproduced without written approval from Limkokwing University of Creative Technology
1-13
If demand and supply change at the same time, whether equilibrium price will increase, decrease or remain the same will depend on the relative increase (decrease) in demand and supply.
For example, demand for mandrin oranges increases during Chinese New Year and in order to meet this, the government increases the supply of oranges by importing oranges from China. Therefore, both the demandand supply curves for mandrin oranges will shift to the right. The equilibrium quantity will definitely increase but whether price will increase or not depends on the relative increase in demand and supply.
Simultaneous Change in Demand and Supply (refer to figure 4a)
ALL RIGHTS RESERVEDNo part of this document may be reproduced without written approval from Limkokwing University of Creative Technology
1-14
As shown in the figure 4, the demand curve will shift to the right from D0 to D1 and the supply curve will also shift to the right from S0 to S1. Even though the government will try to meet increase in demand, yet an increase in demand is greater relative to increase in supply. Consequently, price is still increase from P0 to P1 and quantity increase from Q0 to Q1
ALL RIGHTS RESERVEDNo part of this document may be reproduced without written approval from Limkokwing University of Creative Technology
1-15
P0
P1
Q0 Q1
D0
S1
S0
E1
E0
Qty
Price per unit
D1
Figure 4(b) A Simultaneous Change in Demand and Supply
ALL RIGHTS RESERVEDNo part of this document may be reproduced without written approval from Limkokwing University of Creative Technology
1-16
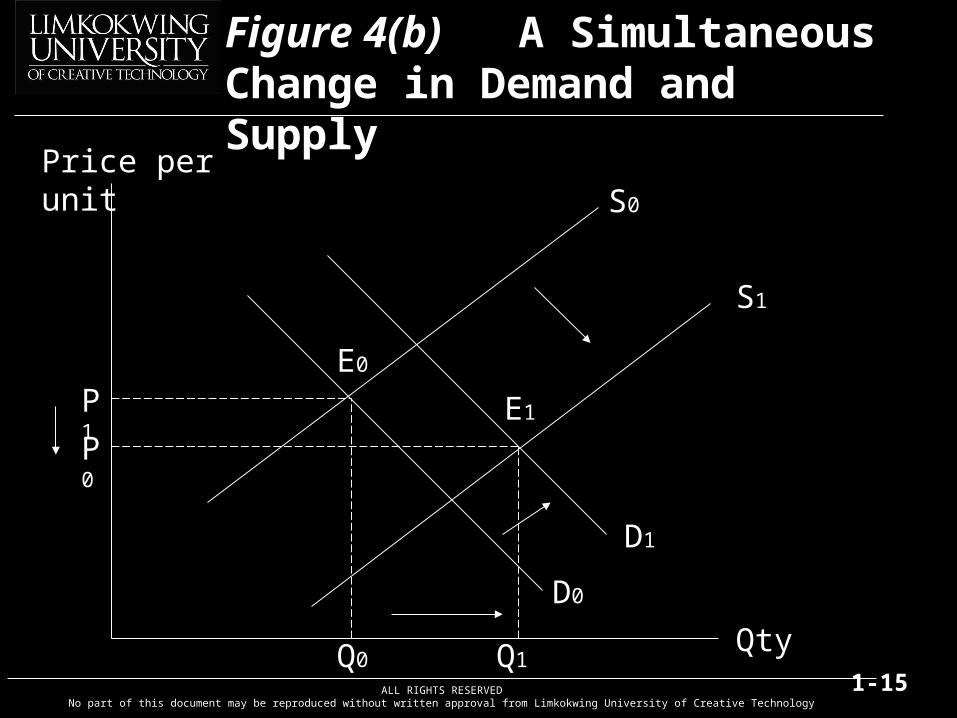
If increase in supply is greater relative to increase in demand result in lower price; i.e. price falls from P0 to P1 but quantity still increase from Q0 to Q1 (Figure 4b)
Note:
1. If increase in demand is greater relative to increase in supply, both price and quantity will increase
2. If increase in supply is greater relative to increase in demand, price will fall and quantity will increase
ALL RIGHTS RESERVEDNo part of this document may be reproduced without written approval from Limkokwing University of Creative Technology
1-17
Government InterventionPrice Control Act 1946 was legislated to give power for the government to control the price of goods and services. There are two types of price control; namely price ceiling and price floor.
Price Ceiling
Price ceiling also known as maximum price, that is set by the government below the market price. Any sales above this price is not allowed. The rationale for imposing price ceiling is to help consumers when price of goods and services are extremely high in the market.
Example of goods and services which prices are controlled by the government are the fare for public transport, chicken, low cost houses, rent control etc.
ALL RIGHTS RESERVEDNo part of this document may be reproduced without written approval from Limkokwing University of Creative Technology
1-18
Price per unit (‘000)
Qty
S
D
Ep=$45
PC=$30
Qs Eq Qd
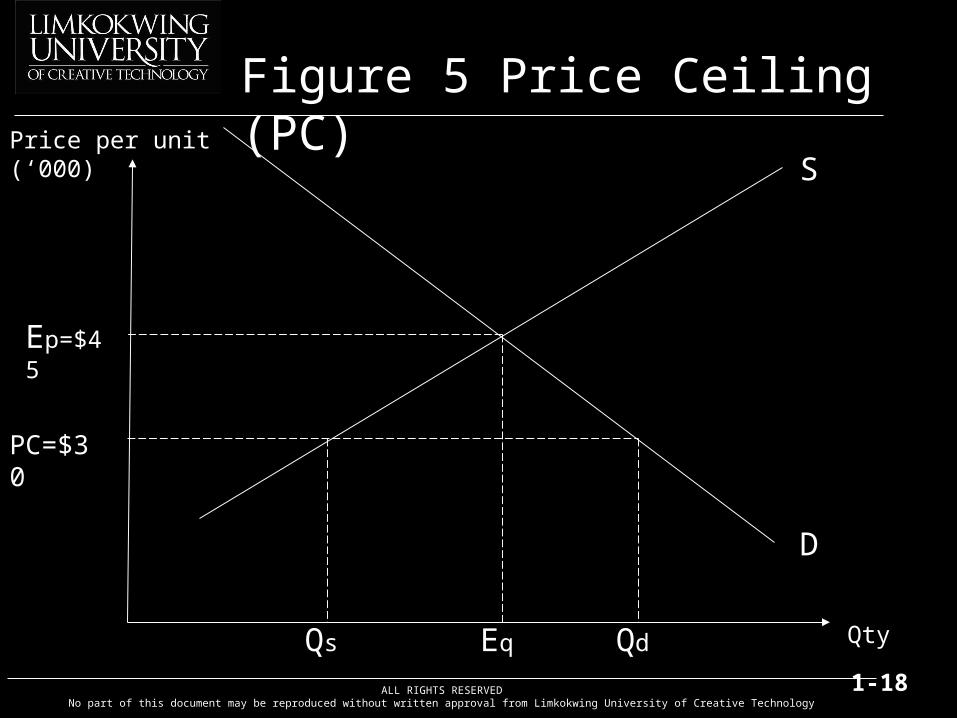
Figure 5 Price Ceiling (PC)
ALL RIGHTS RESERVEDNo part of this document may be reproduced without written approval from Limkokwing University of Creative Technology
1-19
In the absence of price control, equilibrium price for low cost houses would have been at the intersection of the demand and supply curve, with price $45,000. When the ceiling price is imposed by government, it held price down to $30,000 and make it illegal to sell at any price above price ceiling ($30,000). At this low price, demand for low for low cost houses is Qd, and supply is only Qs.
There is a shortage equal to horizontal distance between Qd – Qs.
This is because more of low cost houses will be demanded by consumers but less will be supplied at lower price. Thus maximum price can lead to excess demand of Qd – Qs..
ALL RIGHTS RESERVEDNo part of this document may be reproduced without written approval from Limkokwing University of Creative Technology
1-20
The imposition of maximum price will bring advantage to the consumers as they can obtain goods at lower price. Nevertheless, this price ceiling leads to the following problems:
1. Encourage the existence of black market – an illegal market in which goods are bought and sold outside normal channels of distribution at price above legal ceiling.
2. Discourage firms from investing in new productive facilities for expanding output – price ceiling limits profits in the controlled market.
3. Exploit consumers – consumers are asked to pay extra money (under table money) in order to get the goods that are scarce.
ALL RIGHTS RESERVEDNo part of this document may be reproduced without written approval from Limkokwing University of Creative Technology
1-21
Price Floor
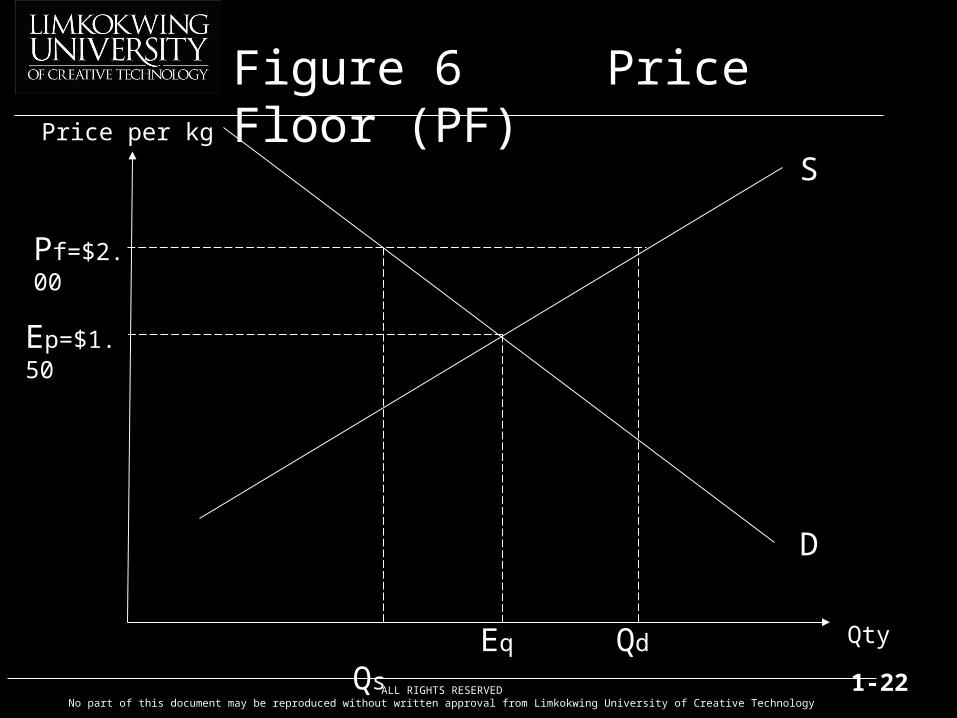
Price floor is also known as a minimum price, that is set by the government above market price. The government often regulates the price of agricultural commodities, such as paddy. The rationale for imposing price floor is that freely operating market does not ensure farmers a high enough price for their products. Thus, this minimum price enables sellers/producers to earn higher earnings and sustain a reasonable standard of living. The effect of this minimum price is shown in the figure 6.
ALL RIGHTS RESERVEDNo part of this document may be reproduced without written approval from Limkokwing University of Creative Technology
1-22
Price per kg
S
D
Ep=$1.50
Qs Eq Qd
Figure 6 Price Floor (PF)
Pf=$2.00
Qty
ALL RIGHTS RESERVEDNo part of this document may be reproduced without written approval from Limkokwing University of Creative Technology
1-23
If we allow the price to be determined by the market forces, the equilibrium price for paddy will be at $1.50 per kg.. Now we assume that the minimum price of $2.00 per kg of paddy is established. At that price, market supply of paddy is Qs but consumers demand only Qd. Thus price floor results in surplus of (Qs-Qd) kg paddy. Unless the surplus is some how eliminated, it will create downward pressure on the price of paddy. The disadvantages that may arise from the minimum price are as follows:
1. Exists surplus of goods (paddy)
2. government has to buy and store the surplus to avoid from it pushing prices down to the market clearing level. The government must store most of the surplus as it cannot give away the entire surplus that would reduce private demand and even bigger surplus. Therefore, storage and regulatory cost are incurred.
3. Unfair – consumers are forced to pay higher price.