Embed Size (px)
Citation preview
Principles of Economics
Class 1Introduction to Economics
State and MarketSupply and Demand
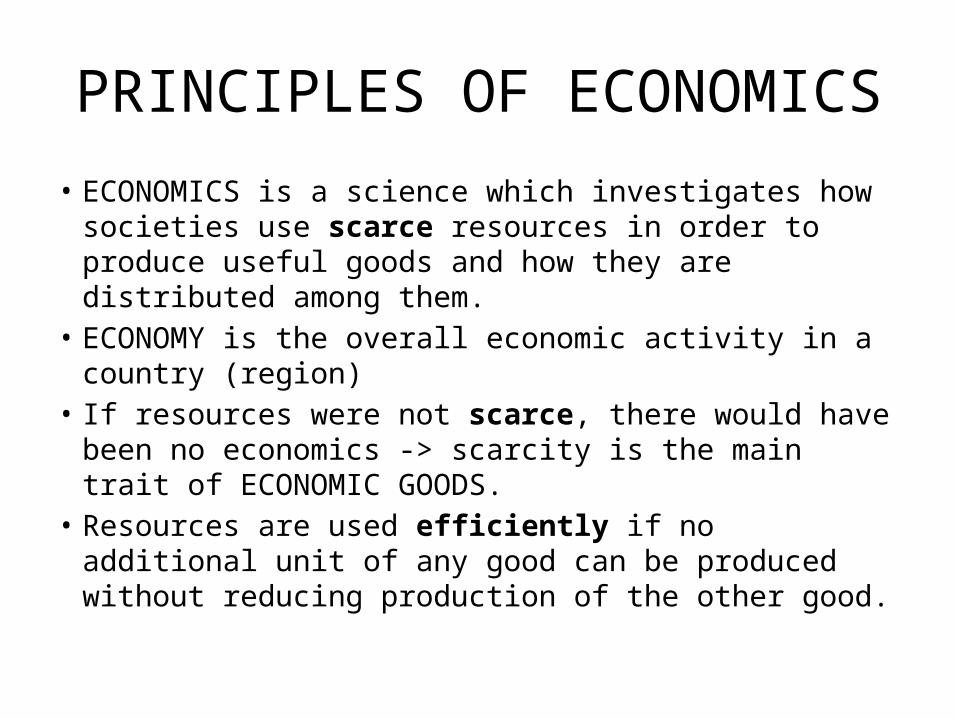
PRINCIPLES OF ECONOMICS
• ECONOMICS is a science which investigates how societies use scarce resources in order to produce useful goods and how they are distributed among them.
• ECONOMY is the overall economic activity in a country (region)
• If resources were not scarce, there would have been no economics -> scarcity is the main trait of ECONOMIC GOODS.
• Resources are used efficiently if no additional unit of any good can be produced without reducing production of the other good.
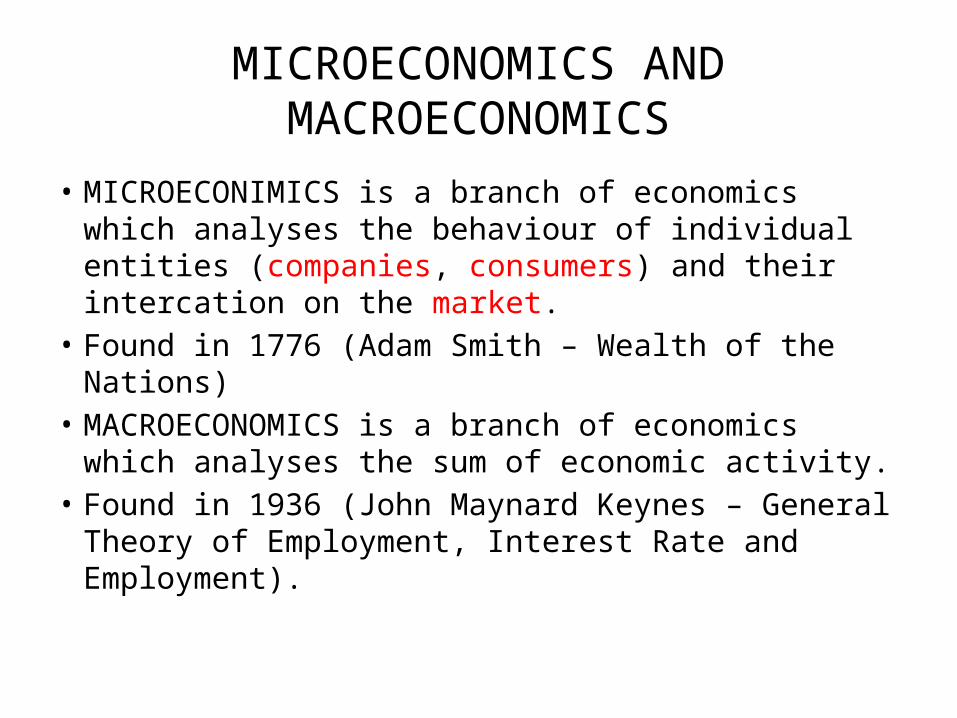
MICROECONOMICS AND MACROECONOMICS
• MICROECONIMICS is a branch of economics which analyses the behaviour of individual entities (companies, consumers) and their intercation on the market.
• Found in 1776 (Adam Smith – Wealth of the Nations)• MACROECONOMICS is a branch of economics which
analyses the sum of economic activity.• Found in 1936 (John Maynard Keynes – General Theory
of Employment, Interest Rate and Employment).
ECONOMY TYPES
• MARKET ECONOMY is an economy where conumers and producers freely set prices and quantities. It boosts efficiency, but fails to solve situations like monopoly and lacks justice.
• PLANNED ECONOMY is an economy where consumption and production is commanded by the state (e.g. communistic economies)
• MIXED ECONOMY is the most common type where majority of the market is self-regulated, but state interferres when it is needed to provide justice.
Positive vs. Normative economy
POSITIVE ECONOMY – description of economic phenomena – the answer provided by economic analysis
Example: Why housekeepers earn less than doctors?NORMATIVE ECONOMY –value or normative
judgments about economic fairness or what the outcome of the economy or goals of public policy ought to be – the answer provided by political discussion and political decisions.
Example: Should production of some arms and drugs be made illegal?
INPUTS AND PRODUCTS
INPUTS are the goods used in production of the other goods and services. Basic inputs are labour, capital, land.
PRODUCTS are useful goods and services that are either consumed or used for production of other goods.
The three basic economic questions
1. What goods and services should be produced? Those that bring producers the most profit.
2. How should the goods and services be produced? To stay competitive, one has to minimize costs and produce efficiently.
3. For whom should the goods and services be produced? It depends on the input market – the product of all factors and its prices define the income of consumers,
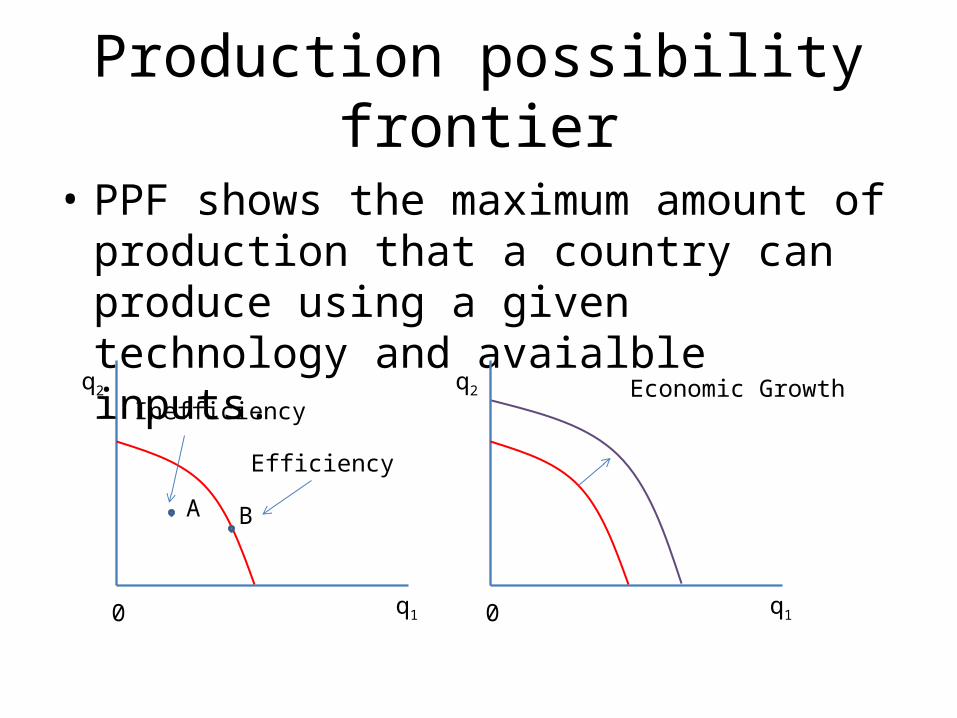
Production possibility frontier
• PPF shows the maximum amount of production that a country can produce using a given technology and avaialble inputs.
0 q1
q2
0 q1
q2
A
InefficiencyEconomic Growth
B
Efficiency
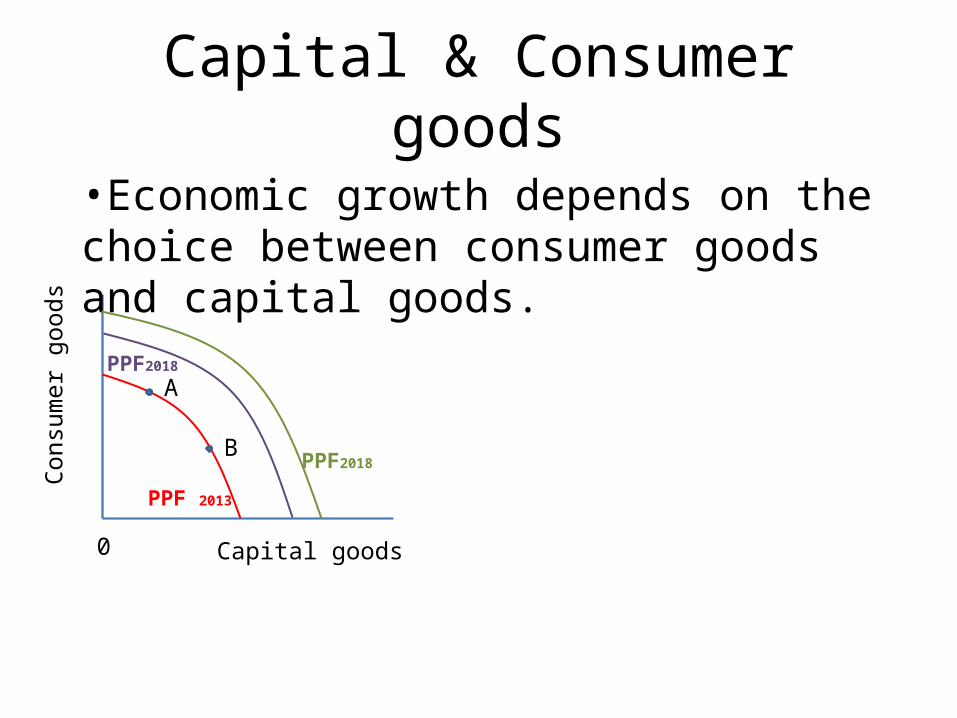
Capital & Consumer goods
0 Capital goods
•Economic growth depends on the choice between consumer goods and capital goods.
A
B
Cons
umer
goo
ds
PPF 2013
PPF2018
PPF2018
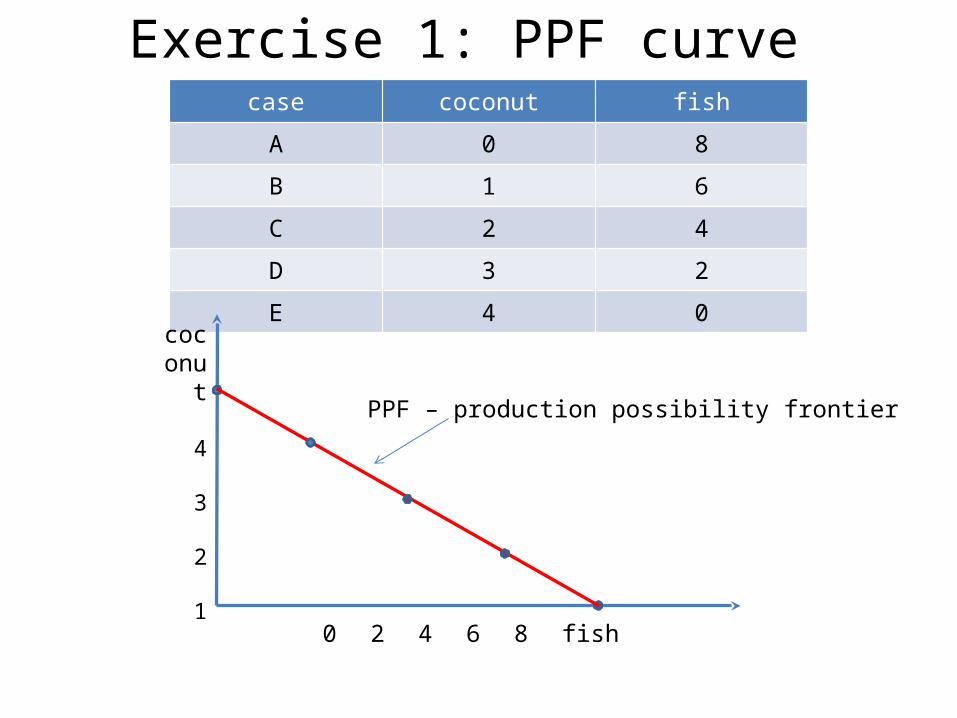
case coconut fish
A 0 8
B 1 6
C 2 4
D 3 2
E 4 0
0 2 4 6 8 fish
coconut
4
3
2
1
PPF – production possibility frontier
Exercise 1: PPF curve
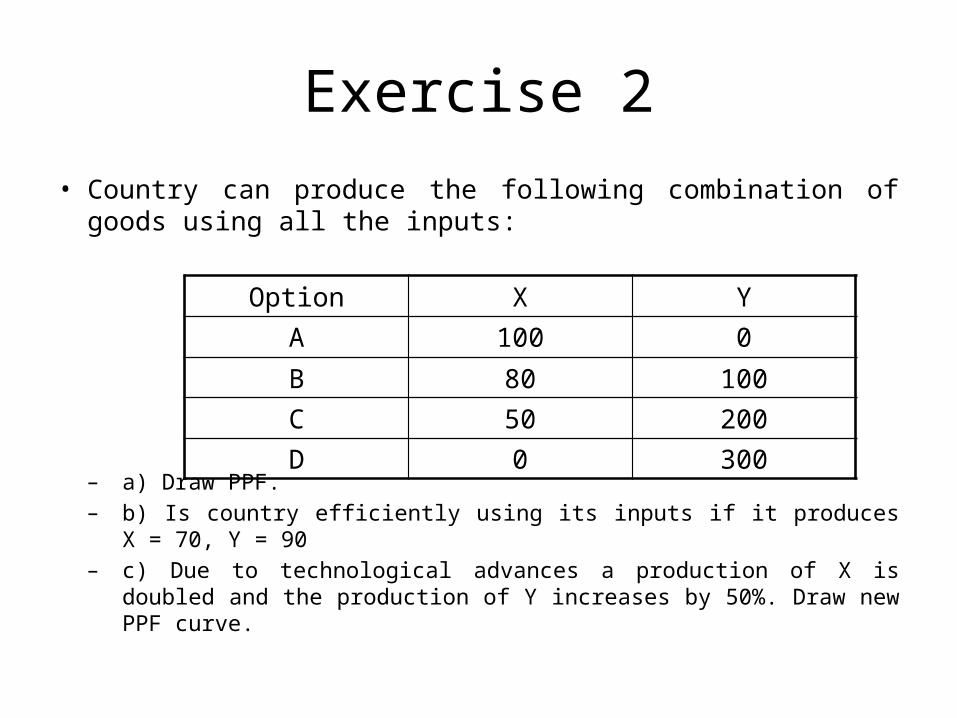
Exercise 2
• Country can produce the following combination of goods using all the inputs:
– a) Draw PPF.– b) Is country efficiently using its inputs if it produces X = 70, Y = 90– c) Due to technological advances a production of X is doubled and the
production of Y increases by 50%. Draw new PPF curve.
Option X Y
A 100 0
B 80 100C 50 200D 0 300
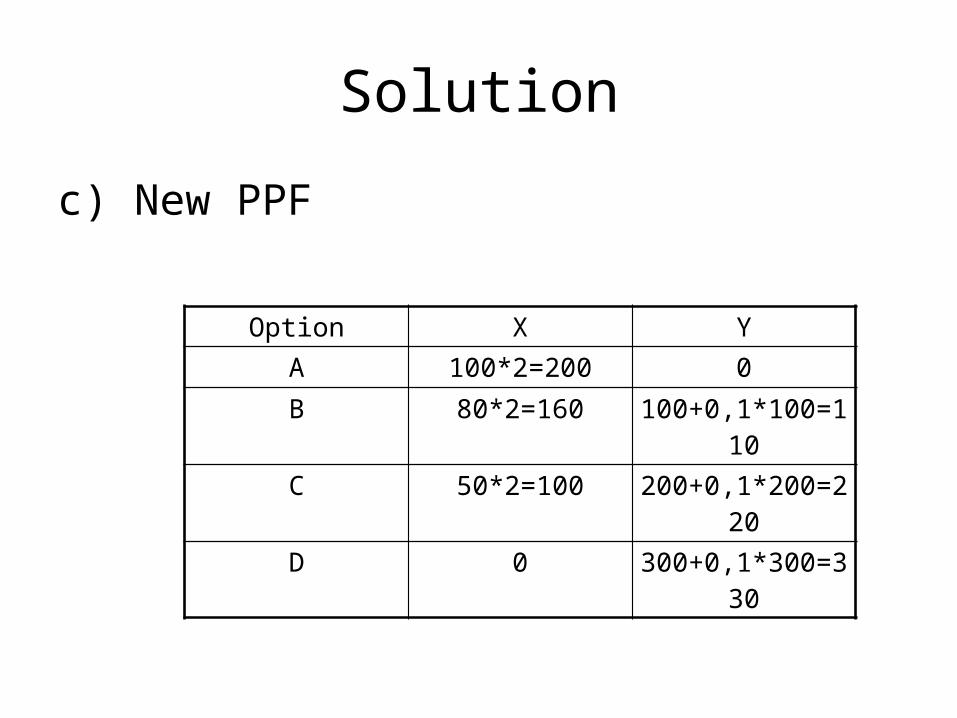
Solution
c) New PPF
Option X Y
A 100*2=200 0
B 80*2=160 100+0,1*100=110C 50*2=100 200+0,1*200=220D 0 300+0,1*300=330
Appendix 1 - Graphs
• A Graph is a picture that shows a relationship between 2 or more variables.
• 2D graphs – linear or nonlinear.• The slope of the curve shows by how much y
changes if x changes by 1 small unit. The sign of the slope tells whether an increase in x causes an increase in y (+), or a decrease (-).
x
y
z
1
0
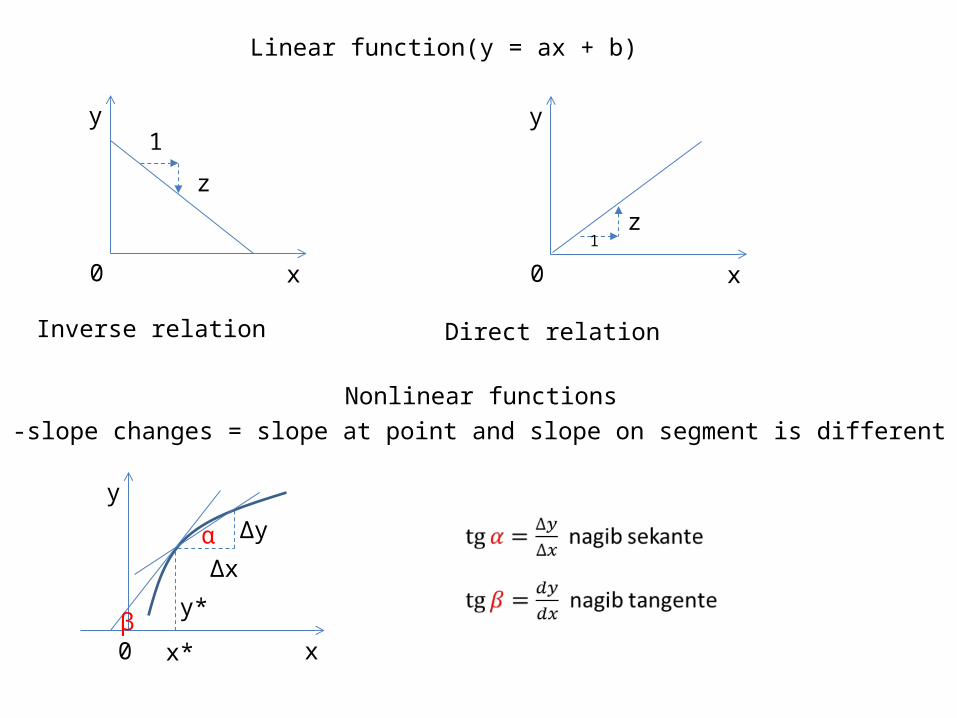
Inverse relation
x
y
z1
0
Direct relation
Linear function(y = ax + b)
Nonlinear functions-slope changes = slope at point and slope on segment is different
x
y
y*
Δx
0
Δy
x*
α
β
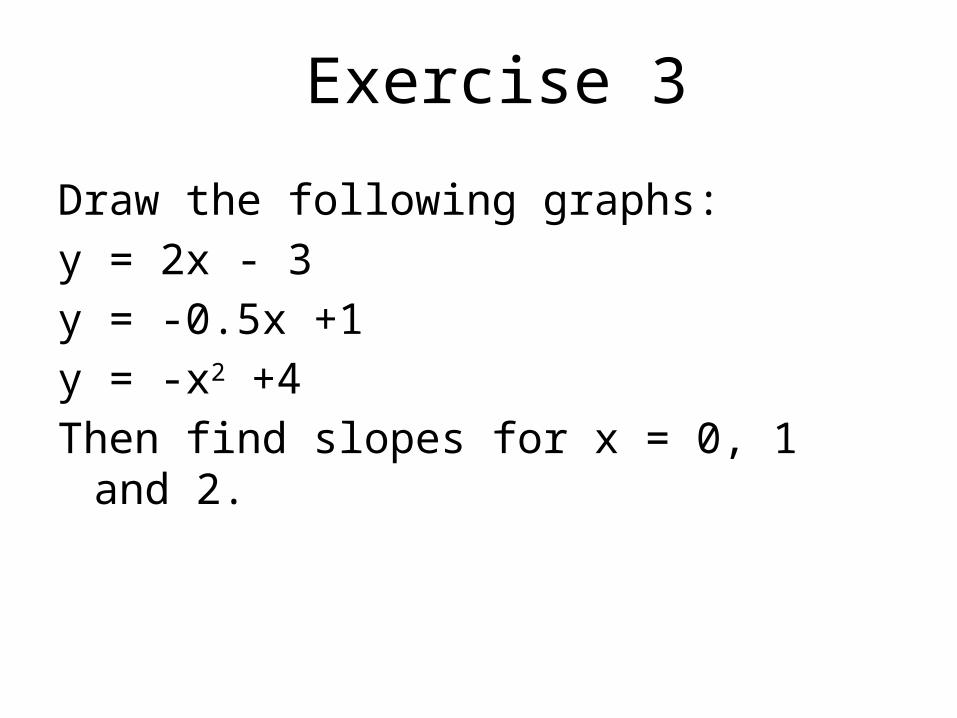
Draw the following graphs:y = 2x - 3y = -0.5x +1y = -x2 +4Then find slopes for x = 0, 1 and 2.
Exercise 3
Market and State
• Market is a system in which sellers and buyers interact in order to determine prices and quantities of goods and services.
• Price is the value of a good or service in money.
• Market equilibrium is a situation in which sellers are willing to sell just as much consumers are willing to buy at certain price.
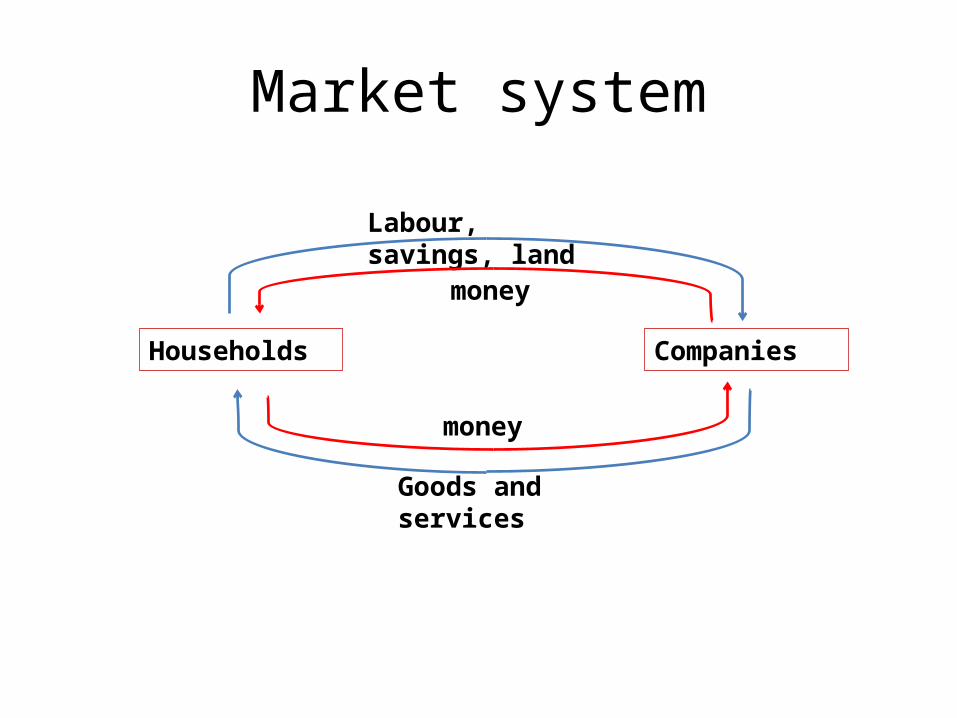
Market system
Labour, savings, land
Goods and services
Households Companies
money
money
Exchange, money and capital
• Exchange of goods is based on the specialisation and money is the mean for exchange.
• Specialization and division of labour increases productivity of labour which increases the amount of goods and thus the welfare of consumers.
• Capital is an input which is an accumulation of labour but more productive. Capital is made by sacrificing current consumption.
• Ownership of capital is protected – it is the foundation of capitalism.

Economic role of the state
• Laissez-faire (Fr.) – “let it be” – classical economics, today revised.
1. EFFICIENCY – best in perfect competition (invisible hand) but sometimes regulation of market competition needed:
• Imperfect competition appear – antitrust laws• Externalities - levying costs or benefits to others.• Public goods – financed by the state.• Taxes – price of the public goods.
2. JUSTICE• Unregulated markets can lead to the unjust
differencies bewteen the incomes.3. MACROECONOMIC GROWTH AND STABILITY• Fiscal policy (public spending, taxes) and
monetary policy (supply of money) affect the employment, GDP growth rate, inflation, etc.
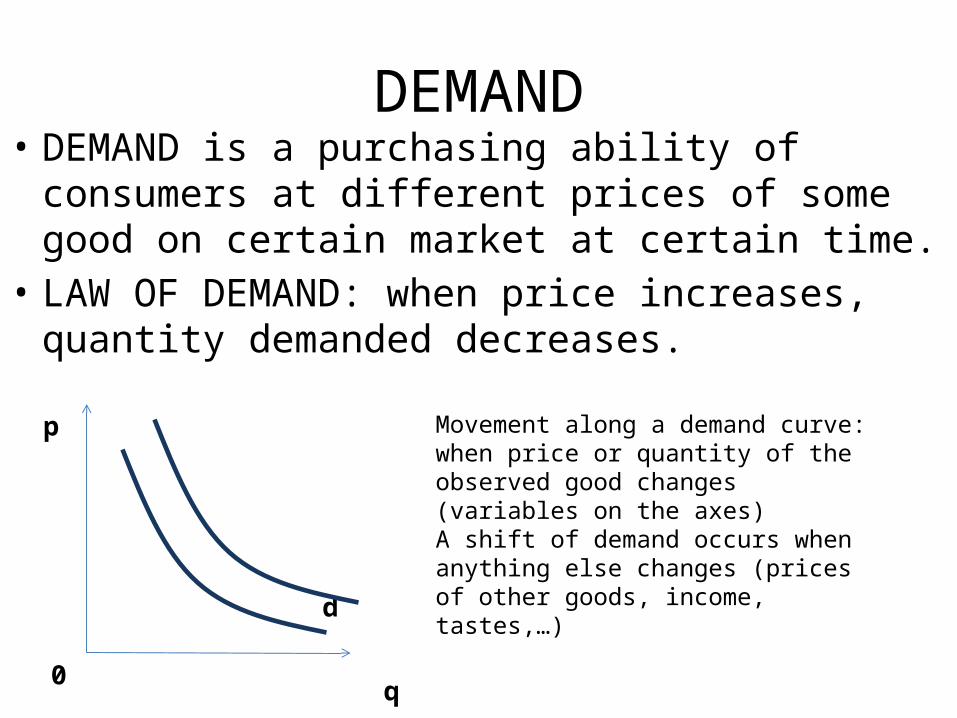
DEMAND• DEMAND is a purchasing ability of consumers at
different prices of some good on certain market at certain time.
• LAW OF DEMAND: when price increases, quantity demanded decreases.
d
p
0 q
Movement along a demand curve: when price or quantity of the observed good changes (variables on the axes)A shift of demand occurs when anything else changes (prices of other goods, income, tastes,…)
RELATION BETWEEN GOODS
• Goods x and y are independent if change in price of x does not affect demand of y.
• Goods x and y are dependent if an increase in price of x affects causes a outward shift of demand (SUBSTITUTES) or an inward shift (COMPLEMENTS)
FACTORS THAT AFFECT DEMAND
INCOMEPOPULATIONPRICES OF RELATED GOODSTASTESOTHER
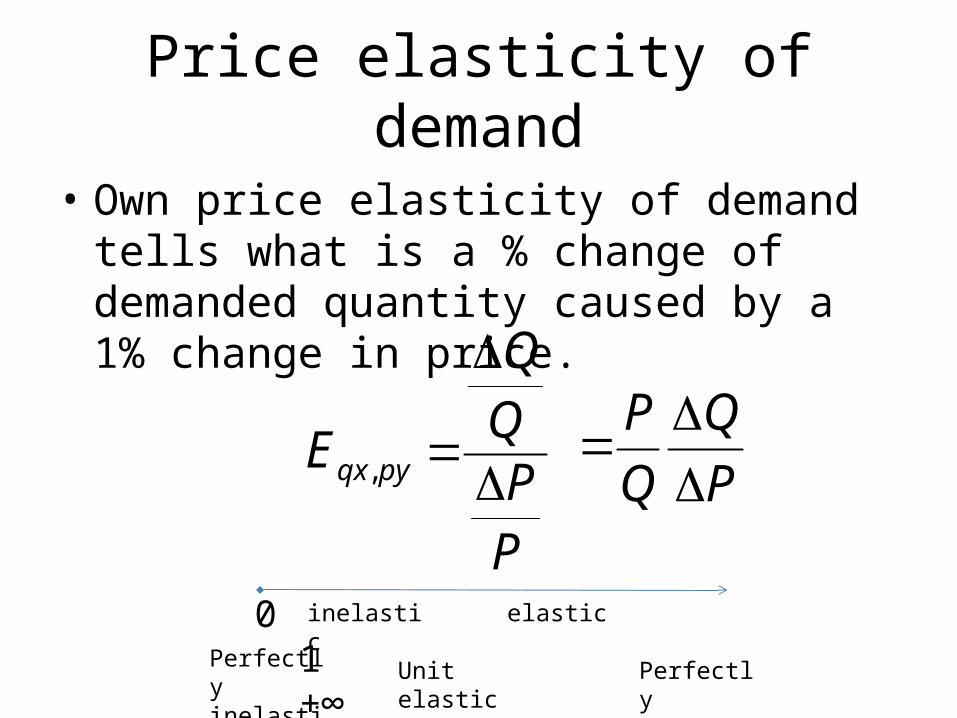
Price elasticity of demand
• Own price elasticity of demand tells what is a % change of demanded quantity caused by a 1% change in price.
PPQQ
E pyqx
, P
Q
Q
P
0 1 +∞ Perfectly inelastic
Unit elastic Perfectly elastic
inelastic elastic
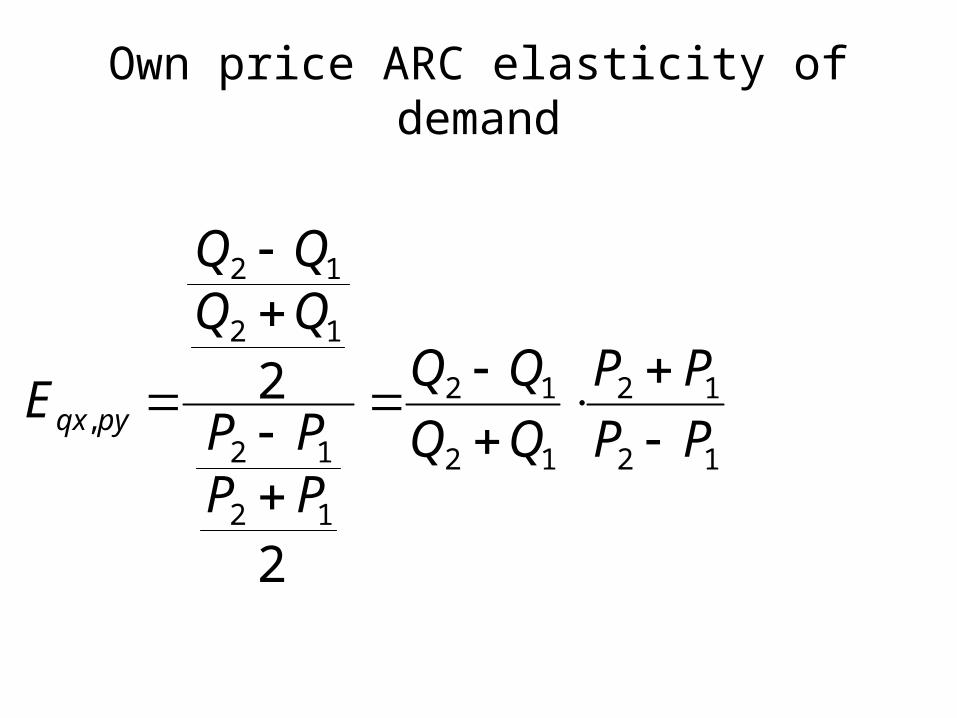
Own price ARC elasticity of demand
12
12
12
12
12
12
12
12
,
2
2PP
PP
PPPP
QQQQ
E pyqx
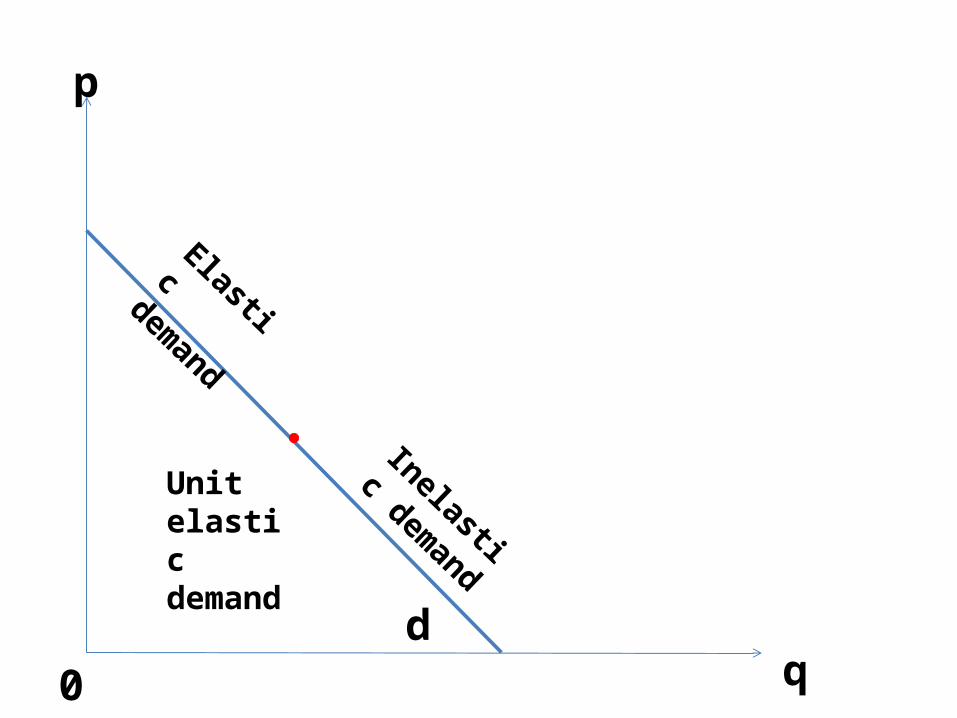
d
p
0 q
Elastic demand
Inelastic demand
Unit elastic demand
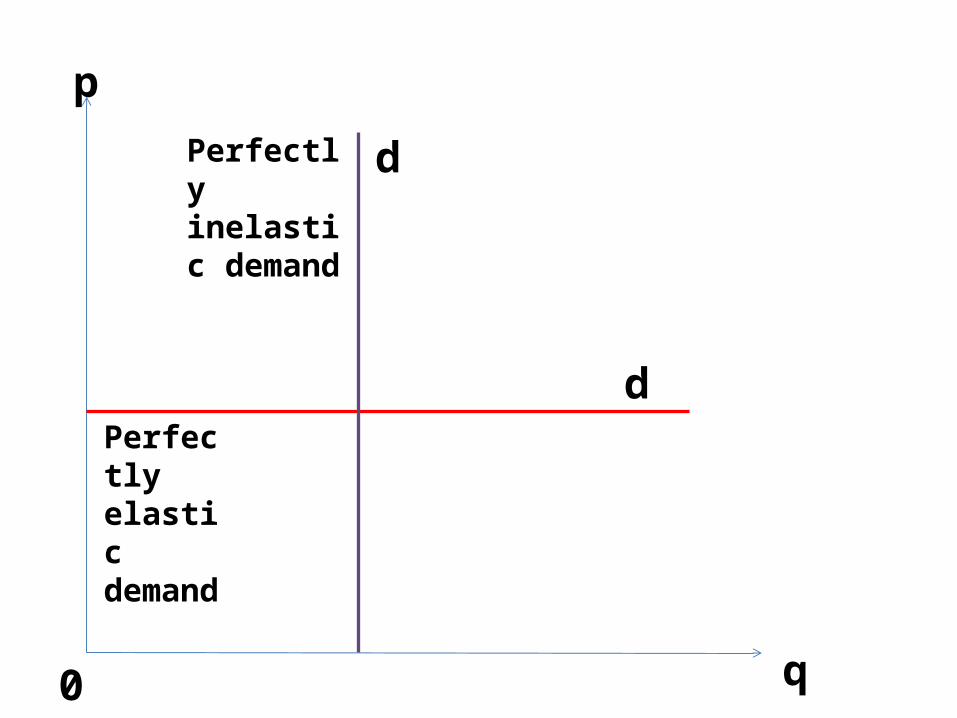
d
p
0 q
Perfectly elastic demand
Perfectly inelastic demand
d
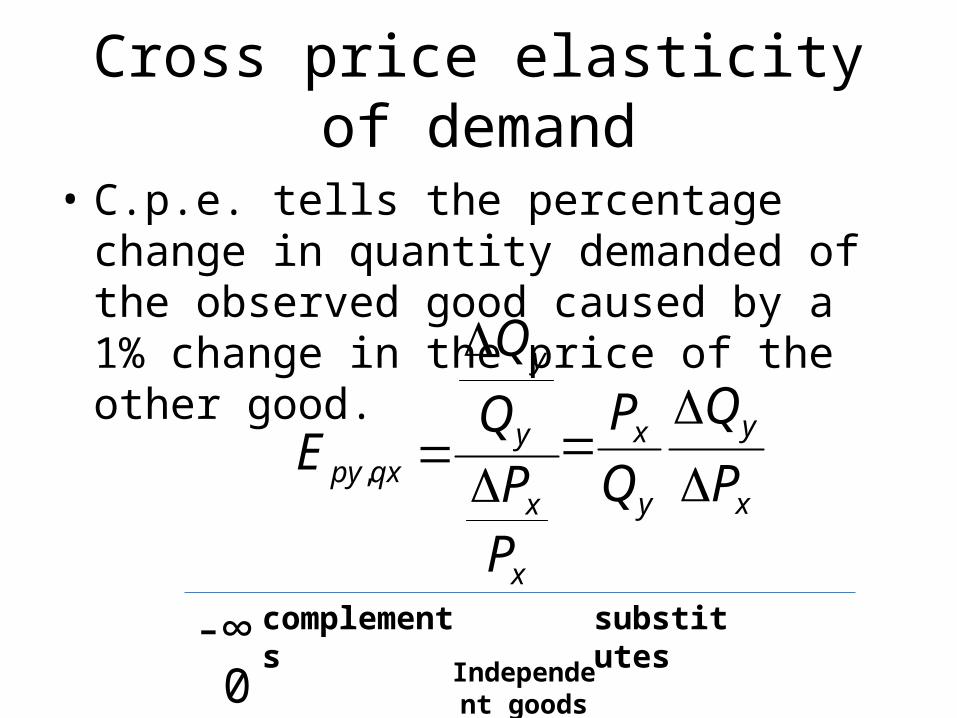
Cross price elasticity of demand
• C.p.e. tells the percentage change in quantity demanded of the observed good caused by a 1% change in the price of the other good.
x
x
y
y
qxpy
PP
Q
Q
E
,x
y
y
x
P
Q
Q
P
-∞ 0 +∞ Independent
goods
complements substitutes
Income elasticity of demand
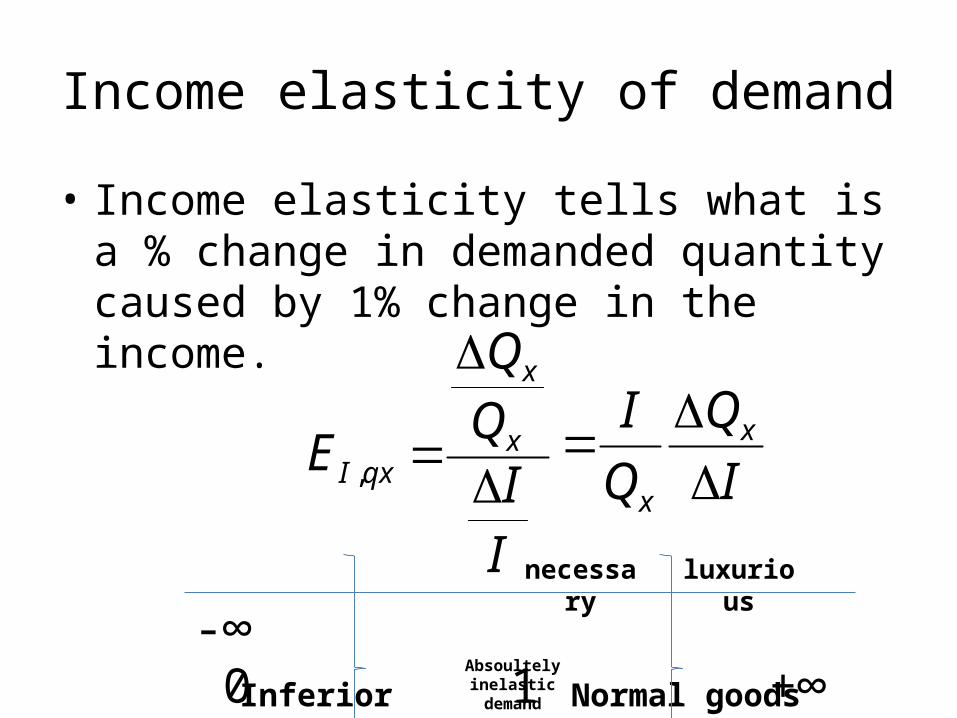
• Income elasticity tells what is a % change in demanded quantity caused by 1% change in the income.
IIQQ
E x
x
qxI
, I
Q
Q
I x
x
-∞ 0 1 +∞ Absoultely
inelastic demandInferior goods Normal goods
necessary luxurious
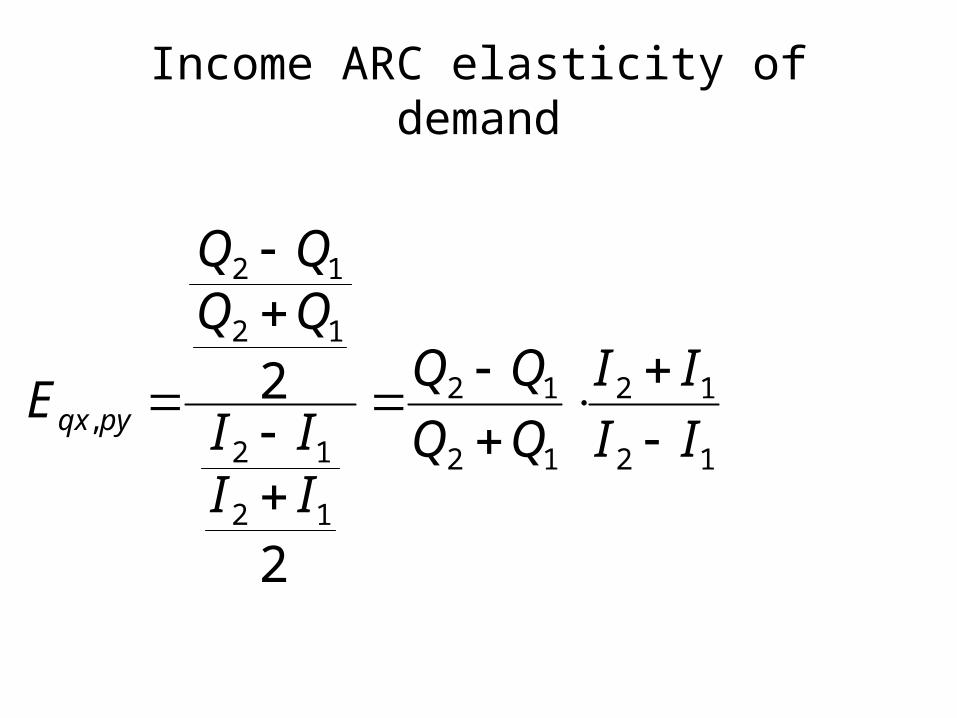
Income ARC elasticity of demand
12
12
12
12
12
12
12
12
,
2
2II
II
IIII
QQQQ
E pyqx
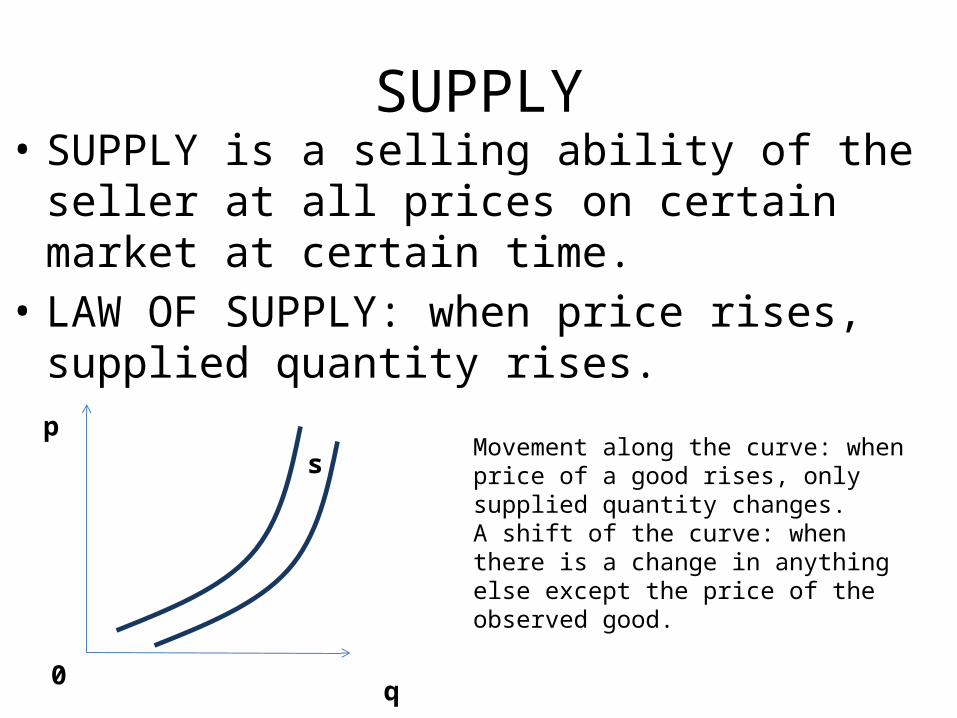
SUPPLY• SUPPLY is a selling ability of the seller at all prices on
certain market at certain time.• LAW OF SUPPLY: when price rises, supplied quantity
rises.
sp
0 q
Movement along the curve: when price of a good rises, only supplied quantity changes.A shift of the curve: when there is a change in anything else except the price of the observed good.
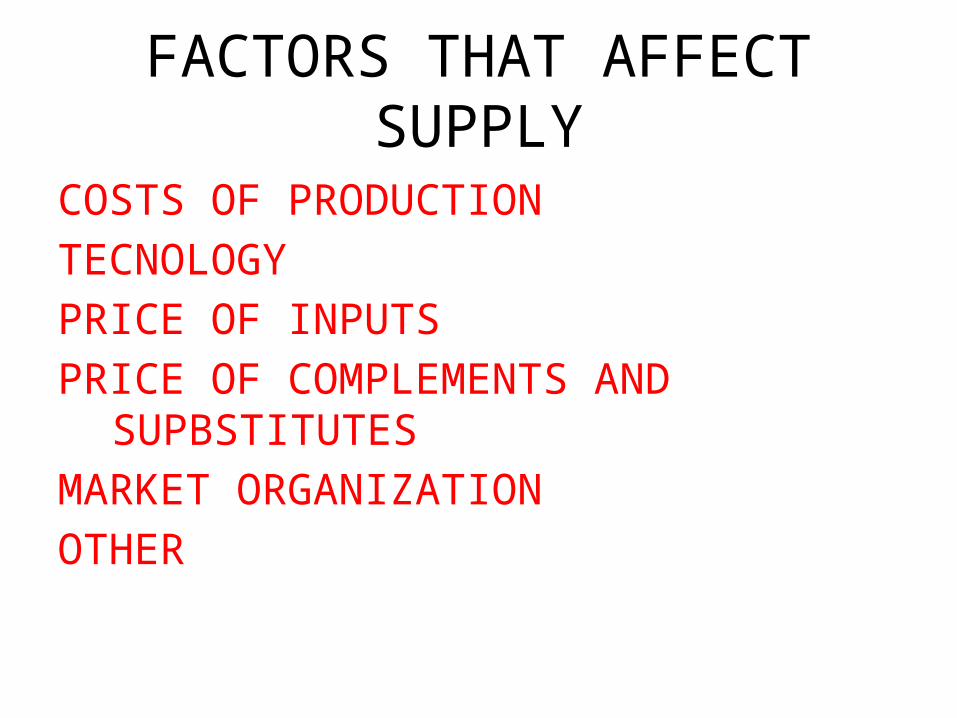
FACTORS THAT AFFECT SUPPLY
COSTS OF PRODUCTIONTECNOLOGYPRICE OF INPUTSPRICE OF COMPLEMENTS AND SUPBSTITUTESMARKET ORGANIZATIONOTHER
Elasticity of supply
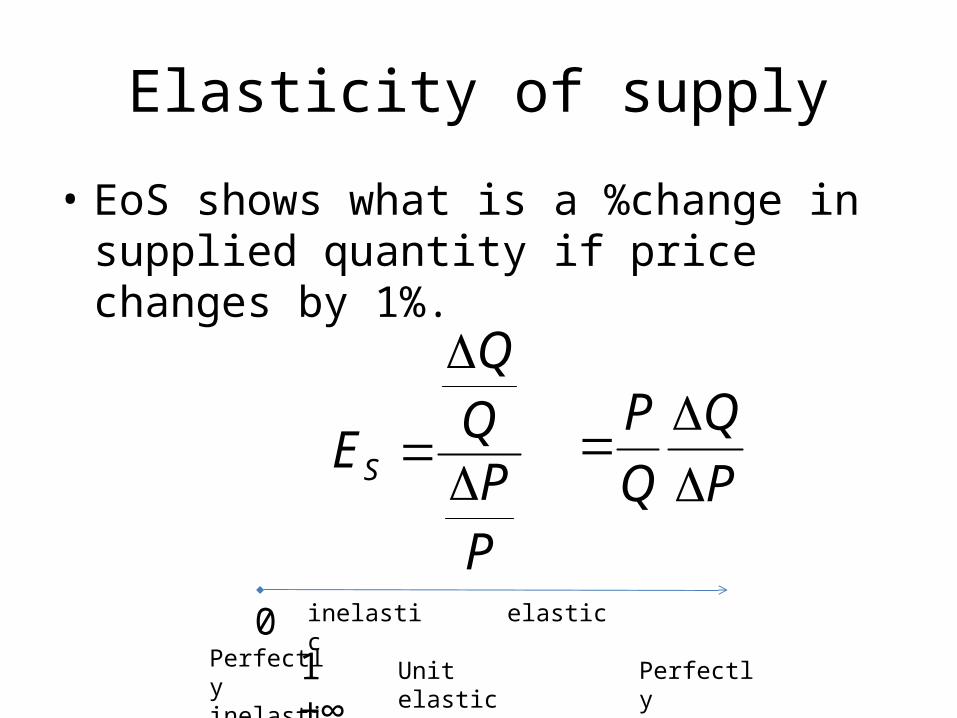
• EoS shows what is a %change in supplied quantity if price changes by 1%.
PPQQ
ES
P
Q
Q
P
0 1 +∞ Perfectly inelastic
Unit elastic Perfectly elastic
inelastic elastic
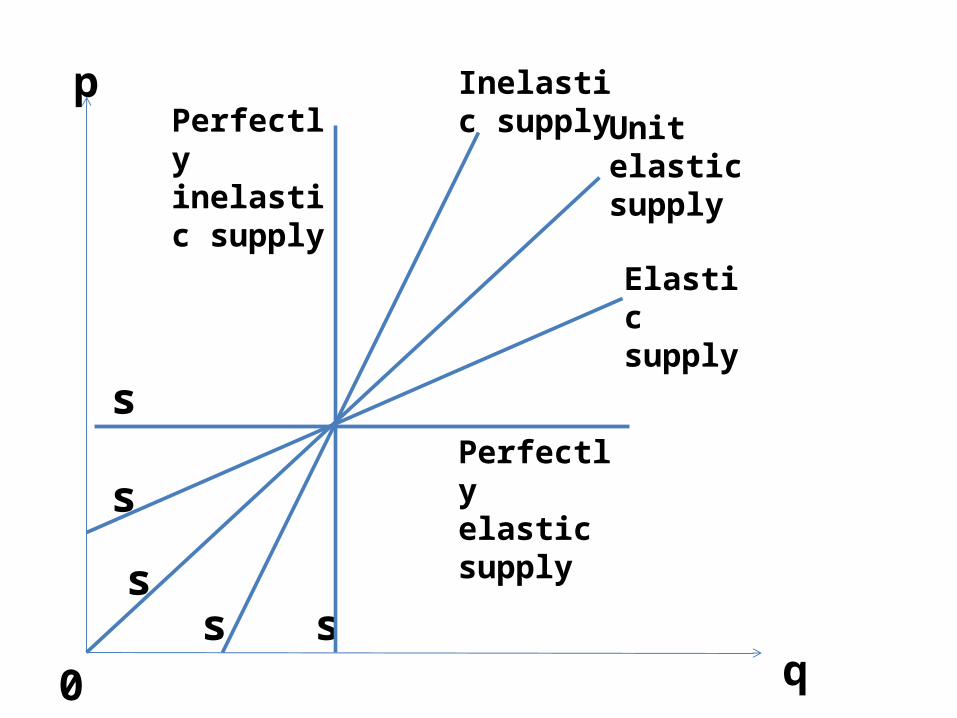
s
p
0 q
Elastic supply
Inelastic supplyPerfectly
inelastic supply
Perfectly elastic supply
ss
s
s
Unit elastic supply
Equilibrium price and quantity
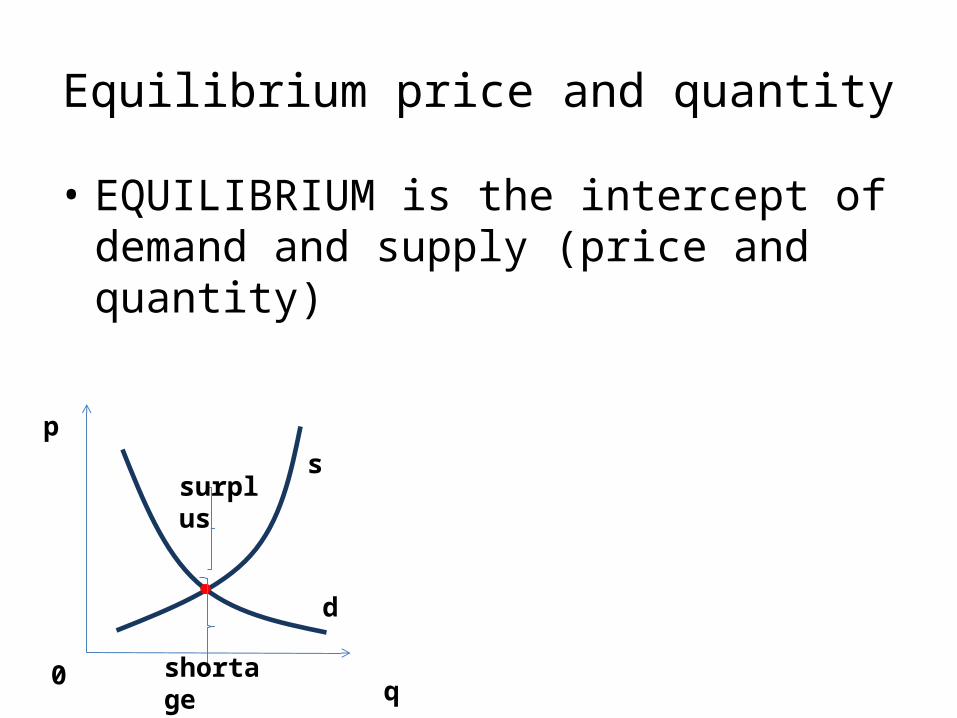
• EQUILIBRIUM is the intercept of demand and supply (price and quantity)
d
p
0 q
ssurplus
shortage
Changes in the equilibrium
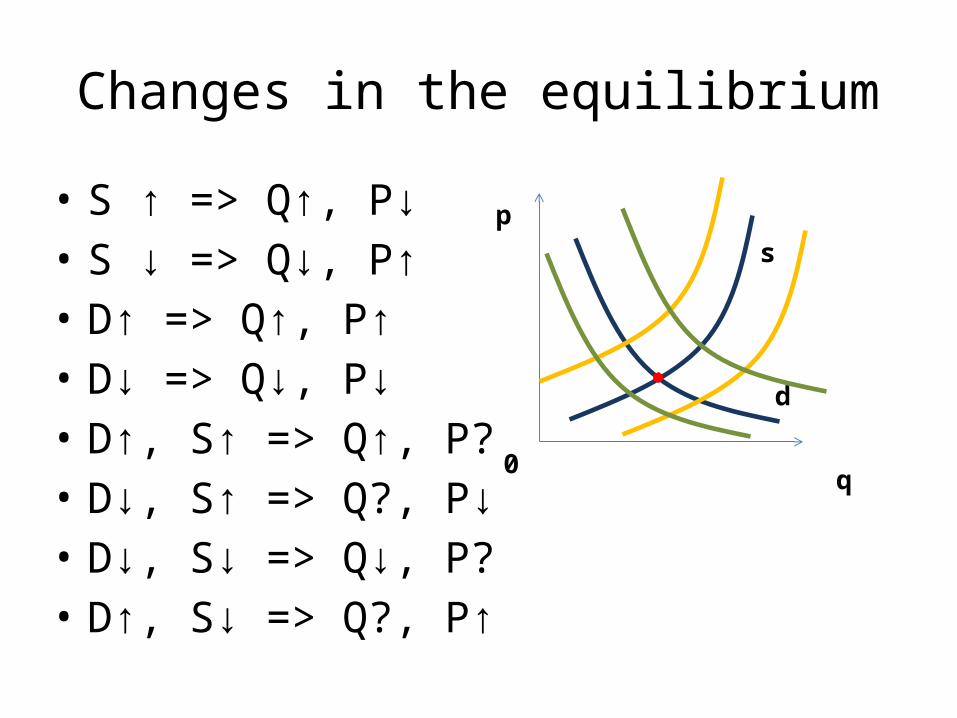
• S ↑ => Q↑, P↓• S ↓ => Q↓, P↑• D↑ => Q↑, P↑• D↓ => Q↓, P↓• D↑, S↑ => Q↑, P?• D↓, S↑ => Q?, P↓• D↓, S↓ => Q↓, P?• D↑, S↓ => Q?, P↑
d
p
0 q
s
Taxation and equilibrium
• Taxes are prices of public goods• Taxes can be imposed on wages, profit, capital
gain, consumption or some special goods like alcohol, tobaco and gas.
• Taxes cause total surplus of the economy to fall.
Taxes and elasticities
d
p
0 q
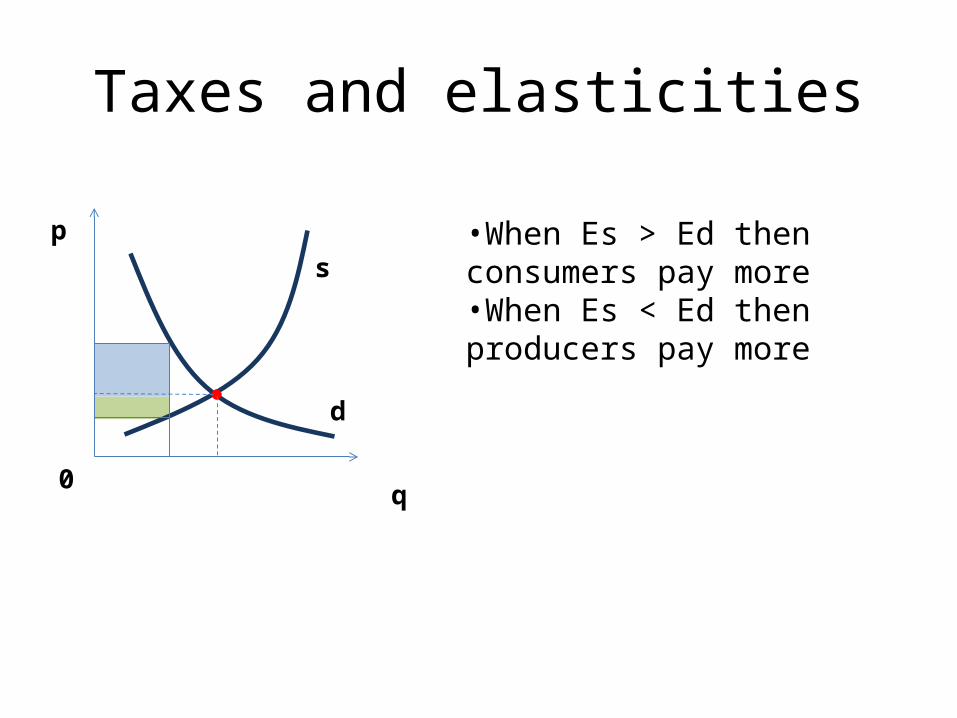
s•When Es > Ed then consumers pay more•When Es < Ed then producers pay more
Exercise 4
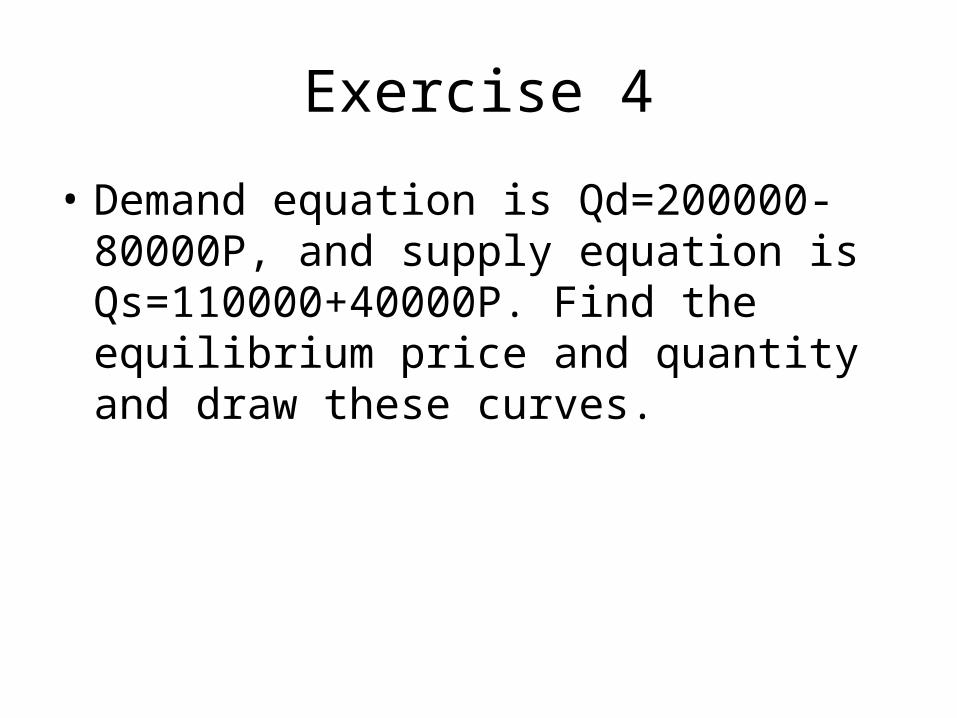
• Demand equation is Qd=200000-80000P, and supply equation is Qs=110000+40000P. Find the equilibrium price and quantity and draw these curves.
Solution
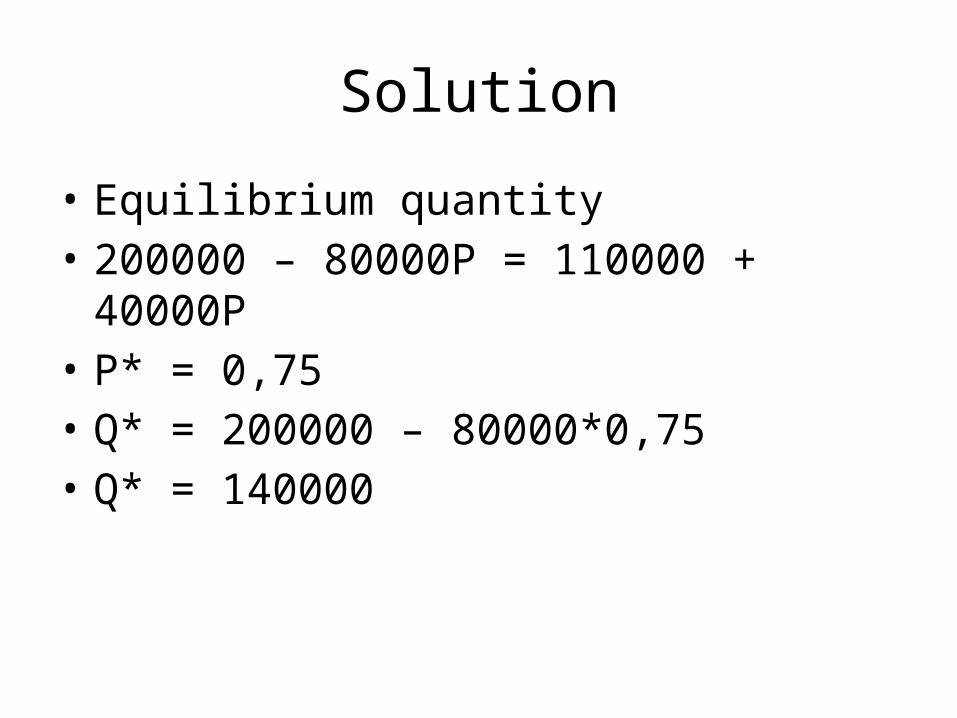
• Equilibrium quantity• 200000 – 80000P = 110000 + 40000P • P* = 0,75 • Q* = 200000 – 80000*0,75• Q* = 140000
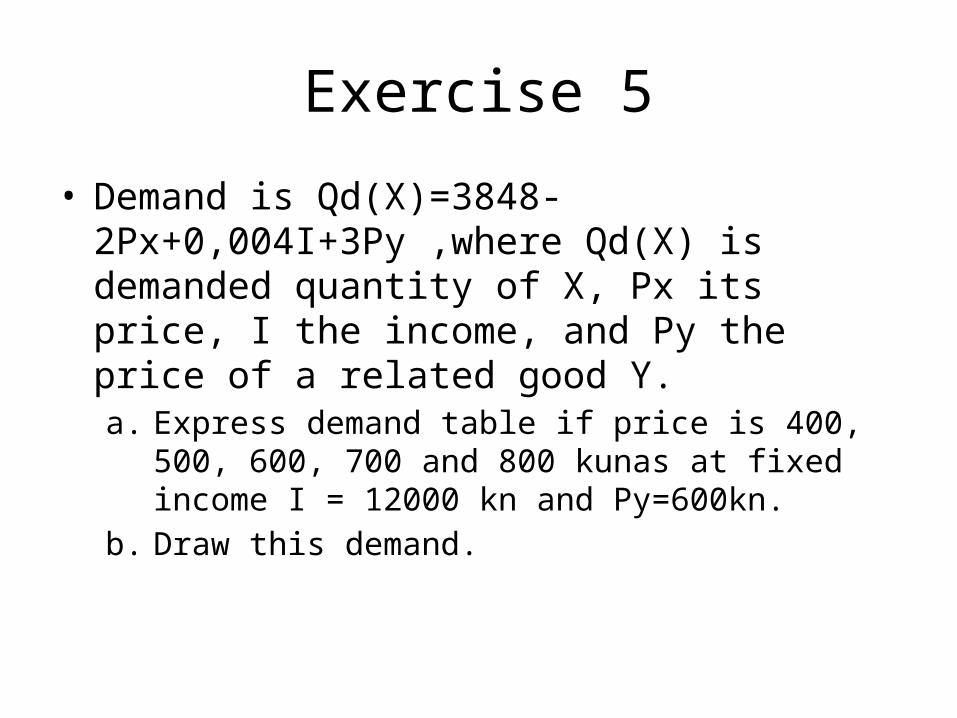
Exercise 5
• Demand is Qd(X)=3848-2Px+0,004I+3Py ,where Qd(X) is demanded quantity of X, Px its price, I the income, and Py the price of a related good Y.a. Express demand table if price is 400, 500, 600, 700 and
800 kunas at fixed income I = 12000 kn and Py=600kn.b. Draw this demand.
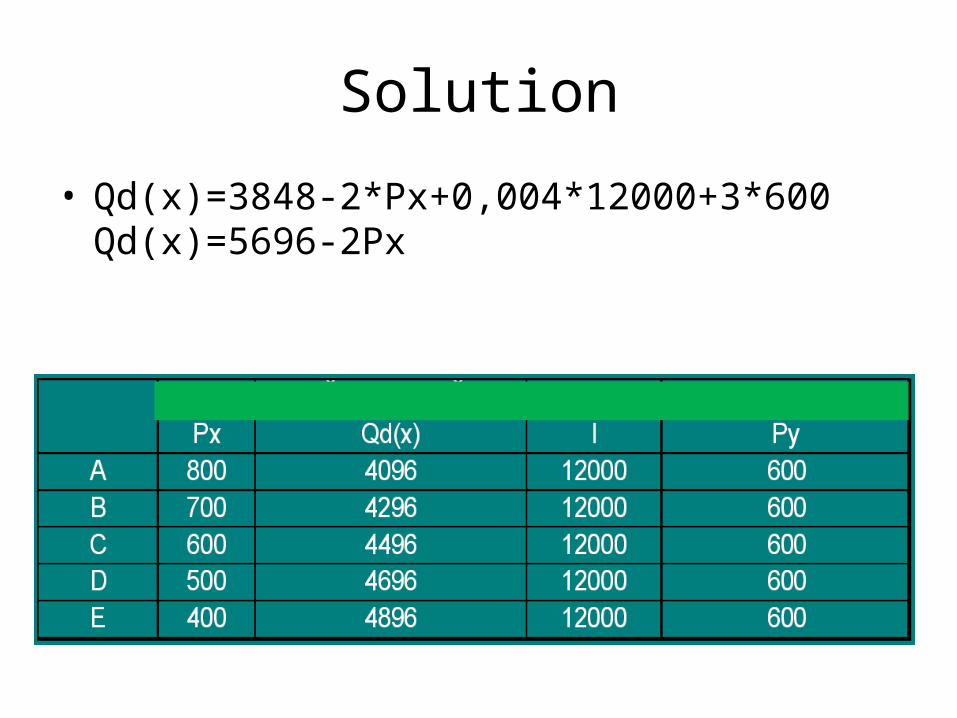
Solution
• Qd(x)=3848-2*Px+0,004*12000+3*600 Qd(x)=5696-2Px
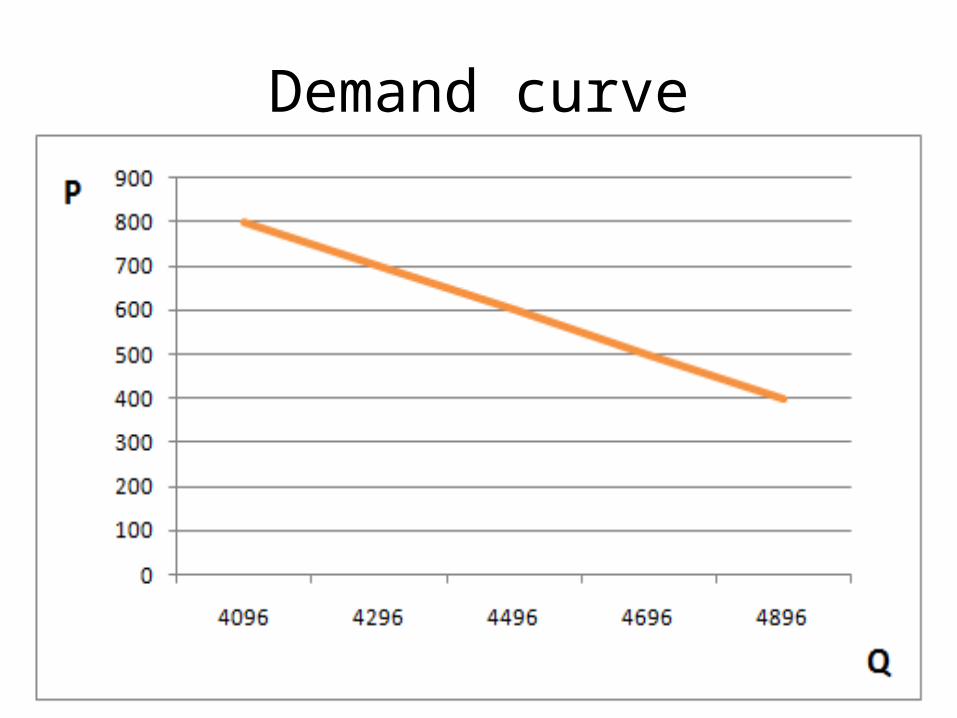
Demand curve
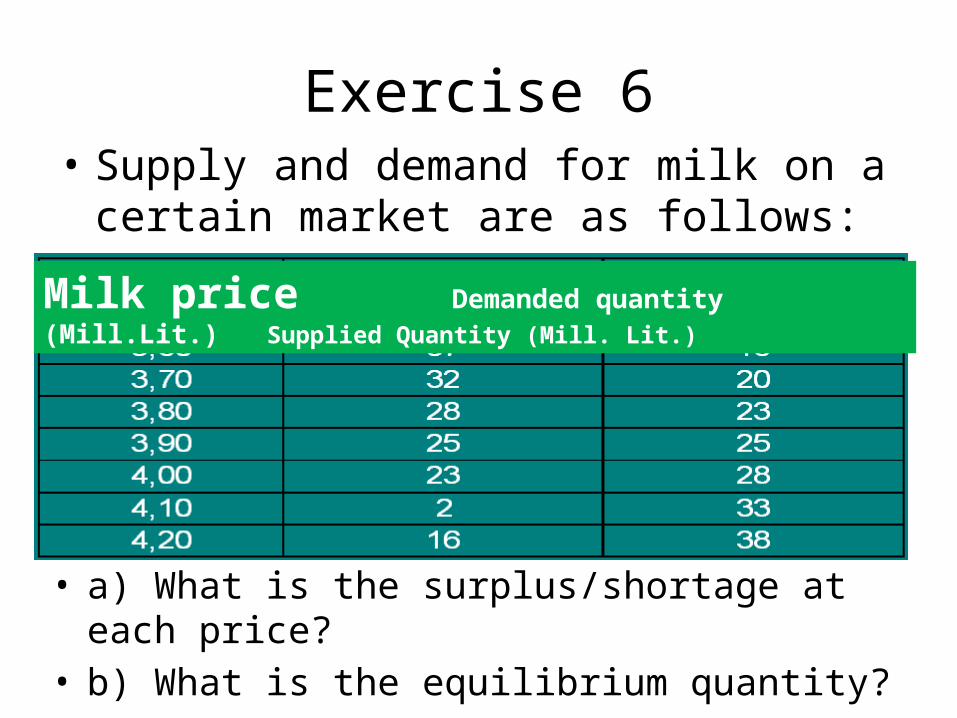
Exercise 6• Supply and demand for milk on a certain
market are as follows:
Milk price Demanded quantity (Mill.Lit.) Supplied Quantity (Mill. Lit.)
• a) What is the surplus/shortage at each price? • b) What is the equilibrium quantity?
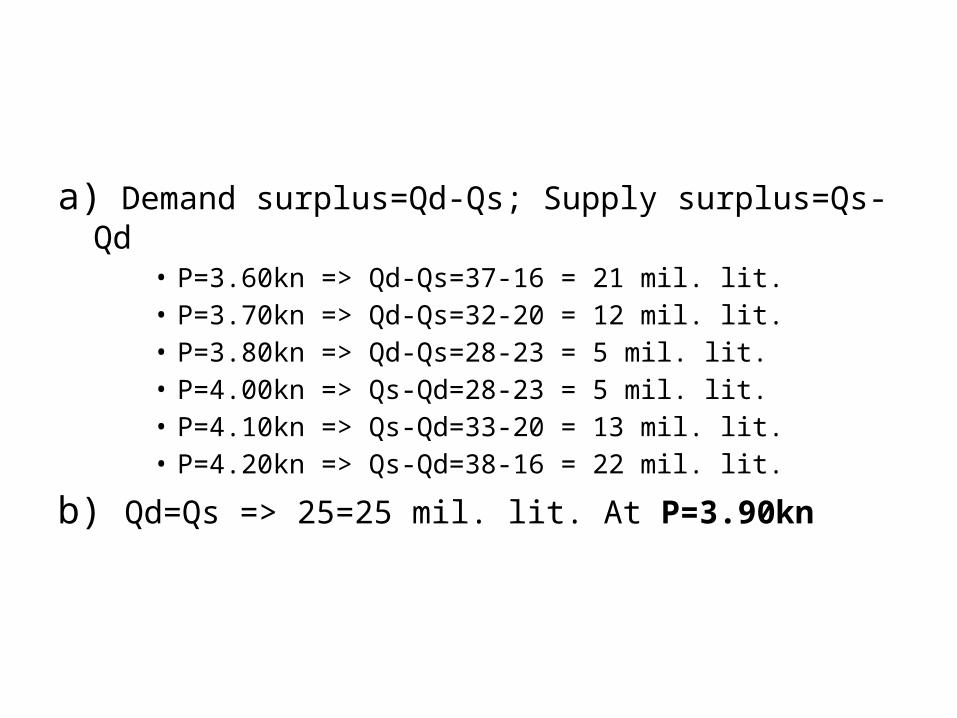
a) Demand surplus=Qd-Qs; Supply surplus=Qs-Qd • P=3.60kn => Qd-Qs=37-16 = 21 mil. lit. • P=3.70kn => Qd-Qs=32-20 = 12 mil. lit.• P=3.80kn => Qd-Qs=28-23 = 5 mil. lit. • P=4.00kn => Qs-Qd=28-23 = 5 mil. lit. • P=4.10kn => Qs-Qd=33-20 = 13 mil. lit. • P=4.20kn => Qs-Qd=38-16 = 22 mil. lit.
b) Qd=Qs => 25=25 mil. lit. At P=3.90kn
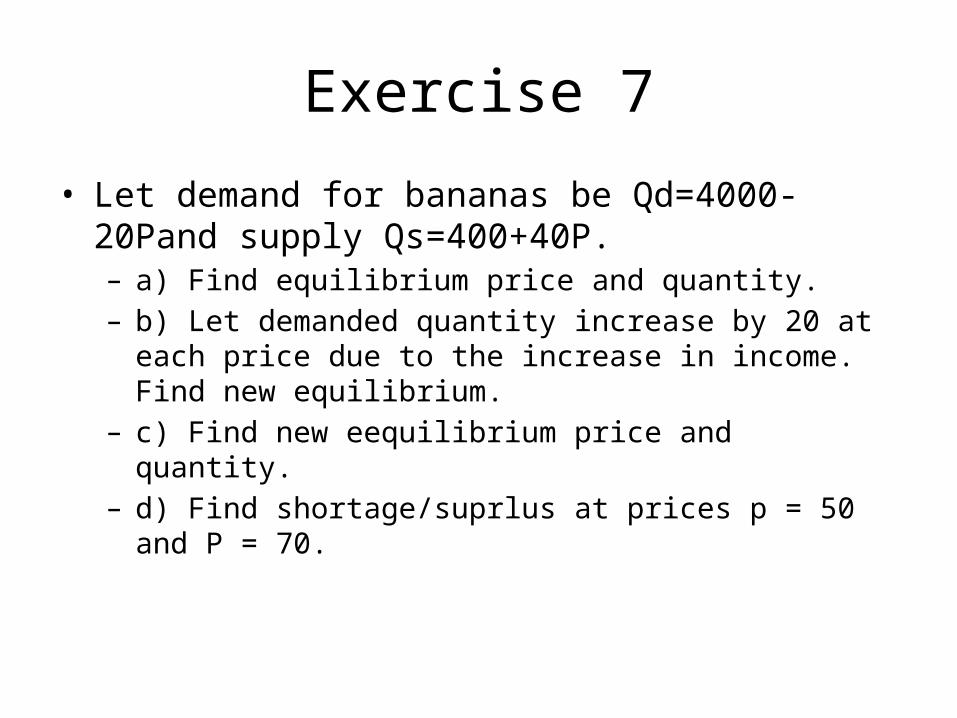
Exercise 7
• Let demand for bananas be Qd=4000-20Pand supply Qs=400+40P. – a) Find equilibrium price and quantity.– b) Let demanded quantity increase by 20 at each price due to
the increase in income. Find new equilibrium.– c) Find new eequilibrium price and quantity.– d) Find shortage/suprlus at prices p = 50 and P = 70.
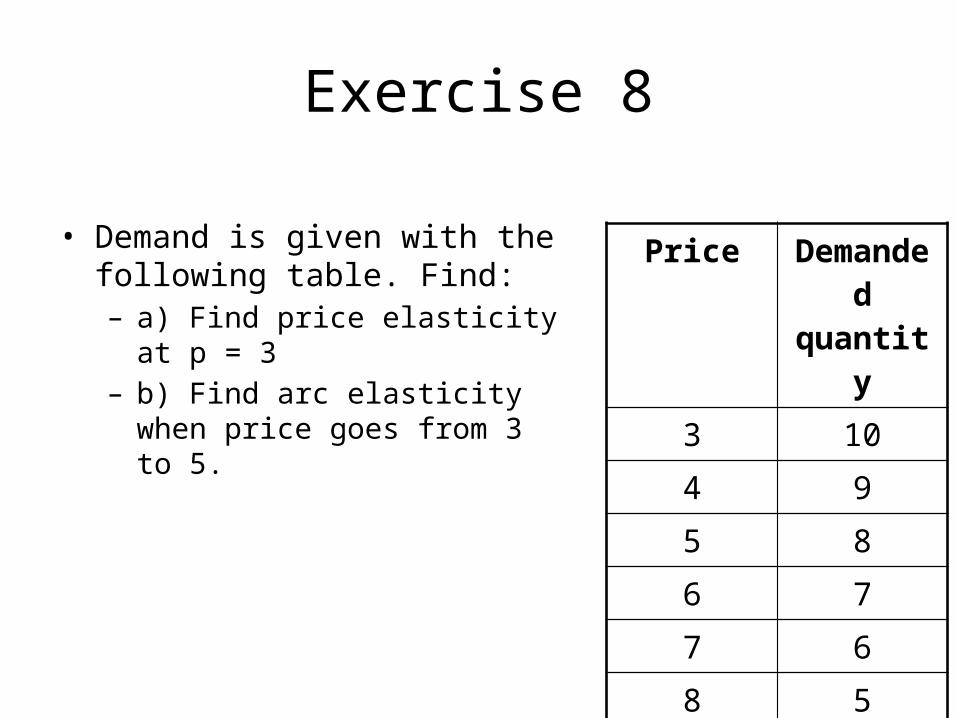
Exercise 8
• Demand is given with the following table. Find:– a) Find price elasticity at p = 3– b) Find arc elasticity when price
goes from 3 to 5.
Price Demanded quantity
3 10
4 9
5 8
6 7
7 6
8 5
Exercise 9
• Find arc elasticity:– (own price): Price of hamburgers has risen from
0.5$ to 0.7$, and quantity demanded fell from 1000 to 900.
– (income): Price of cheese fell from 1.1$ to 0.9$ when income fell from 214.5$ to184.5$.
Exercise 10
• The income is I = 10000 kn, price of y is 10, price of x is 12 and quantity demanded of x is 100.
a) If income rises to 11000 kn, quantity demanded falls to 90. Find income elasticity.
b) If price of x falls to 11 kn, quantity demanded rises to 150. Find own price elasticity.
c) If price of Y increases by 2 quantity demanded remains unchanged. Find cross price elasticity.