Embed Size (px)
Citation preview

Principles of Economics and Business 1
UVBA-EXAMPLE

Silver Gold Platinum Diamond
Minimum Discount 20% 20% 30% 35%
Online course
Hard Copy Summaries
Digital Summaries
Exam trainings on location
Obtain all of your ECTS-credits with the study support of
SlimAcademy!
Curious about the subscriptions we offer for your study? Take a look at SlimStuderen.nl and CapitaSelecta.nl for the possibilities. If you purchase your subscription before the first of
October, you will have a chance on winning free college tuition for 1 year!
010 - 214 06 01 (reachable from 13:00 to 17:00)
Whatsapp: 06 43 95 27 16 (reachable from 9:00 to 17:00)
Our study support products:
Receive our high quality study support instantly, through one of our con-venient subscriptions!
Purchase a SlimAcademy subscription for the perfect preparation for your exams! You will receive all the products from your subscription automatically at home for free and you will save up to 60% (compared to buying the products separately).
Hard Copy Summary
Digital Summary
Summary Combi
Online Course
Exam training on location
Thesis tutoring
starting from €6,95
starting from €5,95
starting from €9,95
starting from €9,95
starting from €111,95
starting from €49,95 p/h
Study support subscriptions:
Win
free tu
ition
for 1
year!
1 year of free tuition?

Overzicht studiestof Principles of Economics and Business 1 2017-2018
1
Preview Summary Principles of Economics and Business 1
Dear Business Administration student,
Welcome at the University of Amsterdam! You are now reading the Principles of Economics and
Business 1 summary for Business Administration. SlimStuderen.nl and Capita Selecta summarized all
the mandatory literature and articles you need to know for your exam, so that you may study in the
best possible way. We would like to wish you good luck in advance with studying!
Good luck with your exams!
Team SlimStuderen.nl and Capita Selecta
P.S. Do you want to start this academic year with discount on summaries from SlimStuderen.nl and
online courses from CapitaSelecta? When ordering summaries before October 1st 2018 on our
websites, you will receive an extra discount of 15% on your first order with ‘Welcome2018SSCS’
Quality
Our summaries and course materials contain everything you need in order to pass the course;
nothing more and nothing less. Every trimester, the mandatory literature is being summarized by
an experienced author. The lectures and important workshops are also summarized, which
allows you to be less stressed when missing out on one of them.
With a subscription you will profit of high discounts!
Do you want to receive the summaries as soon as they are available and with a discount? Buy a
subscription and you automatically receive all summaries at your doorstep!
Join us
SlimStuderen.nl and Capita Selecta are always looking for authors! Are you interested in earning
money while you’re learning? Send your motivation and CV to [email protected]
Stay in contact with SlimStuderen.nl and Capita Selecta
Do you want to stay in touch with SlimStuderen.nl, are you curious about our online contests or
would you like some additional study tips? Connect with us via:
SlimStuderen.nl
/SlimStuderen
@SlimStuderen.nl
010 214 06 01
06 43 952 716
CapitaSelecta.nl
/CapitaSelectaStudieondersteuning
@CapitaSelecta
010 214 23 94
06 45 34 14 74

Overzicht studiestof Principles of Economics and Business 1 2017-2018
2
Table of Contents
PREVIEW SUMMARY PRINCIPLES OF ECONOMICS AND BUSINESS 1 ............................................... 1
TABLE OF CONTENTS .................................................................................................................... 2
INFORMATION REGARDING PRINCIPLES OF ECONOMICS AND BUSINESS 1 ..................................... 3
CHAPTER 1: THE BIG IDEAS ........................................................................................................... 4
CHAPTER 2: THE POWER OF TRADE AND COMPARATIVE ADVANTAGE ........................................... 6
CHAPTER 3: SUPPLY AND DEMAND ............................................................................................... 8
CHAPTER 4: HOW SUPPLY AND DEMAND DETERMINE PRICES ...................................................... 14
DEFINITIONS .............................................................................................................................. 21
EPILOGUE ................................................................................................................................... 27

Overzicht studiestof Principles of Economics and Business 1 2017-2018
3
Information regarding Principles of Economics and Business 1
The structure of this summary is quite clear: we start with the most important theories, then add
some practice questions and sometimes there is even an advice on how to tackle the most difficult
questions on your exam.
Key elements
The key elements of this course are: Adam Smith, demand and supply curve, competitive markets,
equilibrium, incentives.
About the exam
Let’s talk about the exam. The final grade is determined on the basis of a couple of things. You will
write individual assignments, two of them (the fourth and the sixth) are marked by your tutor. These
two grades will be combined and that given grade accounts for 67% of your final grade.
The other 33% of your grade will lead from your two-hour written end of term examination with
open questions and multiple-choice questions. The grade for the written examination should be at
least 5.0 the pass the course.
Most common mistakes
There are a lot of students who make the same mistakes during this course and unfortunately also
during the exam. We will discuss a couple of mistakes, so you won’t make them. Most of the
students forget to draw a figure when they read a question about demand and/or supply. So, when
you read that kind of question, please start drawing immediately. Secondly, don’t start to learn an
evening before the exam. We are sure you have read this before, but this is a really important point.
Read all the stuff during the weeks before the exam and start about ten days before your exam.
How can we help?
We offer two summaries during each course: one for your midterm, and one for your endterm.
We also offer a FREE!!! online course by Capita Selecta, so keep in touch with us via Facebook and
our websites www.slimstuderen.nl and www.capitaselecta.nl!

Overzicht studiestof Principles of Economics and Business 1 2017-2018
4
Chapter 1: The big ideas
Today's society is built on its complexity in organization. Economists refer to complexity as
differentiation. As a result of the production of different goods, specialization, the process of
grouping cooperative labour in specific tasks, is required to avoid waste: a specialized worker can
produce more of one certain product than an all-round worker. Because of this specialization, every
single economic market depends on another market. This connection between these different
markets is the foundation of the discussed big ideas of economists.
A few of these big ideas will be discussed in this chapter. Ideas such as; incentives can be given in
order to improve the quality or quantity of the work done. Employees, as well as principals, will be
offering more precise or quicker labour in return.
Self-interest and the social interest go hand in hand at good institutions
Under the right conditions, it is possible to improve the social wealth or welfare, while those who
pursue their own interest are better off as well. Imagine an employer who decreased his prices in
order to sell more products and ends up with more profit. Under the right circumstances, e.g. in a
recession, he does not only lower the price for the consumers, but he can also lower the
unemployment rate because of this increased production (there are more workers needed). He can
also give his employees a higher income.
Trade-offs are made in every market
Sometimes the government or a health care institution has to make a decision: should they test the
new drug extensively or should they release the new drug immediately after a few tests? The sooner
they release the drug, the lower the costs of research will be. These costs will influence the drug
price and as a result of that some people won't be able to afford this certain drug and might not be
saved. On the other hand, the short time period of research might not be enough to judge whether
the drug is safe, which might result in deaths. A trade-off has to be made. Economists will have to
consider the opportunity costs, the value of the opportunities lost (in this case it is about lives), to
determine when they have to release the drug.
Thinking on the margin is a requirement when you make a trade-off
Marginal costs, the costs of one unit more or less, will give an insight into the decision whether or
not you release the drug. In this case one 'unit' has to be seen as one test. If they decide to do one
more test, the costs will increase by e.g. $2,000,000. The consumer might be paying for these costs.
With this information, economists can make better decisions.
Specialization increases production, production increases the amount of trades.
Imagine the autarkic agrarian society of the Dark Ages. Specialization barely existed anymore and as
a result the total production of a society was almost equal to the production of the farms and trade
routes were globally disappearing. Nowadays, we have specialists all over the world, mass
production and international trade routes.

Overzicht studiestof Principles of Economics and Business 1 2017-2018
5
Governments should not print too much money
Printing money can be a useful economic policy to prevent inflation, the increase in the general level
of prices. Inflation occurs when the supply of money increases (in other words: the product demand
increases). When the government tries to intervene in the economic situation by printing (too much)
money, inflation could turn into hyperinflation and as a result a hefty sum of 1 million dollars could
very well be worth less than a penny.
Central banking is not always the solution to prevent a specific economic situation
The Fed's (Federal Reserve) main task is to combat recessions. This central bank of the United States
has multiple options to fulfil its task. Sometimes the Fed cannot do anything to prevent a recession
due to a lag between the decision of the Fed and the results of its decision.

Overzicht studiestof Principles of Economics and Business 1 2017-2018
6
Chapter 2: The power of trade and comparative advantage
This chapter will focus on the benefits of trade such as the difference of preferences, the division of
knowledge and specialization, and comparative advantages.
Trade and preferences
Trading is all about preferences. A teenager has other preferences than an adult. This difference is
also seen in markets. The willingness to pay for a certain product can be higher for a teenager than
for an adult. For example, the teenager would pay $100 for a skateboard, while the adult does not
even want it. If the adult still has his skateboard he can sell this skateboard to the teenager: he
probably does not use the skateboard anymore. The adult would probably set his price under the
average price of $50. The teenager, as well as the adult has a 'profit' (later on it would be called
consumer and producer surplus) of $50. We say that value has been created.
Specialization, productivity, and the division of knowledge
Specialization however, vastly increases productivity, which increases trade and also creates value on
a bigger scale because specialization makes it possible to master the production of a certain good
(the specialized workers have no other job then making that certain product, so they will be better at
producing it than someone who also produces another product).
Comparative advantages
Every country in the world has its comparative advantages, the ability to produce goods or services
at a relatively lower price than other trade partners. It is possible that the trade partners produce
that specific good at an absolute lower price, but they might have higher opportunity costs, the
benefit of an action that is given up in exchange for another action. Because of these comparative
advantages, every country can make a profit out of trading, even though a country is able to produce
everything at a lower absolute price.
The production possibility frontier
Imagine a country that produces peanut butter and jelly. The graph of the Production Possibility
Frontier (PPF), the possibilities of production without trade, is as follows:
Source: Don Sillers, 4th of July 2017

Overzicht studiestof Principles of Economics and Business 1 2017-2018
7
Without trade, there cannot be produced more than these options, and it also shows the production
capacity (100 units of peanut butter or 300 units of jelly, or any combination of these two). The total
labour force of this country is equal to 100 units. So, producing 300 units of jelly requires 100 labour
units. Country B also produces peanut butter and jelly with a labour force of 50 units. They can
produce 200 jelly units or 200 peanut butter units.
Even though country B has absolute advantages, there will still be a profit for both when they decide
to trade. Country A will specialize in jelly. Country B will specialize most of its units in peanut butter.
Now trades can be made: country A trades e.g. 200 units of jelly for 100 units of peanut butter.
Both are better off, and value has been created: country A has 100 units of peanut butter and 200
units of jelly, which is outside of its PPF. Also, country B has profited: he traded 100 units for 200 (for
him the products were produced with the same labour force!).
Imagining that total production is equal to total income (because it is the value that we create), you
can also bring wages to the surface.
Trade and globalization
Not everybody profits from trade. There will always be goods with a decreased demand because of
trades. For example, the peanut butter in country A. The producers of peanut butter in this country
have lost their jobs. It is because trade increases the level of globalization. The world is getting
smaller and as a result, multinationals will be settling all around the globe to make as much profit as
possible.

Overzicht studiestof Principles of Economics and Business 1 2017-2018
8
Chapter 3: Supply and demand
This chapter focuses on the decision of the best feasible option with regards to trade. This is done by
using the cost-benefit analysis.
Two kinds of optimization: a matter of focus
The first principle of economics is that according to economists, people tend to make most of their
choices by selecting the best feasible option. That is, people tend to optimize. It is assumed by
economists that people don’t always successfully optimize, but they do try. Thus, one could say that
people aren’t perfect optimizers because this would be quite complex.
We will now look at an example that will be used throughout the chapter. Consider that you have to
choose an apartment. There are large cities and a great number of rental apartments, and all
apartments have their own characteristics that need to be taken into account, like location and
views. Trade-offs are important in this situation and how one can optimally evaluate suck trade-offs
will be discussed.
There are two techniques of cost-benefit analysis that can be used for optimization.
• Optimization in levels: This analysis is based on the total net benefit of different alternatives.
The best alternative will be chosen;
• Optimization in differences: This analysis is based on the change in net benefits in the case
one switches from one alternative to the other. The marginal comparisons are used in order
to choose the best alternative.
Regardless of which technique is being used, the outcome should be the same. Suppose we have two
slightly different bags full of Halloween candy (only one candy differs in the second bag from the first
bag). According to the optimization in levels technique, we should choose the bag that offers us the
greatest total enjoyment (the best benefit). We analysed both bags in isolation. Now we look at
optimization in differences. We can take the two bags of candy and reorder the candy. Since all the
candy in the bags is the same except for one candy, it is straightforward that we take a look at those
two candy bars. You will choose the bag that has the one that gives you the highest value of the two
candy bars. Here we made our choice on the basis of differences between the two bags. This second
technique is often faster and easier to use.
Do people really optimize?
Previous research showed that optimization is a good model of economic behavior in most
situations, but not in all. Behavioural economics identifies the economic and psychological factors
that explain human behaviour, so this identifies certain situations in which people fail to optimize.
People tend to fail when they have self-control problems or when they have to carry out a new task.
On the other hand, people tend to perform well on optimization when they have a lot of experience.

Overzicht studiestof Principles of Economics and Business 1 2017-2018
9
Optimization in levels
We return to the example about renting an apartment. We will omit factors like how long it takes to
walk to the neighbours or whether there is a park nearby for simplicity reasons. However, in practice
they are important. We also assume the benefits of each apartment are the same, which makes it
easier to compute a cost-benefit analysis as we only have to look for the alternative with the lowest
cost. The search for an apartment has been narrowed to four apartments:
Apartment Commuting time (hours per month) Rent ($ per month)
Very close 5 hours $1,180
Close 10 hours $1,090
Far 15 hours $1,030
Very far 20 hours $1,000
Now we need to sum up the costs for every apartment to find which one is the best to rent. The total
cost consists of the direct costs of rent and the indirect cost of commute time. The commuting time
and the rent has to be in a common unit of account, for example in dollars per month. The rent is
already given in dollars per month, so we only need to convert commuting time.
We assume the opportunity cost of commuting time is equal to $10 per hour. Opportunity costs
refer to a benefit that a person could have received, but gave up, to take another course of action. In
this case, the time spent on commuting cannot be spent on an alternative activity. Suppose the total
commute takes 20 hours every month and the opportunity cost of time is still $10 per hour. The
dollar cost of that commute can then be calculated as follows:

Overzicht studiestof Principles of Economics and Business 1 2017-2018
10
We can now compute the commuting time for the four apartments by using the same calculations as
above but then with different hours per month of commuting time.
Apartment Commuting time (hours
per month)
Commuting
cost
($ per month)
Rent
($ per
month)
Total cost: Rent +
commuting ($ per month)
Very close 5 hours $50 $1,180 $1,230
Close 10 hours $100 $1,090 $1,190
Far 15 hours $150 $1,030 $1,180
Very far 20 hours $200 $1,000 $1,200
The ‘total cost’ column can be calculated by adding together the commuting cost per month and the
rent per month. Apartment ‘Far’ seems to be the best choice as this apartment has the lowest total
cost. This best feasible choice between apartments is the optimum, in other words, it is the best
optimal choice.
So far, optimization in levels involves taking three steps:
• Translate all costs and benefits into common units, like dollars per month;
• Calculate the total net benefit of each alternative;
• Pick the alternative with the highest net benefit.
Comparative statics
Economic models predict how the choices of people change when something in the environment
changes. Comparative statics is the comparison of economic outcomes before and after some
economic variable is changed. We will now conduct a comparative statics analysis for our apartment
example, as we want to see what happened when the opportunity cost of time is changed.

Overzicht studiestof Principles of Economics and Business 1 2017-2018
11
Suppose the opportunity cost of time is now $15 per hour instead of $10 per hour. This amount can
rise when one’s hourly wage would rise, for example. We make the same calculations as in the
previous table, but now we use $15 opportunity cost per hour.
Apartment Commuting time (hours
per month)
Commuting
cost
($ per month)
Rent
($ per
month)
Total cost: Rent +
commuting ($ per month)
Very close 5 hours $75 $1,180 $1,255
Close 10 hours $150 $1,090 $1,240
Far 15 hours $225 $1,030 $1,255
Very far 20 hours $300 $1,000 $1,300
Apartment ‘Close’ is now the best choice. This makes sense because when the opportunity cost of
time increases, it becomes more valuable for the commuter to choose an apartment that reduces the
amount of time spent commuting, thus the apartment that is closest to his\her job in the city center.
Source: Modern principles of Economics, Cowen, T. & Tabarrok, A., p. 81
The purple line in the figure above represents the total cost curve for the commuter with an
opportunity cost of $10 per hour and the orange line for an opportunity cost of $15 per hour. There
are two important properties visible in the figure:
1. The total cost curve with opportunity cost of $10 per hour lies below the total cost curve of $15 per
hour, for every apartment;
2. The optimal apartment switches from ‘Far’ to ‘Close’ as the opportunity cost of time rises from $10
per hour to $15 per hour.

Overzicht studiestof Principles of Economics and Business 1 2017-2018
12
Optimization in differences: marginal analysis
Optimization in differences breaks an optimization problem down by looking at how costs and
benefit change when one moves hypothetically from one alternative to the other.
Economists use the word marginal to point out differences between alternatives. This difference
usuallrepresents one ‘step’ or ‘unit’ more. A marginal analysis is a cost-benefit calculation that
focuses on the difference between a feasible alternative and the next feasible alternative. The costs
and benefits are compared. Using marginal analysis will never change the final outcome of which (in
our example) apartment is best, but it does change the way we think about optimizing in comparison
to optimization in levels where we compared apartment by looking at the total costs.
Marginal cost
We assume once again that the opportunity cost if time is $10 per hour and we will focus on what
will change as we hypothetically ‘move’ from one apartment to another. The commuting cost in the
table below is calculated the same way as before. The ‘Marginal commuting cost’ column shows that
value of the extra monthly commuting that is created when one moves from one apartment to
another further away from the cite centre.
For ‘Close’, the marginal commuting cost can be calculated by $200 – $150 = $50 and the marginal
rent cost can be calculated by $1,000 – $1,030 = –$30.
Apartment Commuting
cost
Marginal
commuting cost
Rent
cost
Marginal
rent cost
Total
cost
Marginal
total cost
Very close $50 $1,180 $1,230
$50 –$90 –$40
Close $100 $1,090 $1,190
$50 –$60 –$10
Far $150 $1,030 $1,180
$50 –$30 $20
Very far $200 $1,000 $1,200
In general, the marginal cost is the extra cost that is generated by moving from one feasible
alternative to another feasible alternative.

Overzicht studiestof Principles of Economics and Business 1 2017-2018
13
The marginal total cost is calculated by $50 – $90 = –$40, when we look at ‘Very close’. There are two
methods to get to the value of –$40, which will always give the exact same results:
Marginal commuting cost + marginal rent cost = $50 + –$90 = –$40
Total cost of Close – total cost of Very close = $1.190 – $1.230 = –$40
We can use the last column in the table above for optimization. The first move, when we move from
‘Very close’ to ‘Close’, has a marginal cost of –$40 per month. This move is thus reducing costs, so it
is worth taking it. The second move has a marginal cost of –$10 which is thus also worth taking. The
move from ‘Far’ to ‘Very far’ gives us $20 extra costs so we will not be taking this step. We can
therefore conclude that ‘Far’ is the optimum, the best feasible choice.
This example illustrates the principle of optimization at the margin, which states that an optimal
feasible alternative has the property that moving to another alternative makes you better off and
moving away to another alternative makes you worse off. The graph below shows the total costs and
the marginal costs for every apartment. Optimization can be found at the lowest point in the graph
(thus ‘Far’), representing the lowest total cost.
Source: Modern principles of Economics, Cowen, T. & Tabarrok, A., p. 84
To sum up, there are three steps that need to be taken for optimization in differences (also known as
optimization at the margin):
1. Translate all the costs and benefits into common units, like dollars per month (the same as in
optimization in levels);
2. Calculate the marginal consequences when you move from one alternative to another;
3. Apply the principle of optimization at the margin by choosing the best alternative with the
property that moving to it makes you better off and moving away from it makes you worse
off.

Overzicht studiestof Principles of Economics and Business 1 2017-2018
14
Chapter 4: How supply and demand determine prices
This chapter focuses on how buyers and sellers respond to changes of the price of a good or service.
Markets
A market is a group of economic agents who are trading a good or service, and the rules and
arrangements for trading. A market can have a specific location, but this is not necessary. When we
look at the dispersed market for gasoline, we see that there is a gas station on every corner.
We will see how markets use prices to allocate goods and services. Prices act as a device that selects
the sellers who can produce goods at the lowest costs and the buyers who have a particular value to
the goods.
Competitive markets
When all sellers and buyers deal with the same price, this price is known as the market price. The
features of a perfectly competitive market are the following:
• All sellers sell an identical good or service;
• Any individual buyer or seller does not have enough power individually to affect the market
price.
We can thus say that in a perfectly competitive market, everyone accepts the market price, and no
one can bargain to get a better price. These kinds of markets are very rare, if they even exist. Many
markets are nearly perfectly competitive though (like the markets for gasoline), which is why they
are very interesting.
How do buyers behave?
We make the assumption that buyers are price-takers. This means that they take the price of a
product or service as a given and treats it as a take-it-or-leave-it offer. The quantity demanded is the
amount of a good that buyers are willing to purchase at a given price. When we look at the gasoline
market, we might expect that consumers will buy less gasoline when the price for gasoline increases.
The table underneath represents the quantity Sue and Carlos demand at different prices for gasoline,
holding all else equal. This table is called a demand schedule. ‘Holding all else equal’ implies that
everything else in the economy is held constant, except for the price of gasoline.
Source: Modern principles of Economics, Cowen, T. & Tabarrok, A., p. 98

“I WANT HIGHER GRADES”
“I WANT TO BE BETTER PREPARED FOR
MY EXAMS”
P R O F E S S I O N A L ST U DY S U P P O RT W W W.C A P I TA S E L E C TA . N L
“THIS YEAR I WANT TO OBTAIN ALL MY CREDITS”

Order your summaries for all lectures and literature on www.slimstuderen.nl
Is your university or study not available? Let us know by sending an email to [email protected]
Because you already have a lot to do!
Overzicht studiestof Principles of Economics and Business 1 2017-2018
15
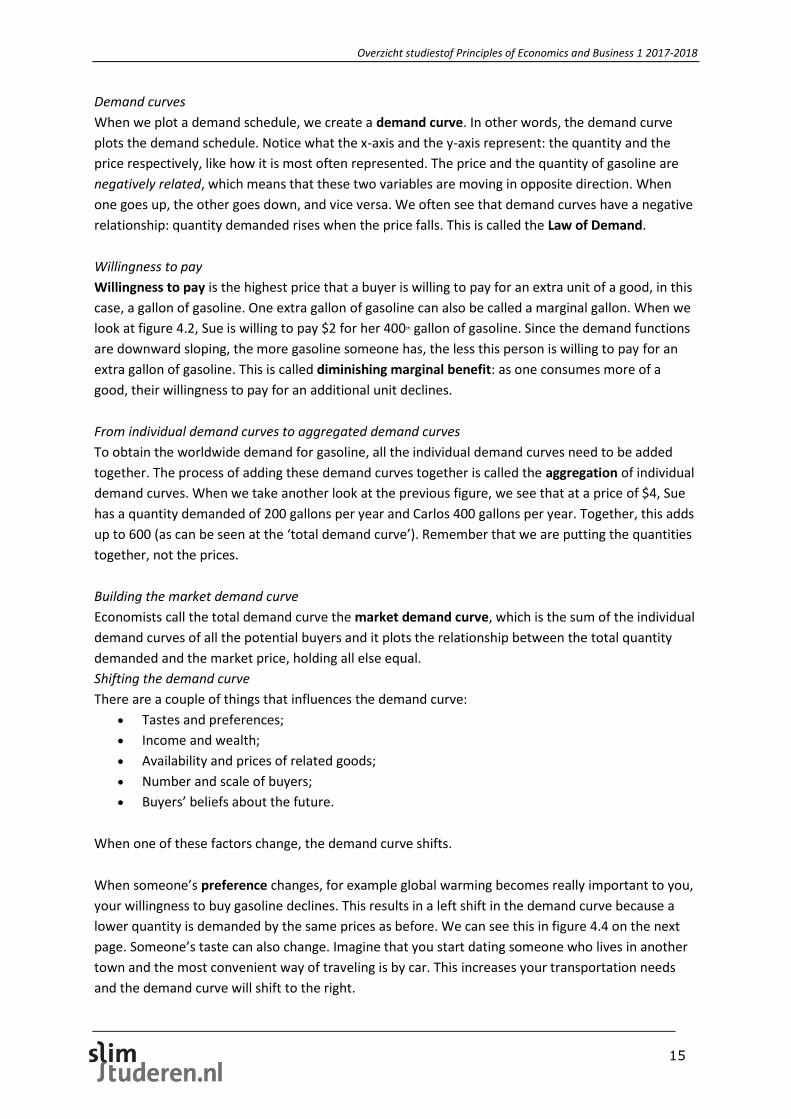
Demand curves
When we plot a demand schedule, we create a demand curve. In other words, the demand curve
plots the demand schedule. Notice what the x-axis and the y-axis represent: the quantity and the
price respectively, like how it is most often represented. The price and the quantity of gasoline are
negatively related, which means that these two variables are moving in opposite direction. When
one goes up, the other goes down, and vice versa. We often see that demand curves have a negative
relationship: quantity demanded rises when the price falls. This is called the Law of Demand.
Willingness to pay
Willingness to pay is the highest price that a buyer is willing to pay for an extra unit of a good, in this
case, a gallon of gasoline. One extra gallon of gasoline can also be called a marginal gallon. When we
look at figure 4.2, Sue is willing to pay $2 for her 400th gallon of gasoline. Since the demand functions
are downward sloping, the more gasoline someone has, the less this person is willing to pay for an
extra gallon of gasoline. This is called diminishing marginal benefit: as one consumes more of a
good, their willingness to pay for an additional unit declines.
From individual demand curves to aggregated demand curves
To obtain the worldwide demand for gasoline, all the individual demand curves need to be added
together. The process of adding these demand curves together is called the aggregation of individual
demand curves. When we take another look at the previous figure, we see that at a price of $4, Sue
has a quantity demanded of 200 gallons per year and Carlos 400 gallons per year. Together, this adds
up to 600 (as can be seen at the ‘total demand curve’). Remember that we are putting the quantities
together, not the prices.
Building the market demand curve
Economists call the total demand curve the market demand curve, which is the sum of the individual
demand curves of all the potential buyers and it plots the relationship between the total quantity
demanded and the market price, holding all else equal.
Shifting the demand curve
There are a couple of things that influences the demand curve:
• Tastes and preferences;
• Income and wealth;
• Availability and prices of related goods;
• Number and scale of buyers;
• Buyers’ beliefs about the future.
When one of these factors change, the demand curve shifts.
When someone’s preference changes, for example global warming becomes really important to you,
your willingness to buy gasoline declines. This results in a left shift in the demand curve because a
lower quantity is demanded by the same prices as before. We can see this in figure 4.4 on the next
page. Someone’s taste can also change. Imagine that you start dating someone who lives in another
town and the most convenient way of traveling is by car. This increases your transportation needs
and the demand curve will shift to the right.

Overzicht studiestof Principles of Economics and Business 1 2017-2018
16
Important to remember:
• The demand curve shifts only when the quantity demanded changes at a given price level;
• If the price of a good changes and its demand curve has not shifted, a movement along the
demand curve will be the result.
Source: Modern principles of Economics, Cowen, T. & Tabarrok, A., p. 100
When someone gets a higher income, he or she will be able to buy more/more expensive goods,
resulting in a higher willingness to buy gasoline for example. When we talk about a normal good, an
increase in income will cause the demand curve to shift to the right. But consider a product like
Spam, which is canned, precooked meat. When one’s income rises, they will buy less of these
products. This is called an inferior good, as rising incomes shifts the demand curve to the left.
When a city decides to lower the price of public transportation, there might be more people using
public transportation instead of their own cars. This results in a shift to the left in the demand curve
for gasoline. Public transportation and gasoline are substitutes, the fall in the price of one leads to a
left shift in the demand curve of the other. On the other hand, imagine lift ticket prices in a ski resort
decreases. This leads to more visitors and to a higher demand curve for gas. These goods are
complements, the fall in the price of one leads to a right shift in the demand curve for the other.
The demand curve shifts to the right when the total number of buyers increases, and the opposite
happens when the number of buyers decreases.
Imagine that your neighbours are losing their jobs at the beginning of an economy-wide slowdown.
This might cause others to get worried and start to cut their spending back. This results in a left shift
of the demand curve for gasoline.
How do sellers behave?
Quantity supplied is the amount of a good or service that sellers are willing to sell at a given price.
When the price of gasoline increases, suppliers increase their willingness to supply gasoline as they
can make a bigger profit.

Overzicht studiestof Principles of Economics and Business 1 2017-2018
17
Supply curves
A supply curve is a table that reports the quantity supplied at different prices, holding all else equal.
An example of a supply curve is given in the figure given on the next page. In contradiction to
demand curves, are supply curves upward sloping. The price of gasoline and the quantity supplied
are positively related because the two variables move in the same direction. The quantity supplied,
and the prices are almost always positively related, which is called the Law of Supply.
Source: Modern principles of Economics, Cowen, T. & Tabarrok, A., p. 103
Willingness to accept
When we look at figure above, we see that ExxonMobil’s is willing to accept $100 to produce its 1.5
billionth barrel of oil. This is exactly what the supply curve tells us, which is called the willingness to
accept. It is the lowest price that a seller is willing to get paid to sell an extra unit of a good.
Willingness to accept is the same as the marginal cost of production.
From the individual supply curve to the market supply curve
This works the same as we did when we added up the quantity demanded. When we add up the
quantity supplied, we create the market supply curve. This is the sum of the individual supply curves
of all the potential sellers. It plots the relationship between the total quantity supplied and the
market price, holding all else equal.
At a price of $100, the quantity supplied by Chevron is 1 billion barrels and the quantity supplied by
ExxonMobil is 1.5 billion barrels. Together they add up to 2.5 billion barrels, which can be seen when
we look at the total supply curve if we have a price of $100.

Overzicht studiestof Principles of Economics and Business 1 2017-2018
18
Shifting the supply curve
There are four major variables that influence the supply curve:
• Prices of inputs used to product the good;
• Technology used to produce the good;
• Number and scale of sellers;
• Seller’s beliefs about the future.
An input is a good or service used to produce another good or service. When the prices of inputs
increase, some products might not be profitable to produce anymore. This results a shift to the left of
the supply curve.
Again, important to remember:
• The supply curve shifts only when the quantity supplied changes at a given price;
• If a good’s own price changes and its supply curve did not shift, a movement along the
supply curve will be the result.
When an innovation causes the production of a good to be cheaper, the supply curve will shift to the
right.
If there are fewer suppliers in a particular industry, the supply curve shifts to the left.
The demand for natural gas during winters is very high, as natural gas is used for home heating.
Natural gas producers use much of their summer natural gas production as a supply for the winter.
This creates a shift of the supply curve to the left in the summer.
Supply and demand in equilibrium
A competitive market is a market that is perfectly competitive. In these markets, a price will be
formed right where the quantity supplied, and quantity demanded are the same. To find this point,
we need to put the demand curve and the supply curve in one graph.
Source: Modern principles of Economics, Cowen, T. & Tabarrok, A., p. 108

Overzicht studiestof Principles of Economics and Business 1 2017-2018
19
The competitive equilibrium is the crossing point of the supply curve and the demand curve. The
competitive equilibrium price equates quantity supplied and quantity demanded and amounts $100
in this example. The competitive equilibrium quantity is the quantity that corresponds to the
competitive equilibrium price. In this case, this is at 35 billion barrels.
The figure above illustrates a market that is not in equilibrium because the price is at $140 instead of
at $100. Since the market price is above the competitive equilibrium price, there is more quantity
supplied than quantity demanded. So, we have excess supply in this situation. When the price would
be $60, we have the opposite situation: there is more quantity demanded than quantity supplied,
creating excess demand.
Curve shifting in competitive equilibrium
Suppose a very big oil exporter suddenly stopped producing oil. This leads to a shift of the supply
curve to the left (step 1), as can be seen in the figure on the next page. Oil has now become scarcer
and as a result, the price of oil needs to increase (step 2). We can also see that the price has
increased because the new intersection of the two curves lies at a higher price level and at a lower
quantity level.
Source: Modern principles of Economics, Cowen, T. & Tabarrok, A., p. 109
It might also be the case that both curves will shift, depending on the situation, creating a new
equilibrium quantity and equilibrium price.
What would happen if the government tried to dictate the price of gasoline?
We have seen that in competitive markets, the outcome will be the competitive equilibrium, but only
as long as prices are allowed to respond to situations. Laws, regulations or social norms, however,
restrict some markets. In these cases, the price or quantity cannot take on every value.

Overzicht studiestof Principles of Economics and Business 1 2017-2018
20
For example, the US government had capped the price of gasoline during the oil crisis of 1973-74.
This means that quantity demanded exceeds quantity supplied, creating excess demand. Long lines
were created at gasoline stations and the stations frequently ran out of gasoline. Consumers tried to
find a way beyond the rules to get more gasoline because, for example, they did not have enough to
go to their work every day.

Overzicht studiestof Principles of Economics and Business 1 2017-2018
21
Definitions
Differentiation Complexity.
Specialization
Opportunity costs
Inflation
Comparative advantages
Opportunity costs
Production Possibility Frontier (PPF)
Comparative statics
Marginal analysis
Principle of optimization at the margin
Market
Market price
Perfectly competitive market
Quantity demanded
The process of grouping cooperative labour in
specific tasks.
The value of the opportunities lost.
The increase in the general level of prices.
The ability to produce goods or services at a
relatively lower price than other economic
agents.
The benefit of an action that is given up in
exchange for another action.
The possibilities of production without trade.
The comparison of economic outcomes before
and after some economic variable is changed.
A cost-benefit calculation that focuses on the
difference between a feasible alternative and
the next feasible alternative.
An optimal feasible alternative has the property
that moving to another alternative makes you
better off and moving away to another
alternative makes you worse off.
A group of economic agents who are trading a
good or service, and the rules and arrangements
for trading.
The price that both sellers and buyers have to
follow.
A market in which sellers sell an identical good
or service, and where any individual buyer or
seller has no individual influence on the market
price.
The amount of a good that buyers are willing to
purchase at a given price.

Overzicht studiestof Principles of Economics and Business 1 2017-2018
22
Demand curve
Law of demand
Willingness to pay
Diminishing marginal benefits
Aggregated demand/Market demand curve
Normal good
Inferior good
Substitutes
Complements
Supply curve
Law of supply
Willingness to accept
Aggregated supply/Market supply curve
Input
Competitive equilibrium
Competitive equilibrium price
A graph which shows the quantity demanded at
a different price points.
The quantity demanded rises when the price
falls.
The highest price that a buyer is willing to pay
for an extra unit of a good.
As one consumes more of a good, their
willingness to pay for an additional unit
declines.
All the individual demand curves together.
An increase in income will case the demand
curve to shift to the right.
An increase in income will cause the demand
curve to shift to the left, due to a lower
willingness to pay for the good.
An increase in the price of product A results in
an increase in the demand of product B and vice
versa.
An increase in the price of product A results in a
decrease in the demand of product B.
A graph which shows the quantity supplied at
different price points.
The quantity supplied and the prices are almost
always positively related.
The lowest price that a seller is willing to be paid
to sell an extra unit of a good.
All the individual supply curves together.
Good or services used to produce another good
or service.
The crossing point of the supply curve and the
demand curve.
The given price at the crossing point of supply
and demand.

Overzicht studiestof Principles of Economics and Business 1 2017-2018
23
Competitive equilibrium quantity
Excess supply
Excess demand
The quantity at the crossing point of supply and
demand.
More quantity supplied than quantity
demanded.
More quantity demanded than quantity
supplied.

Overzicht studiestof Principles of Economics and Business 1 2017-2018
24
Practice Questions
1. The following are four of the ten Big Ideas, described in Chapter 1 of Cowen & Tabarrok.
Which of them is least applicable to the theory of Adam Smith?
A. Incentives
B. Power of Trade
C. Institutions matter
D. Thinking on the margin
2. Kind of advantage gained by offering greater value to customers as compared to competitors
is classified as
A. Competitive advantage
B. Corporate advantage
C. Branding advantage
D. Premium advantage
3. When marginal revenue exceeds marginal cost, a firm should produce more.
Yes / No
4. The market demand curve shows…
A. The effect on market supply of a change in the demand for a good or service.
B. The quantity of a good that consumers would like to purchase at different prices.
C. The marginal cost of producing and selling different quantities of a good.
D. The effect of advertising expenditures on the market price of a good.
5. The market supply curve shows…
A. The effect on market demand of a change in the supply of a good or service.
B. The quantity of a good that firms would offer for sale at different prices.
C. The quantity of a good that consumers would be willing to buy at different prices.
D. All of the above are correct.

Overzicht studiestof Principles of Economics and Business 1 2017-2018
25
6. If the price of a good increases while the quantity of the good exchanged on markets
increases, then the most likely explanation is that there has been…
A. An increase in demand.
B. A decrease in demand.
C. An increase in supply.
D. A decrease in supply.

Overzicht studiestof Principles of Economics and Business 1 2017-2018
26
Answers to practice questions
1. C
2. A
3. Yes
4. B
5. B
6. A
Note: more practice questions and explanations to the answers can be found in the complete
summary for Principles of Economics and Business 1!

Overzicht studiestof Principles of Economics and Business 1 2017-2018
27
Epilogue
Yesss you did it! You’ve read the whole summary!
Do you want to be more certain that you will pass your exam? Wait no longer! We also offer online
qualitative exam trainings to completely prepare you for your exams! During an exam training our
professional student-lecturers will explain the course material to you trough exercises and personal
guidance. So do you also want to be optimally prepared for your exams? Then check our websites
www.capitaselecta.nl and www.slimstuderen.nl for the possibilities for your study!
Good luck with your exams and enjoy the student life!
Team SlimStuderen.nl and Capita Selecta
P.S. Do you want to start this academic year with discount on summaries from SlimStuderen.nl and
online courses from CapitaSelecta? When ordering summaries before October 1st 2018 on our
websites, you will receive an extra discount of 15% on your first order with ‘Welcome2018SSCS’
Partners
We work together with different student associations in Amsterdam. For example, if you are a
member of L.A.N.X. you will benefit from discounts on all our products!
With a subscription you will profit of high discounts!
Do you want to receive the summaries as soon as they are available and with a discount? Buy a
subscription and you automatically receive all summaries at your doorstep!
Curious about the subscriptions of our different products (online courses and summaries)? Check
our websites for more information!
Stay in contact with SlimStuderen.nl and Capita Selecta
Do you want to stay in touch with SlimStuderen.nl, are you curious about our online contests or
would you like some additional study tips? Connect with us via:
SlimStuderen.nl
/SlimStuderen
@SlimStuderen.nl
010 214 06 01
06 43 952 716
CapitaSelecta.nl
/CapitaSelectaStudieondersteuning
@CapitaSelecta
010 214 23 94
06 45 34 14 74


P R O F E S S I O N A L ST U DY S U P P O RT W W W.C A P I TA S E L E C TA . N L
SLIMSTUDEREN+
CAPITA SELECTA=
PERFECTPREPARATION