Embed Size (px)
Citation preview

Principles of circular dichroism (CD) and its applications to proteins
José María Delfino [email protected] Departamento de Química Biológica e Instituto de Química y Fisicoquímica Biológicas (IQUIFIB, UBA-CONICET) Facultad de Farmacia y Bioquímica Universidad de Buenos Aires Junín 956, 1113 Buenos Aires, Argentina
April 2016


¿Qué significa conocer la conformación de una proteina?
Definir el conjunto de los ángulos de torsión para cada
aminoácido de una proteína,
esto es, phi/psi/omega y todos los chi (chi1, chi2, etc.) resulta equivalente a
↓ conocer las coordenadas atómicas (x,y,z)
de cada uno de los átomos,
esto es, la información depositada en el banco pdb (www.rcsb.org)
Ejercicio: extraer una estructura del banco pdb y representarla mediante algún
programa de visualización (Pymol, VMD, RasMol o SwissPDBViewer), medir algunos ángulos de torsión característicos
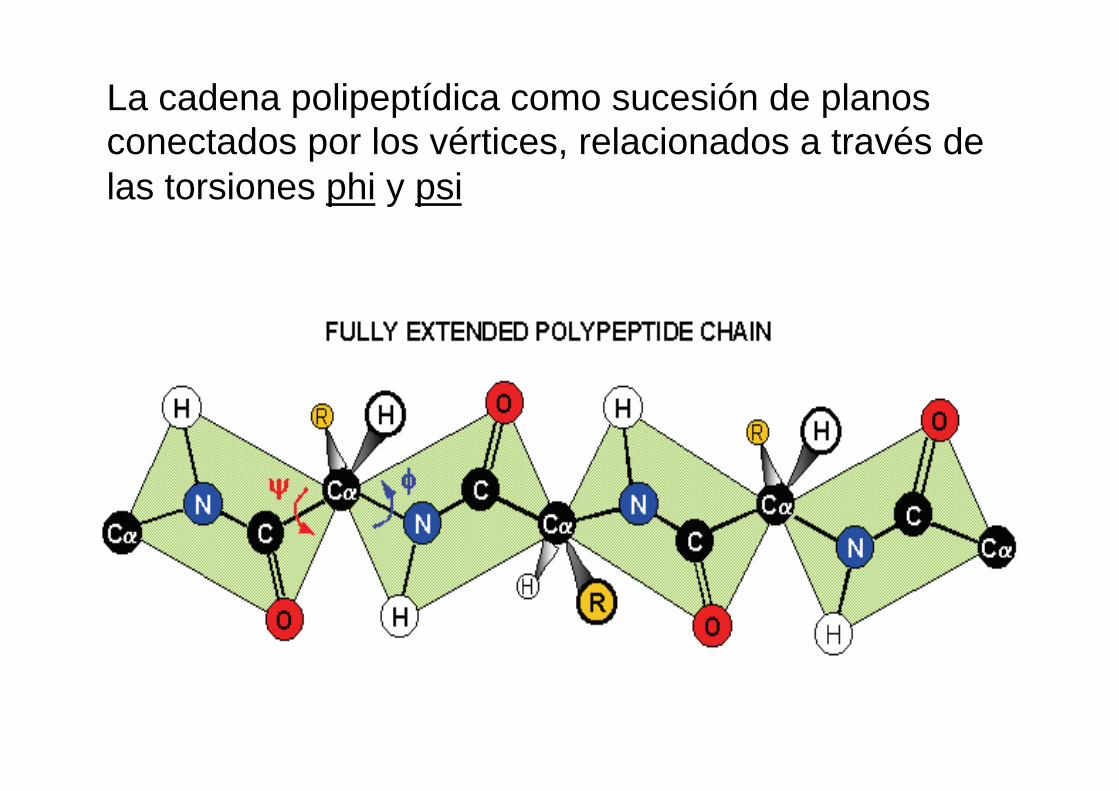
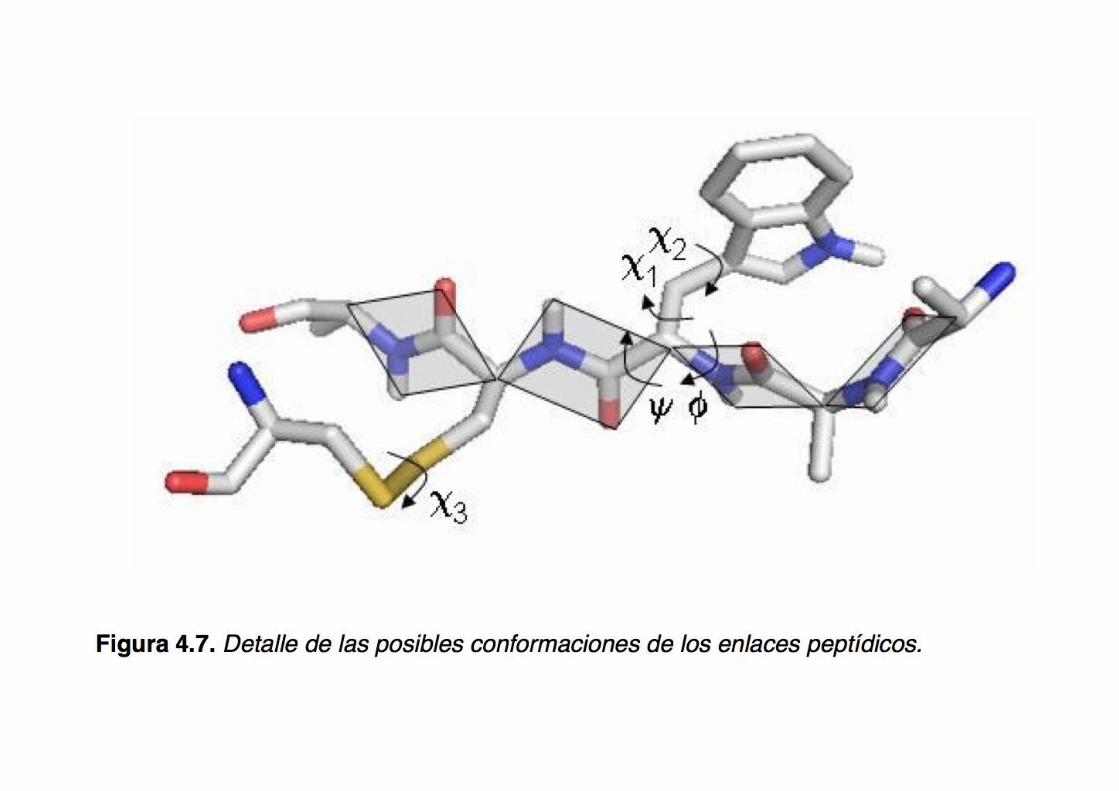
La cadena polipeptídica como sucesión de planos conectados por los vértices, relacionados a través de las torsiones phi y psi
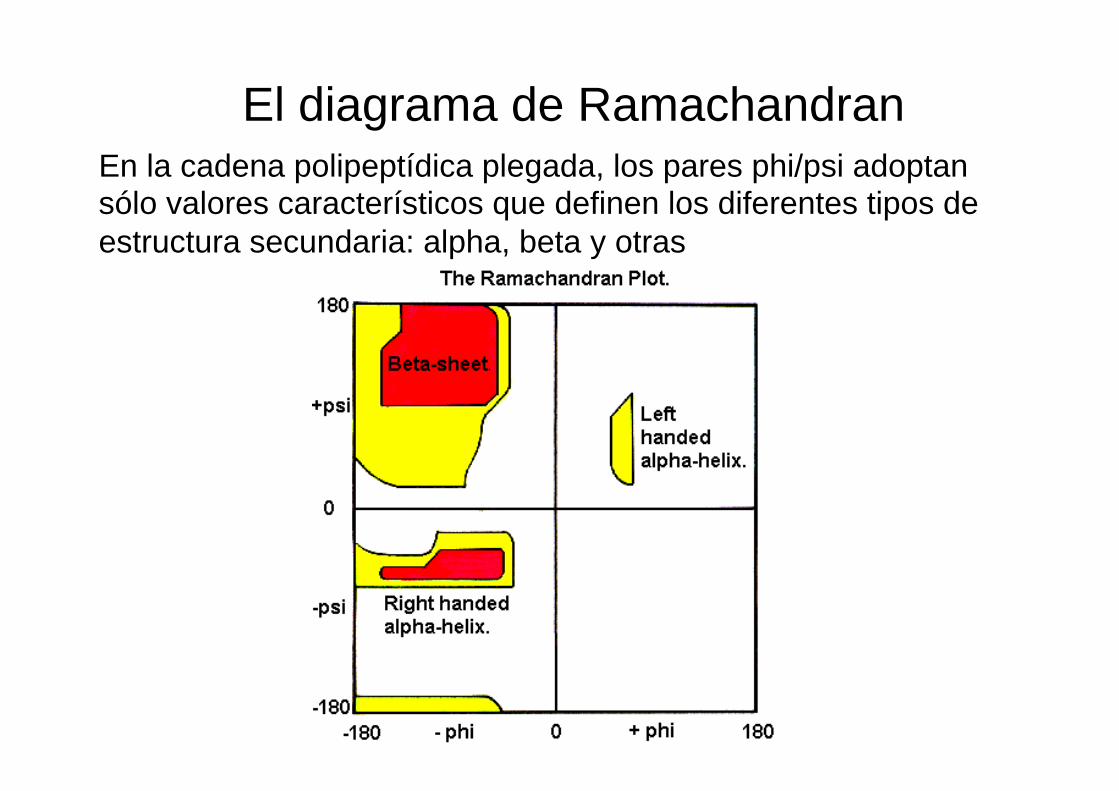
El diagrama de Ramachandran En la cadena polipeptídica plegada, los pares phi/psi adoptan sólo valores característicos que definen los diferentes tipos de estructura secundaria: alpha, beta y otras
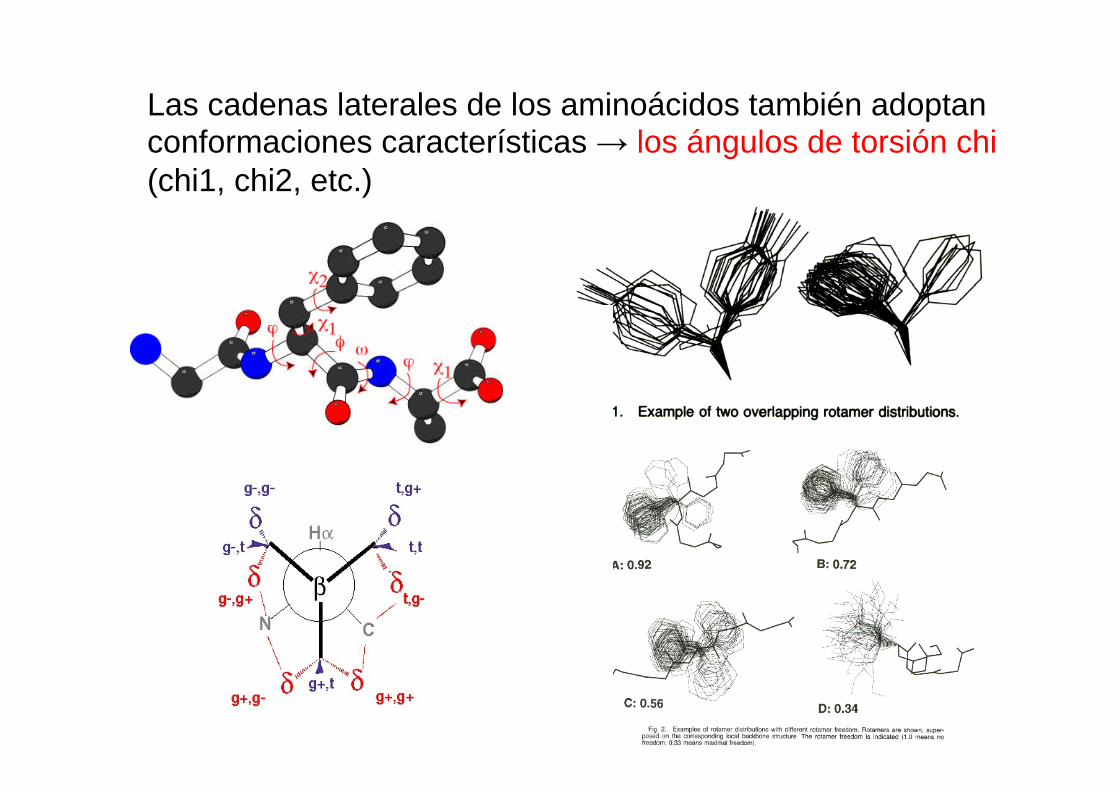
Las cadenas laterales de los aminoácidos también adoptan conformaciones características → los ángulos de torsión chi (chi1, chi2, etc.)
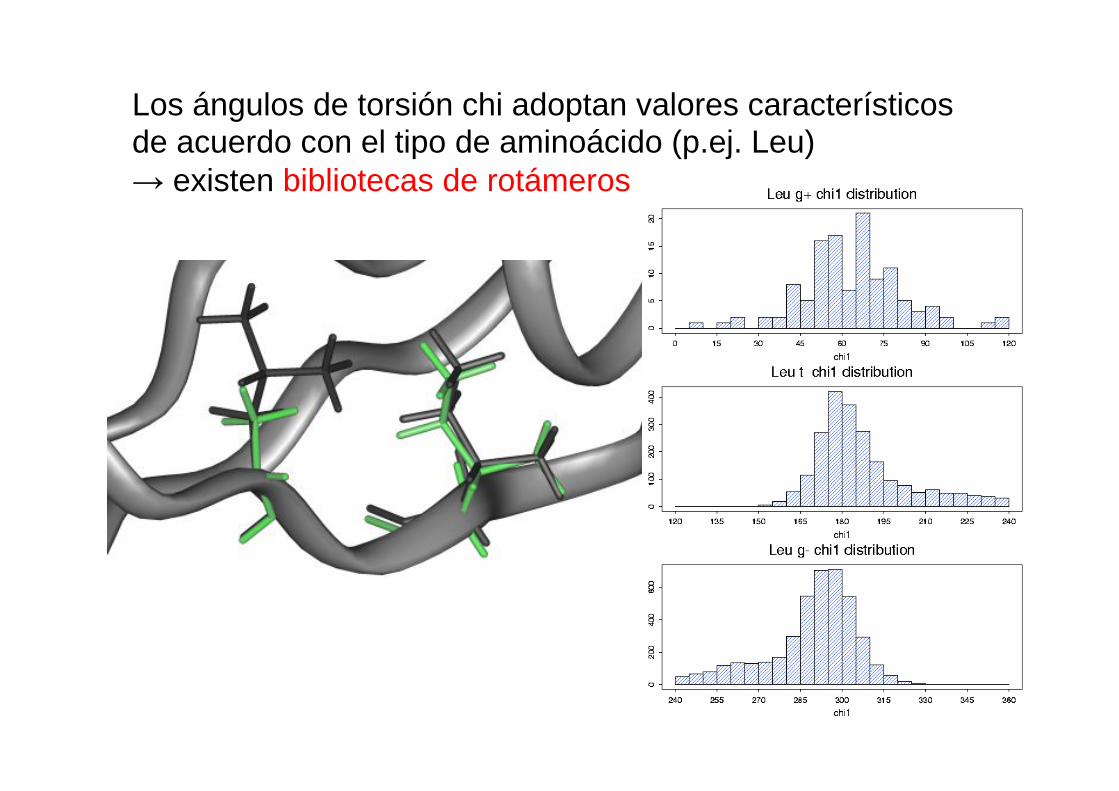
Los ángulos de torsión chi adoptan valores característicos de acuerdo con el tipo de aminoácido (p.ej. Leu) → existen bibliotecas de rotámeros
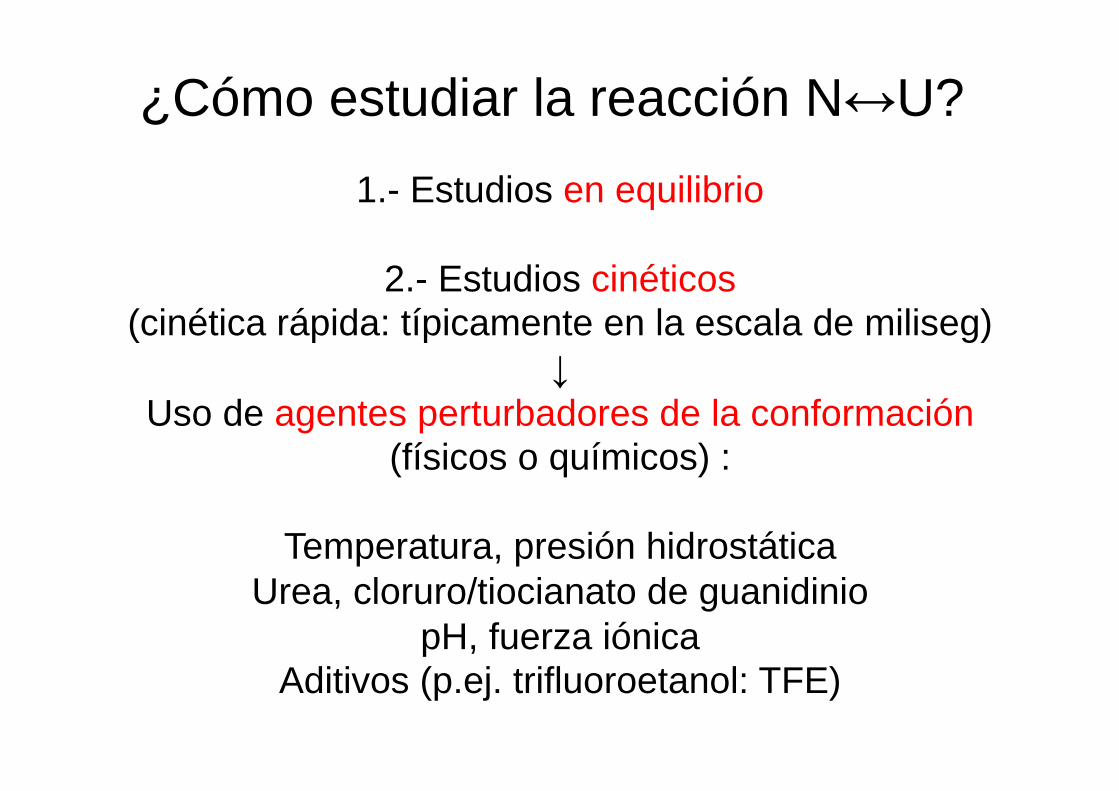
¿Cómo estudiar la reacción N↔U? 1.- Estudios en equilibrio
2.- Estudios cinéticos
(cinética rápida: típicamente en la escala de miliseg) ↓
Uso de agentes perturbadores de la conformación (físicos o químicos) :
Temperatura, presión hidrostática
Urea, cloruro/tiocianato de guanidinio pH, fuerza iónica
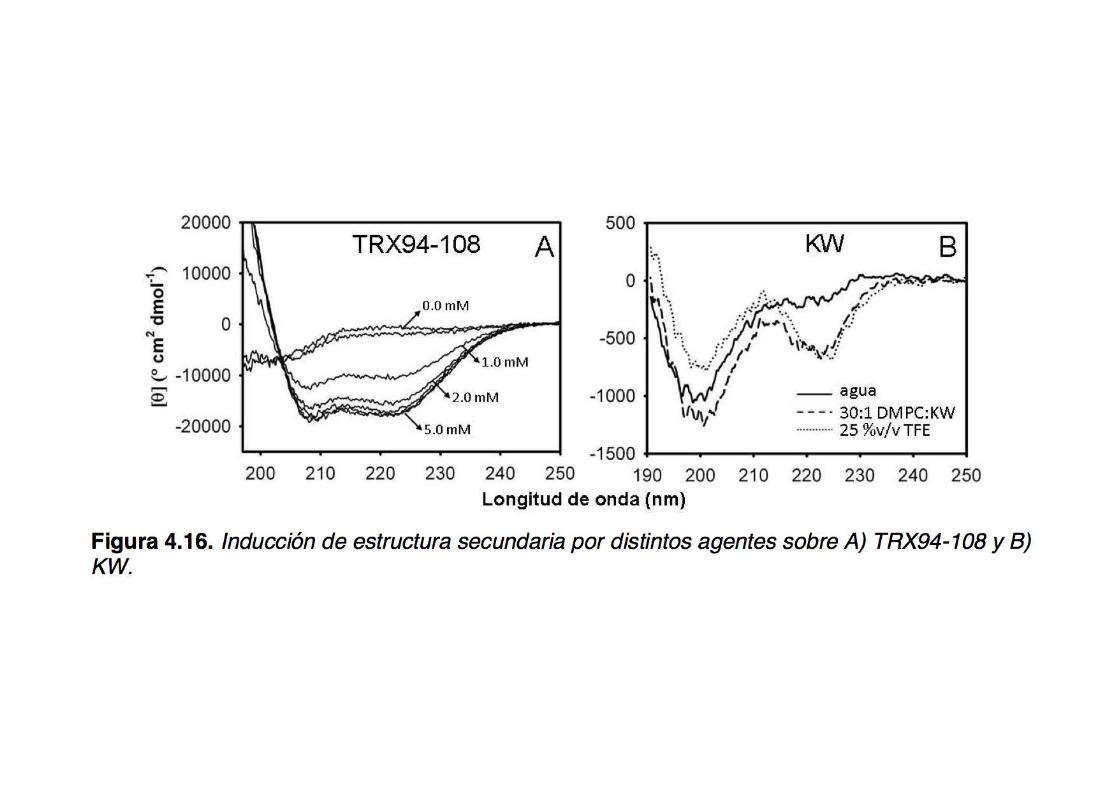
Aditivos (p.ej. trifluoroetanol: TFE)
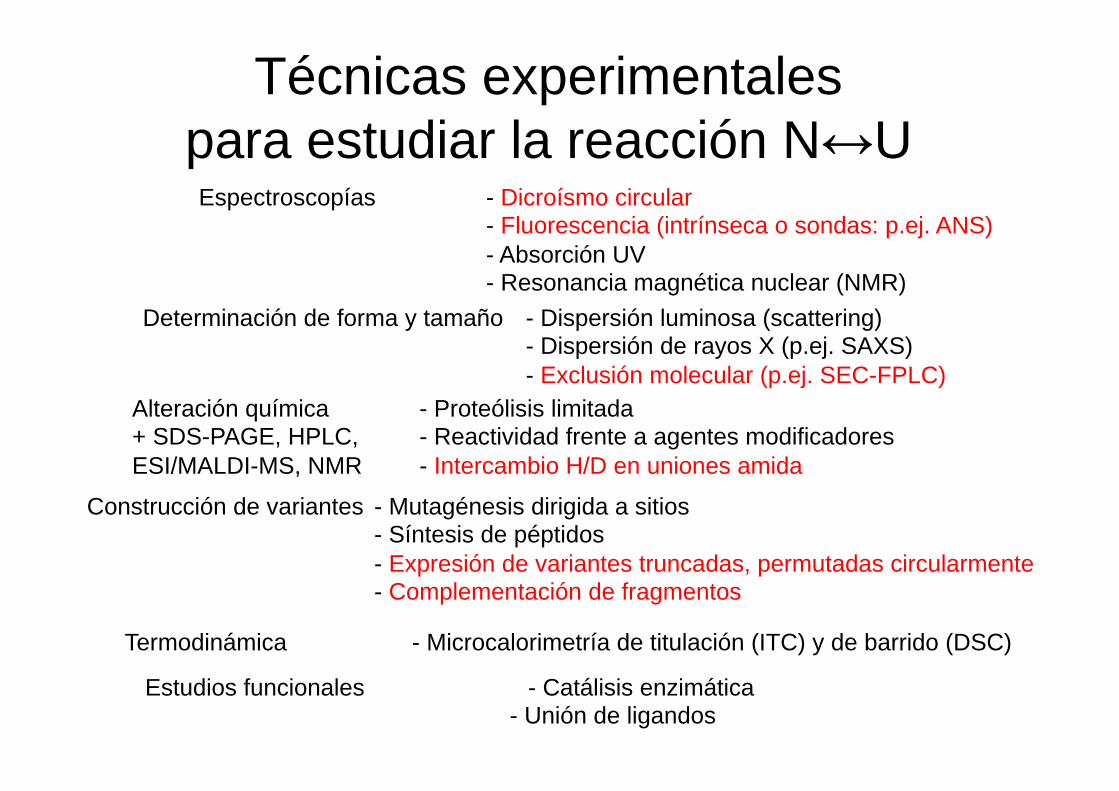
Técnicas experimentales para estudiar la reacción N↔U
Espectroscopías - Dicroísmo circular - Fluorescencia (intrínseca o sondas: p.ej. ANS) - Absorción UV
- Resonancia magnética nuclear (NMR) Determinación de forma y tamaño - Dispersión luminosa (scattering)
- Dispersión de rayos X (p.ej. SAXS) - Exclusión molecular (p.ej. SEC-FPLC)
Alteración química - Proteólisis limitada + SDS-PAGE, HPLC, - Reactividad frente a agentes modificadores ESI/MALDI-MS, NMR - Intercambio H/D en uniones amida
Construcción de variantes - Mutagénesis dirigida a sitios - Síntesis de péptidos
- Expresión de variantes truncadas, permutadas circularmente - Complementación de fragmentos
Termodinámica - Microcalorimetría de titulación (ITC) y de barrido (DSC)
Estudios funcionales - Catálisis enzimática - Unión de ligandos
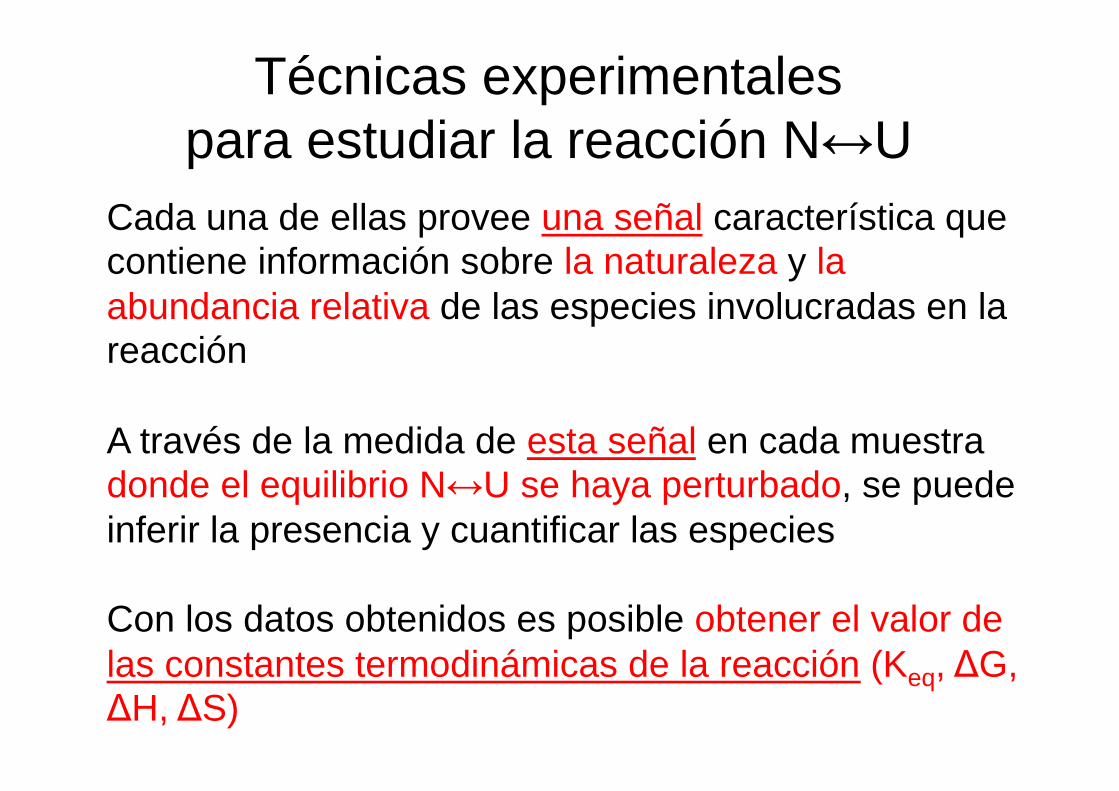
Técnicas experimentales para estudiar la reacción N↔U
Cada una de ellas provee una señal característica que contiene información sobre la naturaleza y la abundancia relativa de las especies involucradas en la reacción A través de la medida de esta señal en cada muestra donde el equilibrio N↔U se haya perturbado, se puede inferir la presencia y cuantificar las especies Con los datos obtenidos es posible obtener el valor de las constantes termodinámicas de la reacción (Keq, ΔG, ΔH, ΔS)
The context where CD becomes a useful tool
in biochemistry
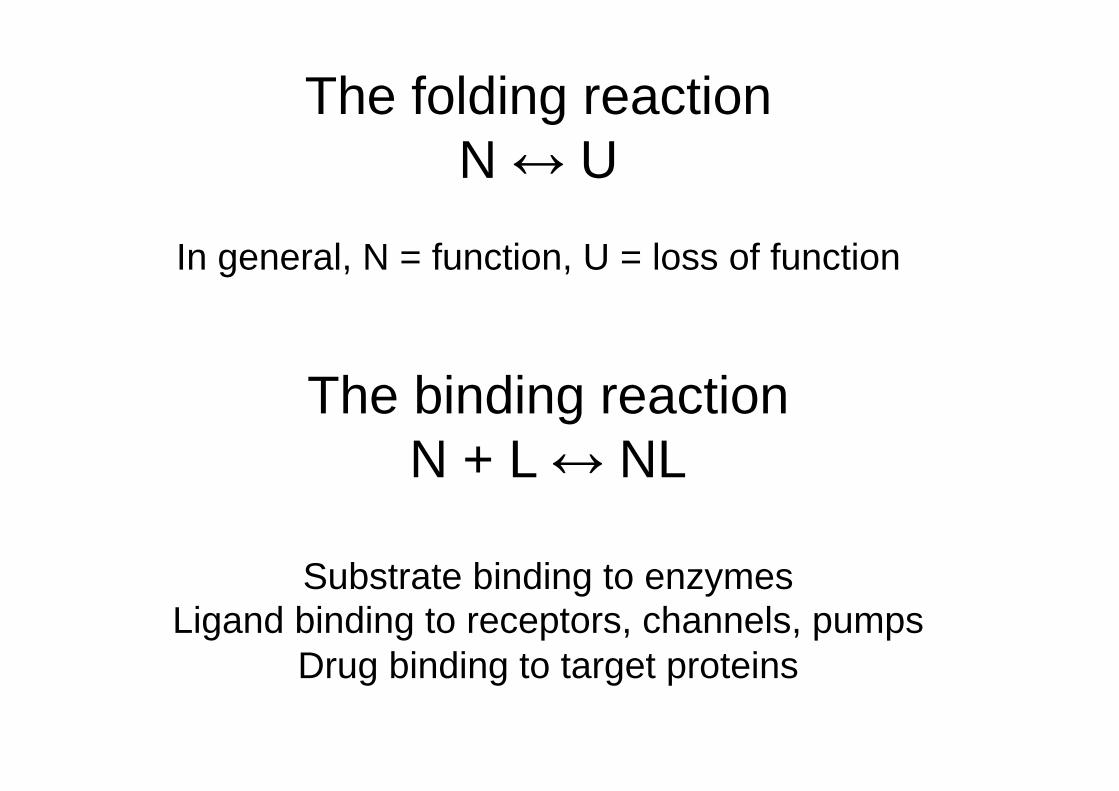
The folding reaction N ↔ U
In general, N = function, U = loss of function
The binding reaction N + L ↔ NL
Substrate binding to enzymes
Ligand binding to receptors, channels, pumps Drug binding to target proteins

An intuitive approach to understand the nature
of polarized light and its interaction with matter
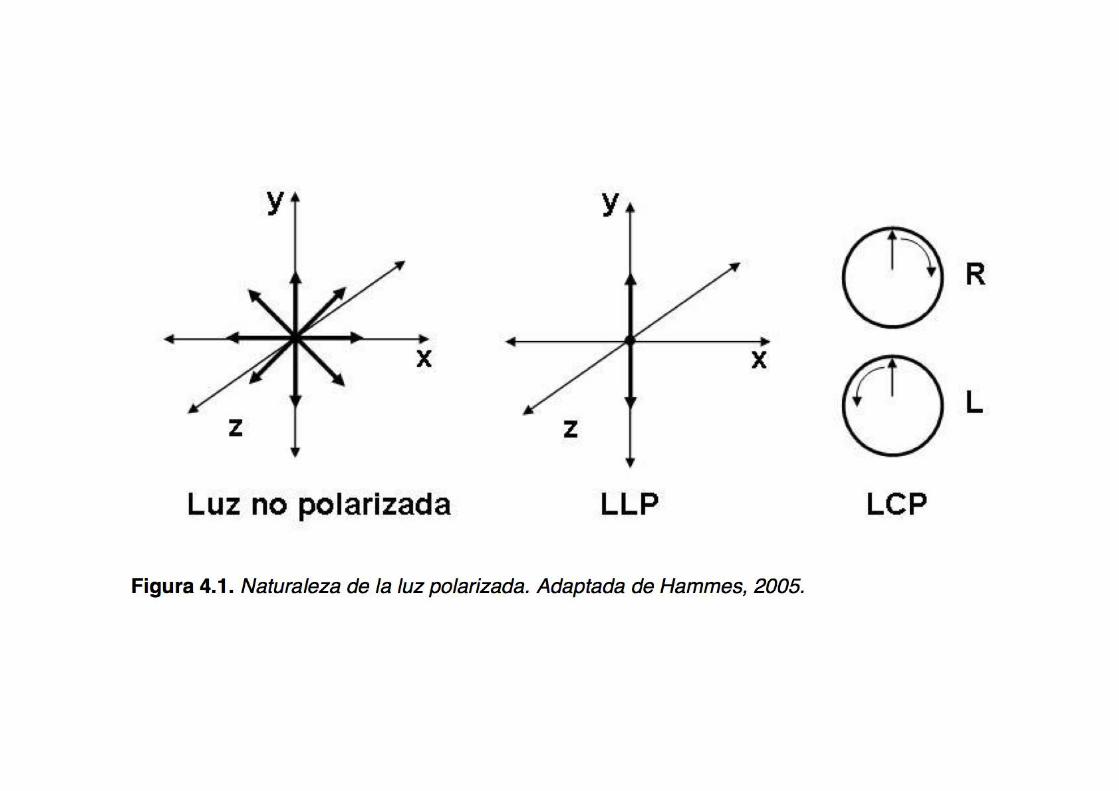
The nature of polarized light

What is optical rotatory dispersion (ORD)?
α (Ó Φ)
α=[α]cl
nL≠nR
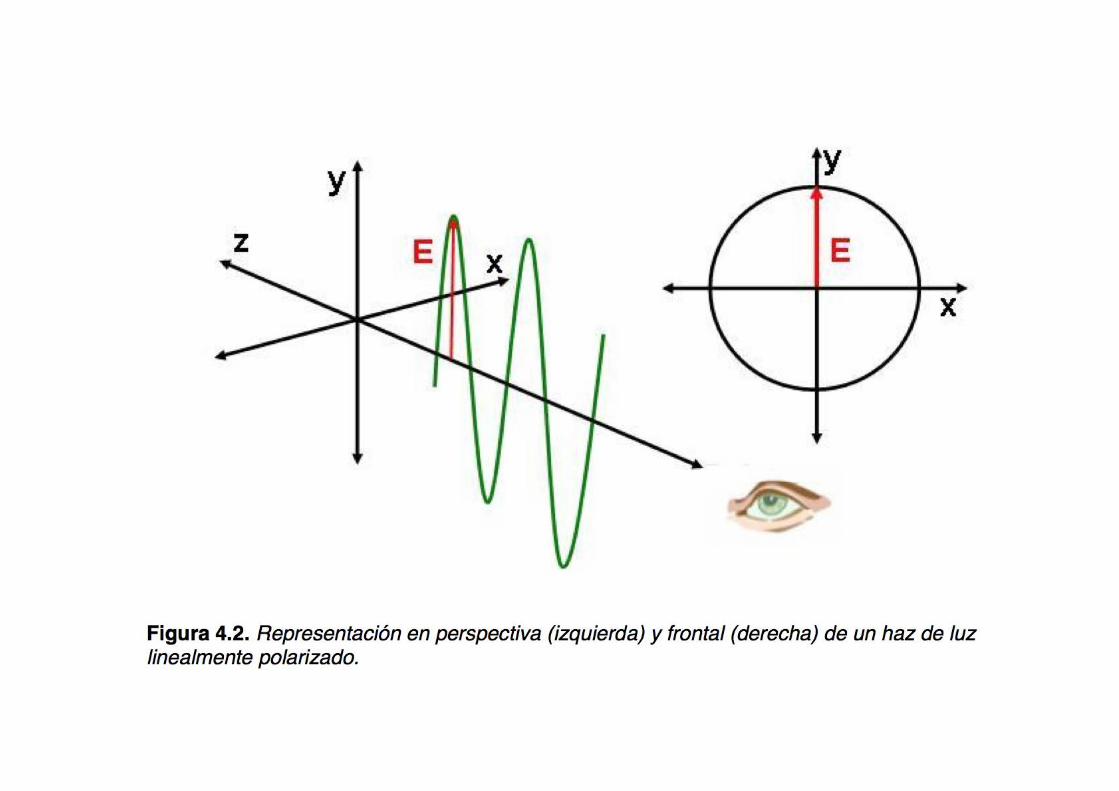
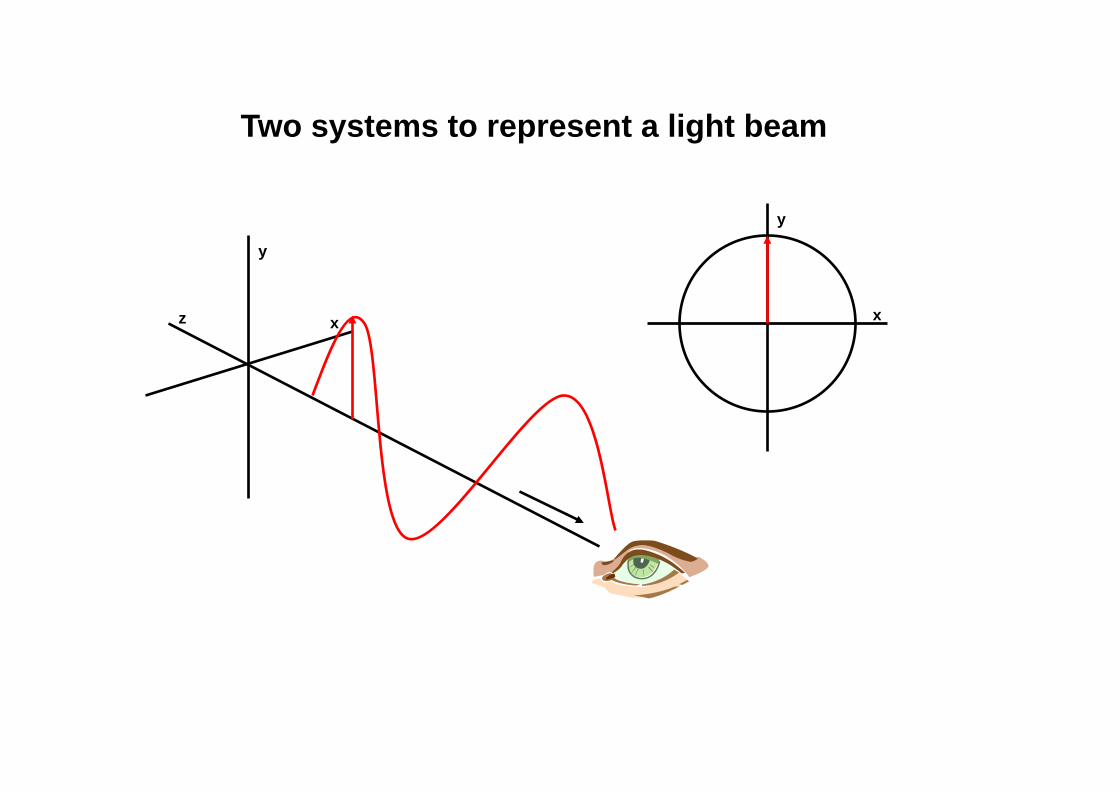
Two systems to represent a light beam
x
y
z x
y
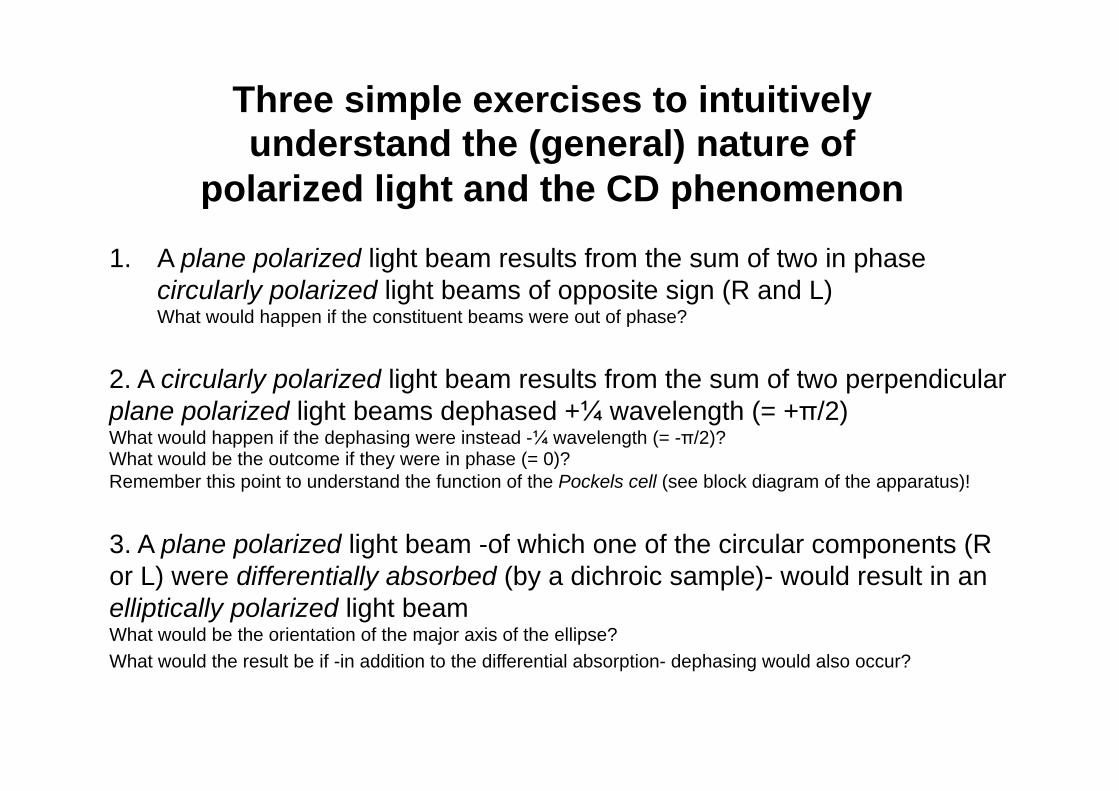
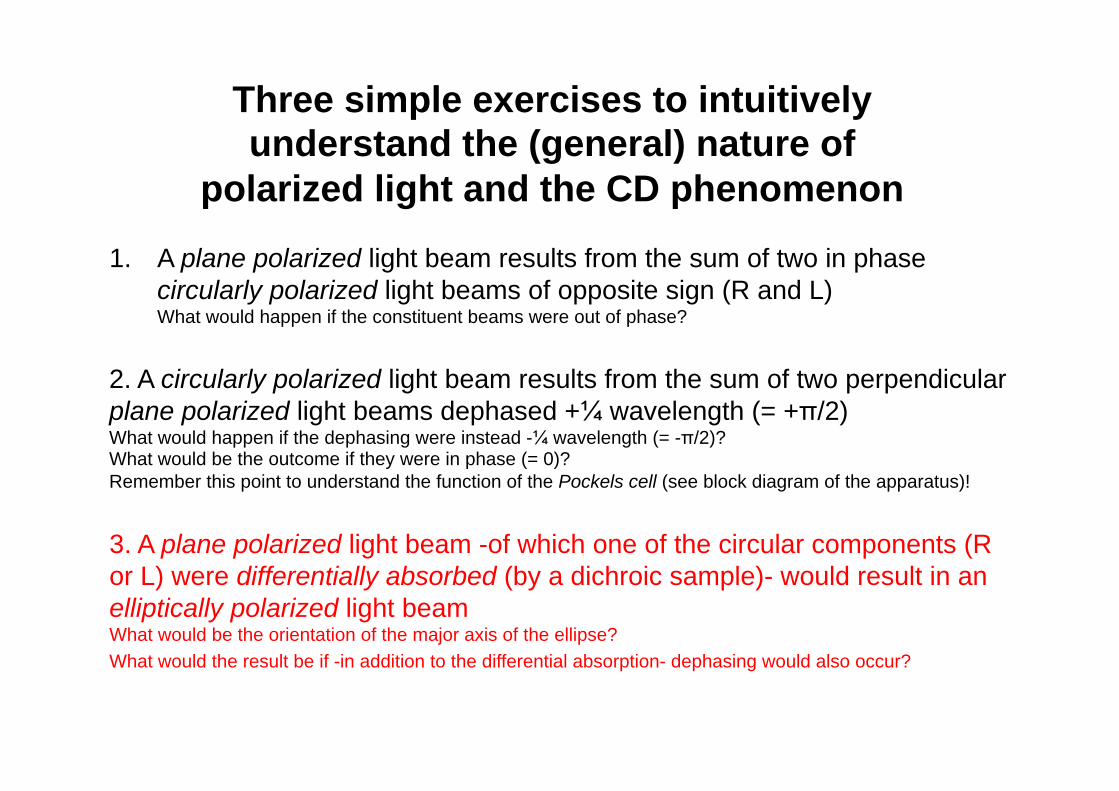
Three simple exercises to intuitively understand the (general) nature of
polarized light and the CD phenomenon
2. A circularly polarized light beam results from the sum of two perpendicular plane polarized light beams dephased +¼ wavelength (= +π/2) What would happen if the dephasing were instead -¼ wavelength (= -π/2)? What would be the outcome if they were in phase (= 0)? Remember this point to understand the function of the Pockels cell (see block diagram of the apparatus)!
1. A plane polarized light beam results from the sum of two in phase circularly polarized light beams of opposite sign (R and L) What would happen if the constituent beams were out of phase?
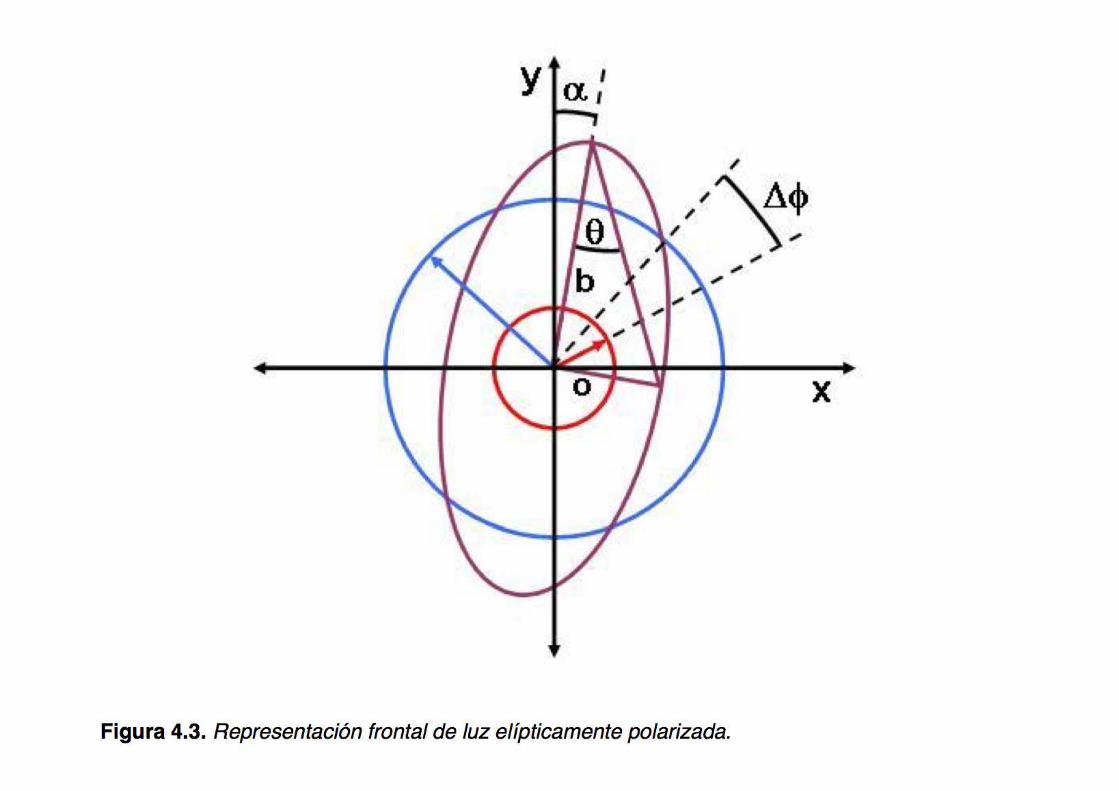
3. A plane polarized light beam -of which one of the circular components (R or L) were differentially absorbed (by a dichroic sample)- would result in an elliptically polarized light beam What would be the orientation of the major axis of the ellipse? What would the result be if -in addition to the differential absorption- dephasing would also occur?
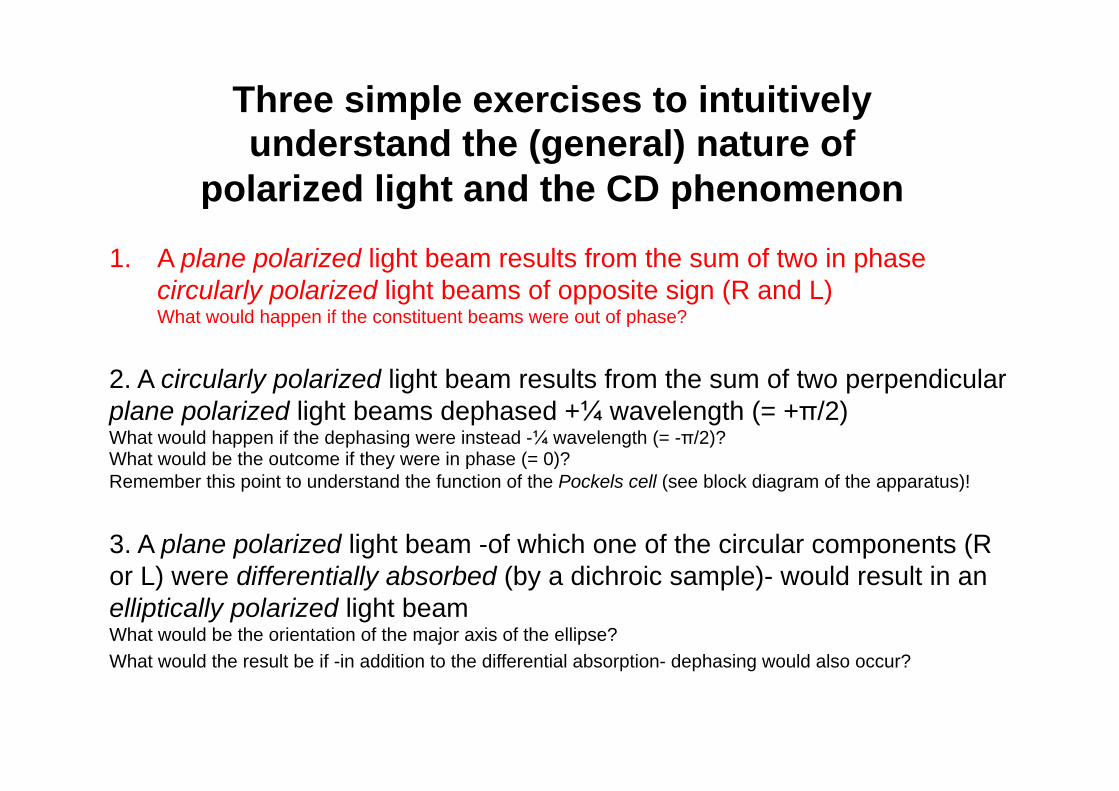
Three simple exercises to intuitively understand the (general) nature of
polarized light and the CD phenomenon
2. A circularly polarized light beam results from the sum of two perpendicular plane polarized light beams dephased +¼ wavelength (= +π/2) What would happen if the dephasing were instead -¼ wavelength (= -π/2)? What would be the outcome if they were in phase (= 0)? Remember this point to understand the function of the Pockels cell (see block diagram of the apparatus)!
1. A plane polarized light beam results from the sum of two in phase circularly polarized light beams of opposite sign (R and L) What would happen if the constituent beams were out of phase?
3. A plane polarized light beam -of which one of the circular components (R or L) were differentially absorbed (by a dichroic sample)- would result in an elliptically polarized light beam What would be the orientation of the major axis of the ellipse? What would the result be if -in addition to the differential absorption- dephasing would also occur?
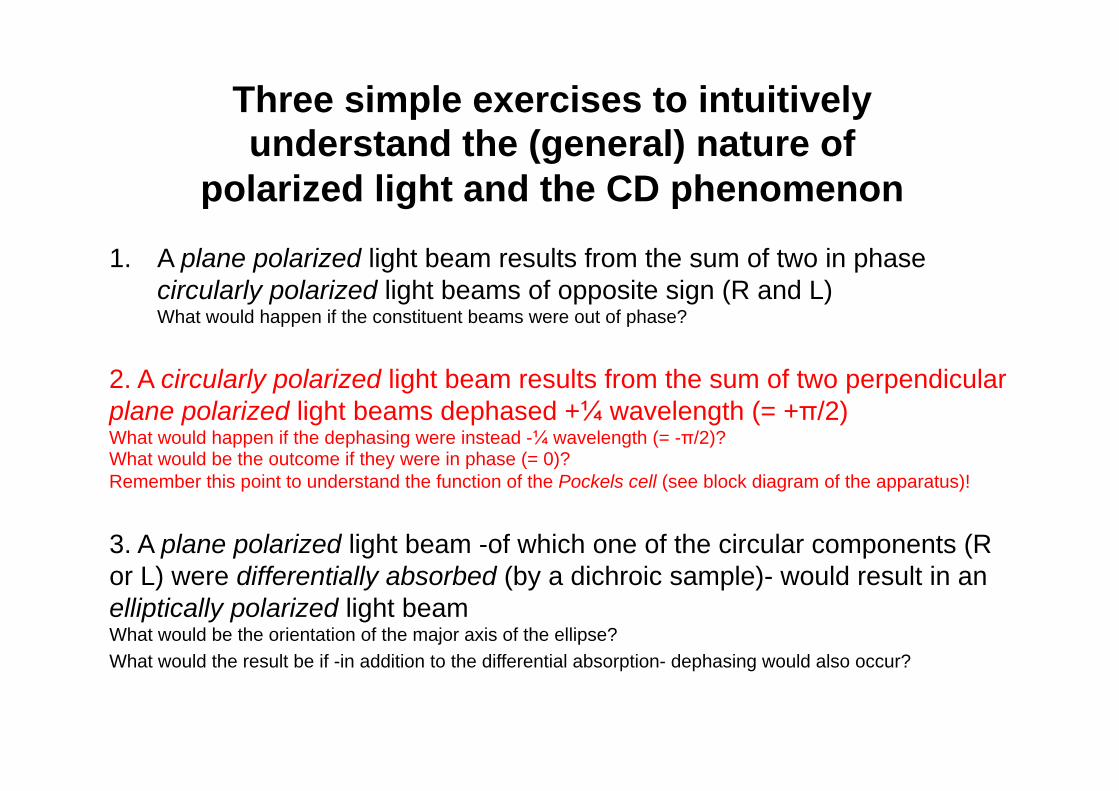
Three simple exercises to intuitively understand the (general) nature of
polarized light and the CD phenomenon
2. A circularly polarized light beam results from the sum of two perpendicular plane polarized light beams dephased +¼ wavelength (= +π/2) What would happen if the dephasing were instead -¼ wavelength (= -π/2)? What would be the outcome if they were in phase (= 0)? Remember this point to understand the function of the Pockels cell (see block diagram of the apparatus)!
1. A plane polarized light beam results from the sum of two in phase circularly polarized light beams of opposite sign (R and L) What would happen if the constituent beams were out of phase?
3. A plane polarized light beam -of which one of the circular components (R or L) were differentially absorbed (by a dichroic sample)- would result in an elliptically polarized light beam What would be the orientation of the major axis of the ellipse? What would the result be if -in addition to the differential absorption- dephasing would also occur?
The interaction of polarized light with matter
Three simple exercises to intuitively understand the (general) nature of
polarized light and the CD phenomenon
2. A circularly polarized light beam results from the sum of two perpendicular plane polarized light beams dephased +¼ wavelength (= +π/2) What would happen if the dephasing were instead -¼ wavelength (= -π/2)? What would be the outcome if they were in phase (= 0)? Remember this point to understand the function of the Pockels cell (see block diagram of the apparatus)!
1. A plane polarized light beam results from the sum of two in phase circularly polarized light beams of opposite sign (R and L) What would happen if the constituent beams were out of phase?
3. A plane polarized light beam -of which one of the circular components (R or L) were differentially absorbed (by a dichroic sample)- would result in an elliptically polarized light beam What would be the orientation of the major axis of the ellipse? What would the result be if -in addition to the differential absorption- dephasing would also occur?
Electromagnetic waves and circular dichroism: an animated tutorial
By András Szilágyi ([email protected])
www.enzim.hu/~szia/cddemo/edemo0.htm
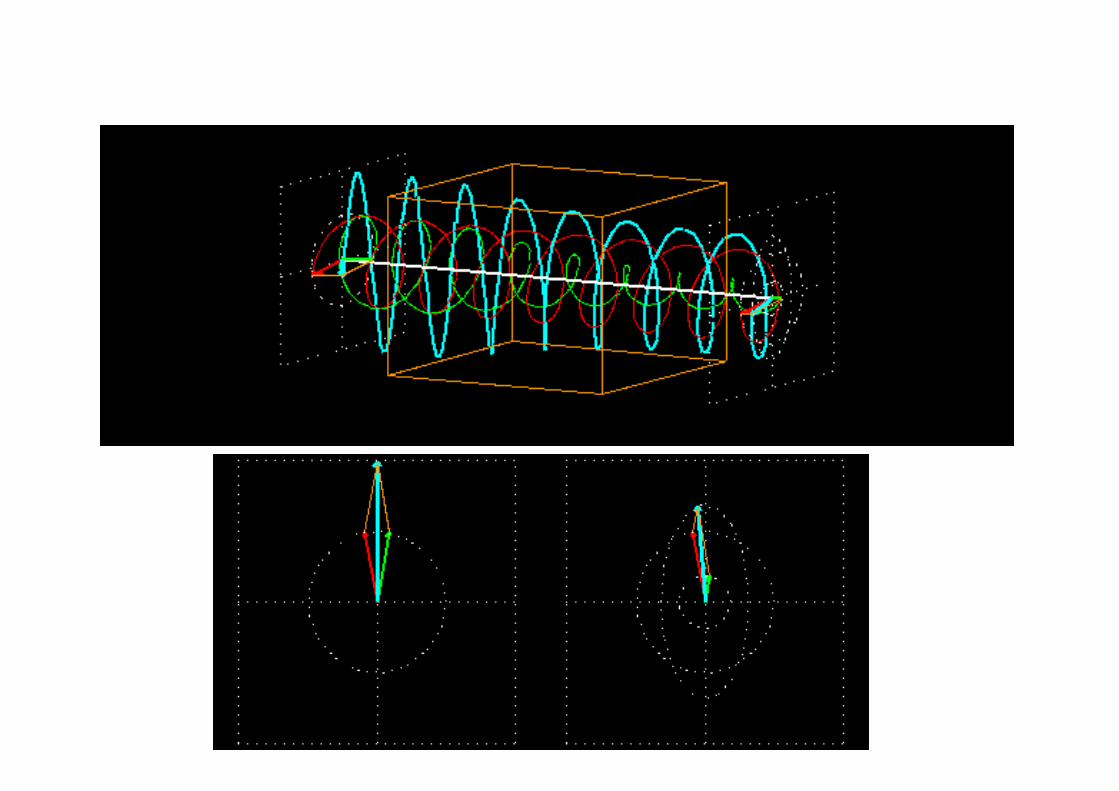
Circular Dichroism (CD), a pictorial view
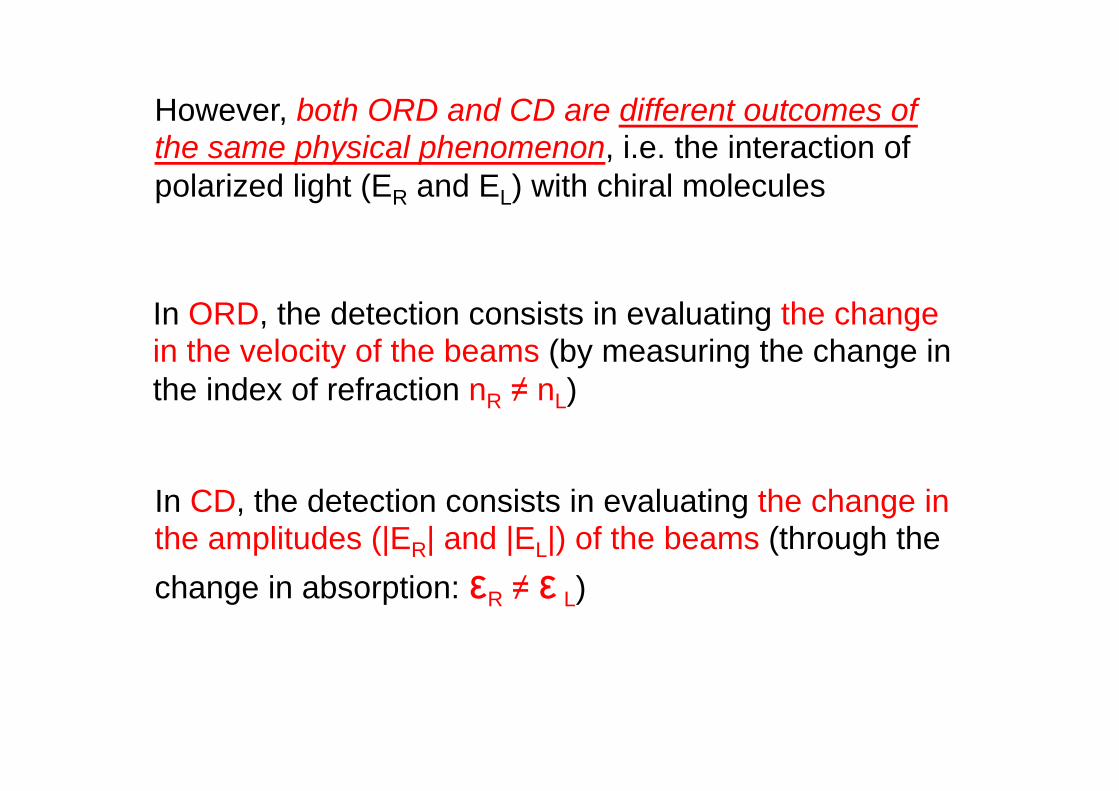
However, both ORD and CD are different outcomes of the same physical phenomenon, i.e. the interaction of polarized light (ER and EL) with chiral molecules
In ORD, the detection consists in evaluating the change in the velocity of the beams (by measuring the change in the index of refraction nR ≠ nL)
In CD, the detection consists in evaluating the change in the amplitudes (|ER| and |EL|) of the beams (through the change in absorption: εR ≠ ε L)
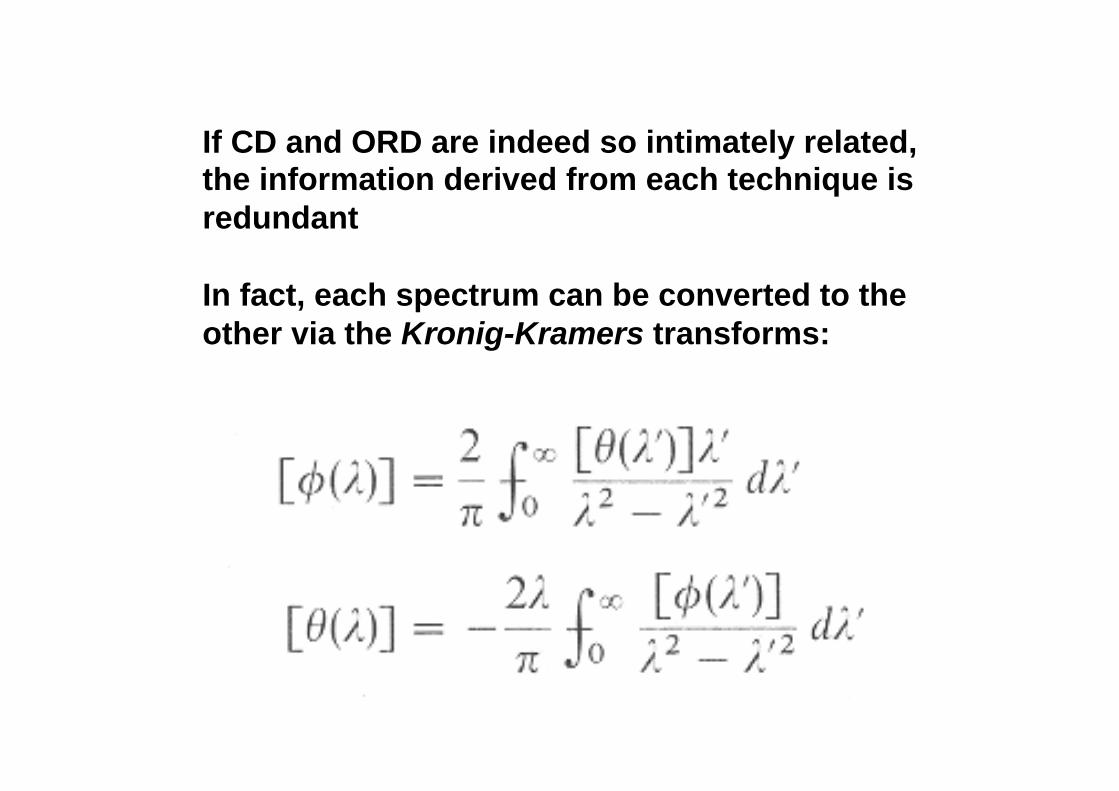
If CD and ORD are indeed so intimately related, the information derived from each technique is redundant In fact, each spectrum can be converted to the other via the Kronig-Kramers transforms:
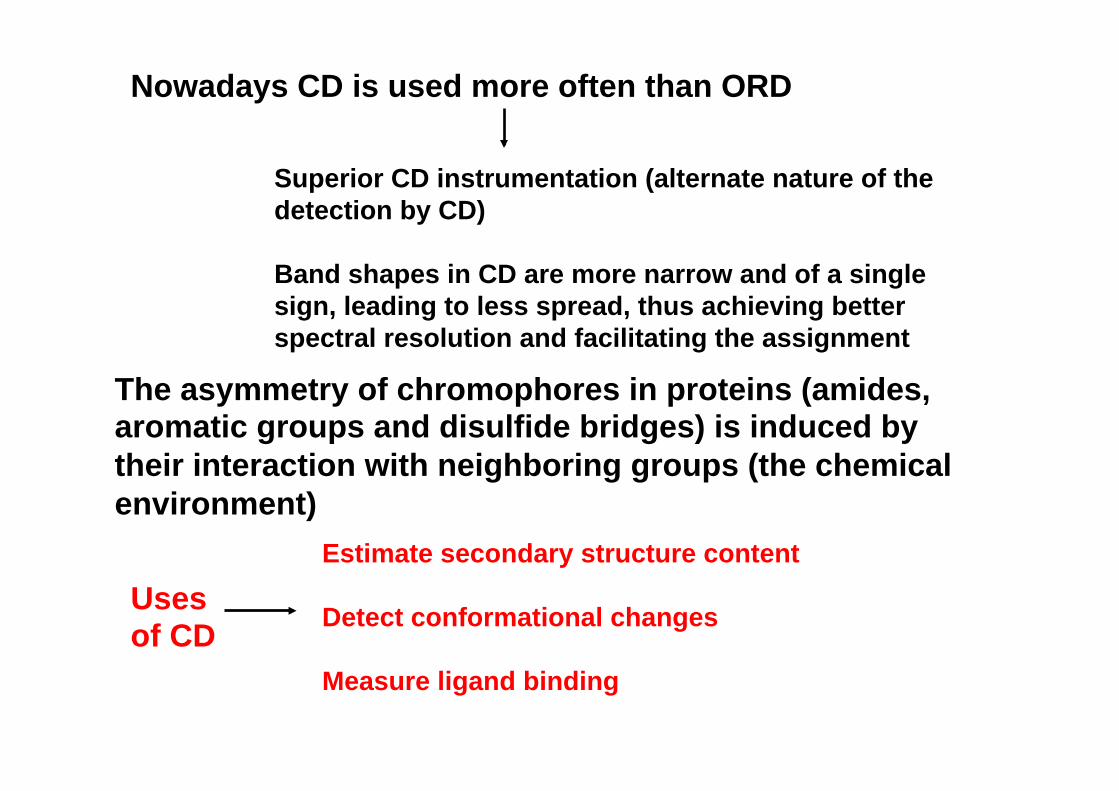
Nowadays CD is used more often than ORD
Superior CD instrumentation (alternate nature of the detection by CD) Band shapes in CD are more narrow and of a single sign, leading to less spread, thus achieving better spectral resolution and facilitating the assignment
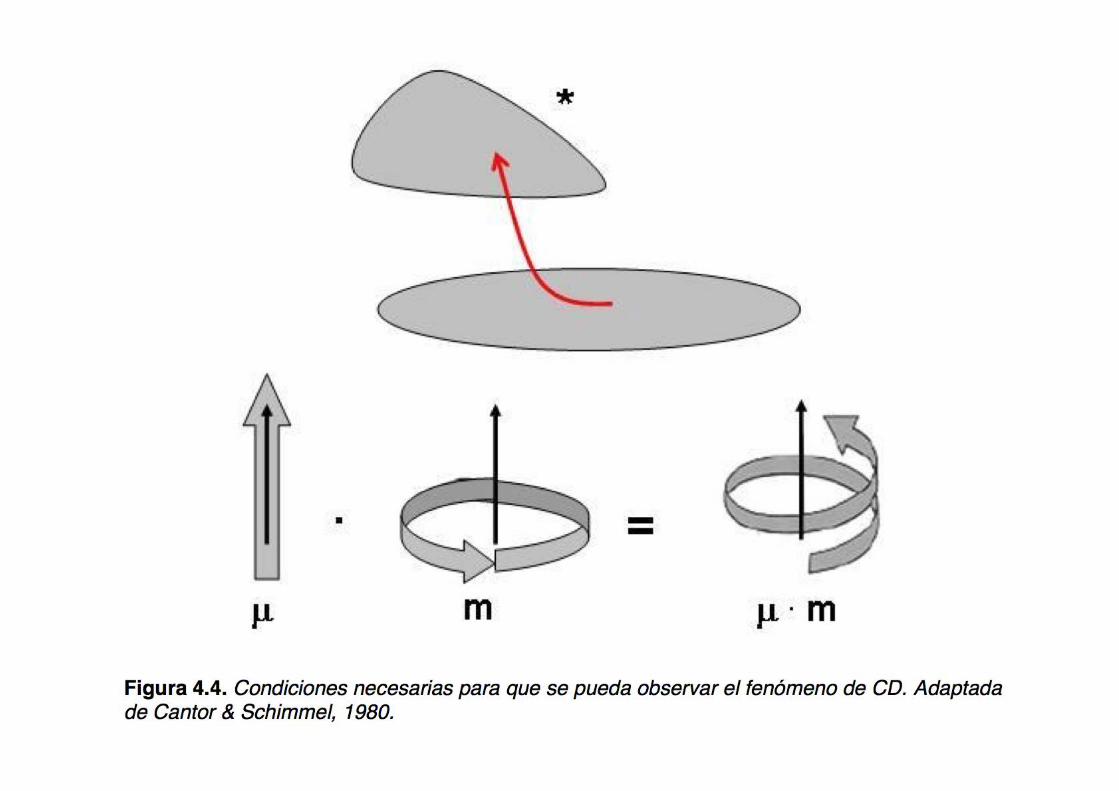
The asymmetry of chromophores in proteins (amides, aromatic groups and disulfide bridges) is induced by their interaction with neighboring groups (the chemical environment)
Uses of CD
Estimate secondary structure content Detect conformational changes Measure ligand binding
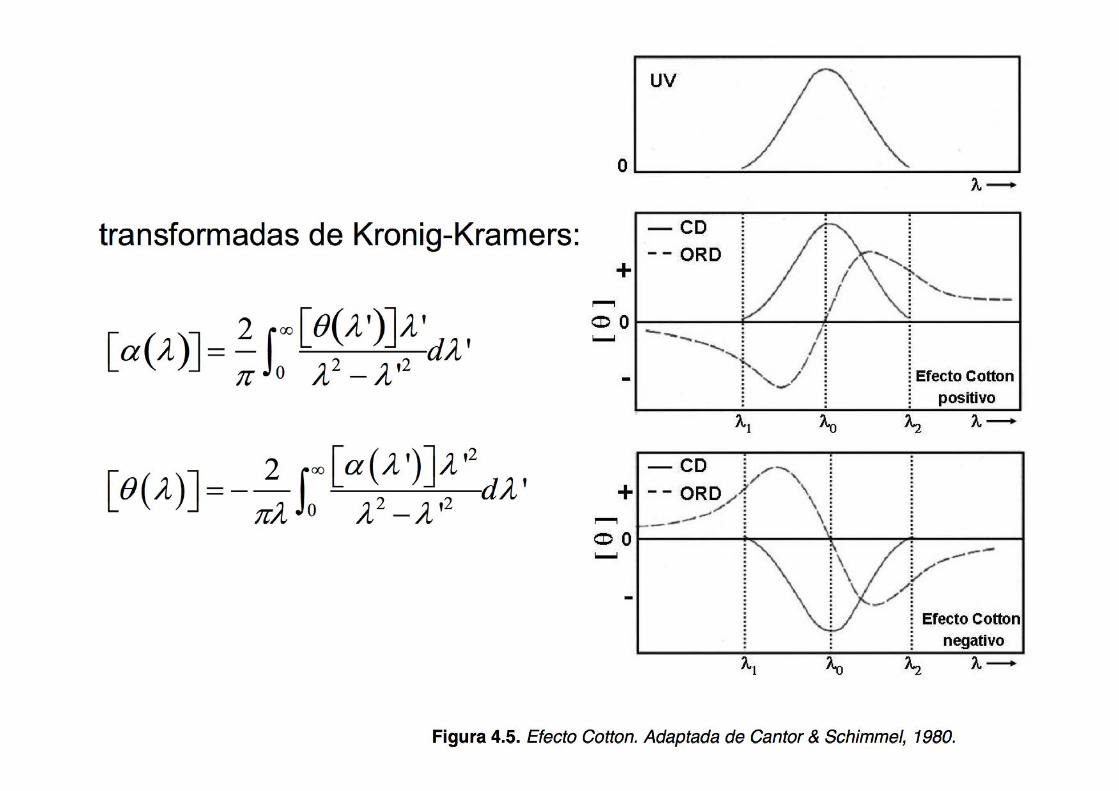
The ORD spectrum looks like the derivative (but it is not) of the CD spectrum, however, the dependence with λ is different
By contrast, the high UV absorption of proteins allows the measurement of CD, the concentration is expressed in terms of the mean amino acid residue weight (MRW):
MRW = MW / #res
For this reason, it is possible to measure optical activity in regions far from the absorption maximum (e.g. in sugars)
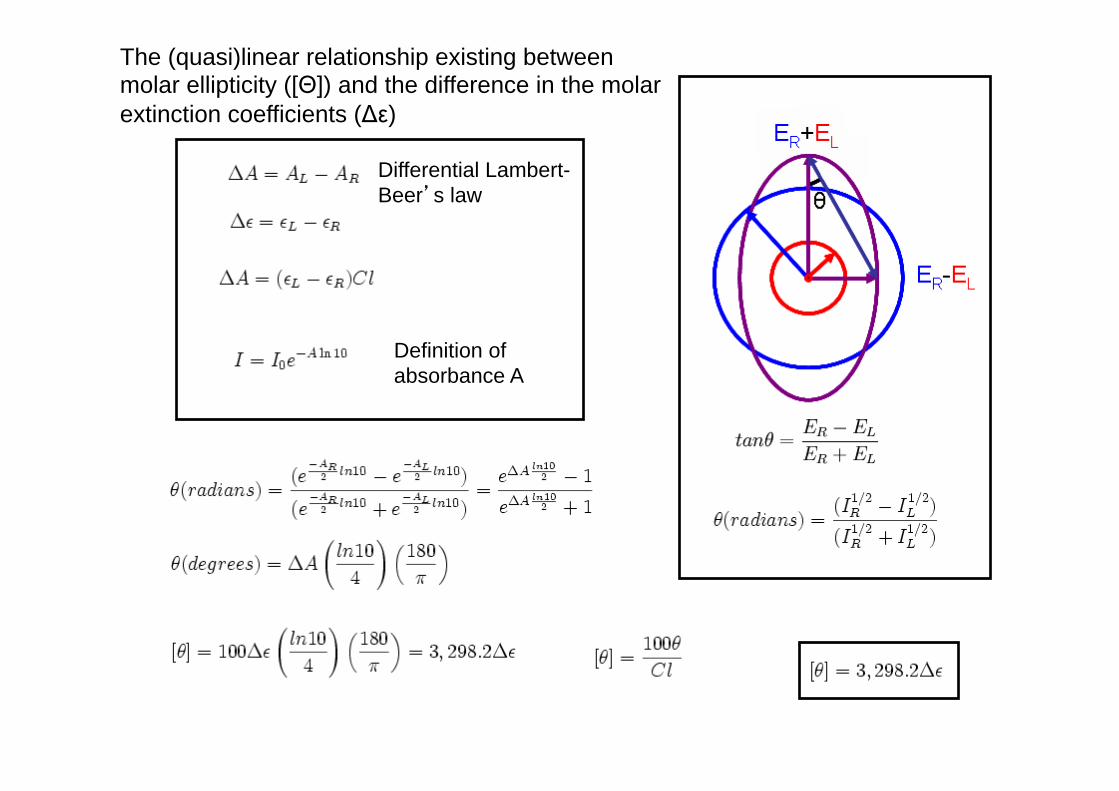
The (quasi)linear relationship existing between molar ellipticity ([Θ]) and the difference in the molar extinction coefficients (Δε)
Differential Lambert-Beer’s law
Definition of absorbance A

How come [Θ] = 3300 Δε?
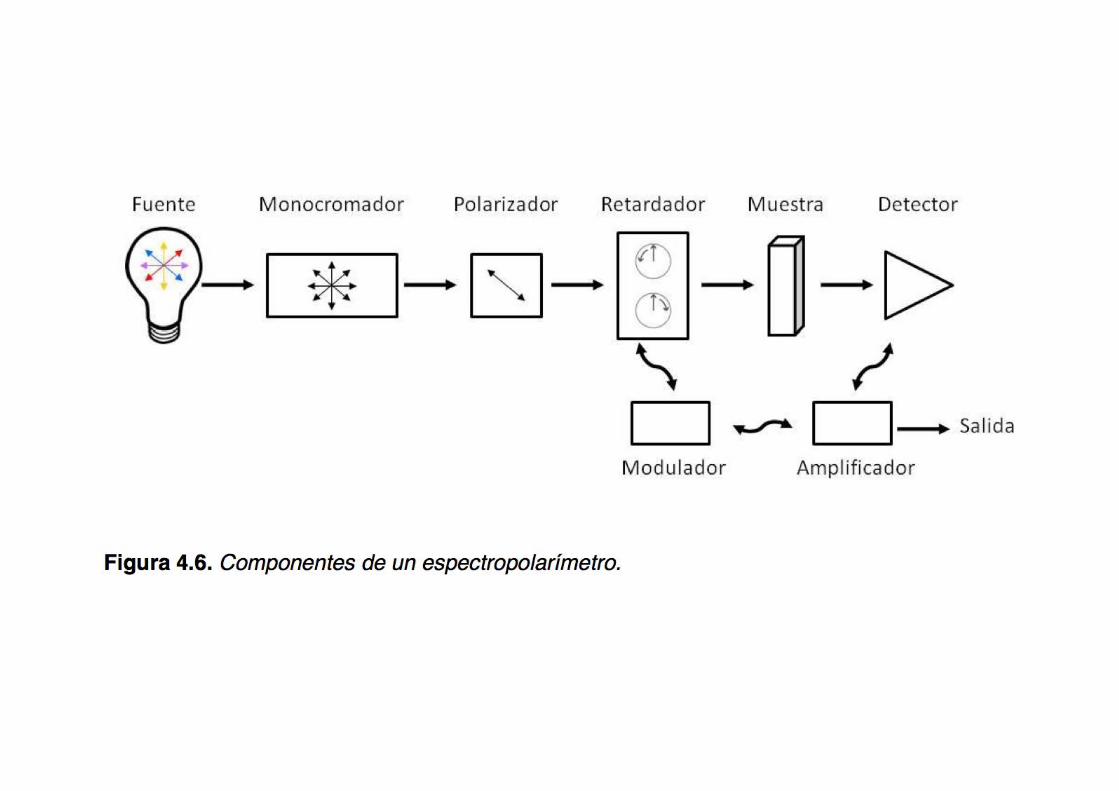
The instrumentation for measuring CD:
the spectropolarimeter
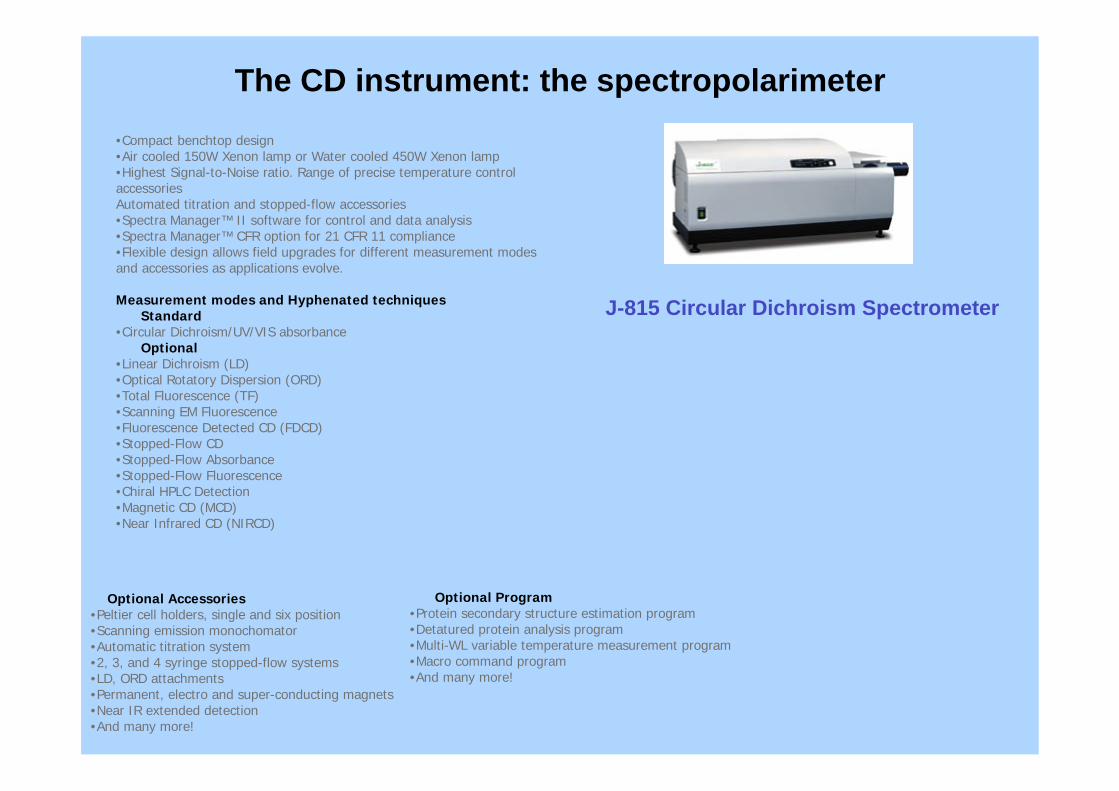
•!Compact benchtop design •!Air cooled 150W Xenon lamp or Water cooled 450W Xenon lamp •!Highest Signal-to-Noise ratio. Range of precise temperature control accessories Automated titration and stopped-flow accessories •!Spectra Manager™ II software for control and data analysis •!Spectra Manager™ CFR option for 21 CFR 11 compliance •!Flexible design allows field upgrades for different measurement modes and accessories as applications evolve. Measurement modes and Hyphenated techniques Standard •!Circular Dichroism/UV/VIS absorbance Optional •!Linear Dichroism (LD) •!Optical Rotatory Dispersion (ORD) •!Total Fluorescence (TF) •!Scanning EM Fluorescence •!Fluorescence Detected CD (FDCD) •!Stopped-Flow CD •!Stopped-Flow Absorbance •!Stopped-Flow Fluorescence •!Chiral HPLC Detection •!Magnetic CD (MCD) •!Near Infrared CD (NIRCD)
Optional Accessories •!Peltier cell holders, single and six position •!Scanning emission monochomator •!Automatic titration system •!2, 3, and 4 syringe stopped-flow systems •!LD, ORD attachments •!Permanent, electro and super-conducting magnets •!Near IR extended detection •!And many more!
The CD instrument: the spectropolarimeter
J-815 Circular Dichroism Spectrometer
Optional Program •!Protein secondary structure estimation program •!Detatured protein analysis program •!Multi-WL variable temperature measurement program •!Macro command program •!And many more!
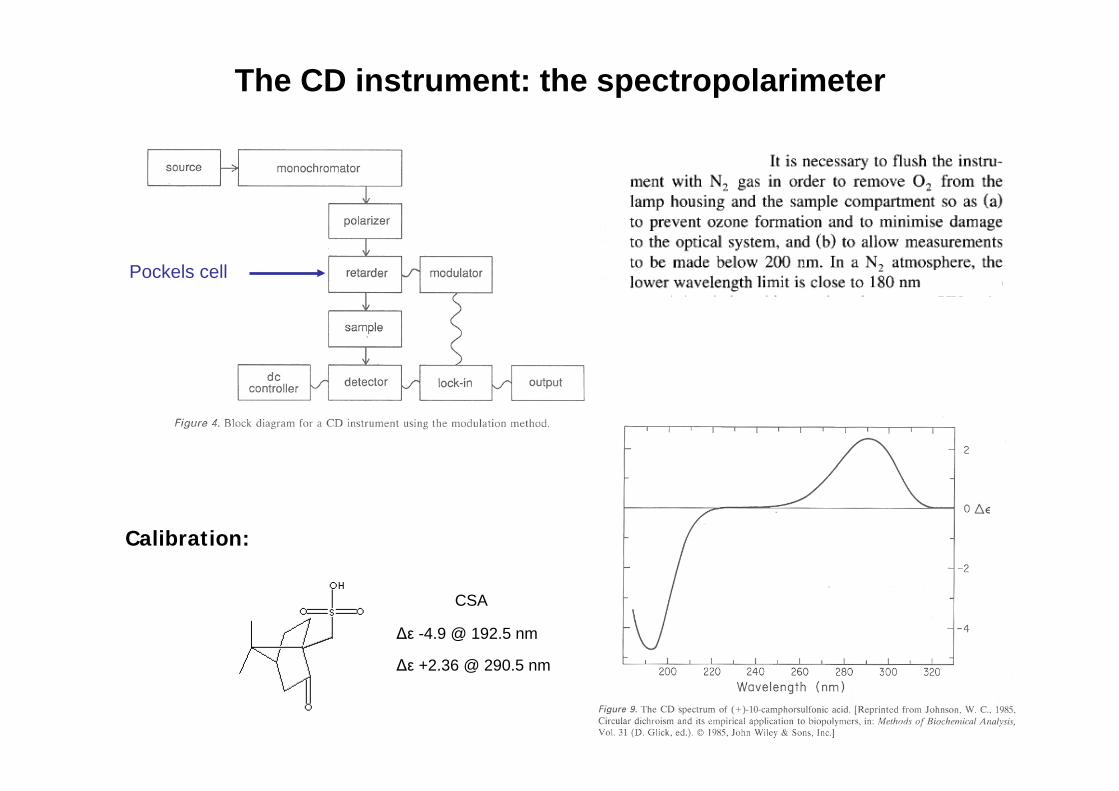
Pockels cell
Calibration:
$* +2.36 @ 290.5 nm
$* -4.9 @ 192.5 nm
CSA
The CD instrument: the spectropolarimeter

Practical aspects I: Manufacturers: Horiba-Jobin Yvon, Jasco, AVIV, Applied Photophysics (Chirascan models) ΔA ~ 10-4 A More potent light sources vs. efficient photodetectors (PMT), enhanced electronics to suppress noise 1 to 10 cm cells in the near UV region: to detect weak signals, and 1, 0.5, 0.1 mm (and even 0.05 and 0.01 mm!) cells in the far UV region, to minimize solvent absorption Continuous N2 flow: to avoid ozone damage to the optics (mirrors) It is essential to accurately know the protein concentration in the sample: by spectrophotometry (using a reliable ε value), or by quantitative amino acid analysis
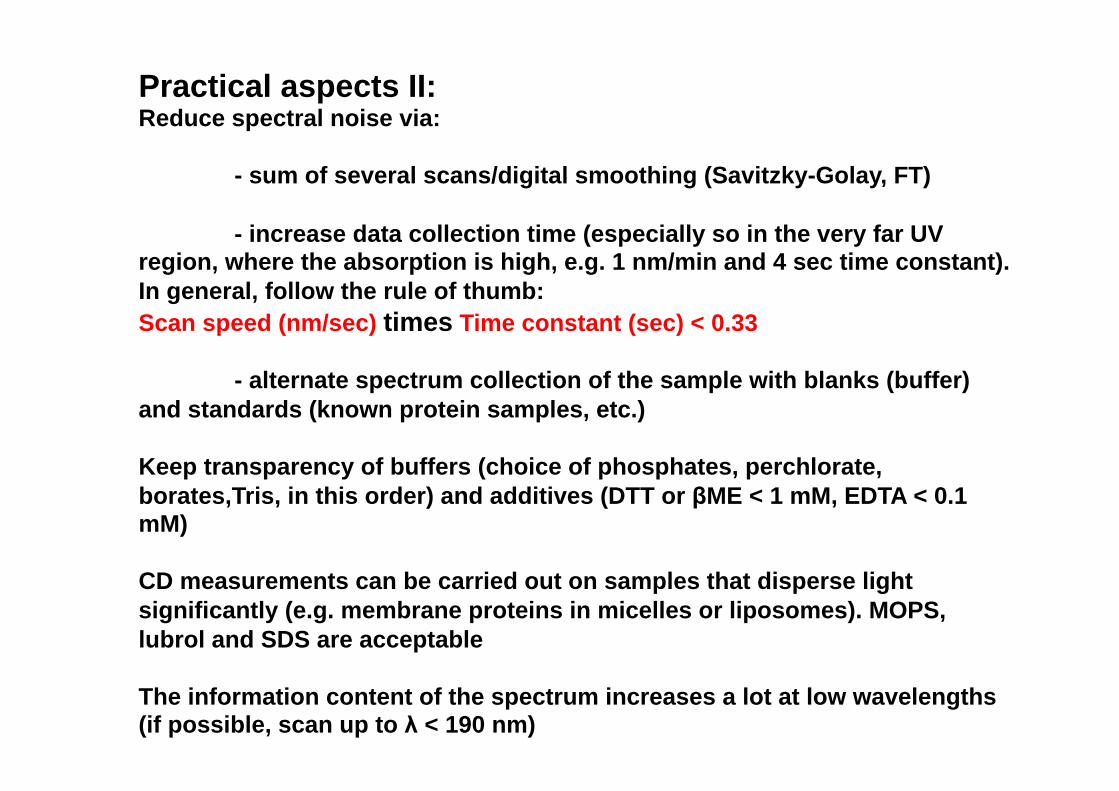
Practical aspects II: Reduce spectral noise via:
- sum of several scans/digital smoothing (Savitzky-Golay, FT)
- increase data collection time (especially so in the very far UV region, where the absorption is high, e.g. 1 nm/min and 4 sec time constant). In general, follow the rule of thumb: Scan speed (nm/sec) times Time constant (sec) < 0.33
- alternate spectrum collection of the sample with blanks (buffer) and standards (known protein samples, etc.) Keep transparency of buffers (choice of phosphates, perchlorate, borates,Tris, in this order) and additives (DTT or βME < 1 mM, EDTA < 0.1 mM) CD measurements can be carried out on samples that disperse light significantly (e.g. membrane proteins in micelles or liposomes). MOPS, lubrol and SDS are acceptable The information content of the spectrum increases a lot at low wavelengths (if possible, scan up to λ < 190 nm)
How CD becomes useful to
understand protein structure
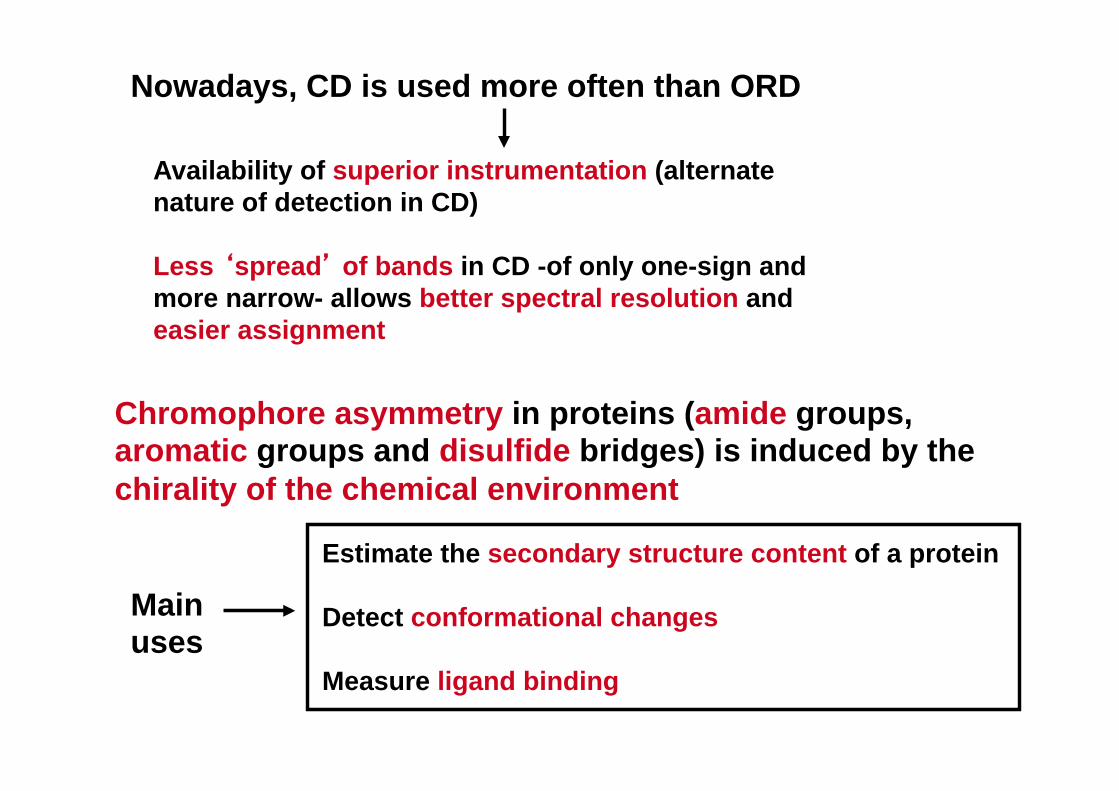
Nowadays, CD is used more often than ORD
Availability of superior instrumentation (alternate nature of detection in CD) Less ‘spread’ of bands in CD -of only one-sign and more narrow- allows better spectral resolution and easier assignment
Chromophore asymmetry in proteins (amide groups, aromatic groups and disulfide bridges) is induced by the chirality of the chemical environment
Main uses
Estimate the secondary structure content of a protein Detect conformational changes Measure ligand binding
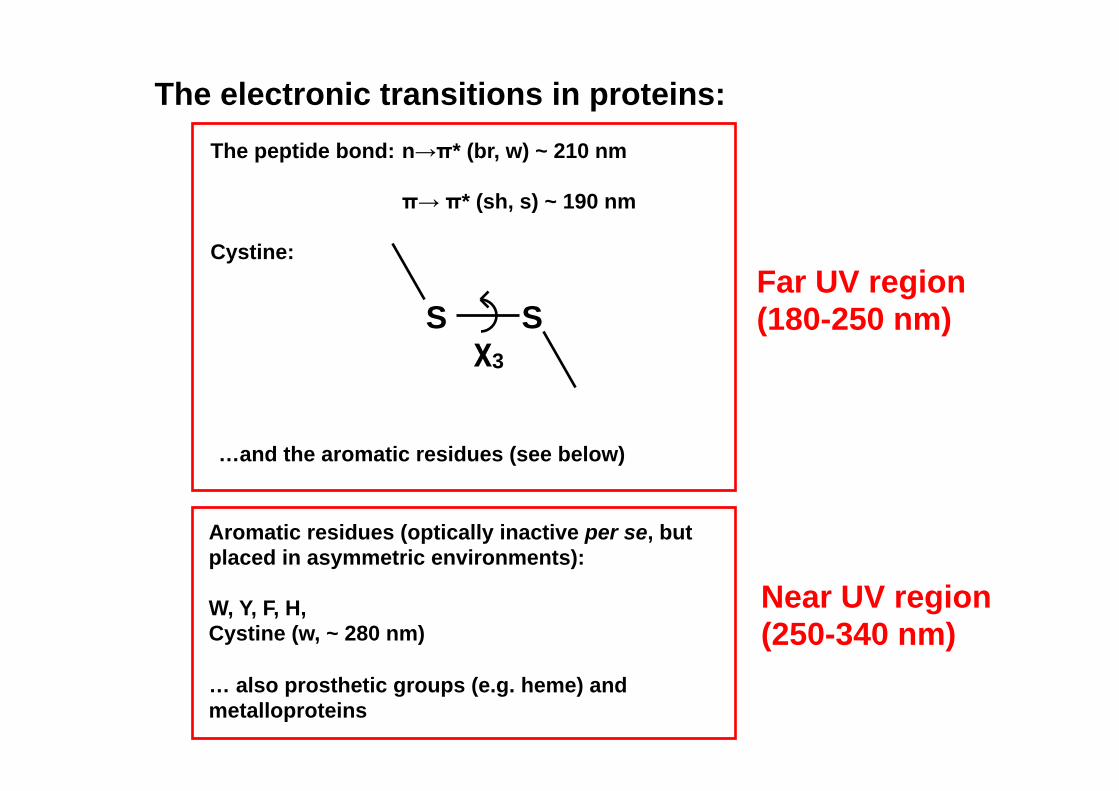
The electronic transitions in proteins: The peptide bond: n→π* (br, w) ~ 210 nm
π→ π* (sh, s) ~ 190 nm
Cystine:
S S χ3
…and the aromatic residues (see below)
Far UV region (180-250 nm)
Near UV region (250-340 nm)
Aromatic residues (optically inactive per se, but placed in asymmetric environments): W, Y, F, H, Cystine (w, ~ 280 nm) … also prosthetic groups (e.g. heme) and metalloproteins
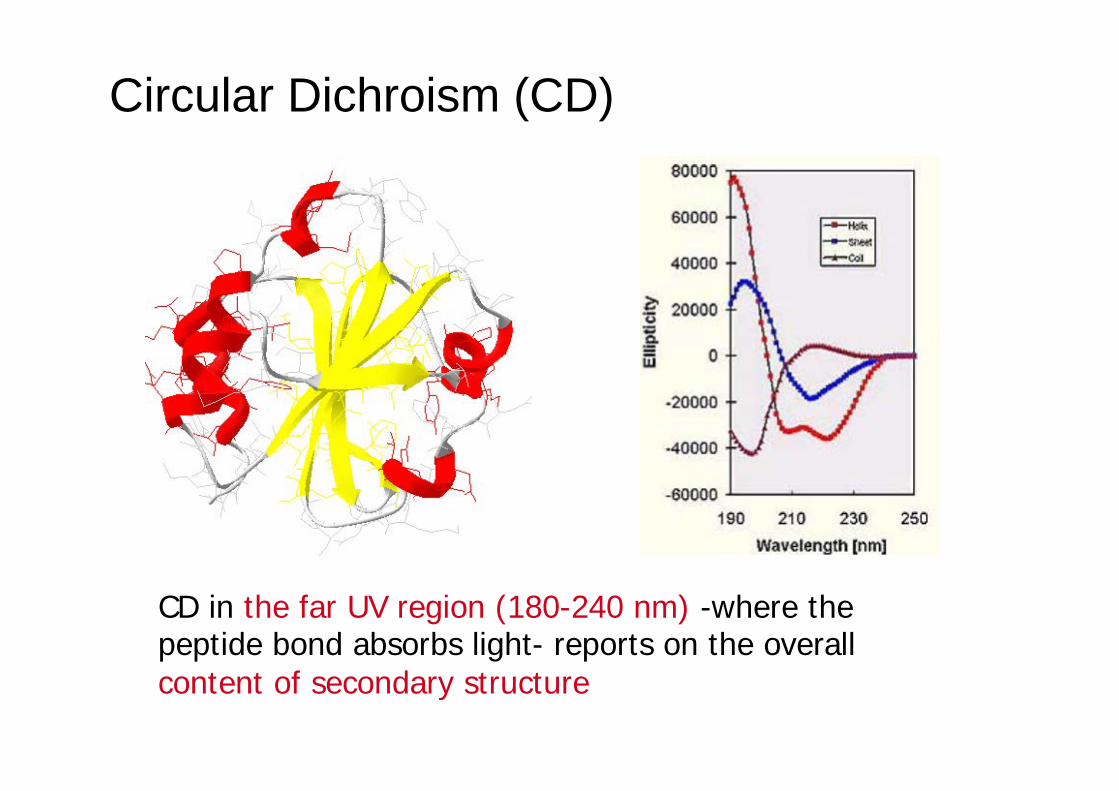
CD in the far UV region (180-240 nm) -where the peptide bond absorbs light- reports on the overall content of secondary structure
Circular Dichroism (CD) (CD)
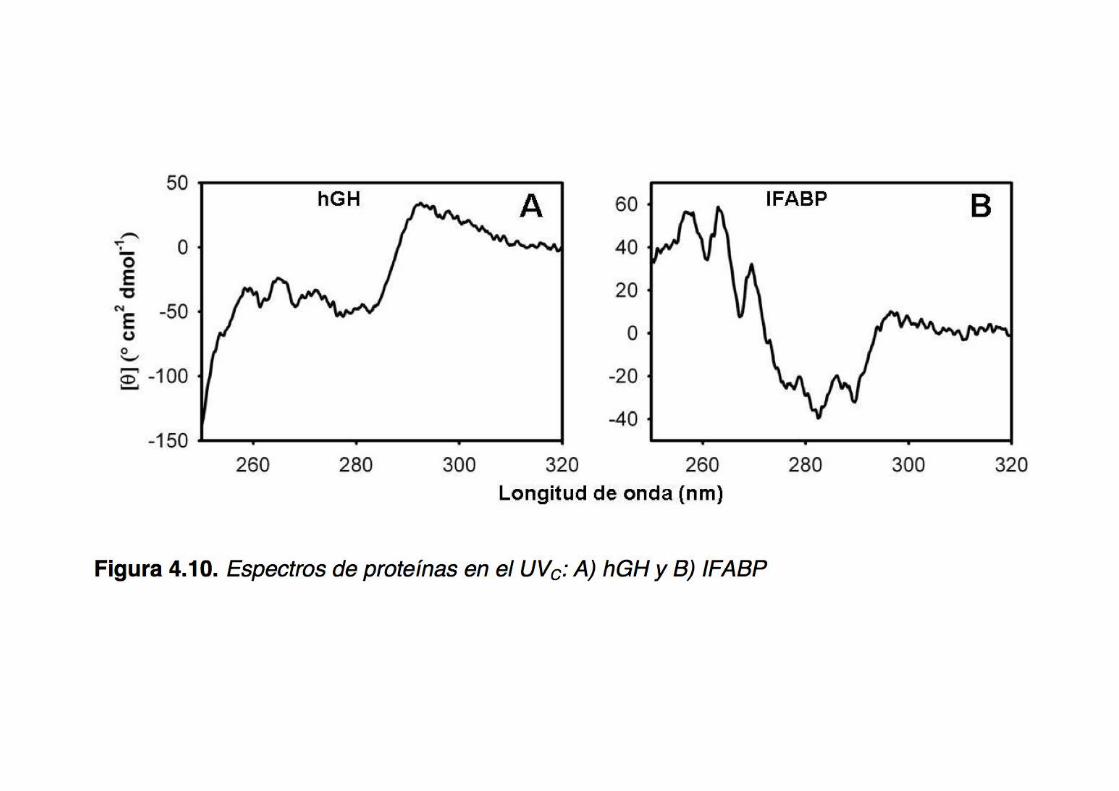
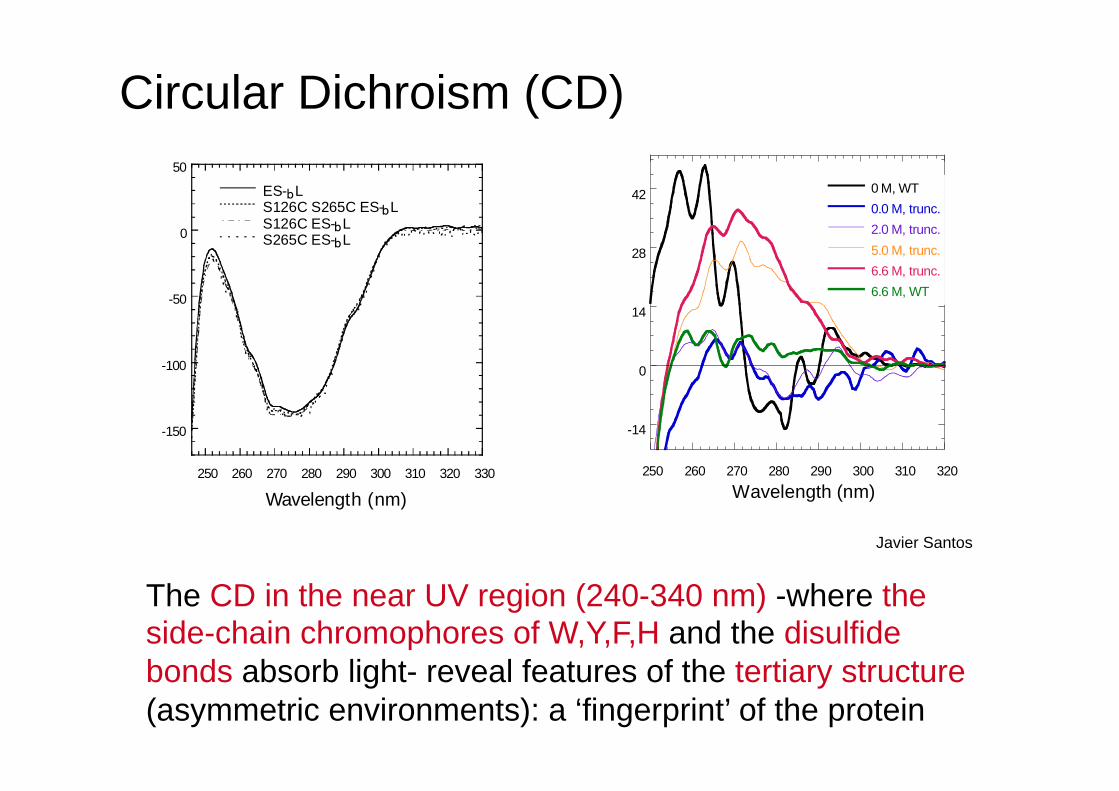
The CD in the near UV region (240-340 nm) -where the side-chain chromophores of W,Y,F,H and the disulfide bonds absorb light- reveal features of the tertiary structure (asymmetric environments): a ‘fingerprint’ of the protein
- 1 5 0
- 1 0 0
- 5 0
0
5 0
2 5 0 2 6 0 2 7 0 2 8 0 2 9 0 3 0 0 3 1 0 3 2 0 3 3 0
E S - b L S 1 2 6 C S 2 6 5 C E S - b L S 1 2 6 C E S - b L S 2 6 5 C E S - b L
- 1 4
0
1 4
2 8
4 2
2 5 0 2 6 0 2 7 0 2 8 0 2 9 0 3 0 0 3 1 0 3 2 0
0 M , W T 0 . 0 M , t r u n c . 2 . 0 M , t r u n c . 5 . 0 M , t r u n c . 6 . 6 M , t r u n c . 6 . 6 M , W T
W a v e l e n g t h ( n m )
Circular Dichroism (CD)
Wavelength (nm) Javier Santos
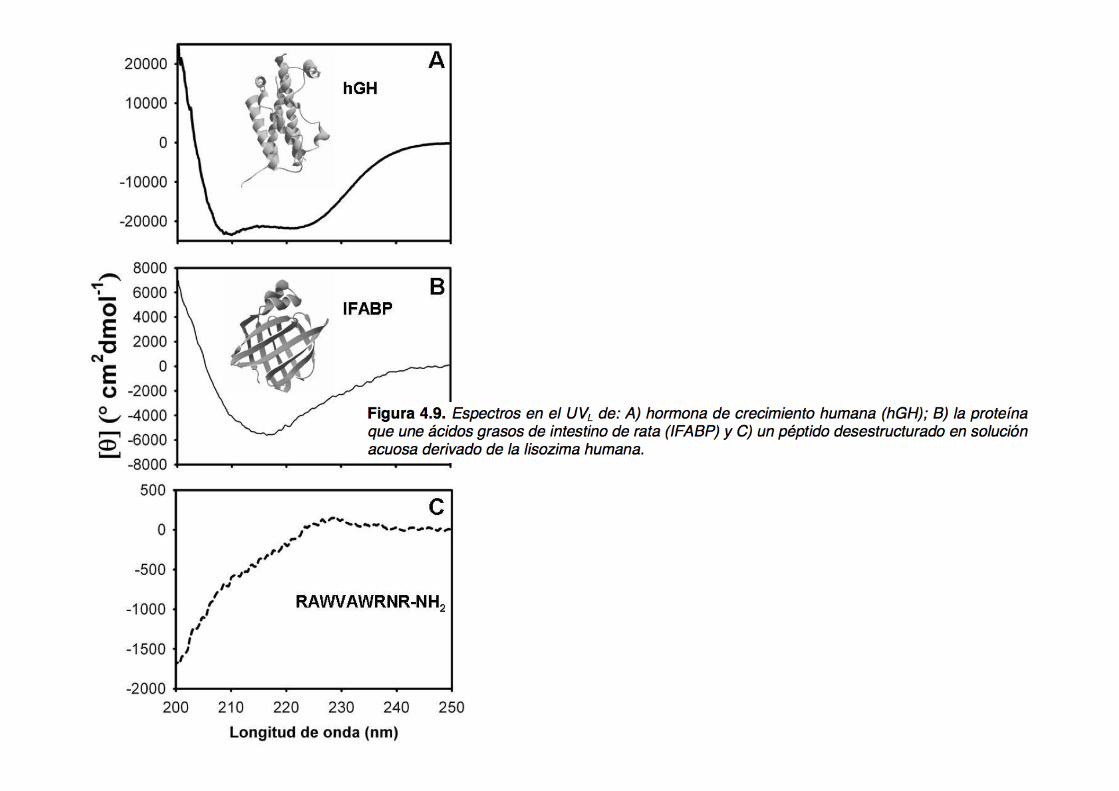
CD spectra of real peptides and proteins
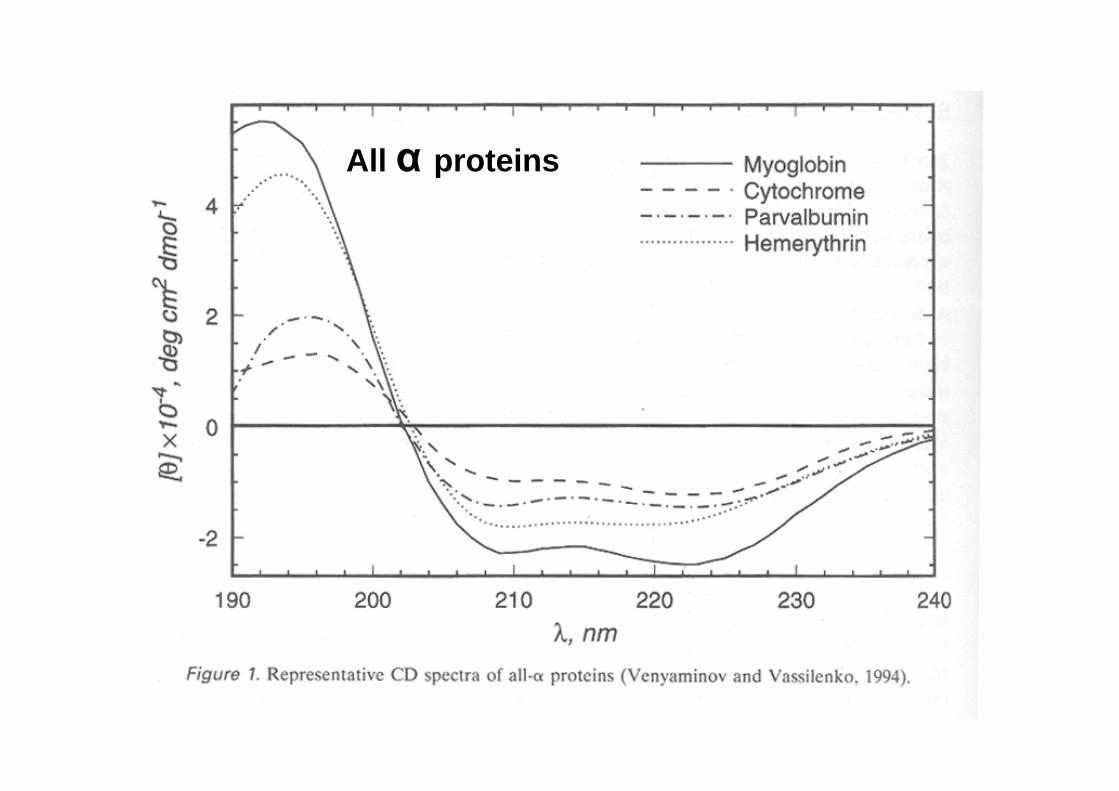
All α proteins
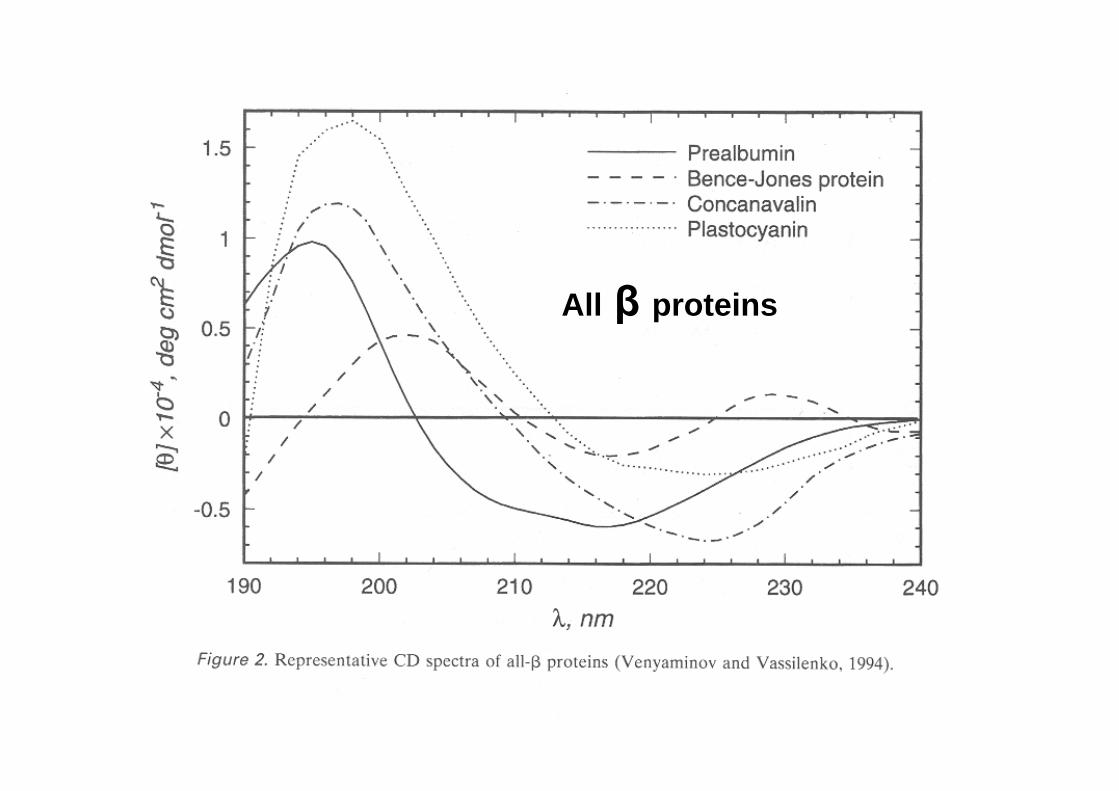
All β proteins
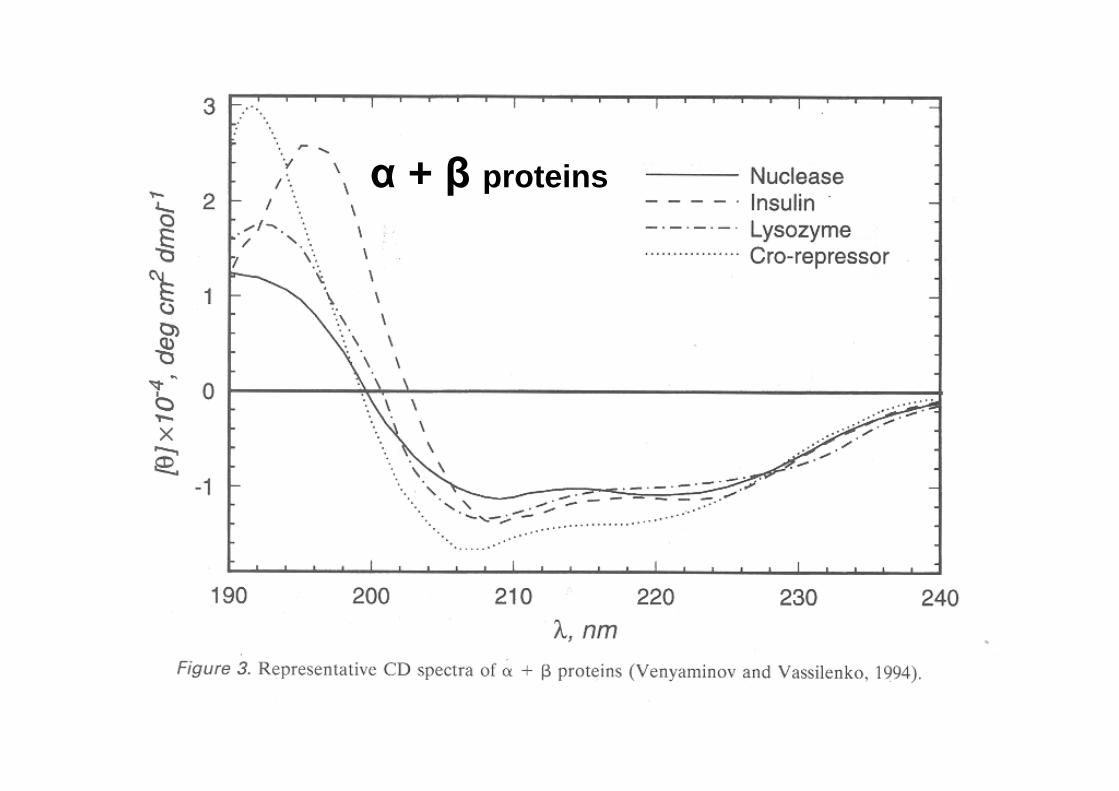
α + β proteins
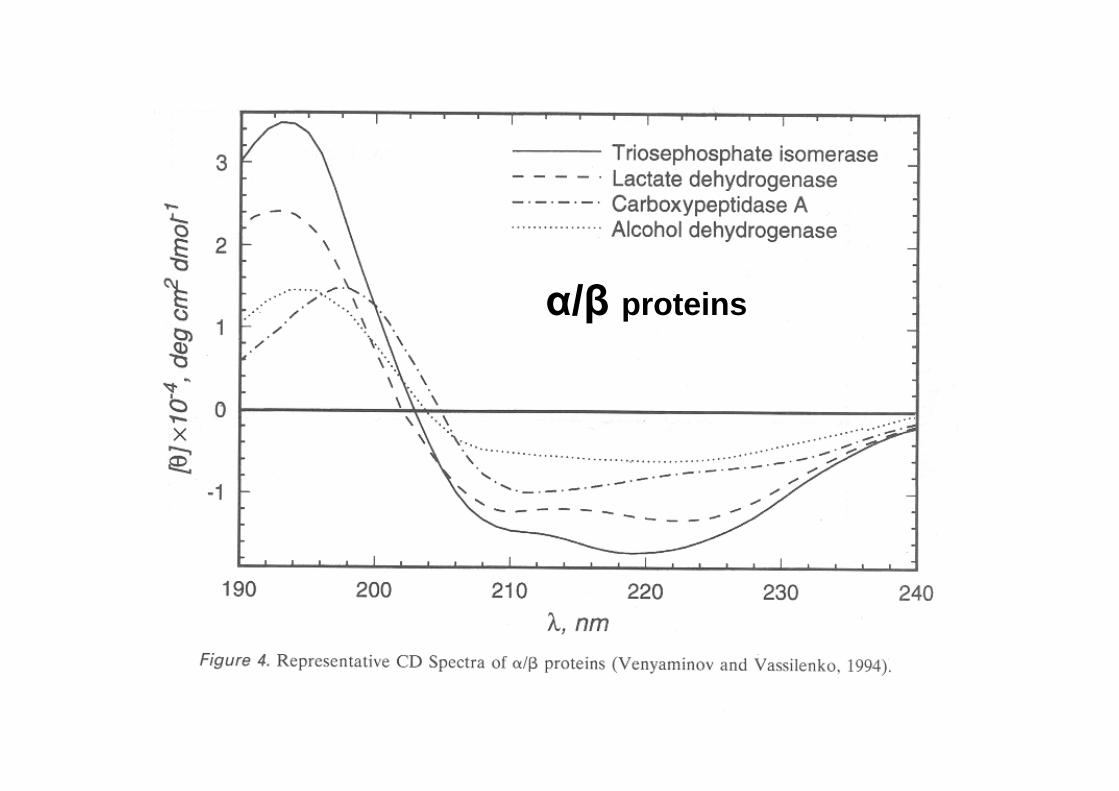
α/β proteins
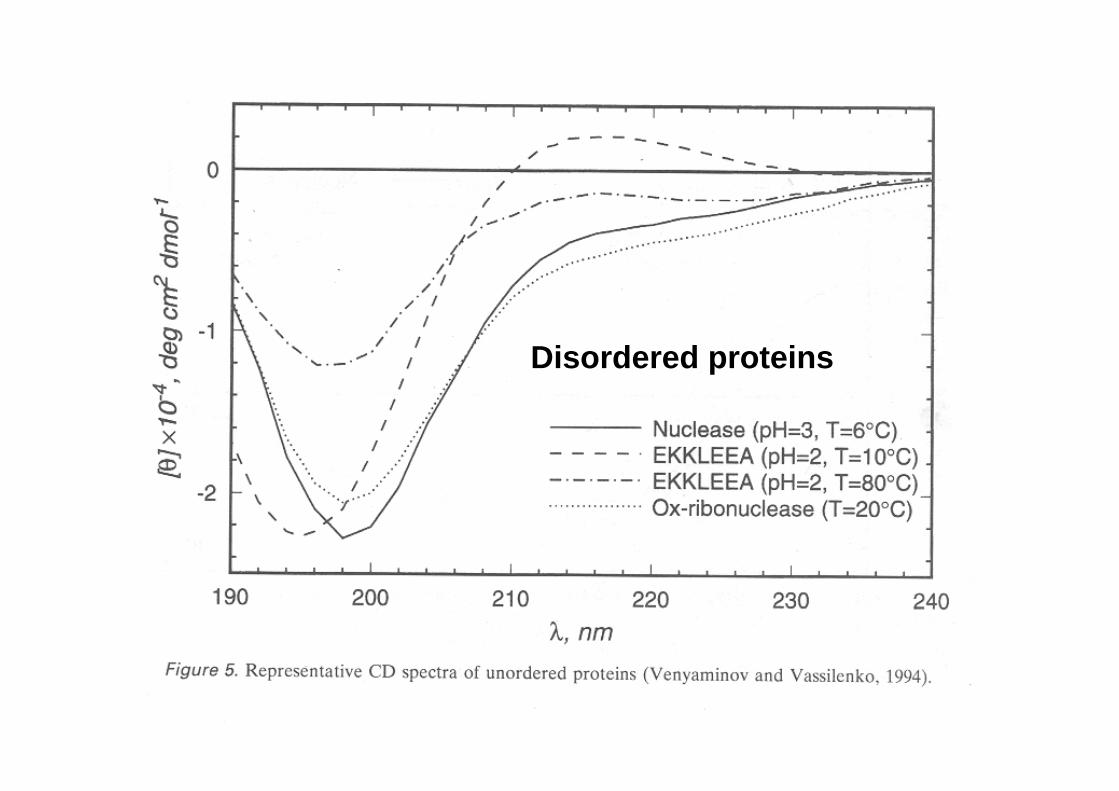
Disordered proteins
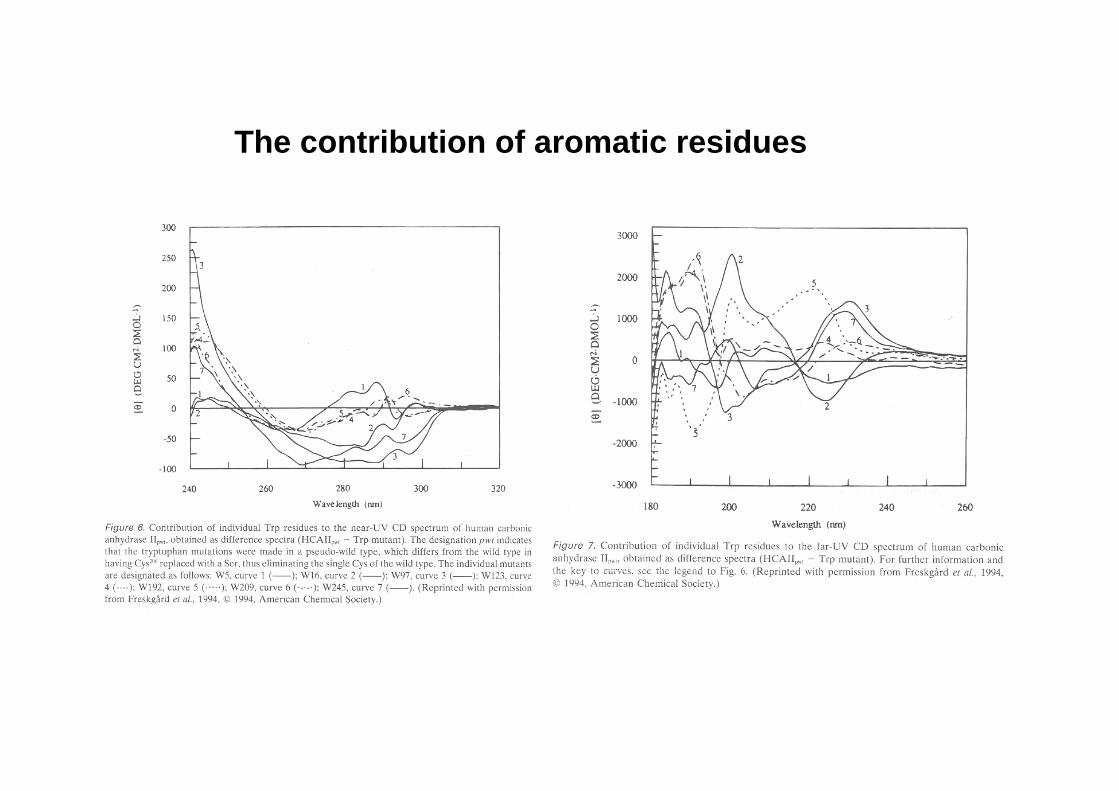
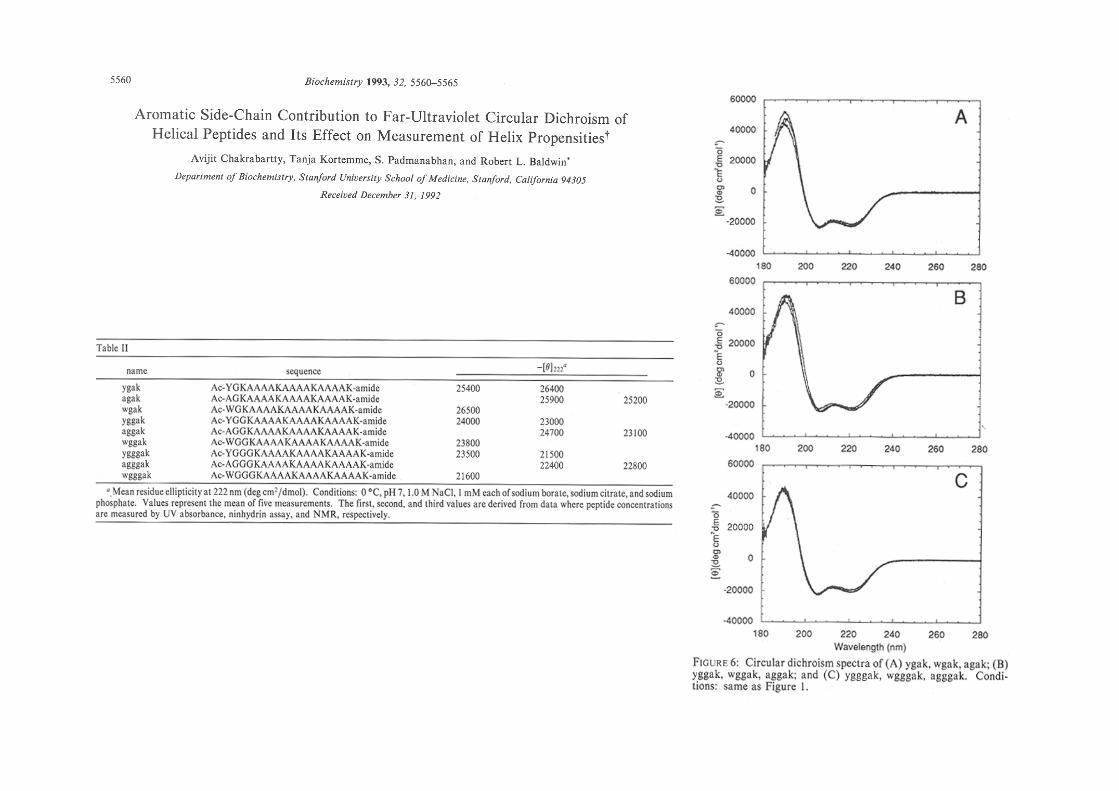
The contribution of aromatic residues

A cautionary note whenever interpreting the contributions to [θ]222!
Deconvolution of CD spectra
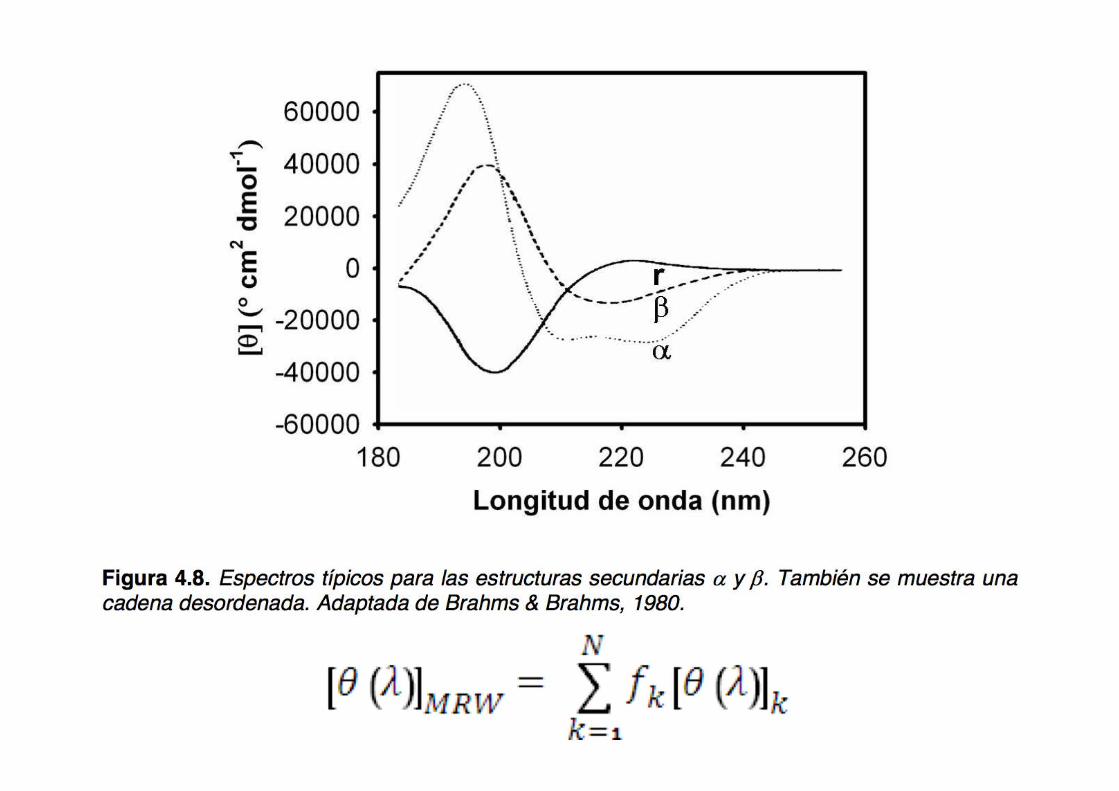

The reference spectra (basis set) for the different types of secondary structure: α helix, β sheet, and random coil
Estimate secondary structure content
A critical point is the wise choice of standards
Based on known 3D structures taken from the PDB: α helix, parallel and anti-parallel β sheet, type I, II and III β turns (Wetlaufer)
Based on amino acid polymers: poly-K, poly-E (Fasman) Problem: dependency on the length of helices, sheets or coils, uncertain contribution of turns
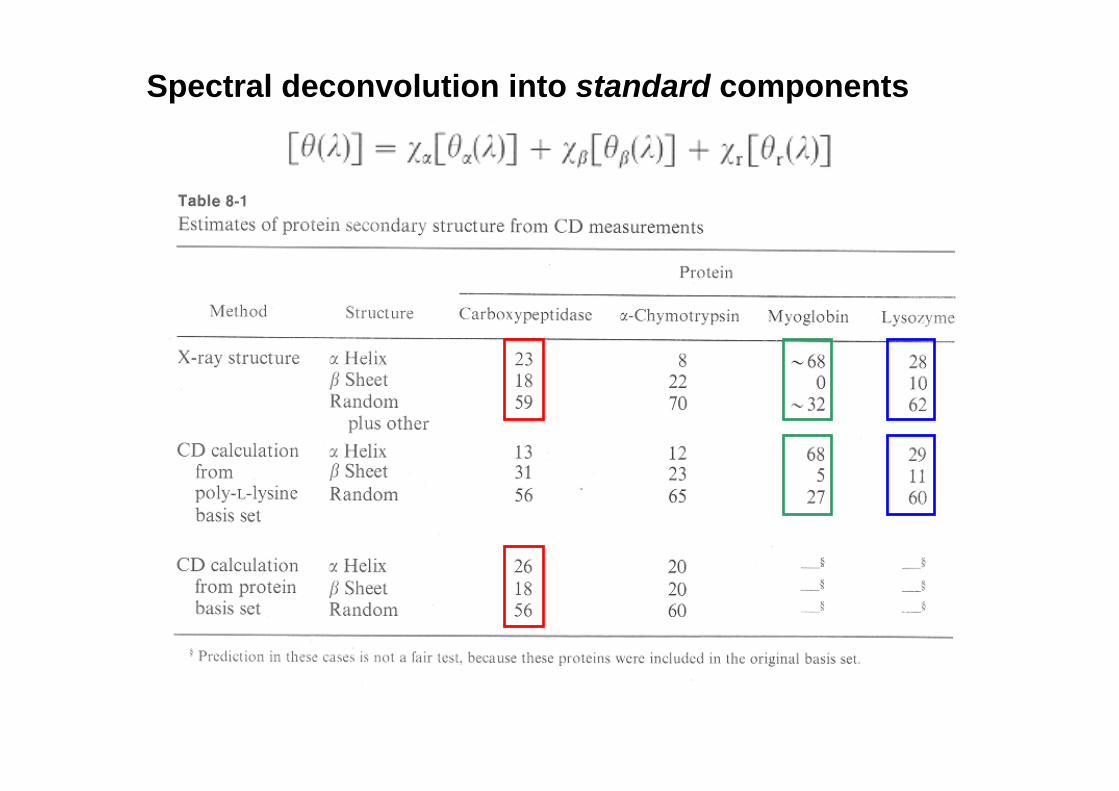
Spectral deconvolution into standard components
There are several methods to deconvolute (decompose) spectra, so that secondary structure content can be extracted: SSE CONTIN BELOK VARSLC 1 Self-consistent LINCOMB/CCA (convex constraint analysis) BPNN (use of neural networks) SOM-BPN PROT CD Check the DICHROWEB site: www.cryst.bbk.ac.uk/cdweb/html Nevertheless, problems persist in regard to the reliability of the basis sets (e.g. there is less information on β structure than on α structure), and the variable contribution of aromatic residues in this spectral region (see below)

A collection of practical examples of CD in structural biology
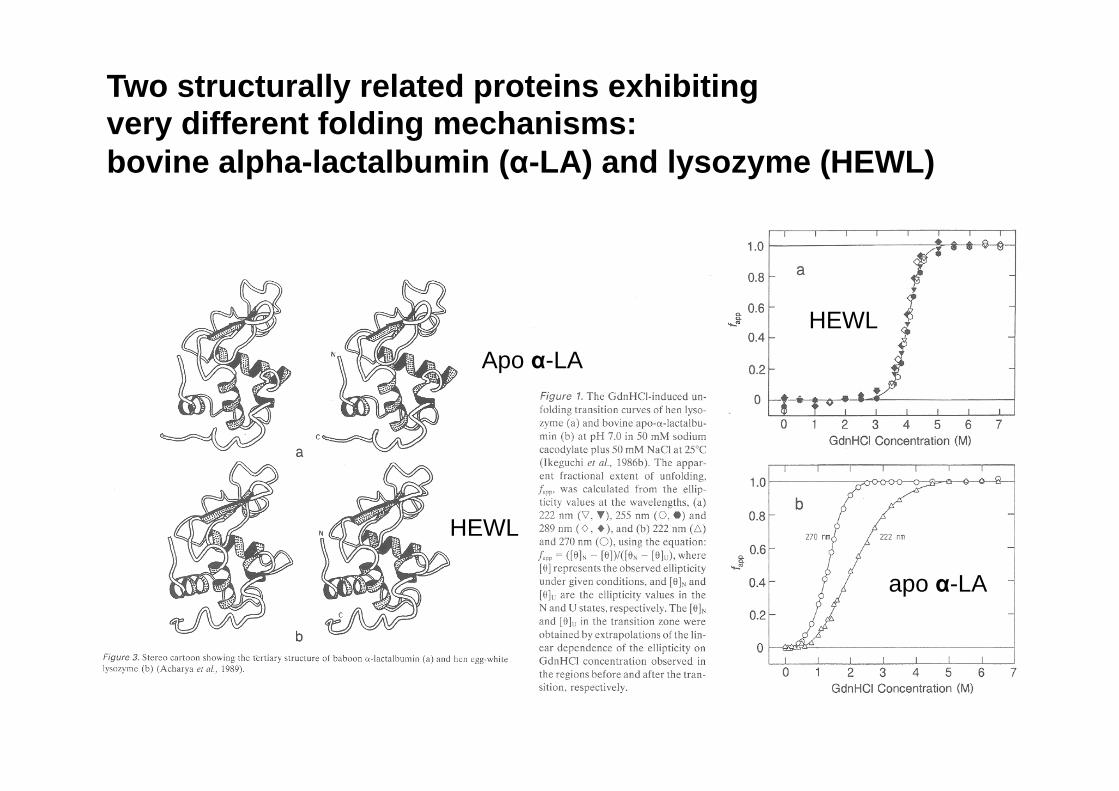
Two structurally related proteins exhibiting very different folding mechanisms: bovine alpha-lactalbumin (α-LA) and lysozyme (HEWL)
apo α-LA
HEWL
HEWL
Apo α-LA

Lisozima α-Lactalbumina
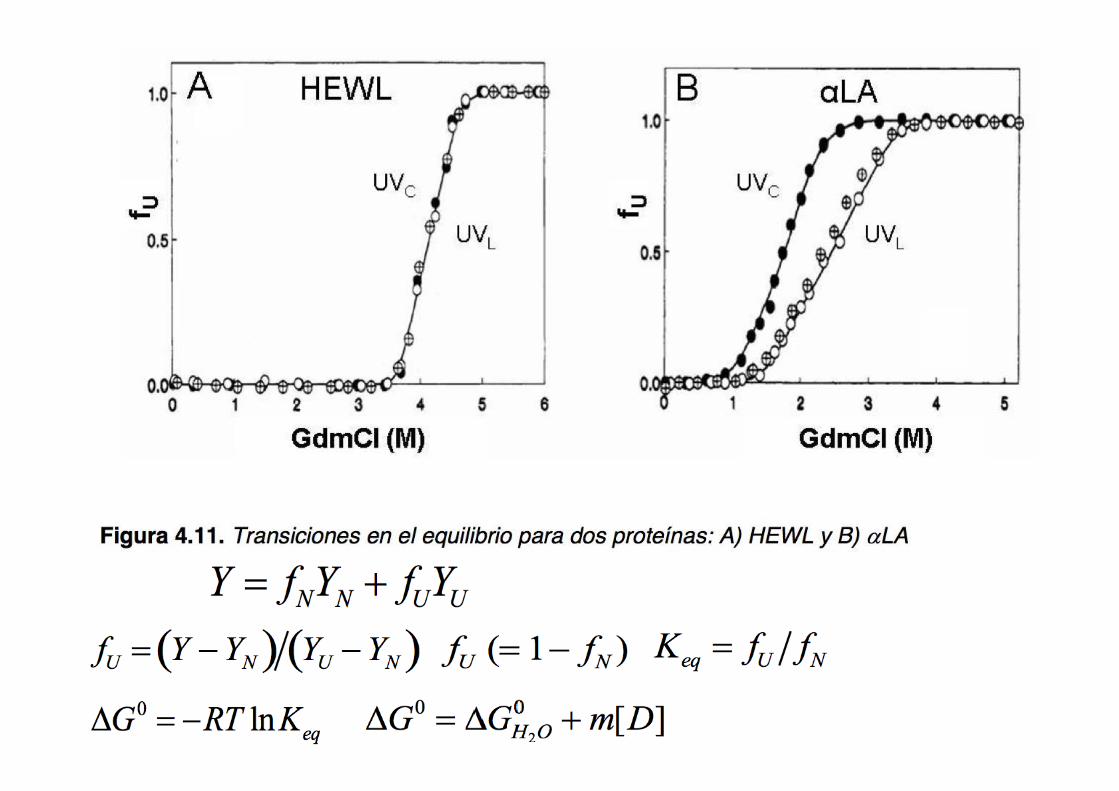
Dos proteínas estructuralmente muy similares presentan transiciones N/U muy diferentes
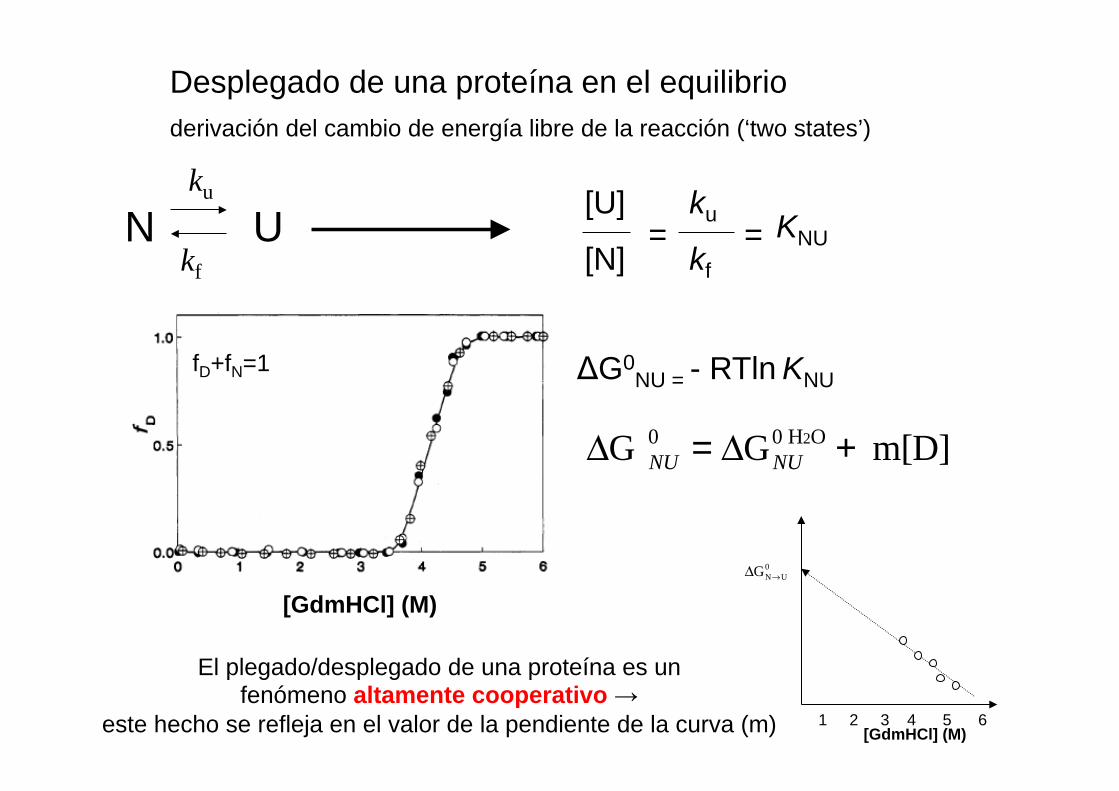
Desplegado de una proteína en el equilibrio derivación del cambio de energía libre de la reacción (‘two states’)
N U ku
kf =
[U] ku
[N] kf = KNU
ΔG0NU = - RTln KNU
[GdmHCl] (M)
ΔG NU0 = ΔGNU
0 H2O + m[D]
[GdmHCl] (M) 1 2 3 4 5 6
ΔGN→U0
fD+fN=1
El plegado/desplegado de una proteína es un fenómeno altamente cooperativo →
este hecho se refleja en el valor de la pendiente de la curva (m)
HEWL
HEWL α-LA
α-LA
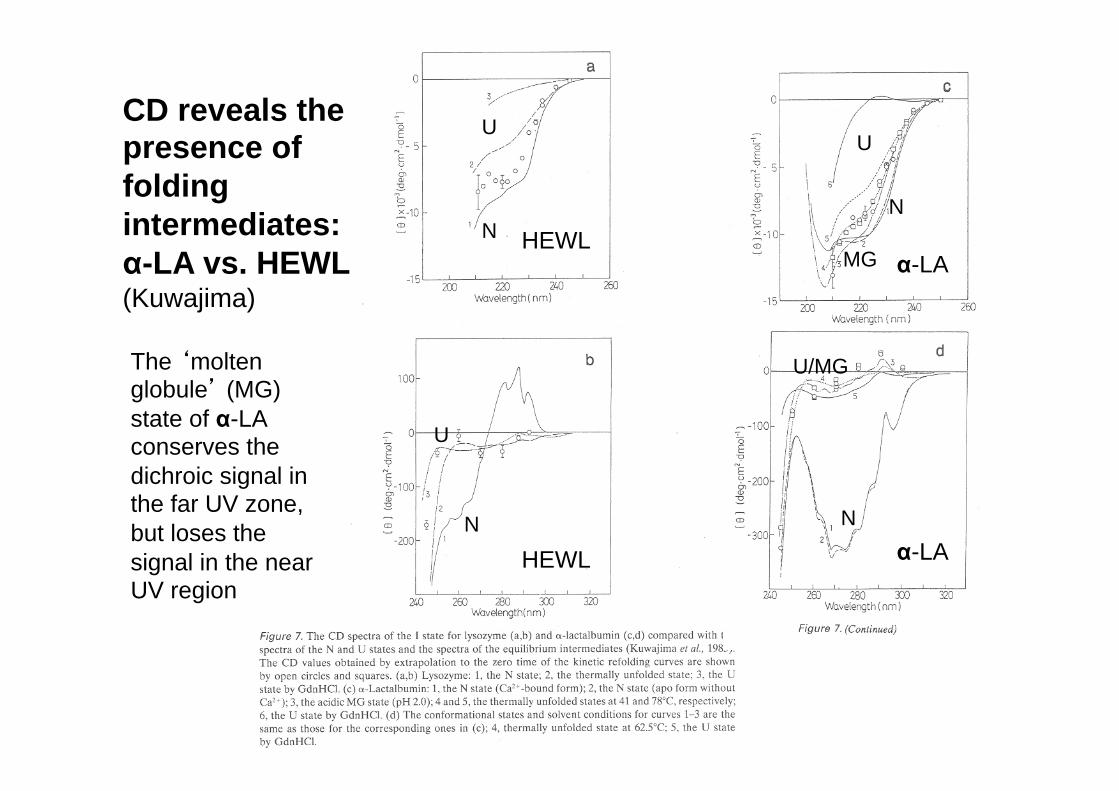
CD reveals the presence of folding intermediates: α-LA vs. HEWL (Kuwajima)
N
U
N
U
U/MG
N
N
U
MG
The ‘molten globule’ (MG) state of α-LA conserves the dichroic signal in the far UV zone, but loses the signal in the near UV region
CD as a useful signal to monitor folding kinetics
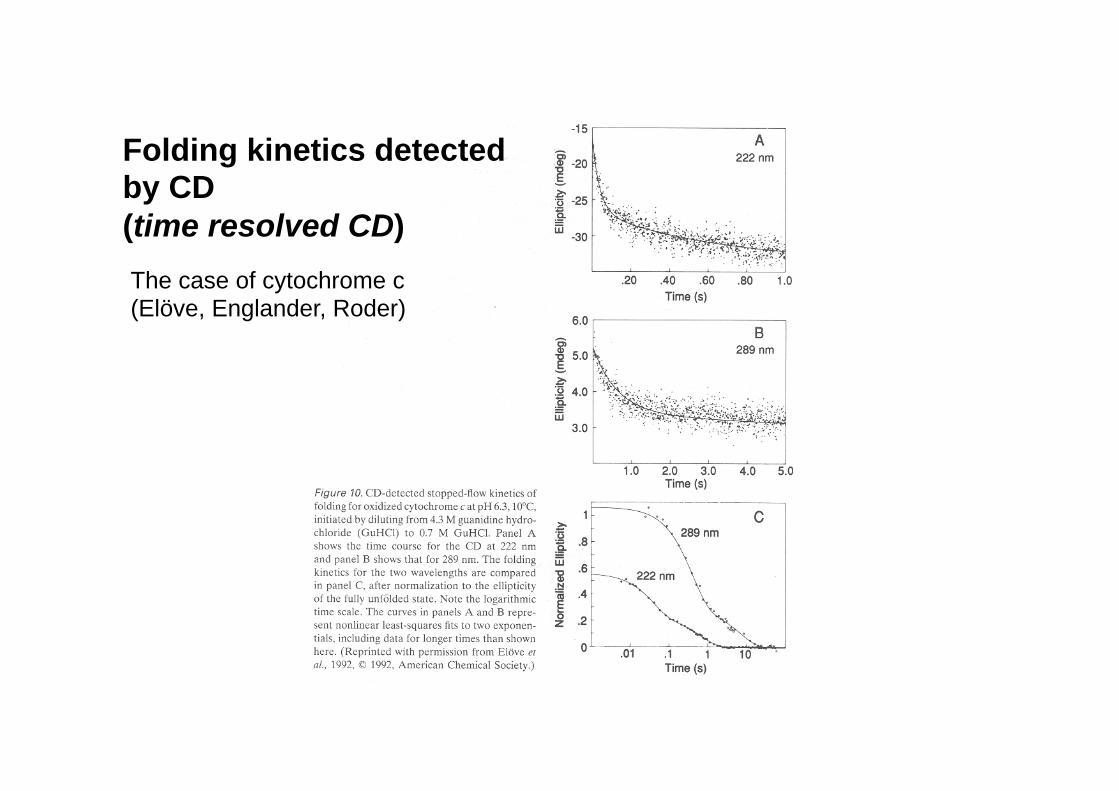
Folding kinetics detected by CD (time resolved CD) The case of cytochrome c (Elöve, Englander, Roder)
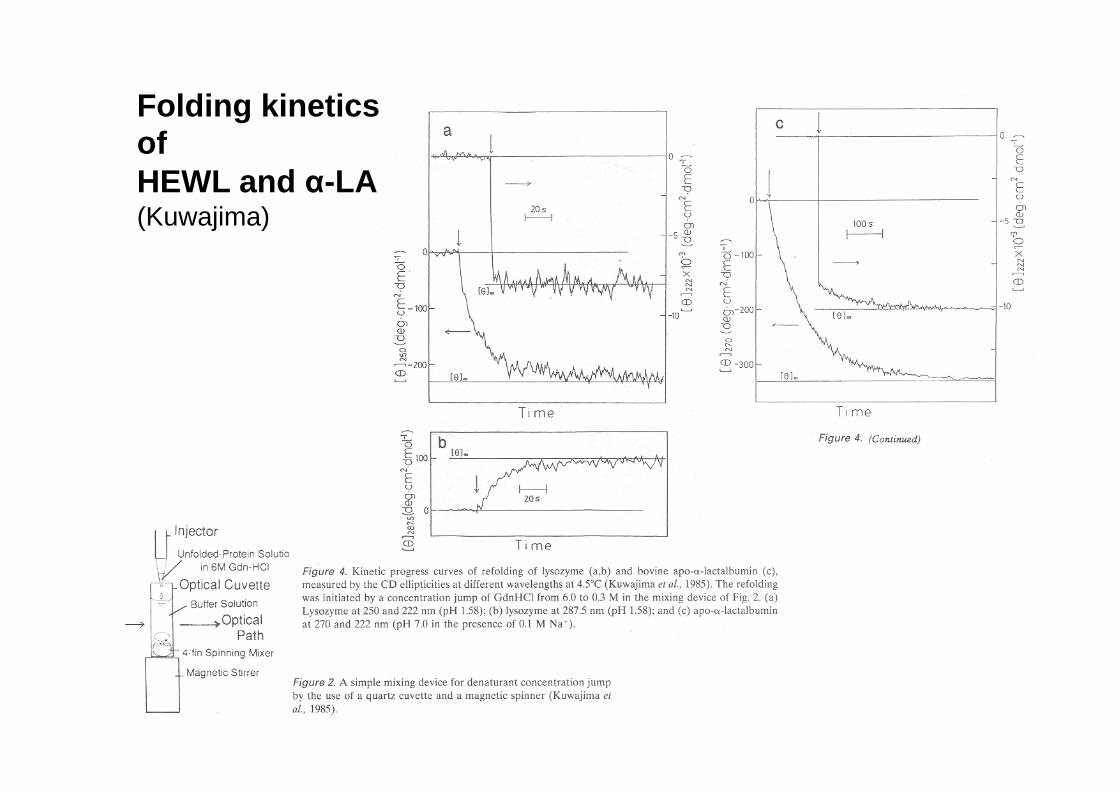
Folding kinetics of HEWL and α-LA (Kuwajima)
Binding of an ‘invisible’ ligand to a protein:
Ca2+ binding to calmodulin
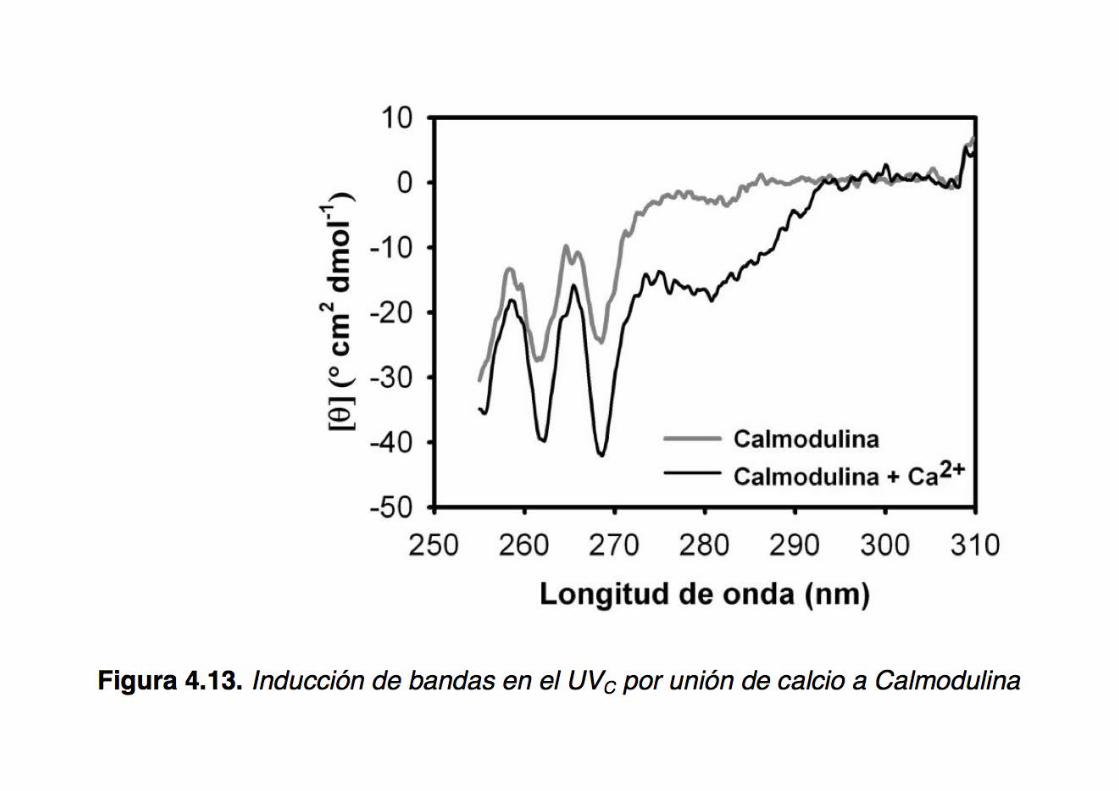
CD displays exquisite sensitivity to the nature of the
binding process
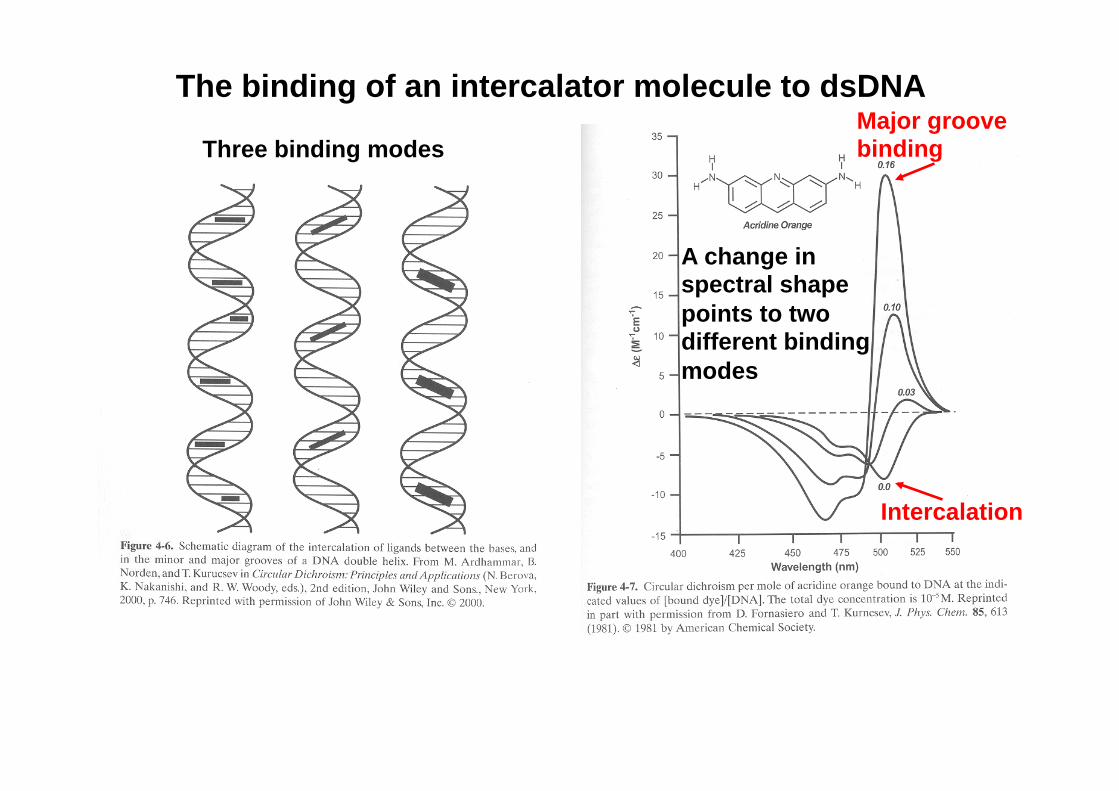
The binding of an intercalator molecule to dsDNA
Three binding modes
A change in spectral shape points to two different binding modes
Intercalation
Major groove binding

Coupling binding to folding: the protein associated with the
ribozyme ribonuclease P
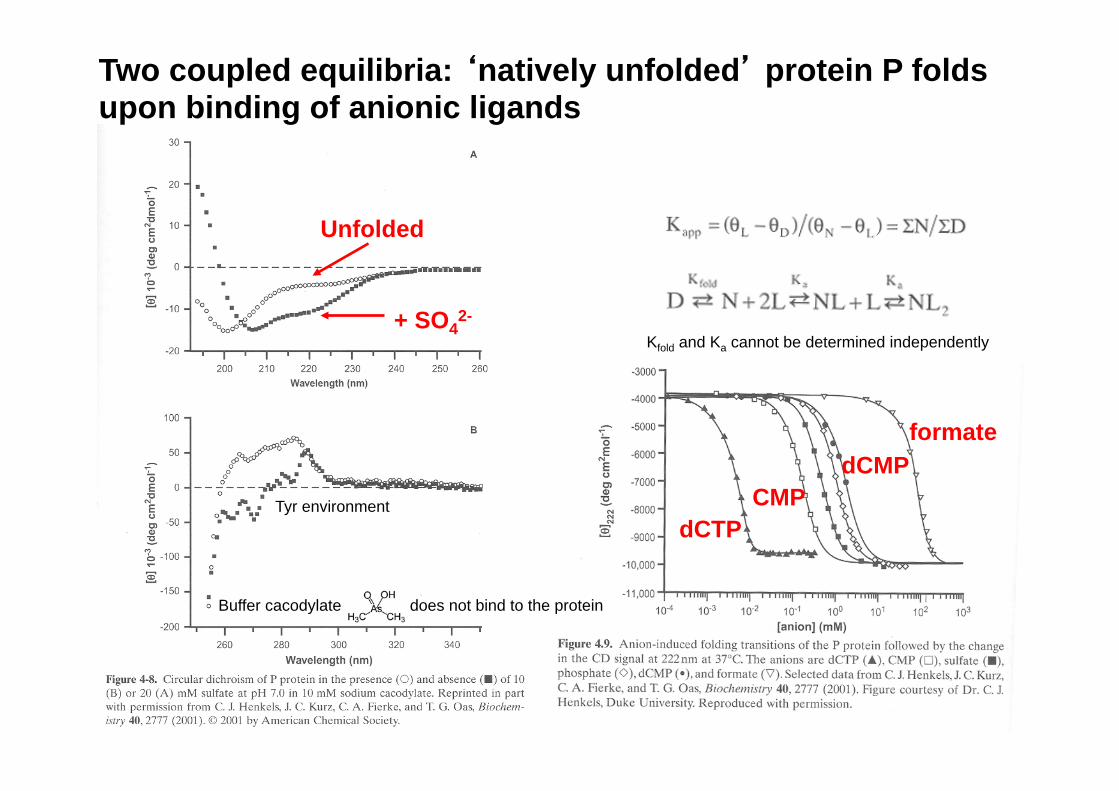
Two coupled equilibria: ‘natively unfolded’ protein P folds upon binding of anionic ligands
Unfolded
+ SO42-
dCTP CMP
formate dCMP
Buffer cacodylate does not bind to the protein
Tyr environment
Kfold and Ka cannot be determined independently
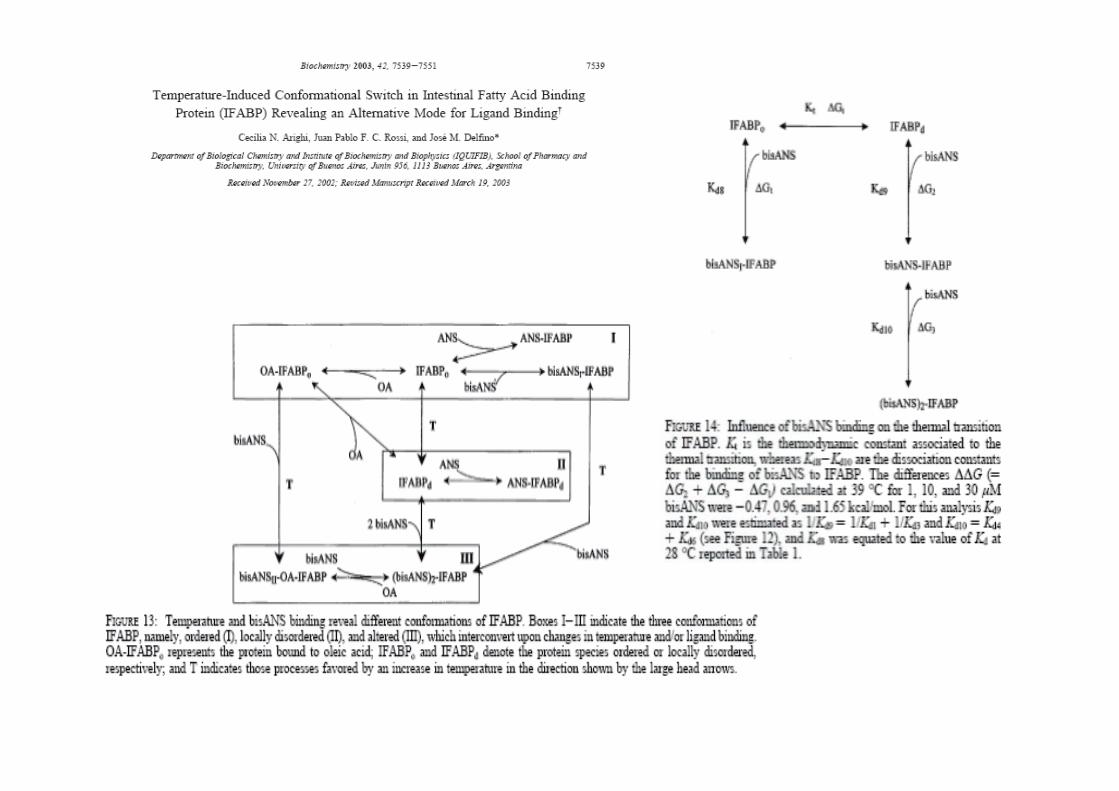
A physiological temperature-induced conformational
transition of IFABP enhancing fatty acid binding
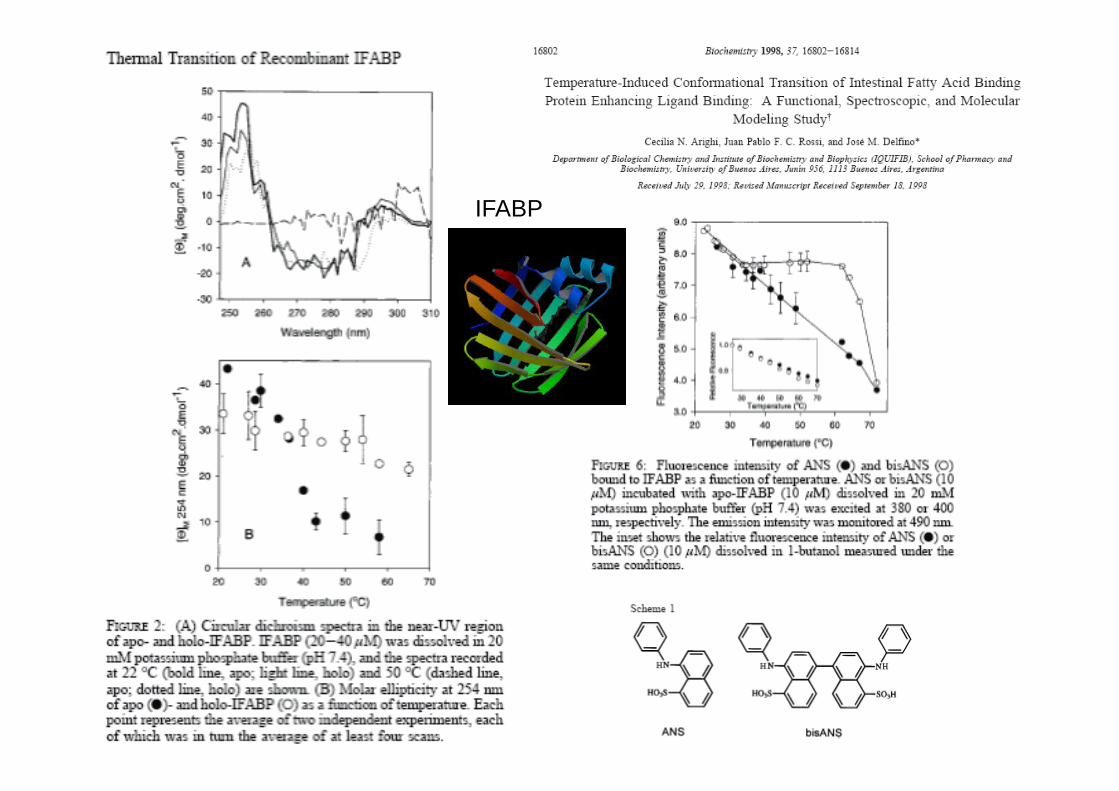
IFABP
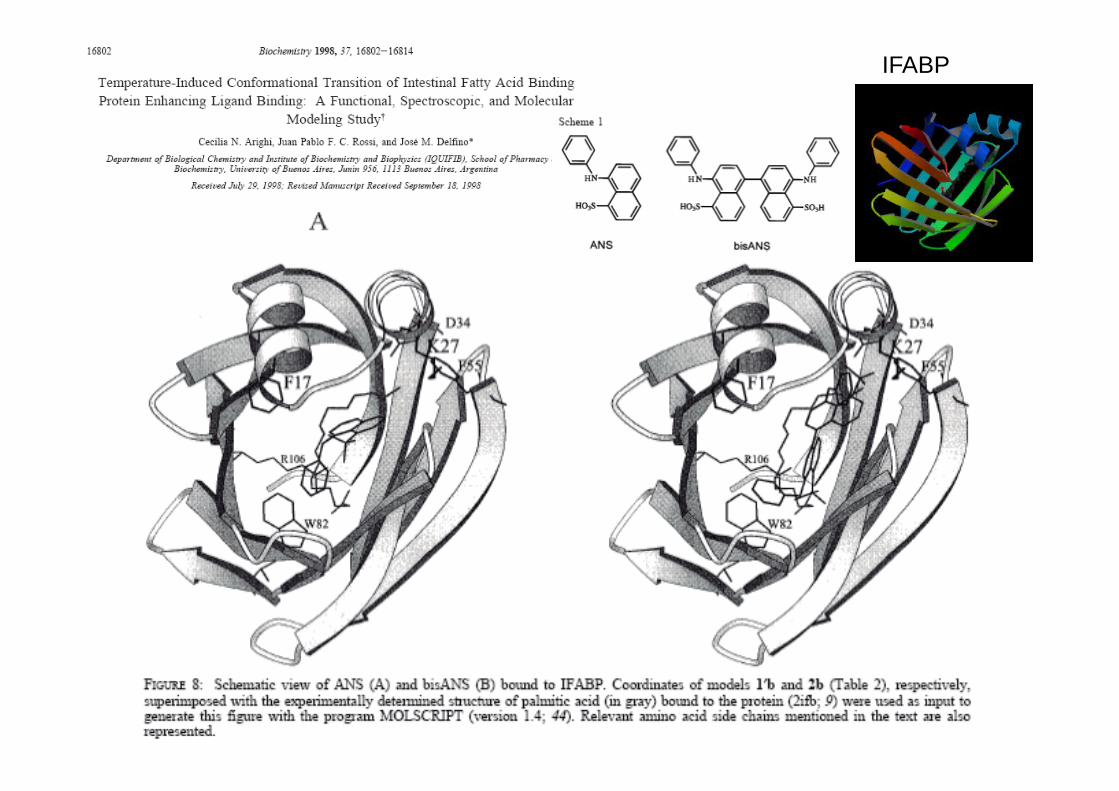
IFABP

IFABP


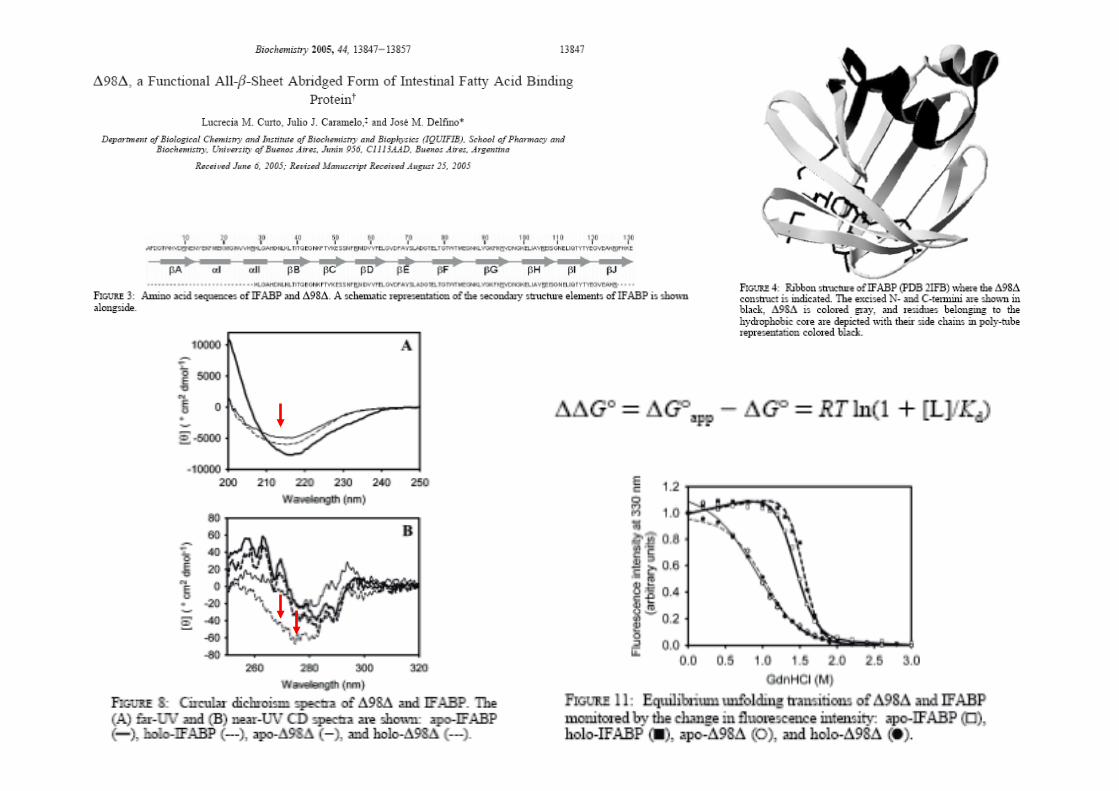
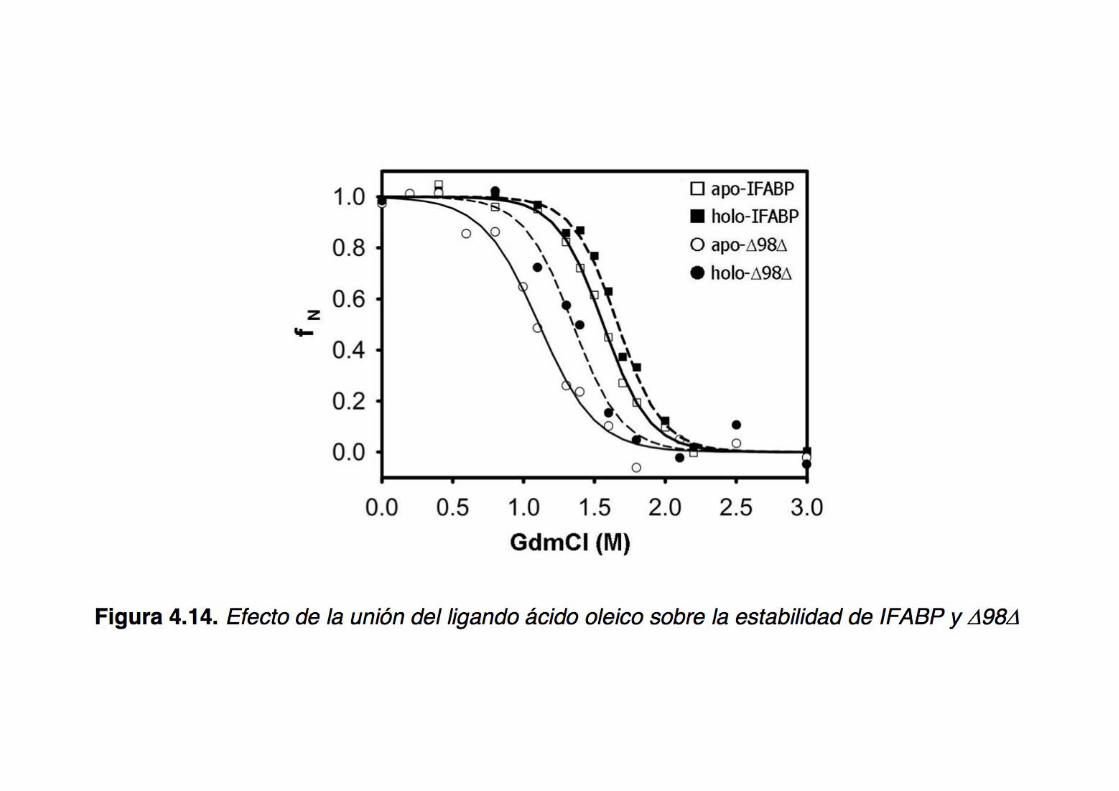
Protein conformational plasticity: fatty acid binding modulates the fine
structure of an abridged form of IFABP
Consolidation of a native fold by peptide recognition:
the case of E. coli thioredoxin
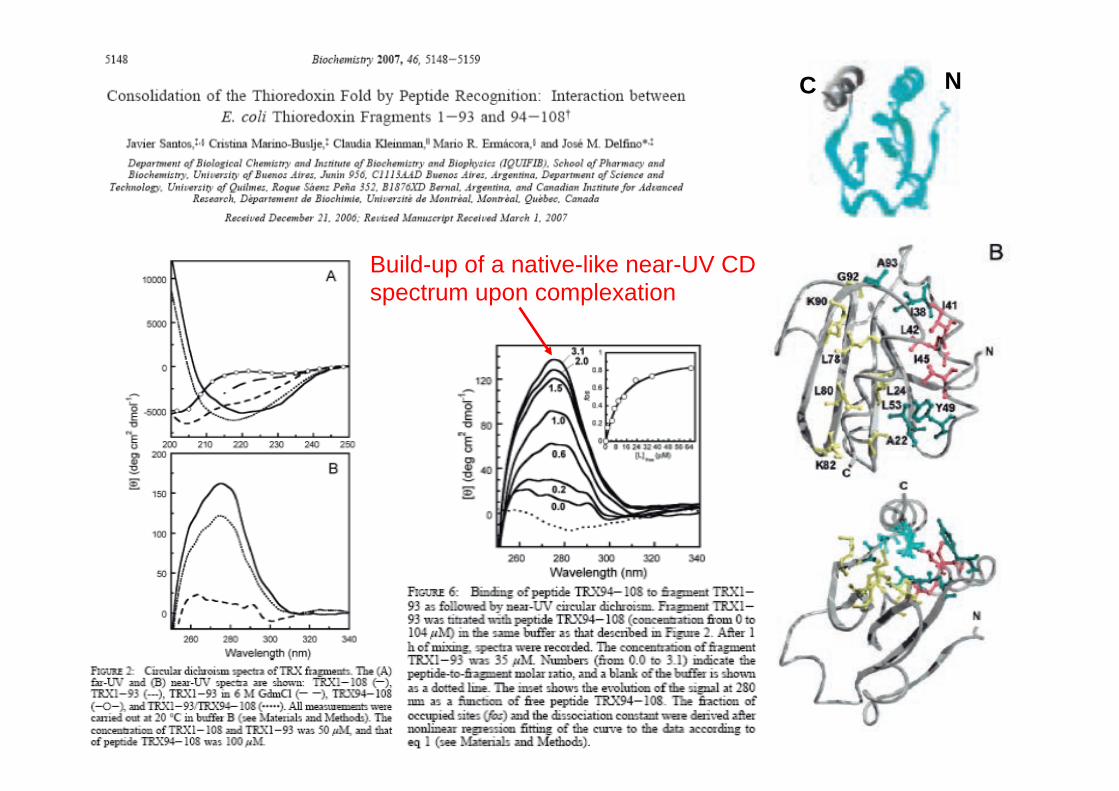
C N
Build-up of a native-like near-UV CD spectrum upon complexation
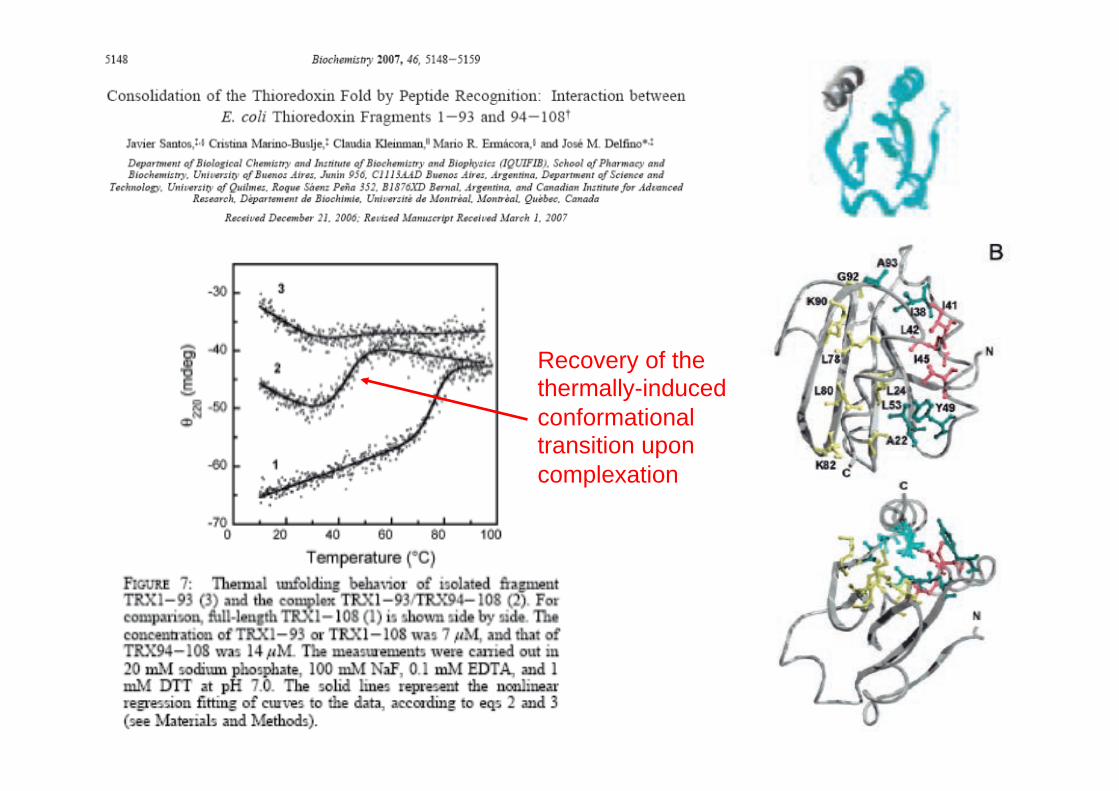
Recovery of the thermally-induced conformational transition upon complexation

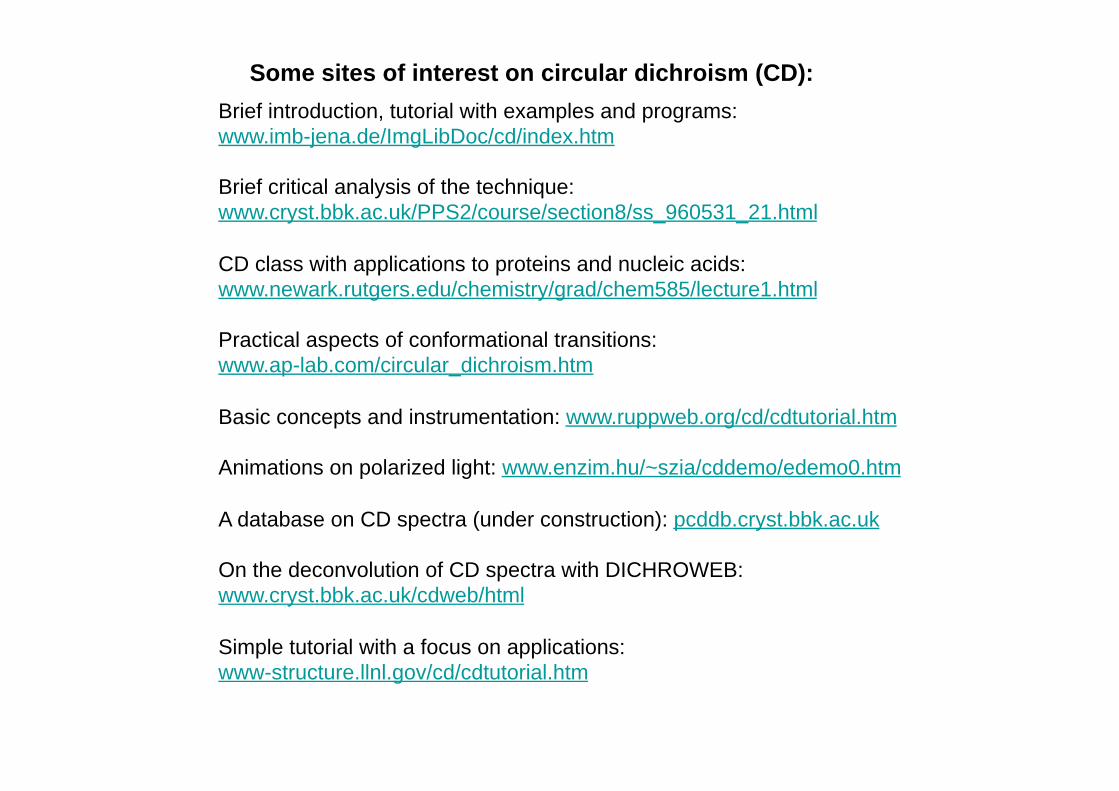
Brief introduction, tutorial with examples and programs: www.imb-jena.de/ImgLibDoc/cd/index.htm Brief critical analysis of the technique: www.cryst.bbk.ac.uk/PPS2/course/section8/ss_960531_21.html CD class with applications to proteins and nucleic acids: www.newark.rutgers.edu/chemistry/grad/chem585/lecture1.html Practical aspects of conformational transitions: www.ap-lab.com/circular_dichroism.htm Basic concepts and instrumentation: www.ruppweb.org/cd/cdtutorial.htm Animations on polarized light: www.enzim.hu/~szia/cddemo/edemo0.htm A database on CD spectra (under construction): pcddb.cryst.bbk.ac.uk On the deconvolution of CD spectra with DICHROWEB: www.cryst.bbk.ac.uk/cdweb/html Simple tutorial with a focus on applications: www-structure.llnl.gov/cd/cdtutorial.htm
Some sites of interest on circular dichroism (CD):
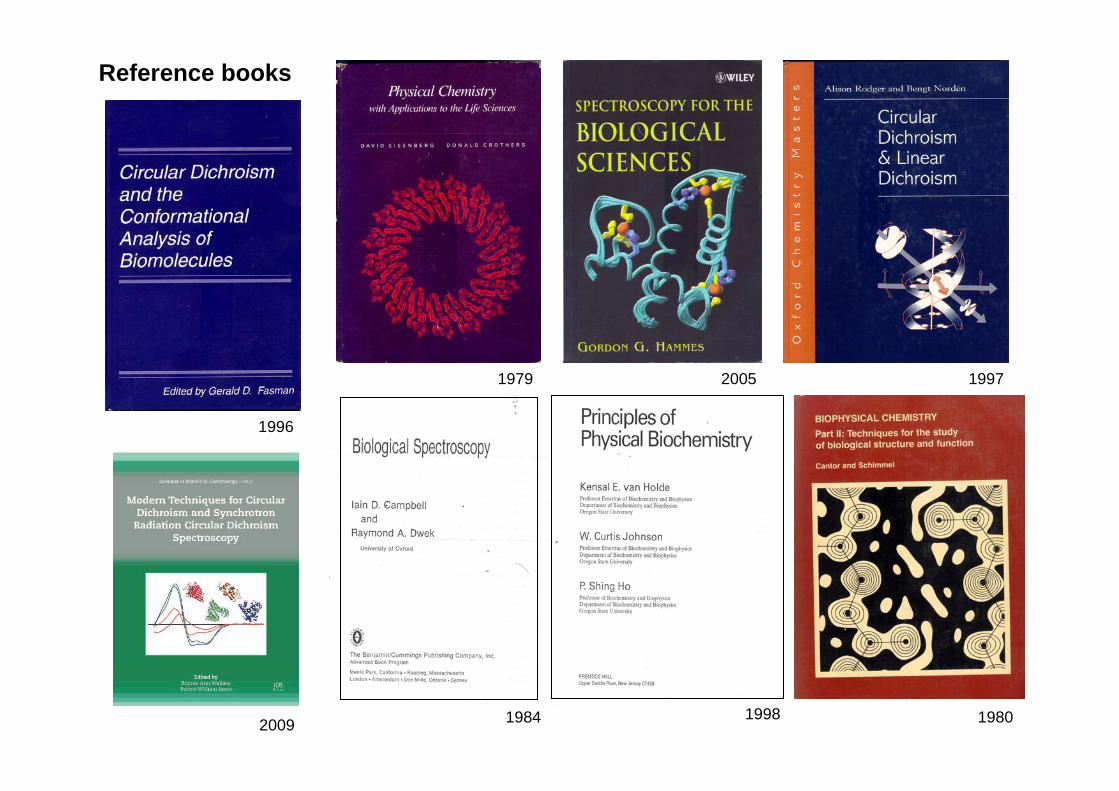
1996
1998 1984
1997 2005 1979
Reference books
1980 2009
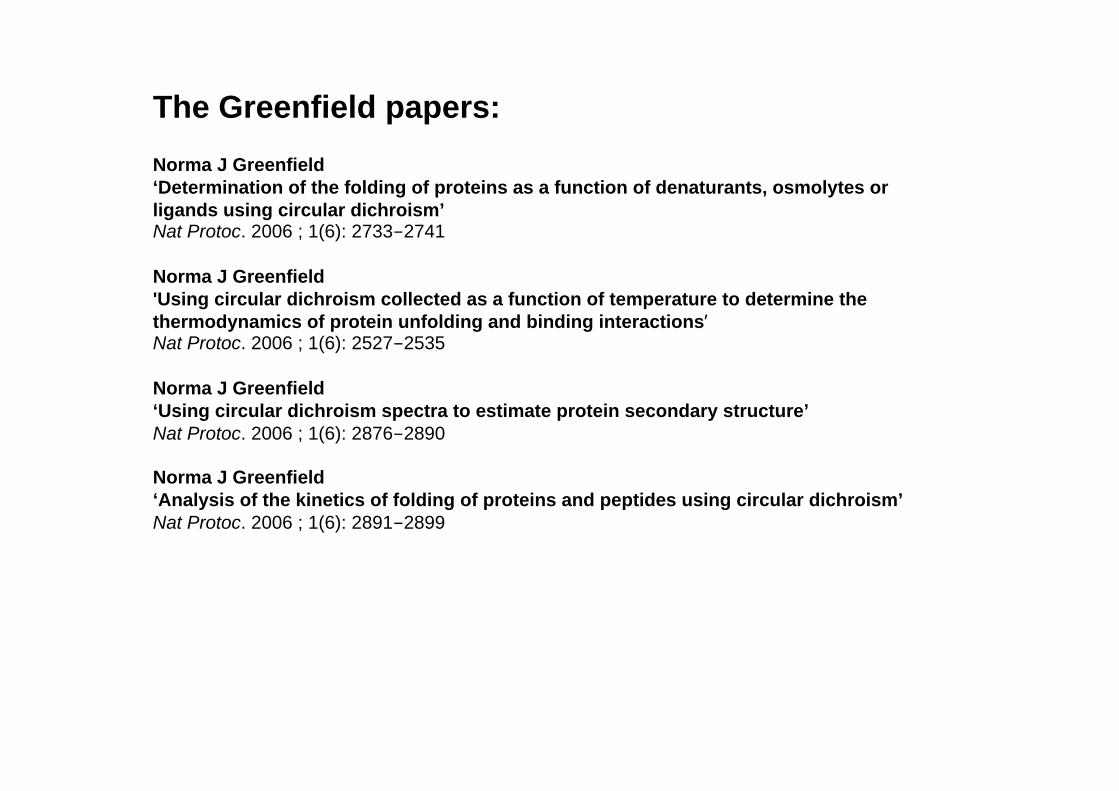
The Greenfield papers: Norma J Greenfield ‘Determination of the folding of proteins as a function of denaturants, osmolytes or ligands using circular dichroism’ Nat Protoc. 2006 ; 1(6): 2733-2741 Norma J Greenfield 'Using circular dichroism collected as a function of temperature to determine the thermodynamics of protein unfolding and binding interactions’"Nat Protoc. 2006 ; 1(6): 2527-2535 Norma J Greenfield ‘Using circular dichroism spectra to estimate protein secondary structure’ Nat Protoc. 2006 ; 1(6): 2876-2890 Norma J Greenfield ‘Analysis of the kinetics of folding of proteins and peptides using circular dichroism’ Nat Protoc. 2006 ; 1(6): 2891-2899


Extra slides
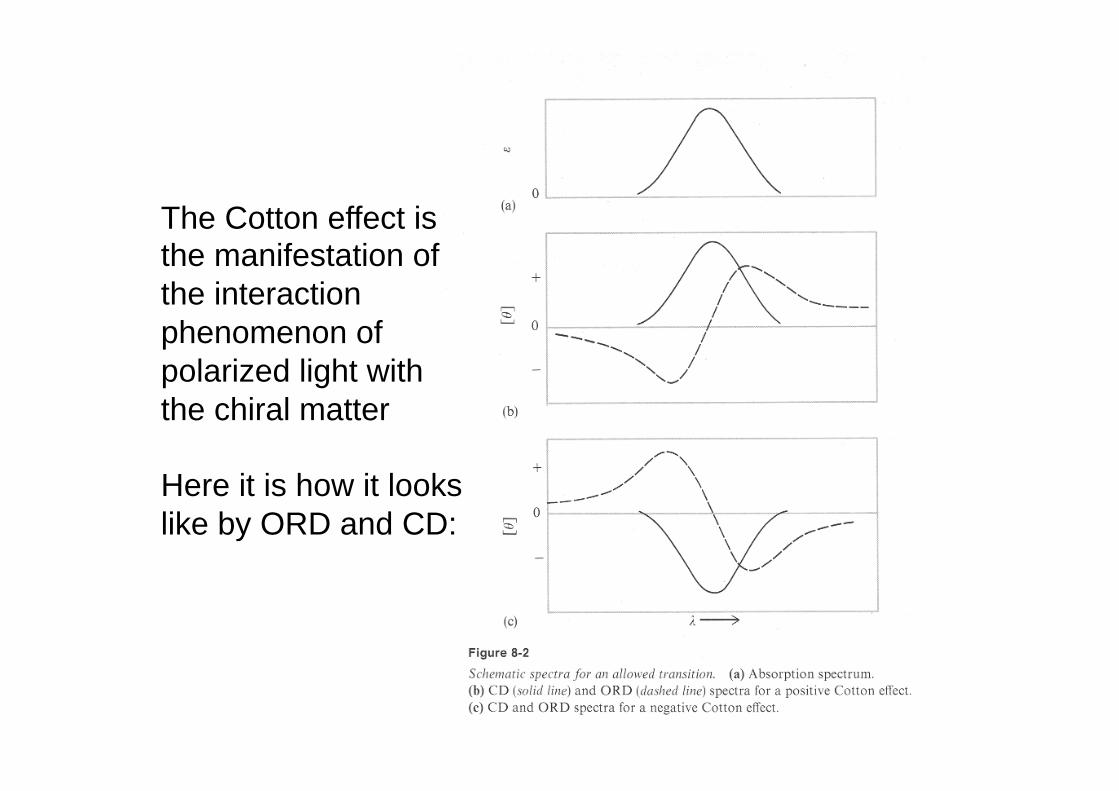
The Cotton effect is the manifestation of the interaction phenomenon of polarized light with the chiral matter Here it is how it looks like by ORD and CD:
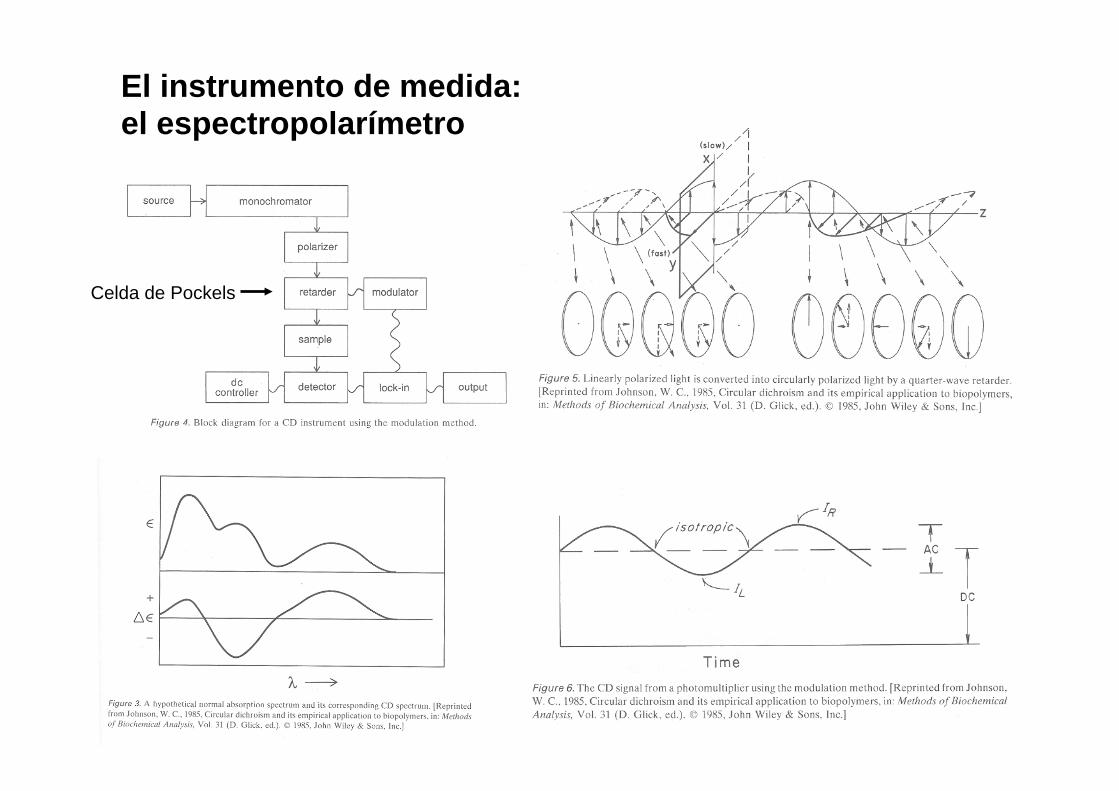
El instrumento de medida: el espectropolarímetro
Celda de Pockels
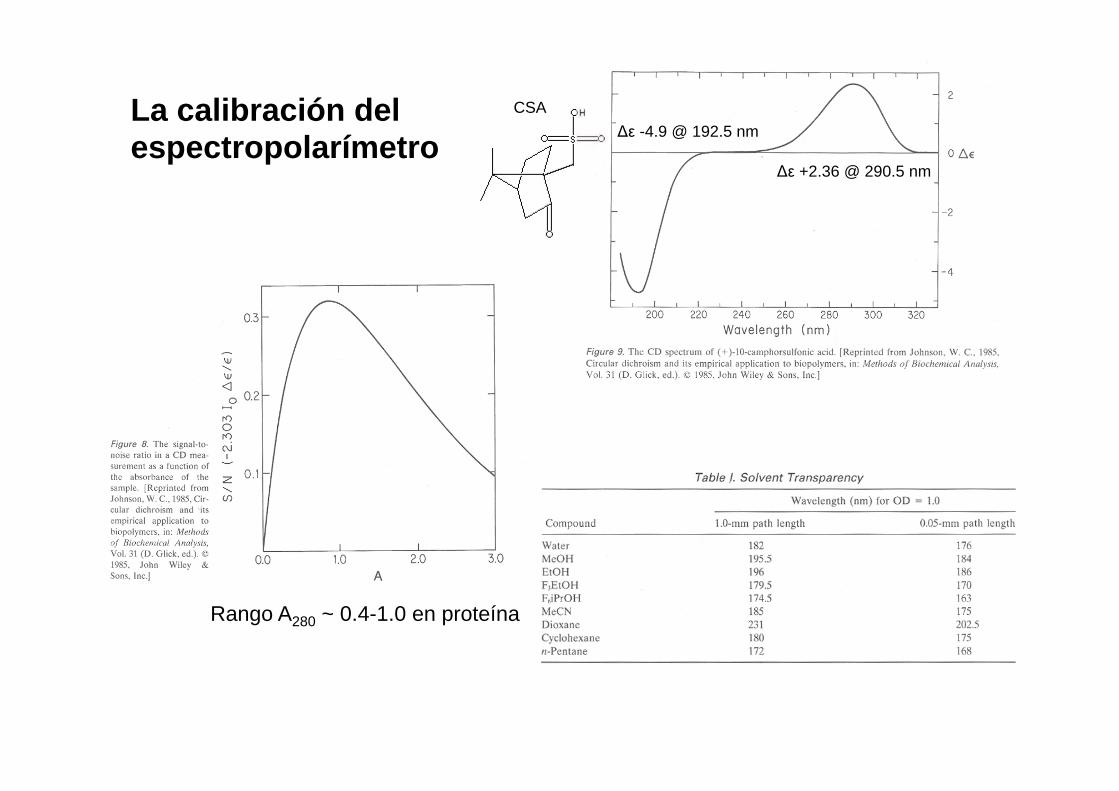
La calibración del espectropolarímetro
$* +2.36 @ 290.5 nm
$* -4.9 @ 192.5 nm CSA
Rango A280 ~ 0.4-1.0 en proteína
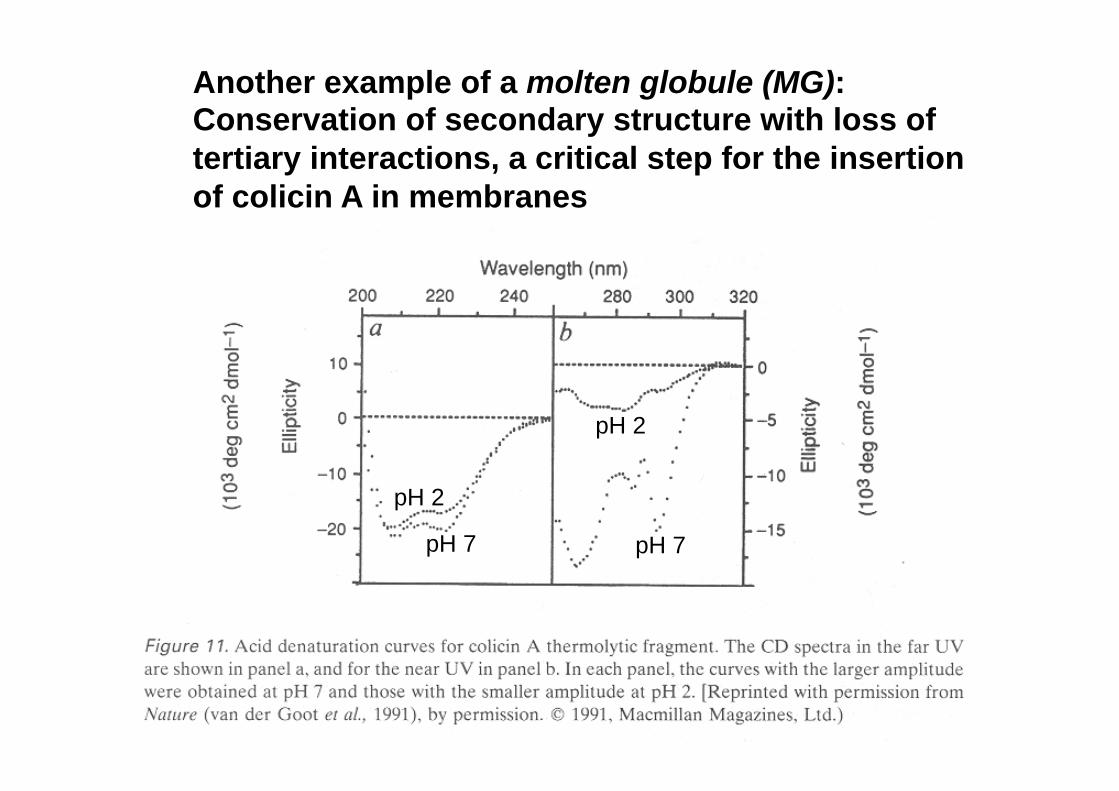
Another example of a molten globule (MG): Conservation of secondary structure with loss of tertiary interactions, a critical step for the insertion of colicin A in membranes
pH 7 pH 7
pH 2
pH 2
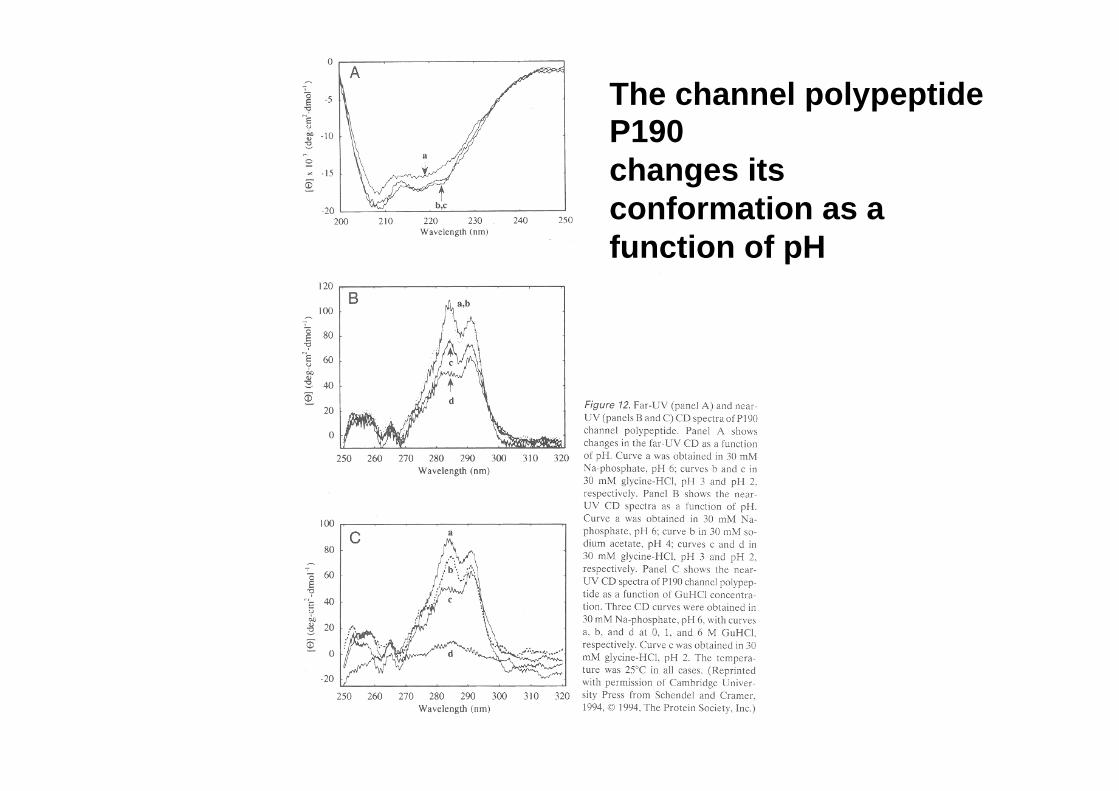
The channel polypeptide P190 changes its conformation as a function of pH


![MINERALI, ENI, M.S. Asymmetric Synthesis of ......liquid crystallography,[3] circular dichroism (CD), optical rotatory dispersion (ORD), vibrational circular di-chroism (VCD),[3] or](https://img.pdfslide.us/doc/110x75/60849e84e872c804a131f3b3/minerali-eni-ms-asymmetric-synthesis-of-liquid-crystallography3-circular.jpg)