Embed Size (px)
Citation preview
Plant and Soil 8 9 , 2 2 7 - 2 4 1 (1985). Ms. BR 15 �9 1985 Martinus NijhoffPublishers, Dordreeht. Printed in the Netherlands.
Principles and strategies in breeding for higher salt tolerance
M. C. SHANNON USDA, ARS, U.S. Salinity Laboratory, Riverside, CA 92501, USA
Key words Salt tolerance Selection Stress
Summary Salinity is an environmenta l componen t that usually reduces yield. Recent advances in the unders tanding of salt effects on plants have not revealed a reliable physiological or bio- chemical marker that can be used to rapidly screen for salt tolerance. The necessity of measuring salt tolerance based upon growth in saline relative to non-saline envi ronments makes salt tolerance measurements and selection for tolerance difficult. Additionally, high variability in soil salinity and environmenta l interactions makes it questionable whether breeding should be conducted for tolerance or for high yield. Genetic techniques can be used to identify the componen t s of variation at tr ibutable to genotype and environment , and the ex ten t of genetic variation in saline and nonsaline envi ronments can be used to est imate the potential for im- proving salt tolerance. Absolute salt tolerance can be improved best by increasing both absolute yield and relative salt tolerance.
Introduction
The need to develop crops with higher salt tolerance has increased t remendously within the last decade; however, methods and ap- proaches for accomplishing this goal are either not available or not well-defined because of a lack of information required for conduc- ting successful research. The objective of this paper is to describe how some progress may be made toward obtaining plants with en- hanced salt tolerance by meshing the theoretical aspects of breeding plants for salt tolerance with the present knowledge concerning the effects and mechanisms of salt stress. For brevity, it will be assumed that the readers are familiar with background information on the physiology and biochemistry of salt effects on plants. If not, there are several recent and thorough reviews on these subjects 6'8'12,1s Generally, successful breeding requires the existence of variability and a means of stable transfer o f a character from one individual to another. A method of recognition or identification of the character is required so that a selection protocol may be devised. The choice of an easily identifiable character, or marker, is highly desirable to simplify the selection procedure. From this point, all approaches basically include selection and breeding, but there is much diversity of selection criteria and philosophies. The actual method of breeding and inducing recombination is dependent upon the breeding system of the crop (i.e., inbreeding, outbreeding, etc.).
227
228 SHANNON
Variability in plant responses to salinity
Extremely high salt concentrations kill plants through the combined effects of ion toxicity and decreased water potential. More moderate, but still high, concentrations of salt may cause leaf burn and severe growth inhibition. At more moderate to low salinities, differences in growth rate are often the only visual symptom of. salt effect, though in some species there is also a slight darkening and/or thickening of the leaf. Although this general description of salt effects applies to all higher plants, there is a great deal of variation among species and even cultivars within a species in the degree of response to any level of salinity.
The subject of genetic variability among plants in responses to salt has been reviewed on several o c c a s i o n s 14,24,25 Variability in salt res- ponse, as with almost any character, increases through the progression from variety to species to genus to family. Although salt-tolerant species are found among a wide range of plant families, some families have greater numbers of tolerant species. For example, the Chenopodiaceae include many salt-tolerant species, ranging from wild species of Salicornia and Atriplex to the cultivated sugarbeet (Beta vulgaris). Representative salt-tolerance species in the Gramineae are wild Spartina species, tall wheatgrass (Elytrigia pontica), bermudagrass (Cynodon dactylon), barley (Hordeum vulgare) and sugarcane (Saccharum officinarum). Variability in salt tolerance within species has been reported with increasing frequency in recent years; however, the choice of criteria by which tolerance is measured has not been consistent among investi- gatorsa4, 15, 19, 23,26
Tolerant phenotypes
Despite the mult i tude of comparisons that have been made between salt-tolerant and salt-sensitive species, few distinctive phenotypic markers reliably distinguish sensitive from tolerant individuals. A useful phenotype for plant breeding is an observable or otherwise measurable character. The phenotype (P) of a plant is the expression of the plant's genetic consti tution (G), or genotype, modified by the environment (E). This relationship is commonly stated as P = G + E. Some traits that investigators have tried to use as markers include the Na § exclusion mechanisms in soybean (Glycine max) 1 , tomato (Lycopersicon species) 2~ and wheatgrass (Elytrigia pontica) 23, C1- exclusion in Citrus 16, and pollen sterility in rice (Oryza sativa) 2. Even these were applicable only within a limited range of salt concentrations and are species- or variety- specific. For example, Rush and Epstein 19,2~ found ion accumulation
BREEDING FOR HIGHER SALT TOLERANCE 229
in the wild tomato species Lycopersicon cheesmanii to be a reflection of the halophytic nature of that ecotype, whereas Sacher et al. 21.22 have found no relationship between ion accumulation and salt tolerance in crosses between L. peruvianum and its cultivated descendent L. esculentum.
Phenotypic markers have not been used successfully in any concerted breeding effort. One problem is that it is unlikely that salt tolerance is determined by a single gene. Salt tolerance is probably the expression of a number of genes, and the importance of the expression of each is dependent upon its interaction with other salt tolerance genes and the external salt concentration.
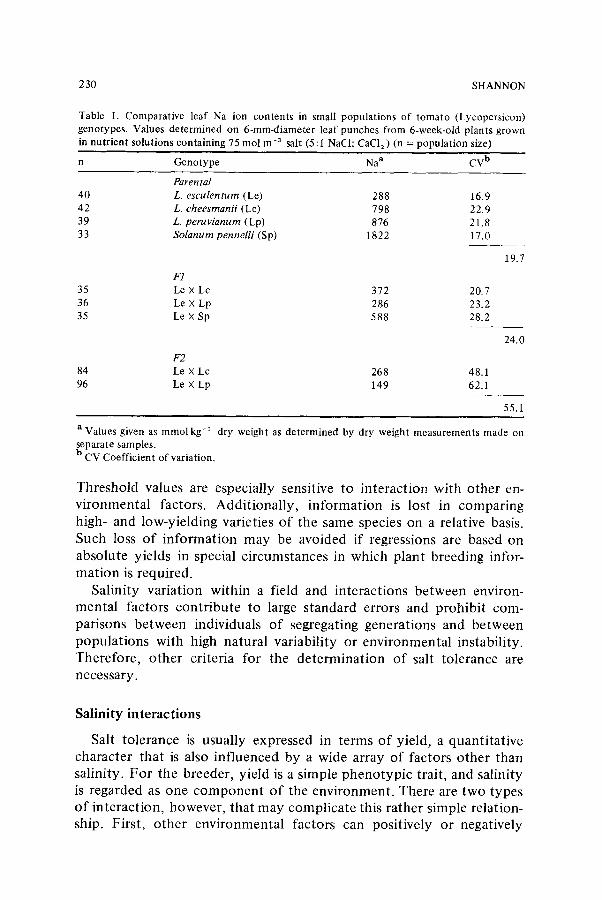
The study of the inheritance of any character centers around its variation. Components causing variation (V) must be separated from one another. For example, in a heterogeneous populat ion Vp = Vg + Ve, whereas in a genetically homogeneous populat ion Vg = 0 and Vp = Ve. If both homogeneous and heterogeneous populations can be tested in the same environment, then Ve can be measured with the homogeneous population, and the Vg of the heterogeneous populat ion can thus be determined. Tomato is self-pollinating, and parental and F 1 populations can be considered to be highly homogeneous. Leaf Na accumulation in parental and F1 populations of tomato had coefficients of variation (CV) o f about 22% (Table 1). The F2 populations, which are hetero- geneous, had CV values of 5 5%, an increase in genetic variance of about 33% for this character as a result of intraspecific crosses.
Measurement of salt tolerance
Maas and Hoffman 11 have proposed that salt tolerance be defined by a simple linear equation, described in general terms as y = a + b (x), where y = relative yield and x = salinity of the saturated soil extract o f the root zone measured in units o f electrical conductivi ty (dS/m). Actual salt response data are of ten nonlinear and follow a reverse sig- mold curve with a small but significant increase in yield at low salinities. However, a simple linear equation is applicable t o .mos t of the data obtained from salt tolerance studies 11. Significant parameters of the equation include the slope (b), which is a representation of decline in yield per increment salinity increase, and the threshold, which is the lowest salinity at which a significant yield reduction occurs. Both yield decline and threshold are measured relative to nonsalinized plants. Such measurements are useful for comparing salt tolerance between species with large differences in yield potential, but carefully controlled con- ditions are necessary to obtain meaningful threshold and slope values.
230 SHANNON
Table I. Comparative leaf Na ion contents in small populations of tomato (Lycopersicon) genotypes. Values determined on 6-mm-diameter leaf punches from 6-week-old plants grown in nutrient solutions containing 75 tool m-3 salt (5 : I NaCI: CaC12 ) (n --- populat ion size)
n Genotype Na a CV b
Parental 40 L. esculentum (Le) 288 16,9 42 L. eheesmanii (Lc) 798 22.9 39 L. peruvianum (Lp) 876 21.8 33 Solanum pennelli (Sp) 1822 17.0
F1 35 Le • Lc 372 20.7 36 Le X Lp 286 23.2 35 Le X Sp 588 28.2
F2 84 Le • Lc 268 48.1 96 Le X Lp 149 62.1
19.7
24.0
55.1
a Values given as mmol kg-~ dry weight as determined by dry weight measurements made on separate samples. b CV Coefficient of variation.
Threshold values are especially sensitive to interaction with other en- vironmental factors. Additionally, information is lost in comparing high- and low-yielding varieties of the same species on a relative basis. Such loss o f information may be avoided if regressions are based on absolute yields in special circumstances in which plant breeding infor- mation is required.
Salinity variation within a field and interactions between environ- mental factors contribute to large standard errors and prohibit com- parisons between individuals of segregating generations and between populations with high natural variability or environmental instability. Therefore, other criteria for the determination of salt tolerance are necessary.
Salinity interactions
Salt tolerance is usually expressed in terms o f yield, a quantitative character that is also influenced by a wide array of factors other than salinity. For the breeder, yield is a simple phenotypic trait, and salinity is regarded as one component o f the environment. There are two types o f interaction, however, that may complicate this rather simple relation- ship. First, other environmental factors can positively or negatively
BREEDING FOR HIGHER SALT TOLERANCE 231
modify the effect of salinity, as has been discussed elsewhere 11'12,24. Second, genotype-environment interaction means that the 'best geno- type ' at one salt concentrat ion may not be the 'best ' at another. For instance, at a moderate salinity the criterion for selection may be significant yield reduction 26, while at high salinity survival might be the criterion a,14. Unfortunately, there is a fundamental gap in our understanding concerning the relationship between tolerance at low and high salinities. This is an important problem in choosing the salt concentrat ion that will be used for screening. While it may be sus- pected that the physiological mechanisms that prevent damage at low salt concentrations are not the same as those that contr ibute to toler- ance at extremely high concentrations, there is very little experimental evidence on which to base a conclusion. The principles of quantitative genetics could be used to study this problem. It has been demonstrated that a character measured in two different environments may be regarded as two characters rather than one 4. By regarding tolerance at high and low salinities as different characters, variances of response at low and high salinity can be used to determine the genetic correlation between the characters. A low correlation would mean that different genes are involved and a high correlation would indicate the involve- ment of the same gene or genes.
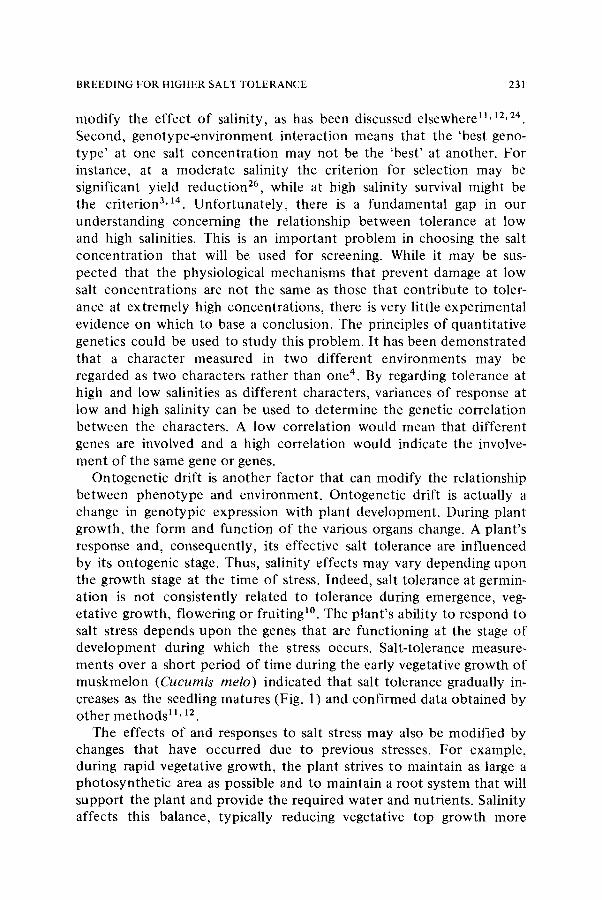
Ontogenetic drift is another factor that can modify the relationship between phenotype and environment. Ontogenetic drift is actually a change in genotypic expression with plant development. During plant growth, the form and function of the various organs change. A plant's response and, consequently, its effective salt tolerance are influenced by its ontogenic stage. Thus, salinity effects may vary depending upon the growth stage at the time of stress. Indeed, salt tolerance at germin- ation is not consistently related to tolerance during emergence, veg- etative growth, flowering or fruiting 1~ The plant's ability to respond to salt stress depends upon the genes that are functioning at the stage of development during which the stress occurs. Salt-tolerance measure- ments over a short period of time during the early vegetative growth of muskmelon (Cucumis melo) indicated that salt tolerance gradually in- creases as the seedling matures (Fig. 1) and confirmed data obtained by other methods 11,12
The effects o f and responses to salt stress may also be modified by changes that have occurred due to previous stresses. For example, during rapid vegetative growth, the plant strives to maintain as large a photosynthet ic area as possible and to maintain a root system that will support the plant and provide the required water and nutrients. Salinity affects this balance, typically reducing vegetative top growth more
232 SHANNON
>.-
OJ >-
o ~D
m
O (y)
>o
~D r r
1.0 �9 O
O
0.8 []_ I o
o_ ;~J-~5-~ 2_ op ; ~ o
0.4
0.2
~176 2'0 4b 6b 8'o ,;o Saline Fresh Wt , g
Fig. 1. Salt tolerance of 68 muskmelon (Cucumis melo) cultivars in four sand culture experi- ments in the greenhouse. In each experiment (shown by different symbols) cultivars were irrigated with control (1 dS/m) or saline (~--8dS/m) nutrient solutions. Time between salin- ation and harvest varied between 2 and 4 weeks with experiment and was directly related to the differences in average fresh weight. Y1 is fresh weight of controls and Y2 is fresh weight of salinized plants.
than root growth lz. Such changes may affect the severity of and res- ponse to subsequent stresses.
Selection criteria
In plant breeding the most widely utilized criteria for selection are (1) mean yield, (2) regression response on site mean yield, and (3)uni - formity o f regression. Selection for mean yield is fundamentally a selection for the most high-yielding variety. Selection for the latter two criteria are based on stable performances across a range of environ- ments. In the commercial agriculture characteristic o f highly developed countries, high yield is the most important objective, whereas stable performance is more important in subsistence agriculture.
Regression response on site mean yield has been employed by breeders to measure yield stability across environments s and is similar to the regression method used to measure salt tolerance. A linear regression calculation is made of variety yield against the mean yield of all varieties at each location or environment. The use of mean yield allows a numeric grading of environments across sites and seasons. Because simple variety yields are plot ted against the mean of all varieties, the population mean has a slope of 1.0. Slopes greater than unity indicate less stability than slopes smaller than 1.0. A small slope is also
BREEDING FOR HIGHER SALT TOLERANCE 233
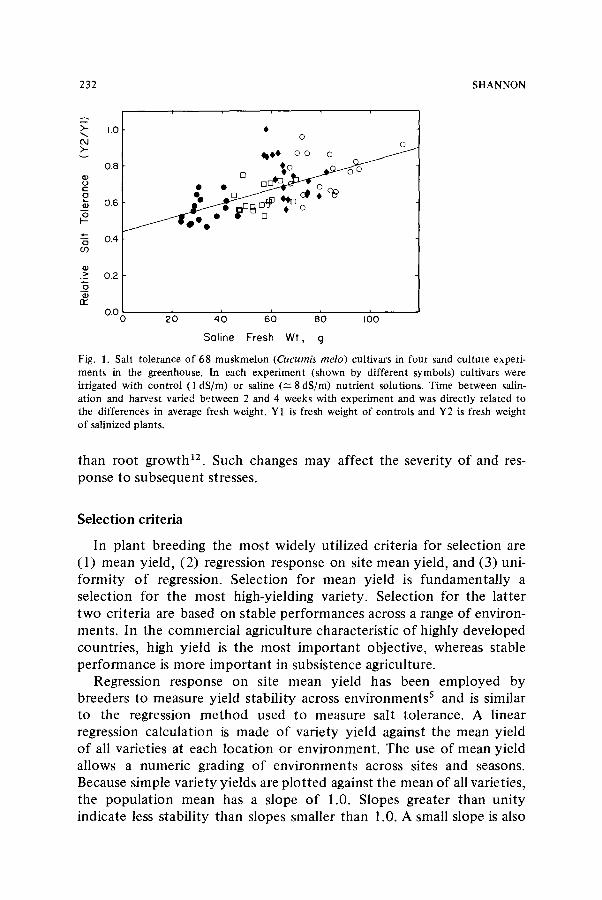
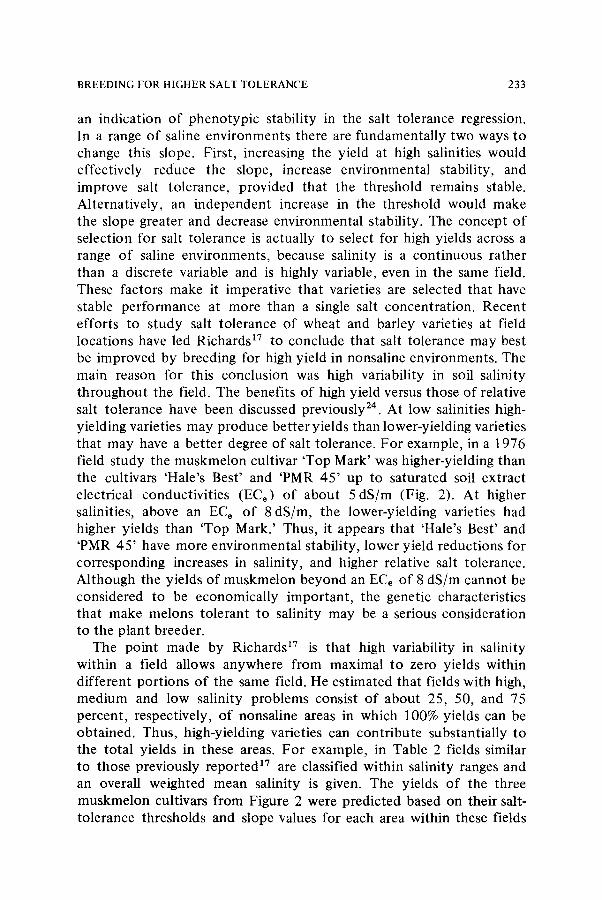
an indication of phenotypic stability in the salt tolerance regression. In a range of saline environments there are fundamentally two ways to change this slope. First, increasing the yield at high salinities would effectively reduce the slope, increase environmental stability, and improve salt tolerance, provided that the threshold remains stable. Alternatively, an independent increase in the threshold would make the slope greater and decrease environmental stability. The concept o f selection for salt tolerance is actually to select for high yields across a range of saline environments, because salinity is a continuous rather than a discrete variable and is highly variable, even in the same field. These factors make it imperative that varieties are selected that have stable performance at more than a single salt concentration. Recent efforts to s tudy salt tolerance of wheat and barley varieties at field locations have led Richards 17 to conclude that salt tolerance may best be improved by breeding for high yield in nonsaline environments. The main reason for this conclusion was high variability in soil salinity throughout the field. The benefits of high yield versus those of relative salt tolerance have been discussed previously 24. At low salinities high- yielding varieties may produce bet ter yields than lower-yielding varieties that may have a bet ter degree of salt tolerance. For example, in a 1976 field study the muskmelon cultivar 'Top Mark' was higher-yielding than the cultivars 'Hale's Best' and 'PMR 45' up to saturated soil extract electrical conductivities (ECe) of about 5 dS/m (Fig. 2). At higher salinities, above an ECe of 8 dS/m, the lower-yielding varieties had higher yields than 'Top Mark.' Thus, it appears that 'Hale's Best' and 'PMR 45' have more environmental stability, lower yield reductions for corresponding increases in salinity, and higher relative salt tolerance. Although the yields of muskmelon beyond an ECe of 8 dS/m cannot be considered to be economically important, the genetic characteristics that make melons tolerant to salinity may be a serious consideration to the plant breeder.
The point made by Richards 17 is that high variability in salinity within a field allows anywhere from maximal to zero yields within different portions o f the same field. He estimated that fields with high, medium and low salinity problems consist of about 25, 50, and 75 percent, respectively, of nonsaline areas in which 100% yields can be obtained. Thus, high-yielding varieties can contr ibute substantially to the total yields in these areas. For example, in Table 2 fields similar to those previously reported 17 are classified within salinity ranges and an overall weighted mean salinity is given. The yields of the three muskmelon cultivars from Figure 2 were predicted based on their salt- tolerance thresholds and slope values for each area within these fields
234 SHANNON
2000 i i i i I ! ! ! ! i i
1600 ~ T o p Mork - 1200 Hole's Best
4 " " ..c
�9 "-~ 8 0 0 PMR 4 5 - - ' - ' ~ ~ ~
~_ 400
c O . . . . . . I 2 :3 4 5 6 7 8 9 I0 II
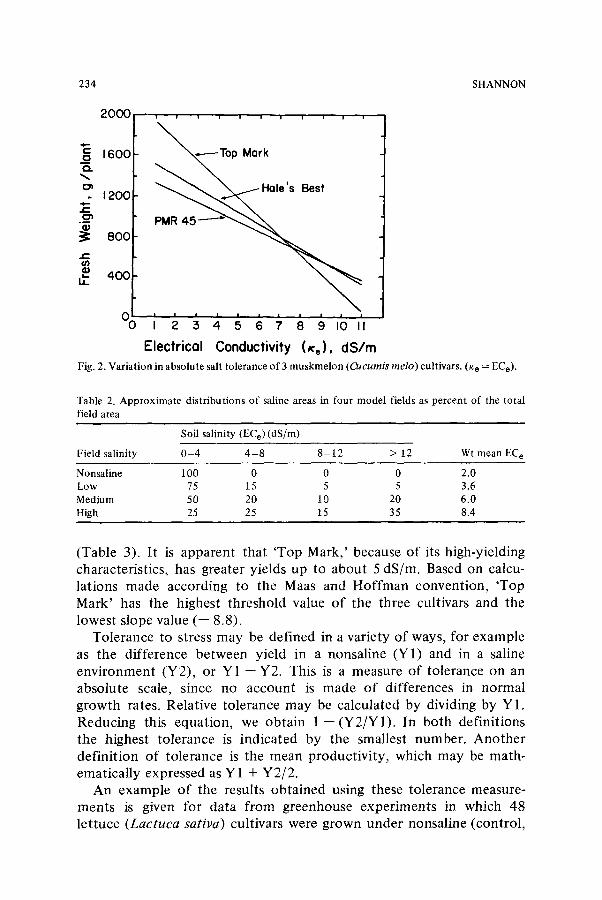
Electrical Conductivity (Xe), dS/m Fig. 2. Variation in absolute salt tolerance of 3 muskmelon (O~cumis melo) cultivars. (K e = ECe).
Table 2. Approximate distributions of saline areas in four model fields as percent of the total field area
Soil salinity (EC e) (dS/m)
Field salinity 0 -4 4 - 8 8-12 > 12 Wt mean EC e
Nonsaline 100 0 0 0 2.0 Low 75 15 5 5 3.6 Medium 50 20 10 20 6.0 High 25 25 15 35 8.4
(Table 3). It is apparent that 'Top Mark,' because of its high-yielding characteristics, has greater yields up to about 5 dS/m. Based on calcu- lations made according to the Maas and Hoffman convention, 'Top Mark' has the highest threshold value of the three cultivars and the lowest slope value (-- 8.8).
Tolerance to stress may be defined in a variety of ways, for example as the difference between yield in a nonsaline (Y1) and in a saline environment (Y2), or Y1 - -Y2 . This is a measure of tolerance on an absolute scale, since no account is made o f differences in normal growth rates. Relative tolerance may be calculated by dividing by Y1. Reducing this equation, we obtain 1 - - ( Y 2 / Y 1 ) . In both definitions the highest tolerance is indicated by the smallest number. Another definition of tolerance is the mean productivity, which may be math- ematically expressed as Y 1 + Y2/2.
An example of the results obtained using these tolerance measure- ments is given for data from greenhouse experiments in which 48 lettuce (Lactuca sativa) cultivars were grown under nonsaline (control,
BREEDING FOR HIGHER SALT TOLERANCE 235
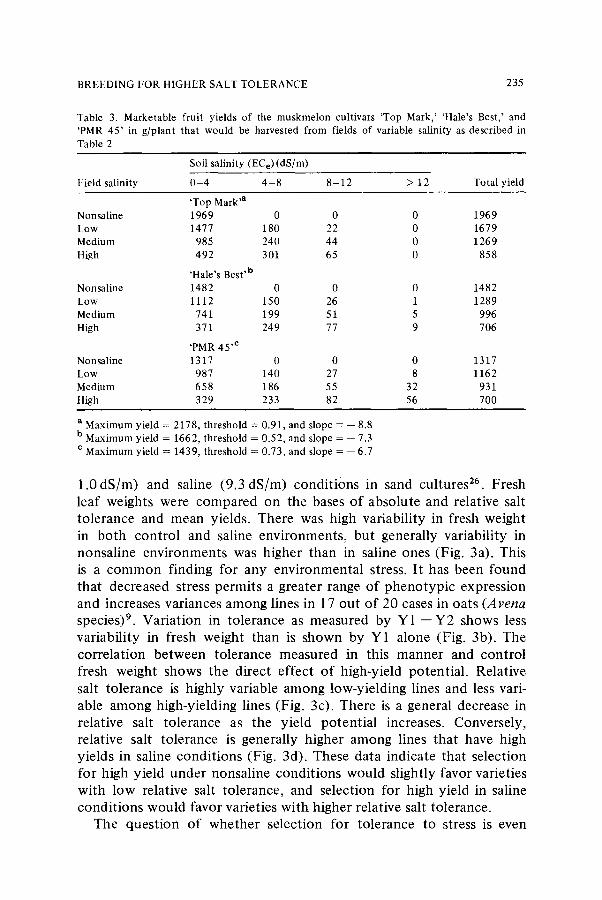
Table 3. Marketable fruit yields of the muskmelon cultivars 'Top Mark,' 'Hale's Best,' and 'PMR 45' in g/plant that would be harvested from fields of variable salinity as described in Table 2
Soil salinity (EC e) (dS/m)
Field salinity 0 - 4 4 - 8 8 - 1 2 > 12 Total yield
'Top Mark 'a
Nonsaline 1969 0 0 0 1969 Low 1477 180 22 0 1679
Medium 985 240 44 0 1269 High 492 301 65 0 858
'Hale's Best 'b Nonsaline 1482 0 0 0 1482
Low 1112 150 26 1 1289 Medium 741 199 51 5 996 High 371 249 77 9 706
'PMR 45 'e
Nonsaline 1317 0 0 0 1317 Low 987 140 27 8 1162
Medium 658 186 55 32 931 High 329 233 82 56 700
a Maximum yield = 2178, threshold = 0.91, and slope = -- 8.8 b Maximum yield = 1662, threshold = 0.52, and slope = -- 7.3
e Maximum yield = 1439, threshold =- 0.73, and slope = -- 6.7
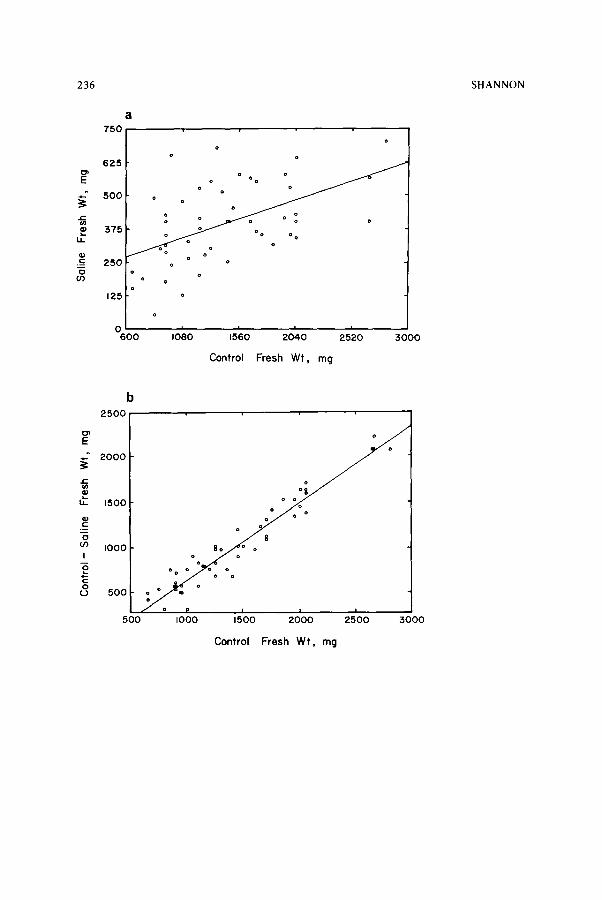
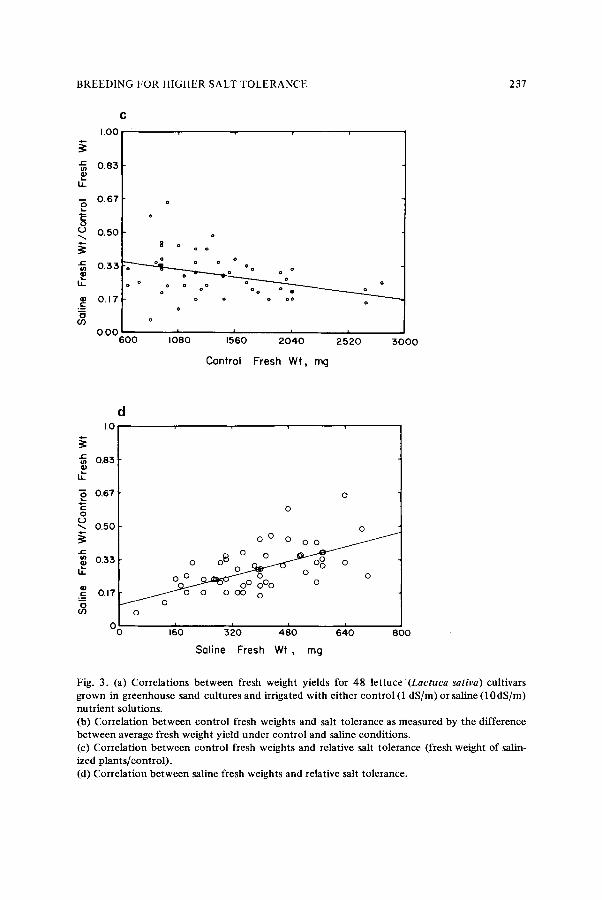
1 .0dS/m) and saline (9.3 dS/m) conditions in sand cultures 26. Fresh leaf weights were compared on the bases of absolute and relative salt tolerance and mean yields. There was high variability in fresh weight in both control and saline environments, but generally variability in nonsaline environments was higher than in saline ones (Fig. 3a). This is a c o m m o n finding for any environmental stress. It has been found that decreased stress permits a greater range of phenotypic expression and increases variances among lines in 17 out of 20 cases in oats (Arena species) 9. Variation in tolerance as measured by Y 1 - - Y 2 shows less variability in fresh weight than is shown by Y1 alone (Fig. 3b). The correlation between tolerance measured in this manner and control fresh weight shows the direct effect o f high-yield potential. Relative salt tolerance is highly variable among low-yielding lines and less vari- able among high-yielding lines (Fig. 3c). There is a general decrease in relative salt tolerance as the yield potential increases. Conversely, relative salt tolerance is generally higher among lines that have high yields in saline conditions (Fig. 3d). These data indicate that selection for high yield under nonsaline conditions would slightly favor varieties with low relative salt tolerance, and selection for high yield in saline conditions would favor varieties with higher relative salt tolerance.
The question of whether selection for tolerance to stress is even
236 SHANNON
750
625
E
~-" 500
s75 I.l_
._c 250 0
O 3
0 0
0 0
0 0 0
0 o o
o o o
a o o o o o o o
o o o o o o
o o o
o o
o 0
0 0
o
i
1080
125
0 6OO
i i i
1560 2 0 4 0 2 5 2 0
Control Fresh Wt , mg
5000
b 2500
O ~
E
2000
== LL 1500
== o _
o
o3 Ioo0 I
2 g r 500
5oo
*8 o o ~
~ o
o ~ o ~ o
~ 1 7 6 I
o ~ o o ~ o ~
o o : -
,ooo ,50o 2o'0o 2~'oo 3o0o
Control Fresh W t , mg
BREEDING t,'OR HIGHER SALT TOLERANCE 237
C
1.00
'- 0.83
h
-~ 0 .67
"E O o 0 .50
"~ 0 . 5 5
t l_
0 .17
o 03
o
o
o
8 o o o
o o o o o o
o o o o
o o o o o o o o o ~ o �9 o
o
o
o' ~ ' ' 0 " 0 0 6 0 0 I 80 I 0 2 0 4 0 2 5 2 0 5 0 0 0
Control Fresh Wt, mg
U_
o
"6 0 0
ut == o O9
1.0
0.83
0.67
0.50
035
0.17
0(~"
0
0 ~ 0
o o B o ~ ~ 1 7 6 - ~ ~ o
0 0 0 ~ ~ 0 0 ~ Q ~ 00 000 0
. / / ~ 0 0 0 000 0
0
160 3 0 480 6 4 0
Saline Fresh W t , mg
0
oo
800
Fig. 3. (a) Correlations between fresh weight yields for 48 lettuce (Lactuca sativa) cultivars grown in greenhouse sand cultures and irrigated with either control (1 dS/m) or saline (10 dS/m) nutrient solutions. (b) Correlation between control fresh weights and salt tolerance as measured by the difference between average fresh weight yield under control and saline conditions. (c) Correlation between control fresh weights and relative salt tolerance (fresh weight of salin- ized plants/control). (d) Correlation between saline fresh weights and relative salt tolerance.
238 SHANNON
worthwhile has recently been proposed 18. It was shown that selection for mean productivity will normally increase yields in both stress and nonstress environments, provided that genetic variance in the stress environment is less than in the nonstress environment and that the genetic correlation of yields in both environments is highly negative 18. Alternatively, selection for tolerance under these same conditions would decrease the mean productivity. This implies a negative corre- lation between mean yield and tolerance. Indeed, the data in Fig. 3c support this contention. For a positive relationship to exist between tolerance and mean productivity the genetic variance in stress environ- ments must be greater than in nonstress environments. This is not common, and it has been pointed out that varieties with high pheno- typic stability usually have low mean yields s, 7,13
Breeding method
Breeding approaches include backcrossing, progeny testing, and pure line selection. The main factor that determines the method of plant breeding, aside from the induction of useful variation, is the breeding system. Two-thirds of the world's food supply is provided by in- bred species. Two o f the major cereals, rice (Oryza sativa), and wheat (Triticum species), and most o f the important oil and protein crops are inbred species. Outbreeding crops include most o f the forages, sugar- cane, and most of the tree fruits.
Inbreeding crops are developed by pedigree selection. In this process, one parent is chosen for genetic properties that are useful (e.g., salt tolerance), while the other is chosen for its complementing and desirable agronomic characteristics. Self pollination leads rapidly to homozygous lines which can then be tested for overall improvements. This system is self perpetuating in that it generates some improved lines that can be used as parents in subsequent hybridizations. A disadvantage of this system is that early generations can be expected to be heterogeneous and quite unstable in their response to environmental interaction. This makes early selection difficult, because the individual is the unit o f selection and the effects o f variation in salinity across a field plot or greenhouse bench can result in some loss of segregates with genes for salt tolerance. Environmental effects during early generations may be reduced by selection under controlled conditions in the laboratory or through the use of saline irrigation water in field selections.
Other practices can be used to reduce environmental effects when screening is conducted in the field. Selection may be delayed until the F 6 - F 8 generation. Bulk generations can be maintained to assure the maximum number of recombinants. The increased homozygousi ty of
BREEDING FOR HIGHER SALT TOLERANCE 239
these generations will increase the correspondence between genotype and phenotype. However, increases in selection efficiency (in the field) cannot be expected, because environmental interactions may still be rather large. Another method that may be used to reduce environ- mental effects in inbreeding species is single-seed descent. Individual lines derived through a single unselected seed saved in each generation through F 6 - F 8 may be used to test for a particular character. The advantages of this method are that many populations can be grown through several generations under conditions favoring reduced gener- ation time, and a good correspondence can be expected between geno- type and phenotype. Additionally, the F2 population can be used to predict a potential range o f variation.
The above systems may be adapted to salt tolerance. Modifications that may improve selection efficiency include the use of saline irrigation water to reduce natural variation in soil salinity and the use of numerous salt concentrations so that regressions against mean yields can be used to determine salt resistance with more reliability.
The product ion of F1 hybrids takes a prominent place in the im- provement of outcrossed species. Genetic advances among hybrids are usually the result of making crosses between selected inbred lines that have been chosen for their individual characters as well as their com- bining abilities. In species that do not have economical F 1 seed produc- tion systems, the concept o f populat ion improvement is usually adopted. Most forms of population improvement include both mass selection and various types of progeny testing designed to accumulate alleles through recurrent selection over generations. The details of this plan have been the subject of much research and controversy, but the average gain by most of the methods indicates that they are all almost equally effective. The complication of salt tolerance would not seem to make one any more effective than another, but a particular selection procedure for salt tolerance may favor one method over another. For instance, recurrent selection within families includes replicative tests at several locations. This procedure could be developed to minimize the interactions between salinity and environment as well as those between genotype and phenotype. The reconsti tution o f advanced generations from parents with high scores for salt tolerance at several locations could eventually lead to a quantitative improvement over time.
Tissue culture techniques may eventually improve both o f the above mentioned methods if haploid isolation procedures can be developed to allow the single-step creation of homozygous diploids from F1 hybrids. Another possibility is the use of somaclonal variation to induce the needed variability to select for salt tolerance.
240 SHANNON
Ultimately, the objective should be to increase tolerance by in- creasing both mean yield and yield stability. An understanding of the basic principles of both salt tolerance and plant breeding will be re- quired to do this.
References
5
6
7
8
9
10
11
12
13
14
15
16
17
18
19
20
21
1
2.
3
4
Abel G H 1963 Inheritance of the capacity for chloride inclusion and chloride exclusion in soybeans. Crop Sci. 9, 697-698. Akbar M and Yabuno T 1977 Breeding for saline-resistant varieties of rice. IV. Inheri- tance of delayed-type panicle sterility induced by salinity. Jap J. Breed. 27 ,237-240 . Epstein E, Norlyn J D, Rush D W, Kingsbury R W, Kelly D B, Cunningham G A and Wrona A W 1980 Saline culture of crops: a genetic approach. Science 210, 399-404. Falconer D S 1952 The problem of environment and selection. Am. Nat. 86, 293- 298. Finlay K W and Wilkinson G N 1963 The analysis of adaptation in a plant breeding pro- gramme. Aust. J. Agric. Res. 14 ,742-754 . Flowers T J, Troke P F and Yeo A R 1977 The mechanism of salt tolerance in halophytes. Annu. Rev. Plant Physiol. 28, 89-121. Frey K J 1964 Adaptation reaction of oat strains selected under stress and non-stress environmental conditions. Crop Sci. 4, 55-58 . Greenway H and Munns R 1980 Mechanisms of salt tolerance in non-halophytes. Annu. Rev. Plant Physiol. 31 ,149 -190 . Johnson G R and Frey K J 1967 Heritabilities of the quantitative attributes of oats (Avena sp.) at varying levels of environmental stress. Crop Sci. 7, 43-46 . Maas E V 1985 Salt tolerance of plants. In Handbook of Plant Science in Agriculture. Ed. B R Christie, CRC Press Inc., Boca Raton, Florida (In press). Maas E V and Hoffman G J 1977 Crop salt tolerance - current assessment. J. Irrig. Drain- age Div., ASCE 103(IR2), 115-134. Maas E V and Nieman R H 1978 Physiology of plant tolerance to salinity. In Crop Toler- ance to Suboptimal Land Conditions. Ed. G A Jung. pp 277-299. Am. Soc. Agron. Spec. Publ. 32. Madison, Wl. Mederski H J and Jeffers D L 1973 Yield response of soybean varieties grown at two soil moisture stress levels. Agron. J. 65 ,410 -412 . Nortyn J D 1980 Breeding salt-tolerant crop plants. In Genetic Engineering of Osmo- regulation - Impact on Plant Productivity for Food Chemicals and Energy. Basic Life Sciences. Vol 14. Eds. D W Rains, R C Valentine and A Hollaender. pp 293-309. Plenum Press, New York. Pasternak D, Twersky M and De Malach Y 1979 Salt resistance in agricultural crops. In Stress Physiology in Crop Plants. Eds. H W Mussell and R C Staples. pp 127-142. Wiley Interscience, New York. Ream C L and Furr J D 1976 Salt tolerance of some Citrus species, relatives, and hybrids tested as rootstocks. J. Am. Soc. Hort. Sci. 101, 265-267. Richards R A 1983 Should selection for yield in saline regions be made on saline or non- saline soils? Euphytica 32, 431-438 . RosieUe A A and Hamblin J 1981 Theoretical aspects of selection for yield in stress and non-stress environments. Crop Sci. 21 ,943 -946 . Rush D W and Epstein E 1976 Genotypic responses to salinity. Differences between salt- sensitive and salt-tolerant genotypes of tomato. Plant Physiol. 57, 162-166. Rush D W and Epstein E 1981 Comparative studies on the sodium, potassium, and chlor- ide relations of a wild halophytic and a domestic salt-sensitive tomato species. Plant Physiol. 68, 1308-1313. Sacher R F, Staples R C and Robinson R W 1982 Salt tolerance in hybrids of Lycopersicon

BREEDING FOR HIGHER SALT TOLERANCE 241
esculentum X Solanum pennellii and selected breeding lines. In Biosaline Research: A Look to the Future. Ed. A San Pietro, pp 325-336. Plenum Press, New York.
22 Sacher R F, Staples R C and Robinson R W 1983 Ion regulation and response of tomato to sodium chloride: a homeostatic system. J. Am. Soc. Hort. Sci. 108, 566-569.
23 Shannon M C 1978 Testing salt tolerance variability among tall wheatgrass lines. Agron. J . 7 0 , 7 1 9 722.
24 Shannon M C 1982 Genetics of salt tolerance: new challenges. In Biosaline Research. A Look to the Future. Ed. A San Pietro. pp 271-282. Plenum Press, New York.
25 Shannon M C 1984 Breeding, selection and the genetics of salt tolerance. In Salinity Tolerance in Plants - Strategies for Crop Improvement. Eds. R C Staples and G H Toenniessen. pp 313-331. Wiley International, New York.
26 Shannon M C, McCreight and Draper J H 1983 Screening tests for salt tolerance in lettuce. J. Am. Soc. Hort. Sci. 108 ,225-230 .