Embed Size (px)
Citation preview
IZA DP No. 1579
Principles and Practicalities for MeasuringChild Poverty in the Rich Countries
Miles Corak
DI
SC
US
SI
ON
PA
PE
R S
ER
IE
S
Forschungsinstitutzur Zukunft der ArbeitInstitute for the Studyof Labor
April 2005

Principles and Practicalities for Measuring
Child Poverty in the Rich Countries
Miles Corak UNICEF Innocenti Research Centre
and IZA Bonn
Discussion Paper No. 1579 April 2005
IZA
P.O. Box 7240 53072 Bonn
Germany
Phone: +49-228-3894-0 Fax: +49-228-3894-180
Email: [email protected]
Any opinions expressed here are those of the author(s) and not those of the institute. Research disseminated by IZA may include views on policy, but the institute itself takes no institutional policy positions. The Institute for the Study of Labor (IZA) in Bonn is a local and virtual international research center and a place of communication between science, politics and business. IZA is an independent nonprofit company supported by Deutsche Post World Net. The center is associated with the University of Bonn and offers a stimulating research environment through its research networks, research support, and visitors and doctoral programs. IZA engages in (i) original and internationally competitive research in all fields of labor economics, (ii) development of policy concepts, and (iii) dissemination of research results and concepts to the interested public. IZA Discussion Papers often represent preliminary work and are circulated to encourage discussion. Citation of such a paper should account for its provisional character. A revised version may be available directly from the author.
IZA Discussion Paper No. 1579 April 2005
ABSTRACT
Principles and Practicalities for Measuring Child Poverty in the Rich Countries∗
This paper has three objectives. The first is to discuss the major issues involved in defining and measuring child poverty. The choices that must be made are clarified, and a set of six principles to serve as a guide for public policy are stated. The second objective is to take stock of child poverty and changes in child poverty in the majority of OECD countries since about 1990 when the Convention on the Rights of the Child came into force. Finally, the third objective is to formulate a number of suggestions for the setting of credible targets for the elimination of child poverty in the rich countries. This involves a method for embodying the ideal of children having priority on social resources into a particular set of child poverty reduction targets, it involves the development of appropriate and timely information sources, and finally it involves the clarification of feasible targets that may vary across the OECD. JEL Classification: I30, I32, I38 Keywords: poverty, children, social policy Corresponding author: Miles Corak Email: [email protected]
∗ This paper was prepared as a contribution to the Innocenti Report Card No. 6 “Child Poverty in Rich Countries 2005,” UNICEF Innocenti Research Centre. It has also been released as Innocenti Working Paper 2005-01. This paper was initiated and conducted while the author was visiting researcher at the UNICEF Innocenti Research Centre. He is currently Director of Family and Labour Studies at Statistics Canada, a research fellow with the Institute for the Study of Labor (IZA), Bonn, and an adjunct professor with the Department of Economics at Carleton University. This is one of four background research reports to UNICEF “Child Poverty in Rich Countries, 2005” Innocenti Report Card No. 6. The author acknowledges and thanks the UNICEF Innocenti Research Centre for financial and in kind support, and particularly the director, Marta Santos Pais for helpful discussions dealing with the Convention on the Rights of the Child. Tony Atkinson, George Beelen, Rebecca Blank, Bruce Bradbury, Jonathan Bradshaw, Christine Bruniaux, Wen-Hao Chen, Gosta Esping-Andersen, Jean-Yves Duclos, Thesia Garner, Petra Hoelscher, Markus Jäntti, Susan Mayer, John Micklewright, Marco Mira d’Ercole, Brian Nolan, Mark Pearson, Tim Smeeding, and Daniel Wienberg commented on parts of a very early draft giving helpful advise with regard to policy developments in particular countries or substantial help with data and information needs. The paper has also benefited from conversations with Peter Adamson and Eva Jespersen. The responsibility for its contents, however, rests solely with the author.

Principles and practicalities in measuring child poverty
for the rich countries
The United Nations Convention on the Rights of the Child contains 54 articles covering
almost every aspect of the rights and well being of children. It is a comprehensive legal
text negotiated and agreed to by 192 heads of state. But the Convention is also a specific
commitment made to the children of the world. It is natural to ask, especially since it is
now over 15 years since their adoption by the UN General Assembly, if these
commitments are being fulfilled, if this ideal is being put into practice. This paper is
motivated by this concern and takes as its starting point two articles that relate directly to
the material well being of children.
Article 27 states that governments “recognize the right of every child to a
standard of living adequate for the child’s physical, mental, spiritual, moral and social
development.” It states that parents or others responsible for the child “have the primary
responsibility to secure … the conditions of living necessary for the child’s
development,” but that governments should assist parents “to implement this right and
shall in case of need provide material assistance and support programmes, particularly
with regard to nutrition, clothing and housing.” Article 4 notes that these rights shall be
fulfilled by each country “to the maximum extent of their available resources.”
Putting these principles into practice may certainly be a challenge. They establish
the elimination of child poverty not only as a policy objective, but one that takes top
priority. And even if children are given first call on social resources, at least three
2
practical challenges stand in the way. First, a committed government must define a
minimum standard of living necessary to secure children’s normal physical and social
development; second, it must understand the capabilities and limits of families and
markets in providing this standard of living; and third, it must develop an evidence-based
awareness of the impact its policy and budgetary decisions actually have on children.
Resolving these issues places governments in a position to formulate credible policies,
and make the attainment of an acceptable minimum standard of living for all children a
reality.
This is no small agenda. Questions concerning the interaction between families,
labour markets and government policy and how they influence child poverty rates are
examined in Chen and Corak (2005), while the actual priorities embedded in government
budgets are the subject of Corak, Lietz and Sutherland (2005). This paper addresses the
first, and possibly most wide reaching challenge, that having to do with issues of
definition.
The paper has three objectives. The first is to discuss the major issues involved in
defining and measuring child poverty. Even the most committed governments have run
into difficulties addressing these issues. Drawing from economic theory, accepted
statistical practice, and a review of actual country experiences The choices that must be
made are clarified, and a set of six principles to serve as a guide for public policy are
stated. This review and these principles also help to justify a definition of child poverty
for international comparisons. Accordingly, the second objective of the paper is to take
stock of child poverty and changes in child poverty in the majority of OECD countries
since about 1990 when the Convention on the Rights of the Child came into effect. A set

3
of internationally comparable child poverty rates are offered and a number of data and
measurement issues addressed. Finally, the third objective of the paper is to formulate a
number of recommendations for the setting of credible targets for the elimination of child
poverty in the rich countries. This involves a method for embodying the ideal of children
having priority on social resources into a particular set of child poverty reduction targets,
it involves the development of appropriate and timely information sources, and finally it
involves the clarification of feasible targets that may vary across the OECD. Targets that
are structured to make children a priority, measured in an accurate and accepted manner,
and set at feasible levels suggest that government commitments are more likely to be
credible and therefore attainable.
1. Measuring child poverty in rich countries
An extensive literature deals with the definition and measurement of poverty.1 However,
reading it at the broadest level suggests that three issues are involved: (1) a definition and
measurement of resources; (2) the establishment of a threshold distinguishing the poor
from the non-poor; and (3) a count, or more generally, an aggregation of the number of
poor into a useful index.
These issues are illustrated schematically in Figure 1. Resources need to be
defined and measured across the population in a statistically representative fashion, the
poor need to be identified by setting a minimum acceptable level of resources, and then
1 The major sources for what follows are: Atkinson (1998, 1989, 1987), Blackburn (1998), Duclos and Grégoire (2002), Expert Group on Household Income Statistics (2001), Fisher (1995, 1992), Foster (1998), Madden (2000), Nolan and Whelan (1996), Ravallion (1998, 1996), Sen (1999, 1983, 1976), Skuterud, Frenette and Poon (2004), and UNDP (2000). But this is obviously only a small subset of a very large number of studies reflecting longstanding public policy concerns.
4
the number of poor need to be counted in some way. There is no single way to proceed
appropriate for all places and all times. In particular, these issues cannot be determined
solely in theoretical or scientific discourse. Value judgments are required to bridge the
gap. Public policy makers, advocates, and for that matter statistical agencies need to be
explicit about these in order to encourage appropriate public discussion, and not to mask
questions of values as issues of technique.
a. Resources
The first issue is to define and measure the resources available to the population. In
Figure 1 these are symbolized as y, and their distribution across the population as f(y).
The word “resources” is used loosely. What exactly it means will depend in part upon the
theoretical perspective. A perspective based upon basic needs, as in Streeten et al (1981),
will not necessarily give the same meaning to this term as one based upon capabilities, as
in Sen (1999), or as one based upon “rights,” as discussed for example in UNDP (2000).
And even within a theoretical perspective the issue is not straightforward. For example,
capabilities, in Sen’s terms, vary in form and content from basic physical needs to avoid
starvation, to avoid undernourishment, to prevent premature morbidity, but also broader
opportunities for personal development through education and health care, and for social
participation through civic liberties and economic freedom. Indeed, the wording of
Article 27 of the Convention on the Rights of the Child calling for “a standard of living
adequate for the child’s physical, mental, spiritual, moral and social development”
suggests that no single definition of resources can capture all aspects of what is
important. All this said, resources, however they are defined, need to be measured using

5
nationally representative surveys based upon accepted statistical methods. When the
focus is on children this requires appropriately designed questionnaires and survey
methods that capture a measure of resources appropriate for understanding the standard
of living from the child’s perspective.
The availability of appropriate data is one important practical constraint on
analyses of child poverty, particularly from an international perspective. Many empirical
studies, and indeed public policy discussions, restrict the definition of resources to that of
income in part for this reason. Though, as will be highlighted below, the availability of
timely and accurate statistics for even this oft used measure is not without its limitations.
However, in well developed economies, where the bulk of the private and indeed some of
the public needs of individuals and families are met through markets, income is in fact a
central element in the standard of living appropriate for physical and social development.
As such it should play some important role as part of the resources used in the analysis of
poverty. But even from this perspective it is a less than perfect measure. Income is of
value because it is a means to an end, and it is not income per se that determines well
being, but consumption. Ideally the most appropriate measure would be the actual
consumption of private and public goods associated with development. Data availability
often also precludes this.
With resources defined as income, and in some sense standing in for
consumption, there remain some specific concerns associated with measurement.
“Income” could refer to just earnings (payments from paid employment as an employee),
to total market income (including earnings but also all other market based sources such as
self-employment, asset or interest income) or to total disposable income (all market

6
incomes after taxes and transfers). In addition, in many surveys there are concerns about
under-reporting—particularly among those with very high and very low incomes—as
well as top and bottom coding of individual information by survey administrators for
either reasons of data quality or confidentiality. There are also concerns about the use of
annual income, which may be subject to measurement error or to considerable transitory
fluctuations suggesting it is a less than entirely accurate indicator of the underlying
“permanent” income determining consumption decisions.
Two related analytical choices also play an important role, particularly in
discussions of child poverty: the definition of the unit of analysis, and the appropriate
equivalence scale. The unit of analysis could refer to the household (all individuals living
together in the same dwelling), the family (all individuals in the same dwelling related by
blood, marriage or adoption), or the individual. A focus on children that in some sense is
rights based suggests that the unit of analysis be the individual, and this indeed is both
recommended and common practice.2 Individual incomes are calculated by dividing
household income among each of its members. But this requires an understanding, or an
assumption, of how resources are shared within the household and how the economies of
living together are to be taken into account.
Until relatively recently economic theory was silent on how economic resources
are shared within the household. Models of the family were often based on the
assumption that multi-person households could be treated as if they were single
individuals, in effect assuming that a benevolent household head’s preferences were
representative of all other members. This has changed a good deal, with an important
2 See for example Expert Group on Household Income Statistics (2001) and Skuterud, Frenette and Poon (2004).

7
literature developing on the sharing rules in households from the research summarized in
Browning (1992), and particularly from Browning, Bourguignon, Chiappori, and
Lechene (1994). This research still does not offer accepted generalities, and empirical
analyses are often based upon the assumption that resources are shared equally. This may
be a convention, but not one that should be accepted lightly. Assuming that children
obtain an equal share of available household resources charts a middle road between the
deprivation they may be subject to if parents consume a disproportionate share, and the
extra protection they might receive if parents make sacrifices to ensure children do not go
without. Indeed, the best empirical analyses suggest that the source of income in the
household makes a difference for the types of goods purchased and their relative benefit
for children. To cite only two examples, this is as true in a rich country like the United
Kingdom as it is in a less rich country like South Africa. Lundberg, Pollack, and Wales
(1997), for example, find that the payment of family allowances directly to mothers in the
UK is associated with more spending on goods of relatively more benefit to children, and
Duflo (2000) finds that increases in South African state pensions for the elderly led to
improvements in the health and nutrition of children, particularly girls, entirely because
of increases in the purchasing power of grandmothers.
Finally, different equivalence scales may imply different poverty rates and
relatedly a different composition of the population who are poor. The equivalence scale is
meant to account for the fact that household formation entails certain costs that do not
change with increases in household size. An often used scale is the square root of
household size, which implies that a household of four individuals requires only twice as
many resources to have the same per-person standard of living as a single person

8
household. Though this is often seen as a suitable middle ground, as for example in the
report of the Expert Group on Household Income Statistics (2001), there is little
empirical consensus on just what is the true equivalence. Indeed, as Atkinson (1998)
stresses it is very likely to vary from country to country with differences in the fixed costs
of household formation.
It should also be noted that other often used equivalence scales, such as those put
forward by the OECD, are based on different weights being given to individuals in the
households. In these measures children are given lower weight than adults. In the original
OECD equivalence scale the first adult in each household is given a weight of one, but
each additional adult 0.7, and each child 0.5. So that a family of four consisting of two
adults and two children would be counted as 2.7 individuals. The modified OECD that
has supplanted this standard gives the second and other adults a weight of 0.5, and each
child a weight of 0.3.3 The same family of four is now counted as 2.1 individuals. The
contrast between these two alternatives also makes the general point that the composition
of the population, and of the poor, will vary with the choice of equivalence scale: the
latter increasing the proportion made up of adults and reducing the proportion of
children.4 In sum, the choice of equivalence scale can be important as it embodies
assumptions about the relative needs of household members and in particular the
importance attached to children. These choices are based less on theory or actual
empirical observation than on convention and assumption.
3 Some alternatives also differentiate children by age, those less than fifteen given a smaller weight than those between 15 and 18. 4 Bradshaw (2004) makes this point, and the impact on the composition of the poor is discussed more generally in Atkinson (1998).

9
b. Identification of the poor
The second issue that needs to be addressed in order to establish a poverty indicator
involves setting a minimum threshold of resources distinguishing the poor from the non-
poor. In Figure 1 this is indicated by Y. This is a contentious issue, and one in which the
theoretical economics literature offers limited guidance: there is no simple answer in the
technical literature as to where the poverty line should be drawn or how it should be
updated over time.
Given that income is considered to be the relevant resource the poverty threshold
is often defined in two broad ways: in terms of the cost of a specific basket of goods
deemed in some sense to be necessities; in terms of a certain fraction of what is deemed
to be a typical income level. The former can be based on budget studies of consumption
and the cost of a particular basket of goods, and are often referred to as “absolute”
poverty lines5; the latter relate to a particular proportion of an income level deemed in
some sense to be typical, and are often referred to as “relative” lines. However the
distinction between these two approaches has less to do with methods of calculation,
budget studies versus proportions of typical incomes, than with the extent of reference to
the general community. The use of the adjective “absolute” reflects the idea that these
lines are intended to make no reference to the consumption level of the general
population, while the use of “relative” is meant to underscore the fact that they explicitly
make such comparisons.
5 The appropriate basket of goods is also sometimes determined by consulting the opinion of experts be they in the private sector or in government. So-called “subjective” poverty lines are also used, being derived by directly asking a representative sample of individuals what they think is the minimum threshold level of income.
10
If this distinction is correct then it should be noted that there is a longstanding
tendency in theory suggesting poverty lines cannot be defined without reference to
prevailing norms of consumption among members of the relevant community. This was
clearly the view of Adam Smith who wrote, in an often cited passage from the Wealth of
Nations published in 1776, that: “[b]y necessaries I understand not only the commodities
which are indispensably necessary for the support of life, but what ever the customs of
the country renders it indecent for creditable people, even the lowest order to be without.”
He goes on to offer a number of examples of goods, like linen shirts or leather shoes, that
would be considered necessities in the England of his time. But he also underscores the
fact that this will vary over time and across communities—people, for example, could
live in some communities in the Europe of the 1770s without leather shoes, and without
the “shame” or “disgrace” this would entail in other communities—and concludes that
“[u]nder necessaries, therefore, I comprehend not only those things which nature, but
those things which the established rules of decency have rendered necessary to the lowest
rank of people. All other things I call luxuries … Nature does not render them necessary
for the support of life, and custom nowhere renders it indecent to live without them.”
(1776, Book 5, Chapter 2) A clear echo of this point of view more than 200 years later is
in, among others, Atkinson (1998), or for that matter in the Convention on the Rights of
the Child where children have a right to a standard of living adequate not only for
physical development but also moral and social development, concepts that cannot be
defined without reference to the broader community. Just where to draw the poverty line
is inherently a value judgment dealing with what is required to function normally in
society.
11
A clarification between absolute versus relative issues in the definition of poverty
lines is offered by Sen (1999, 1983). He stresses that the differences between these
perspectives relate to differences in what is taken to be the underlying measure, to use the
wording of Figure 1, of resources. “Standard of living” is best understood not in terms of
income or commodities but rather the capability to do things, to function with incomes
and commodities. To Sen “poverty is an absolute notion in the space of capabilities but
very often it will take a relative form in the space of commodities....” (1983, p. 161). This
implies that the commodities and incomes necessary to meet the same absolute
capability, in terms of both physical capability and the capability to function without
shame, will vary with the overall development of the community.
The contradictions in relying upon an “absolute” poverty threshold in terms of
commodities or incomes is also evident by the empirical observation that these
necessities are seen to change through time as communities experience economic growth
and changes occur in both the goods that are available and the consumption patterns of
the majority. This is documented for example in Fisher (1995), and suggests that in some
fundamental way it is not a simple task to gauge even the basics of survival without
reference to the wider community.
This raises a second important concern in setting the poverty line. If resources are
defined in terms of commodities or incomes, how should the poverty line be updated? As
Fisher (1995) and Foster (1998) suggest the terms “absolute” and “relative” can enter into
the discussion of poverty lines in a number of different ways: both as an indication of
how the threshold is established, but also how it is updated over time. An “absolute”
threshold is updated with the passage of time only for changes in overall price levels, not

12
changes in the composition of the original basket of goods or level of the reference
income level; a “relative” threshold is updated both for changes in price levels as well as
changes in the composition of the basket of goods deemed necessary, or as the case may
be changes to the typical income. To avoid confusion these differences are referred to as
poverty measures based upon “fixed” and “moving” poverty lines. Should the poverty
line remain forever fixed, or should it change in lock step with contemporaneous
incomes? There is no theoretical answer to this. The threshold must in some sense
represent the level of resources below which it would be insufficient to participate
normally in society, and it should be updated as changes occur in the availability and
consumption of goods and services that determine this norm.
A fixed poverty line is less justifiable over a period of time involving considerable
economic change, particularly when this involves changes in the types of goods available
or the social infrastructure and other requirements necessary to function in society, at
work, at school, or in the home. But the changes in opportunities and attitudes may not at
the same be so rapid as to justify a continual updating by tying the poverty line to annual
developments. Ultimately the issue of updating is an open question that ideally would be
settled by developing an objective understanding of how the majority in a community
function and how this evolves.
Accepted statistical practice may offer some guidance. The task of tracking
patterns and changes in consumer expenditures is one that governments regularly deal
with in other contexts, and in which consensus has emerged on accepted practice. The
accurate measurement of the inflation rate, for example, is central to many aspects of
public policy including in some countries and regions the setting and monitoring of
13
specific targets. The inflation rate is determined by changes in the costs of a specific
basket of goods over time. The contents of this basket are in turn determined at a
particular point in time through nationally representative surveys to reflect the
consumption patterns of the average consumer. The important issue, which can lend a
bias to these calculations if it is not addressed, concerns the frequency with which the
contents of the basket are updated. Without a regular updating the inflation rate will
measure changes in prices that do not necessarily reflect what the average consumer is
currently purchasing. These goods could change because of changes in relative prices and
incomes, the introduction of new goods, or changes in retailing and packaging.
As such a part of the statistical program in the measurement of the consumer price
index includes a “rebasing” of the basket of goods taken to be representative of the
average. Table 1 illustrates the statistical practice in the OECD countries. In the majority
of countries consumption patterns are re-based within five years, and in many countries
biannually or annually. As of early 2004, when the information in this table was
collected, only four of 28 countries were using consumer information predating 1999.
The historical experience in the United States is, at 10 years, the longest interval listed in
the table, but this has changed in 2002 to every two years. The International Labour
Organization, which is responsible for setting international guidelines on price
measurement, recommends that it occur within a five year period. All of this is to suggest
that in contexts outside of poverty measurement governments have concluded that
consumption patterns change sufficiently rapidly that updating has to occur within a five
year and very likely shorter period.

14
c. Aggregation to an index
The third and final issue in defining and measuring poverty deals with how to count the
poor. There is an extensive economic literature on this issue in the context of income
poverty. In large part this springs from dissatisfaction with the most commonly used
measure in public discourse, the so-called “headcount ratio.” This ratio, which is often
simply called the poverty rate, refers to the number of people below the poverty threshold
(represented as n in Figure 1) divided by the total number of people in the population
(represented as N). The child poverty rate calculated in this way is the total number of
poor children divided by the total number of children.
Setting a poverty threshold identifies the poor, but how they are “aggregated”
(that is counted) matters a good deal because it reflects a value judgment on the relative
importance to give those very much below the threshold versus others hovering closer to
the boundary between being poor and not being poor. The headcount ratio explicitly
assumes that poverty is a discrete event associated with being above or below a given
line, and therefore every one below the line is given equal consideration. The
appropriateness of this assumption will depend upon the theoretical perspective used.
A strict interpretation of a rights perspective might suggest that the headcount
ratio is, in fact, the appropriate index. Atkinson (1998, 1989) suggests that a “right’ is an
either-or concept: it is either being respected or it is being violated. There is accordingly
an obligation to correct a wrong or there isn’t. In this sense an indicator based upon a
view that poverty is a discrete condition reflecting the attainment of less than a minimum
acceptable standard might be viewed as appropriate. But other interpretations, and indeed
other interpretations based upon a rights perspective, might quite reasonably suggest that

15
individuals below the poverty threshold should not be weighted equally. The situation of
those very much below the poverty line might in some sense matter more than those just
below. The headcount ratio could after all be lowered by taking enough money from the
very poorest and transferring it to those hovering just below the poverty line in order to
move them just above. This sort of policy, which would lower the headcount ratio, might
not have a good deal of intuitive appeal to many observers. Or just as importantly a
finding that poverty rates have gone up might imply only slight falls in the relative
income of those just above the poverty line and mask important improvements in the
circumstances of those very much below.
In other words, there may be a need to recognize the severity of poverty, not just
its incidence. A well developed economics literature discusses the ideal characteristics a
poverty index should have, and offers a host of alternative classes of measures. Only two
specific alternatives are presented in Figure 1, the average poverty gap—which measures
the average short fall from the poverty line for those who are below it—and the poverty
gap squared, which is similar but gives even more weight to those further from the
poverty line. These two examples hint at one of the other reasons the headcount ratio may
have broad appeal: simplicity and transparency in its calculation makes it an important
public policy tool for communicating to a broader public. A claim that the square of the
poverty gap has changed may not have the same broad appeal or public resonance as one
referring to changes in the fraction of people who are poor, or for that matter the
associated number of individuals.
But this fact should not preclude focusing on issues of severity or deprivation, just
that it might be profitably done in more transparent ways than clinging to ever more

16
complicated indices of income shortfalls. In this sense it may once again be important to
broaden the definition of resources. Measuring deprivation directly as indicated by
certain basic goods or the fulfillment of basic needs is an alternative suggested in the
literature, for example by Nolan and Whelan (1996). It is also suggested by Article 27 of
the Convention on the Rights of the Child, which explicitly mentions nutrition, clothing,
and housing as specific indicators. The absence or inability to afford these, or related,
markers of severe material deprivation can act as a complement to the headcount ratio in
a way that continues to be transparent and have broad appeal. It also explicitly recognizes
the empirical shortcomings of relying on annual income: that it cannot represent all
dimensions of poverty, and that it may be only a loose indicator of longer term economic
status.
2. Country experiences
This representation of the issues suggests that the definition and measurement of poverty
is not just a matter for the theoretician or the statistician, but inherently involves value
judgments requiring public consultation and choices. Theory and statistical methods offer
some guidance in settling the important issues, but this is less than complete. There is, for
example, the clear suggestion that the individual should be the unit of analysis, that
relative notions must enter into income based measures of poverty lines, and some strong
arguments for relying on the headcount ratio, though not without reservation. But crucial
issues on how to exactly set the poverty threshold, how to update it through time, and for
that matter the nature of other types of resources to complement annual income are very

17
much left open. For this reason it is helpful to review actual country experiences in the
hope of clarifying both challenges and best practices.
National developments vary tremendously: some countries have not attempted to
define or measure child poverty; some have made the attempt but have become tangled in
technicalities and indecision; while others have established clear definitions, put into
place instruments for measurement and monitoring, and set targets. A broad overview of
country experiences in the measurement of poverty and the setting of targets is given in
Conseil de l’Emploi, des Revenus et de la Cohésion Sociale (2002), and the following
review uses this as a starting point.
a. North America
The United States is one of the few OECD countries to have an official definition of
poverty and a long historical record in regularly publishing a wide range of
complementary indicators of poverty and inequality, including information on children.
However, the poverty measure dates back to concepts and judgments made in the early
1960s, and the extent to which it continues to represent the reality of contemporary US
society has been the subject of a good deal of discussion. As an open letter written by
over 40 prominent scholars to senior government officials in departments responsible for
the construction of the poverty line states: unless “we correct the critical flaws in the
existing measure, the Nation will continue to rely on a defective yardstick to assess the
effects of policy reform.”6
6 “An Open Letter on Revising the Official Measure of Poverty,” Conveners of the Working Group on Revising the Poverty Measure, August 2, 2000, available at www.ssc.wisc.edu/irp/povmeas. Other references for the following discussion include Fisher (1999, 1992) and Short and Garner (2002).
18
In the United States the poverty line is a monetary concept reflecting the cost of
purchasing a nutritional diet. This calculation dates back to work done in the Department
of Agriculture in 1961 using survey information from 1955 on the so-called “Thrifty
Food Budget.” The poverty threshold was set at three times the cost of this diet to allow
for the purchase of all other goods, with adjustments for family size. In 1969 the resulting
thresholds were officially adopted, and since then have, for the most part, been updated
only for changes in prices.
There has never been a revision of these calculations, and since at least 1990 the
poverty line has been the subject of increasing discussion. This concerns a need to define
and cost a new set of goods and other special needs—like child care and health care—
representative of contemporary US families. It also concerns just where the threshold
between poor and not poor should be set. A number of influential proposals have been
put forward, including most notably those published in 1995 by a panel of experts
appointed by the National Academy of Sciences/National Research Council at the request
of a Congressional Committee. This Panel also made specific recommendations for an
annual updating of expenditures on food, clothing, and shelter to reflect patterns among
the general population. The major conclusion of the National Research Council report
edited by Citro and Michael that
the current measure needs to be revised: it no longer provides an accurate picture of the differences in the extent of economic poverty among population groups or geographic areas of the country, nor an accurate picture of trends over time. The current measure has remained virtually unchanged over the past 30 years. Yet during that time, there have been marked changes in the nation’s economy and society and in public policies that have affected families’ economic well-being, which are not reflected in the measure (Citro and Michael, 1995 p.1)

19
continues to be at the heart of US debate as reflected most recently in a June 2004
workshop organized by the National Academy to discuss, among other things, the
ongoing research at the US Census Bureau on experimental measures of poverty.
In sum, in spite of there being an ‘official’ poverty line in the United States there
is little consensus on what poverty means, and there is no official target to reduce or
eliminate child poverty. In contrast, an official target to eliminate child poverty was
announced in Canada. In 1989 an all party resolution committed the government to “seek
to eliminate child poverty by the year 2000.”7 But this commitment was not backed up by
a clear definition of what poverty meant, nor clear indicators to measure progress.
The Canadian statistical agency has a long history of publishing at least two
different measures of what it refers to as “low income,” and during the 1990s advocacy
groups sought to use these indicators to gauge progress made in reducing child poverty.
These include an income based measure with a threshold defined as the level of income
at which families can be expected to spend one-fifth more than the average family on
food, shelter, clothing. This threshold was derived from a survey of family expenditures.
It has been produced since 1967 and is updated roughly every five years as new surveys
on family expenditures become available. The other indicator is simply one half of the
income of the typical individual, “typical” being taken to be the median income (the level
of income that half the population is above and half below). This is updated annually
according to changes in median incomes, and has been published since 1991.
In spite of a high quality and timely series of statistics there was no official
recognition of either of these measures by the government as the basis to gauge progress
7 Government of Canada, Hansard, November 24, 1989. The references for the following discussion are Skuterud, Frenette and Poon (2004) and Shillington (1999).
20
in attaining its child poverty reduction target. The attempt of the broader community to
make such an association in fact led to a public statement by the statistical agency that it
should not be viewed as providing this recognition. The statement suggested that it “is
through the political process that democratic societies achieve social consensus in
domains that are intrinsically judgmental. The exercise of such value judgments is
certainly not the proper role of Canada’s national statistical agency…” (Fellegi 1997).
In 2003 the government released a new measure of poverty based on the costs of a
specific basket of goods including: food, clothing and footwear, shelter, transportation,
and other household needs. The specific choices of these goods are meant to represent, as
is stated in an official document with respect to the food component, “community
standards” of expenditure. Being in poverty would be defined as not having an income
level higher than the cost of this basket of goods. It is not clear how this “Market Basket
Measure” will be updated through time but the government did state that developing its
contents “was a complex and rigorous process that involved substantial consultations
nationally and in several provinces.” It is also stated that the Market Basket Measure is
not an official measure though it is “designed to complement existing low-income
measures that are used to help track low-income trends among Canada’s children.”8
In 2000 all three measures indicated about the same child poverty rate, but since
this is “the first year for which data have been collected using the Market Basket
Measure, it is not possible to say with certainty whether the incidence of low income for
children using the Market Basket Measure is higher or lower than in the years prior to
8 A summary of the first set of findings from the Canadian Market Basket Measure of Low Income is available at www.hrsdc.gc.ca/en/cs/comm/news/2003/030527.shtml, while the specifics of the construction of the basket are presented in Hatfield (2002). The quotations in this and the following paragraph are taken from these sources.

21
2000.” In sum, in spite of there being an official child poverty reduction target in Canada,
there isn’t a clear sense of what it means, nor the degree to which progress was made in
reaching it.
b. The European Union
In many European countries there appears to have been, particularly at the level of the
European Union, an evolution to an accepted definition of “low income,” meant to offer
an indicator of being “at risk of poverty.” This concept uses individual income to
measure material living standards and draws the line between the poor and non poor at
60% of the country specific median income. This line evolves annually with movements
in median income. An income based indicator of this sort has the particular advantage,
important in the EU context, of permitting cross country comparisons.
The rationale for setting the line at 60% of median income, as opposed to some
other fraction, is not clear though the issue is discussed in Eurostat Task Force (1998).
Bradshaw (2004) states that this threshold “remains entirely arbitrary. The EU decided to
adopt 60 per cent of the median because they found that too many of those below 50
percent were students, the self-employed, and farmers” suggesting that this was not in
accord with preconceived notions.
This said the EU stresses that this is an indicator of being “at risk of poverty.” As
such it acknowledges that poverty has more dimensions than just the monetary and must
to be judged in relation to other individual and social circumstances. For example, an
income level below this threshold may mean very different things in a country providing
a wide set of public services than in a country where significant user fees must be paid.
22
The discussion of poverty is one element in a much broader discussion of social policy in
the European Union, one revolving around the commitments established in March 2000
to reduce “social exclusion.” Progress in achieving this goal is monitored by an agreed
upon set of indicators and regular country reports through National Action Plans.
The 60% of median low income measure is one of eighteen indicators defined in a
comparable way for all member states, which can be supplemented by other indicators
specific to each country. These include additional income based measures like the
distribution of income, the persistence of low income, the amount by which the typical
individual falls below the 60% threshold. But they also include other measures of labour
market and social outcomes: the long term unemployment rate, people living in jobless
households, early school leavers not in further education, life expectancy at birth, and self
perceived health status.9
These supplemental indicators may be particularly important in countries where
income poverty defined in this relative sense is already low, or where there have been
important declines in incomes. As suggested one limitation of the headcount ratio based
on a purely relative indicator of low income is that if the incomes of the poor dropped but
those for everyone else stayed exactly the same, the fraction of the population considered
poor would not change in spite of the fact that the lowest income individuals have clearly
suffered. For example, in Sweden—where child poverty rates are among the lowest in the
OECD—a government sponsored assessment of the 1990s economic crisis focused on a
much broader concept of well being than just monetary income (Palme et al. 2003).
9 The list of 18 common indicators used by the EU is available at europa.eu.int/comm/employment_social/news/2002/jan/report_ind_en.pdf. For background on their development see Tony Atkinson, Bea Cantillon, Eric Marlier, and Brian Nolan (2002).

23
In spite of the significant degree of coordination in the development of indicators
to measure progress toward social policy goals in the EU the question of priorities is still
very much open. Some member countries are finding the plethora of indicators does not
offer clear policy directions or illuminate specific priorities. In particular there is not a
clear demonstration of priorities toward children, or how the goal to eliminate social
exclusion is directed to their concerns, needs, and rights. While the at-risk-of-poverty
measure is categorized in a number of ways, including by age, particular priority to the
child poverty rate or to other measures of child well being is not strongly evident. The
National Action plans of some states do stress the importance of child poverty, but the
Commission itself recognizes that “developing a focus on ending child poverty needs to
be more of a priority in the coming years” (Commission of the European Communities,
2003 p. 6).10
c. The United Kingdom and Ireland
Recent developments in the United Kingdom are distinct from the North American and
other European experiences in at least two respects. First, over the course of the last five
years or so the government has made the reduction and elimination of child poverty a
political priority, with the announcement at the highest levels of clear goals and targets.
There is political leadership. Second, this leadership has been backed up by an open yet
structured debate on the measurement of poverty leading, over a roughly 18 month
period, to the announcement in December of 2003 of a succinct and measurable set of
indicators.
10 For specific reference to children in the EU see Hoelscher (2004) and for reference to child poverty see also europa.eu.int/comm/employment_social/social_protection_commitee/spc_report_july_2003_en.pdf.
24
In fact there are many parallels in the UK experience with those of the Republic
of Ireland, particularly in terms of the extent of political commitment, though the UK has
built upon and extended the Irish approach to measurement and monitoring. To cite the
UK example, the commitment to halve child poverty by 2010 and to eliminate it by 2020
begins with the recognition that measures of low income cannot paint a complete picture
of poverty: as an official government document states “income needs to be central to any
poverty measurement, but … income alone does not provide a wide enough measure…”
(Department for Work and Pensions 2003).
Accordingly it is proposed to monitor progress using three related criteria. These
are detailed in Department for Work and Pensions (2003). The first, referred to as
“absolute low income,” is intended to indicate progress in increasing the living standards
of the poor relative to when the government came to power. It is measured as 60% of the
median income in 1998/99, and is fixed through time being adjusted only for inflation.
The second, referred to as “relative low income,” is intended to indicate progress in
increasing the living standards of the poor relative to the typical individual. It is measured
as 60% of the median income in the current year, and as such evolves over time with
changes in the income of the typical individual. The third, referred to as “material
deprivation,” is intended to supplement these measures with direct indicators of the lack
of particular goods and services. It is measured from individual responses to survey
questions on having and being able to afford a short list of items—11 for adults and nine
for children—and a relative income of less than 70% of the median.
These direct indicators of deprivation refer to quality of housing, clothing, and
social engagement. “Adult deprivation” is measured on the basis of whether families

25
have or are able to afford adequate housing (keeping the home adequately warm, in
decent state of repair, furniture and electrical goods such as refrigerator or washing
machine), certain social activities (a holiday way from home for one week not staying
with relatives, having friends or family for a meal once a month), some assets (a small
amount to spend on oneself and regular savings) and adequate clothing (“two pairs of all-
weather shoes for each adults”). The nine measures of deprivation for children include
one measure relating to housing (enough bedrooms for every child over 10 of different
sex to have their own room). The remainder deal with social activities and include: a one
week family holiday away from home every year, swimming at least once a month, a
hobby or leisure activity, friends visiting once every two weeks, leisure equipment,
celebrations on special occasions, play group activities at least once a week for pre-
school age children, a school trip at least once a term for school aged children.
In sum, eight of the nine child specific items refer to social activities, a single
additional item referring to the number of bedrooms in the home per child. There is one
question referring to clothing, directed to the footwear of adults, and no questions at all
referring to food and nutrition. This small number of items is derived from an analysis of
a much broader set with which they are claimed to be highly correlated and perform best
at distinguishing the poor from the non poor. It is also claimed that they will be reviewed
every “few years.”11
As such this three-tiered definition builds upon and extends the Irish definition,
which relies on a combination of relative income and deprivation. Children are
considered poor in Ireland if they live in households with incomes below 70% of the
11 The annex to Department for Work and Pensions (2003) makes reference to the exact questions used in developing the measure of material deprivation.

26
median and lacking in at least one of eight items considered as indicating deprivation.
The latter involve not having: new clothes; a meal with meat, fish or chicken every
second day; a warm waterproof overcoat; two pairs of strong shoes; a roast or its
equivalent once a week. They also involve having: debt problems from ordinary living
expenses; a day over a two week period without a substantial meal; going without heating
during the last year through lack of money. These indicators do not necessarily refer to
the specific situation of children or their social engagement.12
Pegging the definition on the signal from in effect one indicator of deprivation has
implied, in the context of economic growth, rapid progress in reducing child poverty, to
the point that targets have had to be revised to be more ambitious. Between 1997 and
2001 the percentage of children in consistent poverty has fallen from 15% to 6%, and the
current target is to reduce child poverty below 2% by 2007 (Nolan 2004). But this does
not put into focus the entire experience of children relative to others in the community.
3. Principles for best practice
The first challenge in attaining the kind of ideal set out in Article 27 of the Convention on
the Rights of the Child deals with definition and measurement. Effective public policy to
eliminate child poverty must begin with a clear understanding of what poverty means and
how it how it should be measured. Economic theory and statistical practice offer only
partial guidance in doing this, leaving a significant gap to be bridged by political
12 More background on this approach to poverty measurement with specific reference to Ireland is available in Brian Nolan and Christopher T. Whelan (1996) and at www.combatpoverty.ie/downloads/publications/FactSheets/Factsheet_MeasuringPoverty.pdf

27
pragmaticism. The lessons of theory, statistics, and actual public policy in the OECD
suggest the following six principles as a guide for best practice.13
First, avoid unnecessary complexity. Attempts to define a full set of life’s
necessities or a set of indicators to reflect all aspects of well being can be very
complicated, especially when the need for updating over time is recognized. In well
developed market economies in which the family is the major provider of the material
well being of children the use of an income based measure of resources is a good proxy
and can avoid complexity. Further, data are available from representative national
surveys, and income levels can be measured, compared, and updated with reasonable
reliability.
Second, measure material deprivation directly. Income does not capture all
dimensions of what it means to be poor, especially when it is measured over a period of
time as short as a year. It needs to be complemented by additional indicators, but these
should refer to actual consumption of goods and services by children. These will vary
from country to country, but should be informed by the Convention on the Rights of the
Child to include health and nutrition, clothing, housing, and other goods, services and
opportunities necessary for normal physical, mental and social development. At the same
time these indicators should be small in number yet indicative, rather than striving to be
exhaustive.
Third, draw poverty lines with regard to social norms. Both income and direct
measures of deprivation must be tied to the experiences of the typical individual if they
are to be consistent with economic theory and indicate, as expressed in the Convention, a
13 The wording of some of these principles is the result of conversations with Peter Adamson on a first draft of UNICEF (2005). I thank him for his feedback and acknowledge his contribution.
28
standard of living adequate for a child’s social development. Expressing an income
measure as a fraction of median income, and deriving additional indicators by asking
children questions about their social engagement are established mechanisms. This said,
flexibility is appropriate in drawing the line dividing the poor from the non poor be they
below 40, 50, or 60% of median income. Drawing poverty lines at different points may
add clarity in understanding both levels and changes in low income.
Fourth, establish a regular monitoring system. All indicators need to be updated
regularly, especially income based measures during periods of economic change.
Accepted statistical practice suggests that in a growing economy the consumption
patterns of the average consumer change sufficiently to merit updating within a five year
period, and certainly no longer than a decade. Poverty lines should be updated at similar
frequencies. This also implies that data collection and dissemination needs to be designed
with an eye to timeliness and sustainability.
Fifth, set both a backstop and a target. A fixed and a moving poverty line can be
used in conjunction to on the one hand set a backstop preventing deterioration, and on the
other hand a target for progress. Failure to lower poverty according to a fixed line implies
that poor children have not reaped any gains from economic growth. Failure to lower it
according to a moving poverty line implies that poor children have not reaped
proportionately greater gains than others. As such reducing poverty measured by a fixed
line is a minimum test of progress during growth, but during periods of economic decline
it sets an important backstop. A commitment of this sort during economic decline or
recession ensures that children are given priority in the allocation of social resources, and
29
locks in past progress. Under all conditions poverty measured according to both lines
should be lower.
Sixth, offer leadership and build public support for poverty reduction. An
operational definition of poverty requires value judgments that reflect a consensus
through democratic dialogue. Offer leadership in structuring this debate, and once settled
establish goals for progress that are both feasible and credible. Backstops and targets
should be set over a time span covering the electoral cycle. Incoming governments should
set the child poverty rate prevailing at the time of taking office as a backstop, and use a
fixed poverty line to base a commitment that under no circumstances will this rate
increase over their electoral mandate. It should also set a target for lowering poverty
measured against a moving line. Credibility implies that these goals should be set over
the course of the current mandate, not in the distant future for another government.
The first four of these principles recognize important lessons from economic
theory, statistical practice, and actual policy developments. Identifying, costing, and
updating specific baskets of goods can lead to undue complexity in public policy debates
and risks ending in stalemate. In market economies income based measures of poverty
are a good starting point, but this is not to say that “low income” should be equated with
“poverty.” Measuring material and social deprivation with an indicative set of indicators
avoids both complexity and the shortcomings of using just annual income. But there is
more need in all contexts to base these measurements on the perspective of the child
using child based information sources. This is one way to lend children a voice in public
policy that concerns them directly. It also must be done in a comparative way relative to
prevailing norms and the ability to fully participate in society, as well as requiring

30
appropriate updating through time. All of these issues presuppose a credible statistical
system to gather and disseminate accurate and timely information.
The last two principles deal with setting goals that somehow embody both the
principle that children should be given priority in the conduct of public policy, and that
policy should be seen to be credible. Their workings require further comment, and are
illustrated schematically in Figures 2 and 3. A hypothetical situation is illustrated in
Figure 2 when there is progress in reducing child poverty over two successive electoral
mandates either through growth in incomes or changes in public policy. At the onset of
the first mandate a government takes the existing poverty rate, measured with reference
to the prevailing median income, as a backstop. Poverty rates for children fall according
to this fixed poverty line, and according to one measured by a moving poverty line
updated annually. At the end of the mandate the new government sets a new, lower,
starting point as the backstop is updated. In most democracies this corresponds to a four
to five year period, roughly the time frame in which statistical practice suggests the need
to account for changes in average consumption patterns. In this way child poverty rates
are progressively lowered over the course of successive mandates, as past progress is
locked in and more demanding targets set for the future.
Figure 3 illustrates a case in which the backstop becomes binding during periods
of economic decline. In the first mandate of this scenario the economy is deteriorating
and there would be a tendency for child poverty rates to increase, both with respect to
fixed and moving lines. The backstop embodies a commitment that the allocation of
resources will be such that the child poverty rate, measured according to the line fixed at
the start of the mandate, does not increase. If the actual poverty rate rises above this a

31
clear signal is being sent that requires policy response. If the government is successful the
actual child poverty rate should, in the very least, be no worse during the course of its
mandate relative to the norms prevailing at the beginning. In the second mandate when
growth returns the new government takes this rate as the starting point. The backstop
poverty rate is updated asymmetrically across the scenarios presented in these two
figures: progressively ratcheting downward during times of growth, but not increasing
during times of recessions. The use of both a fixed and a moving poverty in setting public
policy objectives embodies the ideal of children having priority in a way that prevents
increases in child poverty and tips the focus of public policy to progressively reducing it
over a succession of electoral mandates.
Credibility is the outcome of public consultation, leadership, and the setting of
feasible targets over a time frame in which governments are accountable. But it is also the
outcome of a process or understanding that is long-lived and extends across the mandates
of successive governments.
4. Child poverty and changes in child poverty
The specifics of how these six principles are actually put into practice—how poverty is
defined, how specific targets are set, and how commitment and credibility are developed
and maintained—is a task that will be different for each government. But to support this
there is merit in undertaking a comparative overview of child poverty rates in the OECD
countries to broadly chart its dimensions, to illustrate the scope for change, and to suggest
a range for feasible targets. As such these principles are used in what follows to develop a

32
working definition for a cross country comparison of child poverty and changes in child
poverty in the rich countries.
First, the focus is income. Using income as the resource avoids complexity and
offers the best measuring rod to gauge the situation of children across countries and over
time. In the analysis that follows income is taken to be household income from all
sources after taxes and transfers: the household’s disposable income. Individuals are the
unit of analysis, resources are assumed to be shared equally within the household, and the
square root of household size is used as the equivalence scale. These assumptions are in
accord with international comparative research on income as for example in Expert
Group on Household Income Statistics (2001) and the Luxembourg Income Study (LIS).
Complementary measures of capabilities and well-being will vary from country to
country, which make comparisons difficult and beyond the scope of available data.
Second, the focus is on the standing of children relative to the typical individual
in the country, defined as the person with median income. For the most part children in
low income are defined to be those with access to less than 50% of median income, but
when examining changes over time a number of different thresholds are used. The
relevance of this for how children perceive and are affected by poverty is still an open
question. For example, the median income is that of the median individual, not the
median child. Further, comparisons are made at the national level, not the smaller
geographic community or region in which the child lives, or a broader community of
nation states. Finally, as already stressed other measures of deprivation based upon the
child’s perspective are needed to complete this picture and address the issue of “poverty”
as opposed to “low income.” This definition also leaves open questions about non-cash

33
transfers from the state and the provision of public services, both of which impact on the
lives of children and are used in different degrees across the OECD countries. Garfinkel,
Rainwater and Smeeding (2004) offer an account of non-cash transfers, suggesting they
play an important role in determining differences in poverty rates across a number of
these countries.
Third, the focus is on progress made since the early 1990s, when the Convention
on the Rights of the Child came into effect.14 As such the use of a backstop poverty rate
and its updating is not done over the electoral mandate of any particular government, but
puts the emphasis on the commitment that governments made collectively. The principle
being put forth is that things should never be worse than the situation prevailing when the
original commitment to children was made, measured by a fixed low income line, and
things should be better for children relative to the typical individual, as measured by a
moving low income line. Therefore as a backstop a low income line defined as 50% of
the median at the time the Convention came into force is used, adjusted only for inflation.
This measure is used to put a floor on the material living standards of children at the level
prevailing in the early 1990s.
a. Child poverty rates
Figure 4 illustrates that child poverty rates vary by more than a factor of ten across the
OECD countries, the fraction of children living in low income ranging from less than
14 The Convention was adopted and opened for signature, ratification and accession by the UN General Assembly on 20 November 1989. It entered into force on September 2, 1990 and has been ratified by 191 countries UNICEF (2002, p. 57). For practical purposes the starting point for the analysis is 1990 or the closest year before 1990 for which data is available. The most recently available data at the time the analysis in this paper was undertaken is used as the end point. For the most part this is 2000, but in some cases slightly earlier.

34
three percent to over 20 and almost 30%. The proportion of poor children is less than five
percent in only four countries—Denmark, Finland, Norway and Sweden—but at the same
time more than 10% in 15 of the 26 countries, and higher than 20% in the United States
and Mexico.
Further, child poverty rates are higher than the rates for the general population in
all but five OECD countries. In Canada and Italy 15 to 16% of children are poor, while
11 to about 13% of the general population are in the same situation, a gap of over three
percentage points. A similar gap exists in Luxembourg, and it approaches five and even
six percentage points in the United States and New Zealand. In Greece, Denmark,
Sweden, Finland, and Norway children are less likely to be poor than an average member
of the population. But Table 2 illustrates that while these differences are sometimes
significant, as in Finland and Norway, they are also sometimes slender, as in Greece.
Many children face the risk of living in poverty, and many children face a risk higher
than others in their society.
At least five cautions are needed in interpreting these numbers. The first is the
obvious point that they are all relative measures based upon poverty lines drawn from
national median incomes, and therefore refer to different “absolute” standards of living.
Though all of these countries are part of a select group of rich countries median incomes
vary a good deal between them, implying for example that the poverty line in the United
States is higher than that in Poland or Mexico. Low income children in one country could
have a much higher relative standard of living if they lived in another. (The actual low
income thresholds used in the derivation of these figures are presented in Appendix Table
A-1.) There may in some cases be good reason to argue that the concept of community
35
used in making comparisons of this sort should be broader and extend beyond national
boundaries. Indeed, Corak, Tamm, and Fertig (2005) point out that this argument has
historically had particular relevance in Germany with the integration of the East and
West. Before unification East Germans were much more likely to gauge their well-being
relative to the West than to the typical incomes of their co-citizens. This issue will also
likely have increasing resonance in the European Union as the notion of community and
governance changes. But the focus on relative poverty defined according to national
median incomes reflects the fact that children must live and participate in their own
societies, and that the responsibility for public policy towards the poor remains very
much within national boundaries.
Second, these estimates are derived from surveys of national populations and
therefore are subject to statistical uncertainty. The exact degree will vary from country to
country, but very roughly could be taken to be between one to two percentage points.
This would imply that the actual child poverty rate in Austria, to take a country in the
very middle of Figure 4 as an example, could reasonably be between 8 and 12 percent
and it accordingly could as legitimately be ranked ninth behind Belgium as it could 13th
just ahead of Greece.15 As such, the rankings in the figure are not exact and the specifics
are likely not terribly informative. All of the countries listed in Figure 4 from Greece to
Italy have, statistically speaking, about the same child poverty rate: in the neighbourhood
of 15%. It is, however, fair to say that Figure 4 suggests these OECD countries fall into
four broad groupings: countries with poverty rates less than 5%; countries with rates
15 For a listing of the standard errors associated with many of the countries in Figure 4 see the information provided by the Luxembourg Income Study at www.lisproject.org/keyfigures/standarderrors.htm.

36
between about 5 and 10%; those higher than 10% and less than 20%; and two with rates
in the neighbourhood of 20% or more.
The third caution relates to the possibility that the results may be sensitive to the
equivalence scale used, this applies particularly to the information in Table 2. However, it
should be noted that this information is presented in a conservative fashion. The
comparison being made is between children, and the entire population rather than
between children and just the adult population. Where this table indicates child poverty
rates greater than overall population it is very likely that the difference is even greater if
the comparison consisted of just adults. This said other equivalence scales will imply a
different composition of the poor and may lead to different results for some countries.
The fourth caution deals with the fact that in order to develop this list two
different data sources are relied upon. The first is the Luxembourg Income Study (LIS),
an international data archive and research network directed to the comparative analysis of
income in the OECD. LIS relies upon the cooperation of national statistical agencies to
provide up to date versions of nationally representative income surveys of households
and individuals. It undertakes a recoding of some information to ensure comparability in
definitions and concepts, publishes statistics of broad interest, and makes micro data files
accessible to researchers in a way that respects respondent confidentiality. The second
source is Mira d’Ercole and Förster (2005). These poverty rates are based on calculations
performed by a network of international consultants using nationally representative data
sources and coordinated by the OECD. Both LIS and the OECD report using the same
methods and definitions with respect to the measurement of income, the unit of analysis,
and equivalence scales. Figure 4 is based upon the most recently available data from each

37
source, or the most reliable source when in a couple of cases there are acknowledged
reasons to question reliability.16 The need to use both sources stems from the fact that not
all national statistical agencies provide data to LIS or provide timely data. The
comparability of these two sources is examined along a number of dimensions in
Appendix Tables A-2, A-3 and A-4, which suggest that for the most part the estimates are
within the range of statistical uncertainty and that they show the same direction of
change.
The final caution has to do with the sensitivity of the calculations to the particular
low income threshold used to identify the poor: one-half of the median individual
income.17 A complete picture of low income cannot be painted with a single statistic. It
makes a good deal of sense for policy makers to be aware of the entire income
distribution. This can be depicted for the lower half by using several poverty lines. Table
3 offers a series of child poverty rates for 15 of the 26 countries for which micro data was
available. The thresholds vary from 30% to 70% of the median income, which
encompass the range in current policy discourse.
At one extreme child poverty is virtually non-existent when the line is drawn as
low as 30% of the median, but this is not universally the case. In Mexico close to 14% of
children are still poor according to this threshold, in Italy and the United States more than
5%, and in the Netherlands almost 4%. These countries continue to have a non-trivial
proportion of children with very low relative incomes. Seven of 15 countries have child
16 There are two exceptions to this. The information for Australia is provided by the Social Policy Research Centre, University of New South Wales with the assistance of Bruce Bradbury, and that for France is from special tabulations provided by the Direction des Statistiques Démographiques et Sociales of INSEE with the assistance of P. Chevalier and also Christine Bruniaux of the Conseil de l’Emploi et de la Cohésion sociale. 17 The median is calculated using individual incomes that account for the equivalence scale.

38
poverty rates lower than 10% using 50% of the median, but even in these countries a
large fraction of children hover just above this threshold. This is evidenced by the fact
that child poverty rates more than double for low poverty rate countries like Finland,
Norway, Sweden in moving from a 50 to a 60% cut-off. The increase is also important
for many high child poverty rate countries like Poland, Canada, the United Kingdom, and
Italy. With a poverty line of 60% of median income their poverty rates are all above 20%.
Only three countries have child poverty rates below one-in-ten when the threshold is set
at this level. With a line at 70% there is no country with a rate below 10%, and all but
three are above 20% with six higher than 30%.
b. Changes in child poverty rates
Figure 5 charts changes in child poverty rates between about the end of the 1980s and
early 1990s, just before or around the time the Convention came into effect, and the late
1990s and early 2000s, roughly a decade later. In 16 of the 24 countries featured child
poverty rates have risen by more than one percentage point, and in only three—the
United Kingdom, the United States, and Norway—has there been a statistically
significant fall. Of these only Norway began the 1990s with relatively low child poverty
rates. At the other extreme child poverty rates rose by about four or more percentage
points in Belgium, Luxembourg, the Czech Republic, and Poland. The experience in the
majority of OECD countries suggests that the relative economic situation of low income
children has deteriorated.
A more refined picture of these changes is offered in Table 4 and illustrated in
Figure 6, offering changes in child poverty rates using both a moving and a fixed poverty

39
line for 14 countries for which access to the micro data to undertake the calculations was
available. Among the countries experiencing increases in child poverty rates according to
a moving poverty line four can be said to have actually undergone the type of change
depicted hypothetically in Figure 3. In Mexico, Italy, Hungary, and to a lesser extent
Germany the poverty measured against both a moving and a fixed threshold increased
significantly. These are examples of cases in which a backstop was not set on child
poverty rates so that by the end of the 1990s it was higher even by the standards
prevailing a decade earlier when the Convention came into force. In the face of turbulent
economic changes that saw either very little growth in median incomes (as in Germany)
or significant declines (as in all three of the remaining countries) children lost ground
relative to better times in the past, but also relative to prevailing income levels. Like
others in the population their standard of living declined, but the burden of economic
change also fell disproportionately upon them.
In Belgium, the Netherlands, and to a lesser extent Sweden the situation was
slightly different, though still can be understood in terms of Figure 3. Median incomes
increased in these countries, but this was not reflected in lower child poverty rates. The
backstop was respected in that children maintained their standard of living relative to the
early 1990s. But they experienced none of the benefits in income growth, losing ground
relative to the median. Poverty rates according to a moving line rose.
Only in Norway, the United States, and the United Kingdom can it be said that the
type of scenario depicted in Figure 2 played out since the Convention came in to force,
with child poverty rates falling according to both indicators.

40
c. Setting feasible targets
The reasons for these changes require much more detailed study and reflect the
influences of families, labour markets, and government policy on the material situation of
children. These issues are discussed in Chen and Corak (2005), but it is important to note
that families and labour markets are limited in their capacity to lower child poverty rates
below 10%. Figure 7 contrasts the child poverty rates used in Figure 4, those based on
household disposable income, with rates defined on the basis of market incomes (before
taxes and transfers). Child poverty rates are above 10% in 20 of the 21 countries listed in
Figure 7 and above 20% in eight of them. Switzerland is the only country with a child
poverty rate based on market incomes that is lower than 10%.
This said, the difference between low income rates before and after taxes and
transfers should not be taken as an assessment of the impact of tax/transfer policy on
children. This is a very simplistic description that takes no account of the behavioural
impact of these policies, nor does it account for non-cash transfers and the provision of
other public goods. Corak, Lietz and Sutherland (2005) examine government budgets and
their impact on child poverty rates in much more detail, and note, as Figure 7 suggests,
that the very wide range in poverty rates children face in these rich countries has
something important to do government tax and spending decisions. Overall poverty rates
resulting form market incomes vary by roughly a factor of three, from about 10% to
about 30%. But after taxes and transfers they are much more differentiated, varying by a
factor of nine, from around 3% to 28%.
One representation of the relationship between child poverty rates and
government budgetary decisions is depicted in Figure 8, which contrasts poverty rates

41
with the percentage of GDP devoted to family and other related social benefits. These
include government expenditures on family allowances, disability and sickness benefits,
formal day care provision, unemployment insurance, employment promotion, and other
forms of social assistance.18 The figure shows that the greater the proportion of GDP
directed to these areas, the lower the child poverty rates. In no country devoting 10% or
more of GDP is the low income among children above 10%; in no country devoting less
than 5% is it below about 15% or so.19
This relationship should not be taken as simply reflecting a truism that countries
redistributing more of their national income will have more equal post tax and transfer
income distributions, and therefore a smaller proportion of the population below a
particular fraction of the median income. First, there is a good deal of variation in
outcomes between the two extremes. For example, 10 of 26 countries devote between 7
to 10% of GDP to social transfers but their low income rates of children vary by a factor
of more than five, from lows of 3.4% and 7.3% in Norway and France to over 15% in the
UK and New Zealand. Second, and relatedly, there is a choice to be made between
directing spending to these types of benefits or to other types addressed to the needs of
other population groups. In some large measure the relationship between social
18 The source of these data is the provisional version of OECD (2004), Social Expenditures Database, available at www.oecd.org/els/social/expenditure. These data do not include expenditures on education and health as they are not directed in the first instance to income security. More detail on the concepts and content of this information is available in OECD, “20 Years of Social Expenditure: the OECD Database,” Paris: OECD. 19 The single possible exception to this is Japan with a child poverty rate of 14.3% and less than 5% of GDP devoted to these expenditures. But in this case there might be an understatement of social spending as a certain amount of social support is provided directly by employers. See Bradshaw and Finch (2002) on this point.
42
expenditures and child poverty depends not only on the level of government support, but
also on how it is structured and delivered.
All this is to suggest that in countries with moderate shares of GDP devoted to
family and related expenditures there is a good deal of variation in child low income rates
and there is greatest potential for reducing them below 10%. Countries spending about 7
to 7½ percent of GDP on family and related benefits but with child poverty rates above
10% include: Australia, the United Kingdom, Austria, Germany, New Zealand, and
Poland. Attaining a target of less than one-in-ten children in poverty is something these
countries might give consideration. In countries with lower rates of spending attaining
this target may involve increases in the proportion of support directed to children. Some
countries with child poverty rates between 5 and 10% spend similar proportions of GDP
as others with rates below 5%. Luxembourg, France, the Netherlands, and Belgium could
strive to lower child poverty rates below one-in-twenty without significant overall
increases in spending.
These suggestions, are meant to be indicative only. The extent to which they
represent feasible goals presupposes an understanding both of how labour markets,
families, and social policy interact to determine child outcomes, and an appreciation of
the priorities and trade-offs actually embedded in government budgets. The latter are in
part discussed in Corak, Lietz and Sutherland (2005) using a number of different
measures of social spending. While the information in Figure 8 is certainly suggestive of
feasible goals, it is only a starting point and requires reflection within each national
context, one that recognizes both broader dimensions of poverty than just income and a
broader set of policies than just income transfers.
43
5. Conclusion
Articles 4 and 27 of the Convention on the Rights of the Child together establish the
elimination of child poverty as a policy commitment that governments in both rich and
poor countries should take as a top priority. Taking top priority does not mean that child
poverty can be eliminated instantly. It is recognized that social and economic rights
sometimes need to be realized progressively as the understanding of issues evolves, and
as appropriate and effective interventions are uncovered and put into place. But this also
does not mean that the commitment to eliminate child poverty is always one for
tomorrow. Rather there should be progressive movement to lower and lower rates of
child poverty as the ideal that children having first call on social resources becomes
entrenched in discourse and decisions.
The analysis in this paper finds that reality is far from this ideal. First, child
poverty rates vary by more than a factor of ten across the OECD, from less than three
percent to over 20 and almost 30%. These countries fall into four broad groups, those
with child poverty rates less than 5%, those with higher rates but still less than 10%,
those with rates higher than 10% and as high as 20%, and finally two countries with more
than one-in-five children being poor. Such variation creates at least the presumption that
there is nothing inevitable about the level of child poverty in a given country. All OECD
countries operate broadly similar free-market economic systems, and their widely
differing child poverty rates reflect different policies interacting with labour market and
social institutions. Indeed, poverty rates based upon disposable (after tax – after transfer)
incomes vary much more than those calculated from solely market incomes.

44
Second, in the strong majority of countries for which reliable data is available
child poverty rates, far from progressively declining, have actually gone up since the
early 1990s when the Convention on the Rights of the Child first came into force. In 16
of 24 OECD countries the child poverty rate at the end of the 1990s was higher than at
the beginning, and in only three countries has it declined to a measurable degree. Though
the specific reasons for this trend are not addressed it is not one suggesting outright that
children are a top public policy priority.
There are at least three practical challenges that might stand in the way of this
being so: lack of clarity in a policy relevant definition of poverty; lack of understanding
in how families and labour markets work to determine poverty rates; and lack of
understanding of the priorities embedded in government tax and transfer programs as
well as their effectiveness in lowering poverty rates. The major objective of this paper is
to address the first issue, that having to do with definition and measurement. The first
step in eliminating child poverty requires governments to clearly define and measure
what it means for a child to be poor. Without this credible targets cannot be set and
progress cannot be monitored. This is only a first step, but an important one that raises
difficulties even for the most committed public policy maker.
Drawing from economic theory, accepted statistical practice, and a review of
actual country experiences the questions that must be answered are clarified, and a set of
principles to serve as a guide in addressing them stated. A definition of poverty requires
the definition and measurement of the resources determining well-being; the setting of a
threshold distinguishing the poor from the non-poor; and a meaningful count of the poor.
Theory and statistical practice offer some but not complete guidance so that value

45
judgments and practicalities need to bridge the gap. In all aspects of these three issues
there is a need to recognize the particular concerns of children and to tilt information
gathering toward surveys that explicitly recognize their situation.
Theory, statistical practice and actual public policy debates in the OECD suggest
the following six principles to guide the formulation of a definition: (1) avoid
unnecessary complexity by using an income based measure of resources; (2) complement
this by measuring material deprivation directly using a small set of indicators; (3) draw
poverty lines with regard to social norms; (4) establish a regular monitoring system and
update poverty lines within a five year period; (5) set a both a backstop and a target by
using fixed and moving poverty lines; and (6) offer leadership and build public support
for poverty reduction.
The specifics of how these principles are put into practice will vary from country
to country but in all cases they should be used to develop feasible and credible targets for
poverty reduction over the course of a government’s electoral mandate. In many
countries with poverty rates above 10% the level of social expenditure on family related
benefits is similar to other countries where the child poverty rate is less than 10%. For
these countries lowering the fraction of child who are income poor below one-in-ten
might be a goal not requiring increases in spending, but a restructuring of priorities or
delivery. In a similar way other countries could reasonably strive to lower child poverty
rates below 5%. But these targets are only suggestive and require governments to not
only articulate an appropriate level but also to understand how families, labour markets,
and social policy interact in their national context. Feasible and credible targets structured
to make children a priority over the course of an electoral mandate, and that ratchet

46
downward to ever more demanding levels with each new government are important first
steps in reversing the trend of the past and setting a course for lower child poverty in the
future.
47
References Atkinson, A.B. (1998). Poverty in Europe. Oxford: Blackwell publishers. _____ (1989). Poverty and Social Security. Hemel Hempstead: Harvester Wheatsheaf. _____ (1987). “On the Measurement of Poverty.” Econometrica. Vol. 55, pp. 749-64. Atkinson, Tony Bea Cantillon, Eric Marlier, and Brian Nolan (2002). Social Indicators:
The EU and Social Inclusion. Oxford: Oxford University Press. Blackburn, McKinley L. (1998). “The Sensitivity of International Poverty Comparisons.”
Review of Income and Wealth. Series 44, pp. 449-72. Bradshaw, Jonathan (2004). “How Has The Notion of Social Exclusion Developed In
The European Discourse?” The Economic and Labour Relations Review. Vol. 14, 168-86.
Bradshaw J. and N. Finch (2002). A comparison of Child Benefit packages in 22 countries,
Department for Work and Pensions Research Report No. 174, London: CDS. Browning, Martin (1992). “Children and Household Economic Behavior,” Journal of
Economic Literature. Vol. 30, pp. 1434-75. _____, François Bourguignon, Pierre-André Chiappori, and Valérie Lechene (1994).
“Incomes and Outcomes: A Structural Model of Intrahousehold Allocation.” Journal of Political Economy. Vol. 102, pp. 1067-98.
Chen, Wen-Hao and Miles Corak, 2005. “Child poverty and changes in child poverty.”
Innocenti Working Paper No. 2005-02. Florence, UNICEF Innocenti Research Centre. Available at www.unicef.org/irc.
Citro, Constance F. and Robert T. Michael, editors (1995), Measuring Poverty: A New
Approach, Washington DC: National Academy Press Commission of the European Communities (2003). “Joint Report on Social Inclusion
summarizing the results of the National Action Plans for Social Inclusion (2003-2005).” Brussels, COM(2003)773 final.
Conseil de l’Emploi, des Revenus et de la Cohésion Sociale (2002). “Estimer l’évolution
récente de la pauvreté.” Paris: Un dossier du Cerc, available at www.cerc.gouv.fr. Corak, Miles, Michael Fertig and Marus Tamm (2005). “A portrait of child poverty in
Germany.” Innocenti Working Paper No. 2005-03. Florence, UNICEF Innocenti Research Centre. Available at www.unicef.org/irc.
48
_____, Christine Lietz and Holly Sutherland (2005). “The Impact of tax and transfer systems on children in the European Union.” Innocenti Working Paper No. 2005-04. Florence, UNICEF Innocenti Research Centre. Available at www.unicef.org/irc.
Department for Work and Pensions (2003). “Measuring child poverty.” Available at
www.dwp.gov.uk/consultations/consult/2003/childpov/final.asp. Duclos, Jean-Yves and Phillipe Grégoire (2002). “Absolute and Relative Deprivation and
the Measurement of Poverty” Review of Income and Wealth. Series 48, pp. 471-92.
Duflo, Ester (2000). “Child Health and Household Resources in South Africa: Evidence
from the Old Age Pension Program.” American Economic Review. Vol. 90, pp. 393-98.
Eurostat Task Force (1998), “Recommendations on Social Exclusion and Poverty
Statistics,” Paper presented to the 26-27 November Meeting of the EU Statistical Programme Committee.
Expert Group on Household Income Statistics, The Canberra Group (2001). Final Report
and Recommendations. Ottawa: The Canberra Group. Fellegi, Ivan P., Chief Statistician of Canada (1997). “On poverty and low income.”
Ottawa: Statistics Canada. Available at www.statcan.ca/english/research/ 13F0027XIE/13F0027XIE.htm.
Fisher, Gordon M. (1999). “An Overview of Developments since 1995 Relating to a
Possible New U.S. Poverty Measure.” US Bureau of the Census, unpublished. Available at www.census.gov/hhes/poverty/povmeas/papers
_____ (1995). “Is There Such a Thing as an Absolute Poverty Line over Time? Evidence
from the United States, Britain, Canada, and Australia on the Income Elasticity of the Poverty Line.” US Bureau of the Census, unpublished. Available at www.census.gov/hhes/poverty/povmeas/papers/elastap4.html.
_____ (1992). “The Development and History of the Poverty Thresholds.” Social Security
Bulletin. Vol. 55, no. 2. Available at www.ssa.gov/history/fisheronpoverty.html. Foster, James E. (1998). “Absolute versus Relative Poverty.” American Economic
Review. Vol. 88, 335-41. Garfinkel, Irwin, Lee Rainwater and Timothy M. Smeeding (2004). “Welfare State
Expenditures and the Redistribution of Well-Being: Children, Elders and Others in Comparative Perspective.” Paper presented to the Workshop on The Welfare State in an Intertemporal Perspective, Siena, Certosa di Pontignano.

49
Hatfield, Michael (2002). “Constructing the Revised Market Basket Measure.” Ottawa:
Human Resources Development Canada. Hoelscher, Petra (2004). “A thematic study using transnational comparisons to analyse
and identify what combination of policy responses are most successful in preventing and reducing high levels of child poverty.” Draft of a final report submitted to the European Commission, DG Employment and Social Affairs.
Lundberg, Shelly, Robert Pollack, and Terence Wales (1997), “Do Husbands and Wives
Pool their Resources? Evidence from the UK Child Benefit.” Journal of Human Resources. Vol. 32, pp. 463-80.
Madden, David (2000). “Relative or Absolute Poverty Lines: A New Approach.” Review
of Income and Wealth. Series 46, pp. 181-99. Mira d’Ercole, M. and M. Förster (2005). “Income distribution and poverty in OECD
countries in the second half of the 1990s.” Paris: OECD, Directorate for Employment, Labour and Social Affairs.
Nolan, Brian (2004). “The Meaning and Measurement of Child Poverty: Recent UK and
Irish Experience.” Unpublished note prepared for the UNICEF Innocenti Research Centre Experts Meeting.
Nolan, Brian and Christopher T. Whelan (1996). Resources, Deprivation, and Poverty.
Oxford: Oxford University Press. Palme, Joakim et al. (2003). “A Welfare Balance Sheet for the 1990s.” Scandinavian
Journal of Public Health, Supplement 60, August. Ravallion, Martin (1998). Poverty Lines in Theory and Practice. Washington DC: The
World Bank, LSMS Working Paper Number 133. _____ (1996). “Issues in Measuring and Modelling Poverty.” Economic Journal. Vol.
106, pp. 1328-43. Sen, Amartya (1999). Development as Freedom. New York: Random House. _____ (1983). “Poor, Relatively Speaking.” Oxford Economic Papers. New Series, Vol.
35, pp. 153-69. _____ (1976). “Poverty: An Ordinal Approach to Measurement.” Econometrica. Vol. 44,
pp. 219-31. Shillington, Richard (1999). “What Should be the True Definition of Poverty?” Ottawa:
Tristat Resources. Available at www.shillington.ca/poverty/ts012999.htm.

50
Short, Kathleen and Thesia I. Garner (2002), “A Decade of Experimental Poverty
Thresholds 1990 to 2000.” US Bureau of the Census, unpublished. Available at www.census.gov/hhes/poverty/ povmeas/papers.
Skuterud, Mikal, Marc Frenette and Preston Poon (2004). “Describing the Distribution of
Income: Guidelines for Effective Analysis.” Ottawa: Statistics Canada, Catalogue No. 75F0002MIE – No. 010.
Streeten, P., S. Burki, M. ul Haq, N. Hicks, and F. Stewart (1981). First Things First:
Meeting Basic Needs in Developing Countries. New York: Oxford University Press.
UNDP (2000). Human Development Report 2000. New York: United Nations
Development Program. UNICEF (2005). “Child Poverty in Rich Countries, 2005.” Innocenti Report Card No. 6.
Florence: UNICEF Innocenti Research Centre. UNICEF (2002). A World Fit for Children. New York: The United Nations Children’s
Fund.

51
Table 1 Frequencies in the updating of consumption patterns for the calculation of consumer price indices in the OECD countries
Country Frequency of Updates
Latest Update
Notes
Australia About every 5 years 2000 Austria Every 5 years 2000 Belgium Every 7 to 8 years 1995/96 Next revision is planned for 2004. Canada Every 4 years 2001 Czech Republic About every 5 years 1999 Denmark Every 4 to 5 years Finland Every 5 years 2000 France Annually The sample is updated annually to reflect trends in
consumer behaviour and the introduction of new products, but the weights are updated over a two year period.
Germany Every 5 years 2000 Greece Every 5 or 6 years The weights are revised each time a new household budget
survey is conducted every five or six years. Hungary Every 2 years 2000 Weights are derived from a continuous household
expenditure survey, and revised annually. The reference base for the weights is two years prior to the current year.
Iceland Every year Ireland Every 7 years 1999/00 Every five years beginning in December 2006 Italy Every year Japan Every 5 years 2000 Korea Every 5 years 2000 Mexico No fixed schedule,
but plans for every two years
Past updates took place in 1980 using 1977 expenditure data, in 1994 using 1989 data, and presumably in 1998 using 1994 expenditure data. Plans exist to update every two years.
Norway Annually Poland Annually Portugal Annually 2000 Slovak Republic Every 5 years 2000 Spain Annually 1999/01 Beginning in 2002, weights are to be updated at finest
commodity level every five years, with the possibility of annual updates for the major components.
Sweden Annually 2001 Switzerland Annually 1998 The new Consumer Price Index is designed to be
reweighted annually, with the first scheduled for 2001. Turkey Every 5 years 1994 United Kingdom Annually 2002 United States Every 2 years 1999/00 Historically weights have been updated every 10 years, but
every two years beginning in 2002. Sources: http://dsbb.imf.org/Applications/web/sddscategorylist/ accessed on May 10, 2004; correspondence with Statistics Belgium, May 11, 2004; in addition for the US http://stats.bls.gov/cpi/cpiupdt.htm accessed on May 11, 2004; for Australia, Australian Bureau of Statistics A Guide to the Consumer Price Index, 14th Series (cat. no. 6440.0) accessed May 7, 2004 at http://www.abs.gov.au/; for the United Kingdom http://www.statistics.gov.uk/cci/nugget.asp?id=318 accessed on May 7, 2004. For the ILO recommendations see http://www.ilo.org/public/english/bureau/stat/guides/cpi/index.htm chapter 4.22 accessed on May 7, 2004. Clear information on this issue for Luxembourg and the Netherlands was not available from these sources.
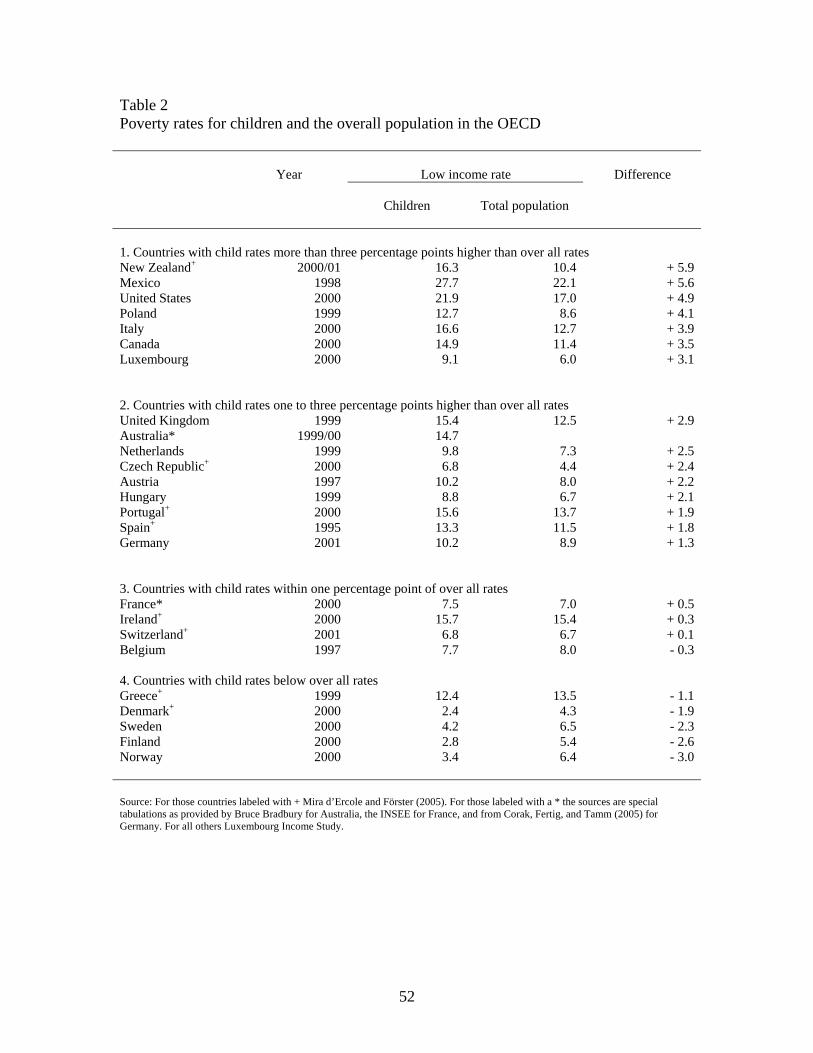
52
Table 2 Poverty rates for children and the overall population in the OECD Year Low income rate Difference
Children
Total population
1. Countries with child rates more than three percentage points higher than over all rates New Zealand+ 2000/01 16.3 10.4 + 5.9 Mexico 1998 27.7 22.1 + 5.6 United States 2000 21.9 17.0 + 4.9 Poland 1999 12.7 8.6 + 4.1 Italy 2000 16.6 12.7 + 3.9 Canada 2000 14.9 11.4 + 3.5 Luxembourg 2000 9.1 6.0 + 3.1 2. Countries with child rates one to three percentage points higher than over all rates United Kingdom 1999 15.4 12.5 + 2.9 Australia* 1999/00 14.7 Netherlands 1999 9.8 7.3 + 2.5 Czech Republic+ 2000 6.8 4.4 + 2.4 Austria 1997 10.2 8.0 + 2.2 Hungary 1999 8.8 6.7 + 2.1 Portugal+ 2000 15.6 13.7 + 1.9 Spain+ 1995 13.3 11.5 + 1.8 Germany 2001 10.2 8.9 + 1.3 3. Countries with child rates within one percentage point of over all rates France* 2000 7.5 7.0 + 0.5 Ireland+ 2000 15.7 15.4 + 0.3 Switzerland+ 2001 6.8 6.7 + 0.1 Belgium 1997 7.7 8.0 - 0.3 4. Countries with child rates below over all rates Greece+ 1999 12.4 13.5 - 1.1 Denmark+ 2000 2.4 4.3 - 1.9 Sweden 2000 4.2 6.5 - 2.3 Finland 2000 2.8 5.4 - 2.6 Norway 2000 3.4 6.4 - 3.0 Source: For those countries labeled with + Mira d’Ercole and Förster (2005). For those labeled with a * the sources are special tabulations as provided by Bruce Bradbury for Australia, the INSEE for France, and from Corak, Fertig, and Tamm (2005) for Germany. For all others Luxembourg Income Study.

53
Table 3 Child poverty rates for different poverty lines in selected OECD countries
Country
Year
Poverty line (as percent of median income)
30 40 50 60 70
Finland 2000 0.4 1.3 2.8 8.0 17.9 Norway 2000 0.9 1.6 3.4 7.5 15.1 Sweden 2000 0.7 1.8 4.2 9.2 17.3 Belgium 1997 1.7 3.2 7.7 13.7 20.2 Hungary 1999 2.6 4.4 8.8 16.9 26.0 Luxembourg 2000 0.5 2.1 9.1 18.3 28.9 Netherlands 1999 3.9 5.9 9.7 14.2 21.2 Austria 1997 3.3 6.5 10.2 17.3 28.5 Germany 2001 2.8 6.2 10.2 16.9 25.2 Poland 1999 2.6 6.1 12.6 21.4 30.5 Canada 2000 3.2 7.7 14.9 23.3 33.0 U.K. 1999 2.5 5.5 15.4 27.0 36.8 Italy 2000 5.8 10.6 16.6 26.5 37.3 U.S. 2000 7.6 14.1 21.9 30.2 37.9 Mexico 1998 13.8 20.9 27.7 35.0 41.7 Source: Calculations by author using Luxembourg Income Study
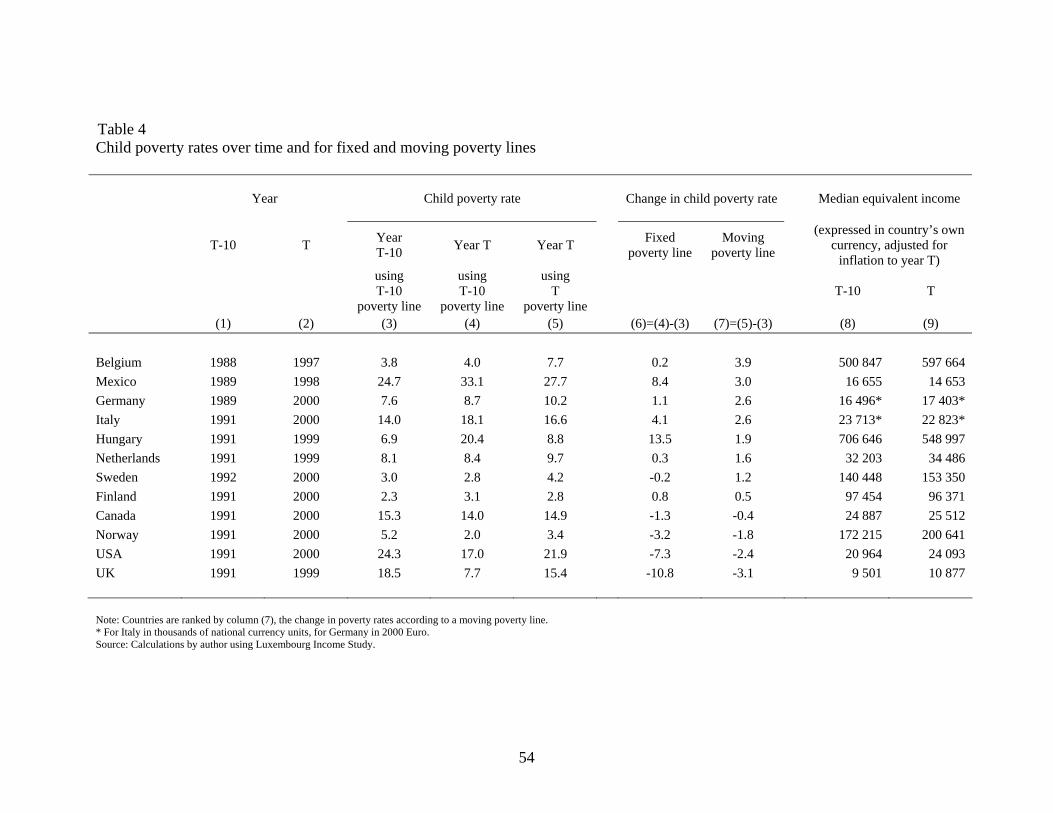
54
Table 4 Child poverty rates over time and for fixed and moving poverty lines
Year Child poverty rate
Change in child poverty rate
Median equivalent income
T-10 T Year T-10 Year T Year T Fixed
poverty line Moving
poverty line
(expressed in country’s own currency, adjusted for
inflation to year T)
using T-10
poverty line
using T-10
poverty line
using T
poverty line
T-10 T
(1) (2) (3) (4) (5) (6)=(4)-(3) (7)=(5)-(3) (8) (9) Belgium 1988 1997 3.8 4.0 7.7 0.2 3.9 500 847 597 664 Mexico 1989 1998 24.7 33.1 27.7 8.4 3.0 16 655 14 653 Germany 1989 2000 7.6 8.7 10.2 1.1 2.6 16 496* 17 403* Italy 1991 2000 14.0 18.1 16.6 4.1 2.6 23 713* 22 823*
Hungary 1991 1999 6.9 20.4 8.8 13.5 1.9 706 646 548 997 Netherlands 1991 1999 8.1 8.4 9.7 0.3 1.6 32 203 34 486 Sweden 1992 2000 3.0 2.8 4.2 -0.2 1.2 140 448 153 350 Finland 1991 2000 2.3 3.1 2.8 0.8 0.5 97 454 96 371 Canada 1991 2000 15.3 14.0 14.9 -1.3 -0.4 24 887 25 512 Norway 1991 2000 5.2 2.0 3.4 -3.2 -1.8 172 215 200 641 USA 1991 2000 24.3 17.0 21.9 -7.3 -2.4 20 964 24 093 UK 1991 1999 18.5 7.7 15.4 -10.8 -3.1 9 501 10 877 Note: Countries are ranked by column (7), the change in poverty rates according to a moving poverty line. * For Italy in thousands of national currency units, for Germany in 2000 Euro. Source: Calculations by author using Luxembourg Income Study.

55
Appendix Table A-1 Low income thresholds used in the derivation of poverty rates for Figure 4 Luxembourg Income Study OECD Year 50% of median
equivalent income Year 50% of median
equivalent income Australia Austria 1999 104 972 Belgium 1997 298 832 Canada 2000 12 444 Czech Republic 2000 60 237 Denmark 2000 83 391 Finland 2000 48 727 France Germany* 2000 8 702 2001 12.8 Greece* 1999 1 359 Hungary 1999 274 499 Ireland 2000 6 668 Italy* 2000 11 412 Luxembourg 2000 521 807 Mexico 1998 7 327 Netherlands 1999 17 243 New Zealand 2000/01 10 208 Norway 2000 86 108 Poland 2000 5 740 Portugal 2000 714 779 Spain 1995 926 809 Sweden 2000 70 224 Switzerland 2001 22 384 United Kingdom 1999 4 751 United States 2000 10 482 Note: All data are expressed in inflation adjusted national currency units for the year indicated except those indicated with *. For Germany information is in Euros, and for Greece and Italy it is in thousands of national currency unit. The source for the OECD data is Annex Table 2 of Mira d’Ercole and Forster (2005). Data for Australia and France are not available.

56
Appendix Table A-2 A comparison of child poverty rates from two alternative data sources: using most recently available data from each source Luxembourg Income Study OECD Difference Year Rate Year Rate Australia 1998/99 11.6 Austria 1997 10.2 1999 13.3 Belgium 1997 7.7 Canada 2000 14.9 Czech Republic 2000 6.8 Denmark 1997 8.7 2000 2.4 Finland 2000 2.8 2000 3.4 -0.6 France 2000 7.3 Germany 2001 12.8 Germany (West) 2000 6.8 2001 13.1 Greece 1999 12.4 Hungary 1999 8.8 2001 13.1 Ireland 2000 15.7 Italy 2000 16.6 2000 15.7 0.9 Luxembourg 2000 9.1 Mexico 1998 27.7 Netherlands 1999 9.8 2000 9.0 New Zealand 2000/01 16.3 Norway 2000 3.4 2000 3.6 -0.2 Poland 1999 12.7 2000 9.9 Portugal 2000 15.6 Spain 1995 13.3 Sweden 2000 4.2 2000 3.6 0.6 Switzerland 2001 6.8 United Kingdom 1999 15.4 2000 16.2 United States 2000 21.9 2000 21.6 0.3 Source: LIS data are from Luxembourg Income Study, Key Figures, accessed at www.lisproject.org/keyfigures.htm on June 8, 2004. OECD data are from Mira d’Ercole and Förster (2005).
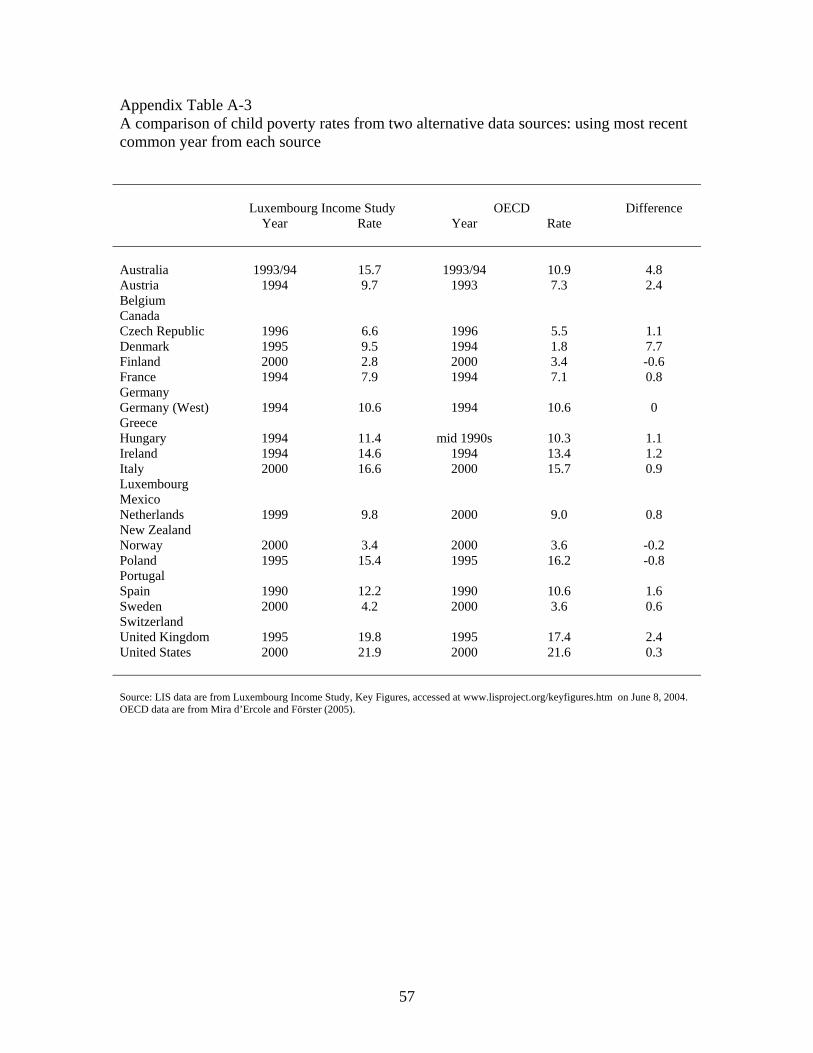
57
Appendix Table A-3 A comparison of child poverty rates from two alternative data sources: using most recent common year from each source Luxembourg Income Study OECD Difference Year Rate Year Rate Australia 1993/94 15.7 1993/94 10.9 4.8 Austria 1994 9.7 1993 7.3 2.4 Belgium Canada Czech Republic 1996 6.6 1996 5.5 1.1 Denmark 1995 9.5 1994 1.8 7.7 Finland 2000 2.8 2000 3.4 -0.6 France 1994 7.9 1994 7.1 0.8 Germany Germany (West) 1994 10.6 1994 10.6 0 Greece Hungary 1994 11.4 mid 1990s 10.3 1.1 Ireland 1994 14.6 1994 13.4 1.2 Italy 2000 16.6 2000 15.7 0.9 Luxembourg Mexico Netherlands 1999 9.8 2000 9.0 0.8 New Zealand Norway 2000 3.4 2000 3.6 -0.2 Poland 1995 15.4 1995 16.2 -0.8 Portugal Spain 1990 12.2 1990 10.6 1.6 Sweden 2000 4.2 2000 3.6 0.6 Switzerland United Kingdom 1995 19.8 1995 17.4 2.4 United States 2000 21.9 2000 21.6 0.3 Source: LIS data are from Luxembourg Income Study, Key Figures, accessed at www.lisproject.org/keyfigures.htm on June 8, 2004. OECD data are from Mira d’Ercole and Förster (2005).

58
Appendix Table A-4 A comparison of changes in child poverty rates from two alternative data sources Luxembourg Income Study OECD Direction early
1990s1 about 2000
change early 1990s
about 2000
change of change is same
Australia 15.5 11.6 -3.9 Austria 4.8 10.2 5.4 7.3 13.3 6.0 yes Belgium 3.8 7.7 3.9 Canada 15.3 14.9 -0.4 Czech Republic 2.6 6.8 4.2 Denmark 5.0 8.7 3.7 1.8 2.4 0.6 yes Finland 2.3 2.8 0.5 2.1 3.4 1.3 yes France 6.1 7.3 1.2 Germany 12.8 Germany (West) 4.6 6.8 2.2 6.7 13.1 6.4 yes Greece 12.7 12.4 -0.3 Hungary 6.9 8.8 1.9 5.7 13.1 7.4 yes Ireland 13.3 15.7 2.4 Italy 14.0 16.6 2.6 13.5 15.7 2.2 yes Luxembourg 5.0 9.1 4.1 Mexico 24.7 27.7 3.0 Netherlands 8.1 9.8 1.7 6.7 9.0 2.3 yes New Zealand 14.3 16.3 2.0 Norway 5.2 3.4 -1.8 4.4 3.6 -0.8 yes Poland 8.4 12.7 4.3 16.2 9.9 -6.3 no Portugal 12.4 15.6 3.2 Spain 10.6 13.3 2.7 Sweden 3.0 4.2 1.2 2.6 3.6 1.0 yes Switzerland 6.8 United Kingdom 18.5 15.4 -3.1 17.2 16.2 -1.0 yes United States 24.3 21.9 -2.4 22.2 21.6 -0.6 yes 1. Austrian data are for 1987, Belgium for 1988, German for 1989, all others for either 1991 or 1992 except Australian which are 1993/94.
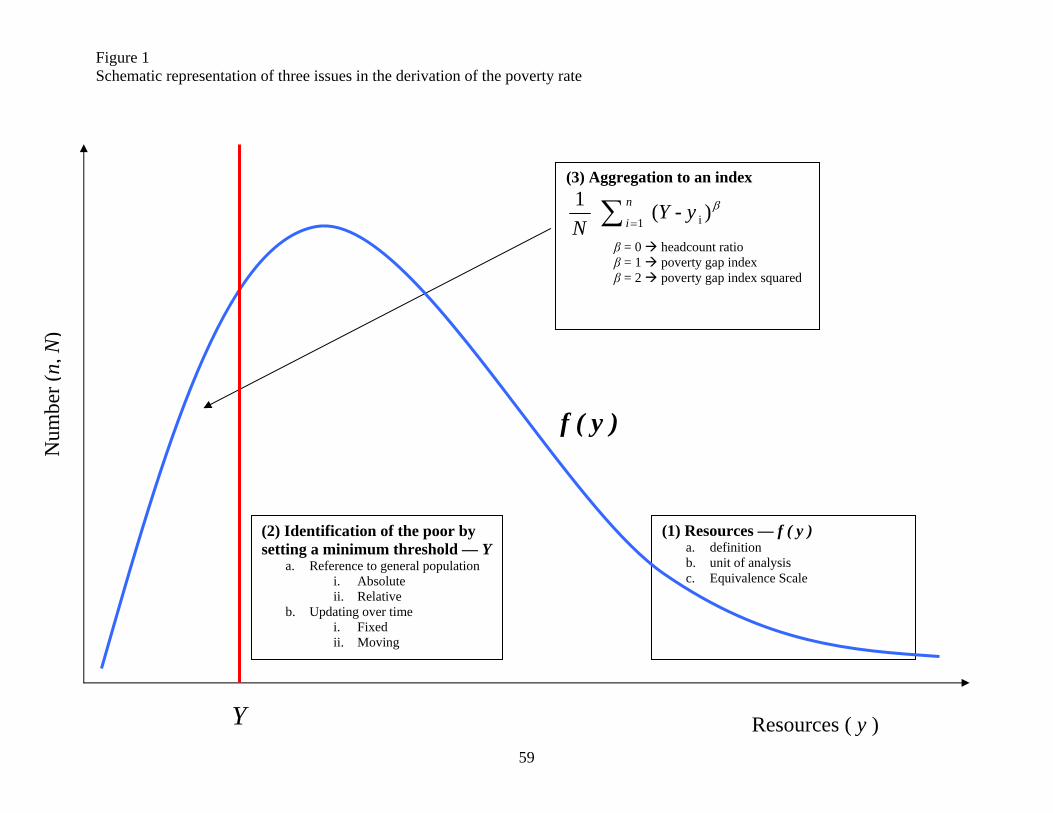
Figure 1 Schematic representation of three issues in the derivation of the poverty rate
59
f ( y )
(1) Resources — f ( y ) a. definition b. unit of analysis c. Equivalence Scale
(2) Identification of the poor by setting a minimum threshold — Y
a. Reference to general population i. Absolute ii. Relative
b. Updating over time i. Fixed ii. Moving
(3) Aggregation to an index
β)( 11 i∑ =
n
iY - y
N
β = 0 headcount ratio β = 1 poverty gap index β = 2 poverty gap index squared
Resources ( y ) Y
Num
ber (
n, N
)

60
Chi
ld p
over
ty ra
te
Poverty rate according to
moving poverty line
Poverty rate according to
fixed poverty line
Figure 2 Lowering child poverty during periods of economic growth using fixed and moving poverty lines to establish a backstop and set targets
First electoral mandate Second electoral mandate
Backstop poverty rate set as the poverty rate at the beginning of the
first electoral mandate
Backstop poverty rate set as the poverty rate at the beginning of the
second electoral mandate
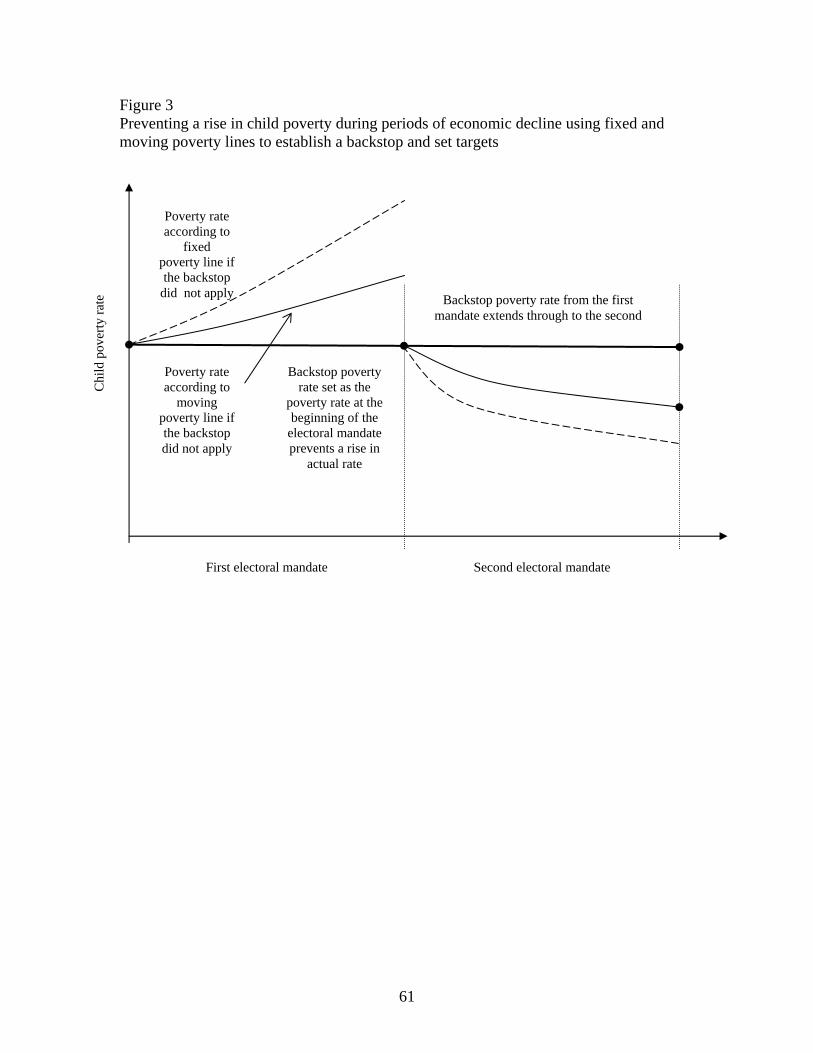
61
Chi
ld p
over
ty ra
te
Poverty rate according to
fixed poverty line if the backstop
did not apply
Poverty rate according to
moving poverty line if the backstop did not apply
Figure 3 Preventing a rise in child poverty during periods of economic decline using fixed and moving poverty lines to establish a backstop and set targets
First electoral mandate Second electoral mandate
Backstop poverty rate from the first mandate extends through to the second
Backstop poverty rate set as the
poverty rate at the beginning of the
electoral mandate prevents a rise in
actual rate

62
Figure 4 Child poverty rates in the OECD during the late 1990s and early 2000s
27.7
21.9
16.6
16.3
15.7
15.6
15.4
14.9
14.7
14.3
13.3
12.7
12.4
10.2
10.2
9.8
9.1
8.8
7.7
7.5
6.8
6.8
4.2
3.4
2.8
2.4
0 5 10 15 20 25 30
Mexico
United States
Italy
New Zealand+
Ireland+
Portugal+
United Kingdom
Canada
Australia*
Japan
Spain+
Poland
Greece+
Austria
Germany*
Netherlands
Luxembourg
Hungary
Belgium
France*
Czech Republic+
Switzerland+
Sweden
Norway
Finland
Denmark+
Child poverty rate(percent of children with incomes below one-half national median)
Source: For those countries labeled with + Mira d’Ercole and Förster (2005). For those labeled with a * the sources are special tabulations as provided by Bruce Bradbury for Australia, the INSEE for France, and from Corak, Fertig, and Tamm (2005) for Germany. For all others Luxembourg Income Study. For the specific reference years, which vary from country to country, see Table 2.
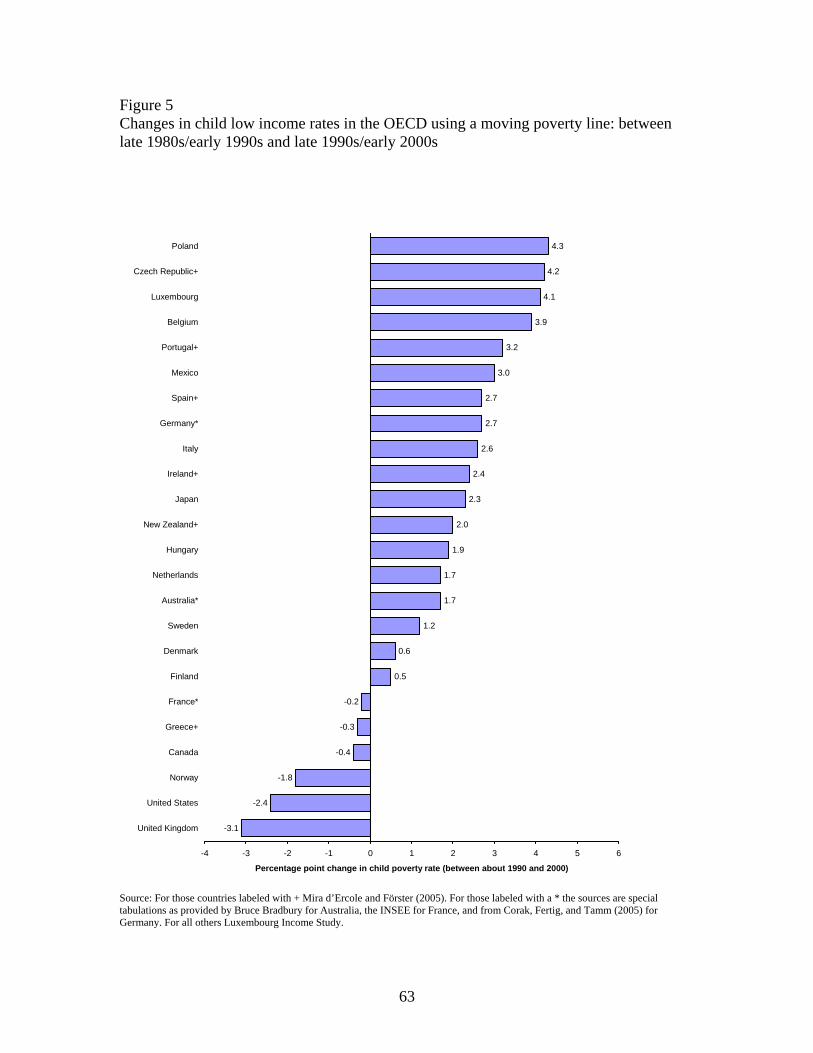
63
Figure 5 Changes in child low income rates in the OECD using a moving poverty line: between late 1980s/early 1990s and late 1990s/early 2000s
-3.1
-2.4
-1.8
-0.4
-0.3
-0.2
0.5
0.6
1.2
1.7
1.7
1.9
2.0
2.3
2.4
2.6
2.7
2.7
3.0
3.2
3.9
4.1
4.2
4.3
-4 -3 -2 -1 0 1 2 3 4 5 6
United Kingdom
United States
Norway
Canada
Greece+
France*
Finland
Denmark
Sweden
Australia*
Netherlands
Hungary
New Zealand+
Japan
Ireland+
Italy
Germany*
Spain+
Mexico
Portugal+
Belgium
Luxembourg
Czech Republic+
Poland
Percentage point change in child poverty rate (between about 1990 and 2000)
Source: For those countries labeled with + Mira d’Ercole and Förster (2005). For those labeled with a * the sources are special tabulations as provided by Bruce Bradbury for Australia, the INSEE for France, and from Corak, Fertig, and Tamm (2005) for Germany. For all others Luxembourg Income Study.
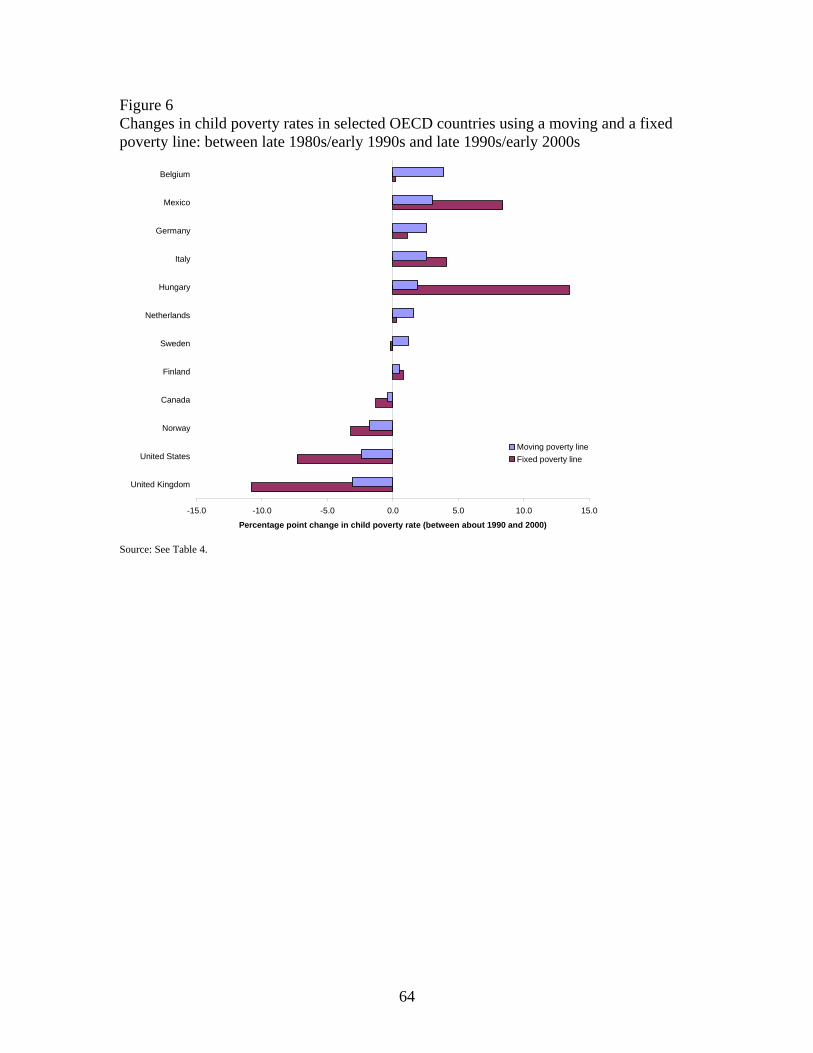
64
Figure 6 Changes in child poverty rates in selected OECD countries using a moving and a fixed poverty line: between late 1980s/early 1990s and late 1990s/early 2000s
-15.0 -10.0 -5.0 0.0 5.0 10.0 15.0
United Kingdom
United States
Norway
Canada
Finland
Sweden
Netherlands
Hungary
Italy
Germany
Mexico
Belgium
Percentage point change in child poverty rate (between about 1990 and 2000)
Moving poverty lineFixed poverty line
Source: See Table 4.
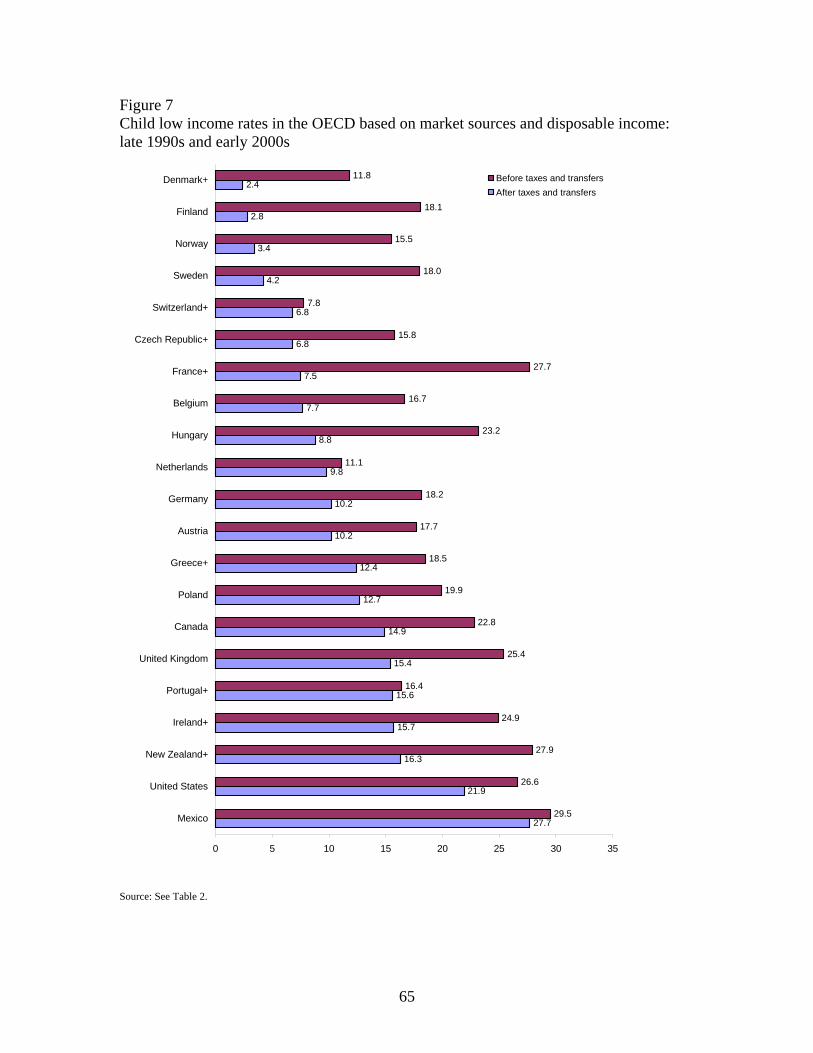
65
Figure 7 Child low income rates in the OECD based on market sources and disposable income: late 1990s and early 2000s
27.7
21.9
16.3
15.7
15.6
15.4
14.9
12.7
12.4
10.2
10.2
9.8
8.8
7.7
7.5
6.8
6.8
4.2
3.4
2.8
2.4
29.5
26.6
27.9
24.9
16.4
25.4
22.8
19.9
18.5
17.7
18.2
11.1
23.2
16.7
27.7
15.8
7.8
18.0
15.5
18.1
11.8
0 5 10 15 20 25 30 35
Mexico
United States
New Zealand+
Ireland+
Portugal+
United Kingdom
Canada
Poland
Greece+
Austria
Germany
Netherlands
Hungary
Belgium
France+
Czech Republic+
Switzerland+
Sweden
Norway
Finland
Denmark+ Before taxes and transfersAfter taxes and transfers
Source: See Table 2.
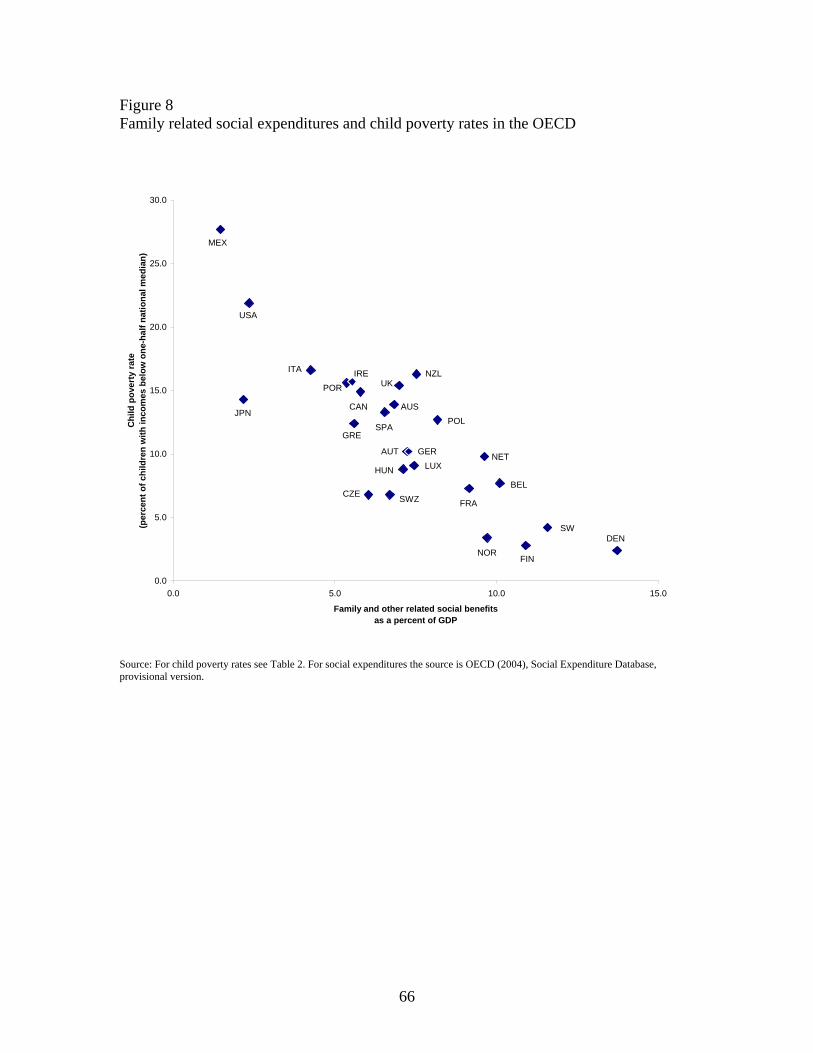
66
Figure 8 Family related social expenditures and child poverty rates in the OECD
0.0
5.0
10.0
15.0
20.0
25.0
30.0
0.0 5.0 10.0 15.0
Family and other related social benefitsas a percent of GDP
Chi
ld p
over
ty ra
te(p
erce
nt o
f chi
ldre
n w
ith in
com
es b
elow
one
-hal
f nat
iona
l med
ian)
FRA
NORFIN
SWDEN
BEL
NET
SWZCZE
HUN LUXGERAUT
POLGRE
SPA
AUS
UKNZL
CAN
IREPOR
ITA
JPN
USA
MEX
Source: For child poverty rates see Table 2. For social expenditures the source is OECD (2004), Social Expenditure Database, provisional version.