Embed Size (px)
Citation preview
Principle and Application of Ball SAW Devices
KAZUSHI YAMANAKA,1,2 NORITAKA NAKASO,3 TAKESHI FUKIURA,4 and DONG YOUN SIM5
1Tohoku University, Japan2JST, CREST, Japan
3Toppan Printing, Japan4Yamatake Corporation, Japan
5Ball Semiconductor Inc., Japan
SUMMARY
A thin beam of waves usually diverges due to diffrac-tion, which is a limitation of any device using such waves.However, a surface acoustic wave (SAW) on a sphere withan appropriate aperture does not diverge but is collimated,realizing ultra-multiple roundtrips along an equator of thesphere. This effect is caused by the balance between diffrac-tion and focusing on a spherical surface, and it enablesrealization of high-performance ball SAW sensors. © 2009Wiley Periodicals, Inc. Electr Eng Jpn, 168(1): 41–51,2009; Published online in Wiley InterScience (www.interscience.wiley.com). DOI 10.1002/eej.20817
Key words: surface acoustic wave; naturally colli-mated beam; sphere; multiple roundtrips.
1. Introduction
In this paper the authors introduce ball SAW devicesand their applications for sensors.
Sensors that use chemical reactions, field effect tran-sistors (FETs), and other electrical sensors have been de-veloped and are used in a wide range of fields. In hydrogengas sensors given particular attention as applications in fuelcells have developed, the catalytic combustion sensor thatcatalyzes the oxidation reaction in hydrogen was used fromthe start. An FET-type sensor is also available that measures
the changes in current based on the work function changedue to accumulation of hydrogen atoms in Pd or other alloygate electrode [1].
However, based on given chemical or physical phe-nomena, these sensors can only operate in a particularconcentration range determined by particular phenomena.For instance, a catalytic combustion-type hydrogen gassensor should not be employed at hydrogen concentrationsabove the lowest explosion limit (LEL), because the hydro-gen is burned and perhaps exploded due to the sensor itself.Moreover, FET-type sensors become saturated at concen-trations above 1 to 10% that include LEL. However, inhydrogen stations and fuel cell automobiles, not only smallleaks but also intense jets or bursts may occur due to thehigh pressure of hydrogen. As a result, different emergencymeasures must be taken depending on whether below orabove the LEL. Thus, very wide range hydrogen sensorshave been desired, but unfortunately not realized yet.
In contrast, elastic waves are dependent on elasticmodulus, viscosity, conductivity, and other physical prop-erties, and as a result, an elastic wave sensor operates basedon several mechanisms, and hence it covers a wide range ofconcentrations. A quartz crystal microbalance (QCM) anda surface acoustic wave (SAW) sensor [2, 3] have alreadybeen developed using elastic waves. The changes in oscil-lation frequency due to the mass loading are used to meas-ure gas concentration or film thickness, and may also beused as biosensors. However, performance is limited byreflection and diffraction losses. As a result, their potentialperformance has not been fully achieved.
In this situation, the authors’ group discovered duringresearch on defect inspection on ball bearings using SAWa phenomenon in which a SAW on a sphere naturally formsa collimate beam and can make over 100 roundtrips withoutloss due to reflection or diffraction [4–8]. Taking advantage
© 2009 Wiley Periodicals, Inc.
Electrical Engineering in Japan, Vol. 168, No. 1, 2009Translated from Denki Gakkai Ronbunshi, Vol. 127-C, No. 8, August 2007, pp. 1177–1185
Contract grant sponsors: New Energy Development Organization(NEDO) H10-12 New Industry Creative Proposal Public Undertaking,and “Effective Promotion of Industrial Joint Research” in the Project forthe Financial Support for Technology Innovation H16,17 in the Ministryof Education, Culture, Sports, Science, and Technology; H18–23 CoreResearch for Evolutional Science and Technology (CREST) at the JapanScience and Technology Agency.
41
of this phenomenon the authors developed a ball SAWsensor [8–11] forming an electrode on a single crystal ball.Because high-precision measurements are possible basedon the SAW velocity and attenuation, a hydrogen gas sensorwith the widest sensing range of 10 ppm–100% concentra-tion was created. In this paper, the authors review thefundamentals of SAW propagation on a sphere, a diffrac-tion-free collimate beam, as well as gas sensors, and futureapplications in various fields.
2. Surface Acoustic Waves on a Sphere
2.1 Research into surface acoustic waves on asphere
A spherical body may be found in various objects,including the Earth, gas tanks, or ball bearings. An elasticwave excited and propagated here has common charac-teristics based on the geometrical properties of a sphere.Bulk elastic waves in a sphere were first calculated by Lamb[12], and the solution for the radial and azimuthal displace-ment components was provided by Sezawa using Besseland spherical harmonic functions [13]. Sato and Usamiinvestigated detailed mathematical solutions from thestandpoint of geophysics, and demonstrated that aRayleigh-mode SAW is obtained as a higher-order limit[14].
If a SAW on a spherical body propagates in onedirection, then all of its energy returns from the oppositedirection to the starting point. Because of this, after oneroundtrip, there is no attenuation at all due to the wavediverging caused by diffraction. Attenuation is a result ofdispersion and ultrasonic absorption alone. If the frequencyis reduced, then the attenuation due to ultrasonic absorptionor dispersion decreases, and the propagation loss becomesextremely low. Moreover, the surface of the sphere is con-tinuous and unbounded. As a result, there is no reflectionloss [15]. These characteristics are attractive for long-dis-tance propagation of SAW. Royer and colleagues [16]experimentally observed SAW on a sphere using a pulselaser converged into a point source. However, there are noexamples of measurements of SAW using a linear sourceon a sphere.
2.2 Elastic waves in a sphere
In the solution to the wave equation
Let us assume that the stress distribution as a boundarycondition is given by
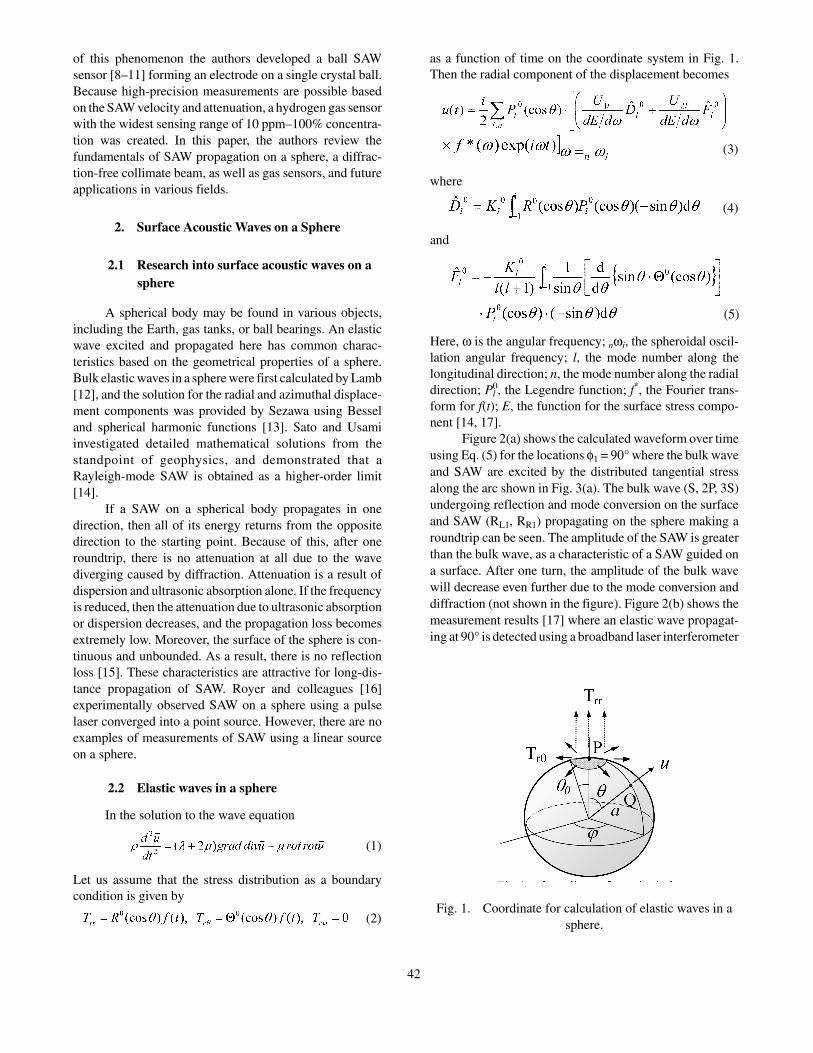
as a function of time on the coordinate system in Fig. 1.Then the radial component of the displacement becomes
where
and
Here, ω is the angular frequency; nωi, the spheroidal oscil-lation angular frequency; l, the mode number along thelongitudinal direction; n, the mode number along the radialdirection; Pl
0, the Legendre function; f*, the Fourier trans-form for f(t); E, the function for the surface stress compo-nent [14, 17].
Figure 2(a) shows the calculated waveform over timeusing Eq. (5) for the locations φ1 = 90° where the bulk waveand SAW are excited by the distributed tangential stressalong the arc shown in Fig. 3(a). The bulk wave (S, 2P, 3S)undergoing reflection and mode conversion on the surfaceand SAW (RL1, RR1) propagating on the sphere making aroundtrip can be seen. The amplitude of the SAW is greaterthan the bulk wave, as a characteristic of a SAW guided ona surface. After one turn, the amplitude of the bulk wavewill decrease even further due to the mode conversion anddiffraction (not shown in the figure). Figure 2(b) shows themeasurement results [17] where an elastic wave propagat-ing at 90° is detected using a broadband laser interferometer
(4)
(2)
(1)
(5)
(3)
Fig. 1. Coordinate for calculation of elastic waves in asphere.
42
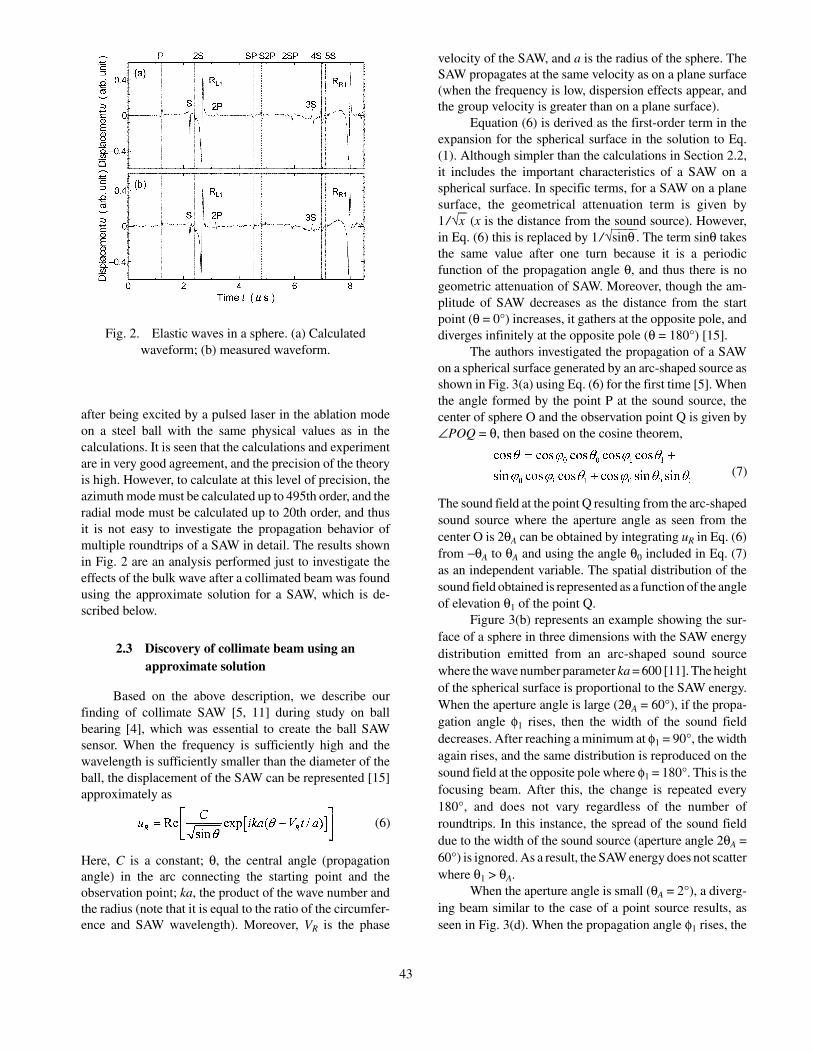
after being excited by a pulsed laser in the ablation modeon a steel ball with the same physical values as in thecalculations. It is seen that the calculations and experimentare in very good agreement, and the precision of the theoryis high. However, to calculate at this level of precision, theazimuth mode must be calculated up to 495th order, and theradial mode must be calculated up to 20th order, and thusit is not easy to investigate the propagation behavior ofmultiple roundtrips of a SAW in detail. The results shownin Fig. 2 are an analysis performed just to investigate theeffects of the bulk wave after a collimated beam was foundusing the approximate solution for a SAW, which is de-scribed below.
2.3 Discovery of collimate beam using anapproximate solution
Based on the above description, we describe ourfinding of collimate SAW [5, 11] during study on ballbearing [4], which was essential to create the ball SAWsensor. When the frequency is sufficiently high and thewavelength is sufficiently smaller than the diameter of theball, the displacement of the SAW can be represented [15]approximately as
Here, C is a constant; θ, the central angle (propagationangle) in the arc connecting the starting point and theobservation point; ka, the product of the wave number andthe radius (note that it is equal to the ratio of the circumfer-ence and SAW wavelength). Moreover, VR is the phase
velocity of the SAW, and a is the radius of the sphere. TheSAW propagates at the same velocity as on a plane surface(when the frequency is low, dispersion effects appear, andthe group velocity is greater than on a plane surface).
Equation (6) is derived as the first-order term in theexpansion for the spherical surface in the solution to Eq.(1). Although simpler than the calculations in Section 2.2,it includes the important characteristics of a SAW on aspherical surface. In specific terms, for a SAW on a planesurface, the geometrical attenuation term is given by1 / √x (x is the distance from the sound source). However,in Eq. (6) this is replaced by 1 / √sinθ . The term sinθ takesthe same value after one turn because it is a periodicfunction of the propagation angle θ, and thus there is nogeometric attenuation of SAW. Moreover, though the am-plitude of SAW decreases as the distance from the startpoint (θ = 0°) increases, it gathers at the opposite pole, anddiverges infinitely at the opposite pole (θ = 180°) [15].
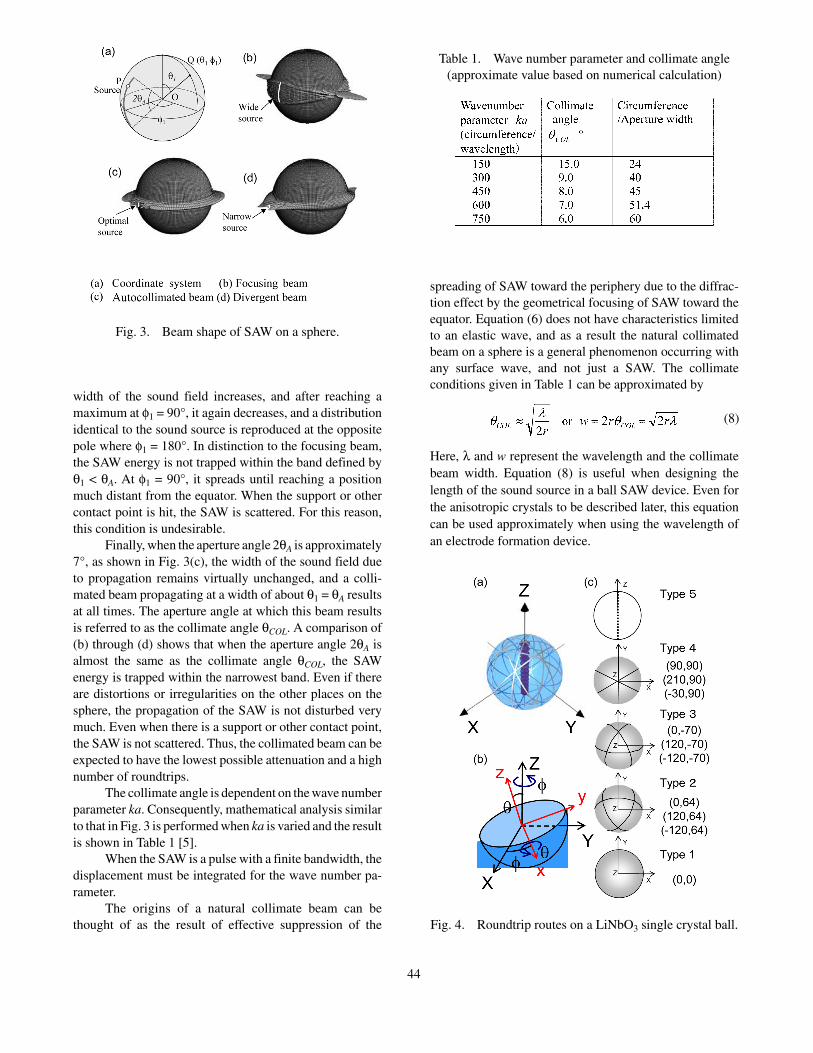
The authors investigated the propagation of a SAWon a spherical surface generated by an arc-shaped source asshown in Fig. 3(a) using Eq. (6) for the first time [5]. Whenthe angle formed by the point P at the sound source, thecenter of sphere O and the observation point Q is given by∠POQ = θ, then based on the cosine theorem,
The sound field at the point Q resulting from the arc-shapedsound source where the aperture angle as seen from thecenter O is 2θA can be obtained by integrating uR in Eq. (6)from −θA to θA and using the angle θ0 included in Eq. (7)as an independent variable. The spatial distribution of thesound field obtained is represented as a function of the angleof elevation θ1 of the point Q.
Figure 3(b) represents an example showing the sur-face of a sphere in three dimensions with the SAW energydistribution emitted from an arc-shaped sound sourcewhere the wave number parameter ka = 600 [11]. The heightof the spherical surface is proportional to the SAW energy.When the aperture angle is large (2θA = 60°), if the propa-gation angle φ1 rises, then the width of the sound fielddecreases. After reaching a minimum at φ1 = 90°, the widthagain rises, and the same distribution is reproduced on thesound field at the opposite pole where φ1 = 180°. This is thefocusing beam. After this, the change is repeated every180°, and does not vary regardless of the number ofroundtrips. In this instance, the spread of the sound fielddue to the width of the sound source (aperture angle 2θA =60°) is ignored. As a result, the SAW energy does not scatterwhere θ1 > θA.
When the aperture angle is small (θA = 2°), a diverg-ing beam similar to the case of a point source results, asseen in Fig. 3(d). When the propagation angle φ1 rises, the
Fig. 2. Elastic waves in a sphere. (a) Calculatedwaveform; (b) measured waveform.
(7)
(6)
43
width of the sound field increases, and after reaching amaximum at φ1 = 90°, it again decreases, and a distributionidentical to the sound source is reproduced at the oppositepole where φ1 = 180°. In distinction to the focusing beam,the SAW energy is not trapped within the band defined byθ1 < θA. At φ1 = 90°, it spreads until reaching a positionmuch distant from the equator. When the support or othercontact point is hit, the SAW is scattered. For this reason,this condition is undesirable.
Finally, when the aperture angle 2θA is approximately7°, as shown in Fig. 3(c), the width of the sound field dueto propagation remains virtually unchanged, and a colli-mated beam propagating at a width of about θ1 = θA resultsat all times. The aperture angle at which this beam resultsis referred to as the collimate angle θCOL. A comparison of(b) through (d) shows that when the aperture angle 2θA isalmost the same as the collimate angle θCOL, the SAWenergy is trapped within the narrowest band. Even if thereare distortions or irregularities on the other places on thesphere, the propagation of the SAW is not disturbed verymuch. Even when there is a support or other contact point,the SAW is not scattered. Thus, the collimated beam can beexpected to have the lowest possible attenuation and a highnumber of roundtrips.
The collimate angle is dependent on the wave numberparameter ka. Consequently, mathematical analysis similarto that in Fig. 3 is performed when ka is varied and the resultis shown in Table 1 [5].
When the SAW is a pulse with a finite bandwidth, thedisplacement must be integrated for the wave number pa-rameter.
The origins of a natural collimate beam can bethought of as the result of effective suppression of the
spreading of SAW toward the periphery due to the diffrac-tion effect by the geometrical focusing of SAW toward theequator. Equation (6) does not have characteristics limitedto an elastic wave, and as a result the natural collimatedbeam on a sphere is a general phenomenon occurring withany surface wave, and not just a SAW. The collimateconditions given in Table 1 can be approximated by
Here, λ and w represent the wavelength and the collimatebeam width. Equation (8) is useful when designing thelength of the sound source in a ball SAW device. Even forthe anisotropic crystals to be described later, this equationcan be used approximately when using the wavelength ofan electrode formation device.
Table 1. Wave number parameter and collimate angle(approximate value based on numerical calculation)
Fig. 3. Beam shape of SAW on a sphere.
Fig. 4. Roundtrip routes on a LiNbO3 single crystal ball.
(8)
44
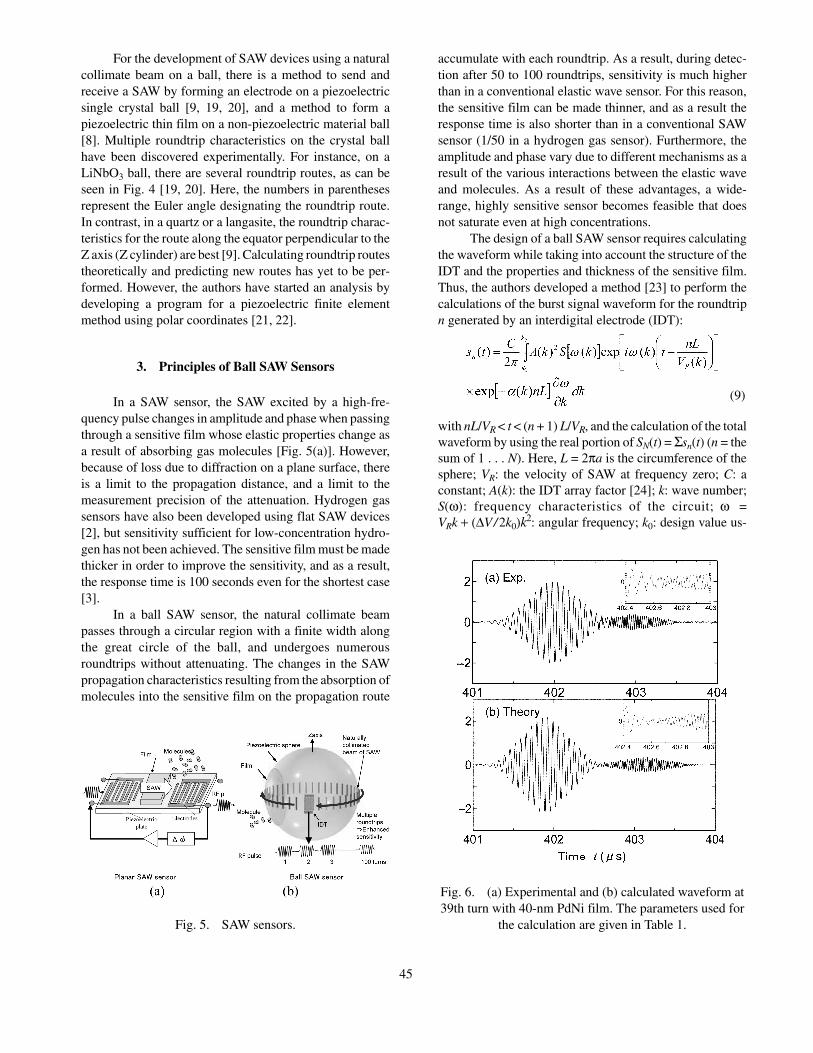
For the development of SAW devices using a naturalcollimate beam on a ball, there is a method to send andreceive a SAW by forming an electrode on a piezoelectricsingle crystal ball [9, 19, 20], and a method to form apiezoelectric thin film on a non-piezoelectric material ball[8]. Multiple roundtrip characteristics on the crystal ballhave been discovered experimentally. For instance, on aLiNbO3 ball, there are several roundtrip routes, as can beseen in Fig. 4 [19, 20]. Here, the numbers in parenthesesrepresent the Euler angle designating the roundtrip route.In contrast, in a quartz or a langasite, the roundtrip charac-teristics for the route along the equator perpendicular to theZ axis (Z cylinder) are best [9]. Calculating roundtrip routestheoretically and predicting new routes has yet to be per-formed. However, the authors have started an analysis bydeveloping a program for a piezoelectric finite elementmethod using polar coordinates [21, 22].
3. Principles of Ball SAW Sensors
In a SAW sensor, the SAW excited by a high-fre-quency pulse changes in amplitude and phase when passingthrough a sensitive film whose elastic properties change asa result of absorbing gas molecules [Fig. 5(a)]. However,because of loss due to diffraction on a plane surface, thereis a limit to the propagation distance, and a limit to themeasurement precision of the attenuation. Hydrogen gassensors have also been developed using flat SAW devices[2], but sensitivity sufficient for low-concentration hydro-gen has not been achieved. The sensitive film must be madethicker in order to improve the sensitivity, and as a result,the response time is 100 seconds even for the shortest case[3].
In a ball SAW sensor, the natural collimate beampasses through a circular region with a finite width alongthe great circle of the ball, and undergoes numerousroundtrips without attenuating. The changes in the SAWpropagation characteristics resulting from the absorption ofmolecules into the sensitive film on the propagation route
accumulate with each roundtrip. As a result, during detec-tion after 50 to 100 roundtrips, sensitivity is much higherthan in a conventional elastic wave sensor. For this reason,the sensitive film can be made thinner, and as a result theresponse time is also shorter than in a conventional SAWsensor (1/50 in a hydrogen gas sensor). Furthermore, theamplitude and phase vary due to different mechanisms as aresult of the various interactions between the elastic waveand molecules. As a result of these advantages, a wide-range, highly sensitive sensor becomes feasible that doesnot saturate even at high concentrations.
The design of a ball SAW sensor requires calculatingthe waveform while taking into account the structure of theIDT and the properties and thickness of the sensitive film.Thus, the authors developed a method [23] to perform thecalculations of the burst signal waveform for the roundtripn generated by an interdigital electrode (IDT):
with nL/VR < t < (n + 1) L/VR, and the calculation of the totalwaveform by using the real portion of SN(t) = Σsn(t) (n = thesum of 1 . . . N). Here, L = 2πa is the circumference of thesphere; VR: the velocity of SAW at frequency zero; C: aconstant; A(k): the IDT array factor [24]; k: wave number;S(ω): frequency characteristics of the circuit; ω =VRk + (∆V / 2k0)k2: angular frequency; k0: design value us-
Fig. 6. (a) Experimental and (b) calculated waveform at39th turn with 40-nm PdNi film. The parameters used for
the calculation are given in Table 1.Fig. 5. SAW sensors.
(9)
45
ing IDT; ∆V: magnitude of the velocity dispersion as a resultof the sensitive film; Vp(k) = ω / k: phase velocity; α =ω/(2QVR): attenuation constant.
Equation (9) has its origin in the possibility of SAWon a ball to omit the effects of diffraction and reflection byusing the fact that the wave front is preserved even afterroundtrips. The waveform obtained as a result of usingfrequency dispersion by creating a PdNi selective film onthe two-frequency ball SAW device [30] using a doubleelectrode IDT that can generate harmonics at three timesthe fundamental frequency and reduce the reflection losscan be measured very precisely, as shown in Fig. 6.
4. Ball SAW Hydrogen Gas Sensor
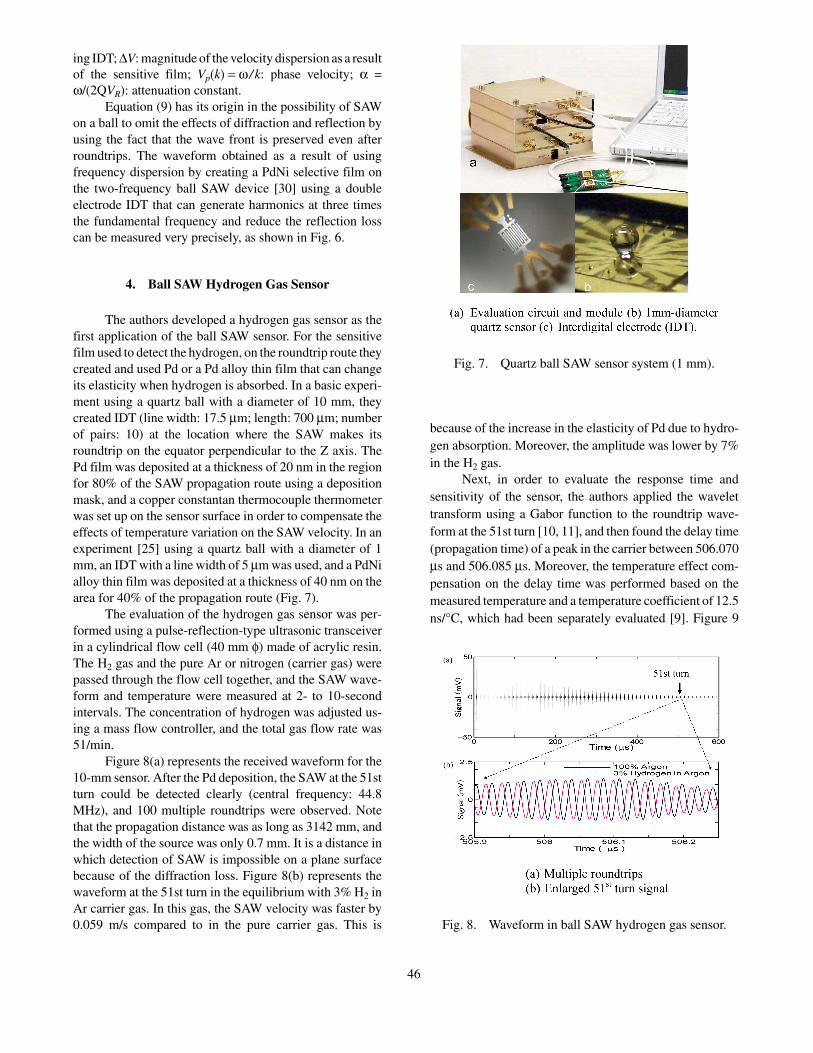
The authors developed a hydrogen gas sensor as thefirst application of the ball SAW sensor. For the sensitivefilm used to detect the hydrogen, on the roundtrip route theycreated and used Pd or a Pd alloy thin film that can changeits elasticity when hydrogen is absorbed. In a basic experi-ment using a quartz ball with a diameter of 10 mm, theycreated IDT (line width: 17.5 µm; length: 700 µm; numberof pairs: 10) at the location where the SAW makes itsroundtrip on the equator perpendicular to the Z axis. ThePd film was deposited at a thickness of 20 nm in the regionfor 80% of the SAW propagation route using a depositionmask, and a copper constantan thermocouple thermometerwas set up on the sensor surface in order to compensate theeffects of temperature variation on the SAW velocity. In anexperiment [25] using a quartz ball with a diameter of 1mm, an IDT with a line width of 5 µm was used, and a PdNialloy thin film was deposited at a thickness of 40 nm on thearea for 40% of the propagation route (Fig. 7).
The evaluation of the hydrogen gas sensor was per-formed using a pulse-reflection-type ultrasonic transceiverin a cylindrical flow cell (40 mm φ) made of acrylic resin.The H2 gas and the pure Ar or nitrogen (carrier gas) werepassed through the flow cell together, and the SAW wave-form and temperature were measured at 2- to 10-secondintervals. The concentration of hydrogen was adjusted us-ing a mass flow controller, and the total gas flow rate was51/min.
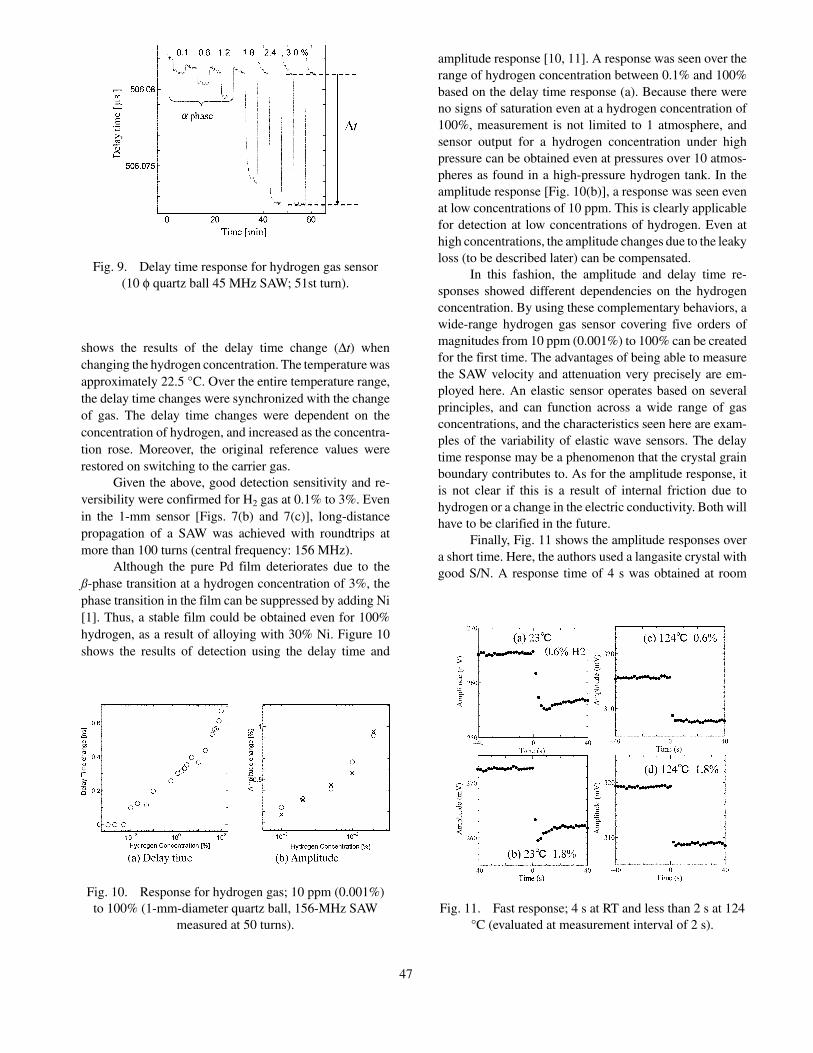
Figure 8(a) represents the received waveform for the10-mm sensor. After the Pd deposition, the SAW at the 51stturn could be detected clearly (central frequency: 44.8MHz), and 100 multiple roundtrips were observed. Notethat the propagation distance was as long as 3142 mm, andthe width of the source was only 0.7 mm. It is a distance inwhich detection of SAW is impossible on a plane surfacebecause of the diffraction loss. Figure 8(b) represents thewaveform at the 51st turn in the equilibrium with 3% H2 inAr carrier gas. In this gas, the SAW velocity was faster by0.059 m/s compared to in the pure carrier gas. This is
because of the increase in the elasticity of Pd due to hydro-gen absorption. Moreover, the amplitude was lower by 7%in the H2 gas.
Next, in order to evaluate the response time andsensitivity of the sensor, the authors applied the wavelettransform using a Gabor function to the roundtrip wave-form at the 51st turn [10, 11], and then found the delay time(propagation time) of a peak in the carrier between 506.070µs and 506.085 µs. Moreover, the temperature effect com-pensation on the delay time was performed based on themeasured temperature and a temperature coefficient of 12.5ns/°C, which had been separately evaluated [9]. Figure 9
Fig. 7. Quartz ball SAW sensor system (1 mm).
Fig. 8. Waveform in ball SAW hydrogen gas sensor.
46
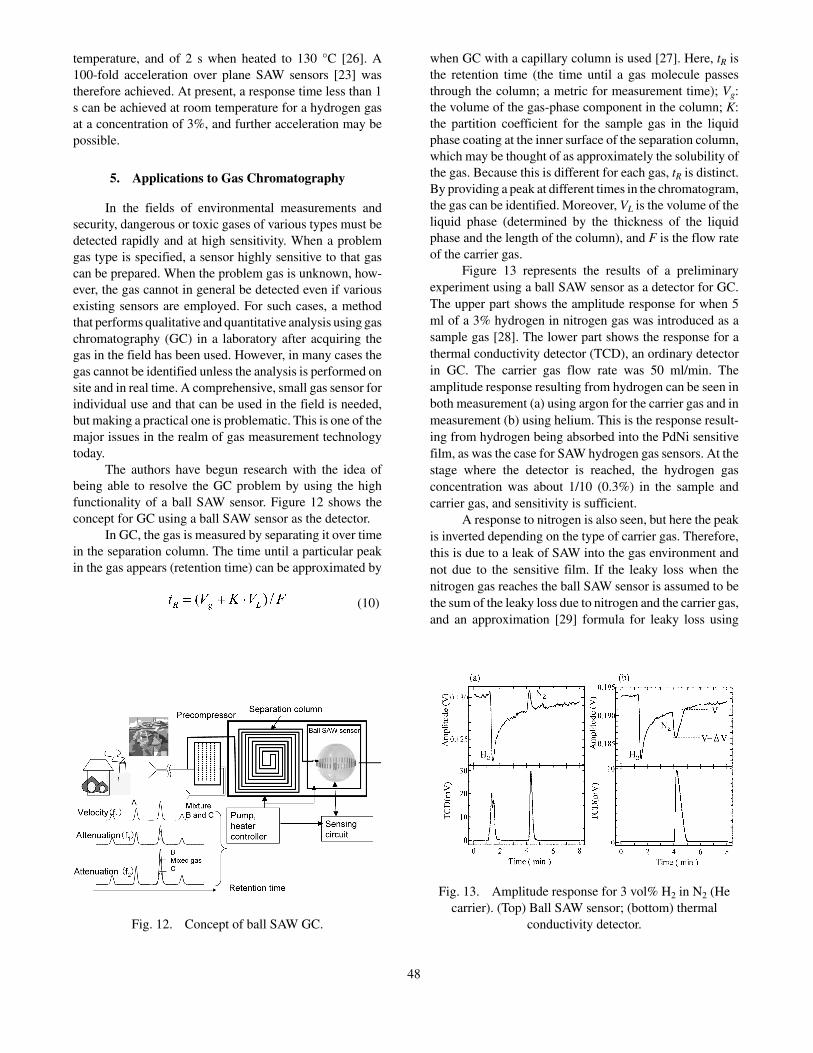
shows the results of the delay time change (∆t) whenchanging the hydrogen concentration. The temperature wasapproximately 22.5 °C. Over the entire temperature range,the delay time changes were synchronized with the changeof gas. The delay time changes were dependent on theconcentration of hydrogen, and increased as the concentra-tion rose. Moreover, the original reference values wererestored on switching to the carrier gas.
Given the above, good detection sensitivity and re-versibility were confirmed for H2 gas at 0.1% to 3%. Evenin the 1-mm sensor [Figs. 7(b) and 7(c)], long-distancepropagation of a SAW was achieved with roundtrips atmore than 100 turns (central frequency: 156 MHz).
Although the pure Pd film deteriorates due to theß-phase transition at a hydrogen concentration of 3%, thephase transition in the film can be suppressed by adding Ni[1]. Thus, a stable film could be obtained even for 100%hydrogen, as a result of alloying with 30% Ni. Figure 10shows the results of detection using the delay time and
amplitude response [10, 11]. A response was seen over therange of hydrogen concentration between 0.1% and 100%based on the delay time response (a). Because there wereno signs of saturation even at a hydrogen concentration of100%, measurement is not limited to 1 atmosphere, andsensor output for a hydrogen concentration under highpressure can be obtained even at pressures over 10 atmos-pheres as found in a high-pressure hydrogen tank. In theamplitude response [Fig. 10(b)], a response was seen evenat low concentrations of 10 ppm. This is clearly applicablefor detection at low concentrations of hydrogen. Even athigh concentrations, the amplitude changes due to the leakyloss (to be described later) can be compensated.
In this fashion, the amplitude and delay time re-sponses showed different dependencies on the hydrogenconcentration. By using these complementary behaviors, awide-range hydrogen gas sensor covering five orders ofmagnitudes from 10 ppm (0.001%) to 100% can be createdfor the first time. The advantages of being able to measurethe SAW velocity and attenuation very precisely are em-ployed here. An elastic sensor operates based on severalprinciples, and can function across a wide range of gasconcentrations, and the characteristics seen here are exam-ples of the variability of elastic wave sensors. The delaytime response may be a phenomenon that the crystal grainboundary contributes to. As for the amplitude response, itis not clear if this is a result of internal friction due tohydrogen or a change in the electric conductivity. Both willhave to be clarified in the future.
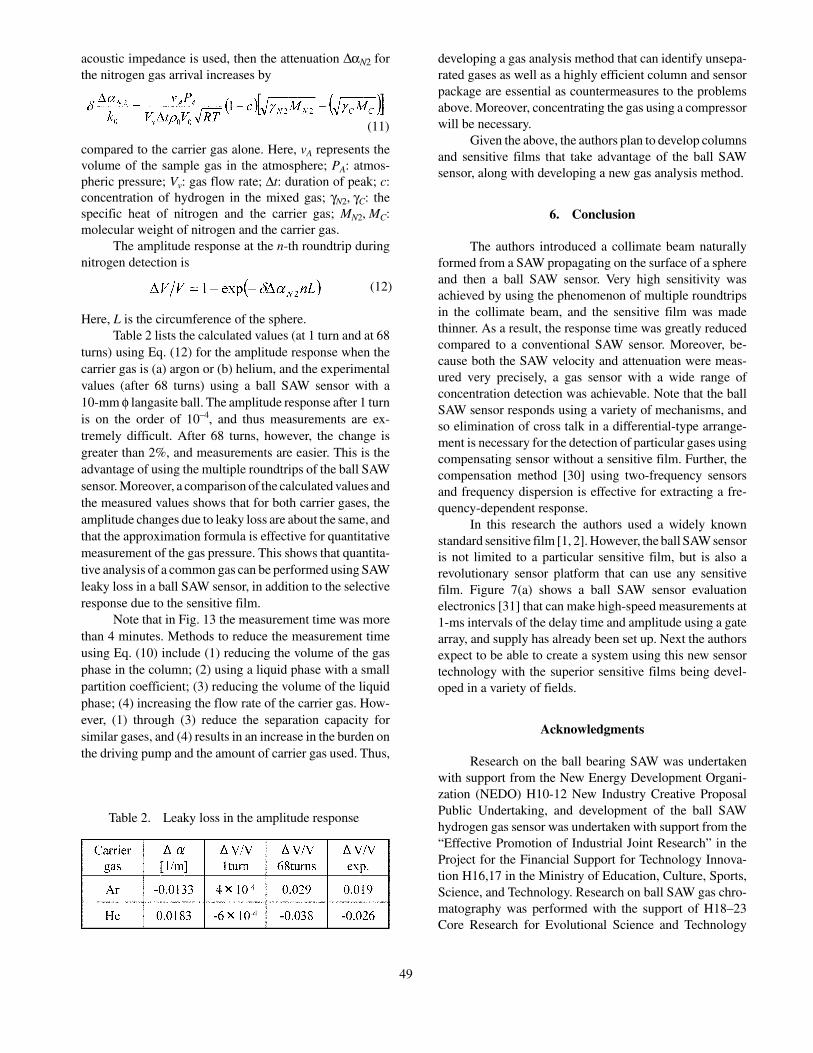
Finally, Fig. 11 shows the amplitude responses overa short time. Here, the authors used a langasite crystal withgood S/N. A response time of 4 s was obtained at room
Fig. 9. Delay time response for hydrogen gas sensor(10 φ quartz ball 45 MHz SAW; 51st turn).
Fig. 10. Response for hydrogen gas; 10 ppm (0.001%)to 100% (1-mm-diameter quartz ball, 156-MHz SAW
measured at 50 turns).Fig. 11. Fast response; 4 s at RT and less than 2 s at 124
°C (evaluated at measurement interval of 2 s).
47
temperature, and of 2 s when heated to 130 °C [26]. A100-fold acceleration over plane SAW sensors [23] wastherefore achieved. At present, a response time less than 1s can be achieved at room temperature for a hydrogen gasat a concentration of 3%, and further acceleration may bepossible.
5. Applications to Gas Chromatography
In the fields of environmental measurements andsecurity, dangerous or toxic gases of various types must bedetected rapidly and at high sensitivity. When a problemgas type is specified, a sensor highly sensitive to that gascan be prepared. When the problem gas is unknown, how-ever, the gas cannot in general be detected even if variousexisting sensors are employed. For such cases, a methodthat performs qualitative and quantitative analysis using gaschromatography (GC) in a laboratory after acquiring thegas in the field has been used. However, in many cases thegas cannot be identified unless the analysis is performed onsite and in real time. A comprehensive, small gas sensor forindividual use and that can be used in the field is needed,but making a practical one is problematic. This is one of themajor issues in the realm of gas measurement technologytoday.
The authors have begun research with the idea ofbeing able to resolve the GC problem by using the highfunctionality of a ball SAW sensor. Figure 12 shows theconcept for GC using a ball SAW sensor as the detector.
In GC, the gas is measured by separating it over timein the separation column. The time until a particular peakin the gas appears (retention time) can be approximated by
when GC with a capillary column is used [27]. Here, tR isthe retention time (the time until a gas molecule passesthrough the column; a metric for measurement time); Vg:the volume of the gas-phase component in the column; K:the partition coefficient for the sample gas in the liquidphase coating at the inner surface of the separation column,which may be thought of as approximately the solubility ofthe gas. Because this is different for each gas, tR is distinct.By providing a peak at different times in the chromatogram,the gas can be identified. Moreover, VL is the volume of theliquid phase (determined by the thickness of the liquidphase and the length of the column), and F is the flow rateof the carrier gas.
Figure 13 represents the results of a preliminaryexperiment using a ball SAW sensor as a detector for GC.The upper part shows the amplitude response for when 5ml of a 3% hydrogen in nitrogen gas was introduced as asample gas [28]. The lower part shows the response for athermal conductivity detector (TCD), an ordinary detectorin GC. The carrier gas flow rate was 50 ml/min. Theamplitude response resulting from hydrogen can be seen inboth measurement (a) using argon for the carrier gas and inmeasurement (b) using helium. This is the response result-ing from hydrogen being absorbed into the PdNi sensitivefilm, as was the case for SAW hydrogen gas sensors. At thestage where the detector is reached, the hydrogen gasconcentration was about 1/10 (0.3%) in the sample andcarrier gas, and sensitivity is sufficient.
A response to nitrogen is also seen, but here the peakis inverted depending on the type of carrier gas. Therefore,this is due to a leak of SAW into the gas environment andnot due to the sensitive film. If the leaky loss when thenitrogen gas reaches the ball SAW sensor is assumed to bethe sum of the leaky loss due to nitrogen and the carrier gas,and an approximation [29] formula for leaky loss using
Fig. 12. Concept of ball SAW GC.
Fig. 13. Amplitude response for 3 vol% H2 in N2 (Hecarrier). (Top) Ball SAW sensor; (bottom) thermal
conductivity detector.
(10)
48
acoustic impedance is used, then the attenuation ∆αN2 forthe nitrogen gas arrival increases by
compared to the carrier gas alone. Here, vA represents thevolume of the sample gas in the atmosphere; PA: atmos-pheric pressure; Vv: gas flow rate; ∆t: duration of peak; c:concentration of hydrogen in the mixed gas; γN2, γC: thespecific heat of nitrogen and the carrier gas; MN2, MC:molecular weight of nitrogen and the carrier gas.
The amplitude response at the n-th roundtrip duringnitrogen detection is
Here, L is the circumference of the sphere.Table 2 lists the calculated values (at 1 turn and at 68
turns) using Eq. (12) for the amplitude response when thecarrier gas is (a) argon or (b) helium, and the experimentalvalues (after 68 turns) using a ball SAW sensor with a10-mm φ langasite ball. The amplitude response after 1 turnis on the order of 10–4, and thus measurements are ex-tremely difficult. After 68 turns, however, the change isgreater than 2%, and measurements are easier. This is theadvantage of using the multiple roundtrips of the ball SAWsensor. Moreover, a comparison of the calculated values andthe measured values shows that for both carrier gases, theamplitude changes due to leaky loss are about the same, andthat the approximation formula is effective for quantitativemeasurement of the gas pressure. This shows that quantita-tive analysis of a common gas can be performed using SAWleaky loss in a ball SAW sensor, in addition to the selectiveresponse due to the sensitive film.
Note that in Fig. 13 the measurement time was morethan 4 minutes. Methods to reduce the measurement timeusing Eq. (10) include (1) reducing the volume of the gasphase in the column; (2) using a liquid phase with a smallpartition coefficient; (3) reducing the volume of the liquidphase; (4) increasing the flow rate of the carrier gas. How-ever, (1) through (3) reduce the separation capacity forsimilar gases, and (4) results in an increase in the burden onthe driving pump and the amount of carrier gas used. Thus,
developing a gas analysis method that can identify unsepa-rated gases as well as a highly efficient column and sensorpackage are essential as countermeasures to the problemsabove. Moreover, concentrating the gas using a compressorwill be necessary.
Given the above, the authors plan to develop columnsand sensitive films that take advantage of the ball SAWsensor, along with developing a new gas analysis method.
6. Conclusion
The authors introduced a collimate beam naturallyformed from a SAW propagating on the surface of a sphereand then a ball SAW sensor. Very high sensitivity wasachieved by using the phenomenon of multiple roundtripsin the collimate beam, and the sensitive film was madethinner. As a result, the response time was greatly reducedcompared to a conventional SAW sensor. Moreover, be-cause both the SAW velocity and attenuation were meas-ured very precisely, a gas sensor with a wide range ofconcentration detection was achievable. Note that the ballSAW sensor responds using a variety of mechanisms, andso elimination of cross talk in a differential-type arrange-ment is necessary for the detection of particular gases usingcompensating sensor without a sensitive film. Further, thecompensation method [30] using two-frequency sensorsand frequency dispersion is effective for extracting a fre-quency-dependent response.
In this research the authors used a widely knownstandard sensitive film [1, 2]. However, the ball SAW sensoris not limited to a particular sensitive film, but is also arevolutionary sensor platform that can use any sensitivefilm. Figure 7(a) shows a ball SAW sensor evaluationelectronics [31] that can make high-speed measurements at1-ms intervals of the delay time and amplitude using a gatearray, and supply has already been set up. Next the authorsexpect to be able to create a system using this new sensortechnology with the superior sensitive films being devel-oped in a variety of fields.
Acknowledgments
Research on the ball bearing SAW was undertakenwith support from the New Energy Development Organi-zation (NEDO) H10-12 New Industry Creative ProposalPublic Undertaking, and development of the ball SAWhydrogen gas sensor was undertaken with support from the“Effective Promotion of Industrial Joint Research” in theProject for the Financial Support for Technology Innova-tion H16,17 in the Ministry of Education, Culture, Sports,Science, and Technology. Research on ball SAW gas chro-matography was performed with the support of H18–23Core Research for Evolutional Science and Technology
(11)
(12)
Table 2. Leaky loss in the amplitude response
49
(CREST) at the Japan Science and Technology Agency. Thecontent of this paper is the result of joint research with AkiraIshikawa, Akio Mizugami, Hiroshi Abe, Naoya Iwata, Hi-roshi Tsuji, and Hiroshi Mihara at Tohoku University, Hi-rosuke Tsukahara, Taro Daiki, Shingo Akao, and ChuNakamu at Boppan Printing, Hiro Takeda and Bryan Maxeyat Ball Semiconductor, and Hirohiko Kazado, HideichiTanaka, Tetsuya Miyakishi, Ichitaro Sato, and Hirosuke Ebiat Sanbu Corp. Moreover, Professor Kenya Hashimoto atChiba University offered valuable suggestions. The authorsexpress their gratitude to all of these individuals.
REFERENCES
1. Hughes RC, Schubert WK. J Appl Phys 1992;71:542.2. D’Amico A, Palma A, Verona E. 1982 IEEE Ultra-
sonics Symp, p 308.3. Jakubik WP, Urbancyzk MW, Kochowski S,
Bodzenta J. Sens Actuators B 2002;82:265.4. Yamanaka K, Cho H, Tsukahara Y. Appl Phys Lett
2000;76:2797.5. Yamanaka K, Cho H, Tsukahara Y. Technology Re-
search Report from the Institute of Electronics, Infor-mation, and Communication Engineers, US2000-14,p 49–56, 2000.
6. Ishikawa S, Tsukahara Y, Nakaso N, Cho H,Yamanaka K. Jpn J Appl Phys 2001;40:3263.
7. Tsukahara Y, Nakaso H, Cho H, Yamanaka K. ApplPhys Lett 2000;77:2926–2928.
8. Tsukahara Y, Nakaso H, Cho H, Yamanaka K. Tech-nology Research Report from the Institute of Elec-tronics, Information, and Communication Engineers,US2000-55, p 31, 2000.
9. Nakaso N, Tsukahara Y, Ishikawa S, Yamanaka K.Proc IEEE Ultrason Symp 47, 2002.
10. Yamanaka K, Ishikawa S, Nakaso N, Takeda N, Mi-hara T, Tsukahara Y. Proc 2003 IEEE Ultrason Symp,p 299, 2004.
11. Yamanaka K, Ishikawa S, Nakaso N, Takeda N, SimD, Mihara T, Mizukami A, Satoh I, Akao S, Ebi Y,Tsukahara T. IEEE Trans UFFC 2006;53:793–801.
12. Lamb H. Proc London Math Soc 1882;13:189.13. Sezawa K. Bull Earthq Res Inst 1924;2:13.14. Sato Y, Usami T. Geophys Mag 1962;31:15.15. Viktrov IA. Rayleigh and Lamb waves. Plenum
Press; 1967. p 33.16. Royer D, Dieulesaint E, Jia X, Shui Y. Appl Phys Lett
1988;52:706.
17. Ishikawa S, Cho H, Tsukahara Y, Nakaso N,Yamanaka K. Ultrasonics 2003;41:1–8.
18. Ishikawa S, Nakaso N, Takeda N, Sim DY, Mihara T,Tsukahara Y, Yamanaka K. Appl Phys Lett2003;83:4649–4651.
19. Akao S, Nakaso N, Ohgi T, Yamanaka K. Jpn J ApplPhys 2004;43:3067–3070.
20. Akao S, Nakaso N, Ohgi T, Yamanaka K. Proc 2004IEEE International UFFC Joint 50th AnniversaryConference, p 1557.
21. Kohai T, Ohte K, Tsuji H, Mihara T, Ohgi T, NakasoN, Sato I, Fukiura T, Tanaka H, Yamanaka K. Tech-nology Research Report from the Institute of Elec-tronics, Information, and Communication Engineers,US2006-38, 2006.
22. Akao S, Kohai T, Ohte K, Iwata N, Tsuji H, MiharaT, Nakaso N, Yamanaka K. Technology ResearchReport from the Institute of Electronics, Information,and Communication Engineers, US2006-76, 2006.
23. Yamanaka K, Singh KJ, Iwata N, Abe T, Akao S,Tsukahara Y, Nakaso N. Appl Phys Lett 2007;90:214105.
24. Morgan D. Surface-wave for signal processing. El-sevier; 1991. p 59.
25. Sim DY, Mizukami A, Akao S, Sato I, Maxey B,Takeda N, Ohgi T, Nakaso N, Miyagishi T, Tanaka H,Fukiura K, Kazato H, Watanabe H, Mihara T,Yamanaka K. Proc 2004 IEEE International Ultra-sonics, Ferroelectrics, and Frequency Control Joint50th Anniversary Conference, p 918.
26. Yamanaka K, Abe T, Iwata N, Tsuji T, Mihara T,Singh KJ, Akao S, Nakaso N, Ohgi T, Sim DY, Ebi Y,Fukiura T, Tanaka H. Proc Symp Ultrason Electron2005;26:245.
27. Japan Society for Analytical Chemistry. Capillary gaschromatography. Asakura Publishing. p 7.
28. Iwata N, Abe S, Tsuji H, Mihara T, Akao S, YamanakaK. Response analysis in different types of gases in aball SAW sensor using gas chromatography. ProcSymp Ultrason Electron 2006;27:367–368.
29. Slobodnik AJ Jr. J Appl Phys 1972;43:2565.30. Nakatsukasa T, Akao S, Ohgi T, Nakaso N, Yamanaka
K. Jpn J Appl Phys 2006;45:4500.31. Abe T, Iwata N, Tsuji T, Mihara T, Akao S, Noguchi
K, Nakaso N, Sim DY, Ebi Y, Fukiura T, Tanaka H,Yamanaka K. Proc Symp Ultrason Electron 2006;27:101.
50
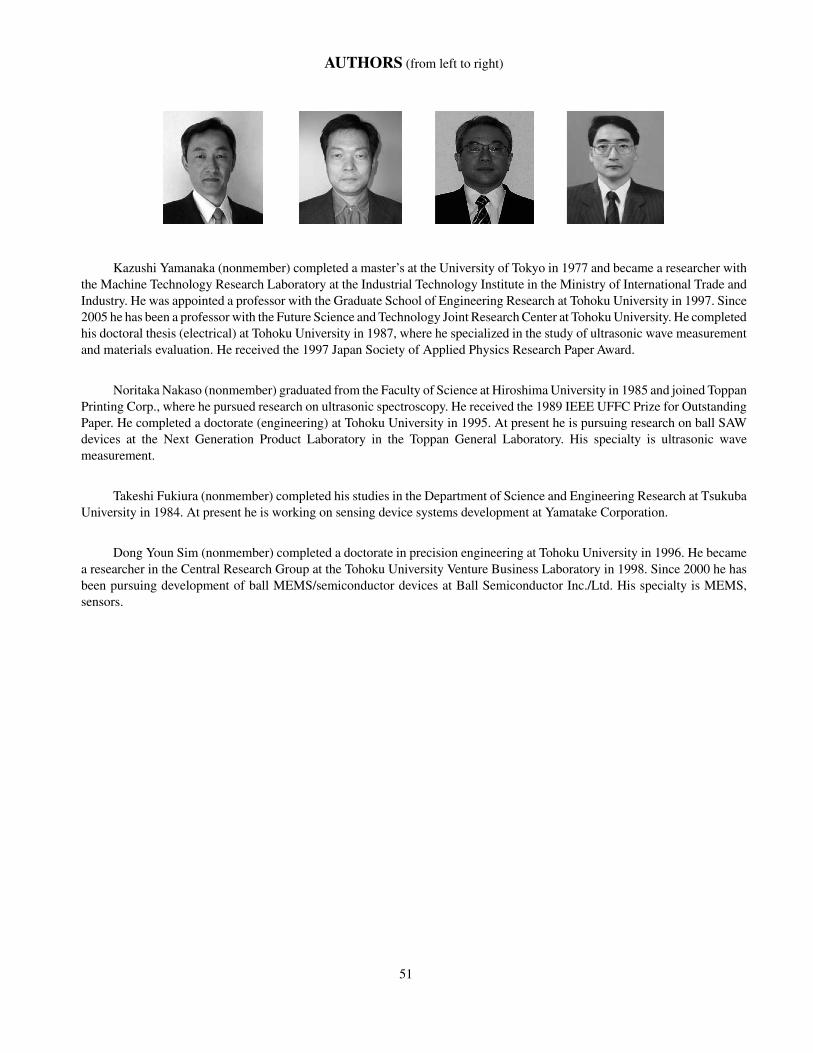
AUTHORS (from left to right)
Kazushi Yamanaka (nonmember) completed a master’s at the University of Tokyo in 1977 and became a researcher withthe Machine Technology Research Laboratory at the Industrial Technology Institute in the Ministry of International Trade andIndustry. He was appointed a professor with the Graduate School of Engineering Research at Tohoku University in 1997. Since2005 he has been a professor with the Future Science and Technology Joint Research Center at Tohoku University. He completedhis doctoral thesis (electrical) at Tohoku University in 1987, where he specialized in the study of ultrasonic wave measurementand materials evaluation. He received the 1997 Japan Society of Applied Physics Research Paper Award.
Noritaka Nakaso (nonmember) graduated from the Faculty of Science at Hiroshima University in 1985 and joined ToppanPrinting Corp., where he pursued research on ultrasonic spectroscopy. He received the 1989 IEEE UFFC Prize for OutstandingPaper. He completed a doctorate (engineering) at Tohoku University in 1995. At present he is pursuing research on ball SAWdevices at the Next Generation Product Laboratory in the Toppan General Laboratory. His specialty is ultrasonic wavemeasurement.
Takeshi Fukiura (nonmember) completed his studies in the Department of Science and Engineering Research at TsukubaUniversity in 1984. At present he is working on sensing device systems development at Yamatake Corporation.
Dong Youn Sim (nonmember) completed a doctorate in precision engineering at Tohoku University in 1996. He becamea researcher in the Central Research Group at the Tohoku University Venture Business Laboratory in 1998. Since 2000 he hasbeen pursuing development of ball MEMS/semiconductor devices at Ball Semiconductor Inc./Ltd. His specialty is MEMS,sensors.
51