Embed Size (px)
Citation preview
Copyright © 2016 Splunk Inc.
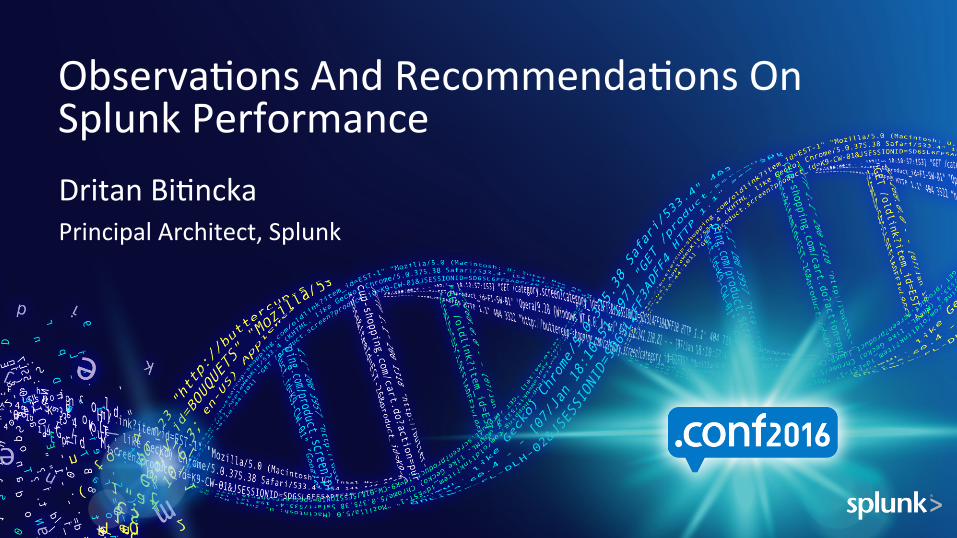
Dritan Bi;ncka Principal Architect, Splunk
Observa;ons And Recommenda;ons On Splunk Performance
Disclaimer
2
During the course of this presenta;on, we may make forward looking statements regarding future events or the expected performance of the company. We cau;on you that such statements reflect our current expecta;ons and es;mates based on factors currently known to us and that actual events or results could differ materially. For important factors that may cause actual results to differ from those contained in our forward-‐looking statements, please review our filings with the SEC. The forward-‐looking statements made in the this presenta;on are being made as of the ;me and date of its live presenta;on. If reviewed aRer its live presenta;on, this presenta;on may not contain current or
accurate informa;on. We do not assume any obliga;on to update any forward looking statements we may make. In addi;on, any informa;on about our roadmap outlines our general product direc;on and is
subject to change at any ;me without no;ce. It is for informa;onal purposes only and shall not, be incorporated into any contract or other commitment. Splunk undertakes no obliga;on either to develop the features or func;onality described or to include any such feature or func;onality in a future release.
About Me
Member of Splunk Tech Services >5 Years at Splunk Large scale and Cloud deployments 6th .conf
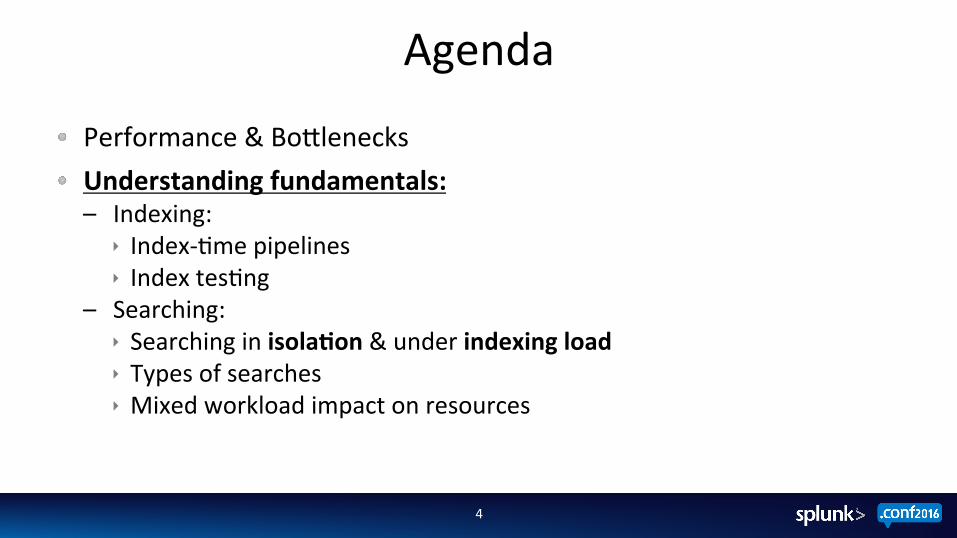
Agenda
Performance & BoZlenecks Understanding fundamentals: – Indexing:
ê Index-‐;me pipelines ê Index tes;ng
– Searching: ê Searching in isola2on & under indexing load ê Types of searches ê Mixed workload impact on resources
4
Tes;ng Disclaimers
• Tes;ng on arbitrary datasets in a “closed course” (lab) environment • Do not take out of context
5
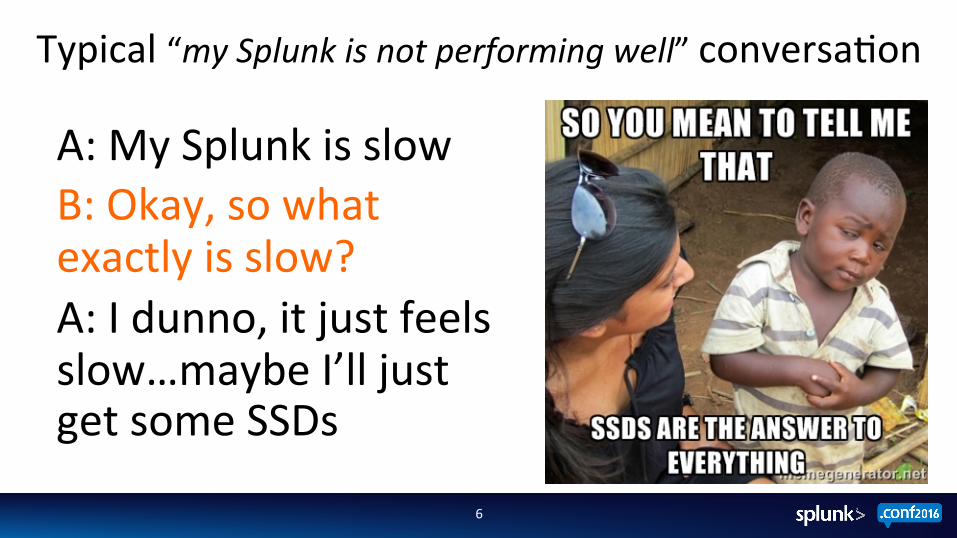
Typical “my Splunk is not performing well” conversa;on
A: My Splunk is slow B: Okay, so what exactly is slow? A: I dunno, it just feels slow…maybe I’ll just get some SSDs
6
7
Splunk, like all distributed compu;ng systems, has various boZlenecks that
manifest themselves differently depending on workloads being processed.
-‐ Winston Churchill
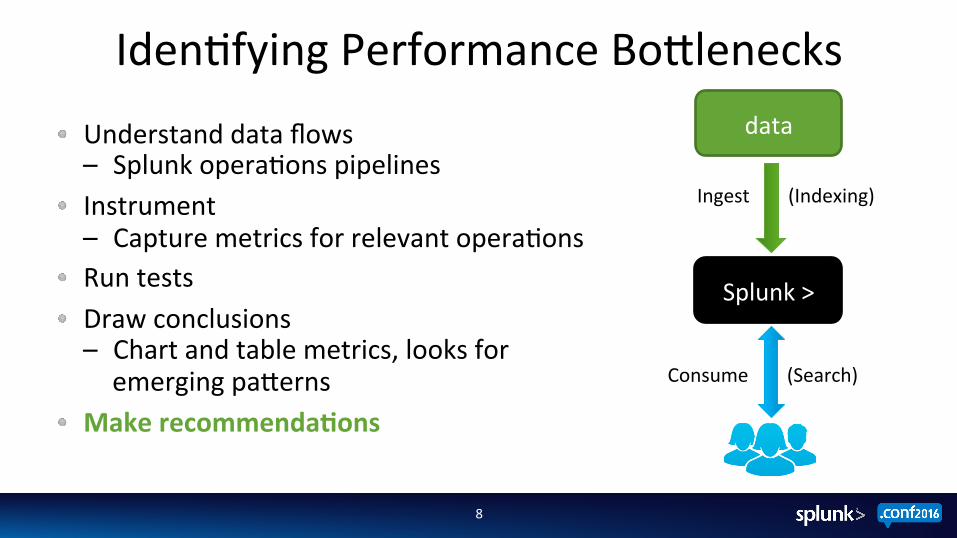
Iden;fying Performance BoZlenecks
Understand data flows – Splunk opera;ons pipelines
Instrument – Capture metrics for relevant opera;ons
Run tests Draw conclusions – Chart and table metrics, looks for emerging paZerns
Make recommenda2ons
8
Splunk >
data
Ingest (Indexing)
Consume (Search)
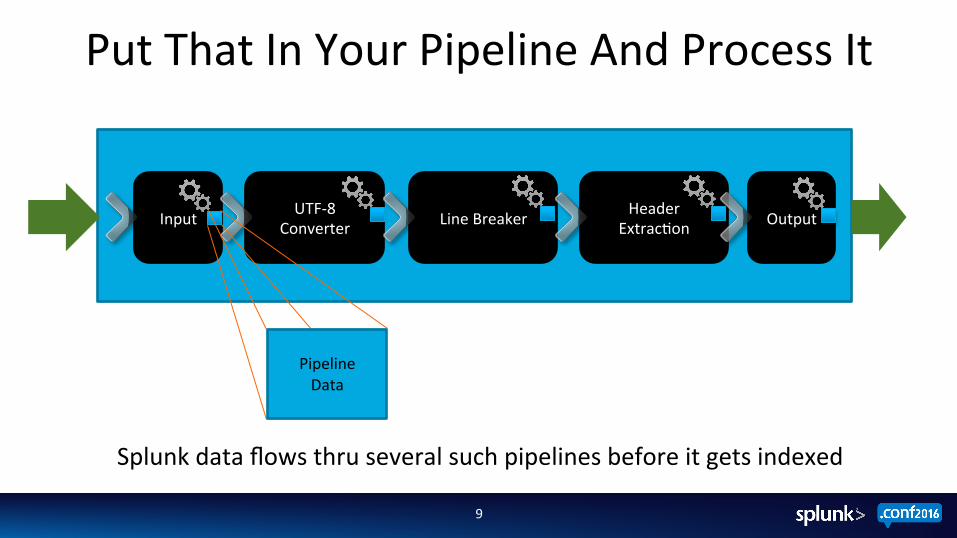
Put That In Your Pipeline And Process It
9
Input UTF-‐8 Converter Line Breaker Header
Extrac;on Output
Splunk data flows thru several such pipelines before it gets indexed
Pipeline Data
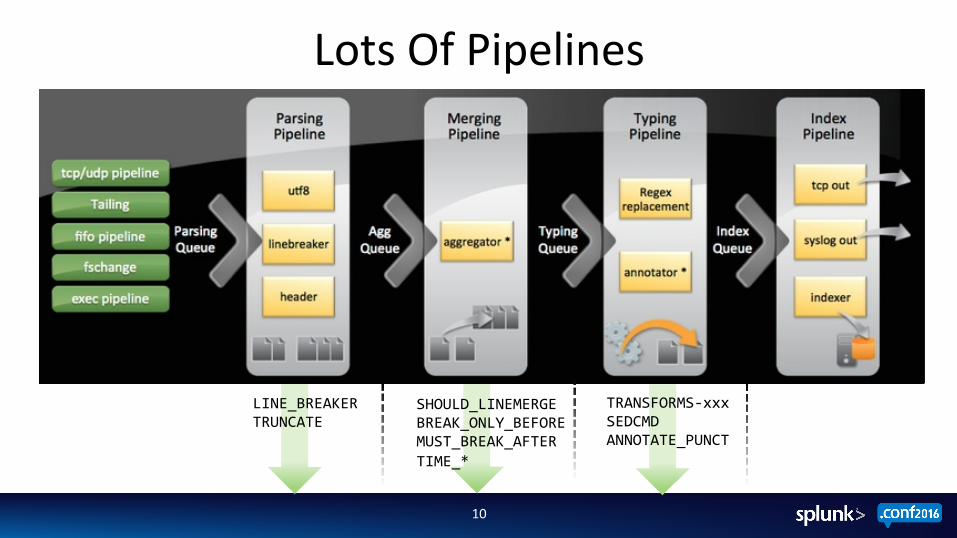
Lots Of Pipelines
10
TRANSFORMS-‐xxx SEDCMD ANNOTATE_PUNCT
LINE_BREAKER TRUNCATE
SHOULD_LINEMERGE BREAK_ONLY_BEFORE MUST_BREAK_AFTER TIME_*
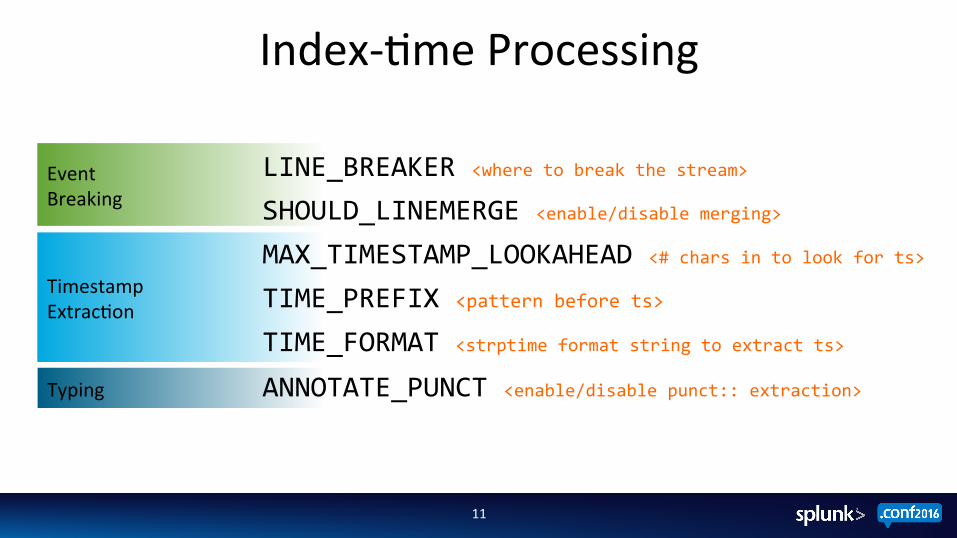
Index-‐;me Processing
11
Event Breaking
Timestamp Extrac;on
Typing
LINE_BREAKER <where to break the stream> SHOULD_LINEMERGE <enable/disable merging> MAX_TIMESTAMP_LOOKAHEAD <# chars in to look for ts> TIME_PREFIX <pattern before ts> TIME_FORMAT <strptime format string to extract ts> ANNOTATE_PUNCT <enable/disable punct:: extraction>
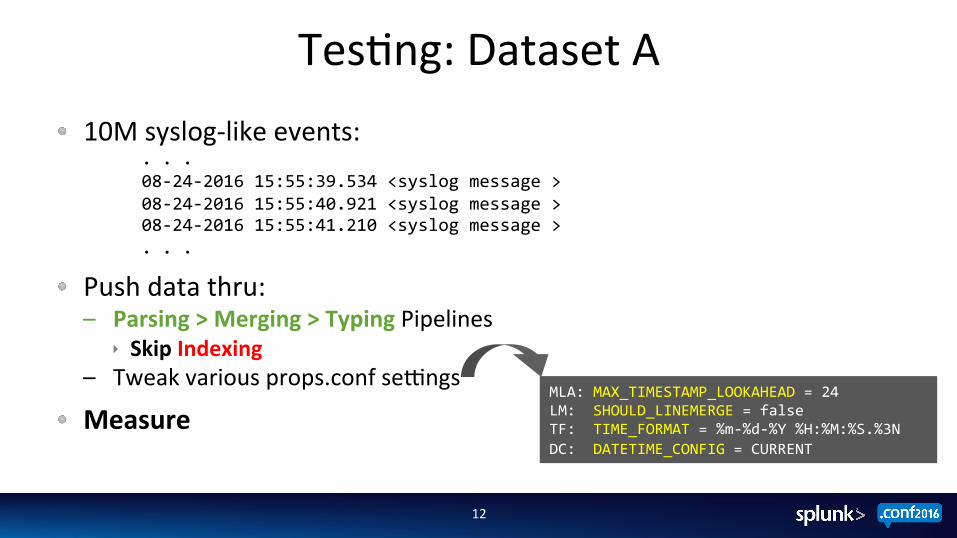
Tes;ng: Dataset A
12
10M syslog-‐like events: . . . 08-‐24-‐2016 15:55:39.534 <syslog message > 08-‐24-‐2016 15:55:40.921 <syslog message > 08-‐24-‐2016 15:55:41.210 <syslog message > . . .
Push data thru: – Parsing > Merging > Typing Pipelines
ê Skip Indexing – Tweak various props.conf sejngs
Measure MLA: MAX_TIMESTAMP_LOOKAHEAD = 24 LM: SHOULD_LINEMERGE = false TF: TIME_FORMAT = %m-‐%d-‐%Y %H:%M:%S.%3N DC: DATETIME_CONFIG = CURRENT
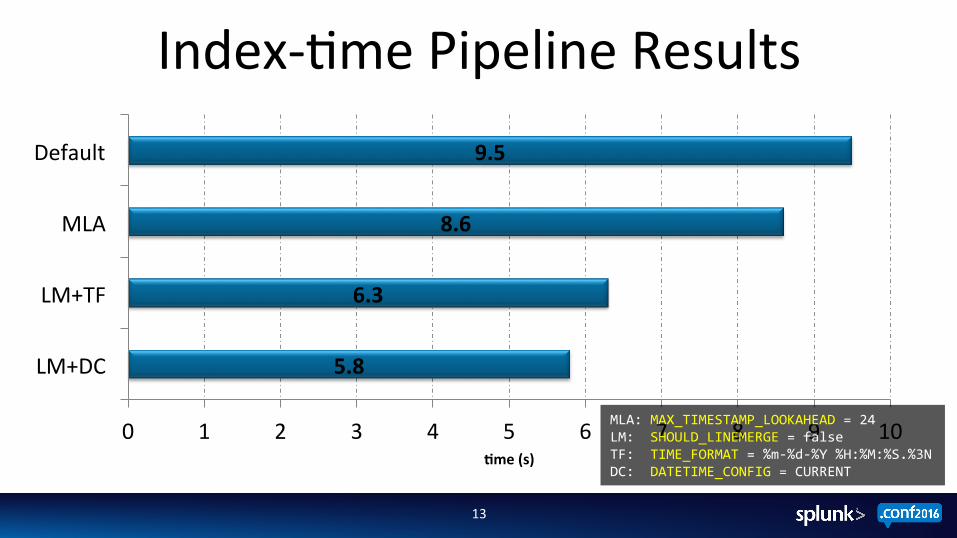
Index-‐;me Pipeline Results
13
Time (s)
5.8
6.3
8.6
9.5
0 1 2 3 4 5 6 7 8 9 10
LM+DC
LM+TF
MLA
Default
2me (s)
MLA: MAX_TIMESTAMP_LOOKAHEAD = 24 LM: SHOULD_LINEMERGE = false TF: TIME_FORMAT = %m-‐%d-‐%Y %H:%M:%S.%3N DC: DATETIME_CONFIG = CURRENT
14
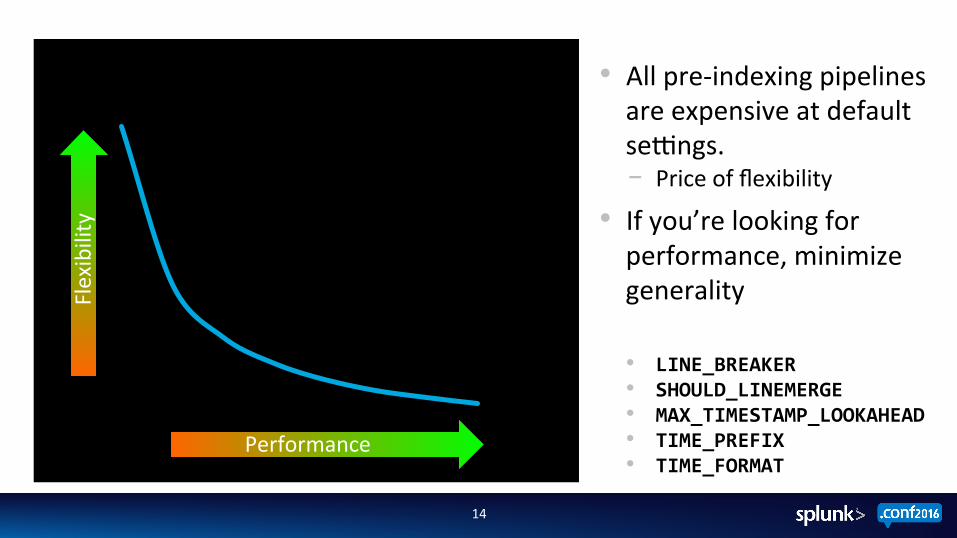
Time (s) Performance
Flexibility
• All pre-‐indexing pipelines are expensive at default sejngs. ‒ Price of flexibility
• If you’re looking for performance, minimize generality
• LINE_BREAKER • SHOULD_LINEMERGE • MAX_TIMESTAMP_LOOKAHEAD • TIME_PREFIX • TIME_FORMAT
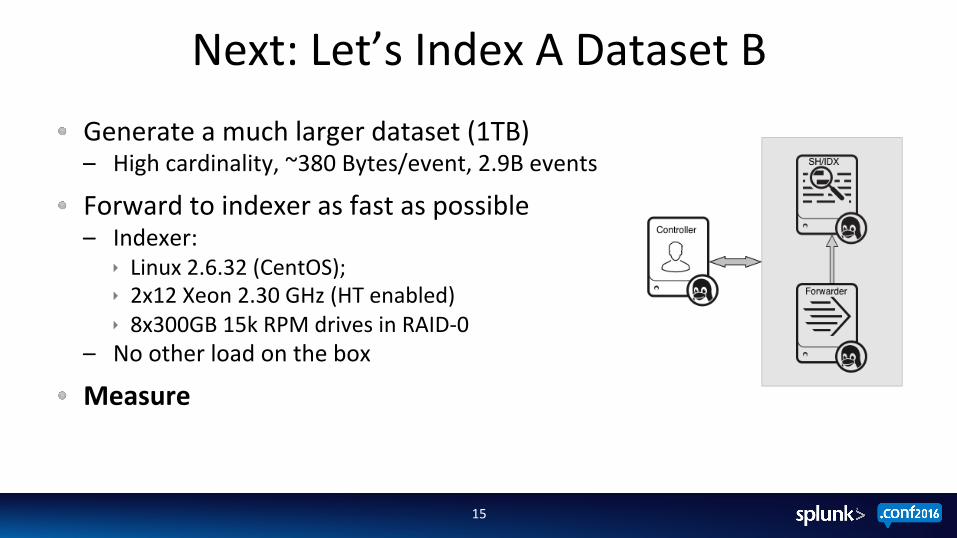
Next: Let’s Index A Dataset B
15
Generate a much larger dataset (1TB) – High cardinality, ~380 Bytes/event, 2.9B events
Forward to indexer as fast as possible – Indexer:
ê Linux 2.6.32 (CentOS); ê 2x12 Xeon 2.30 GHz (HT enabled) ê 8x300GB 15k RPM drives in RAID-‐0
– No other load on the box Measure
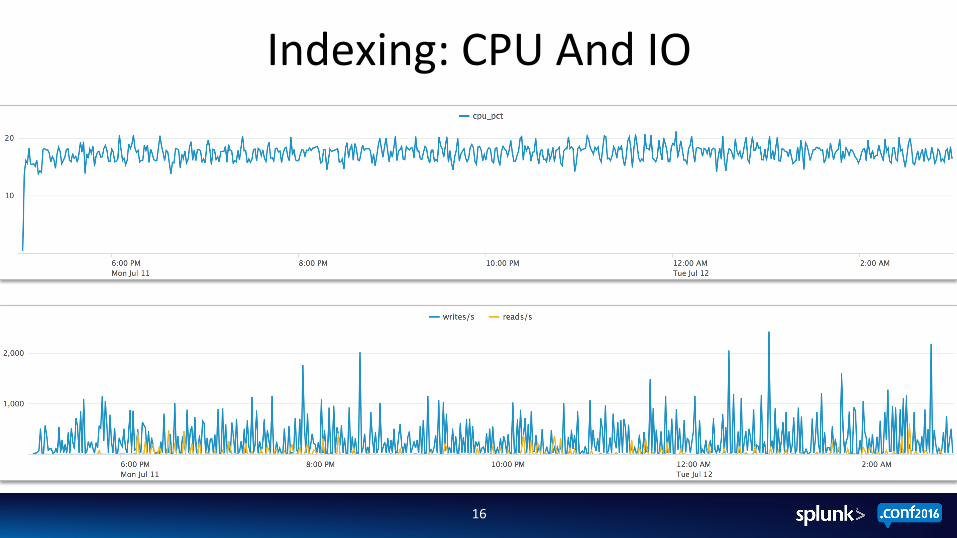
Indexing: CPU And IO
16
Indexing Test Findings
17
CPU U;liza;on – ~17.6% In this case, 4-‐5 Real CPU Cores
IO U;liza;on – Characterized by both reads and writes but not as demanding as search.
Note the splunk-‐op8mize process
Inges;on Rate – 30MB/s – “Speed of Light” – no search load present on the server
Index Pipeline Paralleliza;on
18
Splunk 6.3+ can maintain mul;ple independent pipelines sets ê i.e. same as if each set was running on its own indexer
If machine is under-‐u;lized (CPU and I/O), you can configure the indexer to run 2 such sets
Achieve roughly double the indexing throughput capacity Try not to set over 2 Be mindful of associated resource consump;on
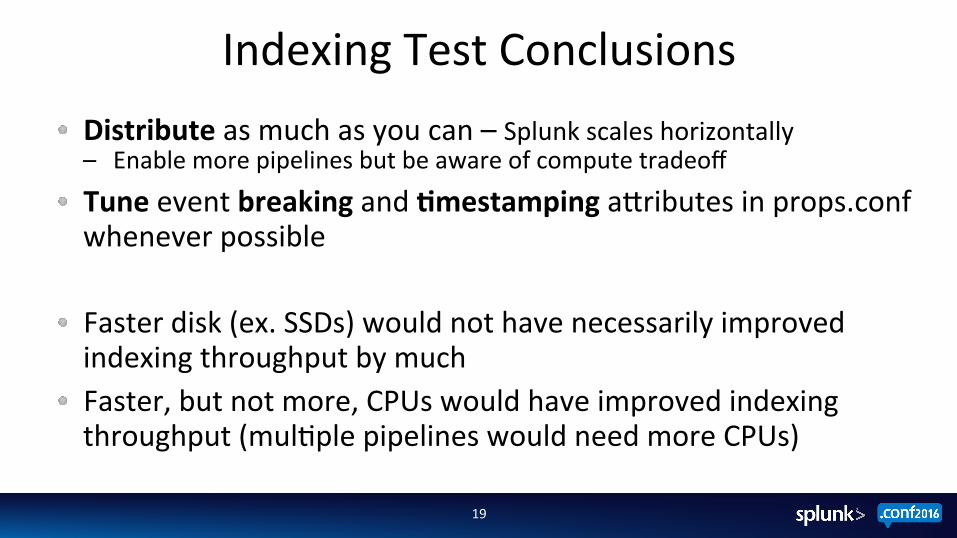
Indexing Test Conclusions
19
Distribute as much as you can – Splunk scales horizontally – Enable more pipelines but be aware of compute tradeoff
Tune event breaking and 2mestamping aZributes in props.conf whenever possible
Faster disk (ex. SSDs) would not have necessarily improved indexing throughput by much Faster, but not more, CPUs would have improved indexing throughput (mul;ple pipelines would need more CPUs)
Next: Searching
20
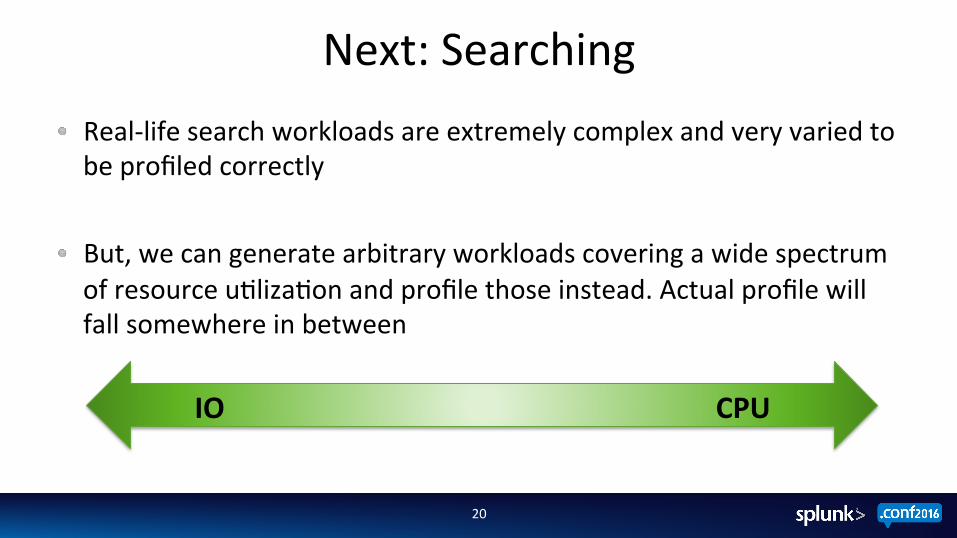
Real-‐life search workloads are extremely complex and very varied to be profiled correctly
But, we can generate arbitrary workloads covering a wide spectrum of resource u;liza;on and profile those instead. Actual profile will fall somewhere in between
IO CPU
Search Pipeline (High Level)
21
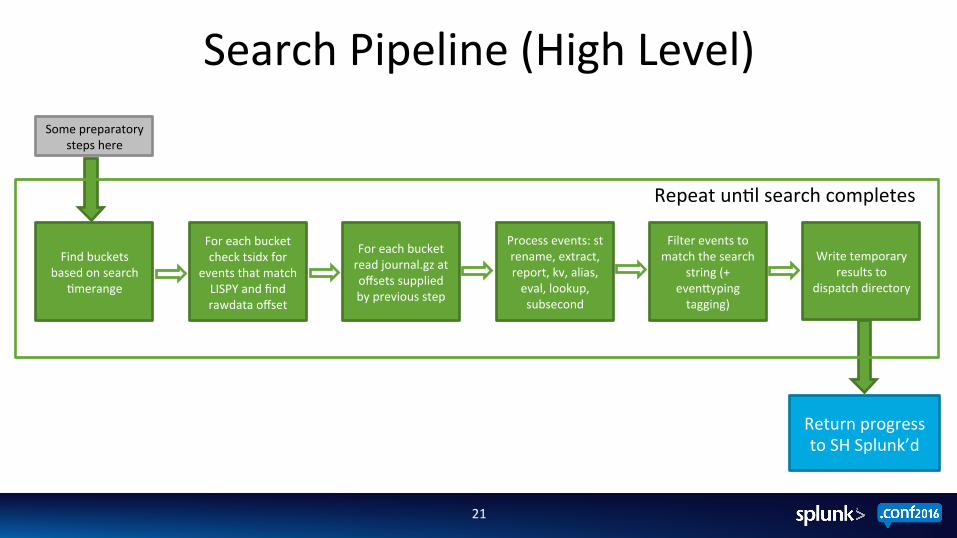
Some preparatory steps here
Write temporary results to
dispatch directory
Find buckets based on search
;merange
Return progress to SH Splunk’d
Repeat un;l search completes
For each bucket check tsidx for
events that match LISPY and find rawdata offset
For each bucket read journal.gz at offsets supplied by previous step
Filter events to match the search
string (+ evenZyping tagging)
Process events: st rename, extract, report, kv, alias, eval, lookup, subsecond
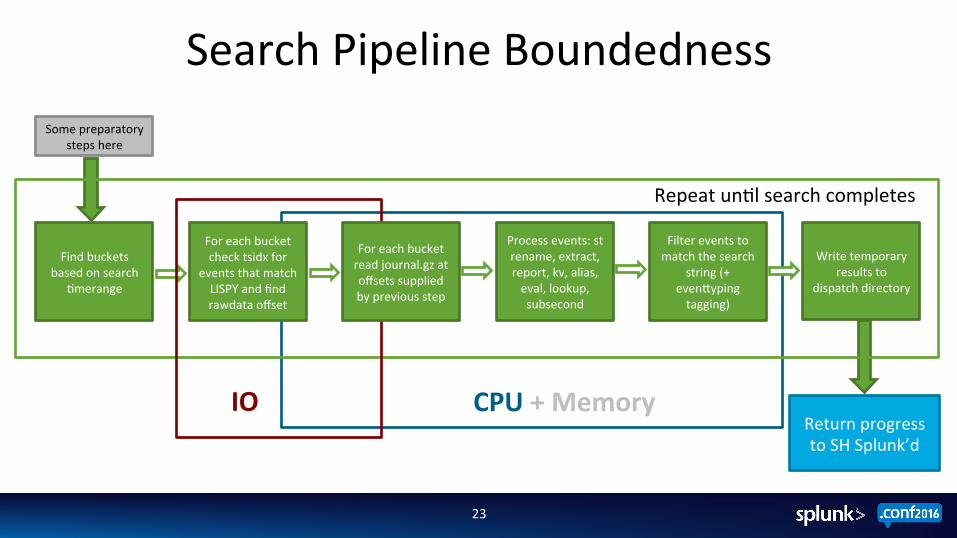
Search Pipeline Boundedness
22
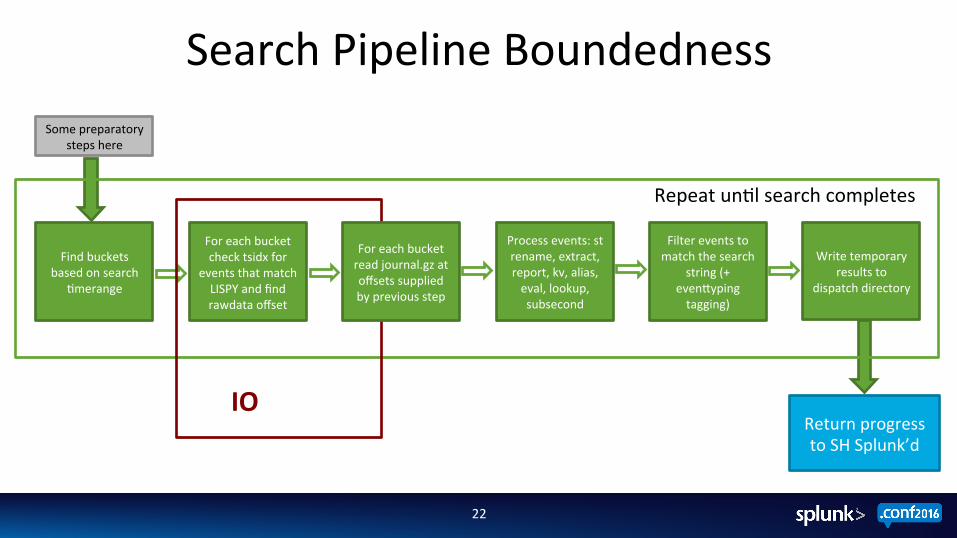
Some preparatory steps here
Write temporary results to
dispatch directory
Find buckets based on search
;merange
Repeat un;l search completes
For each bucket check tsidx for
events that match LISPY and find rawdata offset
Filter events to match the search
string (+ evenZyping tagging)
Process events: st rename, extract, report, kv, alias, eval, lookup, subsecond
Return progress to SH Splunk’d
IO
For each bucket read journal.gz at offsets supplied by previous step
Search Pipeline Boundedness
23
Some preparatory steps here
Write temporary results to
dispatch directory
Find buckets based on search
;merange
Repeat un;l search completes
Filter events to match the search
string (+ evenZyping tagging)
Process events: st rename, extract, report, kv, alias, eval, lookup, subsecond
IO CPU + Memory Return progress to SH Splunk’d
For each bucket check tsidx for
events that match LISPY and find rawdata offset
For each bucket read journal.gz at offsets supplied by previous step
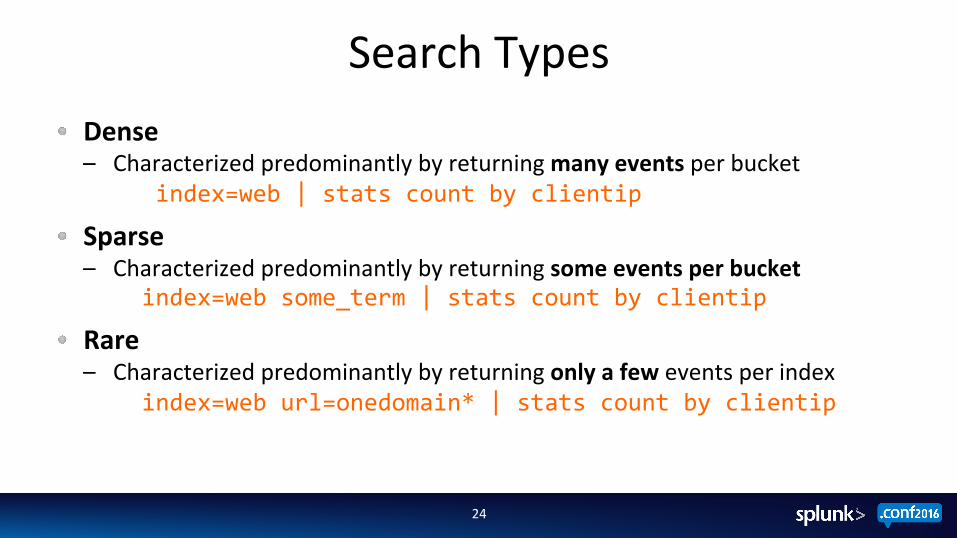
Search Types
24
Dense – Characterized predominantly by returning many events per bucket
index=web | stats count by clientip
Sparse – Characterized predominantly by returning some events per bucket
index=web some_term | stats count by clientip
Rare – Characterized predominantly by returning only a few events per index
index=web url=onedomain* | stats count by clientip
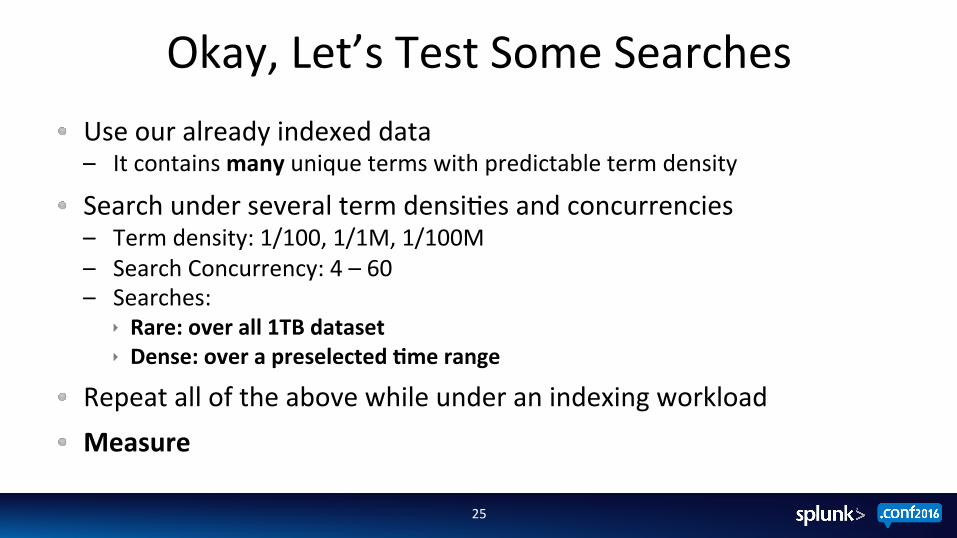
Okay, Let’s Test Some Searches
25
Use our already indexed data – It contains many unique terms with predictable term density
Search under several term densi;es and concurrencies – Term density: 1/100, 1/1M, 1/100M – Search Concurrency: 4 – 60 – Searches:
ê Rare: over all 1TB dataset ê Dense: over a preselected 2me range
Repeat all of the above while under an indexing workload Measure
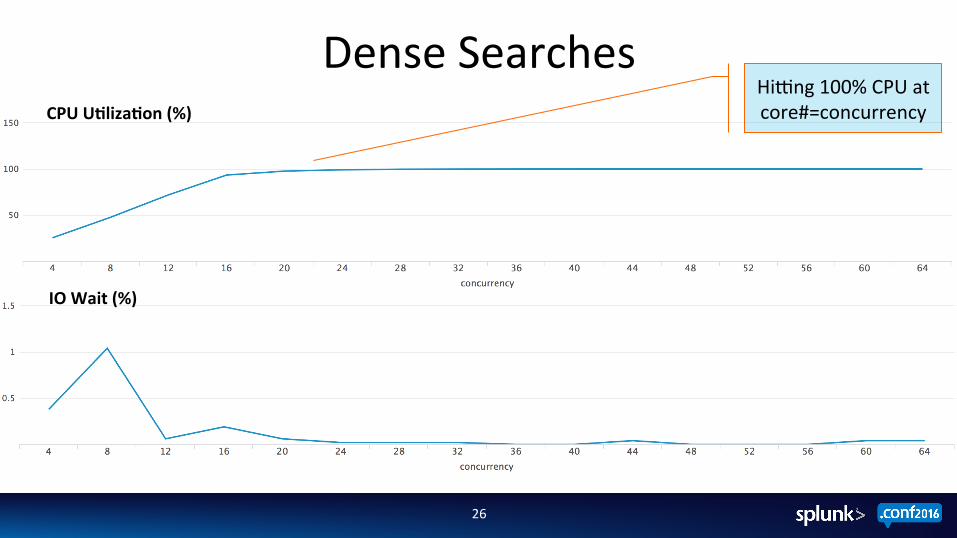
Dense Searches
26
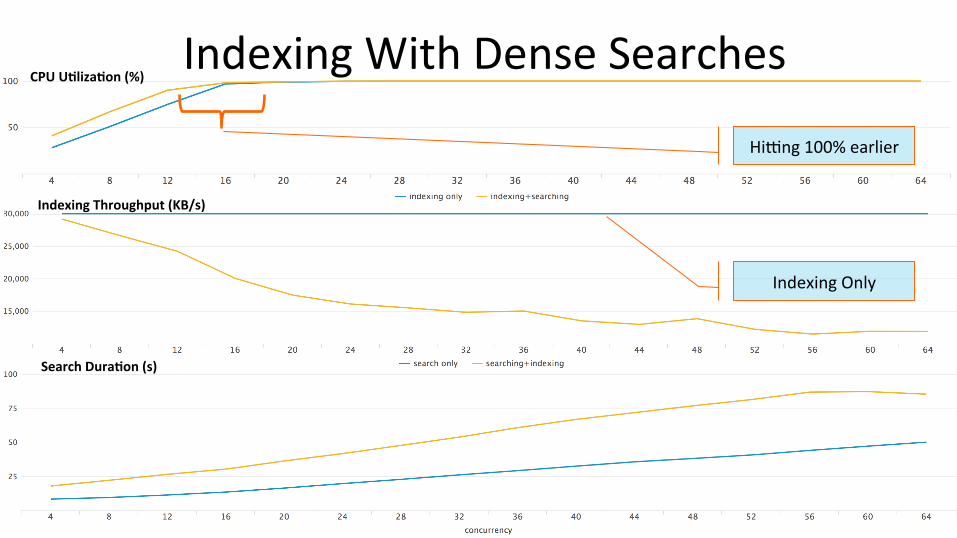
Hijng 100% CPU at core#=concurrency CPU U2liza2on (%)
IO Wait (%)
27
CPU U2liza2on (%)
Hijng 100% earlier
Indexing Throughput (KB/s)
Indexing With Dense Searches
Search Dura2on (s)
Indexing Only
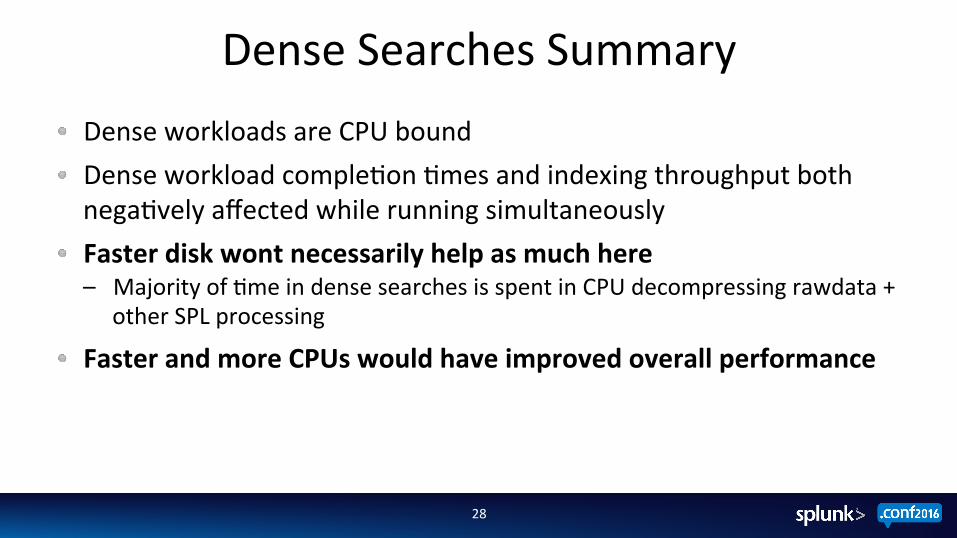
Dense Searches Summary
28
Dense workloads are CPU bound Dense workload comple;on ;mes and indexing throughput both nega;vely affected while running simultaneously
Faster disk wont necessarily help as much here – Majority of ;me in dense searches is spent in CPU decompressing rawdata +
other SPL processing
Faster and more CPUs would have improved overall performance
29
IO Wait (%)
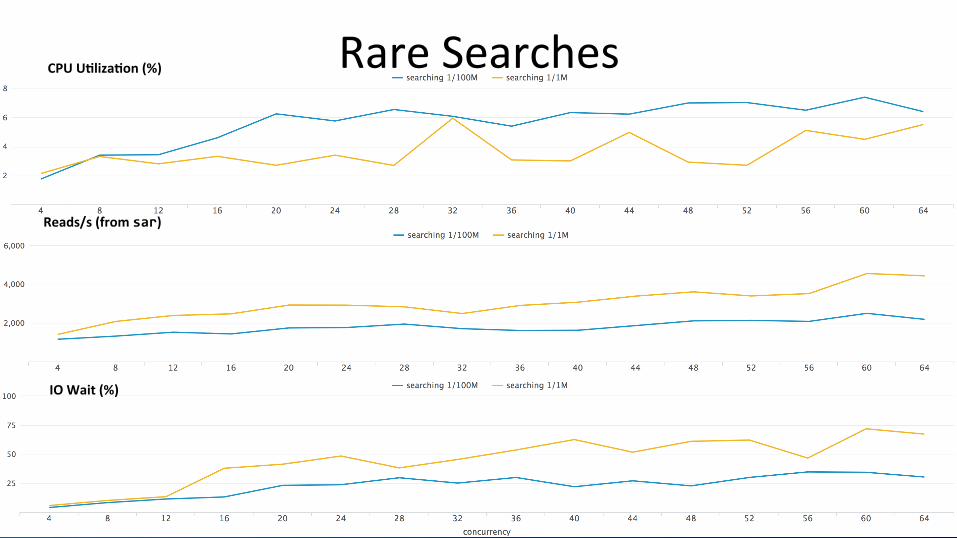
CPU U2liza2on (%) Rare Searches
Reads/s (from sar)
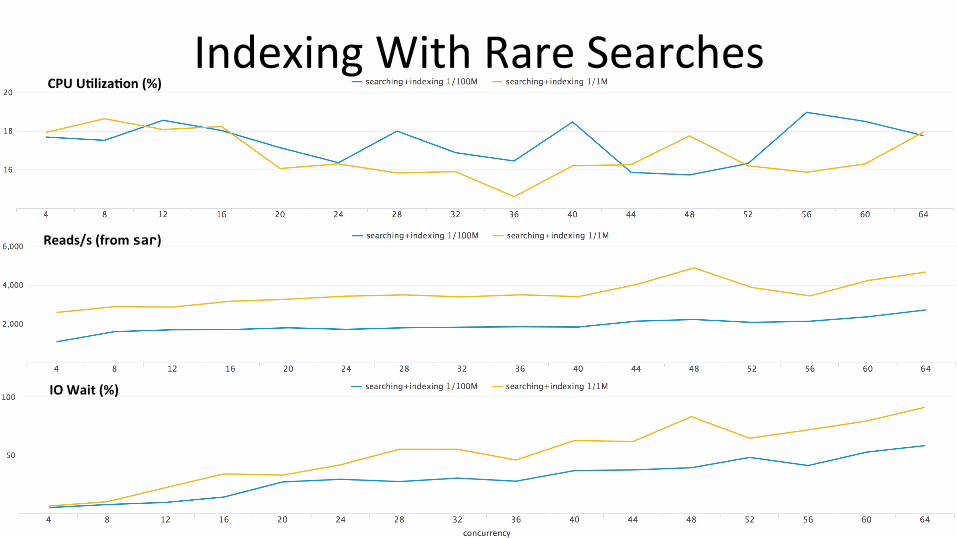
Indexing With Rare Searches
30
IO Wait (%)
Reads/s (from sar)
CPU U2liza2on (%)
31
Indexing Only
Search Dura2on (s)
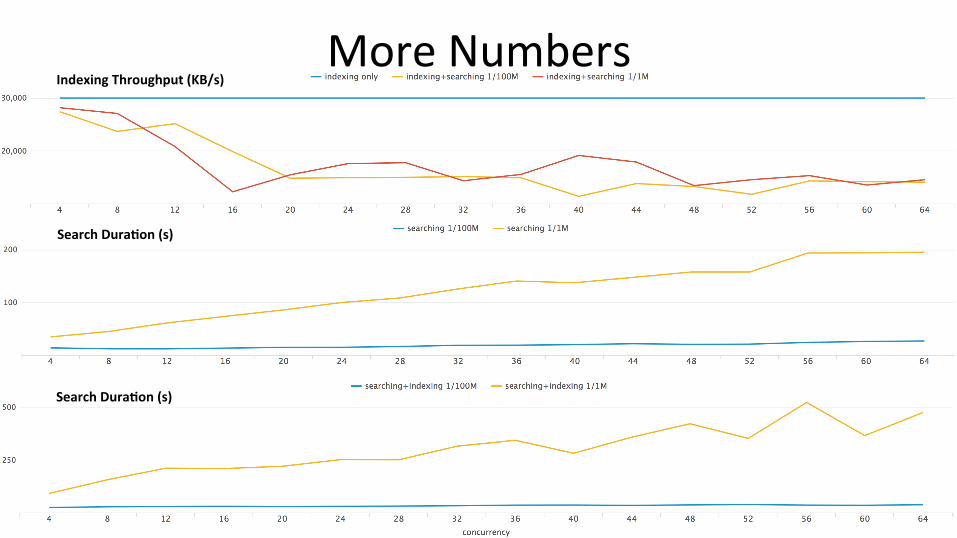
Indexing Throughput (KB/s)
Search Dura2on (s)
More Numbers
Rare Searches Summary
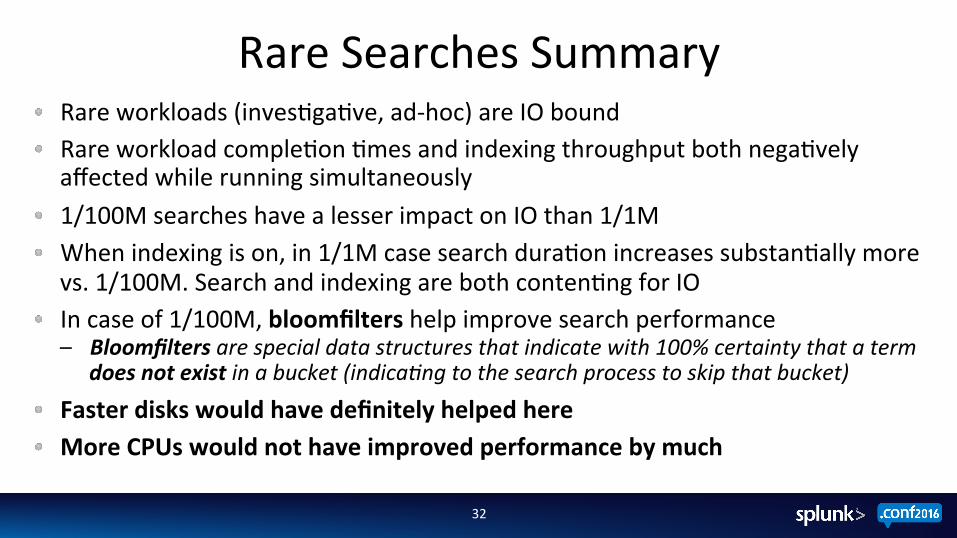
32
Rare workloads (inves;ga;ve, ad-‐hoc) are IO bound Rare workload comple;on ;mes and indexing throughput both nega;vely affected while running simultaneously
1/100M searches have a lesser impact on IO than 1/1M When indexing is on, in 1/1M case search dura;on increases substan;ally more vs. 1/100M. Search and indexing are both conten;ng for IO
In case of 1/100M, bloomfilters help improve search performance – Bloomfilters are special data structures that indicate with 100% certainty that a term
does not exist in a bucket (indica8ng to the search process to skip that bucket)
Faster disks would have definitely helped here More CPUs would not have improved performance by much
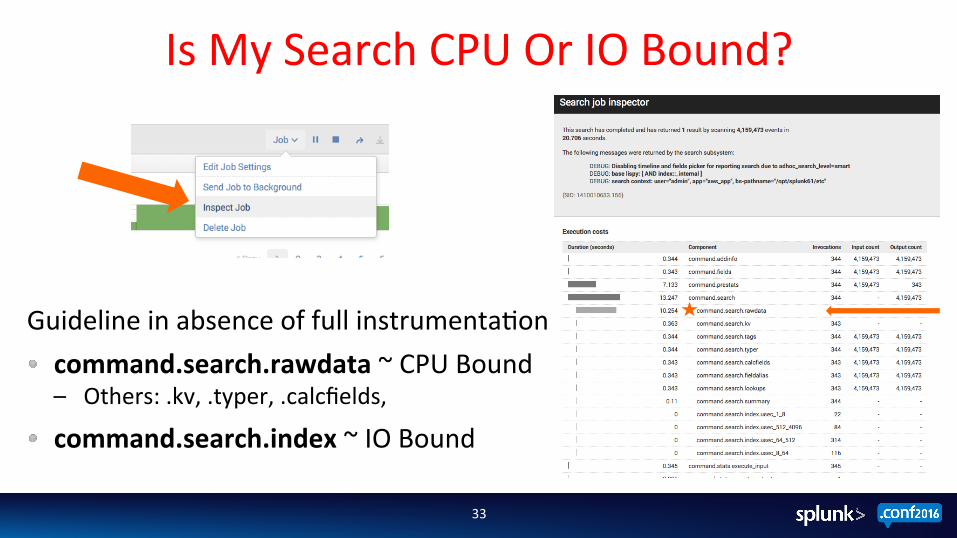
Is My Search CPU Or IO Bound?
33
Guideline in absence of full instrumenta;on command.search.rawdata ~ CPU Bound – Others: .kv, .typer, .calcfields, command.search.index ~ IO Bound
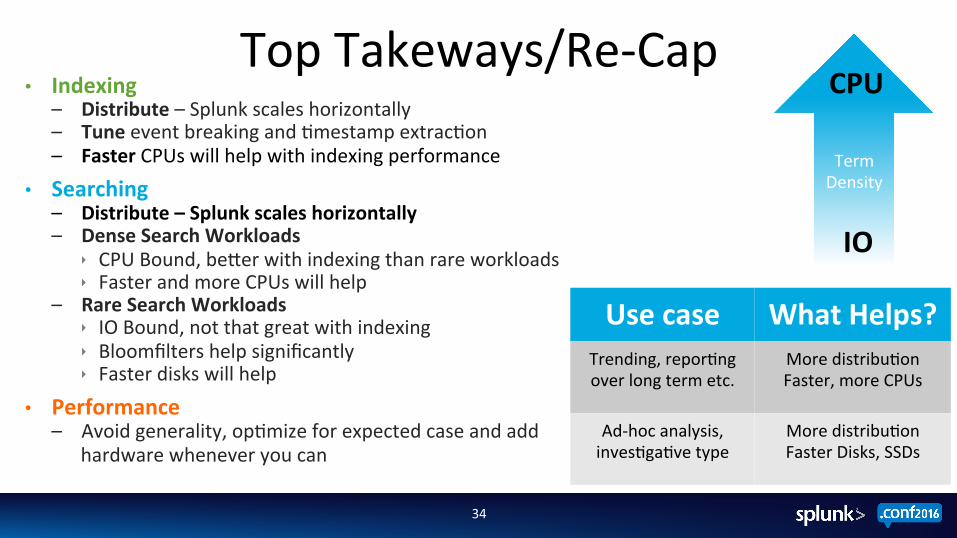
Top Takeways/Re-‐Cap
34
• Indexing – Distribute – Splunk scales horizontally – Tune event breaking and ;mestamp extrac;on – Faster CPUs will help with indexing performance
• Searching – Distribute – Splunk scales horizontally – Dense Search Workloads
ê CPU Bound, beZer with indexing than rare workloads ê Faster and more CPUs will help
– Rare Search Workloads ê IO Bound, not that great with indexing ê Bloomfilters help significantly ê Faster disks will help
• Performance – Avoid generality, op;mize for expected case and add
hardware whenever you can
Term Density
CPU
IO
Use case What Helps? Trending, repor;ng over long term etc.
More distribu;on Faster, more CPUs
Ad-‐hoc analysis, inves;ga;ve type
More distribu;on Faster Disks, SSDs
Tes;ng Disclaimer Reminder
1. Tes;ng conducted on arbitrary datasets 2. “closed course” (lab) environment 3. Not to be interpreted out of context
35
You May Also Like Search: Under the Hood
Worst Prac;ces... and How to Fix Them Splunk Performance Reloaded
Q & A Feedback: [email protected]

THANK YOU